Zip Codes with the Highest Percentage of Population Employed in Real Estate, Rental & Leasing in El Paso, TX
RELATED REPORTS & OPTIONS
Real Estate, Rental & Leasing
El Paso
Compare Zip Codes
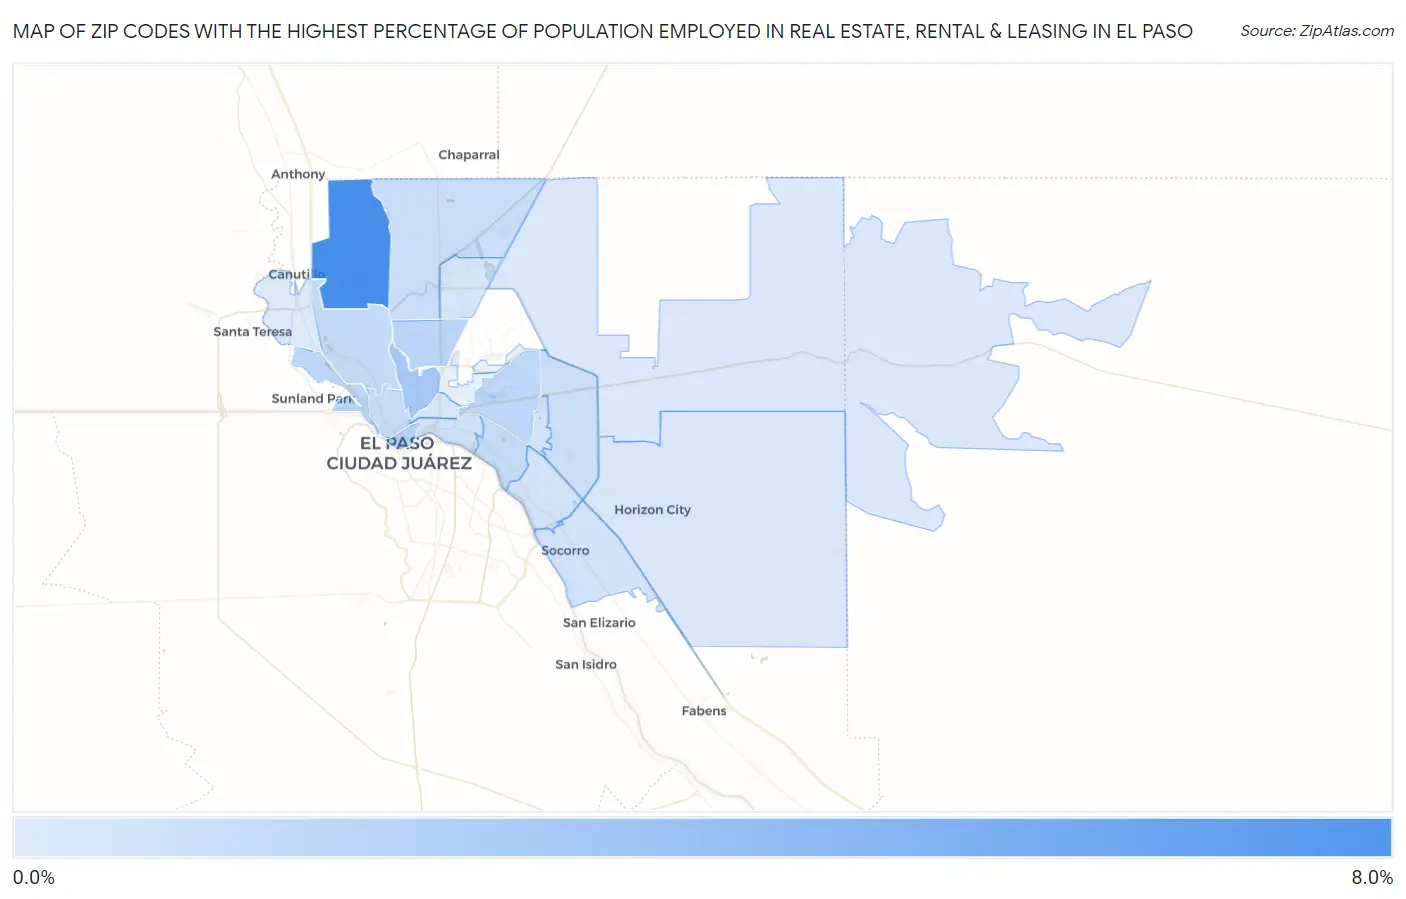
Map of Zip Codes with the Highest Percentage of Population Employed in Real Estate, Rental & Leasing in El Paso
0.80%
7.7%
Zip Codes with the Highest Percentage of Population Employed in Real Estate, Rental & Leasing in El Paso, TX
| Zip Code | % Employed | vs State | vs National | |
| 1. | 79911 | 7.7% | 2.0%(+5.70)#27 | 1.9%(+5.82)#606 |
| 2. | 79930 | 3.3% | 2.0%(+1.31)#201 | 1.9%(+1.43)#3,164 |
| 3. | 79901 | 2.5% | 2.0%(+0.533)#378 | 1.9%(+0.649)#5,328 |
| 4. | 79904 | 2.4% | 2.0%(+0.389)#430 | 1.9%(+0.505)#5,907 |
| 5. | 79922 | 2.2% | 2.0%(+0.215)#485 | 1.9%(+0.331)#6,698 |
| 6. | 79925 | 2.1% | 2.0%(+0.134)#521 | 1.9%(+0.250)#7,108 |
| 7. | 79912 | 2.0% | 2.0%(-0.056)#585 | 1.9%(+0.060)#8,115 |
| 8. | 79902 | 1.9% | 2.0%(-0.132)#616 | 1.9%(-0.016)#8,629 |
| 9. | 79915 | 1.8% | 2.0%(-0.177)#640 | 1.9%(-0.061)#8,926 |
| 10. | 79934 | 1.7% | 2.0%(-0.286)#692 | 1.9%(-0.170)#9,610 |
| 11. | 79936 | 1.6% | 2.0%(-0.389)#738 | 1.9%(-0.273)#10,320 |
| 12. | 79905 | 1.4% | 2.0%(-0.597)#851 | 1.9%(-0.481)#11,894 |
| 13. | 79927 | 1.4% | 2.0%(-0.646)#879 | 1.9%(-0.530)#12,264 |
| 14. | 79907 | 1.3% | 2.0%(-0.703)#905 | 1.9%(-0.587)#12,686 |
| 15. | 79935 | 1.3% | 2.0%(-0.729)#913 | 1.9%(-0.613)#12,880 |
| 16. | 79924 | 1.1% | 2.0%(-0.864)#970 | 1.9%(-0.748)#13,921 |
| 17. | 79903 | 1.1% | 2.0%(-0.899)#983 | 1.9%(-0.783)#14,219 |
| 18. | 79928 | 1.0% | 2.0%(-0.971)#1,011 | 1.9%(-0.855)#14,828 |
| 19. | 79938 | 0.88% | 2.0%(-1.13)#1,082 | 1.9%(-1.01)#16,112 |
| 20. | 79932 | 0.80% | 2.0%(-1.21)#1,119 | 1.9%(-1.09)#16,710 |
1
Common Questions
What are the Top 10 Zip Codes with the Highest Percentage of Population Employed in Real Estate, Rental & Leasing in El Paso, TX?
Top 10 Zip Codes with the Highest Percentage of Population Employed in Real Estate, Rental & Leasing in El Paso, TX are:
What zip code has the Highest Percentage of Population Employed in Real Estate, Rental & Leasing in El Paso, TX?
79911 has the Highest Percentage of Population Employed in Real Estate, Rental & Leasing in El Paso, TX with 7.7%.
What is the Percentage of Population Employed in Real Estate, Rental & Leasing in El Paso, TX?
Percentage of Population Employed in Real Estate, Rental & Leasing in El Paso is 1.7%.
What is the Percentage of Population Employed in Real Estate, Rental & Leasing in Texas?
Percentage of Population Employed in Real Estate, Rental & Leasing in Texas is 2.0%.
What is the Percentage of Population Employed in Real Estate, Rental & Leasing in the United States?
Percentage of Population Employed in Real Estate, Rental & Leasing in the United States is 1.9%.