Falcon Lake Estates, TX Map & Demographics
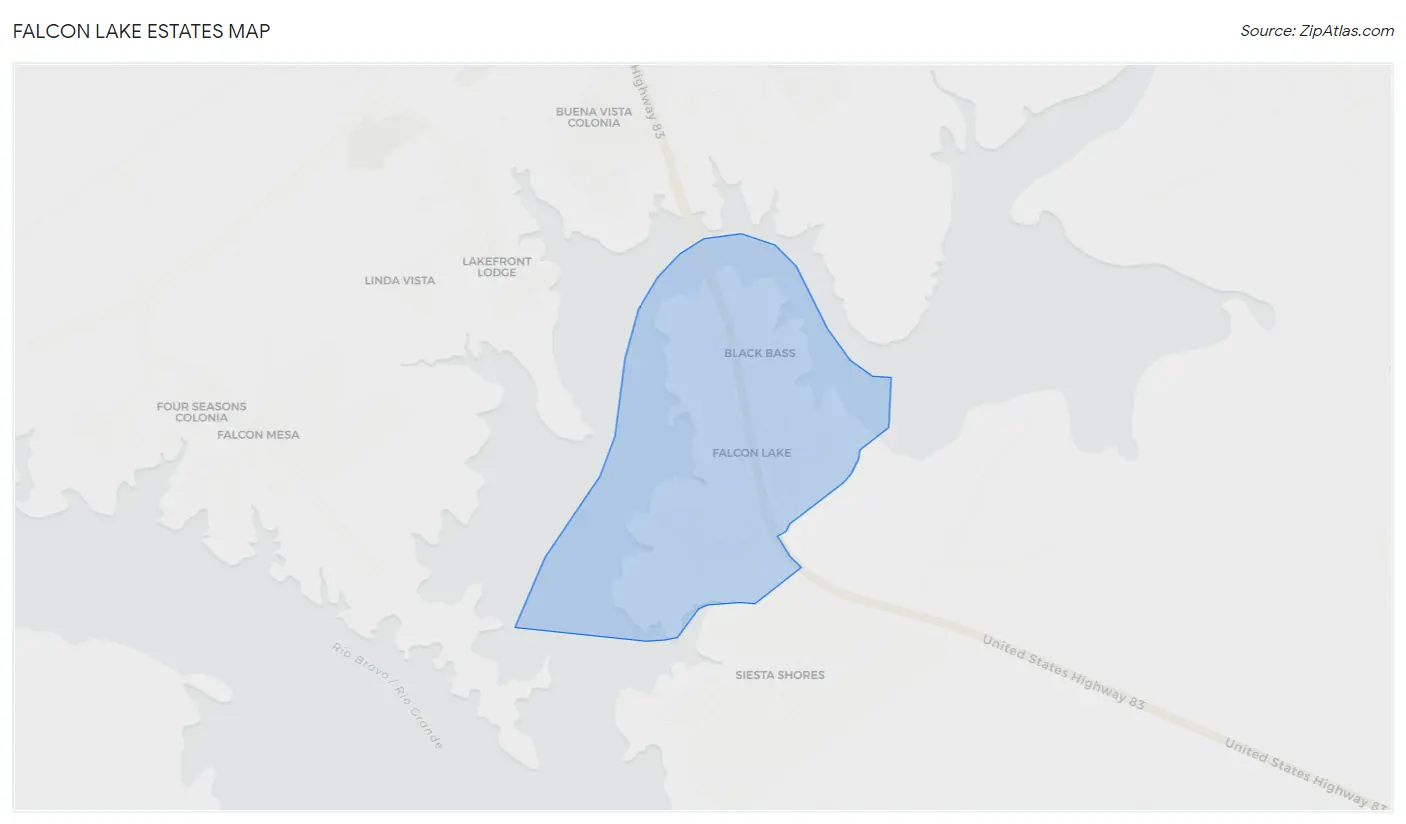
Falcon Lake Estates Map
Falcon Lake Estates Overview
$22,699
PER CAPITA INCOME
$71,042
AVG FAMILY INCOME
$60,096
AVG HOUSEHOLD INCOME
42.9%
WAGE / INCOME GAP [ % ]
57.1¢/ $1
WAGE / INCOME GAP [ $ ]
$6,343
FAMILY INCOME DEFICIT
0.38
INEQUALITY / GINI INDEX
1,037
TOTAL POPULATION
601
MALE POPULATION
436
FEMALE POPULATION
137.84
MALES / 100 FEMALES
72.55
FEMALES / 100 MALES
35.0
MEDIAN AGE
3.0
AVG FAMILY SIZE
2.4
AVG HOUSEHOLD SIZE
408
LABOR FORCE [ PEOPLE ]
56.7%
PERCENT IN LABOR FORCE
Income in Falcon Lake Estates
Income Overview in Falcon Lake Estates
Per Capita Income in Falcon Lake Estates is $22,699, while median incomes of families and households are $71,042 and $60,096 respectively.
| Characteristic | Number | Measure |
| Per Capita Income | 1,037 | $22,699 |
| Median Family Income | 292 | $71,042 |
| Mean Family Income | 292 | $67,932 |
| Median Household Income | 430 | $60,096 |
| Mean Household Income | 430 | $56,941 |
| Income Deficit | 292 | $6,343 |
| Wage / Income Gap (%) | 1,037 | 42.87% |
| Wage / Income Gap ($) | 1,037 | 57.13¢ per $1 |
| Gini / Inequality Index | 1,037 | 0.38 |
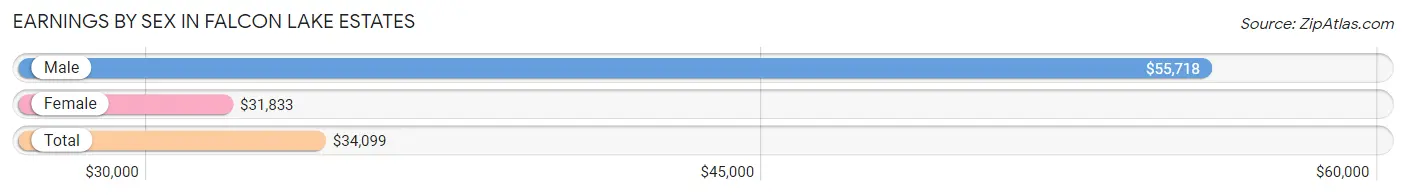
Earnings by Sex in Falcon Lake Estates
Average Earnings in Falcon Lake Estates are $34,099, $55,718 for men and $31,833 for women, a difference of 42.9%.
| Sex | Number | Average Earnings |
| Male | 250 (54.3%) | $55,718 |
| Female | 210 (45.7%) | $31,833 |
| Total | 460 (100.0%) | $34,099 |
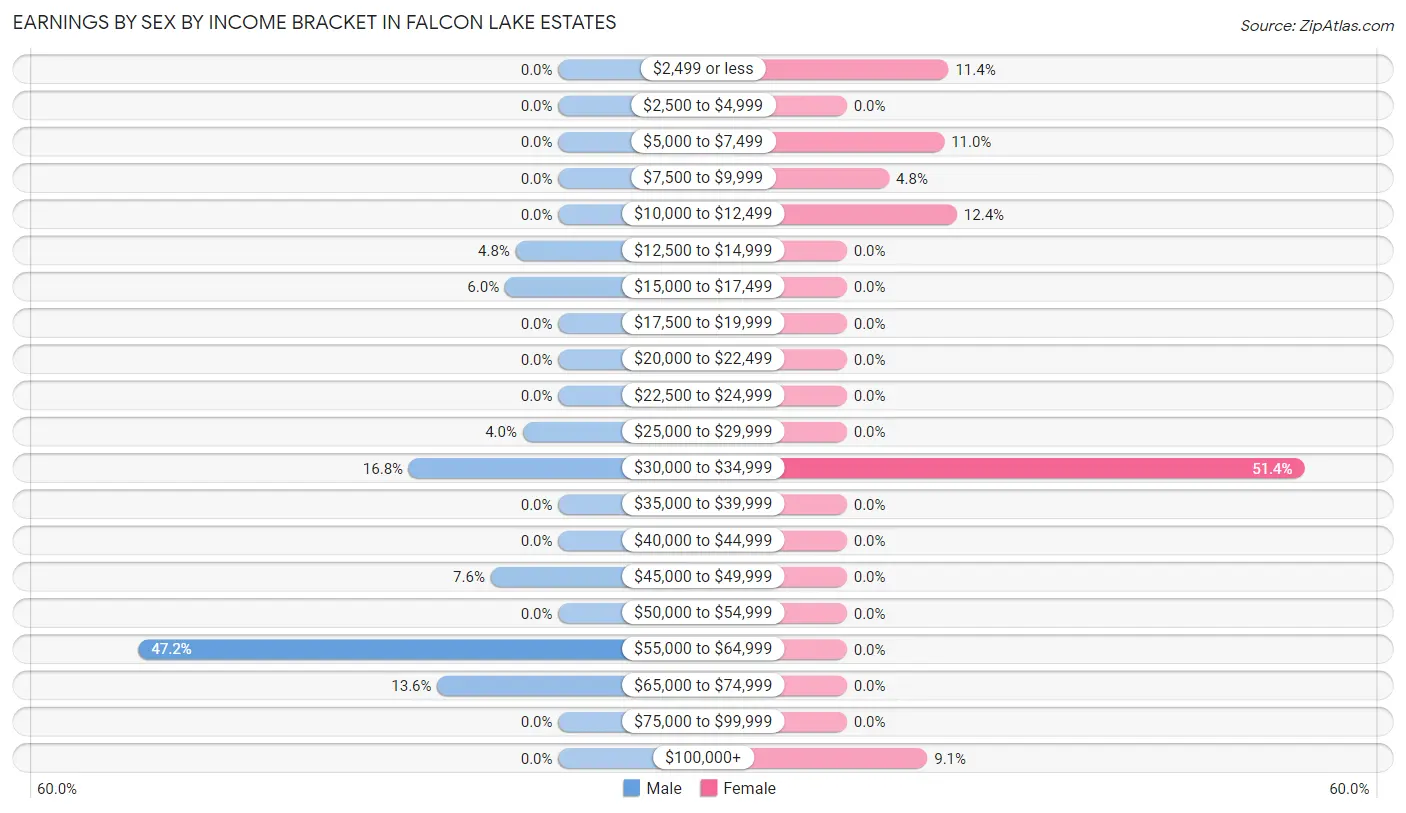
Earnings by Sex by Income Bracket in Falcon Lake Estates
The most common earnings brackets in Falcon Lake Estates are $55,000 to $64,999 for men (118 | 47.2%) and $30,000 to $34,999 for women (108 | 51.4%).
| Income | Male | Female |
| $2,499 or less | 0 (0.0%) | 24 (11.4%) |
| $2,500 to $4,999 | 0 (0.0%) | 0 (0.0%) |
| $5,000 to $7,499 | 0 (0.0%) | 23 (11.0%) |
| $7,500 to $9,999 | 0 (0.0%) | 10 (4.8%) |
| $10,000 to $12,499 | 0 (0.0%) | 26 (12.4%) |
| $12,500 to $14,999 | 12 (4.8%) | 0 (0.0%) |
| $15,000 to $17,499 | 15 (6.0%) | 0 (0.0%) |
| $17,500 to $19,999 | 0 (0.0%) | 0 (0.0%) |
| $20,000 to $22,499 | 0 (0.0%) | 0 (0.0%) |
| $22,500 to $24,999 | 0 (0.0%) | 0 (0.0%) |
| $25,000 to $29,999 | 10 (4.0%) | 0 (0.0%) |
| $30,000 to $34,999 | 42 (16.8%) | 108 (51.4%) |
| $35,000 to $39,999 | 0 (0.0%) | 0 (0.0%) |
| $40,000 to $44,999 | 0 (0.0%) | 0 (0.0%) |
| $45,000 to $49,999 | 19 (7.6%) | 0 (0.0%) |
| $50,000 to $54,999 | 0 (0.0%) | 0 (0.0%) |
| $55,000 to $64,999 | 118 (47.2%) | 0 (0.0%) |
| $65,000 to $74,999 | 34 (13.6%) | 0 (0.0%) |
| $75,000 to $99,999 | 0 (0.0%) | 0 (0.0%) |
| $100,000+ | 0 (0.0%) | 19 (9.0%) |
| Total | 250 (100.0%) | 210 (100.0%) |
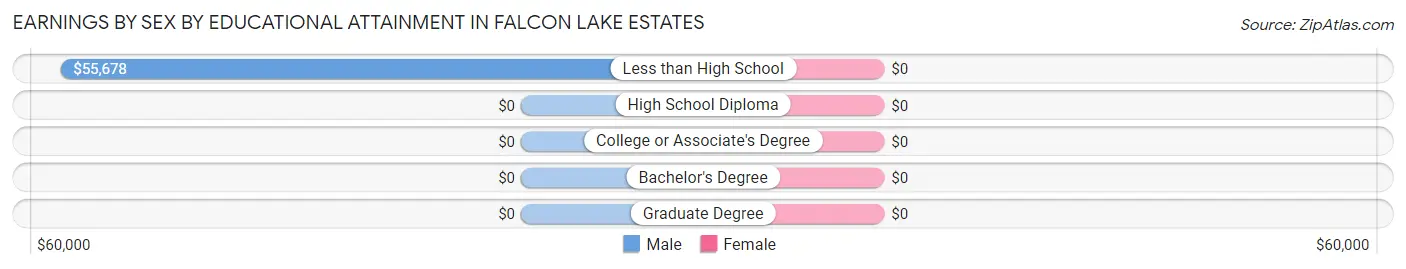
Earnings by Sex by Educational Attainment in Falcon Lake Estates
| Educational Attainment | Male Income | Female Income |
| Less than High School | $55,678 | $0 |
| High School Diploma | - | - |
| College or Associate's Degree | - | - |
| Bachelor's Degree | - | - |
| Graduate Degree | - | - |
| Total | $55,878 | $32,250 |
Family Income in Falcon Lake Estates
Family Income Brackets in Falcon Lake Estates
According to the Falcon Lake Estates family income data, there are 113 families falling into the $75,000 to $99,999 income range, which is the most common income bracket and makes up 38.7% of all families.
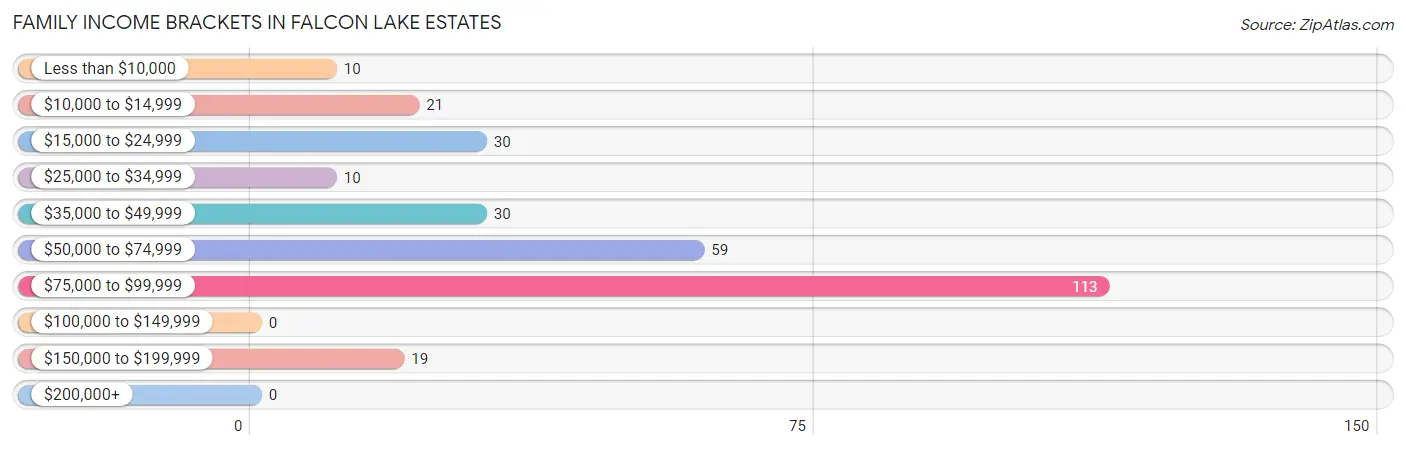
| Income Bracket | # Families | % Families |
| Less than $10,000 | 10 | 3.4% |
| $10,000 to $14,999 | 21 | 7.2% |
| $15,000 to $24,999 | 30 | 10.3% |
| $25,000 to $34,999 | 10 | 3.4% |
| $35,000 to $49,999 | 30 | 10.3% |
| $50,000 to $74,999 | 59 | 20.2% |
| $75,000 to $99,999 | 113 | 38.7% |
| $100,000 to $149,999 | 0 | 0.0% |
| $150,000 to $199,999 | 19 | 6.5% |
| $200,000+ | 0 | 0.0% |
Family Income by Famaliy Size in Falcon Lake Estates
4-person families (122 | 41.8%) account for the highest median family income in Falcon Lake Estates with $91,383 per family, while 2-person families (99 | 33.9%) have the highest median income of $30,938 per family member.
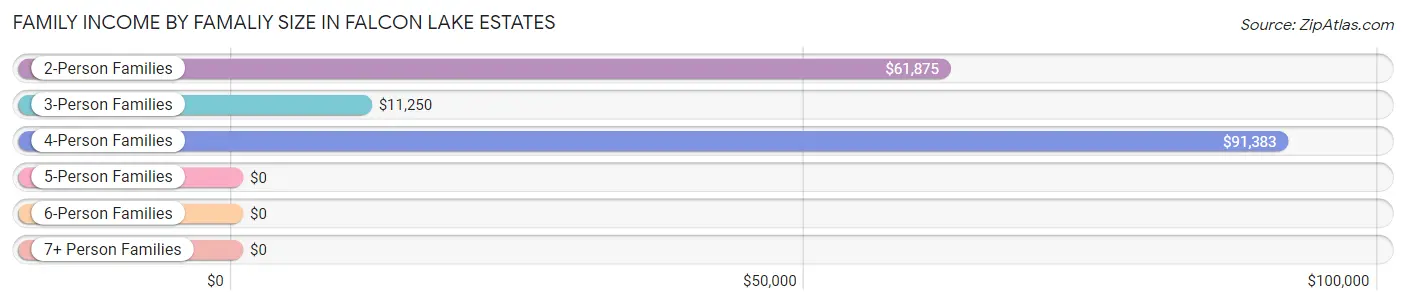
| Income Bracket | # Families | Median Income |
| 2-Person Families | 99 (33.9%) | $61,875 |
| 3-Person Families | 41 (14.0%) | $11,250 |
| 4-Person Families | 122 (41.8%) | $91,383 |
| 5-Person Families | 0 (0.0%) | $0 |
| 6-Person Families | 30 (10.3%) | $0 |
| 7+ Person Families | 0 (0.0%) | $0 |
| Total | 292 (100.0%) | $71,042 |
Family Income by Number of Earners in Falcon Lake Estates
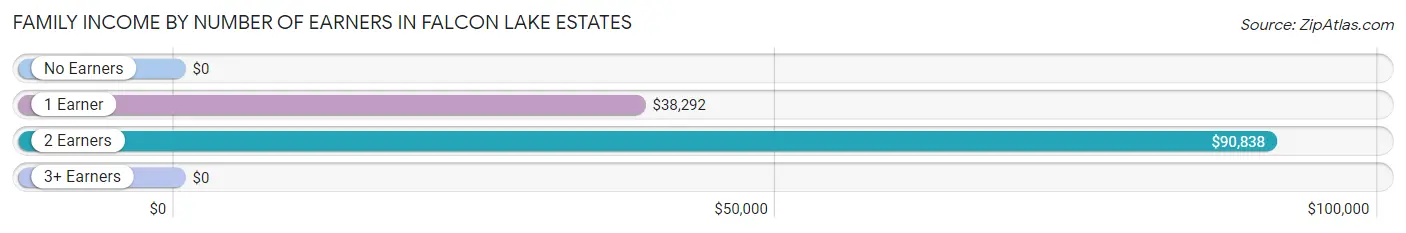
| Number of Earners | # Families | Median Income |
| No Earners | 70 (24.0%) | $0 |
| 1 Earner | 59 (20.2%) | $38,292 |
| 2 Earners | 163 (55.8%) | $90,838 |
| 3+ Earners | 0 (0.0%) | $0 |
| Total | 292 (100.0%) | $71,042 |
Household Income in Falcon Lake Estates
Household Income Brackets in Falcon Lake Estates
With 113 households falling in the category, the $75,000 to $99,999 income range is the most frequent in Falcon Lake Estates, accounting for 26.3% of all households.
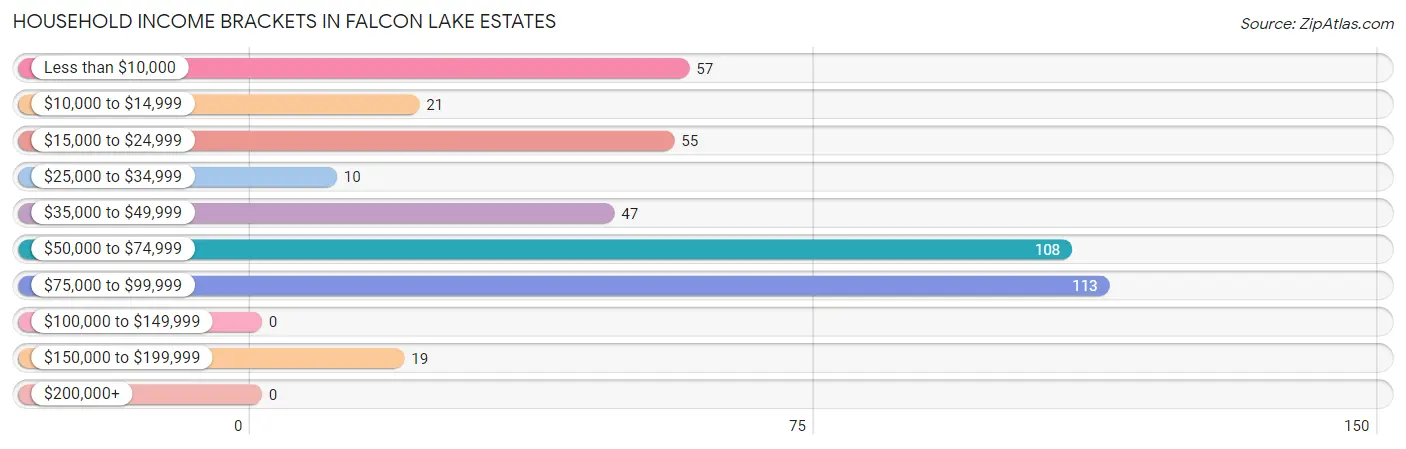
| Income Bracket | # Households | % Households |
| Less than $10,000 | 57 | 13.3% |
| $10,000 to $14,999 | 21 | 4.9% |
| $15,000 to $24,999 | 55 | 12.8% |
| $25,000 to $34,999 | 10 | 2.3% |
| $35,000 to $49,999 | 47 | 10.9% |
| $50,000 to $74,999 | 108 | 25.1% |
| $75,000 to $99,999 | 113 | 26.3% |
| $100,000 to $149,999 | 0 | 0.0% |
| $150,000 to $199,999 | 19 | 4.4% |
| $200,000+ | 0 | 0.0% |
Household Income by Householder Age in Falcon Lake Estates
The median household income in Falcon Lake Estates is $60,096, with the highest median household income of $90,173 found in the 25 to 44 years age bracket for the primary householder. A total of 213 households (49.5%) fall into this category. Meanwhile, the 15 to 24 years age bracket for the primary householder has the lowest median household income of $0, with 10 households (2.3%) in this group.
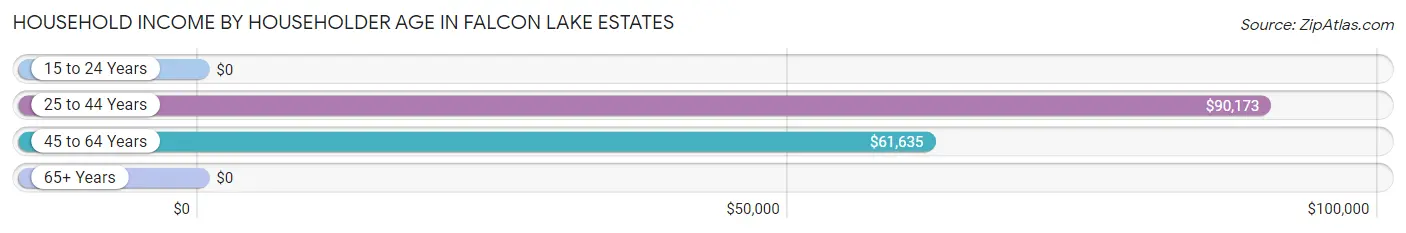
| Income Bracket | # Households | Median Income |
| 15 to 24 Years | 10 (2.3%) | $0 |
| 25 to 44 Years | 213 (49.5%) | $90,173 |
| 45 to 64 Years | 84 (19.5%) | $61,635 |
| 65+ Years | 123 (28.6%) | $0 |
| Total | 430 (100.0%) | $60,096 |
Poverty in Falcon Lake Estates
Income Below Poverty by Sex and Age in Falcon Lake Estates
With 28.0% poverty level for males and 31.0% for females among the residents of Falcon Lake Estates, under 5 year old males and under 5 year old females are the most vulnerable to poverty, with 20 males (100.0%) and 8 females (100.0%) in their respective age groups living below the poverty level.
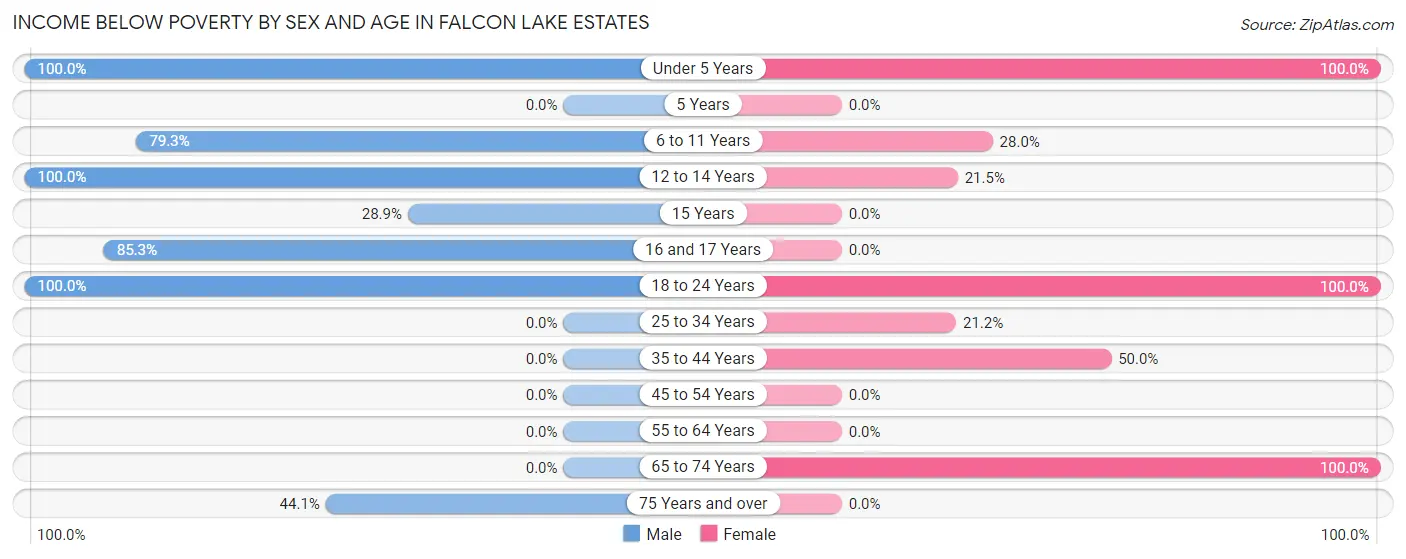
| Age Bracket | Male | Female |
| Under 5 Years | 20 (100.0%) | 8 (100.0%) |
| 5 Years | 0 (0.0%) | 0 (0.0%) |
| 6 to 11 Years | 42 (79.2%) | 7 (28.0%) |
| 12 to 14 Years | 22 (100.0%) | 17 (21.5%) |
| 15 Years | 28 (28.9%) | 0 (0.0%) |
| 16 and 17 Years | 29 (85.3%) | 0 (0.0%) |
| 18 to 24 Years | 12 (100.0%) | 10 (100.0%) |
| 25 to 34 Years | 0 (0.0%) | 21 (21.2%) |
| 35 to 44 Years | 0 (0.0%) | 30 (50.0%) |
| 45 to 54 Years | 0 (0.0%) | 0 (0.0%) |
| 55 to 64 Years | 0 (0.0%) | 0 (0.0%) |
| 65 to 74 Years | 0 (0.0%) | 42 (100.0%) |
| 75 Years and over | 15 (44.1%) | 0 (0.0%) |
| Total | 168 (28.0%) | 135 (31.0%) |
Income Above Poverty by Sex and Age in Falcon Lake Estates
According to the poverty statistics in Falcon Lake Estates, males aged 25 to 34 years and females aged 15 years are the age groups that are most secure financially, with 100.0% of males and 100.0% of females in these age groups living above the poverty line.
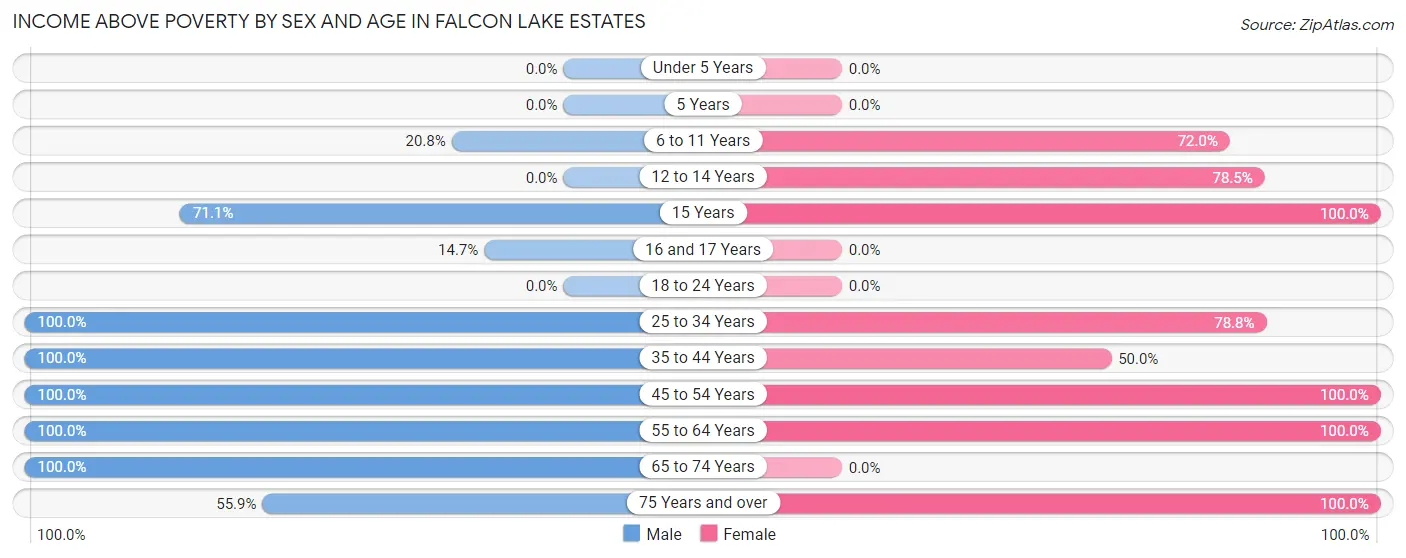
| Age Bracket | Male | Female |
| Under 5 Years | 0 (0.0%) | 0 (0.0%) |
| 5 Years | 0 (0.0%) | 0 (0.0%) |
| 6 to 11 Years | 11 (20.7%) | 18 (72.0%) |
| 12 to 14 Years | 0 (0.0%) | 62 (78.5%) |
| 15 Years | 69 (71.1%) | 13 (100.0%) |
| 16 and 17 Years | 5 (14.7%) | 0 (0.0%) |
| 18 to 24 Years | 0 (0.0%) | 0 (0.0%) |
| 25 to 34 Years | 49 (100.0%) | 78 (78.8%) |
| 35 to 44 Years | 113 (100.0%) | 30 (50.0%) |
| 45 to 54 Years | 80 (100.0%) | 34 (100.0%) |
| 55 to 64 Years | 57 (100.0%) | 26 (100.0%) |
| 65 to 74 Years | 30 (100.0%) | 0 (0.0%) |
| 75 Years and over | 19 (55.9%) | 40 (100.0%) |
| Total | 433 (72.1%) | 301 (69.0%) |
Income Below Poverty Among Married-Couple Families in Falcon Lake Estates
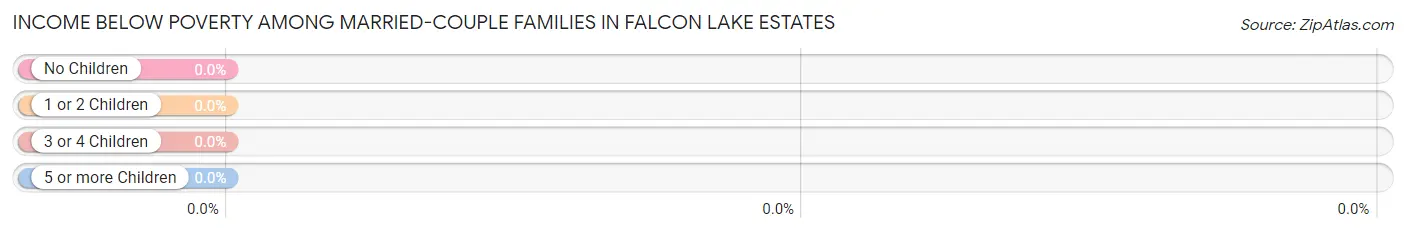
| Children | Above Poverty | Below Poverty |
| No Children | 69 (100.0%) | 0 (0.0%) |
| 1 or 2 Children | 29 (100.0%) | 0 (0.0%) |
| 3 or 4 Children | 0 (0.0%) | 0 (0.0%) |
| 5 or more Children | 0 (0.0%) | 0 (0.0%) |
| Total | 98 (100.0%) | 0 (0.0%) |
Income Below Poverty Among Single-Parent Households in Falcon Lake Estates
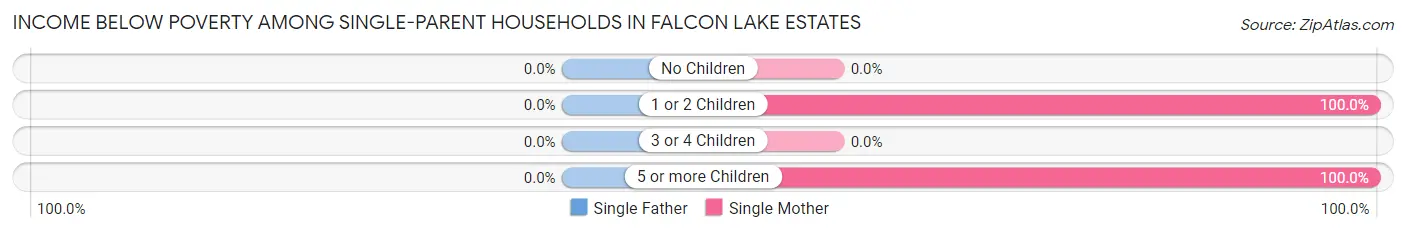
| Children | Single Father | Single Mother |
| No Children | 0 (0.0%) | 0 (0.0%) |
| 1 or 2 Children | 0 (0.0%) | 31 (100.0%) |
| 3 or 4 Children | 0 (0.0%) | 0 (0.0%) |
| 5 or more Children | 0 (0.0%) | 30 (100.0%) |
| Total | 0 (0.0%) | 61 (100.0%) |
Income Below Poverty Among Married-Couple vs Single-Parent Households in Falcon Lake Estates
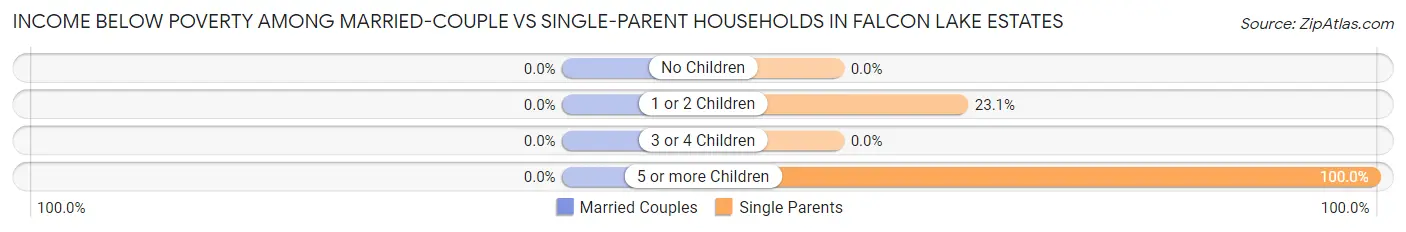
| Children | Married-Couple Families | Single-Parent Households |
| No Children | 0 (0.0%) | 0 (0.0%) |
| 1 or 2 Children | 0 (0.0%) | 31 (23.1%) |
| 3 or 4 Children | 0 (0.0%) | 0 (0.0%) |
| 5 or more Children | 0 (0.0%) | 30 (100.0%) |
| Total | 0 (0.0%) | 61 (31.4%) |
Race in Falcon Lake Estates
The most populous races in Falcon Lake Estates are Hispanic or Latino (829 | 79.9%), Two or more Races (651 | 62.8%), and White / Caucasian (386 | 37.2%).
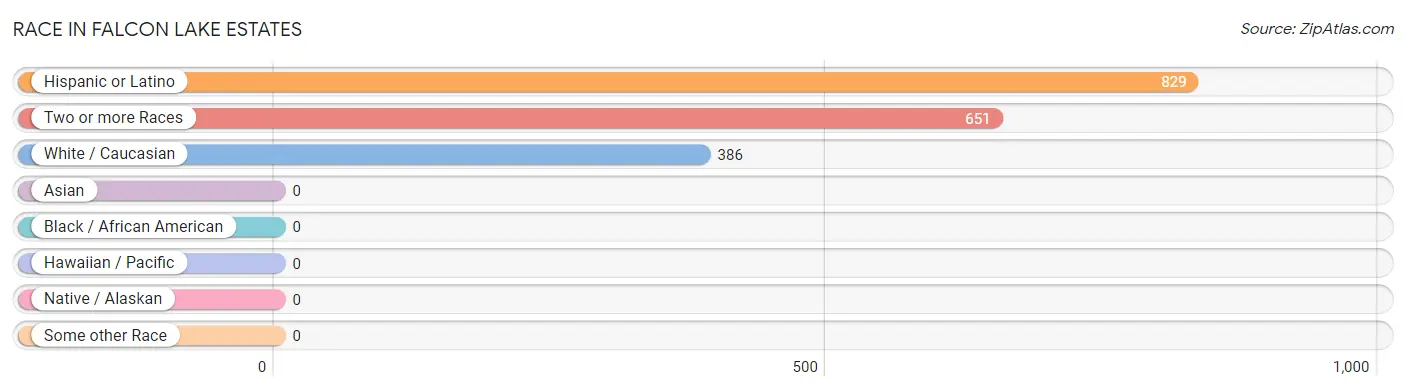
| Race | # Population | % Population |
| Asian | 0 | 0.0% |
| Black / African American | 0 | 0.0% |
| Hawaiian / Pacific | 0 | 0.0% |
| Hispanic or Latino | 829 | 79.9% |
| Native / Alaskan | 0 | 0.0% |
| White / Caucasian | 386 | 37.2% |
| Two or more Races | 651 | 62.8% |
| Some other Race | 0 | 0.0% |
| Total | 1,037 | 100.0% |
Ancestry in Falcon Lake Estates
The most populous ancestries reported in Falcon Lake Estates are Mexican (829 | 79.9%), German (30 | 2.9%), Irish (25 | 2.4%), Italian (25 | 2.4%), and English (17 | 1.6%), together accounting for 89.3% of all Falcon Lake Estates residents.
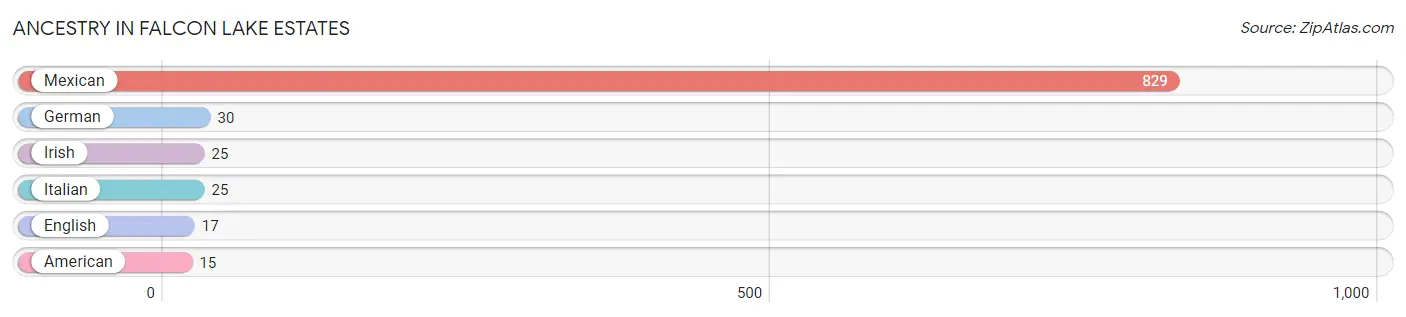
| Ancestry | # Population | % Population |
| American | 15 | 1.5% |
| English | 17 | 1.6% |
| German | 30 | 2.9% |
| Irish | 25 | 2.4% |
| Italian | 25 | 2.4% |
| Mexican | 829 | 79.9% | View All 6 Rows |
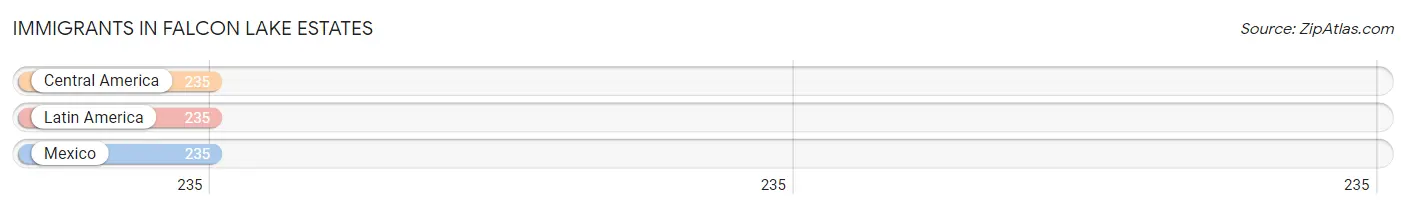
Immigrants in Falcon Lake Estates
The most numerous immigrant groups reported in Falcon Lake Estates came from Central America (235 | 22.7%), Latin America (235 | 22.7%), and Mexico (235 | 22.7%), together accounting for 68.0% of all Falcon Lake Estates residents.
| Immigration Origin | # Population | % Population |
| Central America | 235 | 22.7% |
| Latin America | 235 | 22.7% |
| Mexico | 235 | 22.7% | View All 3 Rows |
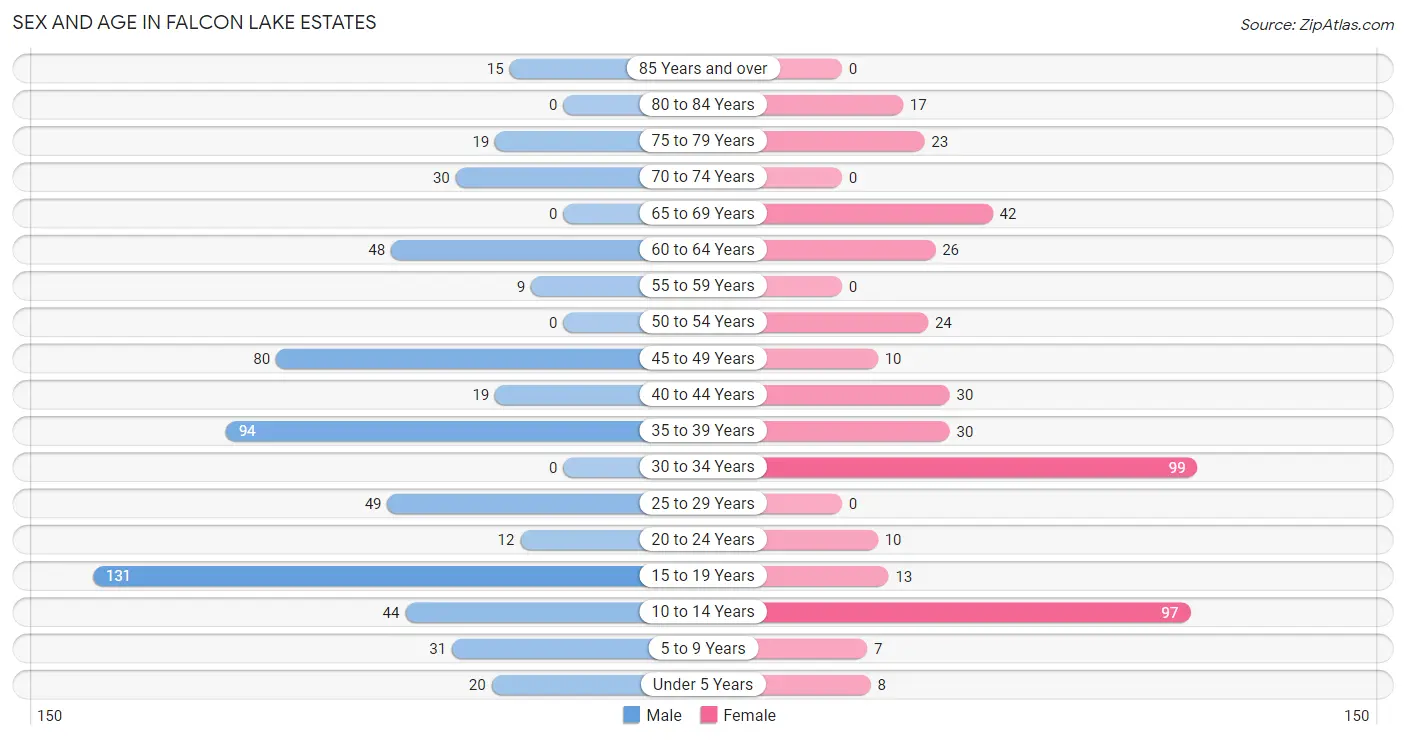
Sex and Age in Falcon Lake Estates
Sex and Age in Falcon Lake Estates
The most populous age groups in Falcon Lake Estates are 15 to 19 Years (131 | 21.8%) for men and 30 to 34 Years (99 | 22.7%) for women.
| Age Bracket | Male | Female |
| Under 5 Years | 20 (3.3%) | 8 (1.8%) |
| 5 to 9 Years | 31 (5.2%) | 7 (1.6%) |
| 10 to 14 Years | 44 (7.3%) | 97 (22.3%) |
| 15 to 19 Years | 131 (21.8%) | 13 (3.0%) |
| 20 to 24 Years | 12 (2.0%) | 10 (2.3%) |
| 25 to 29 Years | 49 (8.2%) | 0 (0.0%) |
| 30 to 34 Years | 0 (0.0%) | 99 (22.7%) |
| 35 to 39 Years | 94 (15.6%) | 30 (6.9%) |
| 40 to 44 Years | 19 (3.2%) | 30 (6.9%) |
| 45 to 49 Years | 80 (13.3%) | 10 (2.3%) |
| 50 to 54 Years | 0 (0.0%) | 24 (5.5%) |
| 55 to 59 Years | 9 (1.5%) | 0 (0.0%) |
| 60 to 64 Years | 48 (8.0%) | 26 (6.0%) |
| 65 to 69 Years | 0 (0.0%) | 42 (9.6%) |
| 70 to 74 Years | 30 (5.0%) | 0 (0.0%) |
| 75 to 79 Years | 19 (3.2%) | 23 (5.3%) |
| 80 to 84 Years | 0 (0.0%) | 17 (3.9%) |
| 85 Years and over | 15 (2.5%) | 0 (0.0%) |
| Total | 601 (100.0%) | 436 (100.0%) |
Families and Households in Falcon Lake Estates
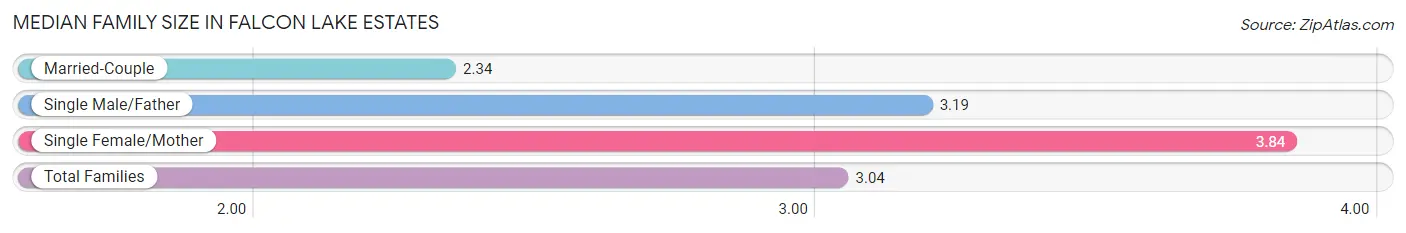
Median Family Size in Falcon Lake Estates
The median family size in Falcon Lake Estates is 3.04 persons per family, with single female/mother families (61 | 20.9%) accounting for the largest median family size of 3.84 persons per family. On the other hand, married-couple families (98 | 33.6%) represent the smallest median family size with 2.34 persons per family.
| Family Type | # Families | Family Size |
| Married-Couple | 98 (33.6%) | 2.34 |
| Single Male/Father | 133 (45.6%) | 3.19 |
| Single Female/Mother | 61 (20.9%) | 3.84 |
| Total Families | 292 (100.0%) | 3.04 |
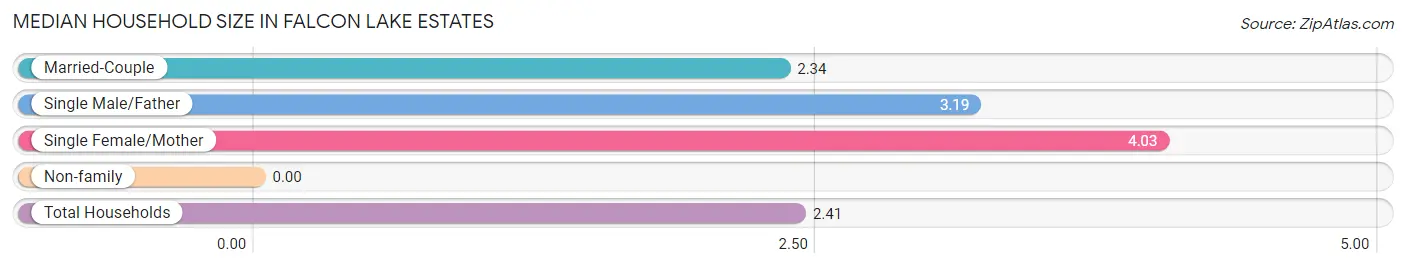
Median Household Size in Falcon Lake Estates
| Household Type | # Households | Household Size |
| Married-Couple | 98 (22.8%) | 2.34 |
| Single Male/Father | 133 (30.9%) | 3.19 |
| Single Female/Mother | 61 (14.2%) | 4.03 |
| Non-family | 138 (32.1%) | - |
| Total Households | 430 (100.0%) | 2.41 |
Household Size by Marriage Status in Falcon Lake Estates
Out of a total of 430 households in Falcon Lake Estates, 292 (67.9%) are family households, while 138 (32.1%) are nonfamily households. The most numerous type of family households are 4-person households, comprising 132, and the most common type of nonfamily households are 1-person households, comprising 138.
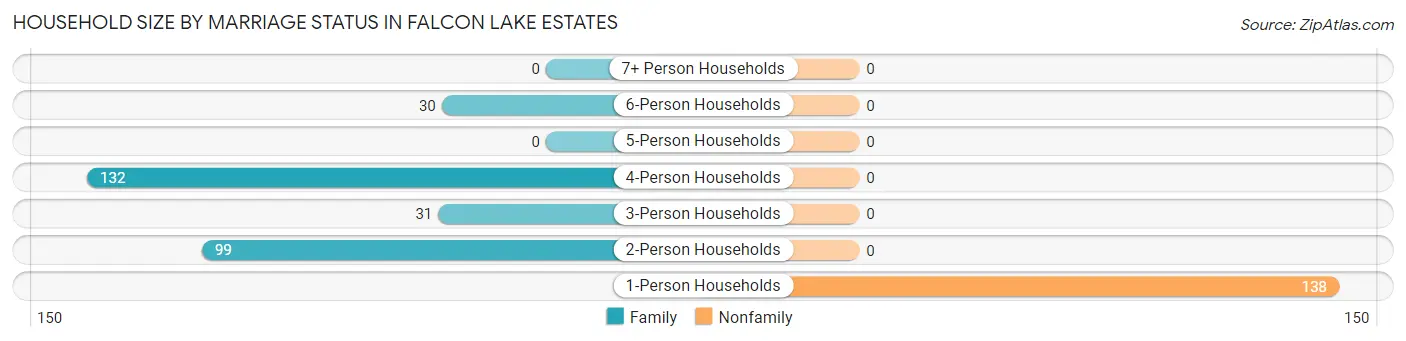
| Household Size | Family Households | Nonfamily Households |
| 1-Person Households | - | 138 (32.1%) |
| 2-Person Households | 99 (23.0%) | 0 (0.0%) |
| 3-Person Households | 31 (7.2%) | 0 (0.0%) |
| 4-Person Households | 132 (30.7%) | 0 (0.0%) |
| 5-Person Households | 0 (0.0%) | 0 (0.0%) |
| 6-Person Households | 30 (7.0%) | 0 (0.0%) |
| 7+ Person Households | 0 (0.0%) | 0 (0.0%) |
| Total | 292 (67.9%) | 138 (32.1%) |
Female Fertility in Falcon Lake Estates
Fertility by Age in Falcon Lake Estates
| Age Bracket | Women with Births | Births / 1,000 Women |
| 15 to 19 years | 0 (0.0%) | 0.0 |
| 20 to 34 years | 0 (0.0%) | 0.0 |
| 35 to 50 years | 0 (0.0%) | 0.0 |
| Total | 0 (0.0%) | 0.0 |
Fertility by Age by Marriage Status in Falcon Lake Estates
| Age Bracket | Married | Unmarried |
| 15 to 19 years | 0 (0.0%) | 0 (0.0%) |
| 20 to 34 years | 0 (0.0%) | 0 (0.0%) |
| 35 to 50 years | 0 (0.0%) | 0 (0.0%) |
| Total | 0 (0.0%) | 0 (0.0%) |
Fertility by Education in Falcon Lake Estates
| Educational Attainment | Women with Births | Births / 1,000 Women |
| Less than High School | 0 (0.0%) | 0.0 |
| High School Diploma | 0 (0.0%) | 0.0 |
| College or Associate's Degree | 0 (0.0%) | 0.0 |
| Bachelor's Degree | 0 (0.0%) | 0.0 |
| Graduate Degree | 0 (0.0%) | 0.0 |
| Total | 0 (0.0%) | 0.0 |
Fertility by Education by Marriage Status in Falcon Lake Estates
| Educational Attainment | Married | Unmarried |
| Less than High School | 0 (0.0%) | 0 (0.0%) |
| High School Diploma | 0 (0.0%) | 0 (0.0%) |
| College or Associate's Degree | 0 (0.0%) | 0 (0.0%) |
| Bachelor's Degree | 0 (0.0%) | 0 (0.0%) |
| Graduate Degree | 0 (0.0%) | 0 (0.0%) |
| Total | 0 (0.0%) | 0 (0.0%) |
Employment Characteristics in Falcon Lake Estates
Employment by Class of Employer in Falcon Lake Estates
Among the 384 employed individuals in Falcon Lake Estates, private company employees (326 | 84.9%), self-employed (not incorporated) (33 | 8.6%), and federal government employees (25 | 6.5%) make up the most common classes of employment.
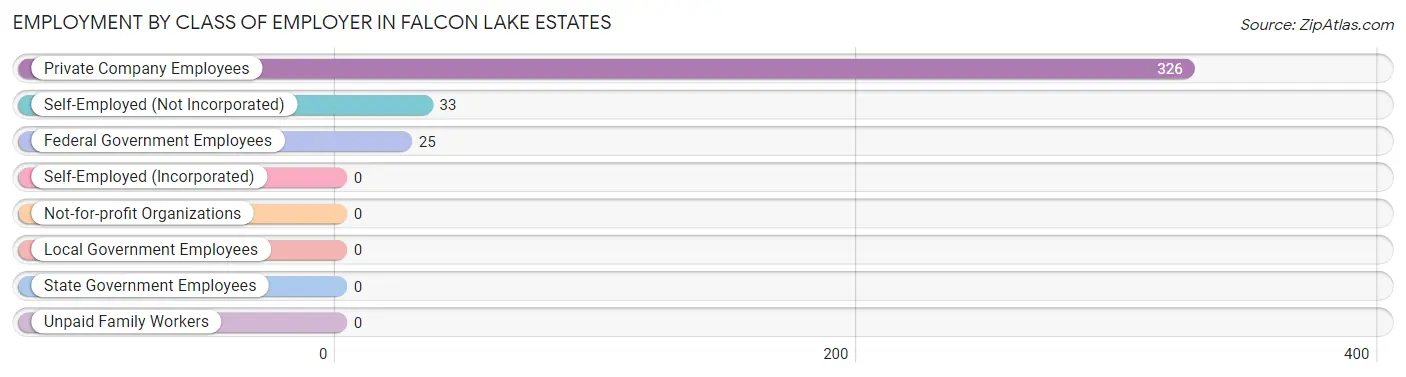
| Employer Class | # Employees | % Employees |
| Private Company Employees | 326 | 84.9% |
| Self-Employed (Incorporated) | 0 | 0.0% |
| Self-Employed (Not Incorporated) | 33 | 8.6% |
| Not-for-profit Organizations | 0 | 0.0% |
| Local Government Employees | 0 | 0.0% |
| State Government Employees | 0 | 0.0% |
| Federal Government Employees | 25 | 6.5% |
| Unpaid Family Workers | 0 | 0.0% |
| Total | 384 | 100.0% |
Employment Status by Age in Falcon Lake Estates
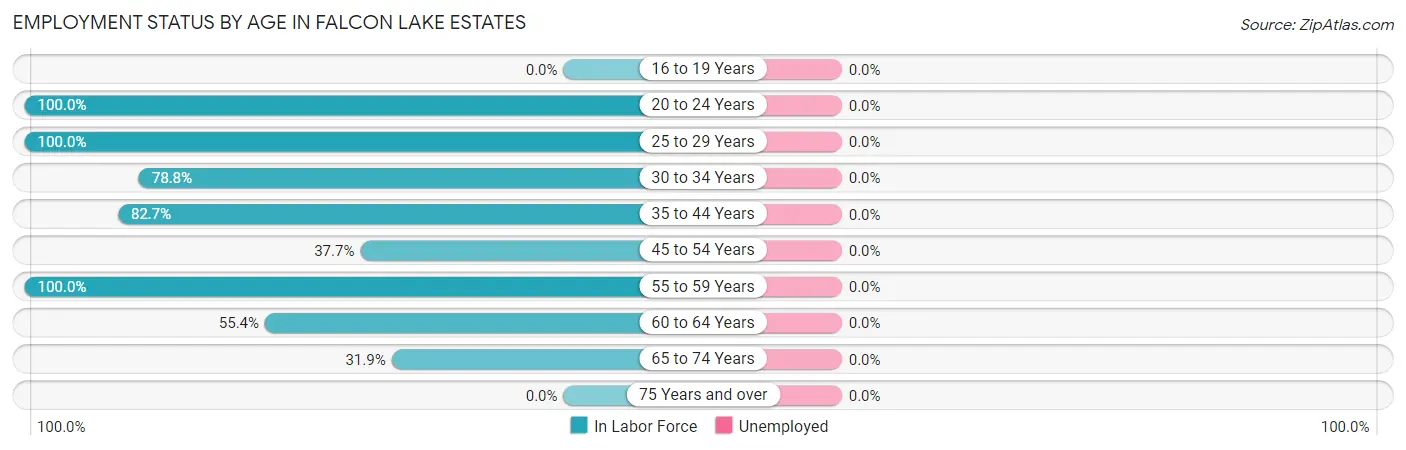
| Age Bracket | In Labor Force | Unemployed |
| 16 to 19 Years | 0 (0.0%) | 0 (0.0%) |
| 20 to 24 Years | 22 (100.0%) | 0 (0.0%) |
| 25 to 29 Years | 49 (100.0%) | 0 (0.0%) |
| 30 to 34 Years | 78 (78.8%) | 0 (0.0%) |
| 35 to 44 Years | 143 (82.7%) | 0 (0.0%) |
| 45 to 54 Years | 43 (37.7%) | 0 (0.0%) |
| 55 to 59 Years | 9 (100.0%) | 0 (0.0%) |
| 60 to 64 Years | 41 (55.4%) | 0 (0.0%) |
| 65 to 74 Years | 23 (31.9%) | 0 (0.0%) |
| 75 Years and over | 0 (0.0%) | 0 (0.0%) |
| Total | 408 (56.7%) | 0 (0.0%) |
Employment Status by Educational Attainment in Falcon Lake Estates
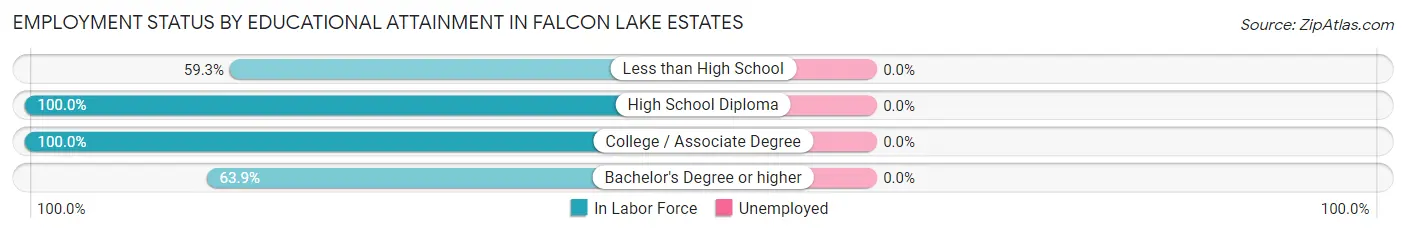
| Educational Attainment | In Labor Force | Unemployed |
| Less than High School | 182 (59.3%) | 0 (0.0%) |
| High School Diploma | 63 (100.0%) | 0 (0.0%) |
| College / Associate Degree | 65 (100.0%) | 0 (0.0%) |
| Bachelor's Degree or higher | 53 (63.9%) | 0 (0.0%) |
| Total | 363 (70.1%) | 0 (0.0%) |
Employment Occupations by Sex in Falcon Lake Estates
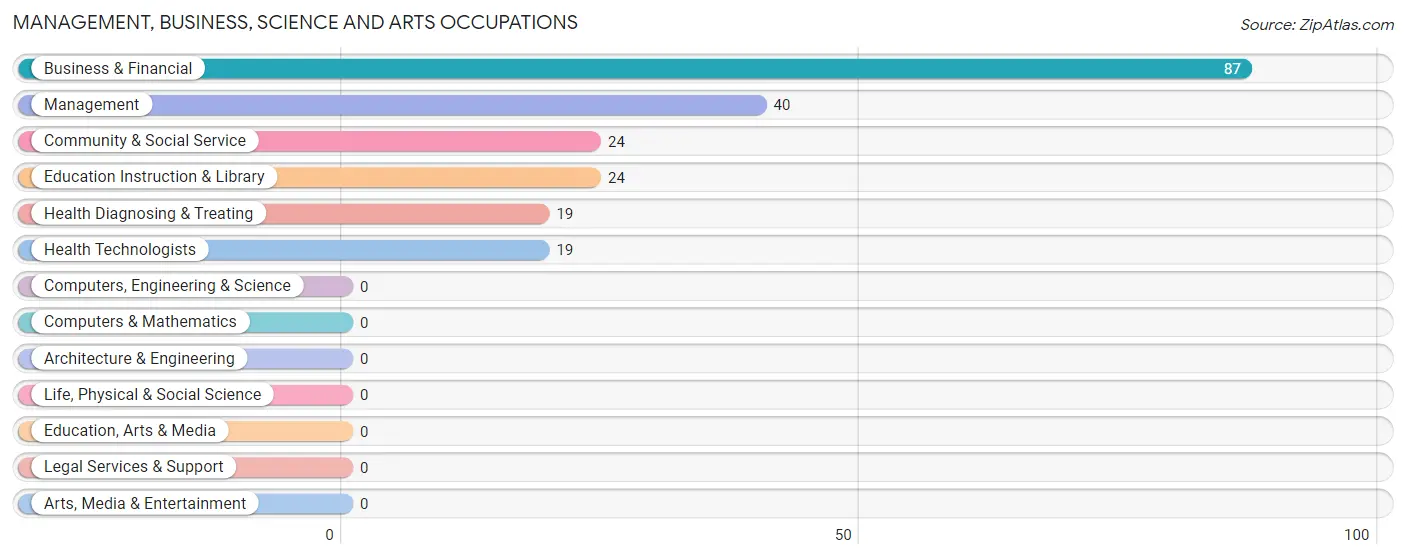
Management, Business, Science and Arts Occupations
The most common Management, Business, Science and Arts occupations in Falcon Lake Estates are Business & Financial (87 | 21.3%), Management (40 | 9.8%), Community & Social Service (24 | 5.9%), Education Instruction & Library (24 | 5.9%), and Health Diagnosing & Treating (19 | 4.7%).
Management, Business, Science and Arts Occupations by Sex
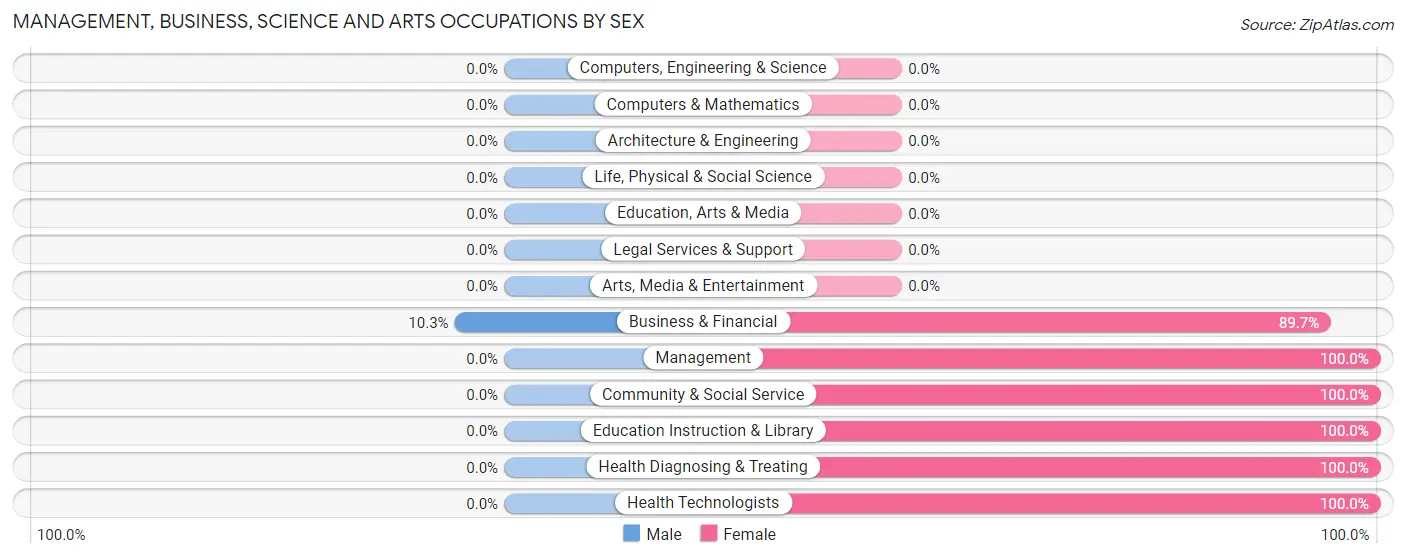
| Occupation | Male | Female |
| Management | 0 (0.0%) | 40 (100.0%) |
| Business & Financial | 9 (10.3%) | 78 (89.7%) |
| Computers, Engineering & Science | 0 (0.0%) | 0 (0.0%) |
| Computers & Mathematics | 0 (0.0%) | 0 (0.0%) |
| Architecture & Engineering | 0 (0.0%) | 0 (0.0%) |
| Life, Physical & Social Science | 0 (0.0%) | 0 (0.0%) |
| Community & Social Service | 0 (0.0%) | 24 (100.0%) |
| Education, Arts & Media | 0 (0.0%) | 0 (0.0%) |
| Legal Services & Support | 0 (0.0%) | 0 (0.0%) |
| Education Instruction & Library | 0 (0.0%) | 24 (100.0%) |
| Arts, Media & Entertainment | 0 (0.0%) | 0 (0.0%) |
| Health Diagnosing & Treating | 0 (0.0%) | 19 (100.0%) |
| Health Technologists | 0 (0.0%) | 19 (100.0%) |
| Total (Category) | 9 (5.3%) | 161 (94.7%) |
| Total (Overall) | 198 (48.5%) | 210 (51.5%) |
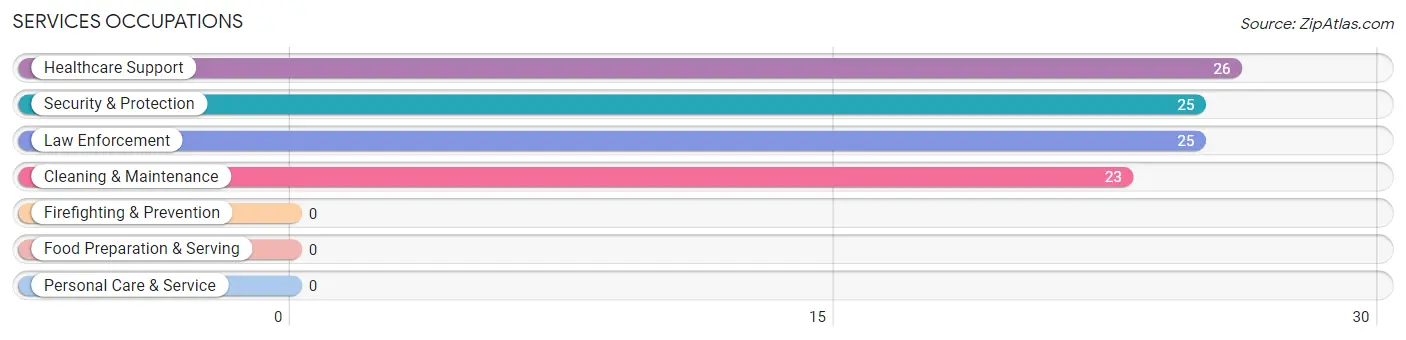
Services Occupations
The most common Services occupations in Falcon Lake Estates are Healthcare Support (26 | 6.4%), Security & Protection (25 | 6.1%), Law Enforcement (25 | 6.1%), and Cleaning & Maintenance (23 | 5.6%).
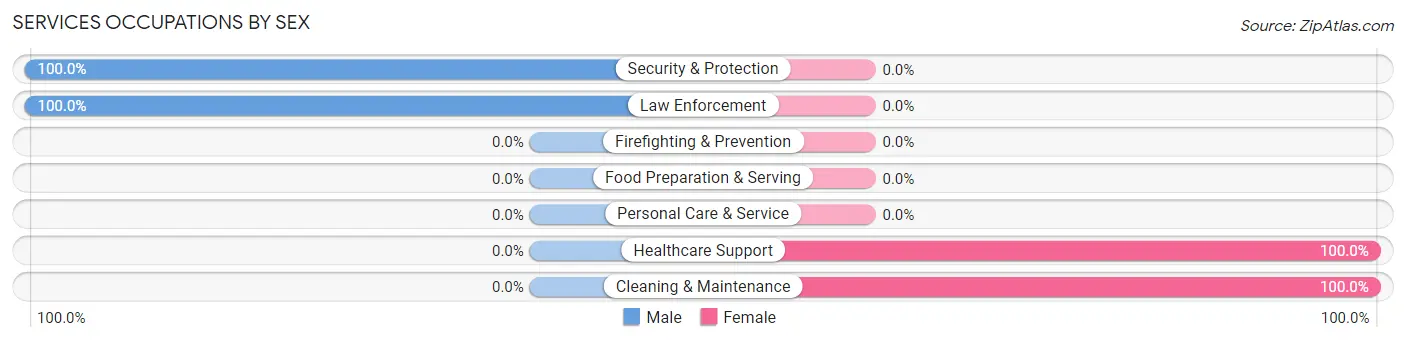
Services Occupations by Sex
Within the Services occupations in Falcon Lake Estates, the most male-oriented occupations are Security & Protection (100.0%), and Law Enforcement (100.0%), while the most female-oriented occupations are Healthcare Support (100.0%), and Cleaning & Maintenance (100.0%).
| Occupation | Male | Female |
| Healthcare Support | 0 (0.0%) | 26 (100.0%) |
| Security & Protection | 25 (100.0%) | 0 (0.0%) |
| Firefighting & Prevention | 0 (0.0%) | 0 (0.0%) |
| Law Enforcement | 25 (100.0%) | 0 (0.0%) |
| Food Preparation & Serving | 0 (0.0%) | 0 (0.0%) |
| Cleaning & Maintenance | 0 (0.0%) | 23 (100.0%) |
| Personal Care & Service | 0 (0.0%) | 0 (0.0%) |
| Total (Category) | 25 (33.8%) | 49 (66.2%) |
| Total (Overall) | 198 (48.5%) | 210 (51.5%) |
Sales and Office Occupations
The most common Sales and Office occupations in Falcon Lake Estates are , and Sales & Related (15 | 3.7%).
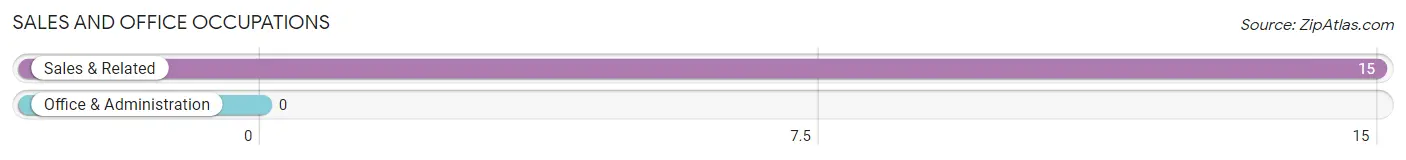
Sales and Office Occupations by Sex
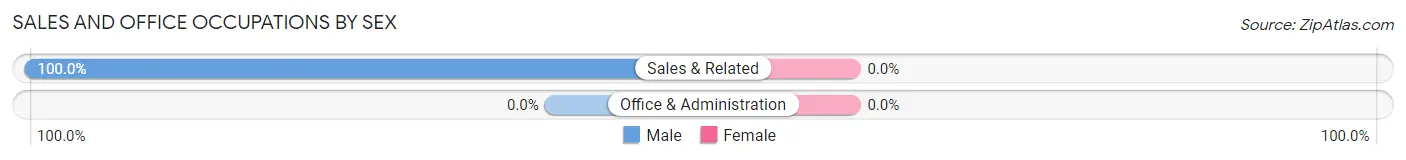
| Occupation | Male | Female |
| Sales & Related | 15 (100.0%) | 0 (0.0%) |
| Office & Administration | 0 (0.0%) | 0 (0.0%) |
| Total (Category) | 15 (100.0%) | 0 (0.0%) |
| Total (Overall) | 198 (48.5%) | 210 (51.5%) |
Natural Resources, Construction and Maintenance Occupations
The most common Natural Resources, Construction and Maintenance occupations in Falcon Lake Estates are Construction & Extraction (104 | 25.5%), and Installation, Maintenance & Repair (12 | 2.9%).
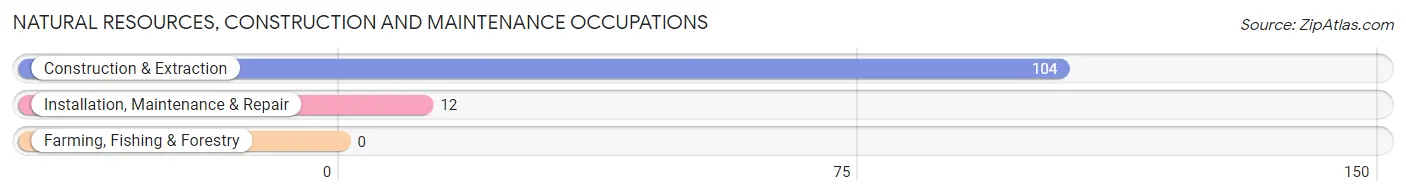
Natural Resources, Construction and Maintenance Occupations by Sex
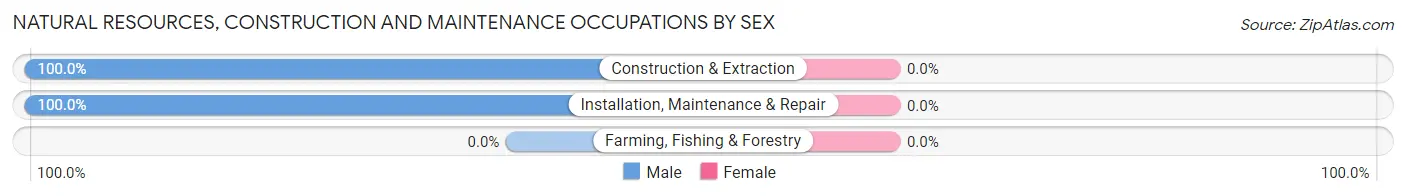
| Occupation | Male | Female |
| Farming, Fishing & Forestry | 0 (0.0%) | 0 (0.0%) |
| Construction & Extraction | 104 (100.0%) | 0 (0.0%) |
| Installation, Maintenance & Repair | 12 (100.0%) | 0 (0.0%) |
| Total (Category) | 116 (100.0%) | 0 (0.0%) |
| Total (Overall) | 198 (48.5%) | 210 (51.5%) |
Production, Transportation and Moving Occupations
The most common Production, Transportation and Moving occupations in Falcon Lake Estates are , and Transportation (33 | 8.1%).
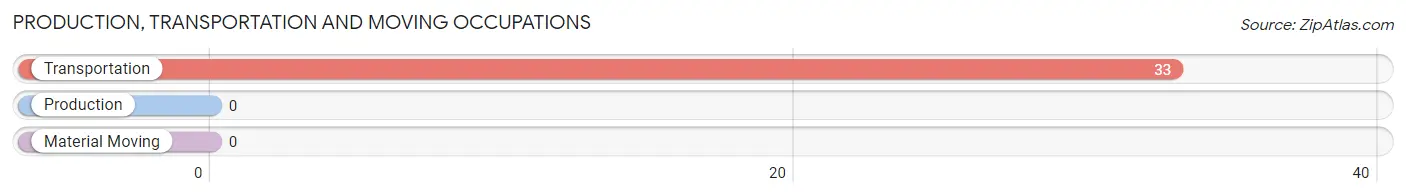
Production, Transportation and Moving Occupations by Sex
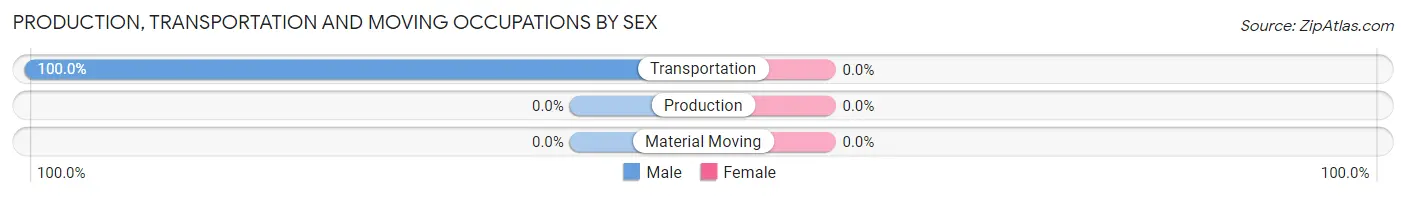
| Occupation | Male | Female |
| Production | 0 (0.0%) | 0 (0.0%) |
| Transportation | 33 (100.0%) | 0 (0.0%) |
| Material Moving | 0 (0.0%) | 0 (0.0%) |
| Total (Category) | 33 (100.0%) | 0 (0.0%) |
| Total (Overall) | 198 (48.5%) | 210 (51.5%) |
Employment Industries by Sex in Falcon Lake Estates
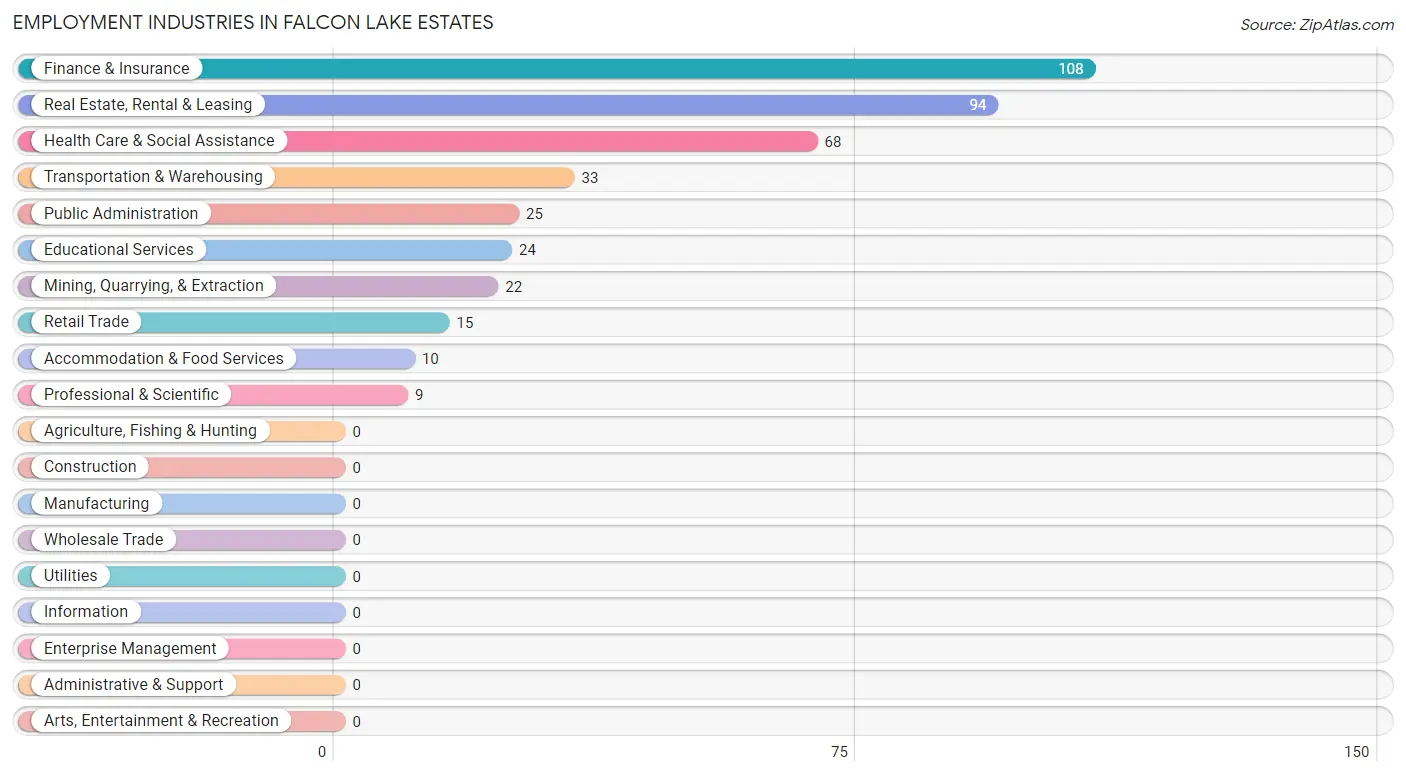
Employment Industries in Falcon Lake Estates
The major employment industries in Falcon Lake Estates include Finance & Insurance (108 | 26.5%), Real Estate, Rental & Leasing (94 | 23.0%), Health Care & Social Assistance (68 | 16.7%), Transportation & Warehousing (33 | 8.1%), and Public Administration (25 | 6.1%).
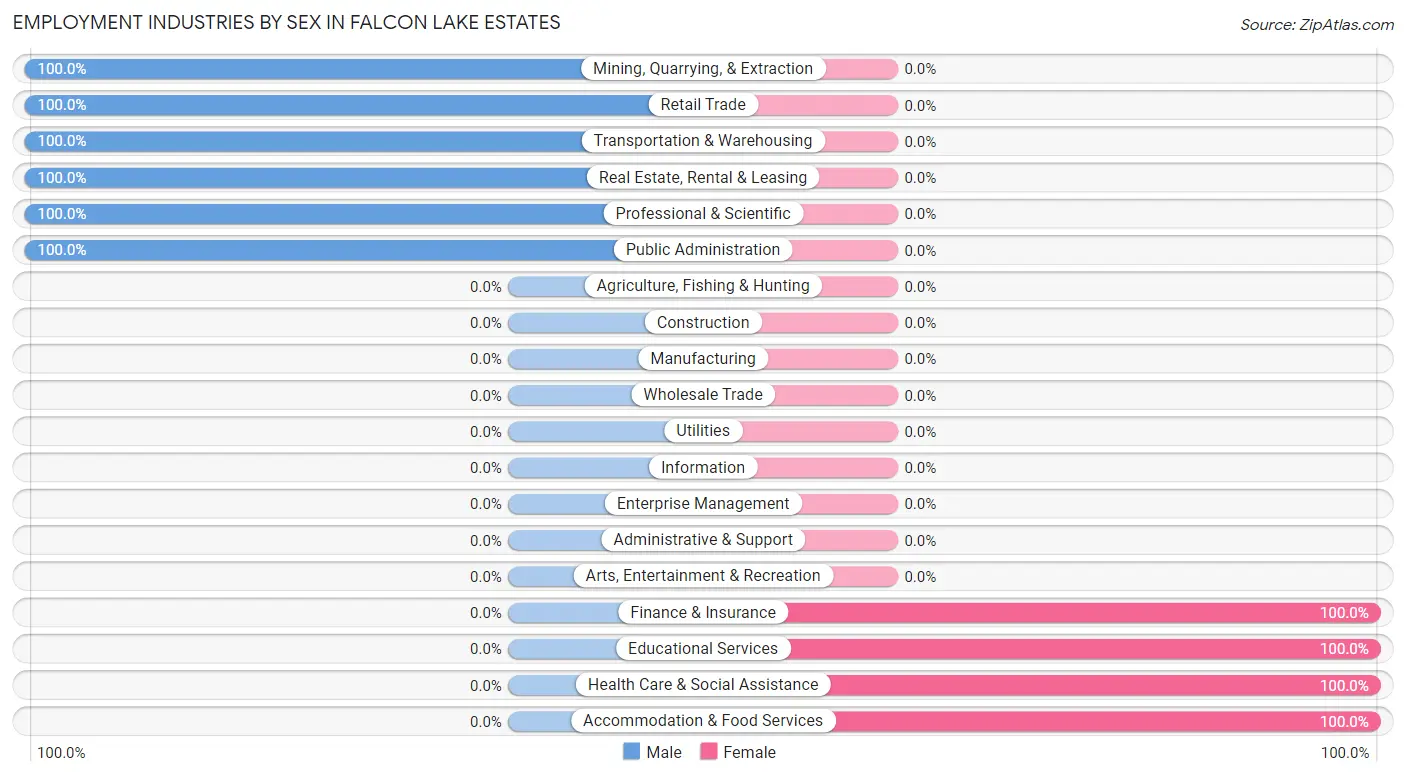
Employment Industries by Sex in Falcon Lake Estates
The Falcon Lake Estates industries that see more men than women are Mining, Quarrying, & Extraction (100.0%), Retail Trade (100.0%), and Transportation & Warehousing (100.0%), whereas the industries that tend to have a higher number of women are Finance & Insurance (100.0%), Educational Services (100.0%), and Health Care & Social Assistance (100.0%).
| Industry | Male | Female |
| Agriculture, Fishing & Hunting | 0 (0.0%) | 0 (0.0%) |
| Mining, Quarrying, & Extraction | 22 (100.0%) | 0 (0.0%) |
| Construction | 0 (0.0%) | 0 (0.0%) |
| Manufacturing | 0 (0.0%) | 0 (0.0%) |
| Wholesale Trade | 0 (0.0%) | 0 (0.0%) |
| Retail Trade | 15 (100.0%) | 0 (0.0%) |
| Transportation & Warehousing | 33 (100.0%) | 0 (0.0%) |
| Utilities | 0 (0.0%) | 0 (0.0%) |
| Information | 0 (0.0%) | 0 (0.0%) |
| Finance & Insurance | 0 (0.0%) | 108 (100.0%) |
| Real Estate, Rental & Leasing | 94 (100.0%) | 0 (0.0%) |
| Professional & Scientific | 9 (100.0%) | 0 (0.0%) |
| Enterprise Management | 0 (0.0%) | 0 (0.0%) |
| Administrative & Support | 0 (0.0%) | 0 (0.0%) |
| Educational Services | 0 (0.0%) | 24 (100.0%) |
| Health Care & Social Assistance | 0 (0.0%) | 68 (100.0%) |
| Arts, Entertainment & Recreation | 0 (0.0%) | 0 (0.0%) |
| Accommodation & Food Services | 0 (0.0%) | 10 (100.0%) |
| Public Administration | 25 (100.0%) | 0 (0.0%) |
| Total | 198 (48.5%) | 210 (51.5%) |
Education in Falcon Lake Estates
School Enrollment in Falcon Lake Estates
The most common levels of schooling among the 297 students in Falcon Lake Estates are high school (131 | 44.1%), middle school (128 | 43.1%), and elementary school (27 | 9.1%).
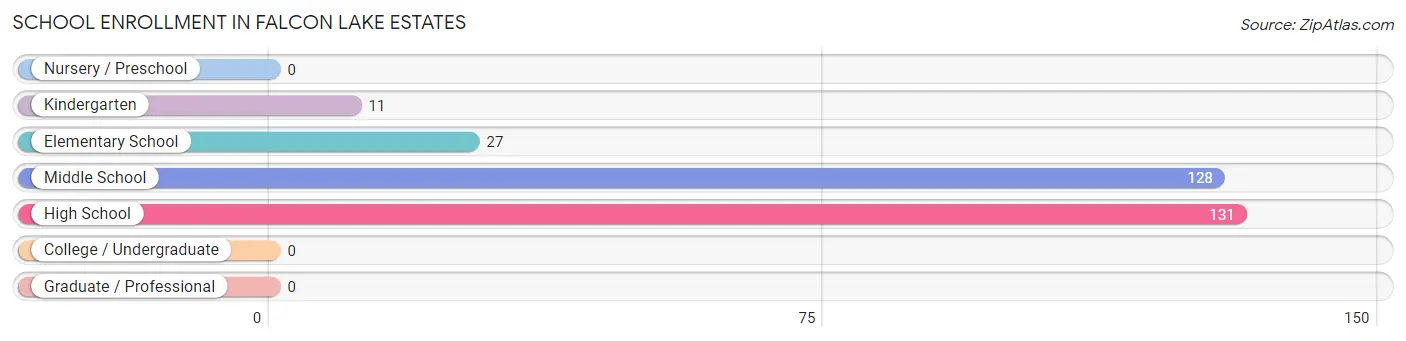
| School Level | # Students | % Students |
| Nursery / Preschool | 0 | 0.0% |
| Kindergarten | 11 | 3.7% |
| Elementary School | 27 | 9.1% |
| Middle School | 128 | 43.1% |
| High School | 131 | 44.1% |
| College / Undergraduate | 0 | 0.0% |
| Graduate / Professional | 0 | 0.0% |
| Total | 297 | 100.0% |
School Enrollment by Age by Funding Source in Falcon Lake Estates
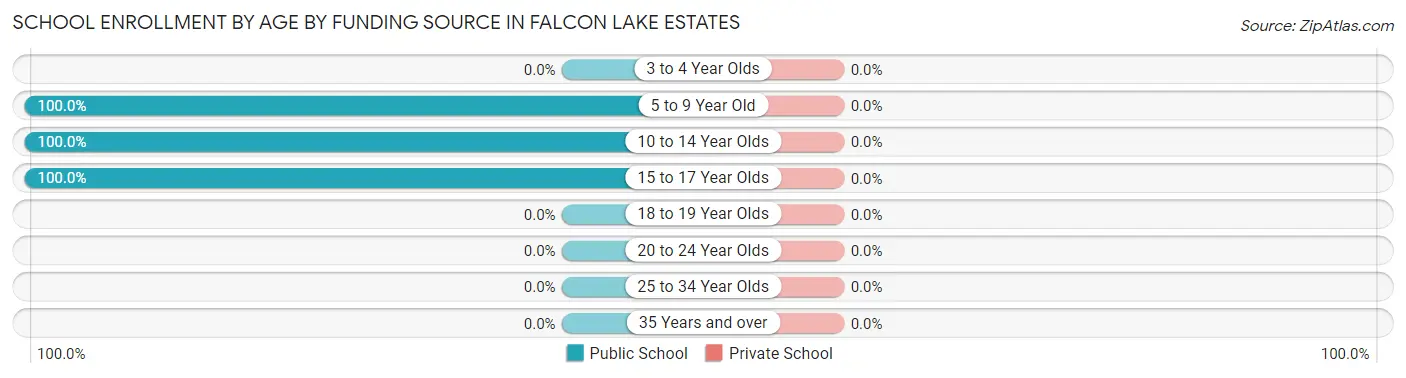
| Age Bracket | Public School | Private School |
| 3 to 4 Year Olds | 0 (0.0%) | 0 (0.0%) |
| 5 to 9 Year Old | 38 (100.0%) | 0 (0.0%) |
| 10 to 14 Year Olds | 128 (100.0%) | 0 (0.0%) |
| 15 to 17 Year Olds | 131 (100.0%) | 0 (0.0%) |
| 18 to 19 Year Olds | 0 (0.0%) | 0 (0.0%) |
| 20 to 24 Year Olds | 0 (0.0%) | 0 (0.0%) |
| 25 to 34 Year Olds | 0 (0.0%) | 0 (0.0%) |
| 35 Years and over | 0 (0.0%) | 0 (0.0%) |
| Total | 297 (100.0%) | 0 (0.0%) |
Educational Attainment by Field of Study in Falcon Lake Estates
Education (42 | 35.9%), business (25 | 21.4%), science & technology (19 | 16.2%), computers & mathematics (11 | 9.4%), and social sciences (11 | 9.4%) are the most common fields of study among 117 individuals in Falcon Lake Estates who have obtained a bachelor's degree or higher.
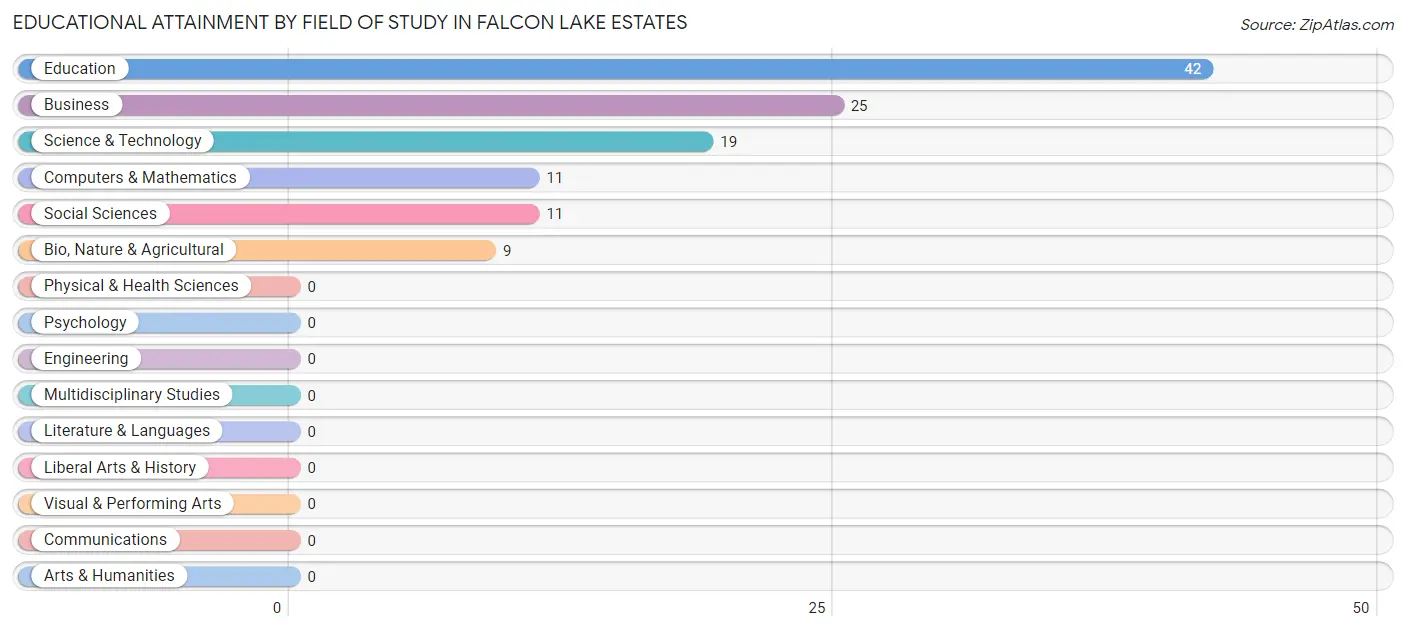
| Field of Study | # Graduates | % Graduates |
| Computers & Mathematics | 11 | 9.4% |
| Bio, Nature & Agricultural | 9 | 7.7% |
| Physical & Health Sciences | 0 | 0.0% |
| Psychology | 0 | 0.0% |
| Social Sciences | 11 | 9.4% |
| Engineering | 0 | 0.0% |
| Multidisciplinary Studies | 0 | 0.0% |
| Science & Technology | 19 | 16.2% |
| Business | 25 | 21.4% |
| Education | 42 | 35.9% |
| Literature & Languages | 0 | 0.0% |
| Liberal Arts & History | 0 | 0.0% |
| Visual & Performing Arts | 0 | 0.0% |
| Communications | 0 | 0.0% |
| Arts & Humanities | 0 | 0.0% |
| Total | 117 | 100.0% |
Transportation & Commute in Falcon Lake Estates
Vehicle Availability by Sex in Falcon Lake Estates
The most prevalent vehicle ownership categories in Falcon Lake Estates are males with 3 vehicles (128, accounting for 64.6%) and females with 3 vehicles (104, making up 68.8%).
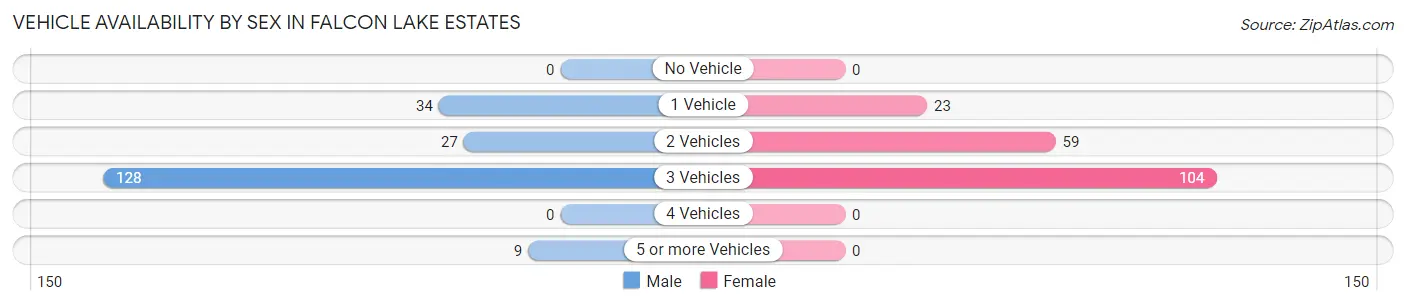
| Vehicles Available | Male | Female |
| No Vehicle | 0 (0.0%) | 0 (0.0%) |
| 1 Vehicle | 34 (17.2%) | 23 (12.4%) |
| 2 Vehicles | 27 (13.6%) | 59 (31.7%) |
| 3 Vehicles | 128 (64.6%) | 104 (55.9%) |
| 4 Vehicles | 0 (0.0%) | 0 (0.0%) |
| 5 or more Vehicles | 9 (4.5%) | 0 (0.0%) |
| Total | 198 (100.0%) | 186 (100.0%) |
Commute Time in Falcon Lake Estates
The most frequently occuring commute durations in Falcon Lake Estates are 60 to 89 minutes (97 commuters, 26.9%), 5 to 9 minutes (94 commuters, 26.0%), and 10 to 14 minutes (94 commuters, 26.0%).
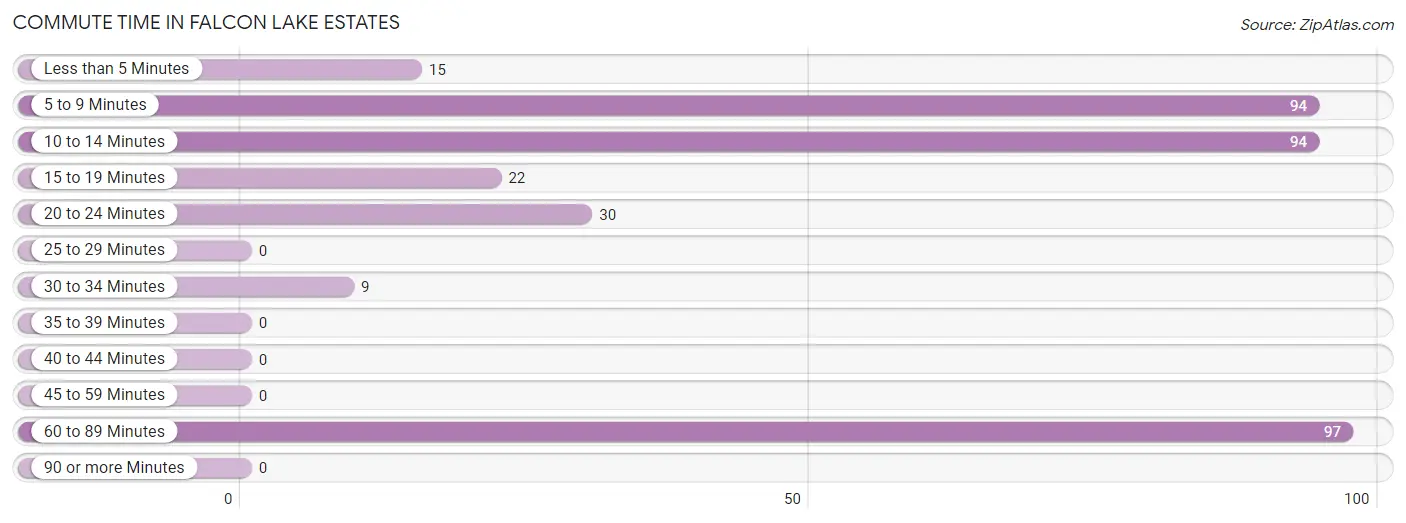
| Commute Time | # Commuters | % Commuters |
| Less than 5 Minutes | 15 | 4.2% |
| 5 to 9 Minutes | 94 | 26.0% |
| 10 to 14 Minutes | 94 | 26.0% |
| 15 to 19 Minutes | 22 | 6.1% |
| 20 to 24 Minutes | 30 | 8.3% |
| 25 to 29 Minutes | 0 | 0.0% |
| 30 to 34 Minutes | 9 | 2.5% |
| 35 to 39 Minutes | 0 | 0.0% |
| 40 to 44 Minutes | 0 | 0.0% |
| 45 to 59 Minutes | 0 | 0.0% |
| 60 to 89 Minutes | 97 | 26.9% |
| 90 or more Minutes | 0 | 0.0% |
Commute Time by Sex in Falcon Lake Estates
The most common commute times in Falcon Lake Estates are 10 to 14 minutes (94 commuters, 47.5%) for males and 60 to 89 minutes (97 commuters, 59.5%) for females.
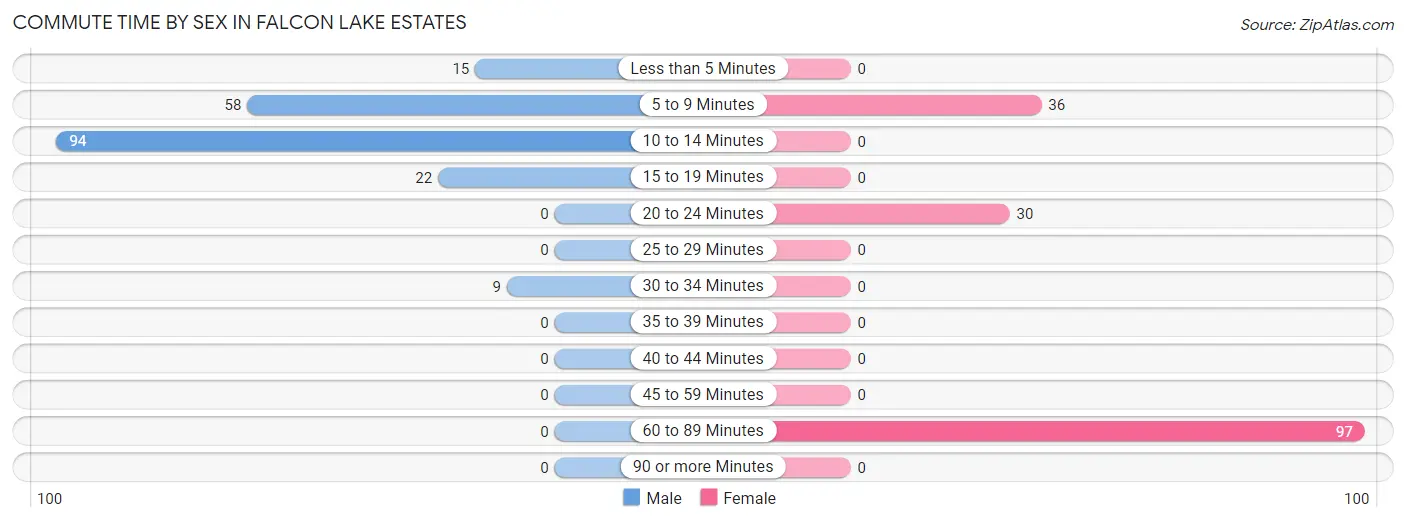
| Commute Time | Male | Female |
| Less than 5 Minutes | 15 (7.6%) | 0 (0.0%) |
| 5 to 9 Minutes | 58 (29.3%) | 36 (22.1%) |
| 10 to 14 Minutes | 94 (47.5%) | 0 (0.0%) |
| 15 to 19 Minutes | 22 (11.1%) | 0 (0.0%) |
| 20 to 24 Minutes | 0 (0.0%) | 30 (18.4%) |
| 25 to 29 Minutes | 0 (0.0%) | 0 (0.0%) |
| 30 to 34 Minutes | 9 (4.5%) | 0 (0.0%) |
| 35 to 39 Minutes | 0 (0.0%) | 0 (0.0%) |
| 40 to 44 Minutes | 0 (0.0%) | 0 (0.0%) |
| 45 to 59 Minutes | 0 (0.0%) | 0 (0.0%) |
| 60 to 89 Minutes | 0 (0.0%) | 97 (59.5%) |
| 90 or more Minutes | 0 (0.0%) | 0 (0.0%) |
Time of Departure to Work by Sex in Falcon Lake Estates
The most frequent times of departure to work in Falcon Lake Estates are 8:00 AM to 8:29 AM (94, 47.5%) for males and 7:30 AM to 7:59 AM (78, 47.8%) for females.
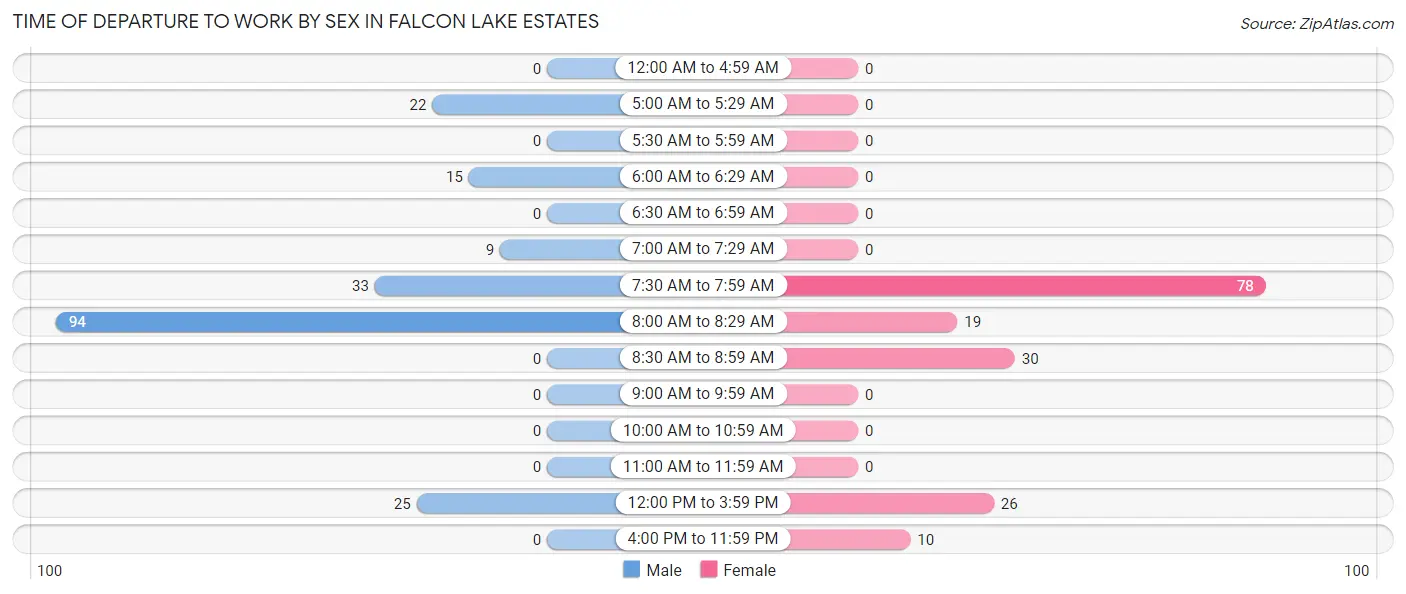
| Time of Departure | Male | Female |
| 12:00 AM to 4:59 AM | 0 (0.0%) | 0 (0.0%) |
| 5:00 AM to 5:29 AM | 22 (11.1%) | 0 (0.0%) |
| 5:30 AM to 5:59 AM | 0 (0.0%) | 0 (0.0%) |
| 6:00 AM to 6:29 AM | 15 (7.6%) | 0 (0.0%) |
| 6:30 AM to 6:59 AM | 0 (0.0%) | 0 (0.0%) |
| 7:00 AM to 7:29 AM | 9 (4.5%) | 0 (0.0%) |
| 7:30 AM to 7:59 AM | 33 (16.7%) | 78 (47.8%) |
| 8:00 AM to 8:29 AM | 94 (47.5%) | 19 (11.7%) |
| 8:30 AM to 8:59 AM | 0 (0.0%) | 30 (18.4%) |
| 9:00 AM to 9:59 AM | 0 (0.0%) | 0 (0.0%) |
| 10:00 AM to 10:59 AM | 0 (0.0%) | 0 (0.0%) |
| 11:00 AM to 11:59 AM | 0 (0.0%) | 0 (0.0%) |
| 12:00 PM to 3:59 PM | 25 (12.6%) | 26 (16.0%) |
| 4:00 PM to 11:59 PM | 0 (0.0%) | 10 (6.1%) |
| Total | 198 (100.0%) | 163 (100.0%) |
Housing Occupancy in Falcon Lake Estates
Occupancy by Ownership in Falcon Lake Estates
Of the total 430 dwellings in Falcon Lake Estates, owner-occupied units account for 371 (86.3%), while renter-occupied units make up 59 (13.7%).
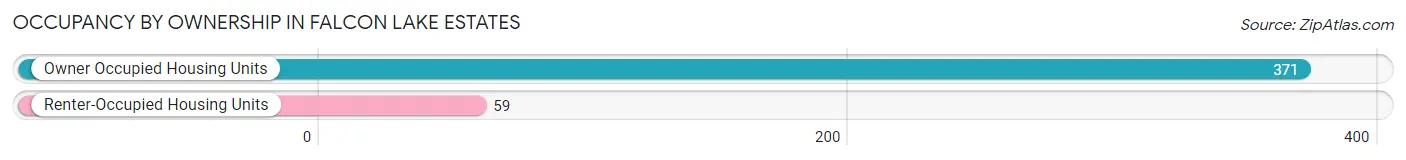
| Occupancy | # Housing Units | % Housing Units |
| Owner Occupied Housing Units | 371 | 86.3% |
| Renter-Occupied Housing Units | 59 | 13.7% |
| Total Occupied Housing Units | 430 | 100.0% |
Occupancy by Household Size in Falcon Lake Estates
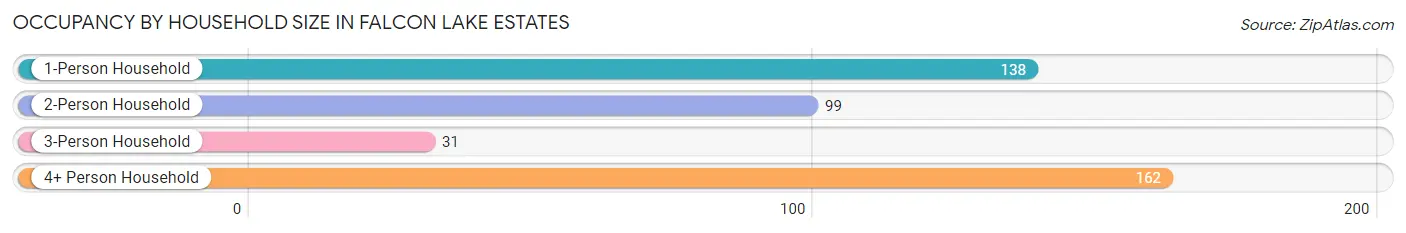
| Household Size | # Housing Units | % Housing Units |
| 1-Person Household | 138 | 32.1% |
| 2-Person Household | 99 | 23.0% |
| 3-Person Household | 31 | 7.2% |
| 4+ Person Household | 162 | 37.7% |
| Total Housing Units | 430 | 100.0% |
Occupancy by Ownership by Household Size in Falcon Lake Estates
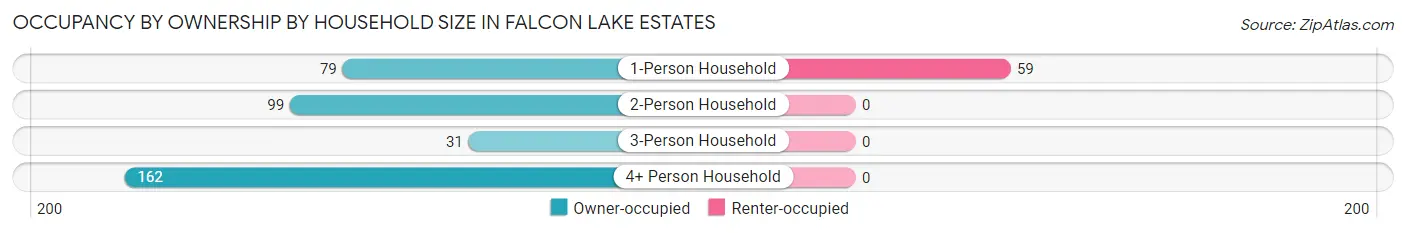
| Household Size | Owner-occupied | Renter-occupied |
| 1-Person Household | 79 (57.3%) | 59 (42.7%) |
| 2-Person Household | 99 (100.0%) | 0 (0.0%) |
| 3-Person Household | 31 (100.0%) | 0 (0.0%) |
| 4+ Person Household | 162 (100.0%) | 0 (0.0%) |
| Total Housing Units | 371 (86.3%) | 59 (13.7%) |
Occupancy by Educational Attainment in Falcon Lake Estates
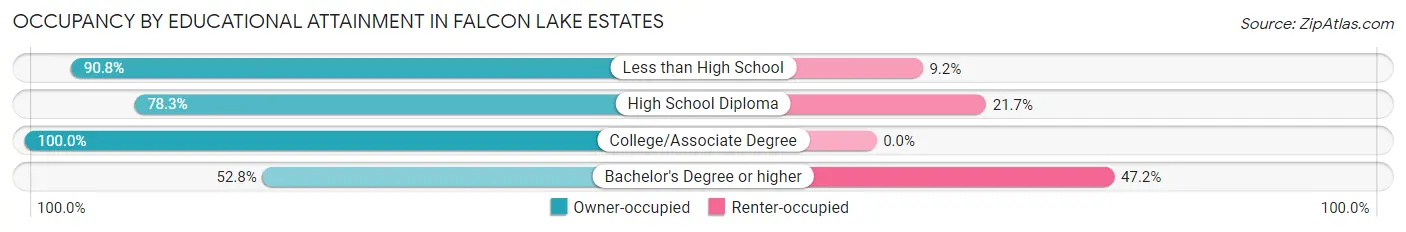
| Household Size | Owner-occupied | Renter-occupied |
| Less than High School | 188 (90.8%) | 19 (9.2%) |
| High School Diploma | 54 (78.3%) | 15 (21.7%) |
| College/Associate Degree | 101 (100.0%) | 0 (0.0%) |
| Bachelor's Degree or higher | 28 (52.8%) | 25 (47.2%) |
Occupancy by Age of Householder in Falcon Lake Estates
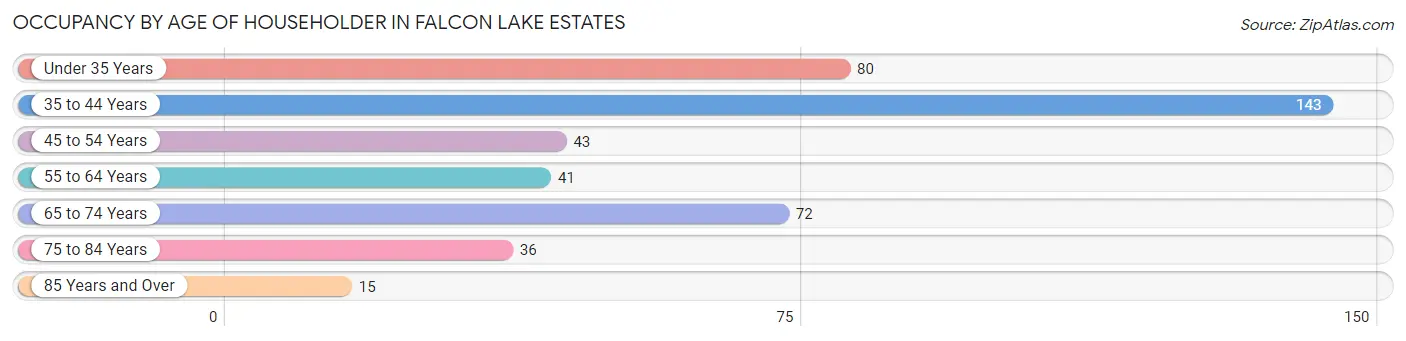
| Age Bracket | # Households | % Households |
| Under 35 Years | 80 | 18.6% |
| 35 to 44 Years | 143 | 33.3% |
| 45 to 54 Years | 43 | 10.0% |
| 55 to 64 Years | 41 | 9.5% |
| 65 to 74 Years | 72 | 16.7% |
| 75 to 84 Years | 36 | 8.4% |
| 85 Years and Over | 15 | 3.5% |
| Total | 430 | 100.0% |
Housing Finances in Falcon Lake Estates
Median Income by Occupancy in Falcon Lake Estates
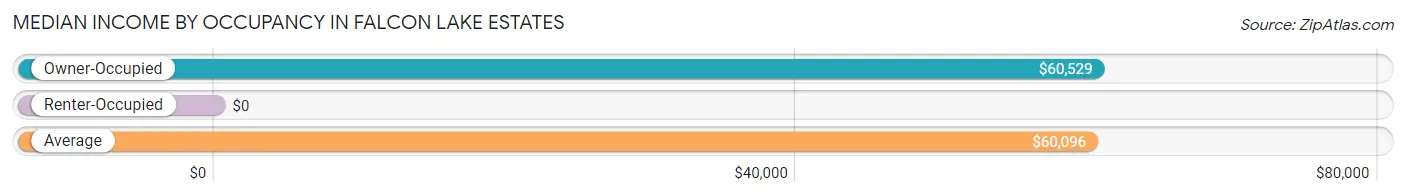
| Occupancy Type | # Households | Median Income |
| Owner-Occupied | 371 (86.3%) | $60,529 |
| Renter-Occupied | 59 (13.7%) | $0 |
| Average | 430 (100.0%) | $60,096 |
Occupancy by Householder Income Bracket in Falcon Lake Estates
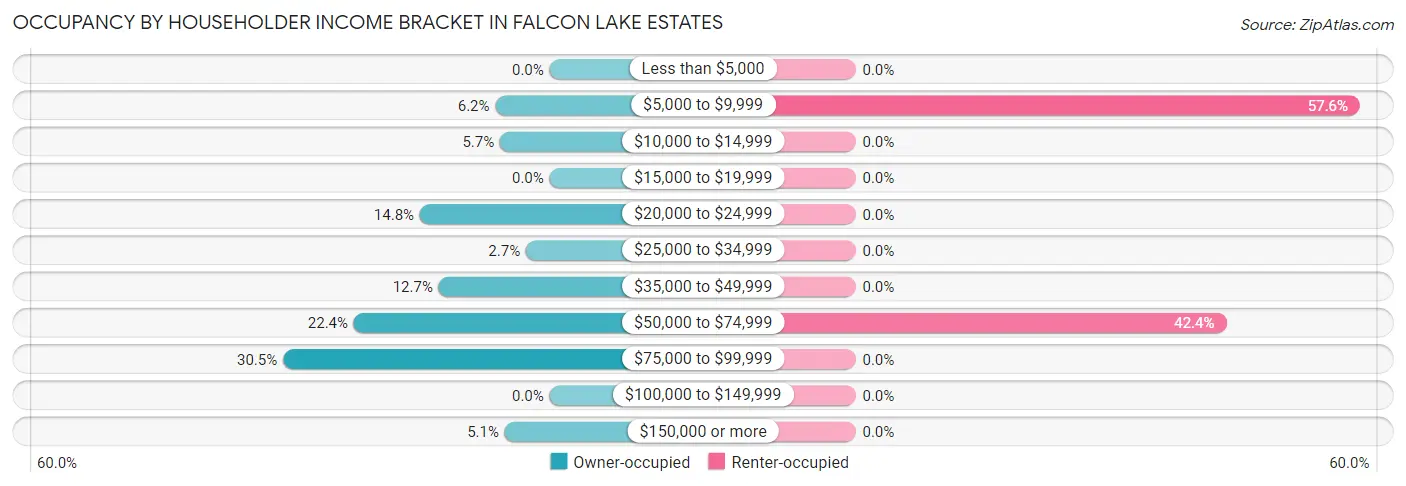
| Income Bracket | Owner-occupied | Renter-occupied |
| Less than $5,000 | 0 (0.0%) | 0 (0.0%) |
| $5,000 to $9,999 | 23 (6.2%) | 34 (57.6%) |
| $10,000 to $14,999 | 21 (5.7%) | 0 (0.0%) |
| $15,000 to $19,999 | 0 (0.0%) | 0 (0.0%) |
| $20,000 to $24,999 | 55 (14.8%) | 0 (0.0%) |
| $25,000 to $34,999 | 10 (2.7%) | 0 (0.0%) |
| $35,000 to $49,999 | 47 (12.7%) | 0 (0.0%) |
| $50,000 to $74,999 | 83 (22.4%) | 25 (42.4%) |
| $75,000 to $99,999 | 113 (30.5%) | 0 (0.0%) |
| $100,000 to $149,999 | 0 (0.0%) | 0 (0.0%) |
| $150,000 or more | 19 (5.1%) | 0 (0.0%) |
| Total | 371 (100.0%) | 59 (100.0%) |
Monthly Housing Cost Tiers in Falcon Lake Estates
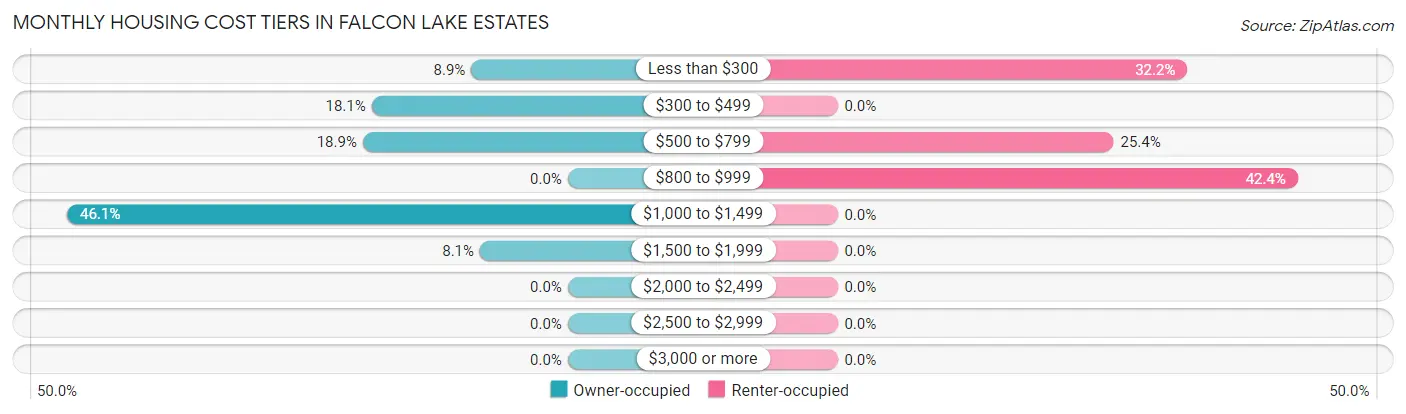
| Monthly Cost | Owner-occupied | Renter-occupied |
| Less than $300 | 33 (8.9%) | 19 (32.2%) |
| $300 to $499 | 67 (18.1%) | 0 (0.0%) |
| $500 to $799 | 70 (18.9%) | 15 (25.4%) |
| $800 to $999 | 0 (0.0%) | 25 (42.4%) |
| $1,000 to $1,499 | 171 (46.1%) | 0 (0.0%) |
| $1,500 to $1,999 | 30 (8.1%) | 0 (0.0%) |
| $2,000 to $2,499 | 0 (0.0%) | 0 (0.0%) |
| $2,500 to $2,999 | 0 (0.0%) | 0 (0.0%) |
| $3,000 or more | 0 (0.0%) | 0 (0.0%) |
| Total | 371 (100.0%) | 59 (100.0%) |
Physical Housing Characteristics in Falcon Lake Estates
Housing Structures in Falcon Lake Estates
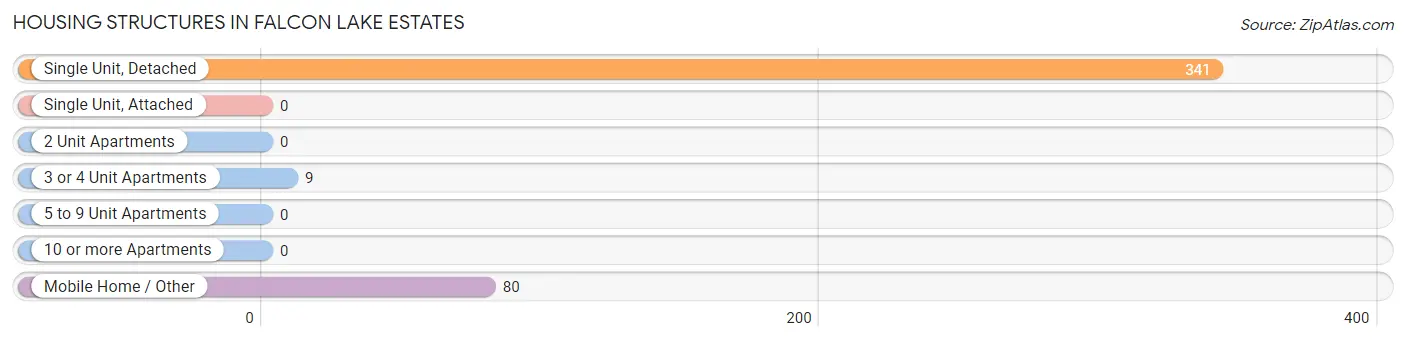
| Structure Type | # Housing Units | % Housing Units |
| Single Unit, Detached | 341 | 79.3% |
| Single Unit, Attached | 0 | 0.0% |
| 2 Unit Apartments | 0 | 0.0% |
| 3 or 4 Unit Apartments | 9 | 2.1% |
| 5 to 9 Unit Apartments | 0 | 0.0% |
| 10 or more Apartments | 0 | 0.0% |
| Mobile Home / Other | 80 | 18.6% |
| Total | 430 | 100.0% |
Housing Structures by Occupancy in Falcon Lake Estates
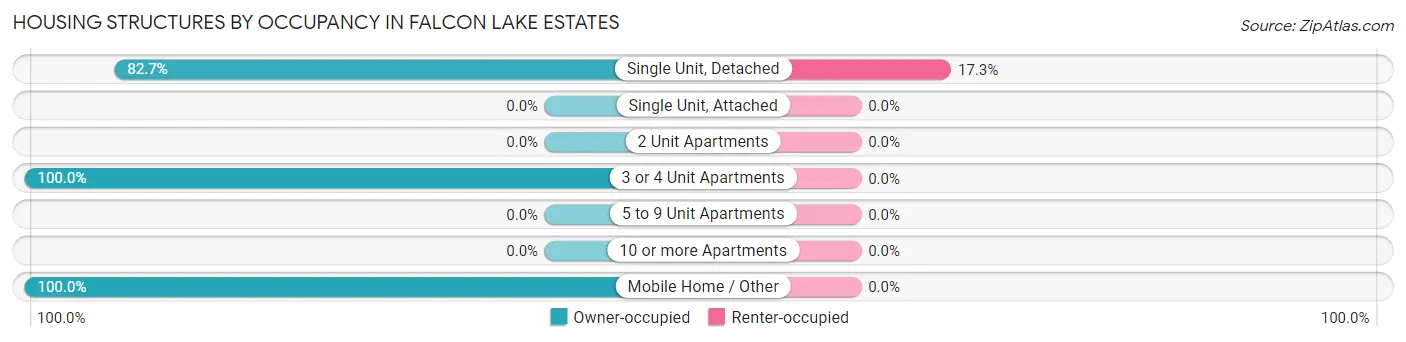
| Structure Type | Owner-occupied | Renter-occupied |
| Single Unit, Detached | 282 (82.7%) | 59 (17.3%) |
| Single Unit, Attached | 0 (0.0%) | 0 (0.0%) |
| 2 Unit Apartments | 0 (0.0%) | 0 (0.0%) |
| 3 or 4 Unit Apartments | 9 (100.0%) | 0 (0.0%) |
| 5 to 9 Unit Apartments | 0 (0.0%) | 0 (0.0%) |
| 10 or more Apartments | 0 (0.0%) | 0 (0.0%) |
| Mobile Home / Other | 80 (100.0%) | 0 (0.0%) |
| Total | 371 (86.3%) | 59 (13.7%) |
Housing Structures by Number of Rooms in Falcon Lake Estates
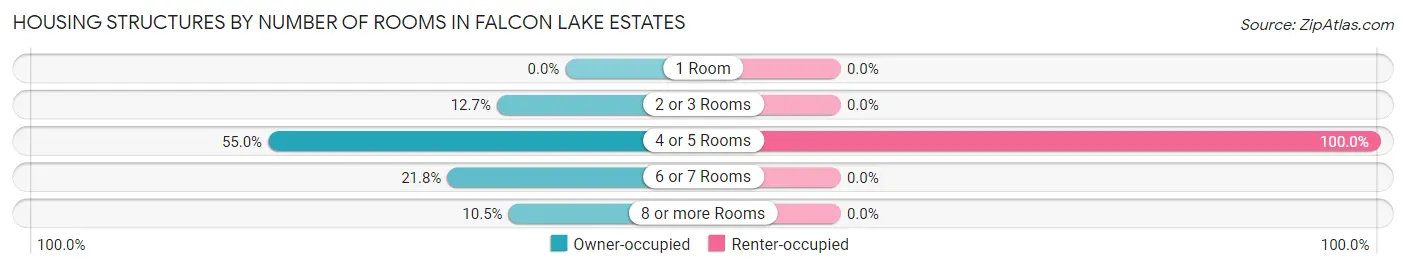
| Number of Rooms | Owner-occupied | Renter-occupied |
| 1 Room | 0 (0.0%) | 0 (0.0%) |
| 2 or 3 Rooms | 47 (12.7%) | 0 (0.0%) |
| 4 or 5 Rooms | 204 (55.0%) | 59 (100.0%) |
| 6 or 7 Rooms | 81 (21.8%) | 0 (0.0%) |
| 8 or more Rooms | 39 (10.5%) | 0 (0.0%) |
| Total | 371 (100.0%) | 59 (100.0%) |
Housing Structure by Heating Type in Falcon Lake Estates
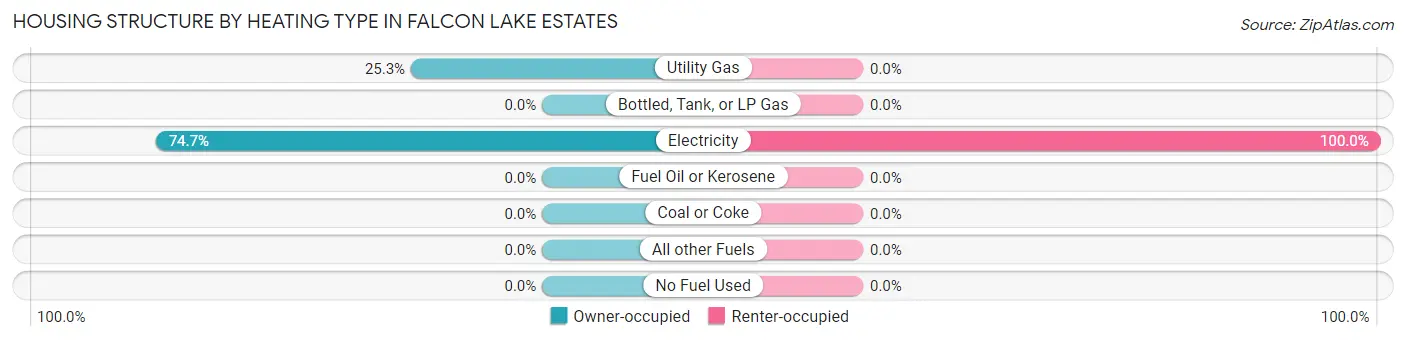
| Heating Type | Owner-occupied | Renter-occupied |
| Utility Gas | 94 (25.3%) | 0 (0.0%) |
| Bottled, Tank, or LP Gas | 0 (0.0%) | 0 (0.0%) |
| Electricity | 277 (74.7%) | 59 (100.0%) |
| Fuel Oil or Kerosene | 0 (0.0%) | 0 (0.0%) |
| Coal or Coke | 0 (0.0%) | 0 (0.0%) |
| All other Fuels | 0 (0.0%) | 0 (0.0%) |
| No Fuel Used | 0 (0.0%) | 0 (0.0%) |
| Total | 371 (100.0%) | 59 (100.0%) |
Household Vehicle Usage in Falcon Lake Estates
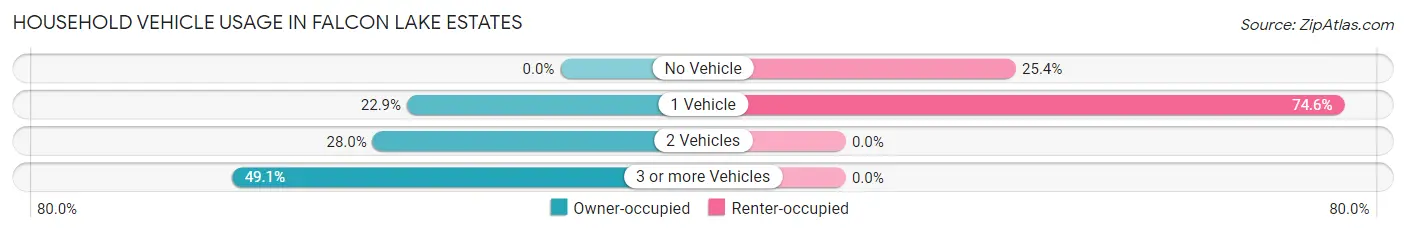
| Vehicles per Household | Owner-occupied | Renter-occupied |
| No Vehicle | 0 (0.0%) | 15 (25.4%) |
| 1 Vehicle | 85 (22.9%) | 44 (74.6%) |
| 2 Vehicles | 104 (28.0%) | 0 (0.0%) |
| 3 or more Vehicles | 182 (49.1%) | 0 (0.0%) |
| Total | 371 (100.0%) | 59 (100.0%) |
Real Estate & Mortgages in Falcon Lake Estates
Real Estate and Mortgage Overview in Falcon Lake Estates
| Characteristic | Without Mortgage | With Mortgage |
| Housing Units | 149 | 222 |
| Median Property Value | $62,600 | $179,300 |
| Median Household Income | - | - |
| Monthly Housing Costs | $348 | $0 |
| Real Estate Taxes | - | - |
Property Value by Mortgage Status in Falcon Lake Estates
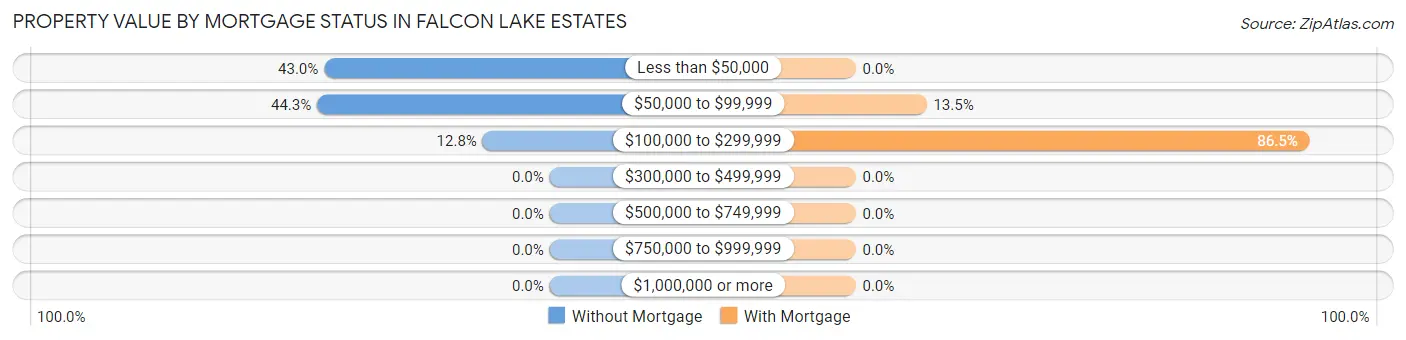
| Property Value | Without Mortgage | With Mortgage |
| Less than $50,000 | 64 (42.9%) | 0 (0.0%) |
| $50,000 to $99,999 | 66 (44.3%) | 30 (13.5%) |
| $100,000 to $299,999 | 19 (12.8%) | 192 (86.5%) |
| $300,000 to $499,999 | 0 (0.0%) | 0 (0.0%) |
| $500,000 to $749,999 | 0 (0.0%) | 0 (0.0%) |
| $750,000 to $999,999 | 0 (0.0%) | 0 (0.0%) |
| $1,000,000 or more | 0 (0.0%) | 0 (0.0%) |
| Total | 149 (100.0%) | 222 (100.0%) |
Household Income by Mortgage Status in Falcon Lake Estates
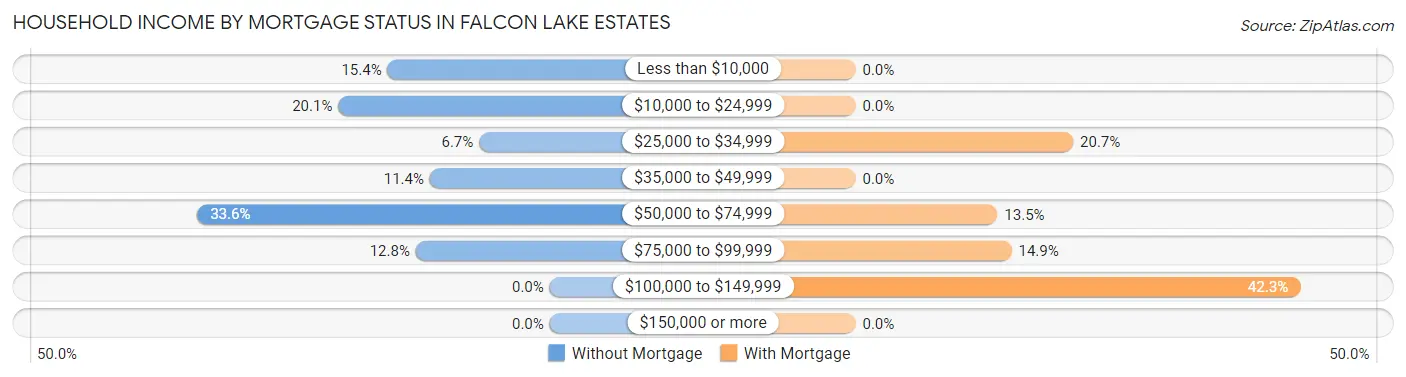
| Household Income | Without Mortgage | With Mortgage |
| Less than $10,000 | 23 (15.4%) | 0 (0.0%) |
| $10,000 to $24,999 | 30 (20.1%) | 0 (0.0%) |
| $25,000 to $34,999 | 10 (6.7%) | 46 (20.7%) |
| $35,000 to $49,999 | 17 (11.4%) | 0 (0.0%) |
| $50,000 to $74,999 | 50 (33.6%) | 30 (13.5%) |
| $75,000 to $99,999 | 19 (12.8%) | 33 (14.9%) |
| $100,000 to $149,999 | 0 (0.0%) | 94 (42.3%) |
| $150,000 or more | 0 (0.0%) | 0 (0.0%) |
| Total | 149 (100.0%) | 222 (100.0%) |
Property Value to Household Income Ratio in Falcon Lake Estates
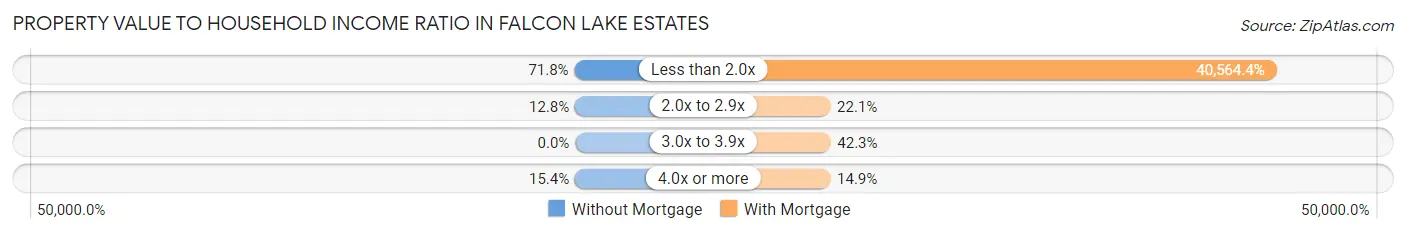
| Value-to-Income Ratio | Without Mortgage | With Mortgage |
| Less than 2.0x | 107 (71.8%) | 90,053 (40,564.4%) |
| 2.0x to 2.9x | 19 (12.8%) | 49 (22.1%) |
| 3.0x to 3.9x | 0 (0.0%) | 94 (42.3%) |
| 4.0x or more | 23 (15.4%) | 33 (14.9%) |
| Total | 149 (100.0%) | 222 (100.0%) |
Real Estate Taxes by Mortgage Status in Falcon Lake Estates
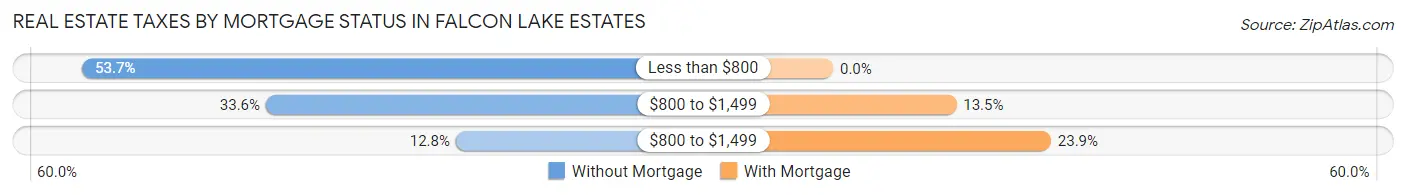
| Property Taxes | Without Mortgage | With Mortgage |
| Less than $800 | 80 (53.7%) | 0 (0.0%) |
| $800 to $1,499 | 50 (33.6%) | 30 (13.5%) |
| $800 to $1,499 | 19 (12.8%) | 53 (23.9%) |
| Total | 149 (100.0%) | 222 (100.0%) |
Health & Disability in Falcon Lake Estates
Health Insurance Coverage by Age in Falcon Lake Estates
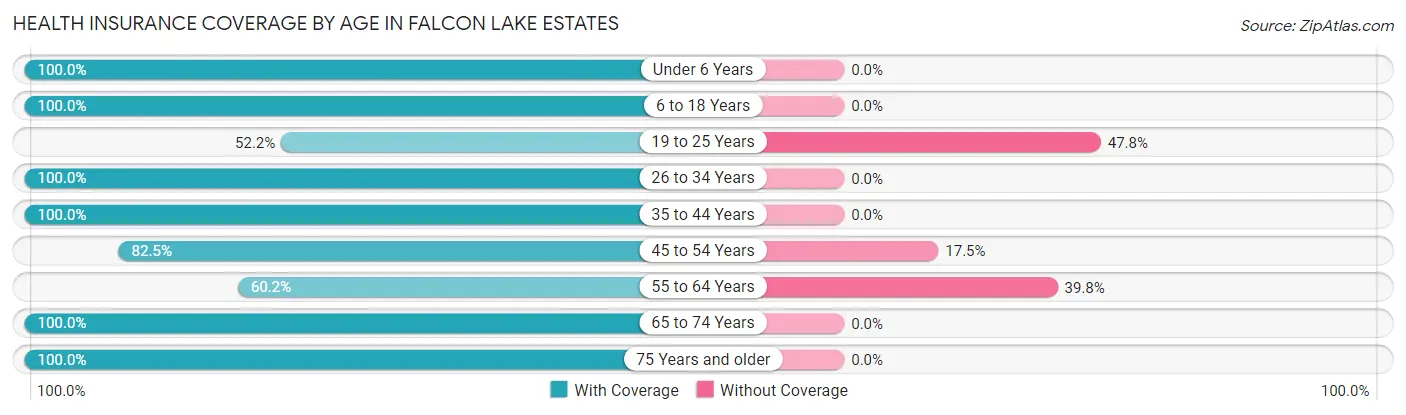
| Age Bracket | With Coverage | Without Coverage |
| Under 6 Years | 28 (100.0%) | 0 (0.0%) |
| 6 to 18 Years | 323 (100.0%) | 0 (0.0%) |
| 19 to 25 Years | 24 (52.2%) | 22 (47.8%) |
| 26 to 34 Years | 124 (100.0%) | 0 (0.0%) |
| 35 to 44 Years | 173 (100.0%) | 0 (0.0%) |
| 45 to 54 Years | 94 (82.5%) | 20 (17.5%) |
| 55 to 64 Years | 50 (60.2%) | 33 (39.8%) |
| 65 to 74 Years | 72 (100.0%) | 0 (0.0%) |
| 75 Years and older | 74 (100.0%) | 0 (0.0%) |
| Total | 962 (92.8%) | 75 (7.2%) |
Health Insurance Coverage by Citizenship Status in Falcon Lake Estates
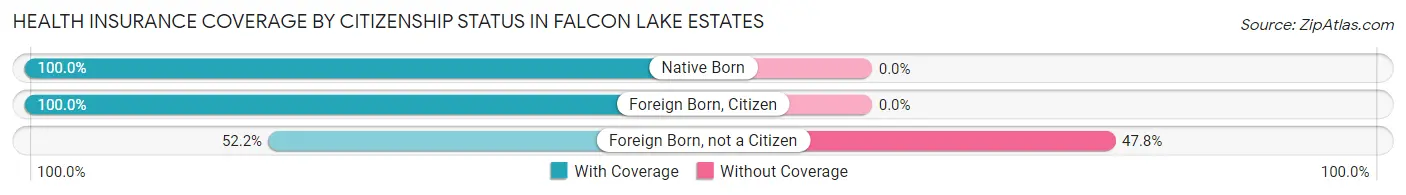
| Citizenship Status | With Coverage | Without Coverage |
| Native Born | 28 (100.0%) | 0 (0.0%) |
| Foreign Born, Citizen | 323 (100.0%) | 0 (0.0%) |
| Foreign Born, not a Citizen | 24 (52.2%) | 22 (47.8%) |
Health Insurance Coverage by Household Income in Falcon Lake Estates
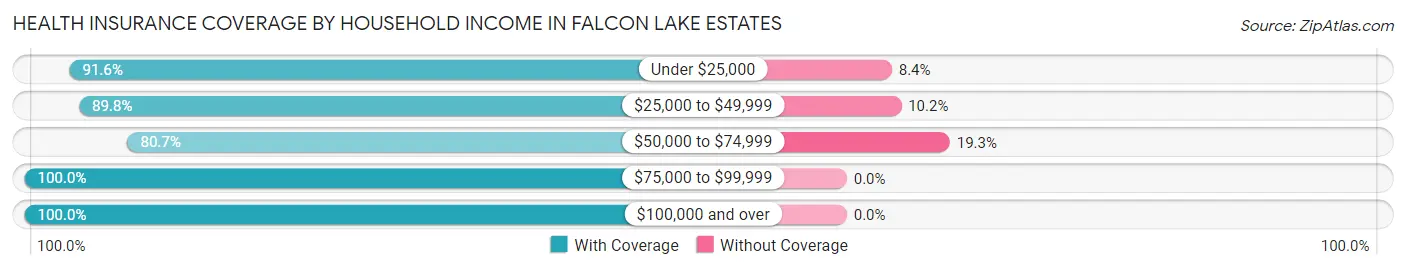
| Household Income | With Coverage | Without Coverage |
| Under $25,000 | 239 (91.6%) | 22 (8.4%) |
| $25,000 to $49,999 | 176 (89.8%) | 20 (10.2%) |
| $50,000 to $74,999 | 138 (80.7%) | 33 (19.3%) |
| $75,000 to $99,999 | 345 (100.0%) | 0 (0.0%) |
| $100,000 and over | 64 (100.0%) | 0 (0.0%) |
Public vs Private Health Insurance Coverage by Age in Falcon Lake Estates
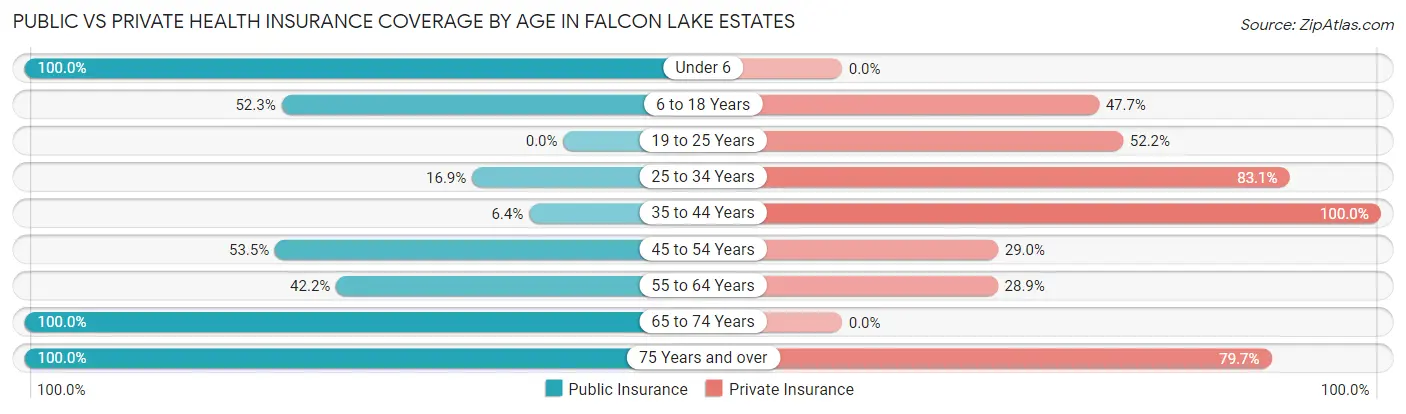
| Age Bracket | Public Insurance | Private Insurance |
| Under 6 | 28 (100.0%) | 0 (0.0%) |
| 6 to 18 Years | 169 (52.3%) | 154 (47.7%) |
| 19 to 25 Years | 0 (0.0%) | 24 (52.2%) |
| 25 to 34 Years | 21 (16.9%) | 103 (83.1%) |
| 35 to 44 Years | 11 (6.4%) | 173 (100.0%) |
| 45 to 54 Years | 61 (53.5%) | 33 (28.9%) |
| 55 to 64 Years | 35 (42.2%) | 24 (28.9%) |
| 65 to 74 Years | 72 (100.0%) | 0 (0.0%) |
| 75 Years and over | 74 (100.0%) | 59 (79.7%) |
| Total | 471 (45.4%) | 570 (55.0%) |
Disability Status by Sex by Age in Falcon Lake Estates
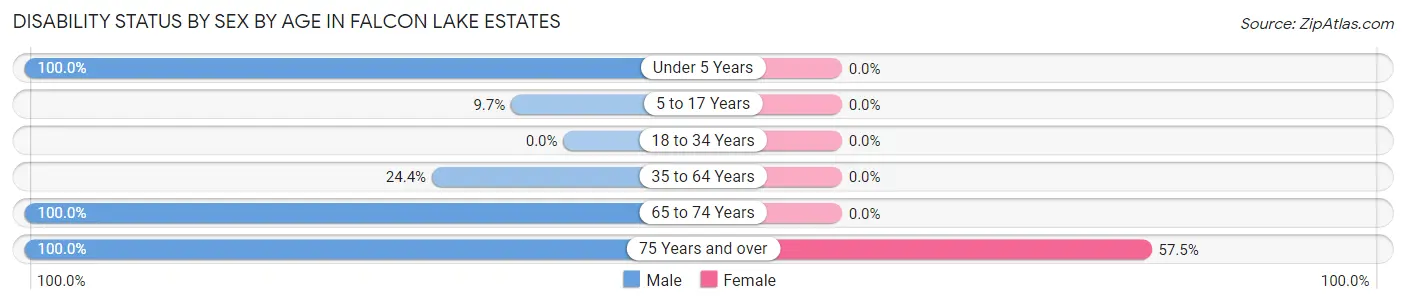
| Age Bracket | Male | Female |
| Under 5 Years | 20 (100.0%) | 0 (0.0%) |
| 5 to 17 Years | 20 (9.7%) | 0 (0.0%) |
| 18 to 34 Years | 0 (0.0%) | 0 (0.0%) |
| 35 to 64 Years | 61 (24.4%) | 0 (0.0%) |
| 65 to 74 Years | 30 (100.0%) | 0 (0.0%) |
| 75 Years and over | 34 (100.0%) | 23 (57.5%) |
Disability Class by Sex by Age in Falcon Lake Estates
Disability Class: Hearing Difficulty
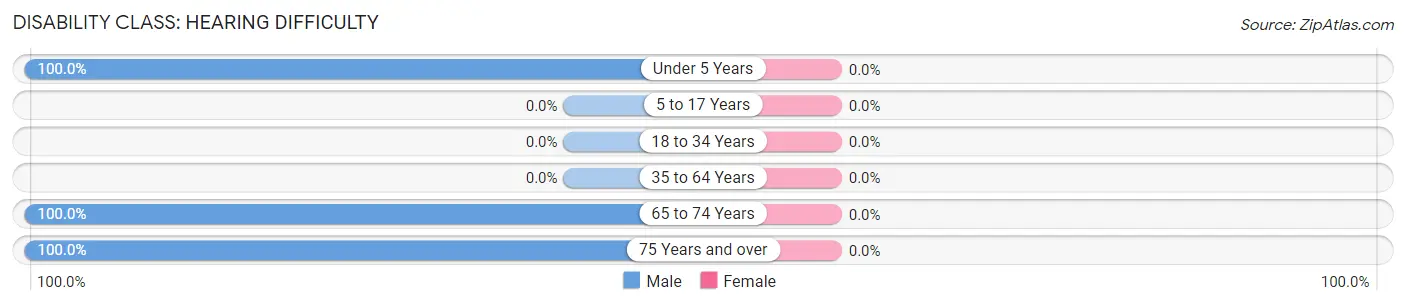
| Age Bracket | Male | Female |
| Under 5 Years | 20 (100.0%) | 0 (0.0%) |
| 5 to 17 Years | 0 (0.0%) | 0 (0.0%) |
| 18 to 34 Years | 0 (0.0%) | 0 (0.0%) |
| 35 to 64 Years | 0 (0.0%) | 0 (0.0%) |
| 65 to 74 Years | 30 (100.0%) | 0 (0.0%) |
| 75 Years and over | 34 (100.0%) | 0 (0.0%) |
Disability Class: Vision Difficulty
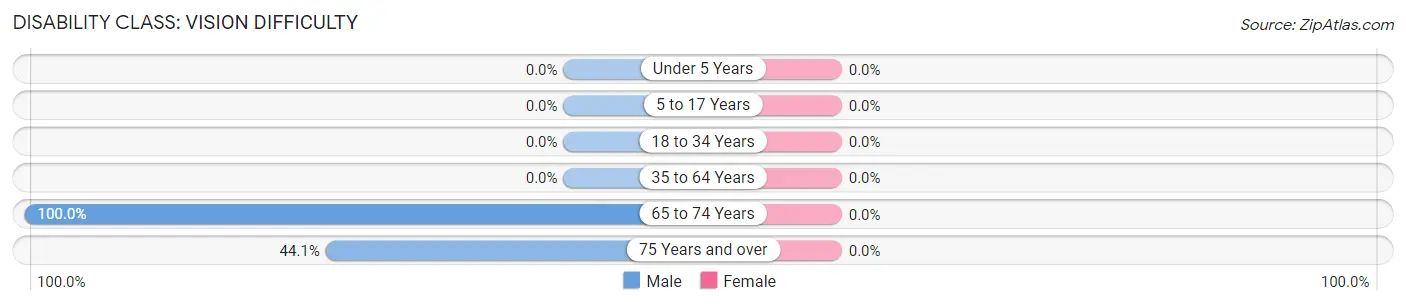
| Age Bracket | Male | Female |
| Under 5 Years | 0 (0.0%) | 0 (0.0%) |
| 5 to 17 Years | 0 (0.0%) | 0 (0.0%) |
| 18 to 34 Years | 0 (0.0%) | 0 (0.0%) |
| 35 to 64 Years | 0 (0.0%) | 0 (0.0%) |
| 65 to 74 Years | 30 (100.0%) | 0 (0.0%) |
| 75 Years and over | 15 (44.1%) | 0 (0.0%) |
Disability Class: Cognitive Difficulty
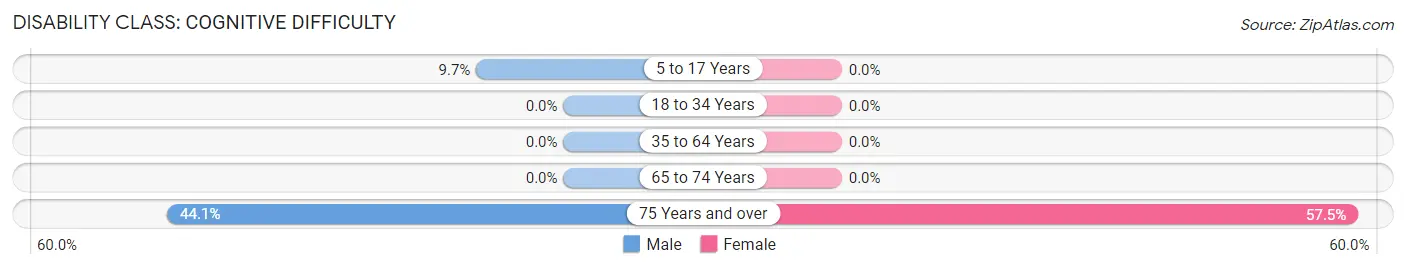
| Age Bracket | Male | Female |
| 5 to 17 Years | 20 (9.7%) | 0 (0.0%) |
| 18 to 34 Years | 0 (0.0%) | 0 (0.0%) |
| 35 to 64 Years | 0 (0.0%) | 0 (0.0%) |
| 65 to 74 Years | 0 (0.0%) | 0 (0.0%) |
| 75 Years and over | 15 (44.1%) | 23 (57.5%) |
Disability Class: Ambulatory Difficulty
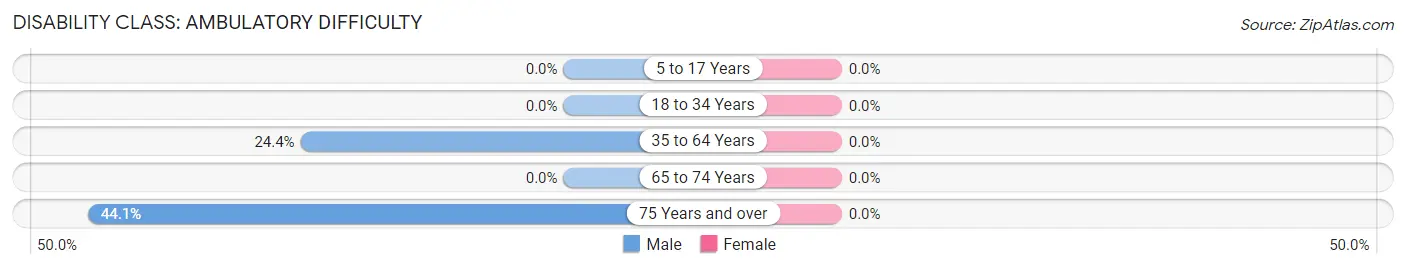
| Age Bracket | Male | Female |
| 5 to 17 Years | 0 (0.0%) | 0 (0.0%) |
| 18 to 34 Years | 0 (0.0%) | 0 (0.0%) |
| 35 to 64 Years | 61 (24.4%) | 0 (0.0%) |
| 65 to 74 Years | 0 (0.0%) | 0 (0.0%) |
| 75 Years and over | 15 (44.1%) | 0 (0.0%) |
Disability Class: Self-Care Difficulty
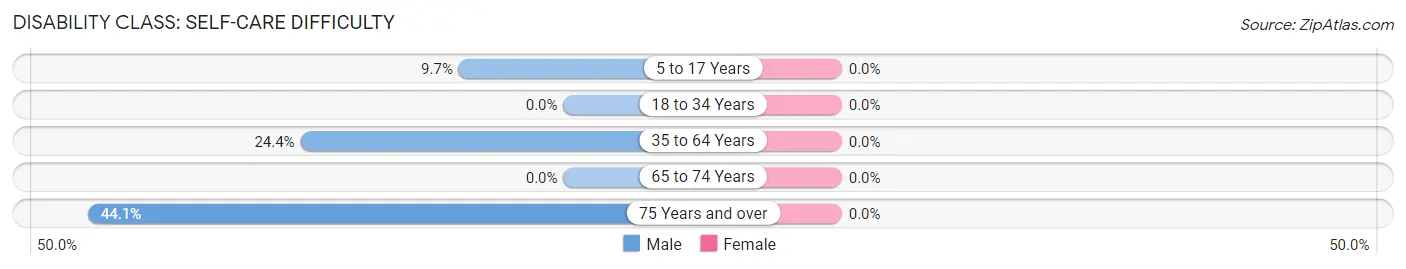
| Age Bracket | Male | Female |
| 5 to 17 Years | 20 (9.7%) | 0 (0.0%) |
| 18 to 34 Years | 0 (0.0%) | 0 (0.0%) |
| 35 to 64 Years | 61 (24.4%) | 0 (0.0%) |
| 65 to 74 Years | 0 (0.0%) | 0 (0.0%) |
| 75 Years and over | 15 (44.1%) | 0 (0.0%) |
Technology Access in Falcon Lake Estates
Computing Device Access in Falcon Lake Estates
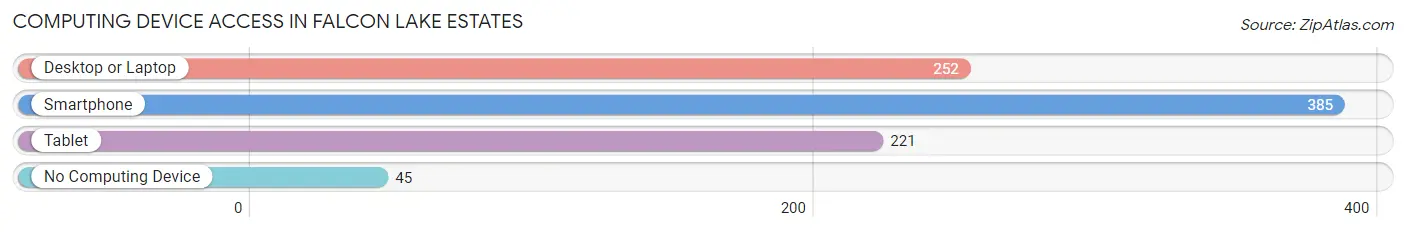
| Device Type | # Households | % Households |
| Desktop or Laptop | 252 | 58.6% |
| Smartphone | 385 | 89.5% |
| Tablet | 221 | 51.4% |
| No Computing Device | 45 | 10.5% |
| Total | 430 | 100.0% |
Internet Access in Falcon Lake Estates
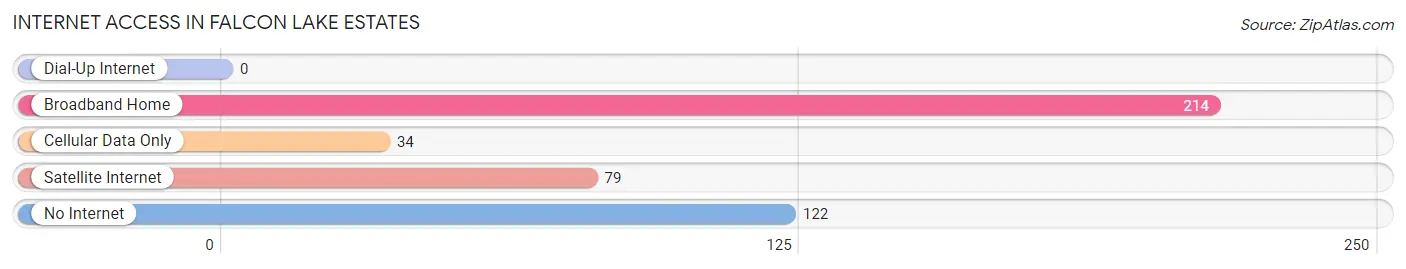
| Internet Type | # Households | % Households |
| Dial-Up Internet | 0 | 0.0% |
| Broadband Home | 214 | 49.8% |
| Cellular Data Only | 34 | 7.9% |
| Satellite Internet | 79 | 18.4% |
| No Internet | 122 | 28.4% |
| Total | 430 | 100.0% |
Falcon Lake Estates Summary
Falcon Lake Estates is a small unincorporated community located in Zapata County, Texas. It is situated on the banks of Falcon Lake, a reservoir on the Rio Grande River. The community is located approximately 80 miles south of Laredo and is part of the Laredo Metropolitan Statistical Area.
History
Falcon Lake Estates was established in the early 1960s as a recreational community. The lake was created in 1953 when the International Boundary and Water Commission built the Falcon Dam on the Rio Grande River. The dam was built to provide irrigation water for the surrounding area and to control flooding. The lake was named after the nearby town of Falcon, Texas.
The community was originally developed as a resort community, with a marina, boat docks, and a golf course. The community was also home to a number of vacation homes and cabins. In the late 1970s, the community began to attract more permanent residents, and by the early 1980s, the population had grown to over 500 people.
Geography
Falcon Lake Estates is located in Zapata County, Texas, on the banks of Falcon Lake. The lake is a reservoir on the Rio Grande River, and is approximately 80 miles south of Laredo. The community is located in the South Texas Plains region, and is characterized by flat terrain and sandy soils. The climate is semi-arid, with hot summers and mild winters.
Economy
The economy of Falcon Lake Estates is largely based on tourism and recreation. The lake is a popular destination for fishing, boating, and other water sports. The community is also home to a number of vacation homes and cabins, as well as a marina and boat docks.
Demographics
As of the 2010 census, the population of Falcon Lake Estates was 1,093. The racial makeup of the community was 94.3% White, 0.7% African American, 0.3% Native American, 0.2% Asian, 0.1% Pacific Islander, 3.2% from other races, and 1.4% from two or more races. Hispanic or Latino of any race were 97.2% of the population.
The median household income in Falcon Lake Estates was $25,938, and the median family income was $30,625. The per capita income was $13,845. About 24.3% of families and 28.2% of the population were below the poverty line, including 37.2% of those under age 18 and 16.2% of those age 65 or over.
Common Questions
What is Per Capita Income in Falcon Lake Estates?
Per Capita income in Falcon Lake Estates is $22,699.
What is the Median Family Income in Falcon Lake Estates?
Median Family Income in Falcon Lake Estates is $71,042.
What is the Median Household income in Falcon Lake Estates?
Median Household Income in Falcon Lake Estates is $60,096.
What is Income or Wage Gap in Falcon Lake Estates?
Income or Wage Gap in Falcon Lake Estates is 42.9%.
Women in Falcon Lake Estates earn 57.1 cents for every dollar earned by a man.
What is Family Income Deficit in Falcon Lake Estates?
Family Income Deficit in Falcon Lake Estates is $6,343.
Families that are below poverty line in Falcon Lake Estates earn $6,343 less on average than the poverty threshold level.
What is Inequality or Gini Index in Falcon Lake Estates?
Inequality or Gini Index in Falcon Lake Estates is 0.38.
What is the Total Population of Falcon Lake Estates?
Total Population of Falcon Lake Estates is 1,037.
What is the Total Male Population of Falcon Lake Estates?
Total Male Population of Falcon Lake Estates is 601.
What is the Total Female Population of Falcon Lake Estates?
Total Female Population of Falcon Lake Estates is 436.
What is the Ratio of Males per 100 Females in Falcon Lake Estates?
There are 137.84 Males per 100 Females in Falcon Lake Estates.
What is the Ratio of Females per 100 Males in Falcon Lake Estates?
There are 72.55 Females per 100 Males in Falcon Lake Estates.
What is the Median Population Age in Falcon Lake Estates?
Median Population Age in Falcon Lake Estates is 35.0 Years.
What is the Average Family Size in Falcon Lake Estates
Average Family Size in Falcon Lake Estates is 3.0 People.
What is the Average Household Size in Falcon Lake Estates
Average Household Size in Falcon Lake Estates is 2.4 People.
How Large is the Labor Force in Falcon Lake Estates?
There are 408 People in the Labor Forcein in Falcon Lake Estates.
What is the Percentage of People in the Labor Force in Falcon Lake Estates?
56.7% of People are in the Labor Force in Falcon Lake Estates.