Emerald Bay, TX Map & Demographics
Emerald Bay Map
Emerald Bay Overview
$42,141
PER CAPITA INCOME
$94,808
AVG FAMILY INCOME
$86,027
AVG HOUSEHOLD INCOME
0.34
INEQUALITY / GINI INDEX
969
TOTAL POPULATION
431
MALE POPULATION
538
FEMALE POPULATION
80.11
MALES / 100 FEMALES
124.83
FEMALES / 100 MALES
67.1
MEDIAN AGE
2.7
AVG FAMILY SIZE
2.3
AVG HOUSEHOLD SIZE
250
LABOR FORCE [ PEOPLE ]
30.6%
PERCENT IN LABOR FORCE
4.4%
UNEMPLOYMENT RATE
Income in Emerald Bay
Income Overview in Emerald Bay
Per Capita Income in Emerald Bay is $42,141, while median incomes of families and households are $94,808 and $86,027 respectively.
| Characteristic | Number | Measure |
| Per Capita Income | 969 | $42,141 |
| Median Family Income | 316 | $94,808 |
| Mean Family Income | 316 | $112,213 |
| Median Household Income | 421 | $86,027 |
| Mean Household Income | 421 | $93,867 |
| Income Deficit | 316 | $0 |
| Wage / Income Gap (%) | 969 | 0.00% |
| Wage / Income Gap ($) | 969 | 100.00¢ per $1 |
| Gini / Inequality Index | 969 | 0.34 |
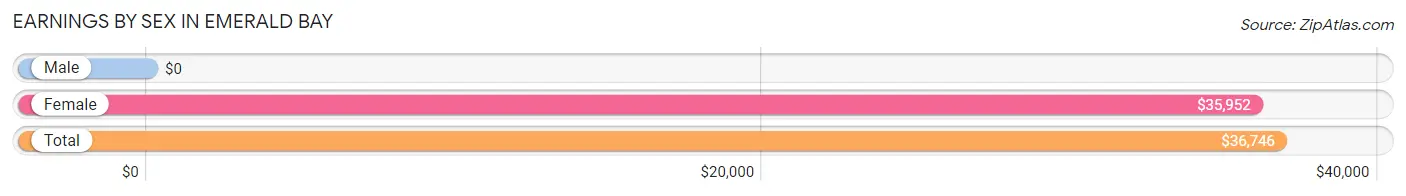
Earnings by Sex in Emerald Bay
| Sex | Number | Average Earnings |
| Male | 92 (31.7%) | $0 |
| Female | 198 (68.3%) | $35,952 |
| Total | 290 (100.0%) | $36,746 |
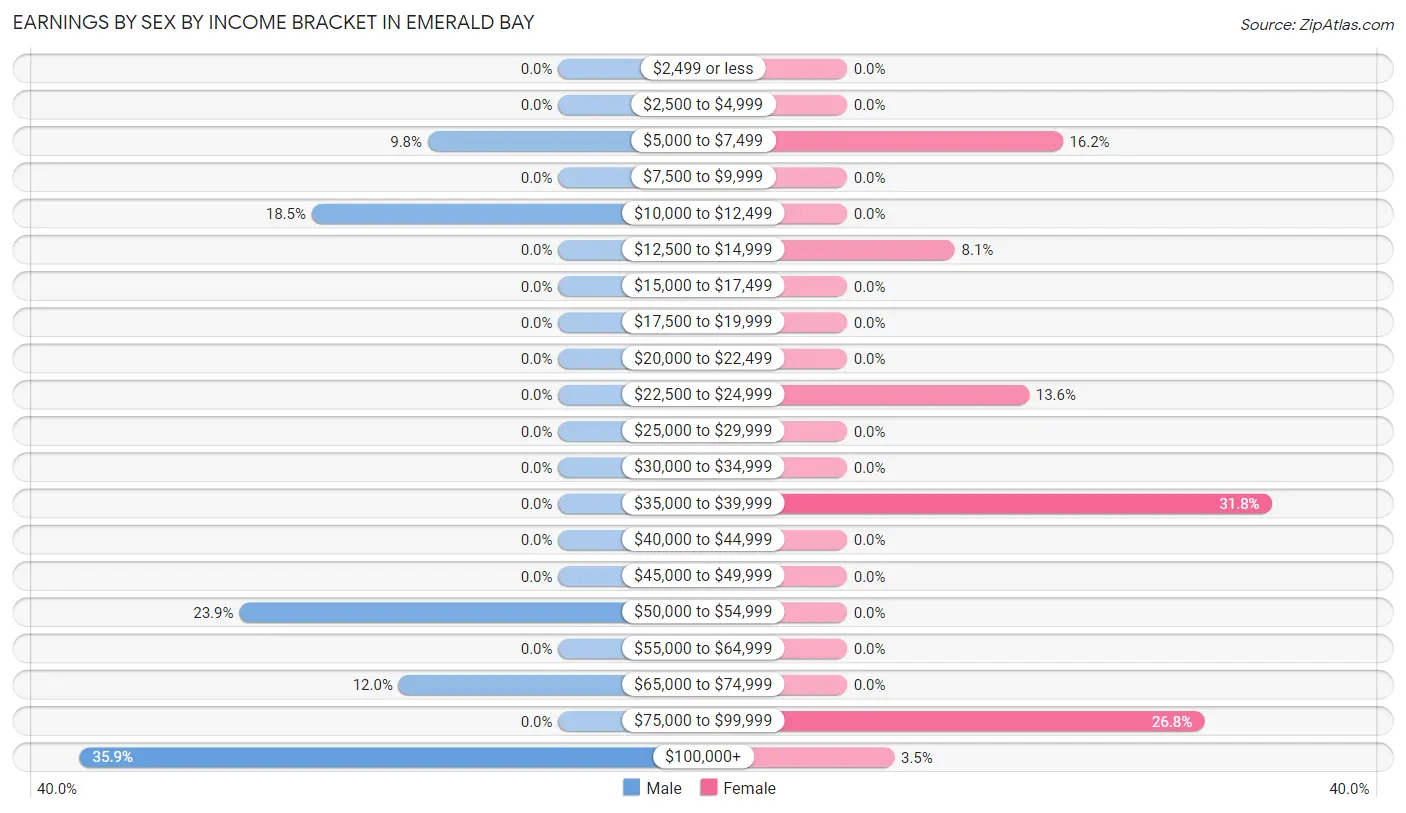
Earnings by Sex by Income Bracket in Emerald Bay
The most common earnings brackets in Emerald Bay are $100,000+ for men (33 | 35.9%) and $35,000 to $39,999 for women (63 | 31.8%).
| Income | Male | Female |
| $2,499 or less | 0 (0.0%) | 0 (0.0%) |
| $2,500 to $4,999 | 0 (0.0%) | 0 (0.0%) |
| $5,000 to $7,499 | 9 (9.8%) | 32 (16.2%) |
| $7,500 to $9,999 | 0 (0.0%) | 0 (0.0%) |
| $10,000 to $12,499 | 17 (18.5%) | 0 (0.0%) |
| $12,500 to $14,999 | 0 (0.0%) | 16 (8.1%) |
| $15,000 to $17,499 | 0 (0.0%) | 0 (0.0%) |
| $17,500 to $19,999 | 0 (0.0%) | 0 (0.0%) |
| $20,000 to $22,499 | 0 (0.0%) | 0 (0.0%) |
| $22,500 to $24,999 | 0 (0.0%) | 27 (13.6%) |
| $25,000 to $29,999 | 0 (0.0%) | 0 (0.0%) |
| $30,000 to $34,999 | 0 (0.0%) | 0 (0.0%) |
| $35,000 to $39,999 | 0 (0.0%) | 63 (31.8%) |
| $40,000 to $44,999 | 0 (0.0%) | 0 (0.0%) |
| $45,000 to $49,999 | 0 (0.0%) | 0 (0.0%) |
| $50,000 to $54,999 | 22 (23.9%) | 0 (0.0%) |
| $55,000 to $64,999 | 0 (0.0%) | 0 (0.0%) |
| $65,000 to $74,999 | 11 (12.0%) | 0 (0.0%) |
| $75,000 to $99,999 | 0 (0.0%) | 53 (26.8%) |
| $100,000+ | 33 (35.9%) | 7 (3.5%) |
| Total | 92 (100.0%) | 198 (100.0%) |
Earnings by Sex by Educational Attainment in Emerald Bay
| Educational Attainment | Male Income | Female Income |
| Less than High School | - | - |
| High School Diploma | - | - |
| College or Associate's Degree | - | - |
| Bachelor's Degree | - | - |
| Graduate Degree | - | - |
| Total | - | - |
Family Income in Emerald Bay
Family Income Brackets in Emerald Bay
According to the Emerald Bay family income data, there are 76 families falling into the $75,000 to $99,999 income range, which is the most common income bracket and makes up 24.0% of all families.
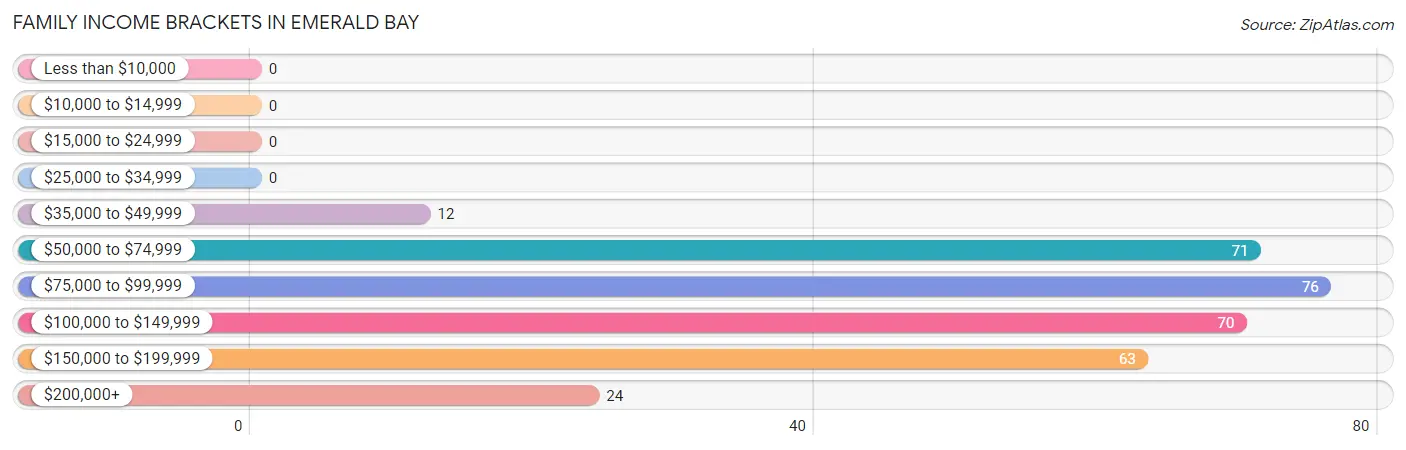
| Income Bracket | # Families | % Families |
| Less than $10,000 | 0 | 0.0% |
| $10,000 to $14,999 | 0 | 0.0% |
| $15,000 to $24,999 | 0 | 0.0% |
| $25,000 to $34,999 | 0 | 0.0% |
| $35,000 to $49,999 | 12 | 3.8% |
| $50,000 to $74,999 | 71 | 22.5% |
| $75,000 to $99,999 | 76 | 24.1% |
| $100,000 to $149,999 | 70 | 22.2% |
| $150,000 to $199,999 | 63 | 19.9% |
| $200,000+ | 24 | 7.6% |
Family Income by Famaliy Size in Emerald Bay
2-person families (218 | 69.0%) account for the highest median family income in Emerald Bay with $92,885 per family, while 2-person families (218 | 69.0%) have the highest median income of $46,442 per family member.
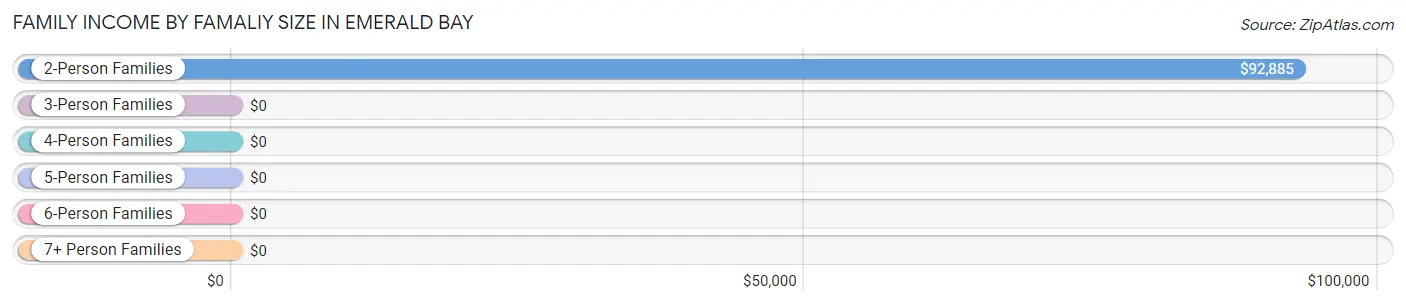
| Income Bracket | # Families | Median Income |
| 2-Person Families | 218 (69.0%) | $92,885 |
| 3-Person Families | 63 (19.9%) | $0 |
| 4-Person Families | 0 (0.0%) | $0 |
| 5-Person Families | 35 (11.1%) | $0 |
| 6-Person Families | 0 (0.0%) | $0 |
| 7+ Person Families | 0 (0.0%) | $0 |
| Total | 316 (100.0%) | $94,808 |
Family Income by Number of Earners in Emerald Bay
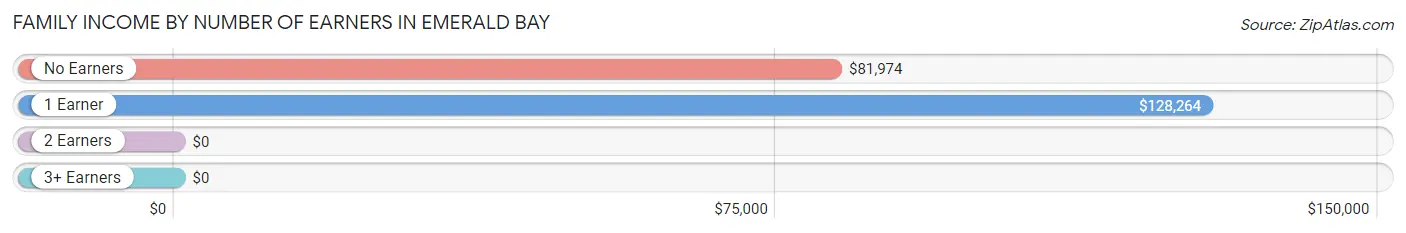
| Number of Earners | # Families | Median Income |
| No Earners | 134 (42.4%) | $81,974 |
| 1 Earner | 133 (42.1%) | $128,264 |
| 2 Earners | 49 (15.5%) | $0 |
| 3+ Earners | 0 (0.0%) | $0 |
| Total | 316 (100.0%) | $94,808 |
Household Income in Emerald Bay
Household Income Brackets in Emerald Bay
With 106 households falling in the category, the $75,000 to $99,999 income range is the most frequent in Emerald Bay, accounting for 25.2% of all households.
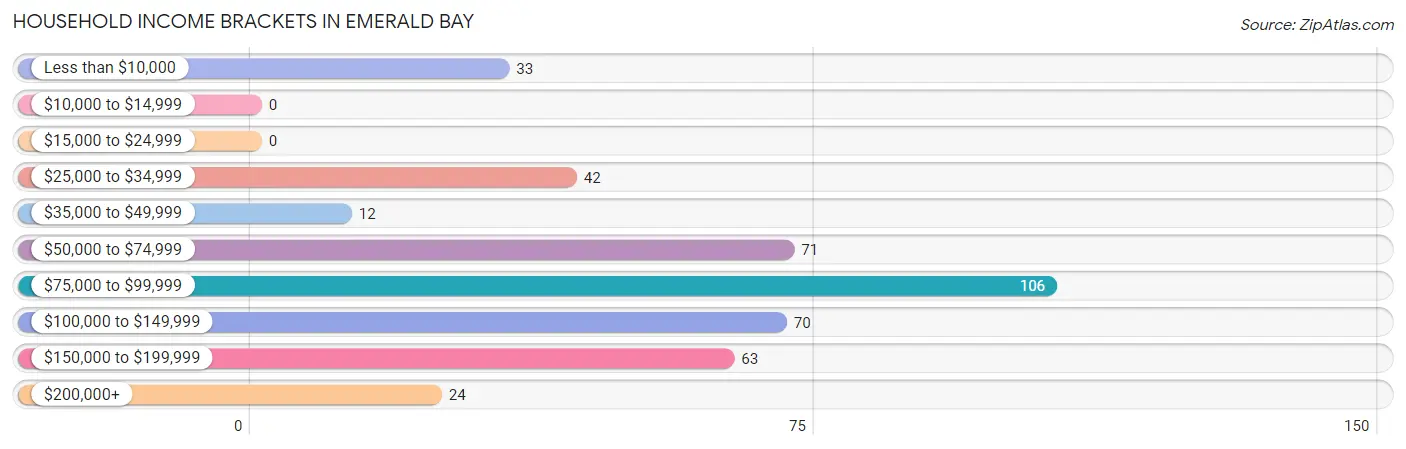
| Income Bracket | # Households | % Households |
| Less than $10,000 | 33 | 7.8% |
| $10,000 to $14,999 | 0 | 0.0% |
| $15,000 to $24,999 | 0 | 0.0% |
| $25,000 to $34,999 | 42 | 10.0% |
| $35,000 to $49,999 | 12 | 2.9% |
| $50,000 to $74,999 | 71 | 16.9% |
| $75,000 to $99,999 | 106 | 25.2% |
| $100,000 to $149,999 | 70 | 16.6% |
| $150,000 to $199,999 | 63 | 15.0% |
| $200,000+ | 24 | 5.7% |
Household Income by Householder Age in Emerald Bay
The median household income in Emerald Bay is $86,027, with the highest median household income of $87,054 found in the 65+ years age bracket for the primary householder. A total of 307 households (72.9%) fall into this category.

| Income Bracket | # Households | Median Income |
| 15 to 24 Years | 0 (0.0%) | $0 |
| 25 to 44 Years | 45 (10.7%) | $0 |
| 45 to 64 Years | 69 (16.4%) | $85,804 |
| 65+ Years | 307 (72.9%) | $87,054 |
| Total | 421 (100.0%) | $86,027 |
Poverty in Emerald Bay
Income Below Poverty by Sex and Age in Emerald Bay
With 3.5% poverty level for males and 3.4% for females among the residents of Emerald Bay, 75 year old and over males and 55 to 64 year old females are the most vulnerable to poverty, with 15 males (10.5%) and 18 females (26.9%) in their respective age groups living below the poverty level.
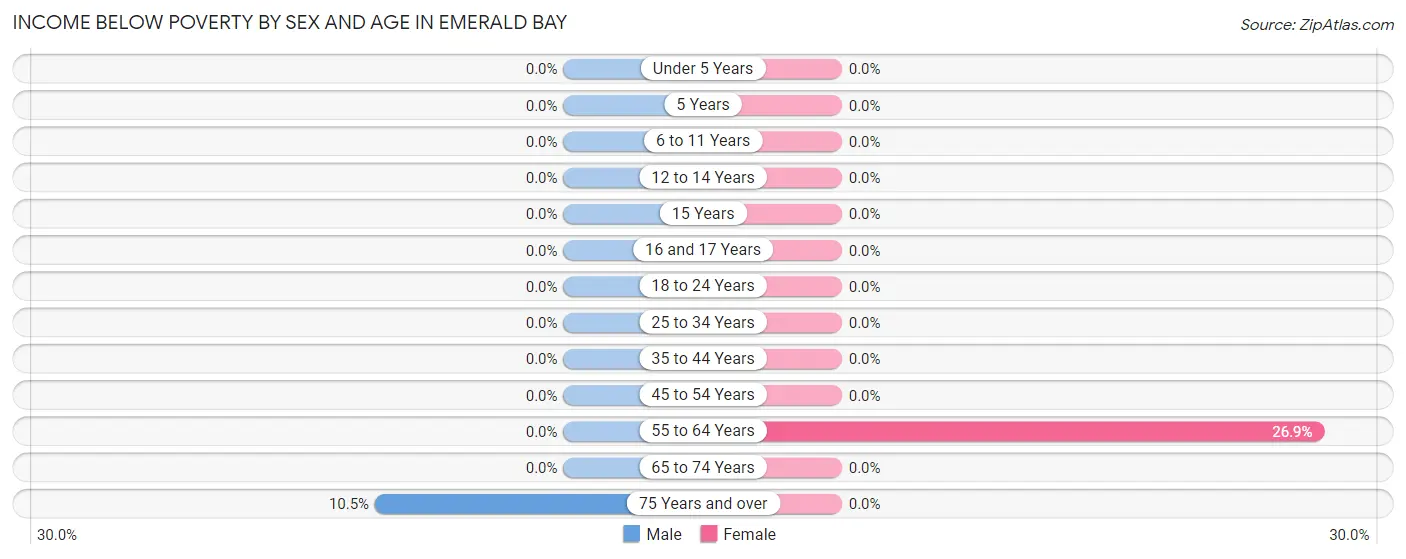
| Age Bracket | Male | Female |
| Under 5 Years | 0 (0.0%) | 0 (0.0%) |
| 5 Years | 0 (0.0%) | 0 (0.0%) |
| 6 to 11 Years | 0 (0.0%) | 0 (0.0%) |
| 12 to 14 Years | 0 (0.0%) | 0 (0.0%) |
| 15 Years | 0 (0.0%) | 0 (0.0%) |
| 16 and 17 Years | 0 (0.0%) | 0 (0.0%) |
| 18 to 24 Years | 0 (0.0%) | 0 (0.0%) |
| 25 to 34 Years | 0 (0.0%) | 0 (0.0%) |
| 35 to 44 Years | 0 (0.0%) | 0 (0.0%) |
| 45 to 54 Years | 0 (0.0%) | 0 (0.0%) |
| 55 to 64 Years | 0 (0.0%) | 18 (26.9%) |
| 65 to 74 Years | 0 (0.0%) | 0 (0.0%) |
| 75 Years and over | 15 (10.5%) | 0 (0.0%) |
| Total | 15 (3.5%) | 18 (3.4%) |
Income Above Poverty by Sex and Age in Emerald Bay
According to the poverty statistics in Emerald Bay, males aged under 5 years and females aged 5 years are the age groups that are most secure financially, with 100.0% of males and 100.0% of females in these age groups living above the poverty line.
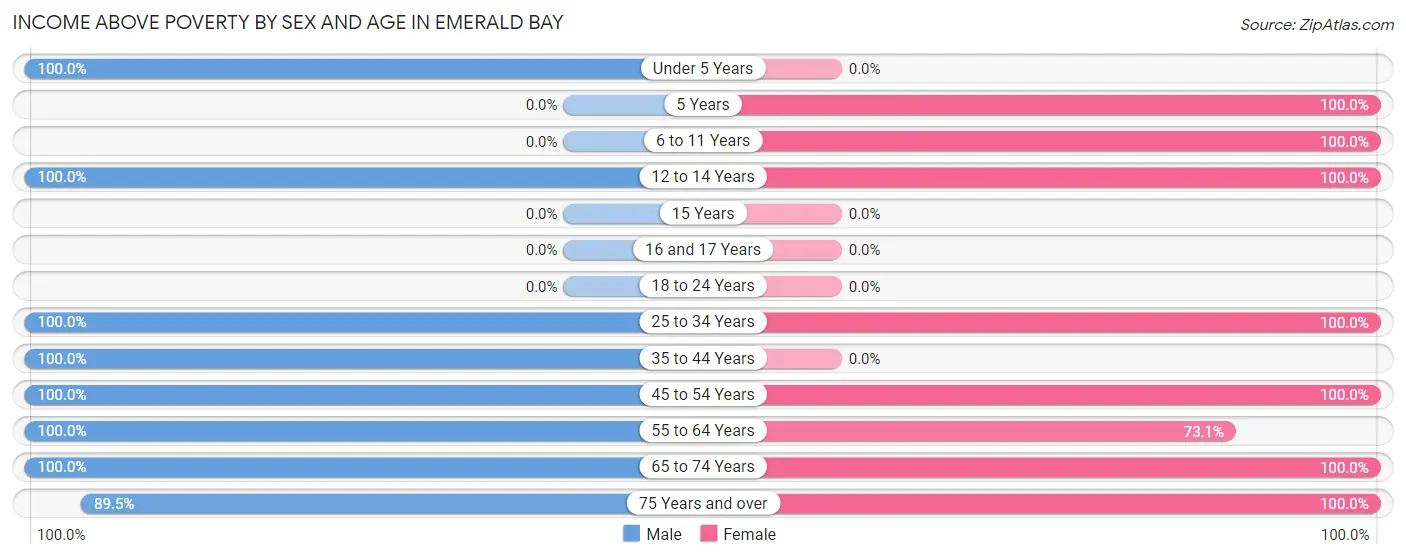
| Age Bracket | Male | Female |
| Under 5 Years | 39 (100.0%) | 0 (0.0%) |
| 5 Years | 0 (0.0%) | 26 (100.0%) |
| 6 to 11 Years | 0 (0.0%) | 33 (100.0%) |
| 12 to 14 Years | 37 (100.0%) | 18 (100.0%) |
| 15 Years | 0 (0.0%) | 0 (0.0%) |
| 16 and 17 Years | 0 (0.0%) | 0 (0.0%) |
| 18 to 24 Years | 0 (0.0%) | 0 (0.0%) |
| 25 to 34 Years | 9 (100.0%) | 90 (100.0%) |
| 35 to 44 Years | 18 (100.0%) | 0 (0.0%) |
| 45 to 54 Years | 22 (100.0%) | 16 (100.0%) |
| 55 to 64 Years | 40 (100.0%) | 49 (73.1%) |
| 65 to 74 Years | 123 (100.0%) | 134 (100.0%) |
| 75 Years and over | 128 (89.5%) | 154 (100.0%) |
| Total | 416 (96.5%) | 520 (96.7%) |
Income Below Poverty Among Married-Couple Families in Emerald Bay
| Children | Above Poverty | Below Poverty |
| No Children | 224 (100.0%) | 0 (0.0%) |
| 1 or 2 Children | 39 (100.0%) | 0 (0.0%) |
| 3 or 4 Children | 0 (0.0%) | 0 (0.0%) |
| 5 or more Children | 0 (0.0%) | 0 (0.0%) |
| Total | 263 (100.0%) | 0 (0.0%) |
Income Below Poverty Among Single-Parent Households in Emerald Bay
| Children | Single Father | Single Mother |
| No Children | 0 (0.0%) | 0 (0.0%) |
| 1 or 2 Children | 0 (0.0%) | 0 (0.0%) |
| 3 or 4 Children | 0 (0.0%) | 0 (0.0%) |
| 5 or more Children | 0 (0.0%) | 0 (0.0%) |
| Total | 0 (0.0%) | 0 (0.0%) |
Income Below Poverty Among Married-Couple vs Single-Parent Households in Emerald Bay
| Children | Married-Couple Families | Single-Parent Households |
| No Children | 0 (0.0%) | 0 (0.0%) |
| 1 or 2 Children | 0 (0.0%) | 0 (0.0%) |
| 3 or 4 Children | 0 (0.0%) | 0 (0.0%) |
| 5 or more Children | 0 (0.0%) | 0 (0.0%) |
| Total | 0 (0.0%) | 0 (0.0%) |
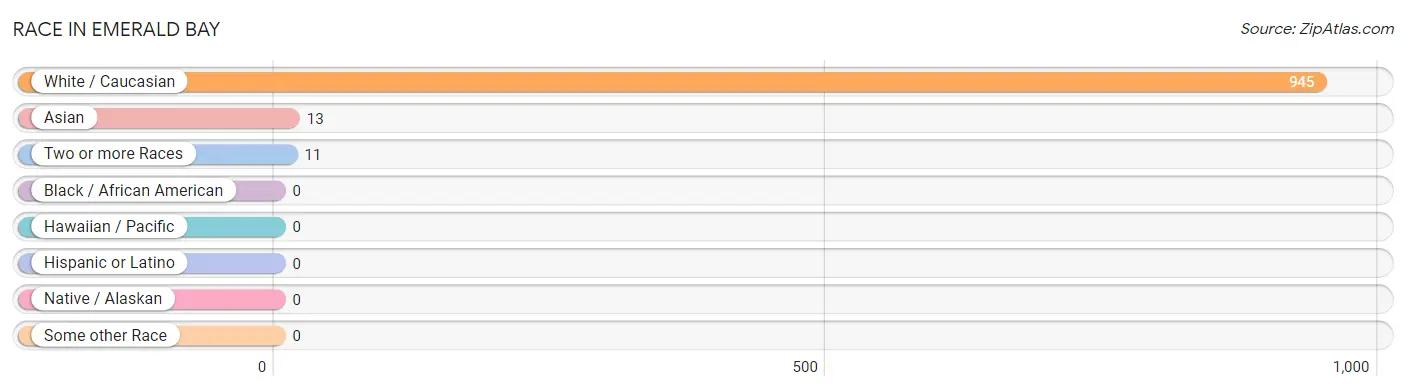
Race in Emerald Bay
The most populous races in Emerald Bay are White / Caucasian (945 | 97.5%), Asian (13 | 1.3%), and Two or more Races (11 | 1.1%).
| Race | # Population | % Population |
| Asian | 13 | 1.3% |
| Black / African American | 0 | 0.0% |
| Hawaiian / Pacific | 0 | 0.0% |
| Hispanic or Latino | 0 | 0.0% |
| Native / Alaskan | 0 | 0.0% |
| White / Caucasian | 945 | 97.5% |
| Two or more Races | 11 | 1.1% |
| Some other Race | 0 | 0.0% |
| Total | 969 | 100.0% |
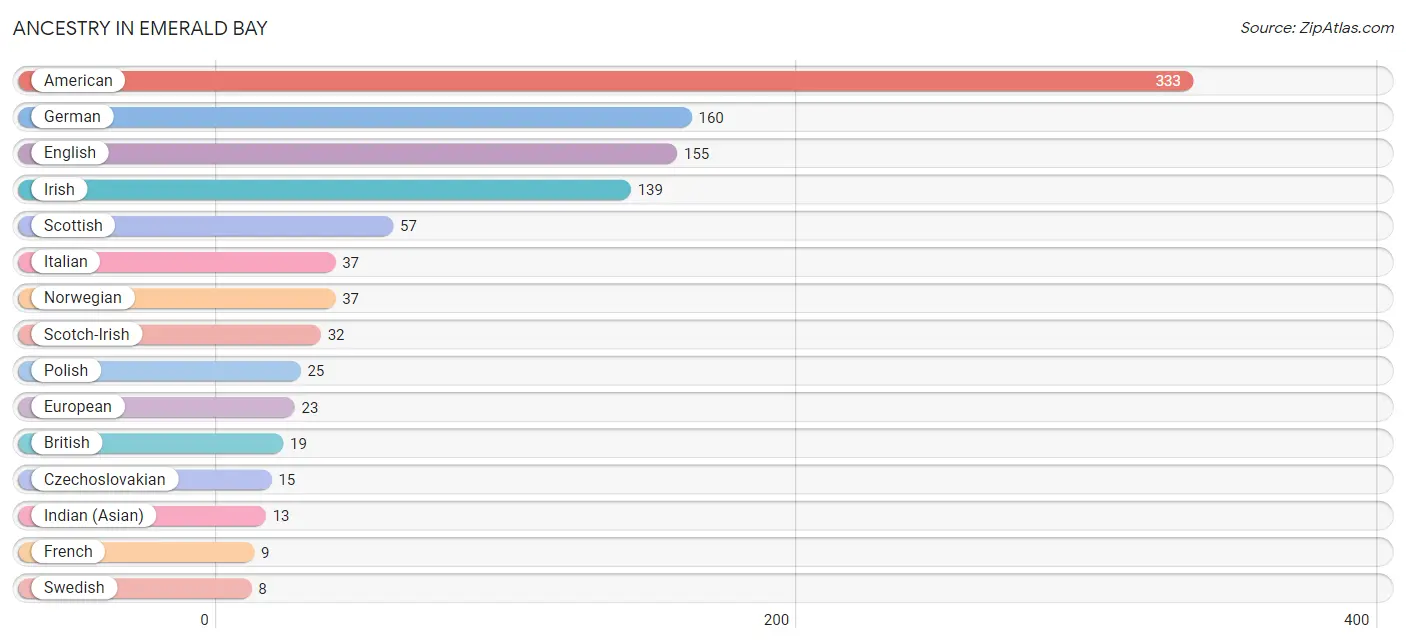
Ancestry in Emerald Bay
The most populous ancestries reported in Emerald Bay are American (333 | 34.4%), German (160 | 16.5%), English (155 | 16.0%), Irish (139 | 14.3%), and Scottish (57 | 5.9%), together accounting for 87.1% of all Emerald Bay residents.
| Ancestry | # Population | % Population |
| American | 333 | 34.4% |
| British | 19 | 2.0% |
| Czechoslovakian | 15 | 1.5% |
| English | 155 | 16.0% |
| European | 23 | 2.4% |
| French | 9 | 0.9% |
| German | 160 | 16.5% |
| Indian (Asian) | 13 | 1.3% |
| Irish | 139 | 14.3% |
| Italian | 37 | 3.8% |
| Norwegian | 37 | 3.8% |
| Polish | 25 | 2.6% |
| Scotch-Irish | 32 | 3.3% |
| Scottish | 57 | 5.9% |
| Swedish | 8 | 0.8% | View All 15 Rows |
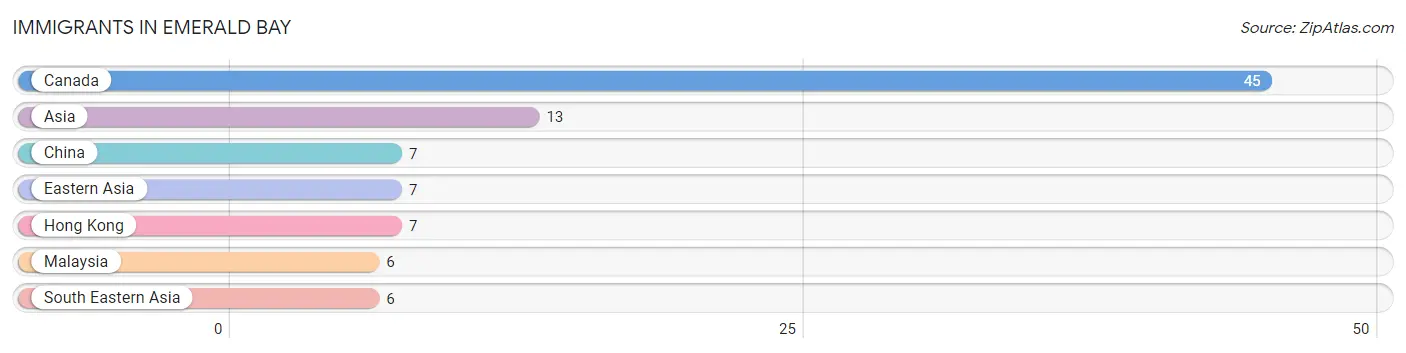
Immigrants in Emerald Bay
The most numerous immigrant groups reported in Emerald Bay came from Canada (45 | 4.6%), Asia (13 | 1.3%), China (7 | 0.7%), Eastern Asia (7 | 0.7%), and Hong Kong (7 | 0.7%), together accounting for 8.1% of all Emerald Bay residents.
| Immigration Origin | # Population | % Population |
| Asia | 13 | 1.3% |
| Canada | 45 | 4.6% |
| China | 7 | 0.7% |
| Eastern Asia | 7 | 0.7% |
| Hong Kong | 7 | 0.7% |
| Malaysia | 6 | 0.6% |
| South Eastern Asia | 6 | 0.6% | View All 7 Rows |
Sex and Age in Emerald Bay
Sex and Age in Emerald Bay
The most populous age groups in Emerald Bay are 75 to 79 Years (114 | 26.5%) for men and 30 to 34 Years (90 | 16.7%) for women.
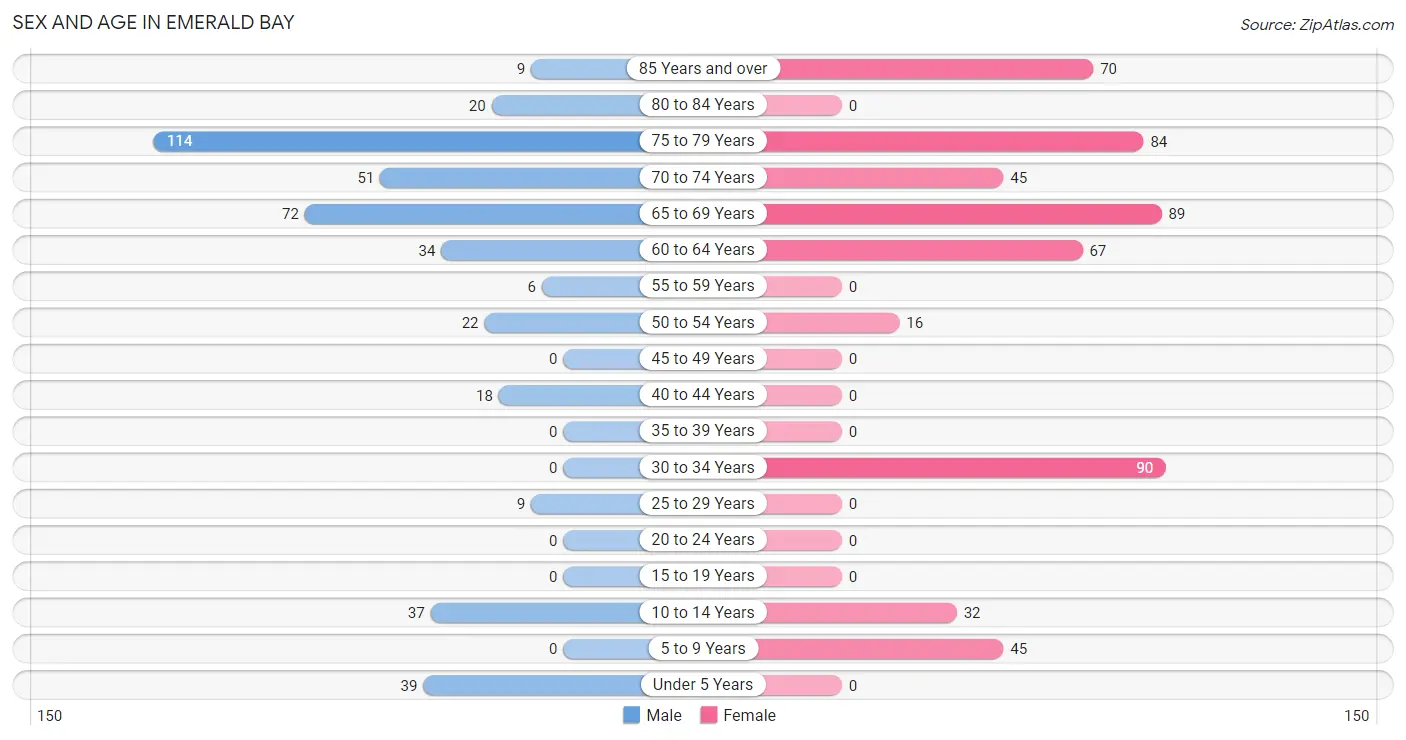
| Age Bracket | Male | Female |
| Under 5 Years | 39 (9.0%) | 0 (0.0%) |
| 5 to 9 Years | 0 (0.0%) | 45 (8.4%) |
| 10 to 14 Years | 37 (8.6%) | 32 (5.9%) |
| 15 to 19 Years | 0 (0.0%) | 0 (0.0%) |
| 20 to 24 Years | 0 (0.0%) | 0 (0.0%) |
| 25 to 29 Years | 9 (2.1%) | 0 (0.0%) |
| 30 to 34 Years | 0 (0.0%) | 90 (16.7%) |
| 35 to 39 Years | 0 (0.0%) | 0 (0.0%) |
| 40 to 44 Years | 18 (4.2%) | 0 (0.0%) |
| 45 to 49 Years | 0 (0.0%) | 0 (0.0%) |
| 50 to 54 Years | 22 (5.1%) | 16 (3.0%) |
| 55 to 59 Years | 6 (1.4%) | 0 (0.0%) |
| 60 to 64 Years | 34 (7.9%) | 67 (12.4%) |
| 65 to 69 Years | 72 (16.7%) | 89 (16.5%) |
| 70 to 74 Years | 51 (11.8%) | 45 (8.4%) |
| 75 to 79 Years | 114 (26.5%) | 84 (15.6%) |
| 80 to 84 Years | 20 (4.6%) | 0 (0.0%) |
| 85 Years and over | 9 (2.1%) | 70 (13.0%) |
| Total | 431 (100.0%) | 538 (100.0%) |
Families and Households in Emerald Bay
Median Family Size in Emerald Bay
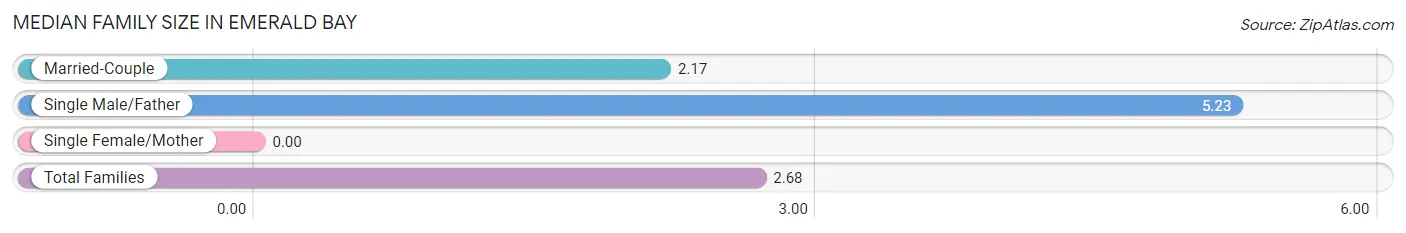
| Family Type | # Families | Family Size |
| Married-Couple | 263 (83.2%) | 2.17 |
| Single Male/Father | 53 (16.8%) | 5.23 |
| Single Female/Mother | 0 (0.0%) | - |
| Total Families | 316 (100.0%) | 2.68 |
Median Household Size in Emerald Bay
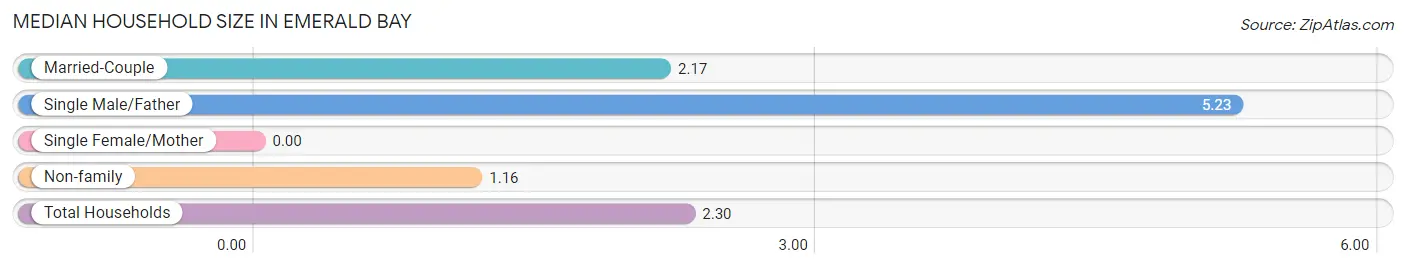
| Household Type | # Households | Household Size |
| Married-Couple | 263 (62.5%) | 2.17 |
| Single Male/Father | 53 (12.6%) | 5.23 |
| Single Female/Mother | 0 (0.0%) | - |
| Non-family | 105 (24.9%) | 1.16 |
| Total Households | 421 (100.0%) | 2.30 |
Household Size by Marriage Status in Emerald Bay
Out of a total of 421 households in Emerald Bay, 316 (75.1%) are family households, while 105 (24.9%) are nonfamily households. The most numerous type of family households are 2-person households, comprising 218, and the most common type of nonfamily households are 1-person households, comprising 89.
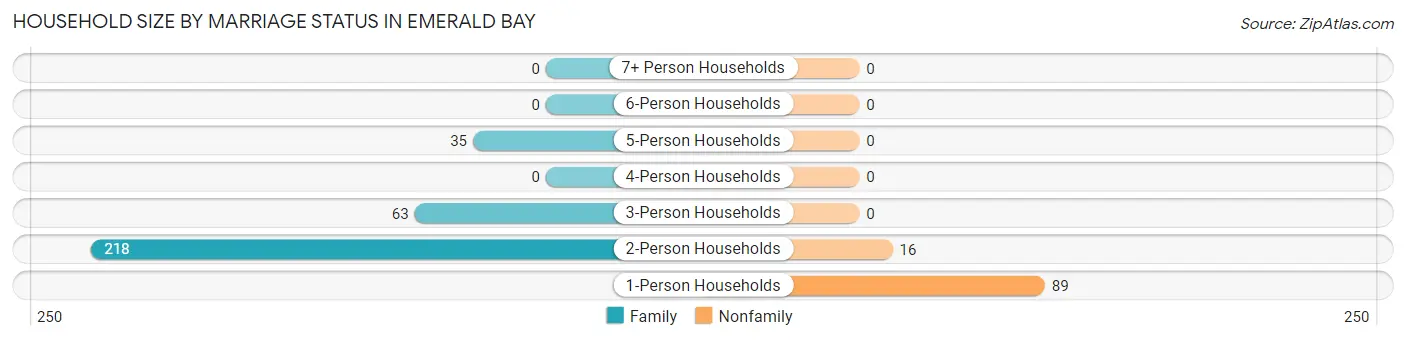
| Household Size | Family Households | Nonfamily Households |
| 1-Person Households | - | 89 (21.1%) |
| 2-Person Households | 218 (51.8%) | 16 (3.8%) |
| 3-Person Households | 63 (15.0%) | 0 (0.0%) |
| 4-Person Households | 0 (0.0%) | 0 (0.0%) |
| 5-Person Households | 35 (8.3%) | 0 (0.0%) |
| 6-Person Households | 0 (0.0%) | 0 (0.0%) |
| 7+ Person Households | 0 (0.0%) | 0 (0.0%) |
| Total | 316 (75.1%) | 105 (24.9%) |
Female Fertility in Emerald Bay
Fertility by Age in Emerald Bay
| Age Bracket | Women with Births | Births / 1,000 Women |
| 15 to 19 years | 0 (0.0%) | 0.0 |
| 20 to 34 years | 0 (0.0%) | 0.0 |
| 35 to 50 years | 0 (0.0%) | 0.0 |
| Total | 0 (0.0%) | 0.0 |
Fertility by Age by Marriage Status in Emerald Bay
| Age Bracket | Married | Unmarried |
| 15 to 19 years | 0 (0.0%) | 0 (0.0%) |
| 20 to 34 years | 0 (0.0%) | 0 (0.0%) |
| 35 to 50 years | 0 (0.0%) | 0 (0.0%) |
| Total | 0 (0.0%) | 0 (0.0%) |
Fertility by Education in Emerald Bay
| Educational Attainment | Women with Births | Births / 1,000 Women |
| Less than High School | 0 (0.0%) | 0.0 |
| High School Diploma | 0 (0.0%) | 0.0 |
| College or Associate's Degree | 0 (0.0%) | 0.0 |
| Bachelor's Degree | 0 (0.0%) | 0.0 |
| Graduate Degree | 0 (0.0%) | 0.0 |
| Total | 0 (0.0%) | 0.0 |
Fertility by Education by Marriage Status in Emerald Bay
| Educational Attainment | Married | Unmarried |
| Less than High School | 0 (0.0%) | 0 (0.0%) |
| High School Diploma | 0 (0.0%) | 0 (0.0%) |
| College or Associate's Degree | 0 (0.0%) | 0 (0.0%) |
| Bachelor's Degree | 0 (0.0%) | 0 (0.0%) |
| Graduate Degree | 0 (0.0%) | 0 (0.0%) |
| Total | 0 (0.0%) | 0 (0.0%) |
Employment Characteristics in Emerald Bay
Employment by Class of Employer in Emerald Bay
Among the 239 employed individuals in Emerald Bay, private company employees (217 | 90.8%), self-employed (not incorporated) (16 | 6.7%), and self-employed (incorporated) (6 | 2.5%) make up the most common classes of employment.
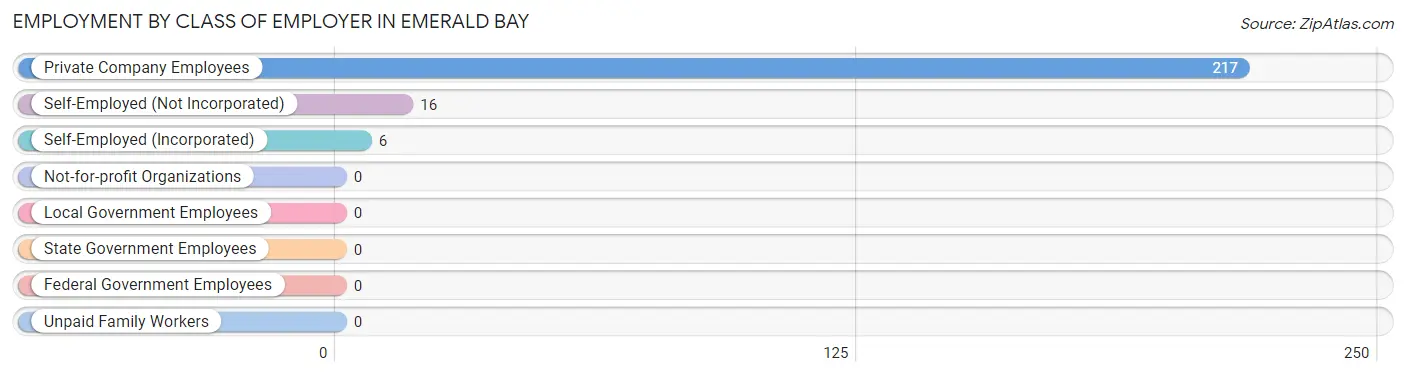
| Employer Class | # Employees | % Employees |
| Private Company Employees | 217 | 90.8% |
| Self-Employed (Incorporated) | 6 | 2.5% |
| Self-Employed (Not Incorporated) | 16 | 6.7% |
| Not-for-profit Organizations | 0 | 0.0% |
| Local Government Employees | 0 | 0.0% |
| State Government Employees | 0 | 0.0% |
| Federal Government Employees | 0 | 0.0% |
| Unpaid Family Workers | 0 | 0.0% |
| Total | 239 | 100.0% |
Employment Status by Age in Emerald Bay
According to the labor force statistics for Emerald Bay, out of the total population over 16 years of age (816), 30.6% or 250 individuals are in the labor force, with 4.4% or 11 of them unemployed. The age group with the highest labor force participation rate is 30 to 34 years, with 100.0% or 90 individuals in the labor force. Within the labor force, the 60 to 64 years age range has the highest percentage of unemployed individuals, with 23.4% or 11 of them being unemployed.
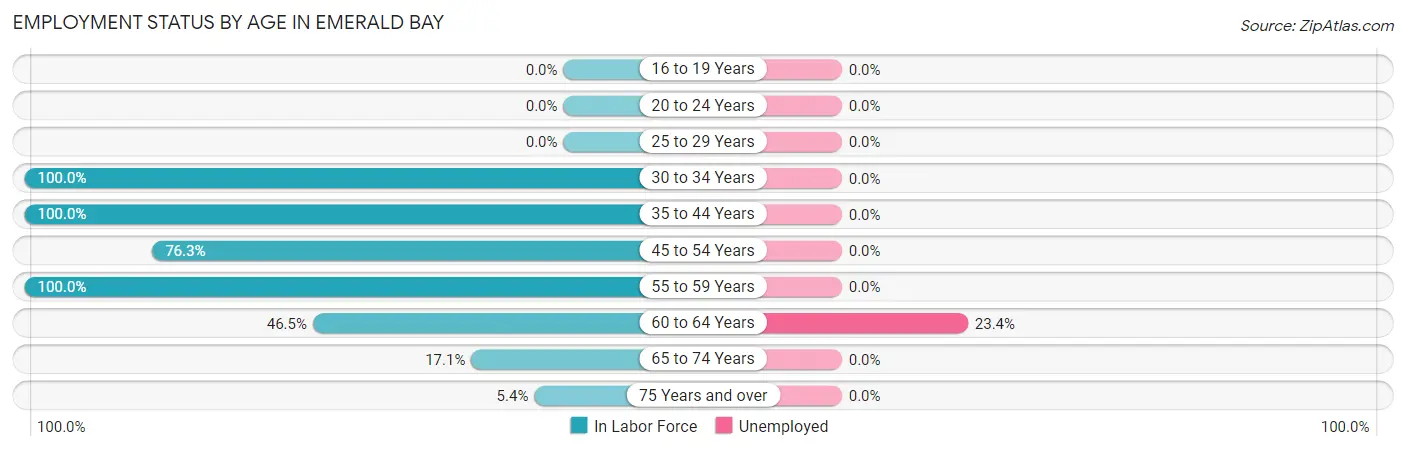
| Age Bracket | In Labor Force | Unemployed |
| 16 to 19 Years | 0 (0.0%) | 0 (0.0%) |
| 20 to 24 Years | 0 (0.0%) | 0 (0.0%) |
| 25 to 29 Years | 0 (0.0%) | 0 (0.0%) |
| 30 to 34 Years | 90 (100.0%) | 0 (0.0%) |
| 35 to 44 Years | 18 (100.0%) | 0 (0.0%) |
| 45 to 54 Years | 29 (76.3%) | 0 (0.0%) |
| 55 to 59 Years | 6 (100.0%) | 0 (0.0%) |
| 60 to 64 Years | 47 (46.5%) | 11 (23.4%) |
| 65 to 74 Years | 44 (17.1%) | 0 (0.0%) |
| 75 Years and over | 16 (5.4%) | 0 (0.0%) |
| Total | 250 (30.6%) | 11 (4.4%) |
Employment Status by Educational Attainment in Emerald Bay
According to labor force statistics for Emerald Bay, 72.5% of individuals (190) out of the total population between 25 and 64 years of age (262) are in the labor force, with 5.8% or 11 of them being unemployed. The group with the highest labor force participation rate are those with the educational attainment of college / associate degree, with 86.7% or 117 individuals in the labor force. Within the labor force, individuals with high school diploma education have the highest percentage of unemployment, with 37.9% or 11 of them being unemployed.
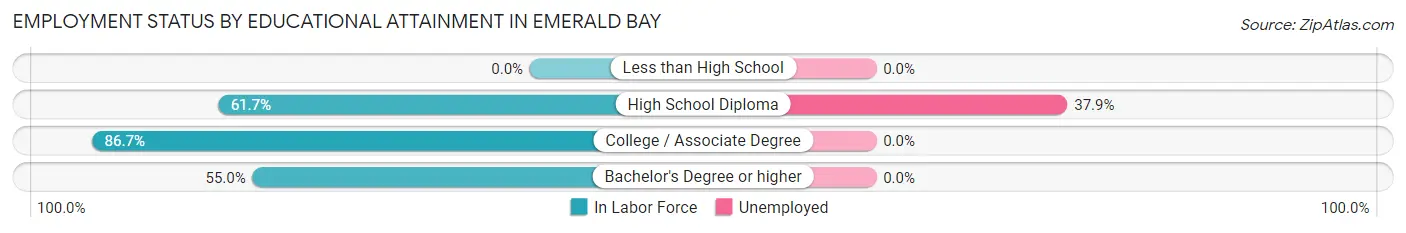
| Educational Attainment | In Labor Force | Unemployed |
| Less than High School | 0 (0.0%) | 0 (0.0%) |
| High School Diploma | 29 (61.7%) | 18 (37.9%) |
| College / Associate Degree | 117 (86.7%) | 0 (0.0%) |
| Bachelor's Degree or higher | 44 (55.0%) | 0 (0.0%) |
| Total | 190 (72.5%) | 15 (5.8%) |
Employment Occupations by Sex in Emerald Bay
Management, Business, Science and Arts Occupations
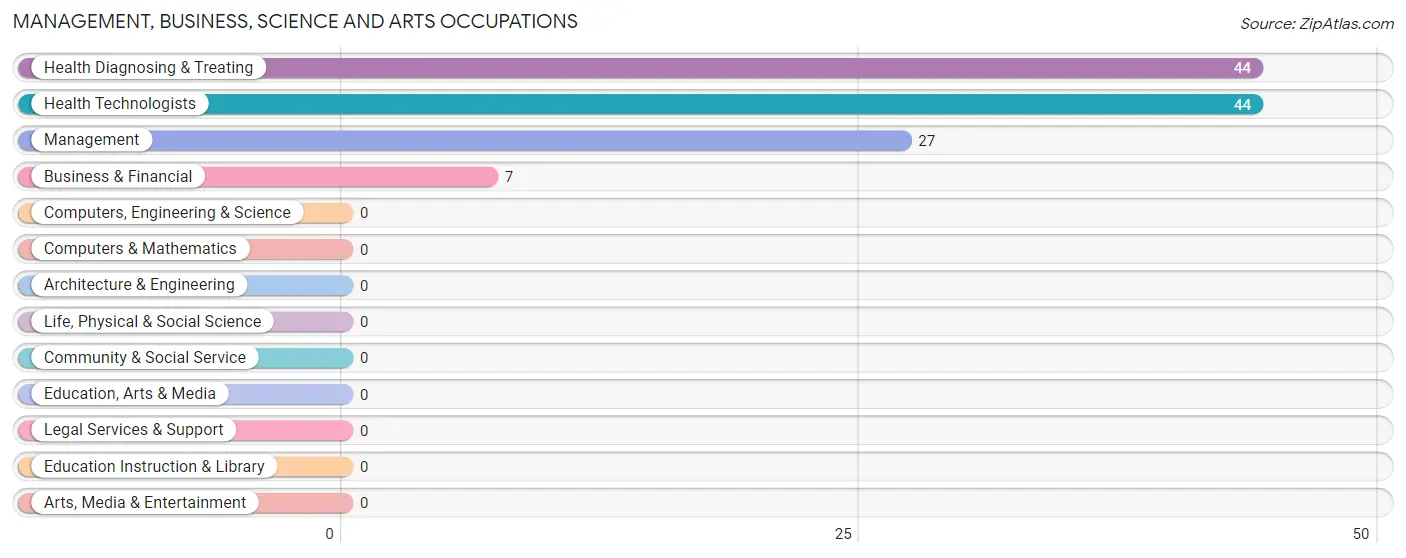
The most common Management, Business, Science and Arts occupations in Emerald Bay are Health Diagnosing & Treating (44 | 18.4%), Health Technologists (44 | 18.4%), Management (27 | 11.3%), and Business & Financial (7 | 2.9%).
Management, Business, Science and Arts Occupations by Sex
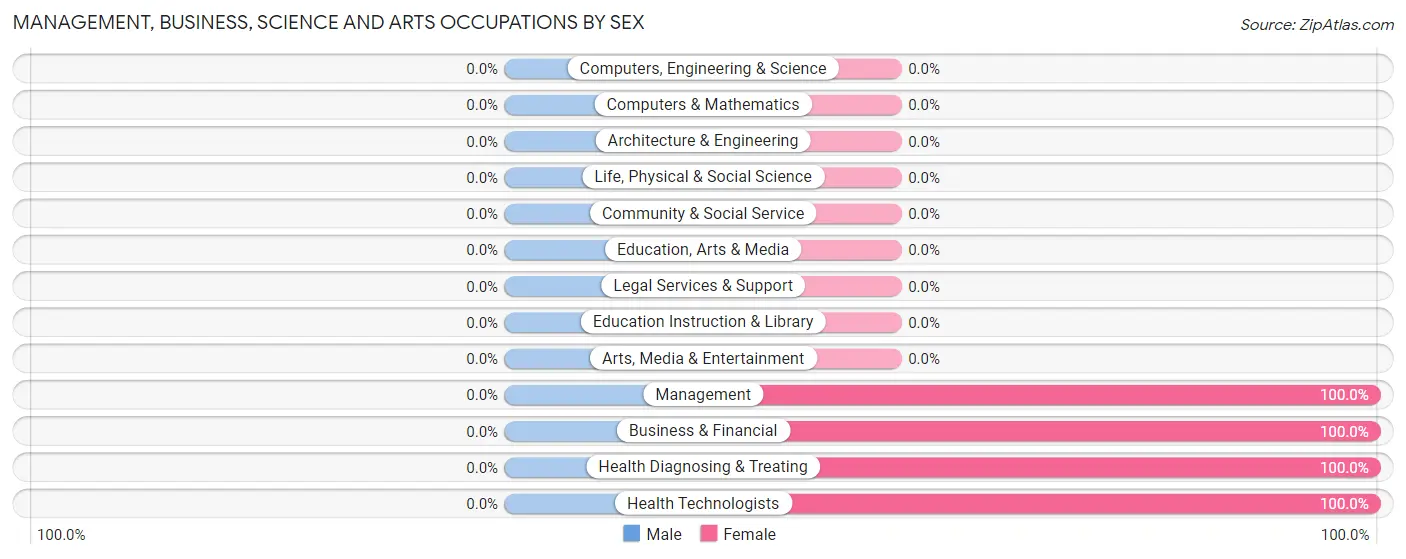
| Occupation | Male | Female |
| Management | 0 (0.0%) | 27 (100.0%) |
| Business & Financial | 0 (0.0%) | 7 (100.0%) |
| Computers, Engineering & Science | 0 (0.0%) | 0 (0.0%) |
| Computers & Mathematics | 0 (0.0%) | 0 (0.0%) |
| Architecture & Engineering | 0 (0.0%) | 0 (0.0%) |
| Life, Physical & Social Science | 0 (0.0%) | 0 (0.0%) |
| Community & Social Service | 0 (0.0%) | 0 (0.0%) |
| Education, Arts & Media | 0 (0.0%) | 0 (0.0%) |
| Legal Services & Support | 0 (0.0%) | 0 (0.0%) |
| Education Instruction & Library | 0 (0.0%) | 0 (0.0%) |
| Arts, Media & Entertainment | 0 (0.0%) | 0 (0.0%) |
| Health Diagnosing & Treating | 0 (0.0%) | 44 (100.0%) |
| Health Technologists | 0 (0.0%) | 44 (100.0%) |
| Total (Category) | 0 (0.0%) | 78 (100.0%) |
| Total (Overall) | 55 (23.0%) | 184 (77.0%) |
Services Occupations
The most common Services occupations in Emerald Bay are , and Personal Care & Service (16 | 6.7%).
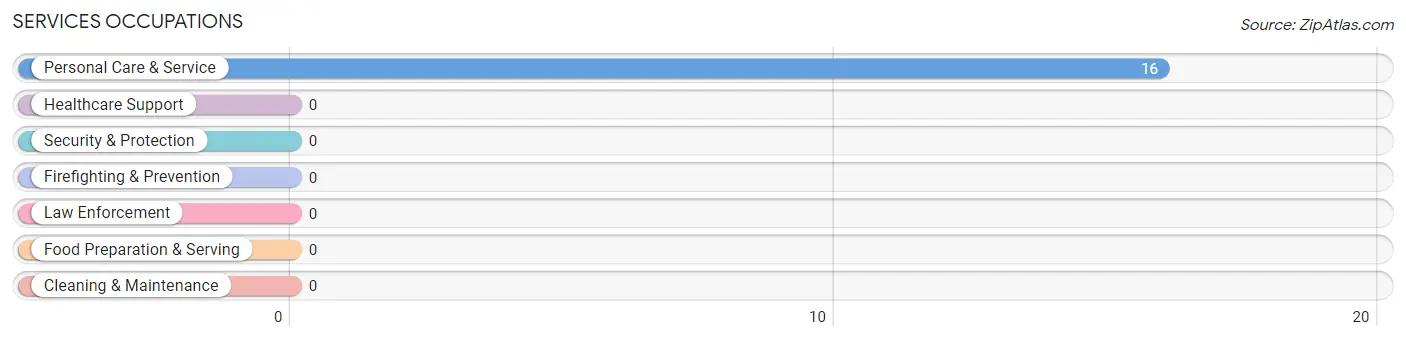
Services Occupations by Sex
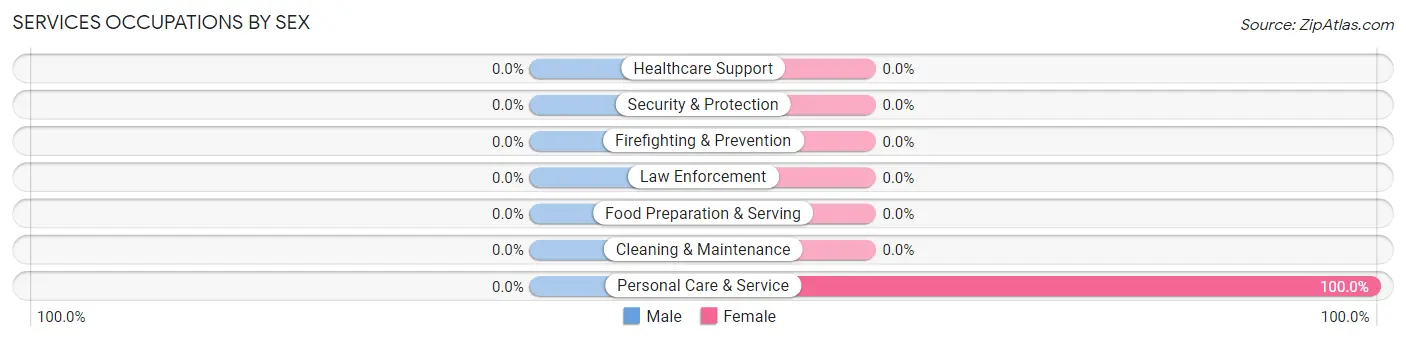
| Occupation | Male | Female |
| Healthcare Support | 0 (0.0%) | 0 (0.0%) |
| Security & Protection | 0 (0.0%) | 0 (0.0%) |
| Firefighting & Prevention | 0 (0.0%) | 0 (0.0%) |
| Law Enforcement | 0 (0.0%) | 0 (0.0%) |
| Food Preparation & Serving | 0 (0.0%) | 0 (0.0%) |
| Cleaning & Maintenance | 0 (0.0%) | 0 (0.0%) |
| Personal Care & Service | 0 (0.0%) | 16 (100.0%) |
| Total (Category) | 0 (0.0%) | 16 (100.0%) |
| Total (Overall) | 55 (23.0%) | 184 (77.0%) |
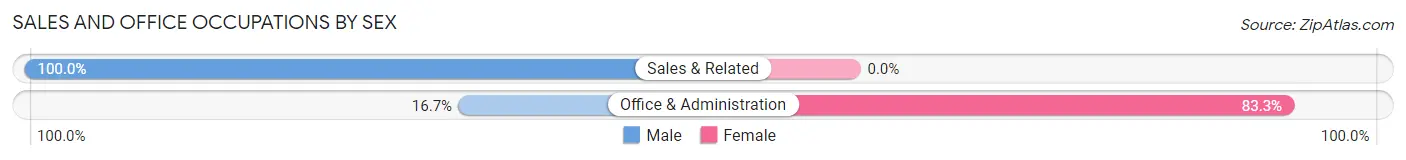
Sales and Office Occupations
The most common Sales and Office occupations in Emerald Bay are Office & Administration (108 | 45.2%), and Sales & Related (37 | 15.5%).
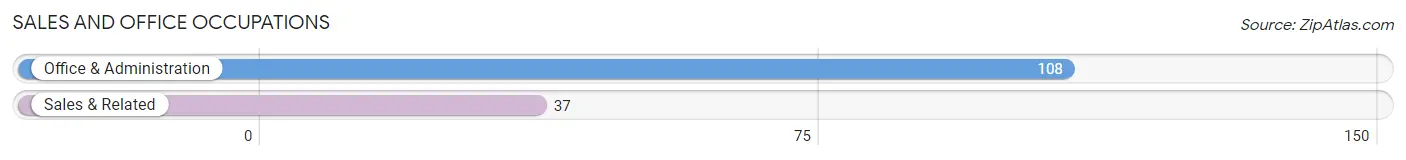
Sales and Office Occupations by Sex
| Occupation | Male | Female |
| Sales & Related | 37 (100.0%) | 0 (0.0%) |
| Office & Administration | 18 (16.7%) | 90 (83.3%) |
| Total (Category) | 55 (37.9%) | 90 (62.1%) |
| Total (Overall) | 55 (23.0%) | 184 (77.0%) |
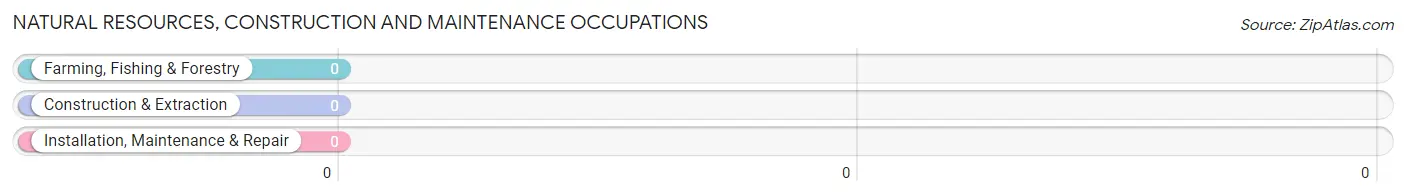
Natural Resources, Construction and Maintenance Occupations
Natural Resources, Construction and Maintenance Occupations by Sex
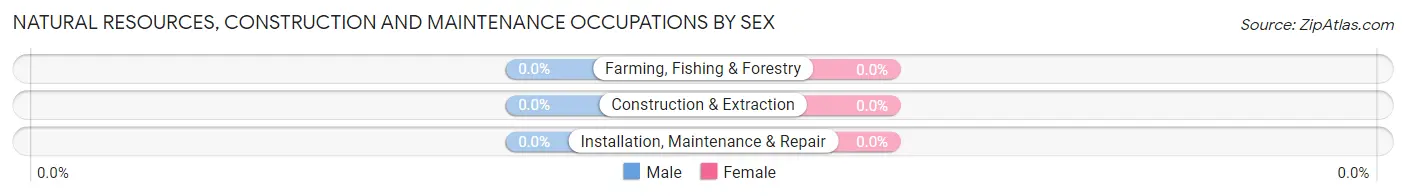
| Occupation | Male | Female |
| Farming, Fishing & Forestry | 0 (0.0%) | 0 (0.0%) |
| Construction & Extraction | 0 (0.0%) | 0 (0.0%) |
| Installation, Maintenance & Repair | 0 (0.0%) | 0 (0.0%) |
| Total (Category) | 0 (0.0%) | 0 (0.0%) |
| Total (Overall) | 55 (23.0%) | 184 (77.0%) |
Production, Transportation and Moving Occupations
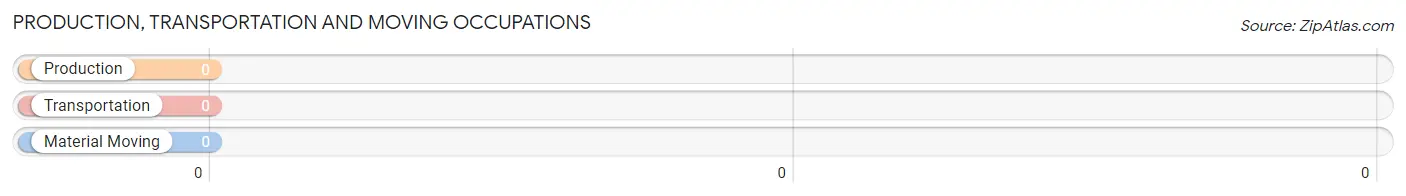
Production, Transportation and Moving Occupations by Sex
| Occupation | Male | Female |
| Production | 0 (0.0%) | 0 (0.0%) |
| Transportation | 0 (0.0%) | 0 (0.0%) |
| Material Moving | 0 (0.0%) | 0 (0.0%) |
| Total (Category) | 0 (0.0%) | 0 (0.0%) |
| Total (Overall) | 55 (23.0%) | 184 (77.0%) |
Employment Industries by Sex in Emerald Bay
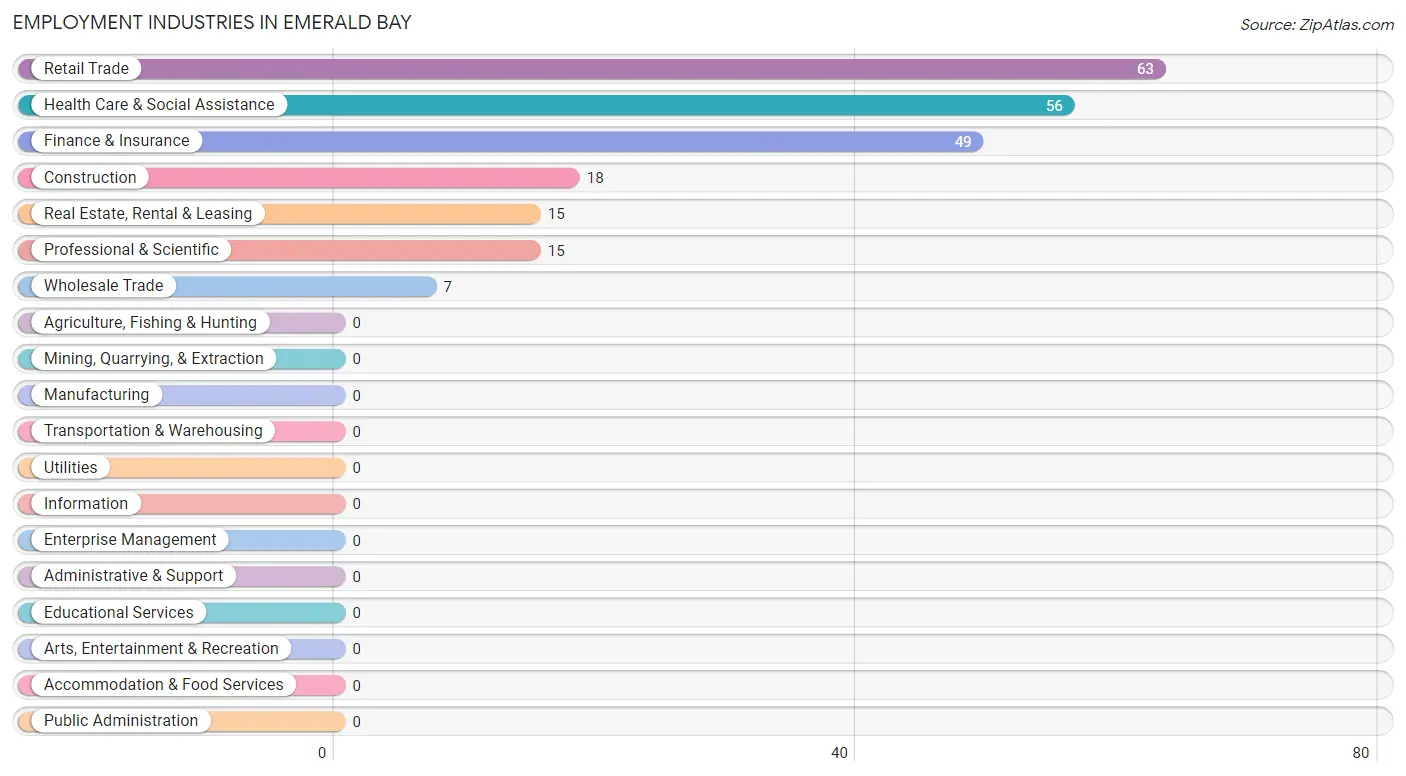
Employment Industries in Emerald Bay
The major employment industries in Emerald Bay include Retail Trade (63 | 26.4%), Health Care & Social Assistance (56 | 23.4%), Finance & Insurance (49 | 20.5%), Construction (18 | 7.5%), and Real Estate, Rental & Leasing (15 | 6.3%).
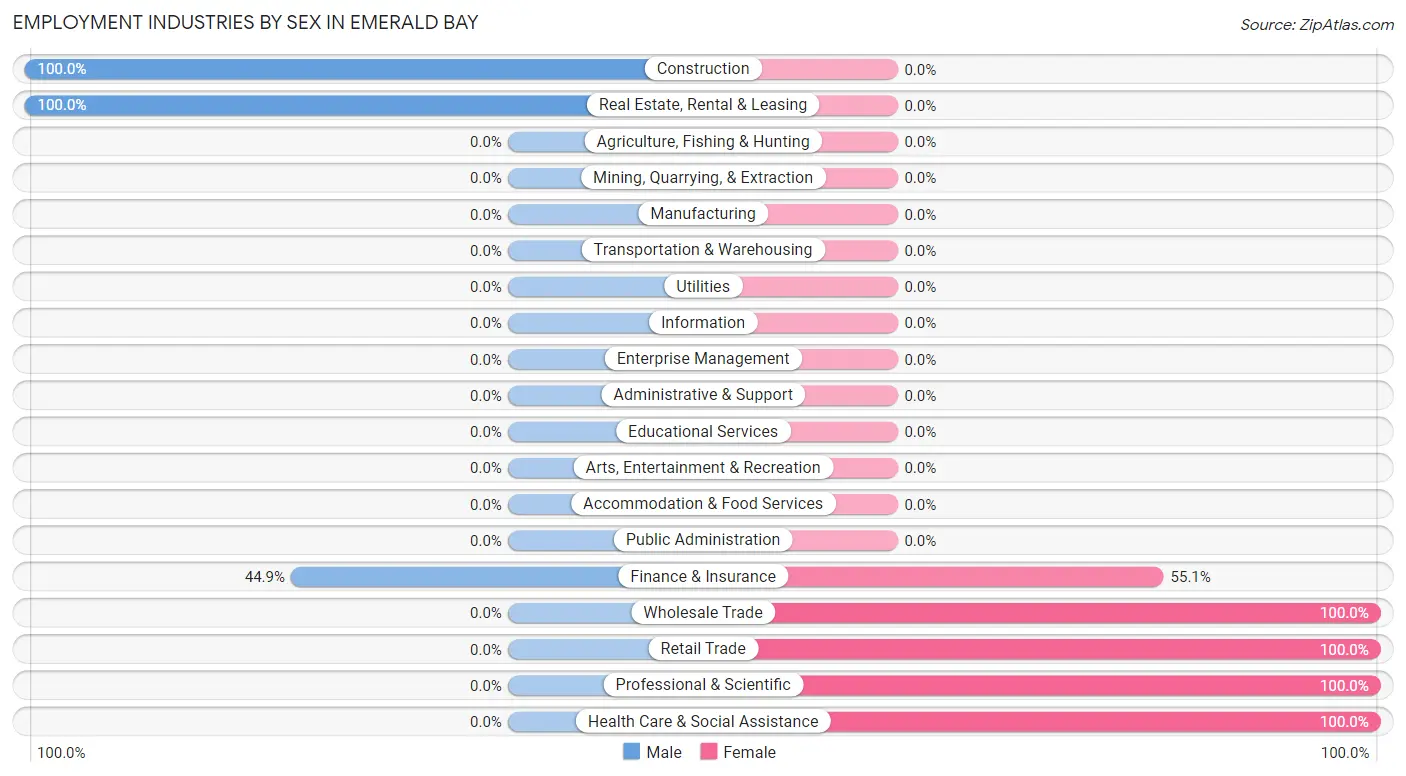
Employment Industries by Sex in Emerald Bay
The Emerald Bay industries that see more men than women are Construction (100.0%), Real Estate, Rental & Leasing (100.0%), and Finance & Insurance (44.9%), whereas the industries that tend to have a higher number of women are Wholesale Trade (100.0%), Retail Trade (100.0%), and Professional & Scientific (100.0%).
| Industry | Male | Female |
| Agriculture, Fishing & Hunting | 0 (0.0%) | 0 (0.0%) |
| Mining, Quarrying, & Extraction | 0 (0.0%) | 0 (0.0%) |
| Construction | 18 (100.0%) | 0 (0.0%) |
| Manufacturing | 0 (0.0%) | 0 (0.0%) |
| Wholesale Trade | 0 (0.0%) | 7 (100.0%) |
| Retail Trade | 0 (0.0%) | 63 (100.0%) |
| Transportation & Warehousing | 0 (0.0%) | 0 (0.0%) |
| Utilities | 0 (0.0%) | 0 (0.0%) |
| Information | 0 (0.0%) | 0 (0.0%) |
| Finance & Insurance | 22 (44.9%) | 27 (55.1%) |
| Real Estate, Rental & Leasing | 15 (100.0%) | 0 (0.0%) |
| Professional & Scientific | 0 (0.0%) | 15 (100.0%) |
| Enterprise Management | 0 (0.0%) | 0 (0.0%) |
| Administrative & Support | 0 (0.0%) | 0 (0.0%) |
| Educational Services | 0 (0.0%) | 0 (0.0%) |
| Health Care & Social Assistance | 0 (0.0%) | 56 (100.0%) |
| Arts, Entertainment & Recreation | 0 (0.0%) | 0 (0.0%) |
| Accommodation & Food Services | 0 (0.0%) | 0 (0.0%) |
| Public Administration | 0 (0.0%) | 0 (0.0%) |
| Total | 55 (23.0%) | 184 (77.0%) |
Education in Emerald Bay
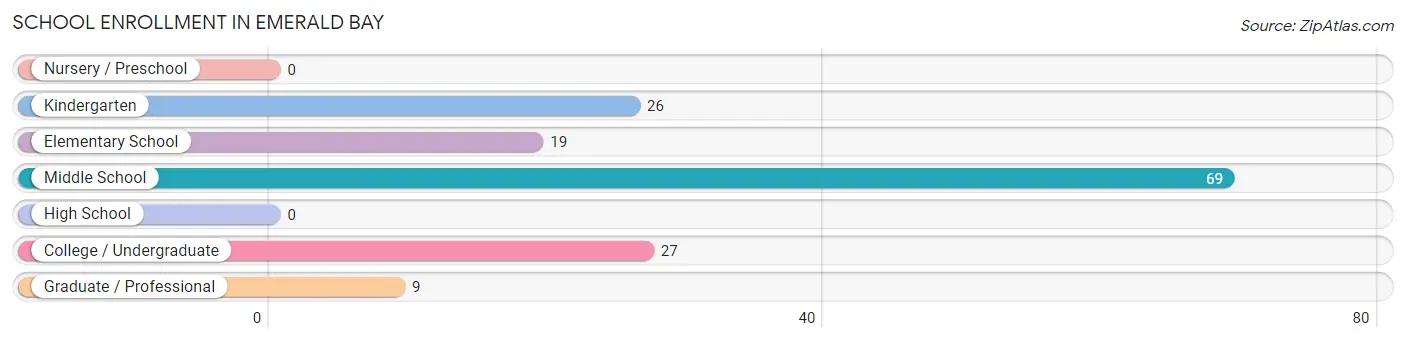
School Enrollment in Emerald Bay
The most common levels of schooling among the 150 students in Emerald Bay are middle school (69 | 46.0%), college / undergraduate (27 | 18.0%), and kindergarten (26 | 17.3%).
| School Level | # Students | % Students |
| Nursery / Preschool | 0 | 0.0% |
| Kindergarten | 26 | 17.3% |
| Elementary School | 19 | 12.7% |
| Middle School | 69 | 46.0% |
| High School | 0 | 0.0% |
| College / Undergraduate | 27 | 18.0% |
| Graduate / Professional | 9 | 6.0% |
| Total | 150 | 100.0% |
School Enrollment by Age by Funding Source in Emerald Bay
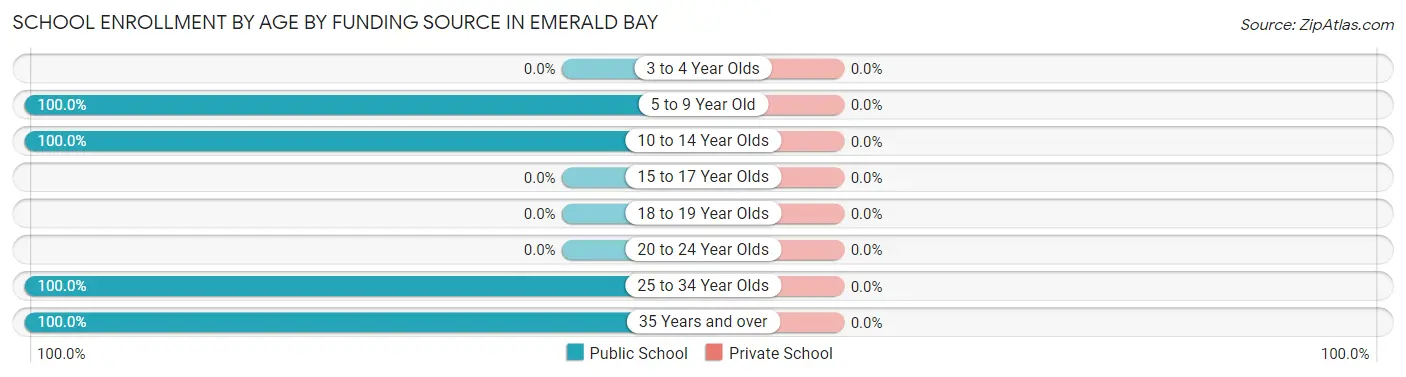
| Age Bracket | Public School | Private School |
| 3 to 4 Year Olds | 0 (0.0%) | 0 (0.0%) |
| 5 to 9 Year Old | 45 (100.0%) | 0 (0.0%) |
| 10 to 14 Year Olds | 69 (100.0%) | 0 (0.0%) |
| 15 to 17 Year Olds | 0 (0.0%) | 0 (0.0%) |
| 18 to 19 Year Olds | 0 (0.0%) | 0 (0.0%) |
| 20 to 24 Year Olds | 0 (0.0%) | 0 (0.0%) |
| 25 to 34 Year Olds | 27 (100.0%) | 0 (0.0%) |
| 35 Years and over | 9 (100.0%) | 0 (0.0%) |
| Total | 150 (100.0%) | 0 (0.0%) |
Educational Attainment by Field of Study in Emerald Bay
Education (114 | 24.5%), business (81 | 17.4%), science & technology (73 | 15.7%), engineering (70 | 15.0%), and physical & health sciences (35 | 7.5%) are the most common fields of study among 465 individuals in Emerald Bay who have obtained a bachelor's degree or higher.
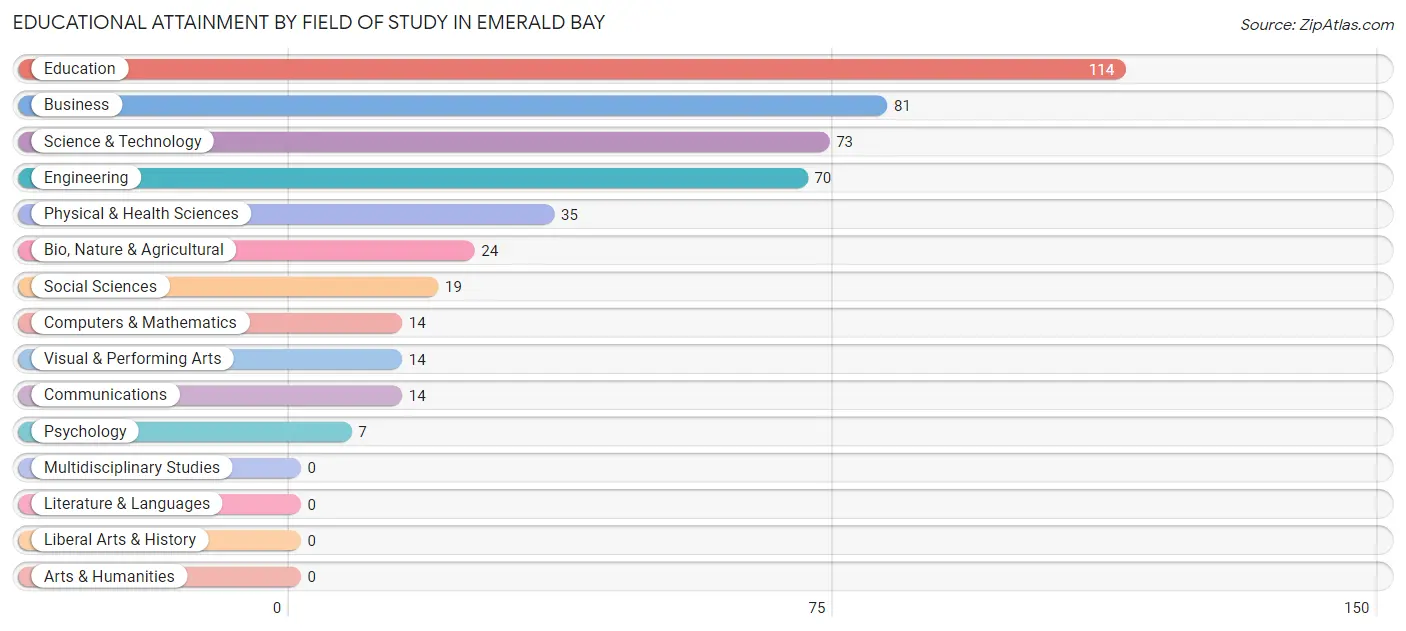
| Field of Study | # Graduates | % Graduates |
| Computers & Mathematics | 14 | 3.0% |
| Bio, Nature & Agricultural | 24 | 5.2% |
| Physical & Health Sciences | 35 | 7.5% |
| Psychology | 7 | 1.5% |
| Social Sciences | 19 | 4.1% |
| Engineering | 70 | 15.0% |
| Multidisciplinary Studies | 0 | 0.0% |
| Science & Technology | 73 | 15.7% |
| Business | 81 | 17.4% |
| Education | 114 | 24.5% |
| Literature & Languages | 0 | 0.0% |
| Liberal Arts & History | 0 | 0.0% |
| Visual & Performing Arts | 14 | 3.0% |
| Communications | 14 | 3.0% |
| Arts & Humanities | 0 | 0.0% |
| Total | 465 | 100.0% |
Transportation & Commute in Emerald Bay
Vehicle Availability by Sex in Emerald Bay
The most prevalent vehicle ownership categories in Emerald Bay are males with 2 vehicles (37, accounting for 67.3%) and females with 2 vehicles (121, making up 20.1%).
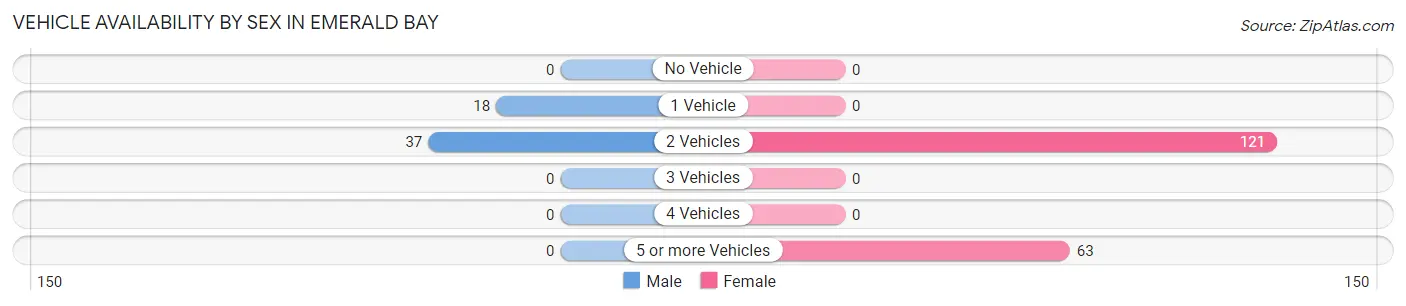
| Vehicles Available | Male | Female |
| No Vehicle | 0 (0.0%) | 0 (0.0%) |
| 1 Vehicle | 18 (32.7%) | 0 (0.0%) |
| 2 Vehicles | 37 (67.3%) | 121 (65.8%) |
| 3 Vehicles | 0 (0.0%) | 0 (0.0%) |
| 4 Vehicles | 0 (0.0%) | 0 (0.0%) |
| 5 or more Vehicles | 0 (0.0%) | 63 (34.2%) |
| Total | 55 (100.0%) | 184 (100.0%) |
Commute Time in Emerald Bay
The most frequently occuring commute durations in Emerald Bay are 30 to 34 minutes (100 commuters, 48.8%), 25 to 29 minutes (72 commuters, 35.1%), and 20 to 24 minutes (27 commuters, 13.2%).
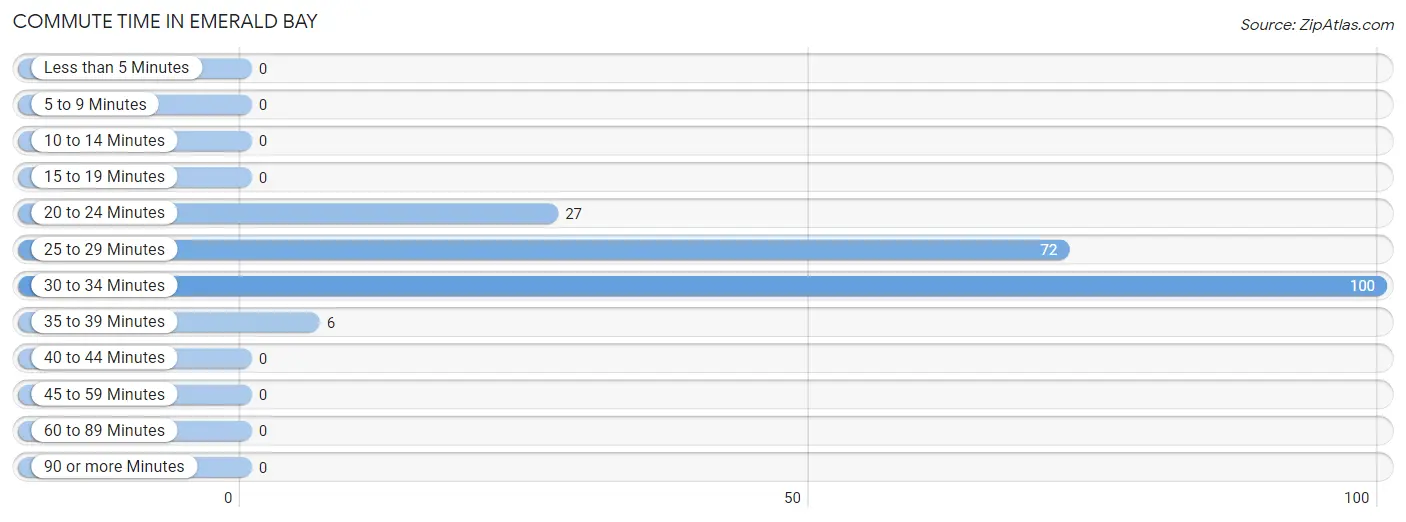
| Commute Time | # Commuters | % Commuters |
| Less than 5 Minutes | 0 | 0.0% |
| 5 to 9 Minutes | 0 | 0.0% |
| 10 to 14 Minutes | 0 | 0.0% |
| 15 to 19 Minutes | 0 | 0.0% |
| 20 to 24 Minutes | 27 | 13.2% |
| 25 to 29 Minutes | 72 | 35.1% |
| 30 to 34 Minutes | 100 | 48.8% |
| 35 to 39 Minutes | 6 | 2.9% |
| 40 to 44 Minutes | 0 | 0.0% |
| 45 to 59 Minutes | 0 | 0.0% |
| 60 to 89 Minutes | 0 | 0.0% |
| 90 or more Minutes | 0 | 0.0% |
Commute Time by Sex in Emerald Bay
The most common commute times in Emerald Bay are 30 to 34 minutes (18 commuters, 54.5%) for males and 30 to 34 minutes (82 commuters, 47.7%) for females.
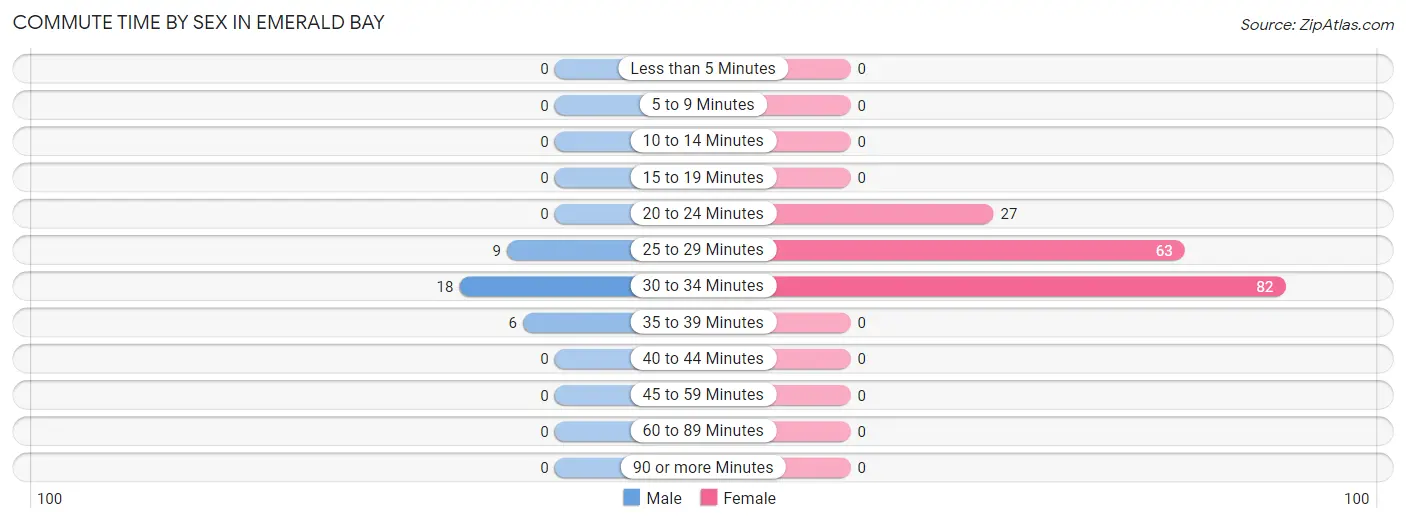
| Commute Time | Male | Female |
| Less than 5 Minutes | 0 (0.0%) | 0 (0.0%) |
| 5 to 9 Minutes | 0 (0.0%) | 0 (0.0%) |
| 10 to 14 Minutes | 0 (0.0%) | 0 (0.0%) |
| 15 to 19 Minutes | 0 (0.0%) | 0 (0.0%) |
| 20 to 24 Minutes | 0 (0.0%) | 27 (15.7%) |
| 25 to 29 Minutes | 9 (27.3%) | 63 (36.6%) |
| 30 to 34 Minutes | 18 (54.5%) | 82 (47.7%) |
| 35 to 39 Minutes | 6 (18.2%) | 0 (0.0%) |
| 40 to 44 Minutes | 0 (0.0%) | 0 (0.0%) |
| 45 to 59 Minutes | 0 (0.0%) | 0 (0.0%) |
| 60 to 89 Minutes | 0 (0.0%) | 0 (0.0%) |
| 90 or more Minutes | 0 (0.0%) | 0 (0.0%) |
Time of Departure to Work by Sex in Emerald Bay
The most frequent times of departure to work in Emerald Bay are 7:00 AM to 7:29 AM (18, 54.5%) for males and 7:30 AM to 7:59 AM (101, 58.7%) for females.
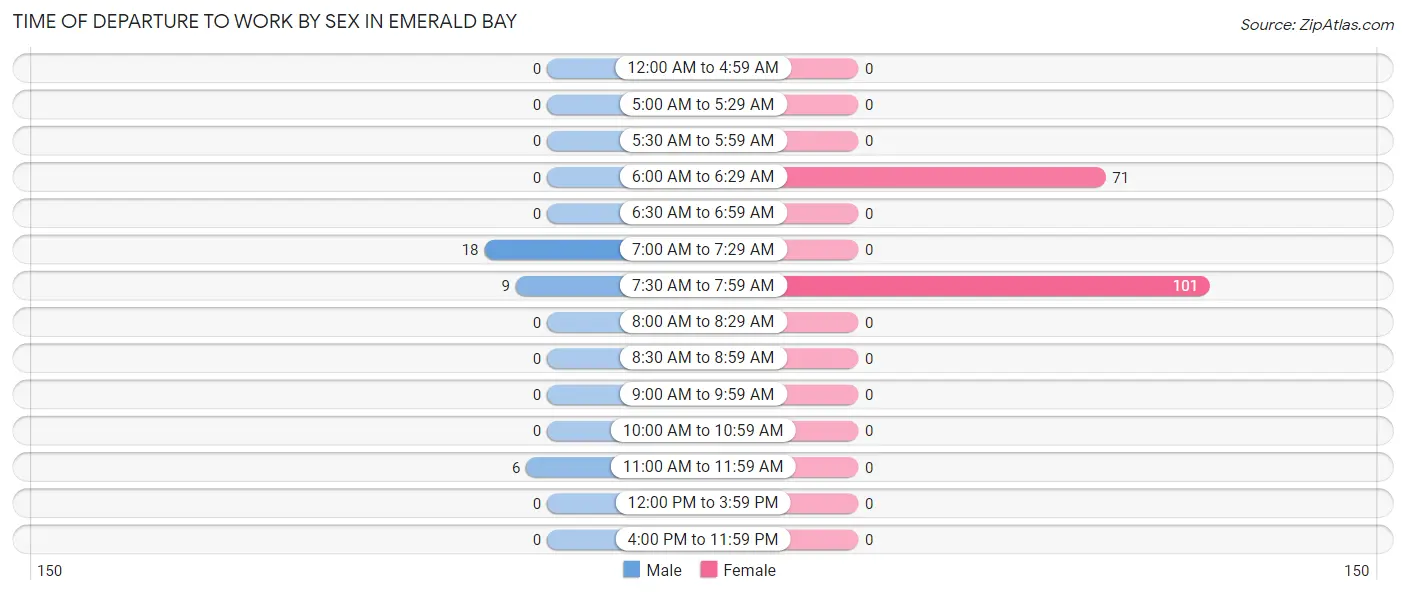
| Time of Departure | Male | Female |
| 12:00 AM to 4:59 AM | 0 (0.0%) | 0 (0.0%) |
| 5:00 AM to 5:29 AM | 0 (0.0%) | 0 (0.0%) |
| 5:30 AM to 5:59 AM | 0 (0.0%) | 0 (0.0%) |
| 6:00 AM to 6:29 AM | 0 (0.0%) | 71 (41.3%) |
| 6:30 AM to 6:59 AM | 0 (0.0%) | 0 (0.0%) |
| 7:00 AM to 7:29 AM | 18 (54.5%) | 0 (0.0%) |
| 7:30 AM to 7:59 AM | 9 (27.3%) | 101 (58.7%) |
| 8:00 AM to 8:29 AM | 0 (0.0%) | 0 (0.0%) |
| 8:30 AM to 8:59 AM | 0 (0.0%) | 0 (0.0%) |
| 9:00 AM to 9:59 AM | 0 (0.0%) | 0 (0.0%) |
| 10:00 AM to 10:59 AM | 0 (0.0%) | 0 (0.0%) |
| 11:00 AM to 11:59 AM | 6 (18.2%) | 0 (0.0%) |
| 12:00 PM to 3:59 PM | 0 (0.0%) | 0 (0.0%) |
| 4:00 PM to 11:59 PM | 0 (0.0%) | 0 (0.0%) |
| Total | 33 (100.0%) | 172 (100.0%) |
Housing Occupancy in Emerald Bay
Occupancy by Ownership in Emerald Bay
Of the total 421 dwellings in Emerald Bay, owner-occupied units account for 421 (100.0%), while renter-occupied units make up 0 (0.0%).
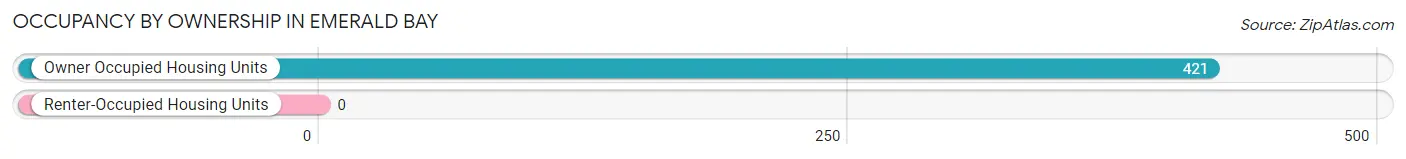
| Occupancy | # Housing Units | % Housing Units |
| Owner Occupied Housing Units | 421 | 100.0% |
| Renter-Occupied Housing Units | 0 | 0.0% |
| Total Occupied Housing Units | 421 | 100.0% |
Occupancy by Household Size in Emerald Bay
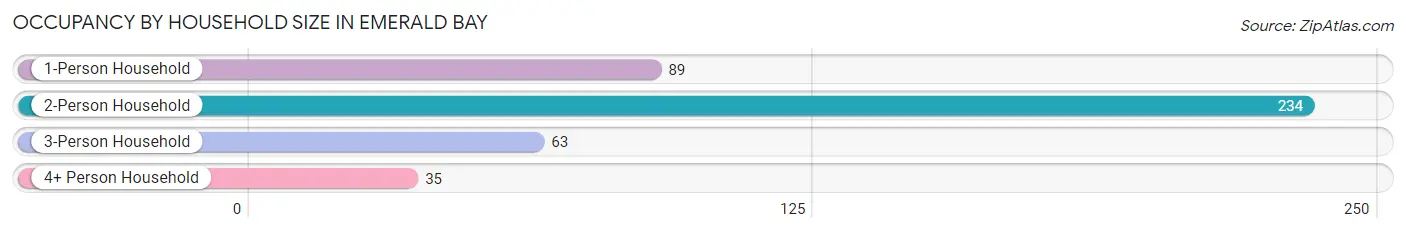
| Household Size | # Housing Units | % Housing Units |
| 1-Person Household | 89 | 21.1% |
| 2-Person Household | 234 | 55.6% |
| 3-Person Household | 63 | 15.0% |
| 4+ Person Household | 35 | 8.3% |
| Total Housing Units | 421 | 100.0% |
Occupancy by Ownership by Household Size in Emerald Bay
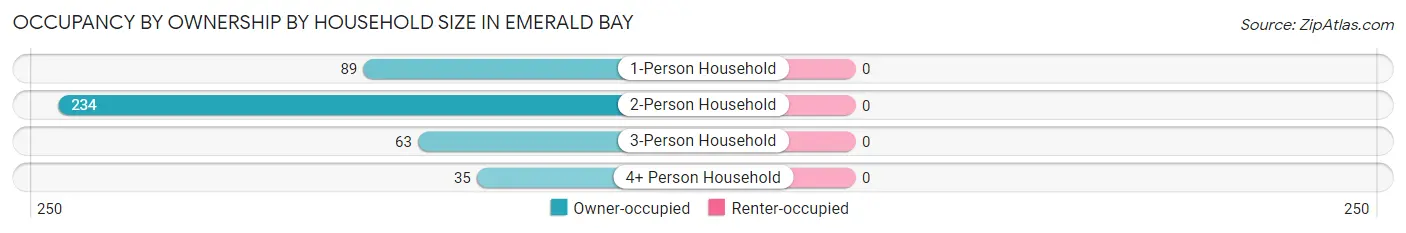
| Household Size | Owner-occupied | Renter-occupied |
| 1-Person Household | 89 (100.0%) | 0 (0.0%) |
| 2-Person Household | 234 (100.0%) | 0 (0.0%) |
| 3-Person Household | 63 (100.0%) | 0 (0.0%) |
| 4+ Person Household | 35 (100.0%) | 0 (0.0%) |
| Total Housing Units | 421 (100.0%) | 0 (0.0%) |
Occupancy by Educational Attainment in Emerald Bay
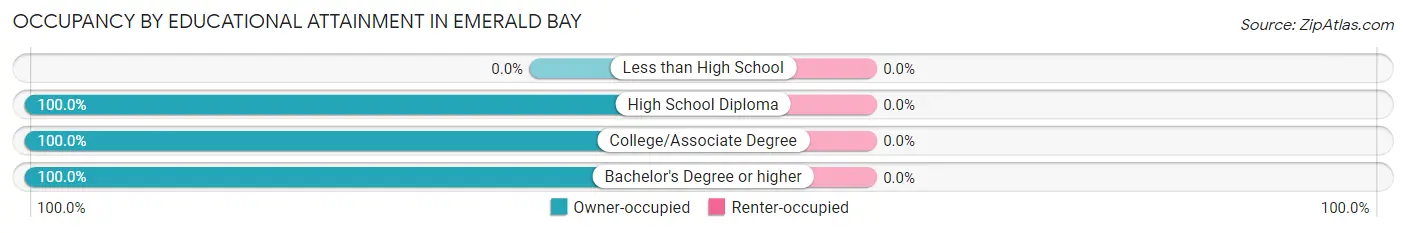
| Household Size | Owner-occupied | Renter-occupied |
| Less than High School | 0 (0.0%) | 0 (0.0%) |
| High School Diploma | 34 (100.0%) | 0 (0.0%) |
| College/Associate Degree | 199 (100.0%) | 0 (0.0%) |
| Bachelor's Degree or higher | 188 (100.0%) | 0 (0.0%) |
Occupancy by Age of Householder in Emerald Bay
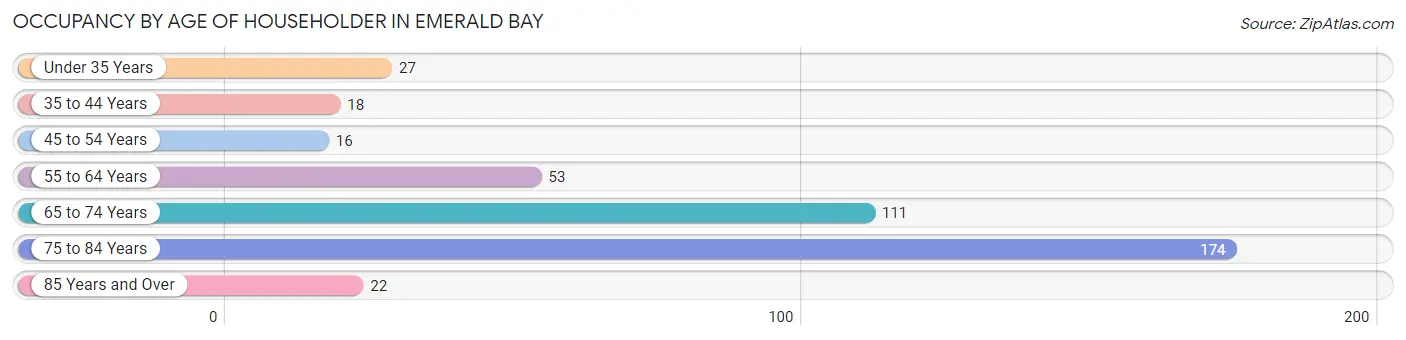
| Age Bracket | # Households | % Households |
| Under 35 Years | 27 | 6.4% |
| 35 to 44 Years | 18 | 4.3% |
| 45 to 54 Years | 16 | 3.8% |
| 55 to 64 Years | 53 | 12.6% |
| 65 to 74 Years | 111 | 26.4% |
| 75 to 84 Years | 174 | 41.3% |
| 85 Years and Over | 22 | 5.2% |
| Total | 421 | 100.0% |
Housing Finances in Emerald Bay
Median Income by Occupancy in Emerald Bay
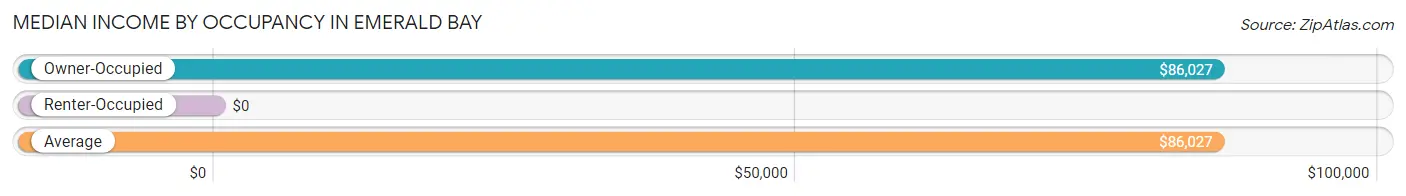
| Occupancy Type | # Households | Median Income |
| Owner-Occupied | 421 (100.0%) | $86,027 |
| Renter-Occupied | 0 (0.0%) | $0 |
| Average | 421 (100.0%) | $86,027 |
Occupancy by Householder Income Bracket in Emerald Bay
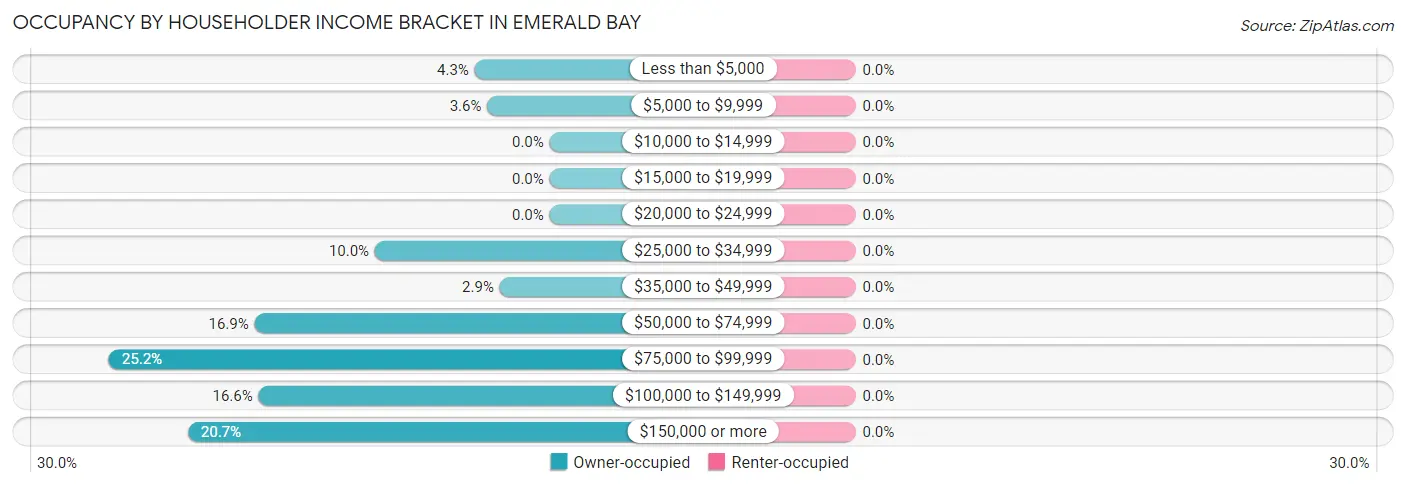
| Income Bracket | Owner-occupied | Renter-occupied |
| Less than $5,000 | 18 (4.3%) | 0 (0.0%) |
| $5,000 to $9,999 | 15 (3.6%) | 0 (0.0%) |
| $10,000 to $14,999 | 0 (0.0%) | 0 (0.0%) |
| $15,000 to $19,999 | 0 (0.0%) | 0 (0.0%) |
| $20,000 to $24,999 | 0 (0.0%) | 0 (0.0%) |
| $25,000 to $34,999 | 42 (10.0%) | 0 (0.0%) |
| $35,000 to $49,999 | 12 (2.9%) | 0 (0.0%) |
| $50,000 to $74,999 | 71 (16.9%) | 0 (0.0%) |
| $75,000 to $99,999 | 106 (25.2%) | 0 (0.0%) |
| $100,000 to $149,999 | 70 (16.6%) | 0 (0.0%) |
| $150,000 or more | 87 (20.7%) | 0 (0.0%) |
| Total | 421 (100.0%) | 0 (0.0%) |
Monthly Housing Cost Tiers in Emerald Bay
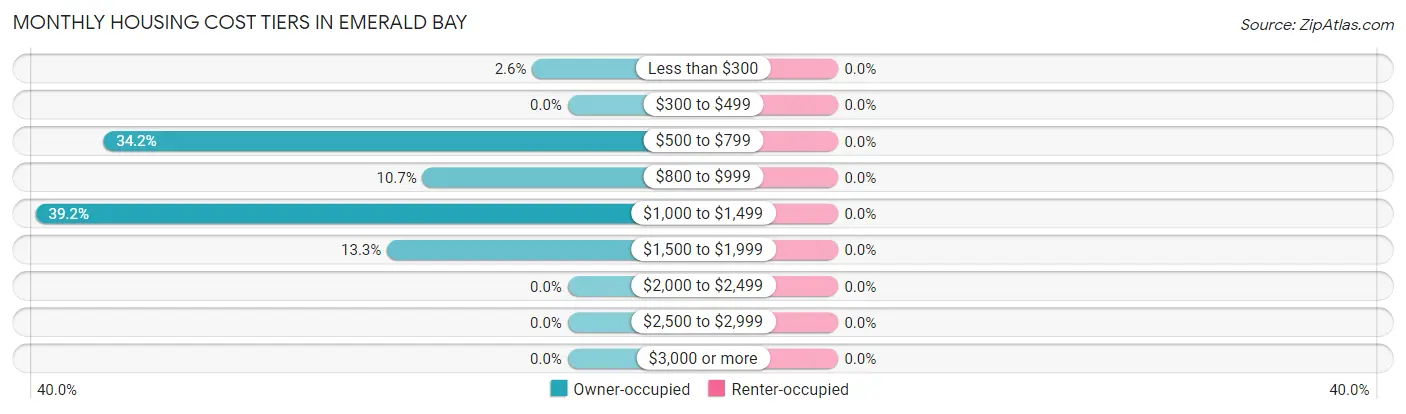
| Monthly Cost | Owner-occupied | Renter-occupied |
| Less than $300 | 11 (2.6%) | 0 (0.0%) |
| $300 to $499 | 0 (0.0%) | 0 (0.0%) |
| $500 to $799 | 144 (34.2%) | 0 (0.0%) |
| $800 to $999 | 45 (10.7%) | 0 (0.0%) |
| $1,000 to $1,499 | 165 (39.2%) | 0 (0.0%) |
| $1,500 to $1,999 | 56 (13.3%) | 0 (0.0%) |
| $2,000 to $2,499 | 0 (0.0%) | 0 (0.0%) |
| $2,500 to $2,999 | 0 (0.0%) | 0 (0.0%) |
| $3,000 or more | 0 (0.0%) | 0 (0.0%) |
| Total | 421 (100.0%) | 0 (0.0%) |
Physical Housing Characteristics in Emerald Bay
Housing Structures in Emerald Bay
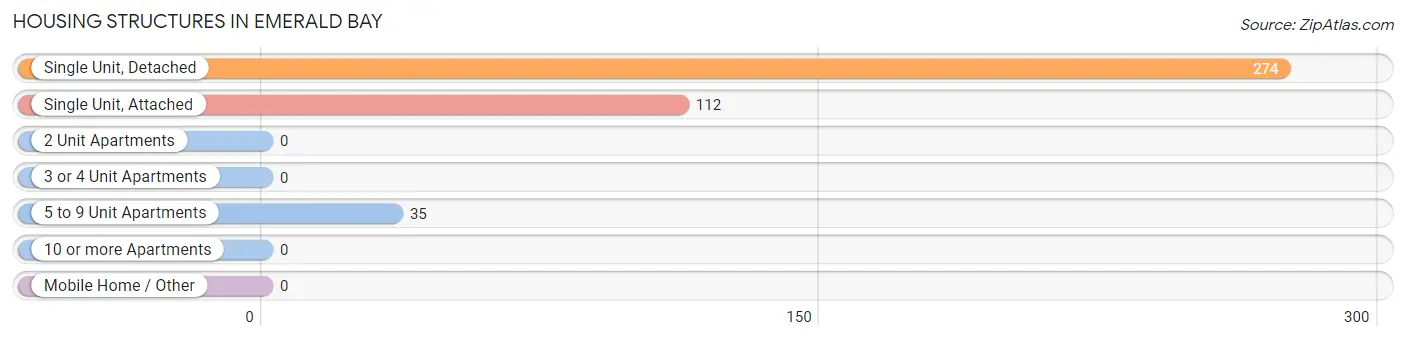
| Structure Type | # Housing Units | % Housing Units |
| Single Unit, Detached | 274 | 65.1% |
| Single Unit, Attached | 112 | 26.6% |
| 2 Unit Apartments | 0 | 0.0% |
| 3 or 4 Unit Apartments | 0 | 0.0% |
| 5 to 9 Unit Apartments | 35 | 8.3% |
| 10 or more Apartments | 0 | 0.0% |
| Mobile Home / Other | 0 | 0.0% |
| Total | 421 | 100.0% |
Housing Structures by Occupancy in Emerald Bay
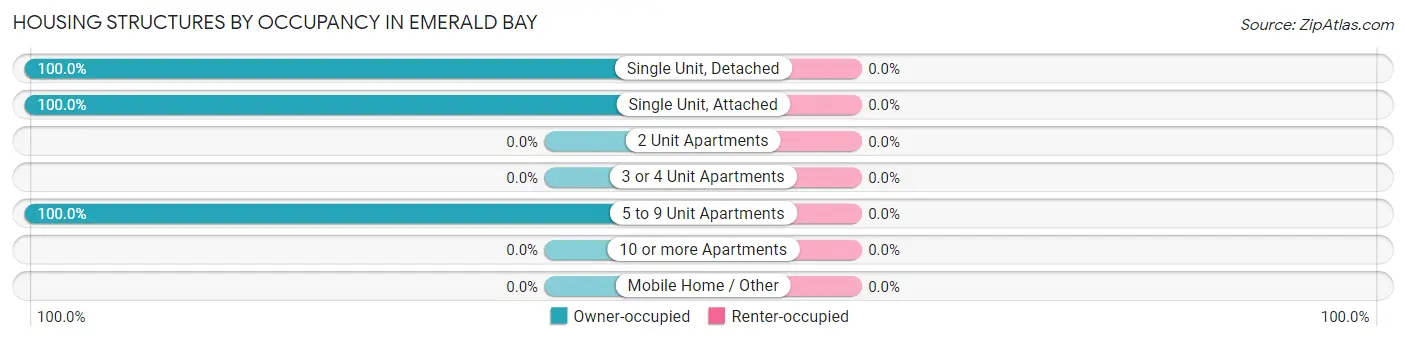
| Structure Type | Owner-occupied | Renter-occupied |
| Single Unit, Detached | 274 (100.0%) | 0 (0.0%) |
| Single Unit, Attached | 112 (100.0%) | 0 (0.0%) |
| 2 Unit Apartments | 0 (0.0%) | 0 (0.0%) |
| 3 or 4 Unit Apartments | 0 (0.0%) | 0 (0.0%) |
| 5 to 9 Unit Apartments | 35 (100.0%) | 0 (0.0%) |
| 10 or more Apartments | 0 (0.0%) | 0 (0.0%) |
| Mobile Home / Other | 0 (0.0%) | 0 (0.0%) |
| Total | 421 (100.0%) | 0 (0.0%) |
Housing Structures by Number of Rooms in Emerald Bay
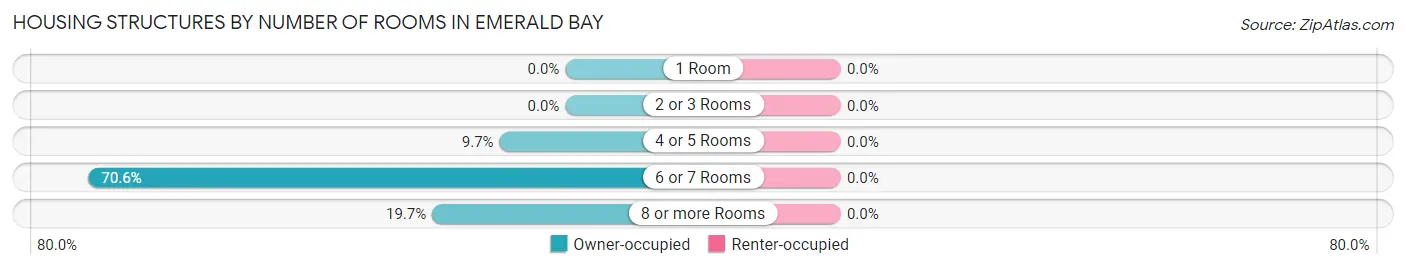
| Number of Rooms | Owner-occupied | Renter-occupied |
| 1 Room | 0 (0.0%) | 0 (0.0%) |
| 2 or 3 Rooms | 0 (0.0%) | 0 (0.0%) |
| 4 or 5 Rooms | 41 (9.7%) | 0 (0.0%) |
| 6 or 7 Rooms | 297 (70.6%) | 0 (0.0%) |
| 8 or more Rooms | 83 (19.7%) | 0 (0.0%) |
| Total | 421 (100.0%) | 0 (0.0%) |
Housing Structure by Heating Type in Emerald Bay
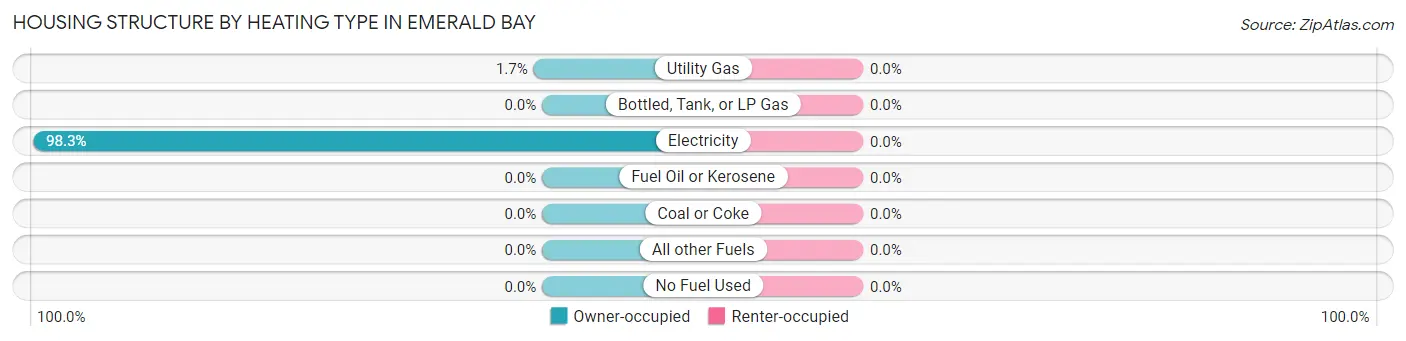
| Heating Type | Owner-occupied | Renter-occupied |
| Utility Gas | 7 (1.7%) | 0 (0.0%) |
| Bottled, Tank, or LP Gas | 0 (0.0%) | 0 (0.0%) |
| Electricity | 414 (98.3%) | 0 (0.0%) |
| Fuel Oil or Kerosene | 0 (0.0%) | 0 (0.0%) |
| Coal or Coke | 0 (0.0%) | 0 (0.0%) |
| All other Fuels | 0 (0.0%) | 0 (0.0%) |
| No Fuel Used | 0 (0.0%) | 0 (0.0%) |
| Total | 421 (100.0%) | 0 (0.0%) |
Household Vehicle Usage in Emerald Bay
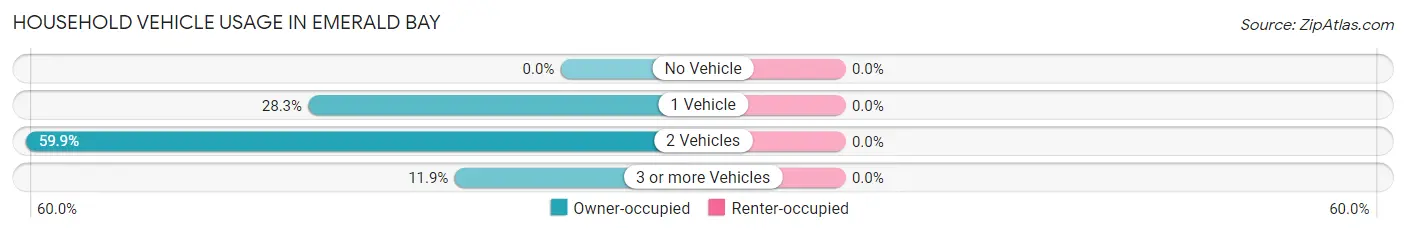
| Vehicles per Household | Owner-occupied | Renter-occupied |
| No Vehicle | 0 (0.0%) | 0 (0.0%) |
| 1 Vehicle | 119 (28.3%) | 0 (0.0%) |
| 2 Vehicles | 252 (59.9%) | 0 (0.0%) |
| 3 or more Vehicles | 50 (11.9%) | 0 (0.0%) |
| Total | 421 (100.0%) | 0 (0.0%) |
Real Estate & Mortgages in Emerald Bay
Real Estate and Mortgage Overview in Emerald Bay
| Characteristic | Without Mortgage | With Mortgage |
| Housing Units | 287 | 134 |
| Median Property Value | $273,900 | $195,400 |
| Median Household Income | $85,223 | $63 |
| Monthly Housing Costs | $793 | $0 |
| Real Estate Taxes | $3,947 | $0 |
Property Value by Mortgage Status in Emerald Bay
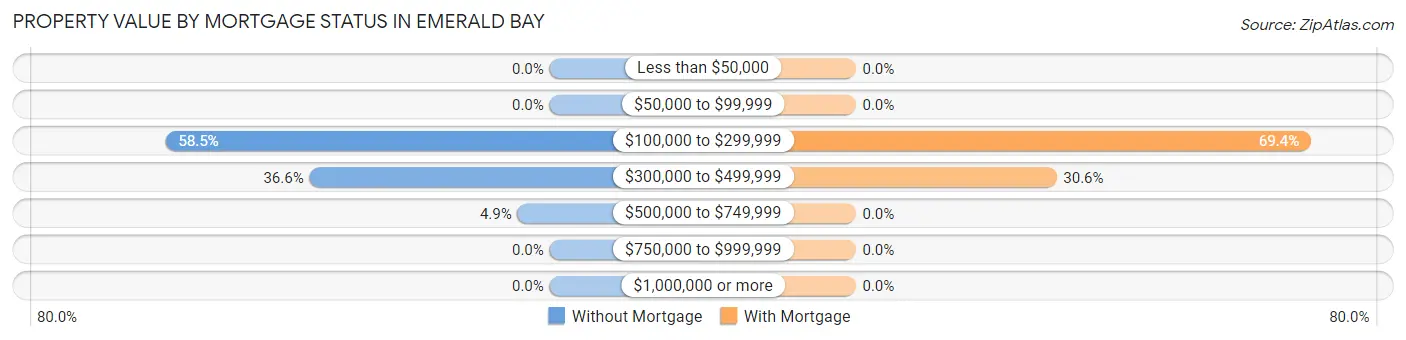
| Property Value | Without Mortgage | With Mortgage |
| Less than $50,000 | 0 (0.0%) | 0 (0.0%) |
| $50,000 to $99,999 | 0 (0.0%) | 0 (0.0%) |
| $100,000 to $299,999 | 168 (58.5%) | 93 (69.4%) |
| $300,000 to $499,999 | 105 (36.6%) | 41 (30.6%) |
| $500,000 to $749,999 | 14 (4.9%) | 0 (0.0%) |
| $750,000 to $999,999 | 0 (0.0%) | 0 (0.0%) |
| $1,000,000 or more | 0 (0.0%) | 0 (0.0%) |
| Total | 287 (100.0%) | 134 (100.0%) |
Household Income by Mortgage Status in Emerald Bay
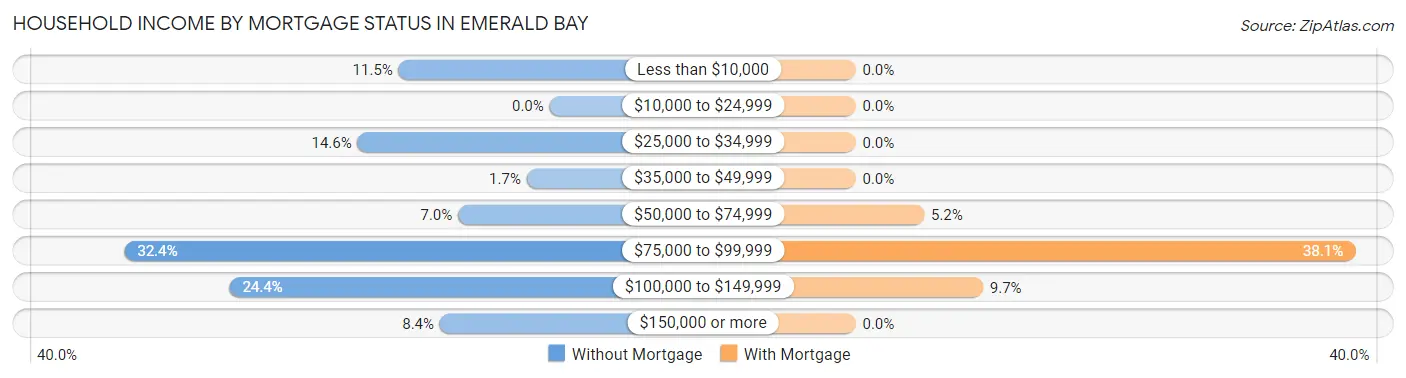
| Household Income | Without Mortgage | With Mortgage |
| Less than $10,000 | 33 (11.5%) | 0 (0.0%) |
| $10,000 to $24,999 | 0 (0.0%) | 0 (0.0%) |
| $25,000 to $34,999 | 42 (14.6%) | 0 (0.0%) |
| $35,000 to $49,999 | 5 (1.7%) | 0 (0.0%) |
| $50,000 to $74,999 | 20 (7.0%) | 7 (5.2%) |
| $75,000 to $99,999 | 93 (32.4%) | 51 (38.1%) |
| $100,000 to $149,999 | 70 (24.4%) | 13 (9.7%) |
| $150,000 or more | 24 (8.4%) | 0 (0.0%) |
| Total | 287 (100.0%) | 134 (100.0%) |
Property Value to Household Income Ratio in Emerald Bay
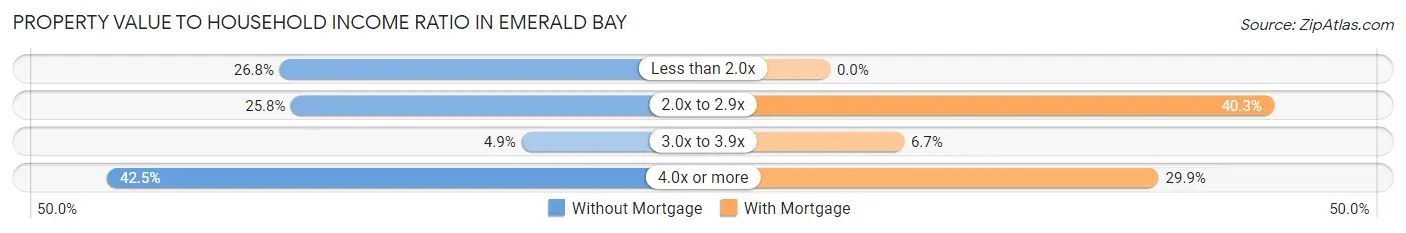
| Value-to-Income Ratio | Without Mortgage | With Mortgage |
| Less than 2.0x | 77 (26.8%) | 0 (0.0%) |
| 2.0x to 2.9x | 74 (25.8%) | 54 (40.3%) |
| 3.0x to 3.9x | 14 (4.9%) | 9 (6.7%) |
| 4.0x or more | 122 (42.5%) | 40 (29.8%) |
| Total | 287 (100.0%) | 134 (100.0%) |
Real Estate Taxes by Mortgage Status in Emerald Bay
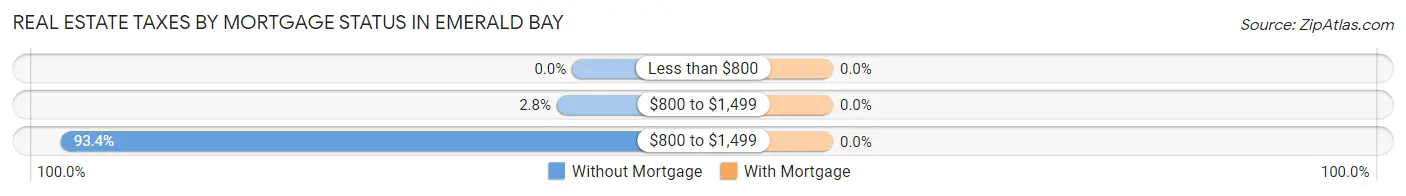
| Property Taxes | Without Mortgage | With Mortgage |
| Less than $800 | 0 (0.0%) | 0 (0.0%) |
| $800 to $1,499 | 8 (2.8%) | 0 (0.0%) |
| $800 to $1,499 | 268 (93.4%) | 0 (0.0%) |
| Total | 287 (100.0%) | 134 (100.0%) |
Health & Disability in Emerald Bay
Health Insurance Coverage by Age in Emerald Bay
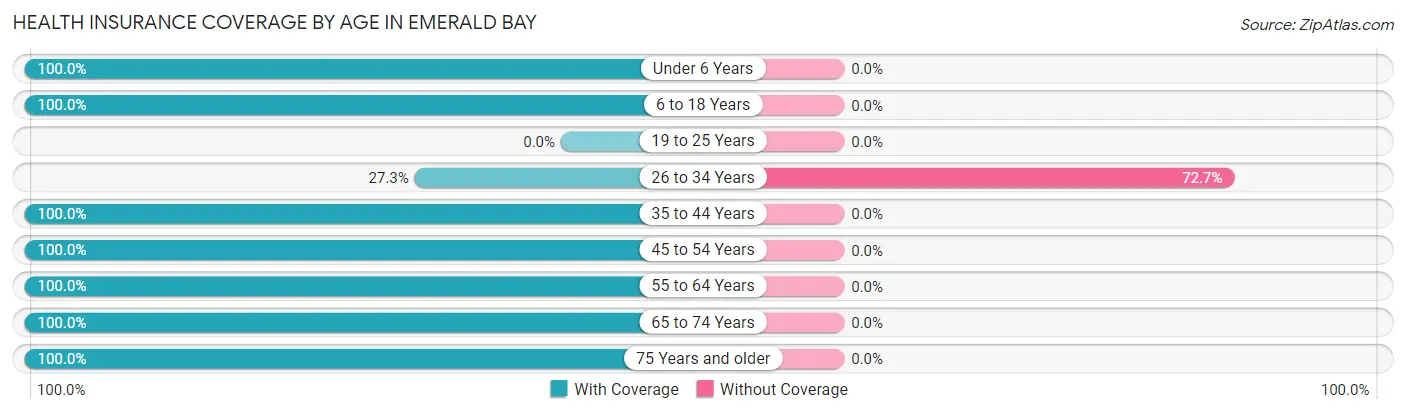
| Age Bracket | With Coverage | Without Coverage |
| Under 6 Years | 65 (100.0%) | 0 (0.0%) |
| 6 to 18 Years | 88 (100.0%) | 0 (0.0%) |
| 19 to 25 Years | 0 (0.0%) | 0 (0.0%) |
| 26 to 34 Years | 27 (27.3%) | 72 (72.7%) |
| 35 to 44 Years | 18 (100.0%) | 0 (0.0%) |
| 45 to 54 Years | 38 (100.0%) | 0 (0.0%) |
| 55 to 64 Years | 107 (100.0%) | 0 (0.0%) |
| 65 to 74 Years | 257 (100.0%) | 0 (0.0%) |
| 75 Years and older | 297 (100.0%) | 0 (0.0%) |
| Total | 897 (92.6%) | 72 (7.4%) |
Health Insurance Coverage by Citizenship Status in Emerald Bay
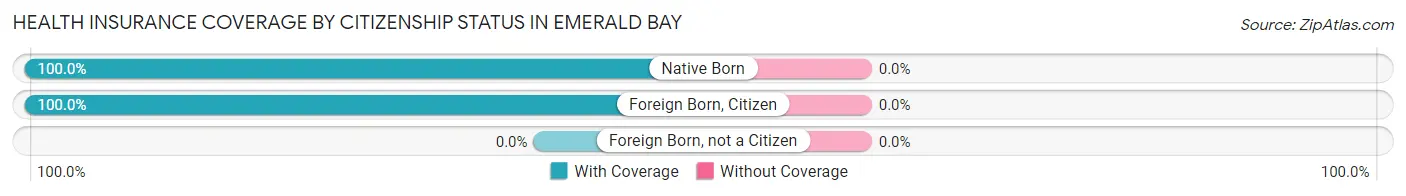
| Citizenship Status | With Coverage | Without Coverage |
| Native Born | 65 (100.0%) | 0 (0.0%) |
| Foreign Born, Citizen | 88 (100.0%) | 0 (0.0%) |
| Foreign Born, not a Citizen | 0 (0.0%) | 0 (0.0%) |
Health Insurance Coverage by Household Income in Emerald Bay
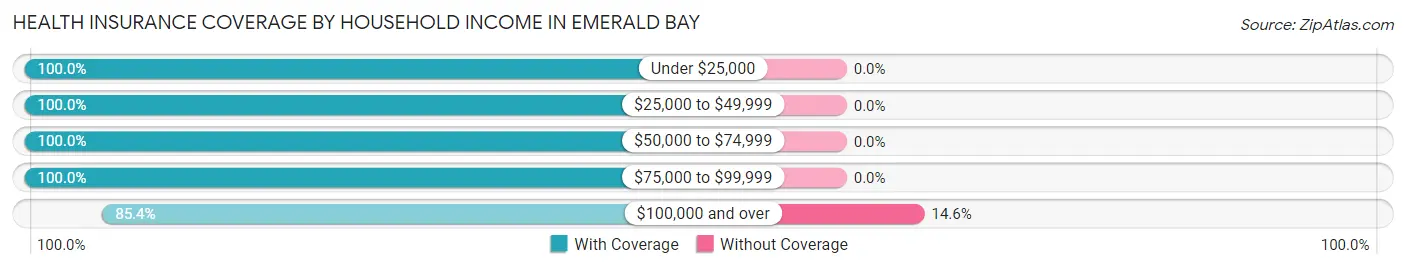
| Household Income | With Coverage | Without Coverage |
| Under $25,000 | 33 (100.0%) | 0 (0.0%) |
| $25,000 to $49,999 | 67 (100.0%) | 0 (0.0%) |
| $50,000 to $74,999 | 174 (100.0%) | 0 (0.0%) |
| $75,000 to $99,999 | 201 (100.0%) | 0 (0.0%) |
| $100,000 and over | 422 (85.4%) | 72 (14.6%) |
Public vs Private Health Insurance Coverage by Age in Emerald Bay
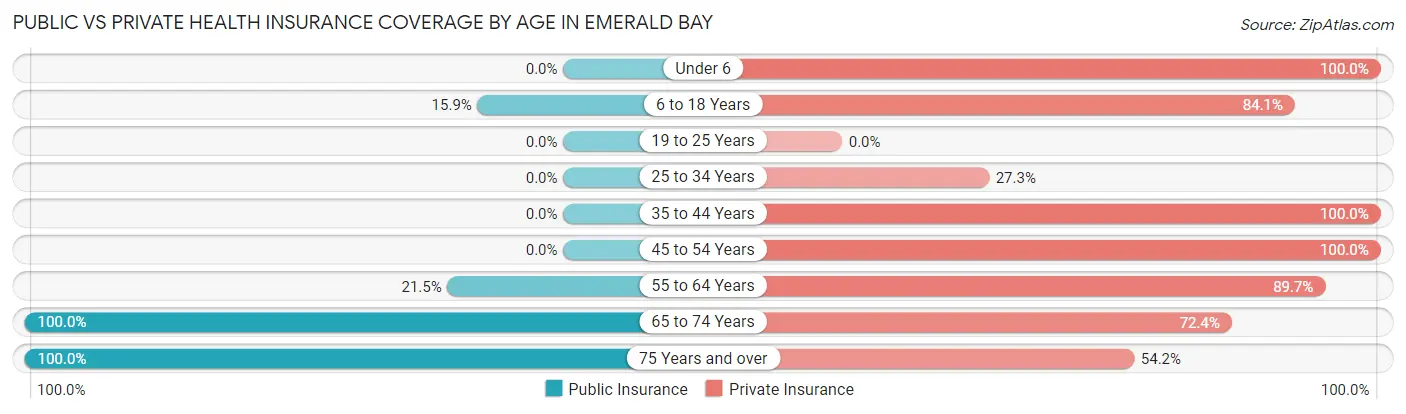
| Age Bracket | Public Insurance | Private Insurance |
| Under 6 | 0 (0.0%) | 65 (100.0%) |
| 6 to 18 Years | 14 (15.9%) | 74 (84.1%) |
| 19 to 25 Years | 0 (0.0%) | 0 (0.0%) |
| 25 to 34 Years | 0 (0.0%) | 27 (27.3%) |
| 35 to 44 Years | 0 (0.0%) | 18 (100.0%) |
| 45 to 54 Years | 0 (0.0%) | 38 (100.0%) |
| 55 to 64 Years | 23 (21.5%) | 96 (89.7%) |
| 65 to 74 Years | 257 (100.0%) | 186 (72.4%) |
| 75 Years and over | 297 (100.0%) | 161 (54.2%) |
| Total | 591 (61.0%) | 665 (68.6%) |
Disability Status by Sex by Age in Emerald Bay
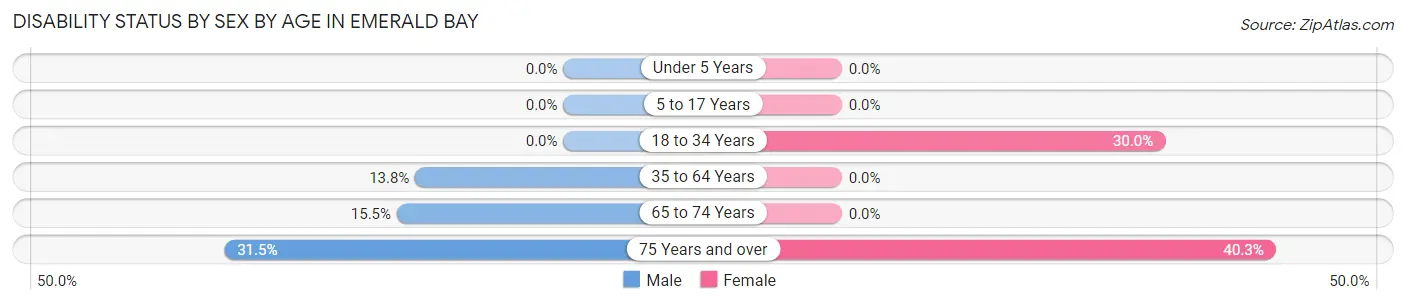
| Age Bracket | Male | Female |
| Under 5 Years | 0 (0.0%) | 0 (0.0%) |
| 5 to 17 Years | 0 (0.0%) | 0 (0.0%) |
| 18 to 34 Years | 0 (0.0%) | 27 (30.0%) |
| 35 to 64 Years | 11 (13.8%) | 0 (0.0%) |
| 65 to 74 Years | 19 (15.4%) | 0 (0.0%) |
| 75 Years and over | 45 (31.5%) | 62 (40.3%) |
Disability Class by Sex by Age in Emerald Bay
Disability Class: Hearing Difficulty
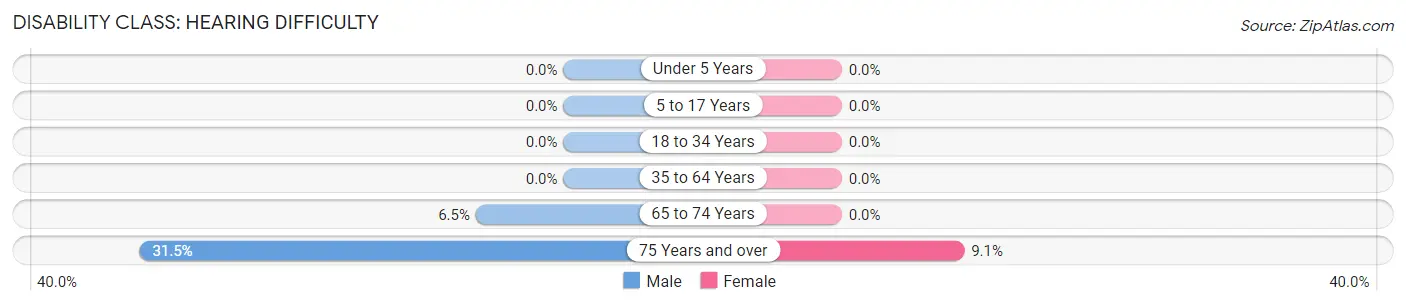
| Age Bracket | Male | Female |
| Under 5 Years | 0 (0.0%) | 0 (0.0%) |
| 5 to 17 Years | 0 (0.0%) | 0 (0.0%) |
| 18 to 34 Years | 0 (0.0%) | 0 (0.0%) |
| 35 to 64 Years | 0 (0.0%) | 0 (0.0%) |
| 65 to 74 Years | 8 (6.5%) | 0 (0.0%) |
| 75 Years and over | 45 (31.5%) | 14 (9.1%) |
Disability Class: Vision Difficulty
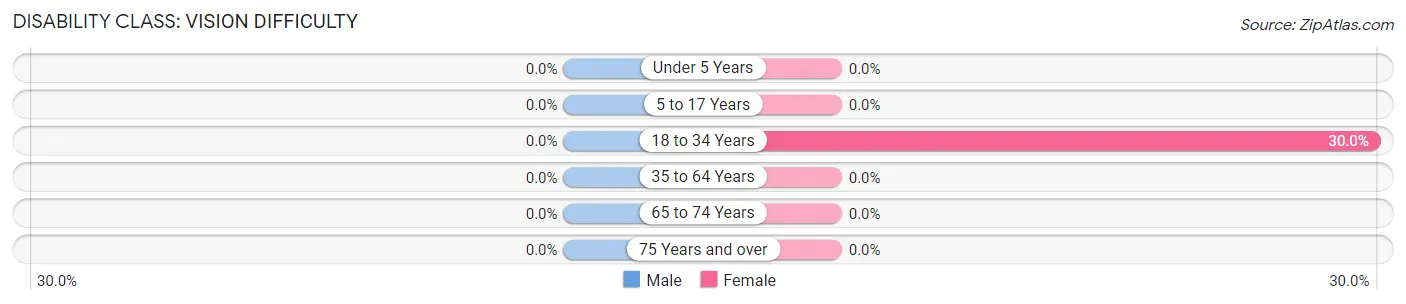
| Age Bracket | Male | Female |
| Under 5 Years | 0 (0.0%) | 0 (0.0%) |
| 5 to 17 Years | 0 (0.0%) | 0 (0.0%) |
| 18 to 34 Years | 0 (0.0%) | 27 (30.0%) |
| 35 to 64 Years | 0 (0.0%) | 0 (0.0%) |
| 65 to 74 Years | 0 (0.0%) | 0 (0.0%) |
| 75 Years and over | 0 (0.0%) | 0 (0.0%) |
Disability Class: Cognitive Difficulty
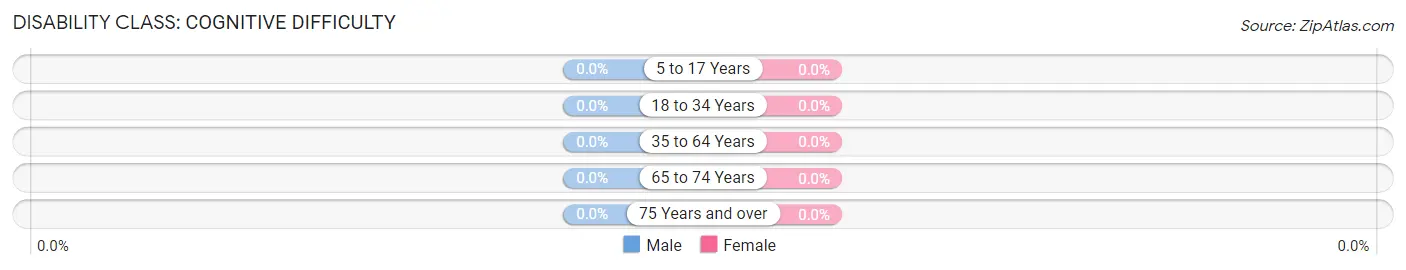
| Age Bracket | Male | Female |
| 5 to 17 Years | 0 (0.0%) | 0 (0.0%) |
| 18 to 34 Years | 0 (0.0%) | 0 (0.0%) |
| 35 to 64 Years | 0 (0.0%) | 0 (0.0%) |
| 65 to 74 Years | 0 (0.0%) | 0 (0.0%) |
| 75 Years and over | 0 (0.0%) | 0 (0.0%) |
Disability Class: Ambulatory Difficulty
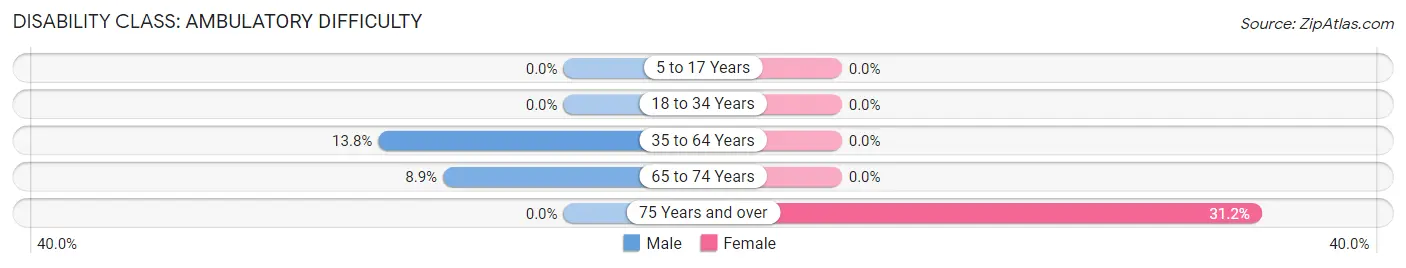
| Age Bracket | Male | Female |
| 5 to 17 Years | 0 (0.0%) | 0 (0.0%) |
| 18 to 34 Years | 0 (0.0%) | 0 (0.0%) |
| 35 to 64 Years | 11 (13.8%) | 0 (0.0%) |
| 65 to 74 Years | 11 (8.9%) | 0 (0.0%) |
| 75 Years and over | 0 (0.0%) | 48 (31.2%) |
Disability Class: Self-Care Difficulty
| Age Bracket | Male | Female |
| 5 to 17 Years | 0 (0.0%) | 0 (0.0%) |
| 18 to 34 Years | 0 (0.0%) | 0 (0.0%) |
| 35 to 64 Years | 0 (0.0%) | 0 (0.0%) |
| 65 to 74 Years | 0 (0.0%) | 0 (0.0%) |
| 75 Years and over | 0 (0.0%) | 0 (0.0%) |
Technology Access in Emerald Bay
Computing Device Access in Emerald Bay
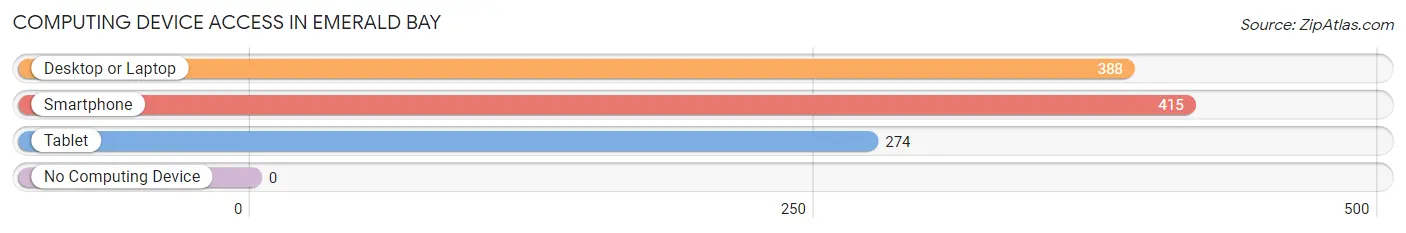
| Device Type | # Households | % Households |
| Desktop or Laptop | 388 | 92.2% |
| Smartphone | 415 | 98.6% |
| Tablet | 274 | 65.1% |
| No Computing Device | 0 | 0.0% |
| Total | 421 | 100.0% |
Internet Access in Emerald Bay
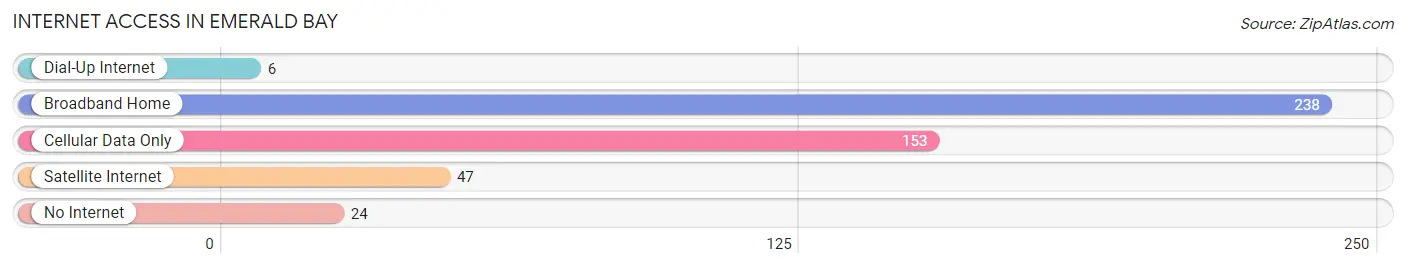
| Internet Type | # Households | % Households |
| Dial-Up Internet | 6 | 1.4% |
| Broadband Home | 238 | 56.5% |
| Cellular Data Only | 153 | 36.3% |
| Satellite Internet | 47 | 11.2% |
| No Internet | 24 | 5.7% |
| Total | 421 | 100.0% |
Emerald Bay Summary
Emerald Bay, Texas is a small town located in Galveston County, Texas. It is situated on the western shore of Galveston Bay, approximately 25 miles south of Houston. The town was founded in the late 1800s and has a population of approximately 1,500 people.
History
The area that is now Emerald Bay was originally inhabited by the Karankawa Indians. The first European settlers arrived in the area in the late 1800s and established a small fishing village. The town was originally called “Fisherman’s Point” and was later renamed “Emerald Bay” in the early 1900s.
The town was a popular destination for tourists and fishermen alike. In the early 1900s, the town was home to a number of resorts, including the Emerald Bay Hotel and the Emerald Bay Yacht Club. The town also had a number of restaurants, stores, and other businesses.
In the 1950s, the town began to decline as the popularity of the area decreased. The resorts and businesses closed and the population began to dwindle. In the late 1970s, the town was revitalized when the Galveston Bay Foundation purchased the land and began to develop it into a residential community.
Geography
Emerald Bay is located on the western shore of Galveston Bay, approximately 25 miles south of Houston. The town is situated on a peninsula that is surrounded by the bay on three sides. The town is bordered by the cities of La Marque and Texas City to the north and east, respectively.
The town is located in a humid subtropical climate zone and experiences hot, humid summers and mild winters. The average temperature in the summer is around 90 degrees Fahrenheit and the average temperature in the winter is around 60 degrees Fahrenheit.
Economy
The economy of Emerald Bay is largely based on tourism and fishing. The town is home to a number of resorts, restaurants, and other businesses that cater to tourists and fishermen. The town also has a number of marinas and boat ramps that are used by fishermen and recreational boaters.
The town is also home to a number of manufacturing and industrial businesses. These businesses include a chemical plant, a paper mill, and a steel mill.
Demographics
As of the 2010 census, the population of Emerald Bay was 1,500 people. The racial makeup of the town was 79.3% White, 15.3% Hispanic or Latino, 2.7% African American, and 2.7% other. The median household income was $45,000 and the median home value was $150,000.
The town is served by the Galveston County School District. The town has one elementary school, one middle school, and one high school. The town also has a number of private schools.
Conclusion
Emerald Bay, Texas is a small town located on the western shore of Galveston Bay, approximately 25 miles south of Houston. The town was founded in the late 1800s and has a population of approximately 1,500 people. The economy of the town is largely based on tourism and fishing, and the town is home to a number of resorts, restaurants, and other businesses. The town is served by the Galveston County School District and has a number of private schools.
Common Questions
What is Per Capita Income in Emerald Bay?
Per Capita income in Emerald Bay is $42,141.
What is the Median Family Income in Emerald Bay?
Median Family Income in Emerald Bay is $94,808.
What is the Median Household income in Emerald Bay?
Median Household Income in Emerald Bay is $86,027.
What is Inequality or Gini Index in Emerald Bay?
Inequality or Gini Index in Emerald Bay is 0.34.
What is the Total Population of Emerald Bay?
Total Population of Emerald Bay is 969.
What is the Total Male Population of Emerald Bay?
Total Male Population of Emerald Bay is 431.
What is the Total Female Population of Emerald Bay?
Total Female Population of Emerald Bay is 538.
What is the Ratio of Males per 100 Females in Emerald Bay?
There are 80.11 Males per 100 Females in Emerald Bay.
What is the Ratio of Females per 100 Males in Emerald Bay?
There are 124.83 Females per 100 Males in Emerald Bay.
What is the Median Population Age in Emerald Bay?
Median Population Age in Emerald Bay is 67.1 Years.
What is the Average Family Size in Emerald Bay
Average Family Size in Emerald Bay is 2.7 People.
What is the Average Household Size in Emerald Bay
Average Household Size in Emerald Bay is 2.3 People.
How Large is the Labor Force in Emerald Bay?
There are 250 People in the Labor Forcein in Emerald Bay.
What is the Percentage of People in the Labor Force in Emerald Bay?
30.6% of People are in the Labor Force in Emerald Bay.
What is the Unemployment Rate in Emerald Bay?
Unemployment Rate in Emerald Bay is 4.4%.