Wilson, TX Map & Demographics
Wilson Map
Wilson Overview
$17,871
PER CAPITA INCOME
$42,708
AVG FAMILY INCOME
$37,500
AVG HOUSEHOLD INCOME
30.5%
WAGE / INCOME GAP [ % ]
69.5¢/ $1
WAGE / INCOME GAP [ $ ]
$8,140
FAMILY INCOME DEFICIT
0.47
INEQUALITY / GINI INDEX
451
TOTAL POPULATION
215
MALE POPULATION
236
FEMALE POPULATION
91.10
MALES / 100 FEMALES
109.77
FEMALES / 100 MALES
24.5
MEDIAN AGE
3.5
AVG FAMILY SIZE
2.8
AVG HOUSEHOLD SIZE
154
LABOR FORCE [ PEOPLE ]
52.6%
PERCENT IN LABOR FORCE
2.0%
UNEMPLOYMENT RATE
Wilson Zip Codes
Wilson Area Codes
Income in Wilson
Income Overview in Wilson
Per Capita Income in Wilson is $17,871, while median incomes of families and households are $42,708 and $37,500 respectively.
| Characteristic | Number | Measure |
| Per Capita Income | 451 | $17,871 |
| Median Family Income | 107 | $42,708 |
| Mean Family Income | 107 | $61,797 |
| Median Household Income | 160 | $37,500 |
| Mean Household Income | 160 | $52,476 |
| Income Deficit | 107 | $8,140 |
| Wage / Income Gap (%) | 451 | 30.46% |
| Wage / Income Gap ($) | 451 | 69.54¢ per $1 |
| Gini / Inequality Index | 451 | 0.47 |
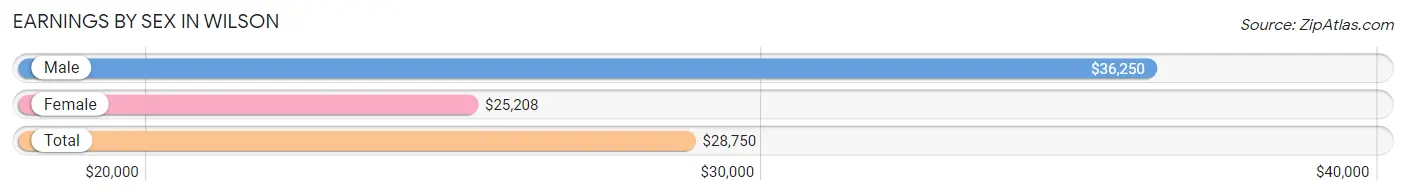
Earnings by Sex in Wilson
Average Earnings in Wilson are $28,750, $36,250 for men and $25,208 for women, a difference of 30.5%.
| Sex | Number | Average Earnings |
| Male | 98 (63.6%) | $36,250 |
| Female | 56 (36.4%) | $25,208 |
| Total | 154 (100.0%) | $28,750 |
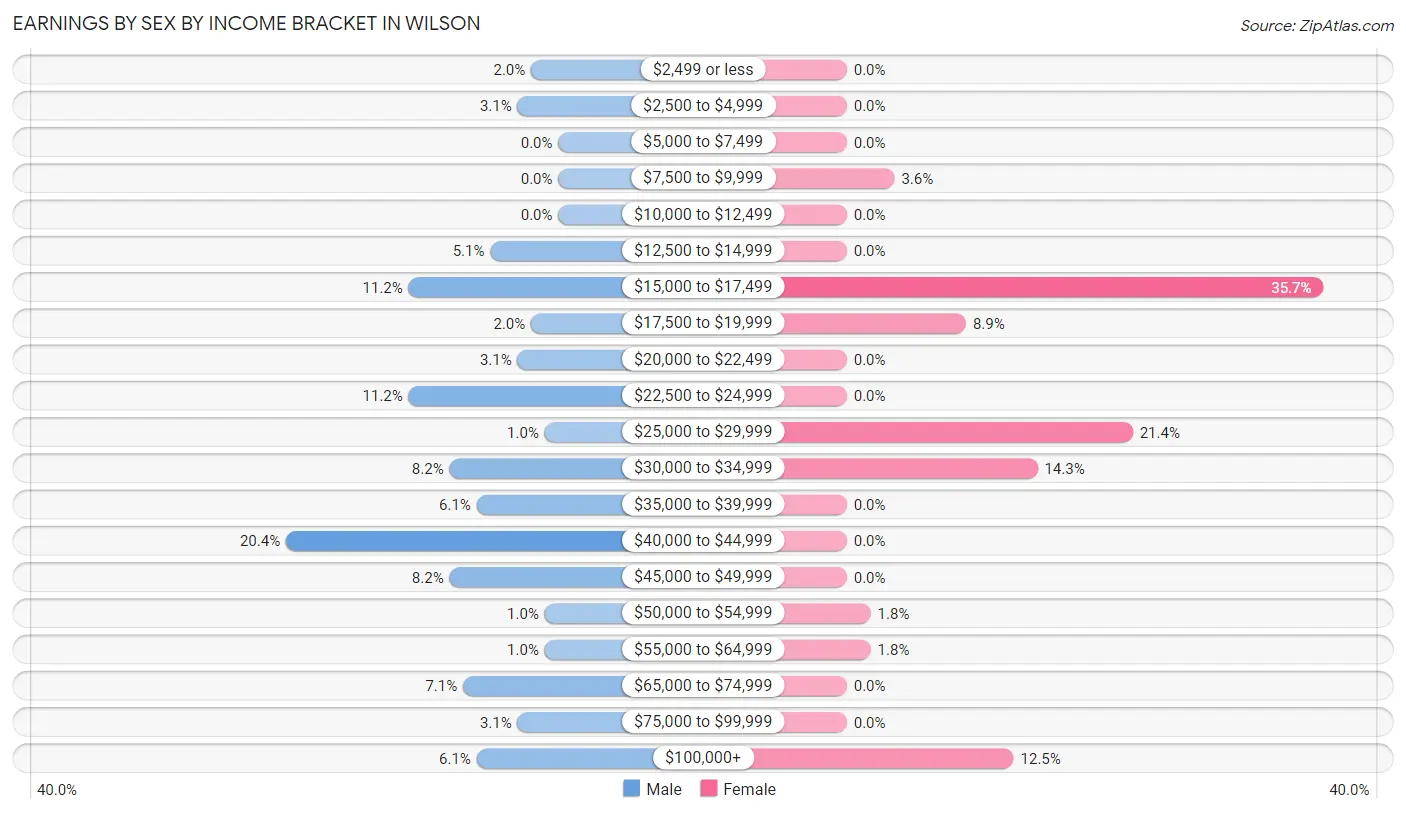
Earnings by Sex by Income Bracket in Wilson
The most common earnings brackets in Wilson are $40,000 to $44,999 for men (20 | 20.4%) and $15,000 to $17,499 for women (20 | 35.7%).
| Income | Male | Female |
| $2,499 or less | 2 (2.0%) | 0 (0.0%) |
| $2,500 to $4,999 | 3 (3.1%) | 0 (0.0%) |
| $5,000 to $7,499 | 0 (0.0%) | 0 (0.0%) |
| $7,500 to $9,999 | 0 (0.0%) | 2 (3.6%) |
| $10,000 to $12,499 | 0 (0.0%) | 0 (0.0%) |
| $12,500 to $14,999 | 5 (5.1%) | 0 (0.0%) |
| $15,000 to $17,499 | 11 (11.2%) | 20 (35.7%) |
| $17,500 to $19,999 | 2 (2.0%) | 5 (8.9%) |
| $20,000 to $22,499 | 3 (3.1%) | 0 (0.0%) |
| $22,500 to $24,999 | 11 (11.2%) | 0 (0.0%) |
| $25,000 to $29,999 | 1 (1.0%) | 12 (21.4%) |
| $30,000 to $34,999 | 8 (8.2%) | 8 (14.3%) |
| $35,000 to $39,999 | 6 (6.1%) | 0 (0.0%) |
| $40,000 to $44,999 | 20 (20.4%) | 0 (0.0%) |
| $45,000 to $49,999 | 8 (8.2%) | 0 (0.0%) |
| $50,000 to $54,999 | 1 (1.0%) | 1 (1.8%) |
| $55,000 to $64,999 | 1 (1.0%) | 1 (1.8%) |
| $65,000 to $74,999 | 7 (7.1%) | 0 (0.0%) |
| $75,000 to $99,999 | 3 (3.1%) | 0 (0.0%) |
| $100,000+ | 6 (6.1%) | 7 (12.5%) |
| Total | 98 (100.0%) | 56 (100.0%) |
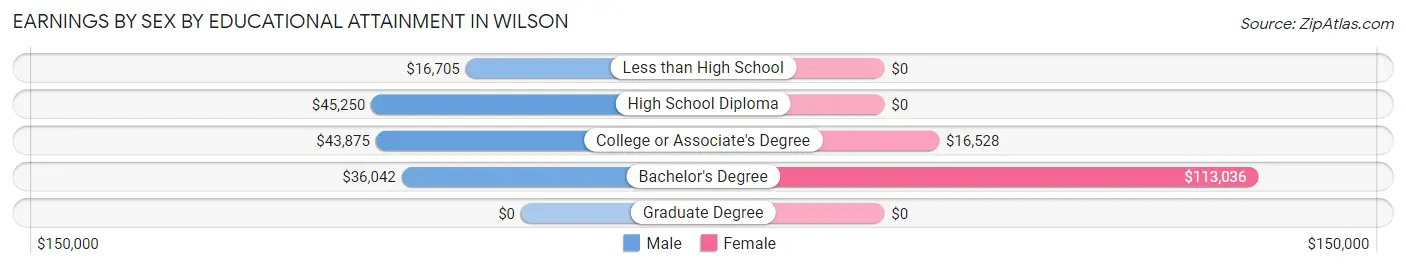
Earnings by Sex by Educational Attainment in Wilson
Average earnings in Wilson are $41,000 for men and $25,833 for women, a difference of 37.0%. Men with an educational attainment of high school diploma enjoy the highest average annual earnings of $45,250, while those with less than high school education earn the least with $16,705. Women with an educational attainment of bachelor's degree earn the most with the average annual earnings of $113,036, while those with college or associate's degree education have the smallest earnings of $16,528.
| Educational Attainment | Male Income | Female Income |
| Less than High School | $16,705 | $0 |
| High School Diploma | $45,250 | $0 |
| College or Associate's Degree | $43,875 | $16,528 |
| Bachelor's Degree | $36,042 | $113,036 |
| Graduate Degree | - | - |
| Total | $41,000 | $25,833 |
Family Income in Wilson
Family Income Brackets in Wilson
According to the Wilson family income data, there are 23 families falling into the $15,000 to $24,999 income range, which is the most common income bracket and makes up 21.5% of all families.
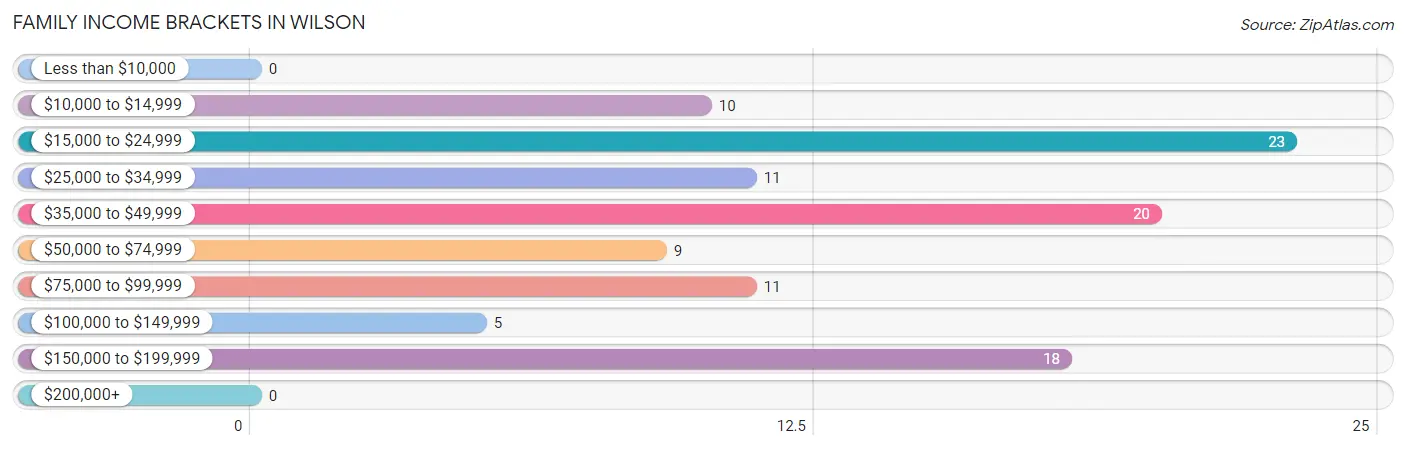
| Income Bracket | # Families | % Families |
| Less than $10,000 | 0 | 0.0% |
| $10,000 to $14,999 | 10 | 9.3% |
| $15,000 to $24,999 | 23 | 21.5% |
| $25,000 to $34,999 | 11 | 10.3% |
| $35,000 to $49,999 | 20 | 18.7% |
| $50,000 to $74,999 | 9 | 8.4% |
| $75,000 to $99,999 | 11 | 10.3% |
| $100,000 to $149,999 | 5 | 4.7% |
| $150,000 to $199,999 | 18 | 16.8% |
| $200,000+ | 0 | 0.0% |
Family Income by Famaliy Size in Wilson
2-person families (30 | 28.0%) account for the highest median family income in Wilson with $93,750 per family, while 2-person families (30 | 28.0%) have the highest median income of $46,875 per family member.
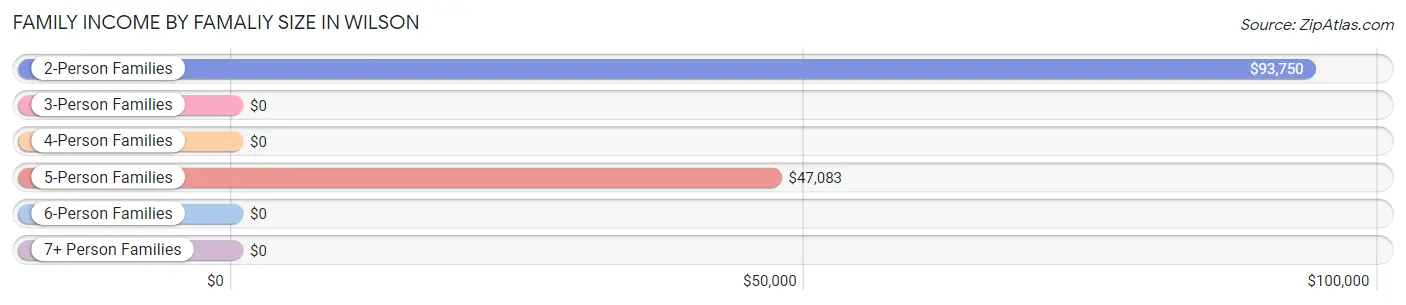
| Income Bracket | # Families | Median Income |
| 2-Person Families | 30 (28.0%) | $93,750 |
| 3-Person Families | 52 (48.6%) | $0 |
| 4-Person Families | 14 (13.1%) | $0 |
| 5-Person Families | 5 (4.7%) | $47,083 |
| 6-Person Families | 6 (5.6%) | $0 |
| 7+ Person Families | 0 (0.0%) | $0 |
| Total | 107 (100.0%) | $42,708 |
Family Income by Number of Earners in Wilson
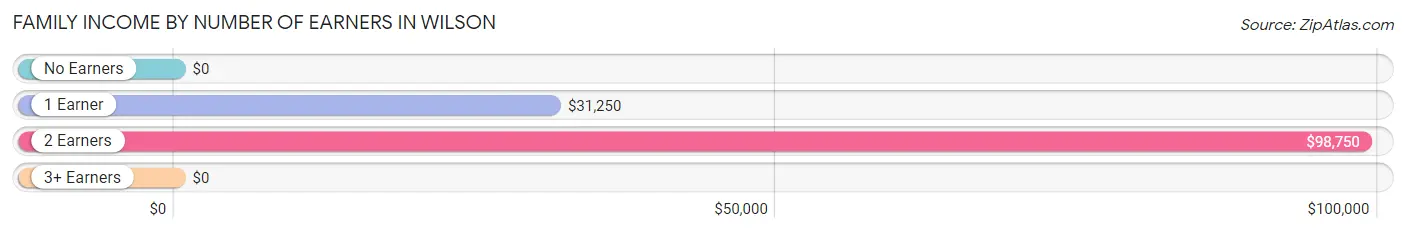
| Number of Earners | # Families | Median Income |
| No Earners | 16 (14.9%) | $0 |
| 1 Earner | 66 (61.7%) | $31,250 |
| 2 Earners | 24 (22.4%) | $98,750 |
| 3+ Earners | 1 (0.9%) | $0 |
| Total | 107 (100.0%) | $42,708 |
Household Income in Wilson
Household Income Brackets in Wilson
With 41 households falling in the category, the $35,000 to $49,999 income range is the most frequent in Wilson, accounting for 25.6% of all households.
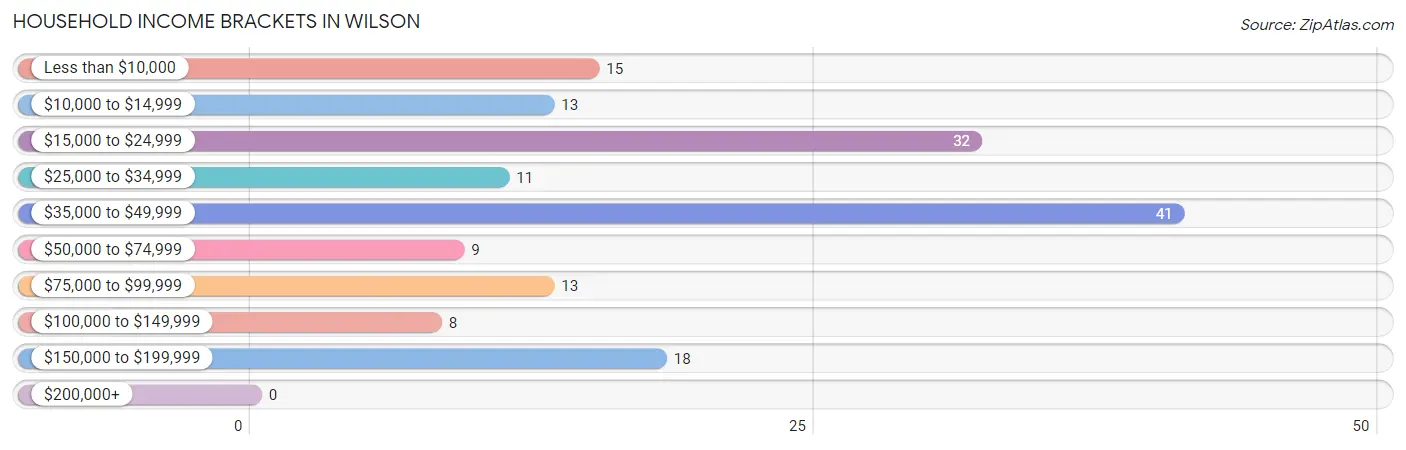
| Income Bracket | # Households | % Households |
| Less than $10,000 | 15 | 9.4% |
| $10,000 to $14,999 | 13 | 8.1% |
| $15,000 to $24,999 | 32 | 20.0% |
| $25,000 to $34,999 | 11 | 6.9% |
| $35,000 to $49,999 | 41 | 25.6% |
| $50,000 to $74,999 | 9 | 5.6% |
| $75,000 to $99,999 | 13 | 8.1% |
| $100,000 to $149,999 | 8 | 5.0% |
| $150,000 to $199,999 | 18 | 11.3% |
| $200,000+ | 0 | 0.0% |
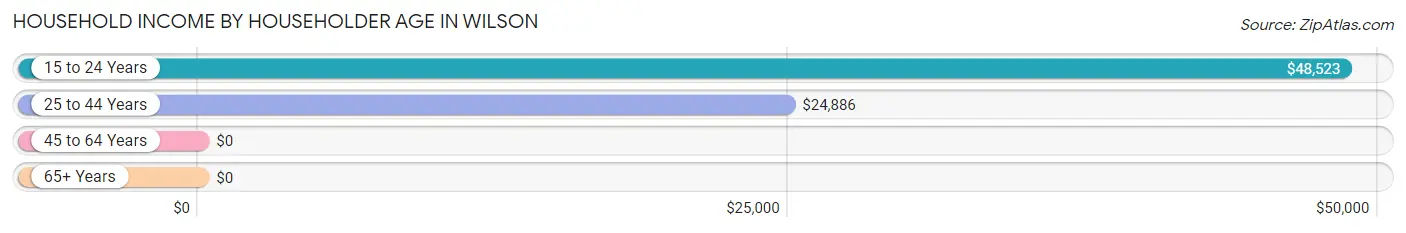
Household Income by Householder Age in Wilson
The median household income in Wilson is $37,500, with the highest median household income of $48,523 found in the 15 to 24 years age bracket for the primary householder. A total of 19 households (11.9%) fall into this category. Meanwhile, the 45 to 64 years age bracket for the primary householder has the lowest median household income of $0, with 53 households (33.1%) in this group.
| Income Bracket | # Households | Median Income |
| 15 to 24 Years | 19 (11.9%) | $48,523 |
| 25 to 44 Years | 41 (25.6%) | $24,886 |
| 45 to 64 Years | 53 (33.1%) | $0 |
| 65+ Years | 47 (29.4%) | $0 |
| Total | 160 (100.0%) | $37,500 |
Poverty in Wilson
Income Below Poverty by Sex and Age in Wilson
With 14.4% poverty level for males and 45.5% for females among the residents of Wilson, under 5 year old males and 12 to 14 year old females are the most vulnerable to poverty, with 16 males (45.7%) and 35 females (100.0%) in their respective age groups living below the poverty level.
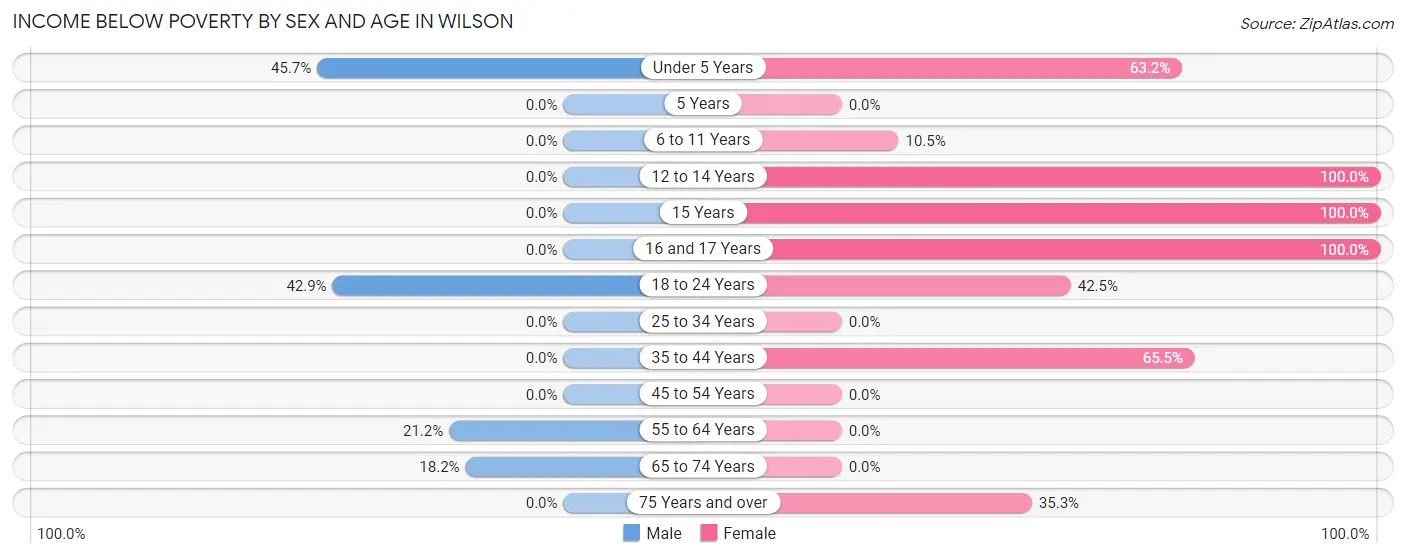
| Age Bracket | Male | Female |
| Under 5 Years | 16 (45.7%) | 12 (63.2%) |
| 5 Years | 0 (0.0%) | 0 (0.0%) |
| 6 to 11 Years | 0 (0.0%) | 2 (10.5%) |
| 12 to 14 Years | 0 (0.0%) | 35 (100.0%) |
| 15 Years | 0 (0.0%) | 6 (100.0%) |
| 16 and 17 Years | 0 (0.0%) | 10 (100.0%) |
| 18 to 24 Years | 6 (42.9%) | 17 (42.5%) |
| 25 to 34 Years | 0 (0.0%) | 0 (0.0%) |
| 35 to 44 Years | 0 (0.0%) | 19 (65.5%) |
| 45 to 54 Years | 0 (0.0%) | 0 (0.0%) |
| 55 to 64 Years | 7 (21.2%) | 0 (0.0%) |
| 65 to 74 Years | 2 (18.2%) | 0 (0.0%) |
| 75 Years and over | 0 (0.0%) | 6 (35.3%) |
| Total | 31 (14.4%) | 107 (45.5%) |
Income Above Poverty by Sex and Age in Wilson
According to the poverty statistics in Wilson, males aged 6 to 11 years and females aged 5 years are the age groups that are most secure financially, with 100.0% of males and 100.0% of females in these age groups living above the poverty line.
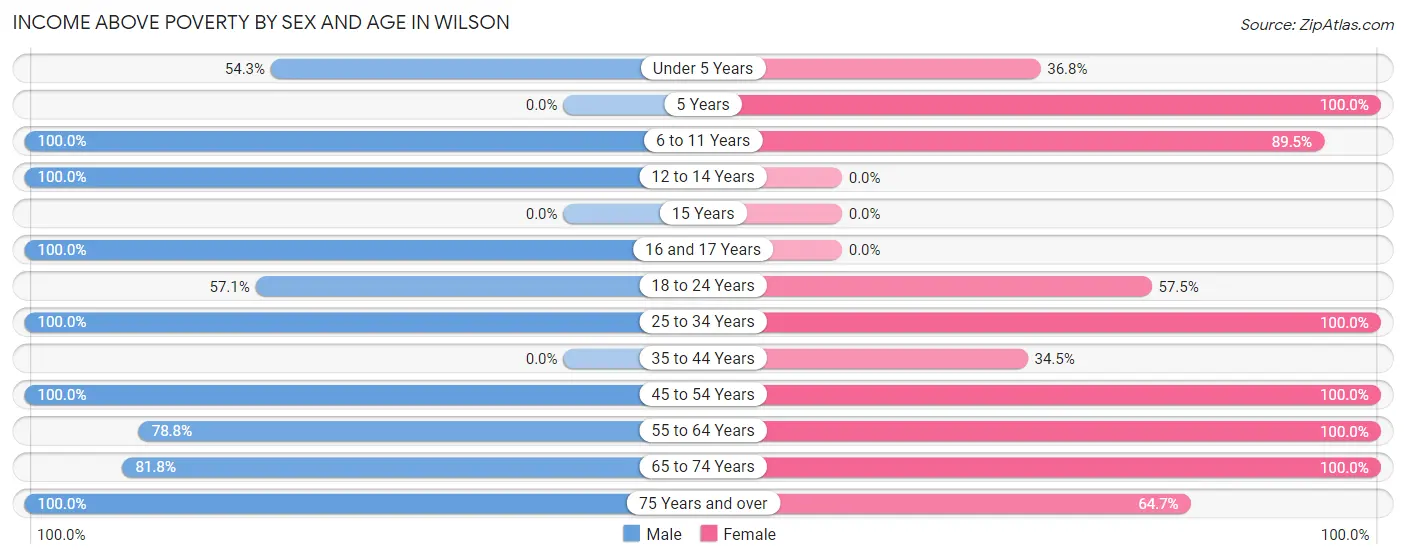
| Age Bracket | Male | Female |
| Under 5 Years | 19 (54.3%) | 7 (36.8%) |
| 5 Years | 0 (0.0%) | 1 (100.0%) |
| 6 to 11 Years | 15 (100.0%) | 17 (89.5%) |
| 12 to 14 Years | 27 (100.0%) | 0 (0.0%) |
| 15 Years | 0 (0.0%) | 0 (0.0%) |
| 16 and 17 Years | 5 (100.0%) | 0 (0.0%) |
| 18 to 24 Years | 8 (57.1%) | 23 (57.5%) |
| 25 to 34 Years | 39 (100.0%) | 7 (100.0%) |
| 35 to 44 Years | 0 (0.0%) | 10 (34.5%) |
| 45 to 54 Years | 18 (100.0%) | 25 (100.0%) |
| 55 to 64 Years | 26 (78.8%) | 13 (100.0%) |
| 65 to 74 Years | 9 (81.8%) | 14 (100.0%) |
| 75 Years and over | 18 (100.0%) | 11 (64.7%) |
| Total | 184 (85.6%) | 128 (54.5%) |
Income Below Poverty Among Married-Couple Families in Wilson
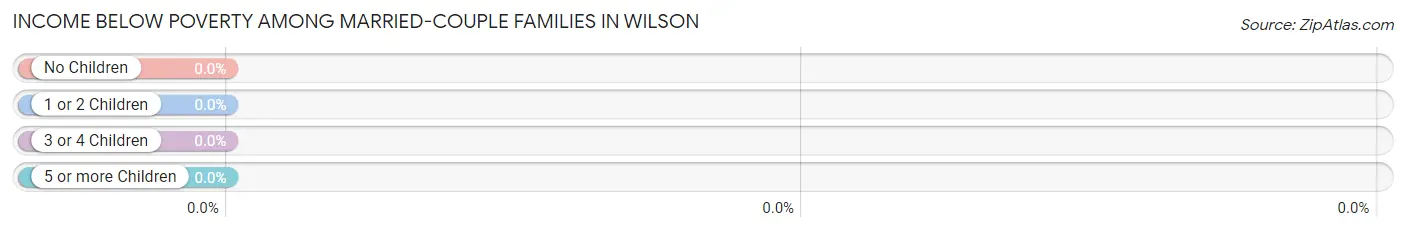
| Children | Above Poverty | Below Poverty |
| No Children | 41 (100.0%) | 0 (0.0%) |
| 1 or 2 Children | 8 (100.0%) | 0 (0.0%) |
| 3 or 4 Children | 10 (100.0%) | 0 (0.0%) |
| 5 or more Children | 0 (0.0%) | 0 (0.0%) |
| Total | 59 (100.0%) | 0 (0.0%) |
Income Below Poverty Among Single-Parent Households in Wilson
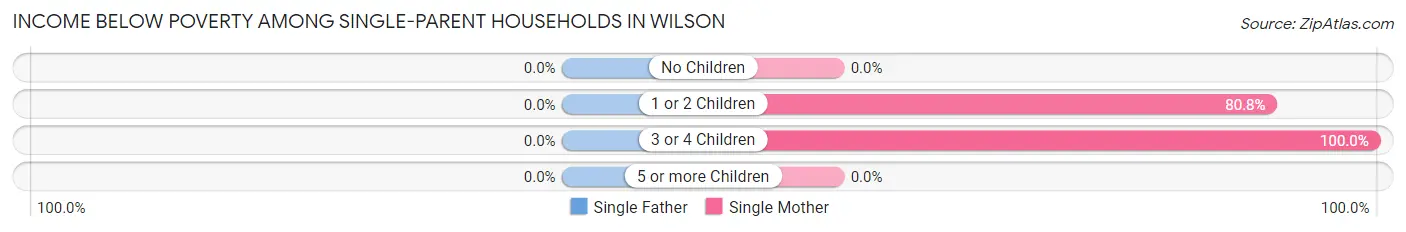
| Children | Single Father | Single Mother |
| No Children | 0 (0.0%) | 0 (0.0%) |
| 1 or 2 Children | 0 (0.0%) | 21 (80.8%) |
| 3 or 4 Children | 0 (0.0%) | 9 (100.0%) |
| 5 or more Children | 0 (0.0%) | 0 (0.0%) |
| Total | 0 (0.0%) | 30 (81.1%) |
Income Below Poverty Among Married-Couple vs Single-Parent Households in Wilson
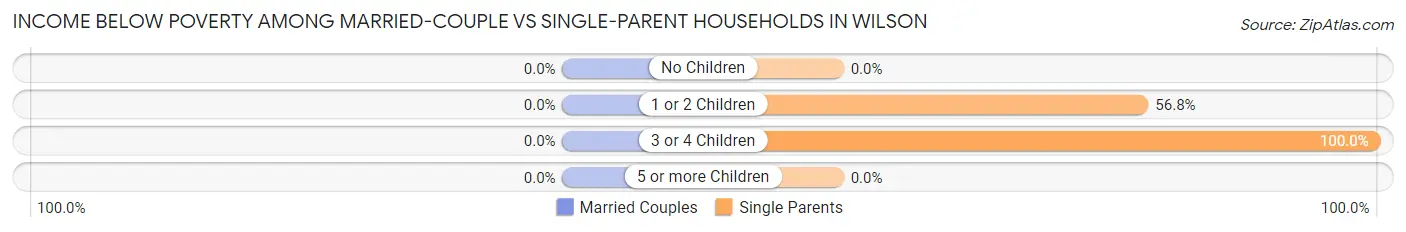
| Children | Married-Couple Families | Single-Parent Households |
| No Children | 0 (0.0%) | 0 (0.0%) |
| 1 or 2 Children | 0 (0.0%) | 21 (56.8%) |
| 3 or 4 Children | 0 (0.0%) | 9 (100.0%) |
| 5 or more Children | 0 (0.0%) | 0 (0.0%) |
| Total | 0 (0.0%) | 30 (62.5%) |
Race in Wilson
The most populous races in Wilson are Hispanic or Latino (355 | 78.7%), White / Caucasian (218 | 48.3%), and Two or more Races (150 | 33.3%).
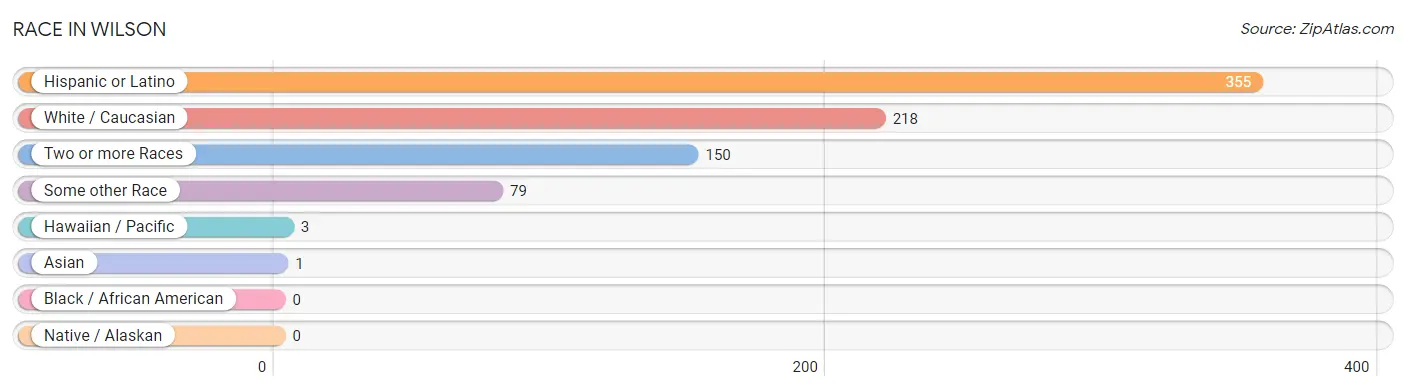
| Race | # Population | % Population |
| Asian | 1 | 0.2% |
| Black / African American | 0 | 0.0% |
| Hawaiian / Pacific | 3 | 0.7% |
| Hispanic or Latino | 355 | 78.7% |
| Native / Alaskan | 0 | 0.0% |
| White / Caucasian | 218 | 48.3% |
| Two or more Races | 150 | 33.3% |
| Some other Race | 79 | 17.5% |
| Total | 451 | 100.0% |
Ancestry in Wilson
The most populous ancestries reported in Wilson are Mexican (288 | 63.9%), German (55 | 12.2%), Irish (15 | 3.3%), American (13 | 2.9%), and English (10 | 2.2%), together accounting for 84.5% of all Wilson residents.
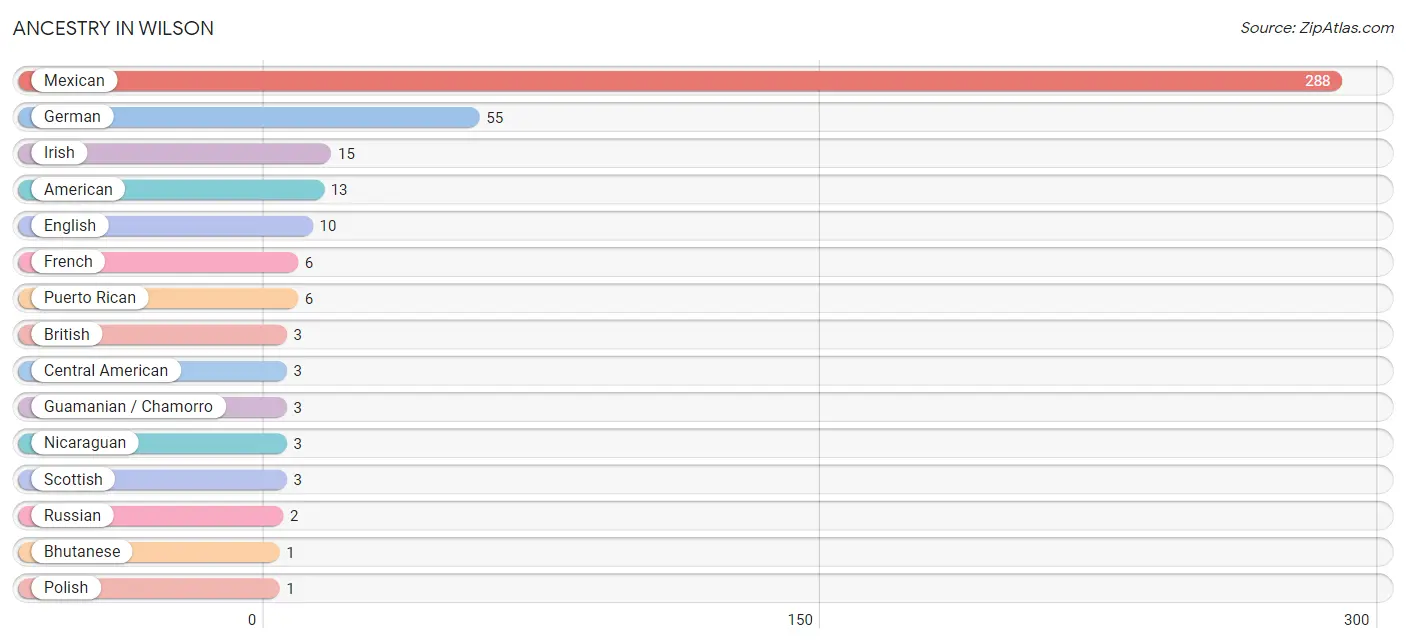
| Ancestry | # Population | % Population |
| American | 13 | 2.9% |
| Bhutanese | 1 | 0.2% |
| British | 3 | 0.7% |
| Central American | 3 | 0.7% |
| English | 10 | 2.2% |
| French | 6 | 1.3% |
| German | 55 | 12.2% |
| Guamanian / Chamorro | 3 | 0.7% |
| Irish | 15 | 3.3% |
| Mexican | 288 | 63.9% |
| Nicaraguan | 3 | 0.7% |
| Polish | 1 | 0.2% |
| Puerto Rican | 6 | 1.3% |
| Russian | 2 | 0.4% |
| Scottish | 3 | 0.7% | View All 15 Rows |
Immigrants in Wilson
The most numerous immigrant groups reported in Wilson came from Central America (7 | 1.5%), Latin America (7 | 1.5%), and Mexico (7 | 1.5%), together accounting for 4.6% of all Wilson residents.
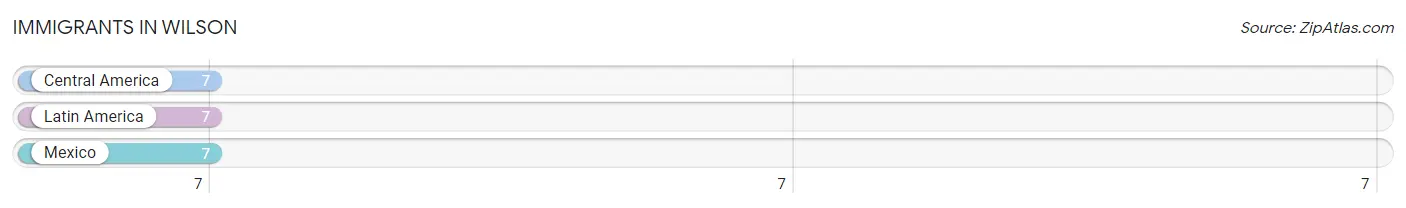
| Immigration Origin | # Population | % Population |
| Central America | 7 | 1.5% |
| Latin America | 7 | 1.5% |
| Mexico | 7 | 1.5% | View All 3 Rows |
Sex and Age in Wilson
Sex and Age in Wilson
The most populous age groups in Wilson are 10 to 14 Years (42 | 19.5%) for men and 20 to 24 Years (40 | 17.0%) for women.
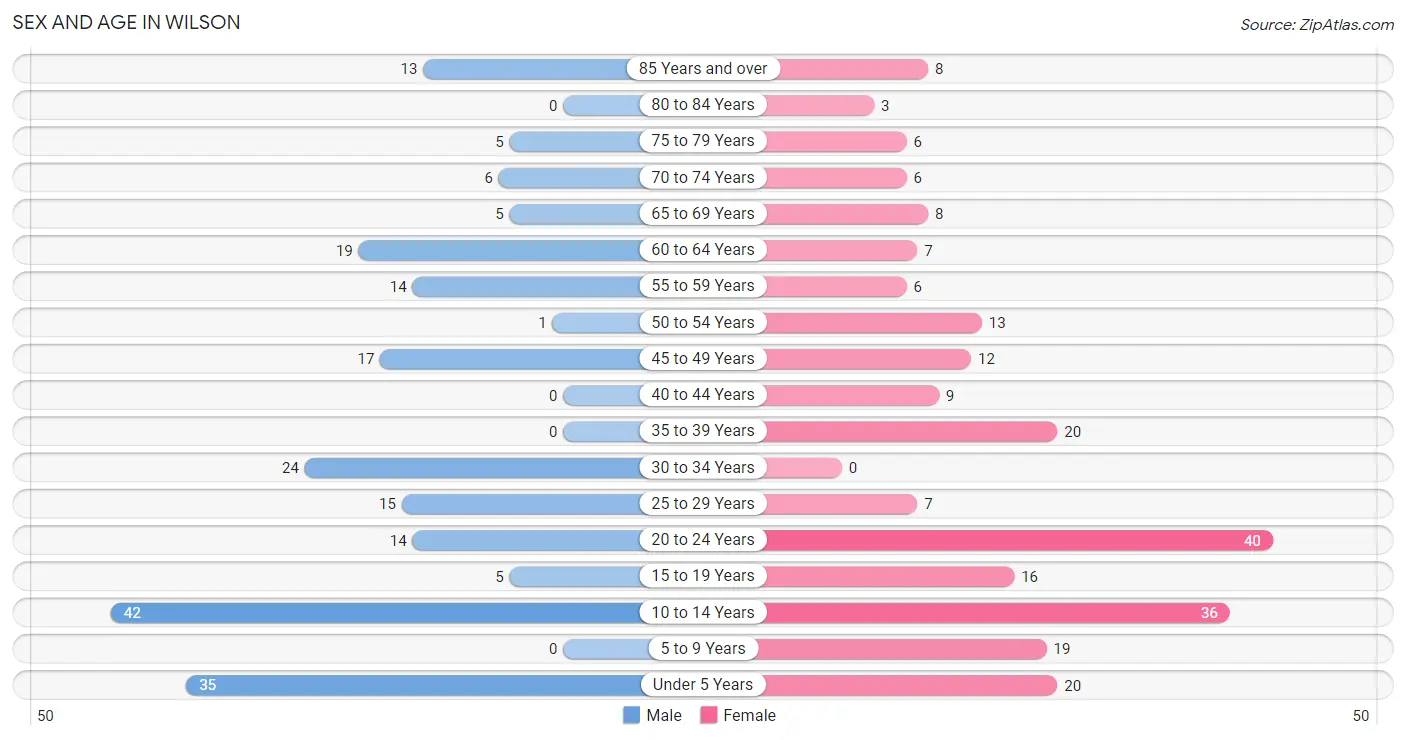
| Age Bracket | Male | Female |
| Under 5 Years | 35 (16.3%) | 20 (8.5%) |
| 5 to 9 Years | 0 (0.0%) | 19 (8.1%) |
| 10 to 14 Years | 42 (19.5%) | 36 (15.2%) |
| 15 to 19 Years | 5 (2.3%) | 16 (6.8%) |
| 20 to 24 Years | 14 (6.5%) | 40 (17.0%) |
| 25 to 29 Years | 15 (7.0%) | 7 (3.0%) |
| 30 to 34 Years | 24 (11.2%) | 0 (0.0%) |
| 35 to 39 Years | 0 (0.0%) | 20 (8.5%) |
| 40 to 44 Years | 0 (0.0%) | 9 (3.8%) |
| 45 to 49 Years | 17 (7.9%) | 12 (5.1%) |
| 50 to 54 Years | 1 (0.5%) | 13 (5.5%) |
| 55 to 59 Years | 14 (6.5%) | 6 (2.5%) |
| 60 to 64 Years | 19 (8.8%) | 7 (3.0%) |
| 65 to 69 Years | 5 (2.3%) | 8 (3.4%) |
| 70 to 74 Years | 6 (2.8%) | 6 (2.5%) |
| 75 to 79 Years | 5 (2.3%) | 6 (2.5%) |
| 80 to 84 Years | 0 (0.0%) | 3 (1.3%) |
| 85 Years and over | 13 (6.0%) | 8 (3.4%) |
| Total | 215 (100.0%) | 236 (100.0%) |
Families and Households in Wilson
Median Family Size in Wilson
The median family size in Wilson is 3.55 persons per family, with single female/mother families (37 | 34.6%) accounting for the largest median family size of 4.11 persons per family. On the other hand, single male/father families (11 | 10.3%) represent the smallest median family size with 2.27 persons per family.
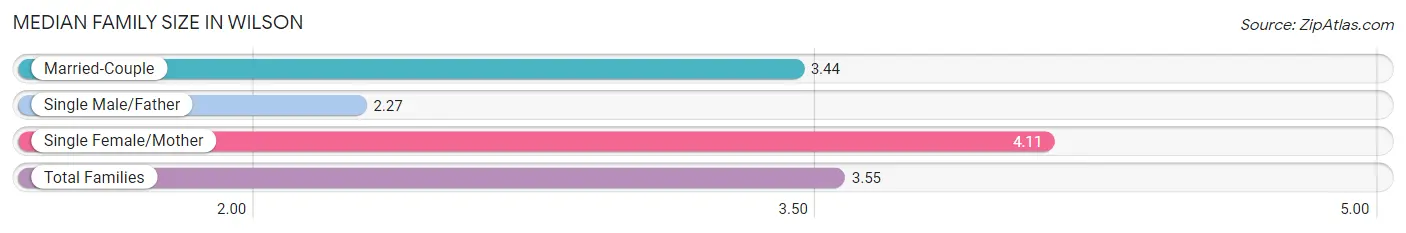
| Family Type | # Families | Family Size |
| Married-Couple | 59 (55.1%) | 3.44 |
| Single Male/Father | 11 (10.3%) | 2.27 |
| Single Female/Mother | 37 (34.6%) | 4.11 |
| Total Families | 107 (100.0%) | 3.55 |
Median Household Size in Wilson
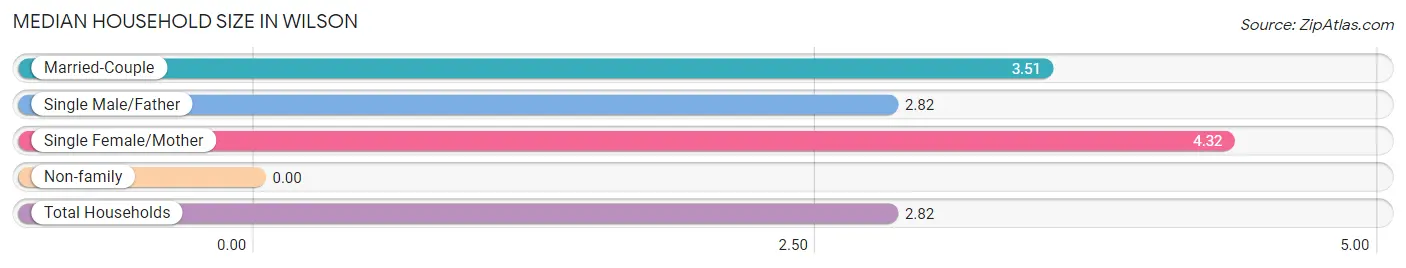
| Household Type | # Households | Household Size |
| Married-Couple | 59 (36.9%) | 3.51 |
| Single Male/Father | 11 (6.9%) | 2.82 |
| Single Female/Mother | 37 (23.1%) | 4.32 |
| Non-family | 53 (33.1%) | - |
| Total Households | 160 (100.0%) | 2.82 |
Household Size by Marriage Status in Wilson
Out of a total of 160 households in Wilson, 107 (66.9%) are family households, while 53 (33.1%) are nonfamily households. The most numerous type of family households are 4-person households, comprising 39, and the most common type of nonfamily households are 1-person households, comprising 53.
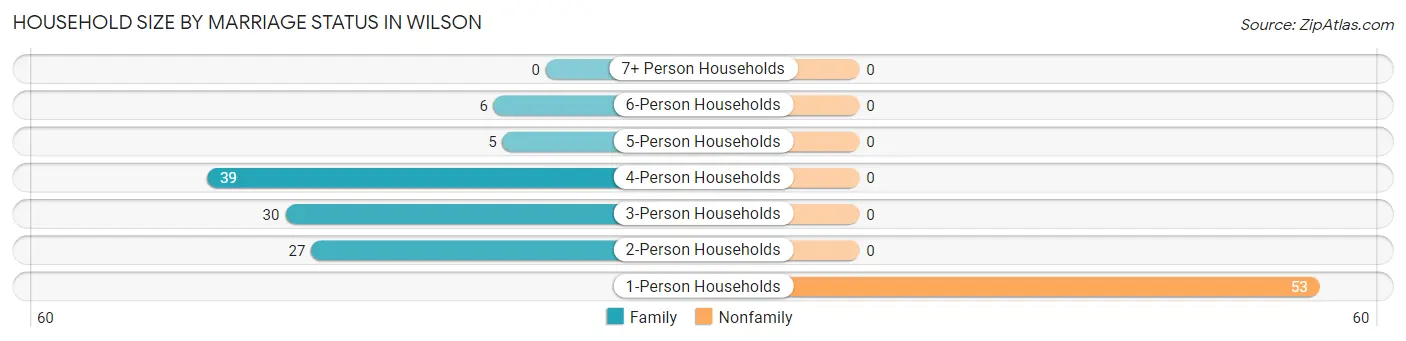
| Household Size | Family Households | Nonfamily Households |
| 1-Person Households | - | 53 (33.1%) |
| 2-Person Households | 27 (16.9%) | 0 (0.0%) |
| 3-Person Households | 30 (18.8%) | 0 (0.0%) |
| 4-Person Households | 39 (24.4%) | 0 (0.0%) |
| 5-Person Households | 5 (3.1%) | 0 (0.0%) |
| 6-Person Households | 6 (3.7%) | 0 (0.0%) |
| 7+ Person Households | 0 (0.0%) | 0 (0.0%) |
| Total | 107 (66.9%) | 53 (33.1%) |
Female Fertility in Wilson
Fertility by Age in Wilson
Average fertility rate in Wilson is 189.0 births per 1,000 women. Women in the age bracket of 20 to 34 years have the highest fertility rate with 447.0 births per 1,000 women. Women in the age bracket of 20 to 34 years acount for 100.0% of all women with births.
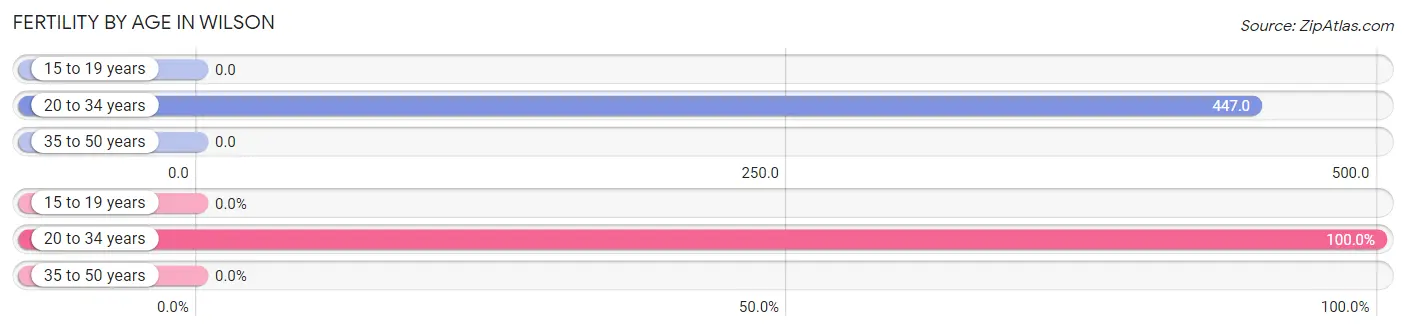
| Age Bracket | Women with Births | Births / 1,000 Women |
| 15 to 19 years | 0 (0.0%) | 0.0 |
| 20 to 34 years | 21 (100.0%) | 447.0 |
| 35 to 50 years | 0 (0.0%) | 0.0 |
| Total | 21 (100.0%) | 189.0 |
Fertility by Age by Marriage Status in Wilson
19.0% of women with births (21) in Wilson are married. The highest percentage of unmarried women with births falls into 20 to 34 years age bracket with 80.9% of them unmarried at the time of birth, while the lowest percentage of unmarried women with births belong to 20 to 34 years age bracket with 80.9% of them unmarried.
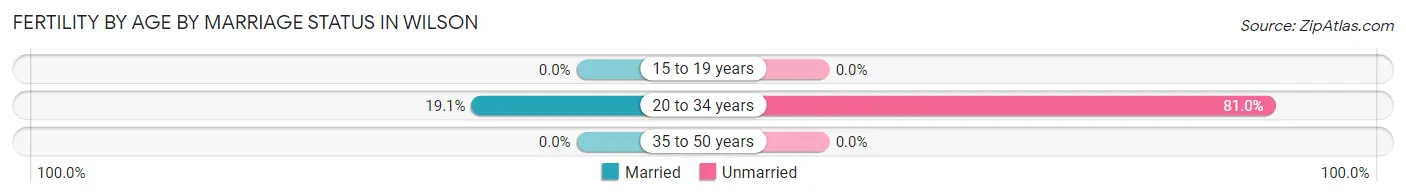
| Age Bracket | Married | Unmarried |
| 15 to 19 years | 0 (0.0%) | 0 (0.0%) |
| 20 to 34 years | 4 (19.1%) | 17 (80.9%) |
| 35 to 50 years | 0 (0.0%) | 0 (0.0%) |
| Total | 4 (19.1%) | 17 (80.9%) |
Fertility by Education in Wilson
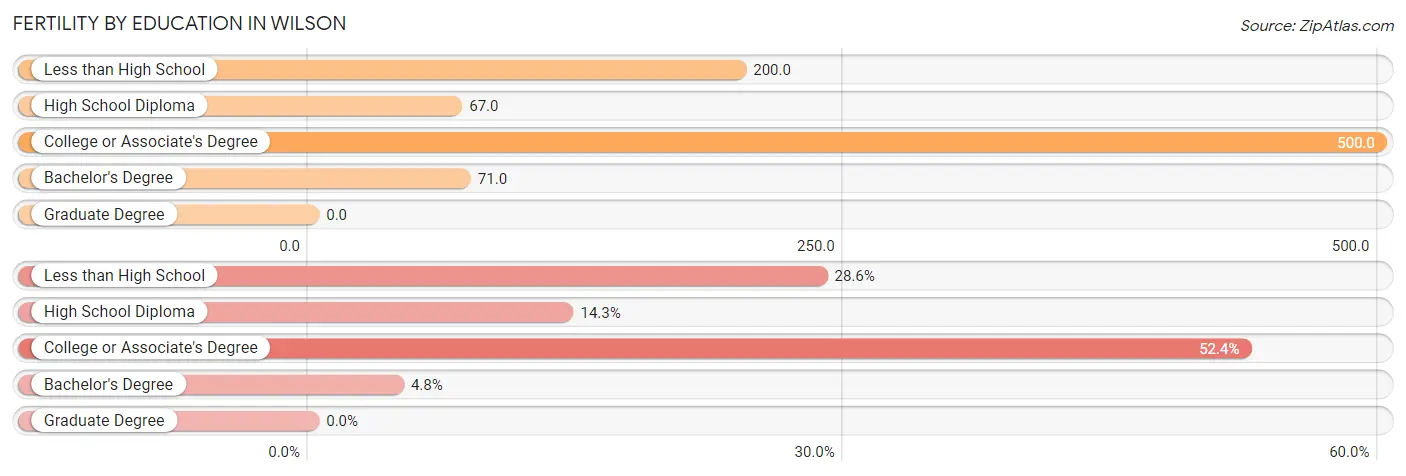
| Educational Attainment | Women with Births | Births / 1,000 Women |
| Less than High School | 6 (28.6%) | 200.0 |
| High School Diploma | 3 (14.3%) | 67.0 |
| College or Associate's Degree | 11 (52.4%) | 500.0 |
| Bachelor's Degree | 1 (4.8%) | 71.0 |
| Graduate Degree | 0 (0.0%) | 0.0 |
| Total | 21 (100.0%) | 189.0 |
Fertility by Education by Marriage Status in Wilson
80.9% of women with births in Wilson are unmarried. Women with the educational attainment of high school diploma are most likely to be married with 100.0% of them married at childbirth, while women with the educational attainment of less than high school are least likely to be married with 100.0% of them unmarried at childbirth.
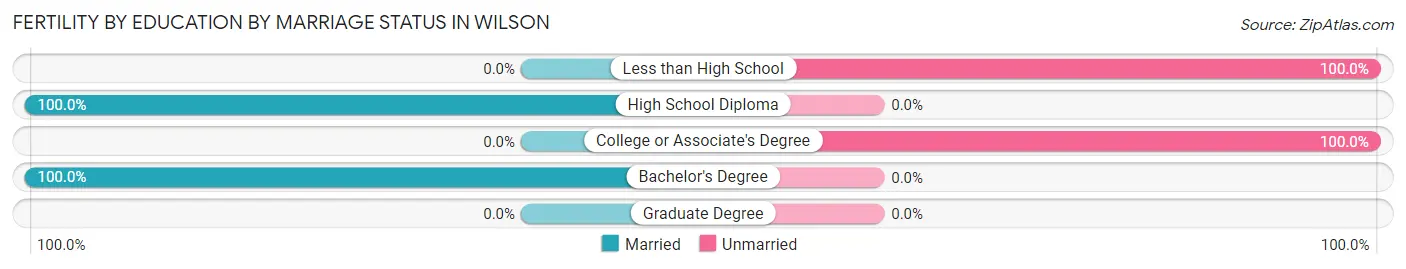
| Educational Attainment | Married | Unmarried |
| Less than High School | 0 (0.0%) | 6 (100.0%) |
| High School Diploma | 3 (100.0%) | 0 (0.0%) |
| College or Associate's Degree | 0 (0.0%) | 11 (100.0%) |
| Bachelor's Degree | 1 (100.0%) | 0 (0.0%) |
| Graduate Degree | 0 (0.0%) | 0 (0.0%) |
| Total | 4 (19.1%) | 17 (80.9%) |
Employment Characteristics in Wilson
Employment by Class of Employer in Wilson
Among the 151 employed individuals in Wilson, private company employees (96 | 63.6%), local government employees (33 | 21.8%), and federal government employees (10 | 6.6%) make up the most common classes of employment.
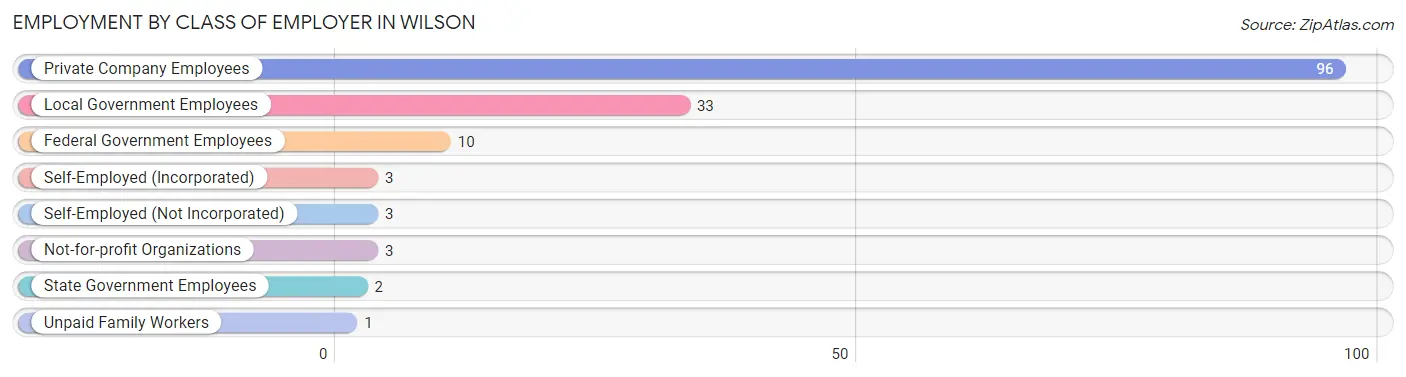
| Employer Class | # Employees | % Employees |
| Private Company Employees | 96 | 63.6% |
| Self-Employed (Incorporated) | 3 | 2.0% |
| Self-Employed (Not Incorporated) | 3 | 2.0% |
| Not-for-profit Organizations | 3 | 2.0% |
| Local Government Employees | 33 | 21.8% |
| State Government Employees | 2 | 1.3% |
| Federal Government Employees | 10 | 6.6% |
| Unpaid Family Workers | 1 | 0.7% |
| Total | 151 | 100.0% |
Employment Status by Age in Wilson
According to the labor force statistics for Wilson, out of the total population over 16 years of age (293), 52.6% or 154 individuals are in the labor force, with 2.0% or 3 of them unemployed. The age group with the highest labor force participation rate is 30 to 34 years, with 100.0% or 24 individuals in the labor force. Within the labor force, the 25 to 29 years age range has the highest percentage of unemployed individuals, with 15.8% or 3 of them being unemployed.
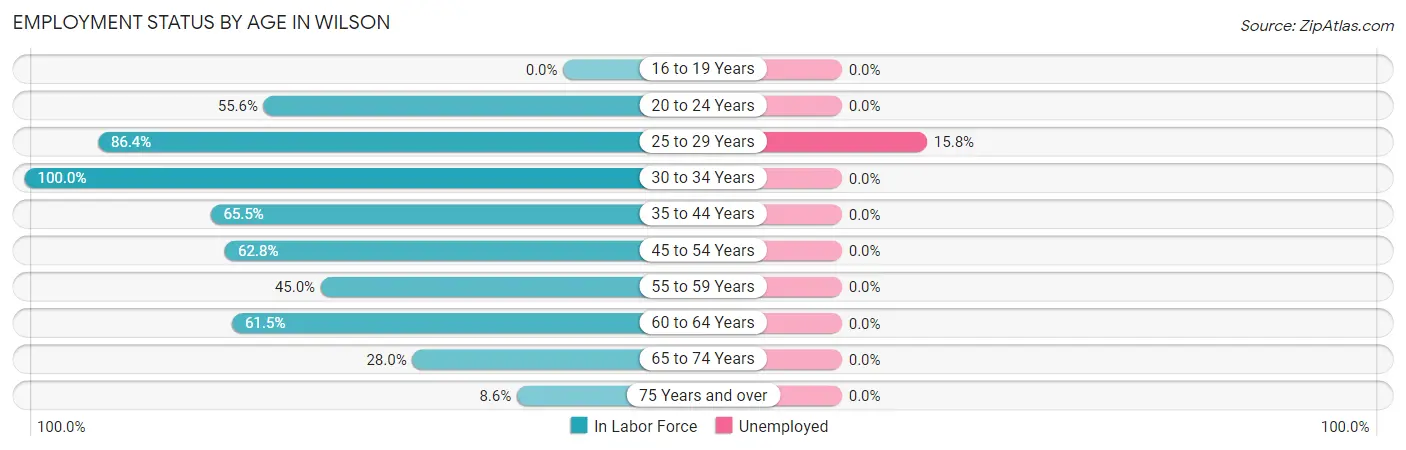
| Age Bracket | In Labor Force | Unemployed |
| 16 to 19 Years | 0 (0.0%) | 0 (0.0%) |
| 20 to 24 Years | 30 (55.6%) | 0 (0.0%) |
| 25 to 29 Years | 19 (86.4%) | 3 (15.8%) |
| 30 to 34 Years | 24 (100.0%) | 0 (0.0%) |
| 35 to 44 Years | 19 (65.5%) | 0 (0.0%) |
| 45 to 54 Years | 27 (62.8%) | 0 (0.0%) |
| 55 to 59 Years | 9 (45.0%) | 0 (0.0%) |
| 60 to 64 Years | 16 (61.5%) | 0 (0.0%) |
| 65 to 74 Years | 7 (28.0%) | 0 (0.0%) |
| 75 Years and over | 3 (8.6%) | 0 (0.0%) |
| Total | 154 (52.6%) | 3 (2.0%) |
Employment Status by Educational Attainment in Wilson
According to labor force statistics for Wilson, 69.5% of individuals (114) out of the total population between 25 and 64 years of age (164) are in the labor force, with 2.6% or 3 of them being unemployed. The group with the highest labor force participation rate are those with the educational attainment of college / associate degree, with 93.0% or 53 individuals in the labor force. Within the labor force, individuals with high school diploma education have the highest percentage of unemployment, with 12.0% or 3 of them being unemployed.
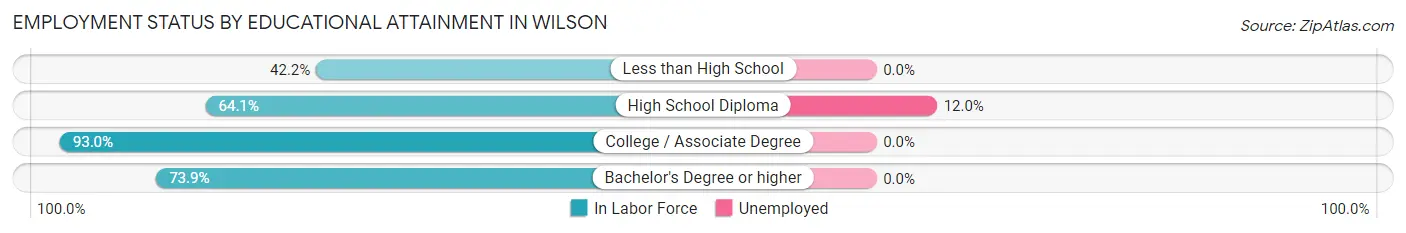
| Educational Attainment | In Labor Force | Unemployed |
| Less than High School | 19 (42.2%) | 0 (0.0%) |
| High School Diploma | 25 (64.1%) | 5 (12.0%) |
| College / Associate Degree | 53 (93.0%) | 0 (0.0%) |
| Bachelor's Degree or higher | 17 (73.9%) | 0 (0.0%) |
| Total | 114 (69.5%) | 4 (2.6%) |
Employment Occupations by Sex in Wilson
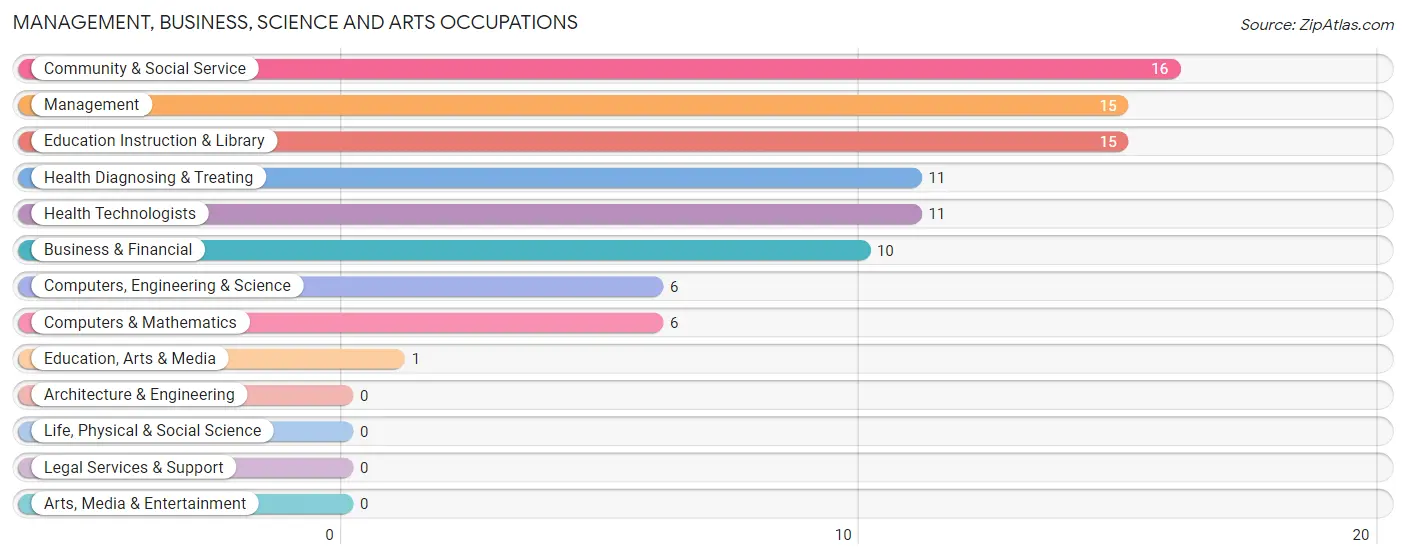
Management, Business, Science and Arts Occupations
The most common Management, Business, Science and Arts occupations in Wilson are Community & Social Service (16 | 10.8%), Management (15 | 10.1%), Education Instruction & Library (15 | 10.1%), Health Diagnosing & Treating (11 | 7.4%), and Health Technologists (11 | 7.4%).
Management, Business, Science and Arts Occupations by Sex
Within the Management, Business, Science and Arts occupations in Wilson, the most male-oriented occupations are Business & Financial (100.0%), Computers, Engineering & Science (100.0%), and Computers & Mathematics (100.0%), while the most female-oriented occupations are Community & Social Service (100.0%), Education, Arts & Media (100.0%), and Education Instruction & Library (100.0%).
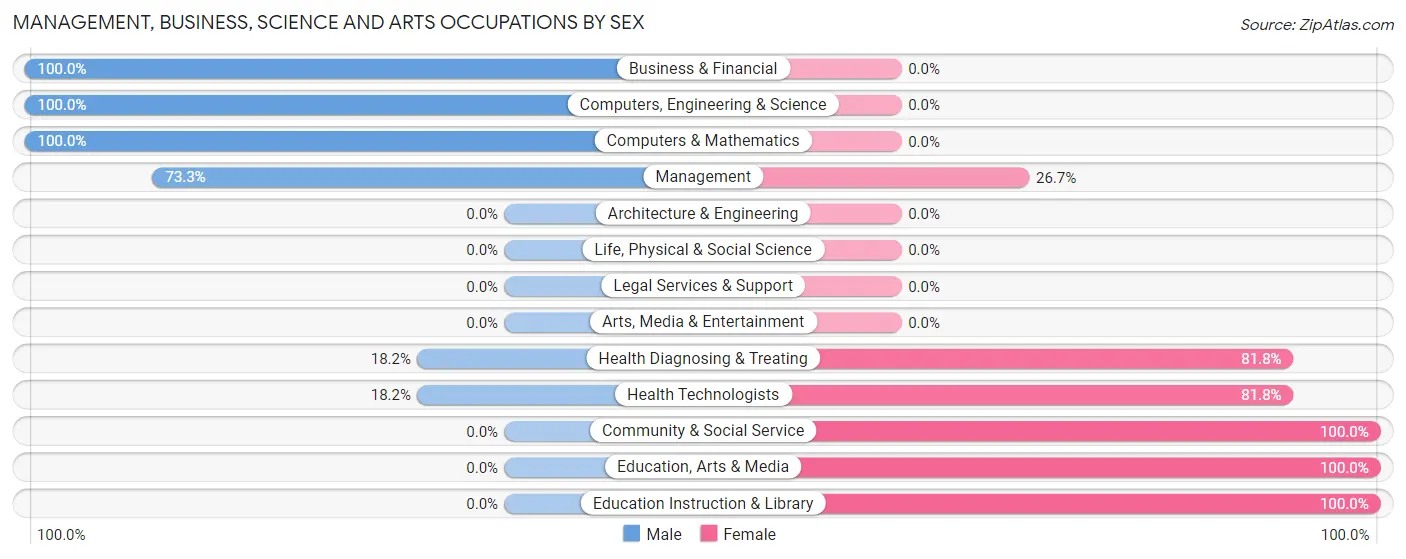
| Occupation | Male | Female |
| Management | 11 (73.3%) | 4 (26.7%) |
| Business & Financial | 10 (100.0%) | 0 (0.0%) |
| Computers, Engineering & Science | 6 (100.0%) | 0 (0.0%) |
| Computers & Mathematics | 6 (100.0%) | 0 (0.0%) |
| Architecture & Engineering | 0 (0.0%) | 0 (0.0%) |
| Life, Physical & Social Science | 0 (0.0%) | 0 (0.0%) |
| Community & Social Service | 0 (0.0%) | 16 (100.0%) |
| Education, Arts & Media | 0 (0.0%) | 1 (100.0%) |
| Legal Services & Support | 0 (0.0%) | 0 (0.0%) |
| Education Instruction & Library | 0 (0.0%) | 15 (100.0%) |
| Arts, Media & Entertainment | 0 (0.0%) | 0 (0.0%) |
| Health Diagnosing & Treating | 2 (18.2%) | 9 (81.8%) |
| Health Technologists | 2 (18.2%) | 9 (81.8%) |
| Total (Category) | 29 (50.0%) | 29 (50.0%) |
| Total (Overall) | 95 (64.2%) | 53 (35.8%) |
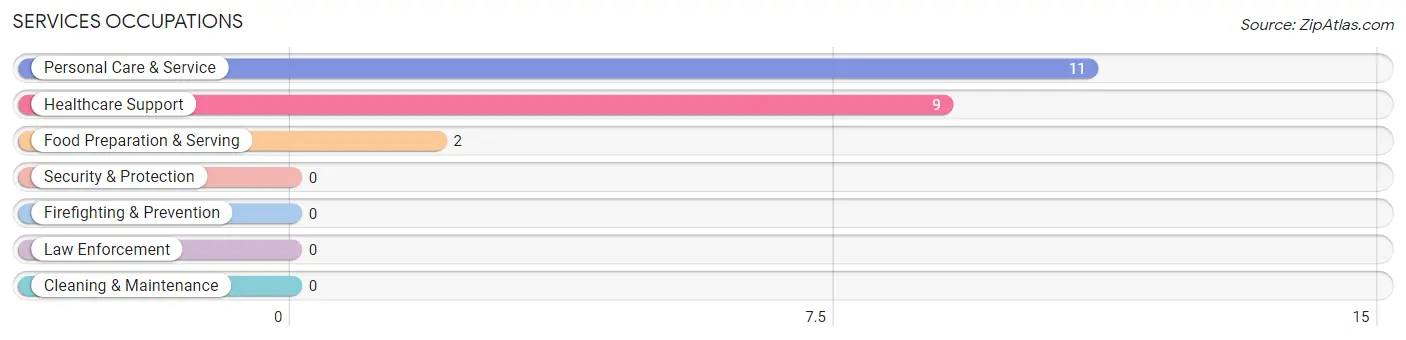
Services Occupations
The most common Services occupations in Wilson are Personal Care & Service (11 | 7.4%), Healthcare Support (9 | 6.1%), and Food Preparation & Serving (2 | 1.3%).
Services Occupations by Sex
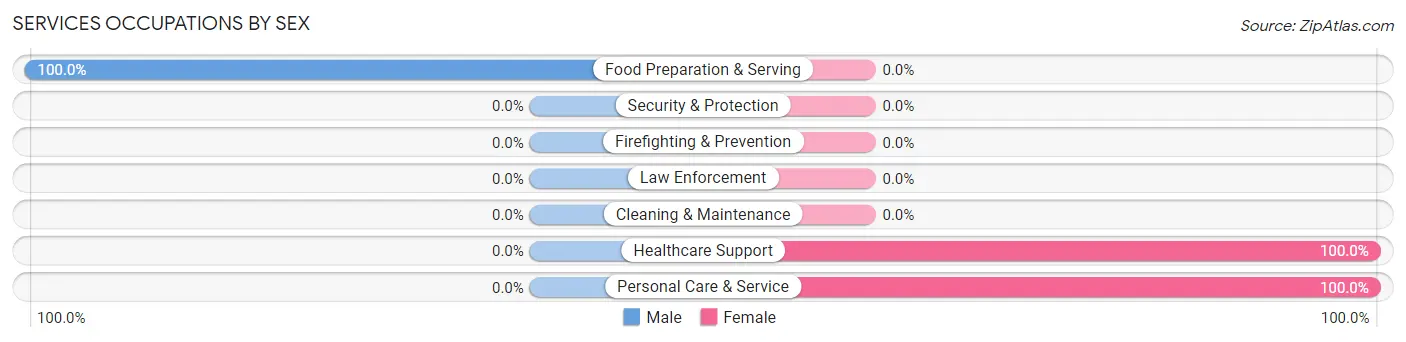
| Occupation | Male | Female |
| Healthcare Support | 0 (0.0%) | 9 (100.0%) |
| Security & Protection | 0 (0.0%) | 0 (0.0%) |
| Firefighting & Prevention | 0 (0.0%) | 0 (0.0%) |
| Law Enforcement | 0 (0.0%) | 0 (0.0%) |
| Food Preparation & Serving | 2 (100.0%) | 0 (0.0%) |
| Cleaning & Maintenance | 0 (0.0%) | 0 (0.0%) |
| Personal Care & Service | 0 (0.0%) | 11 (100.0%) |
| Total (Category) | 2 (9.1%) | 20 (90.9%) |
| Total (Overall) | 95 (64.2%) | 53 (35.8%) |
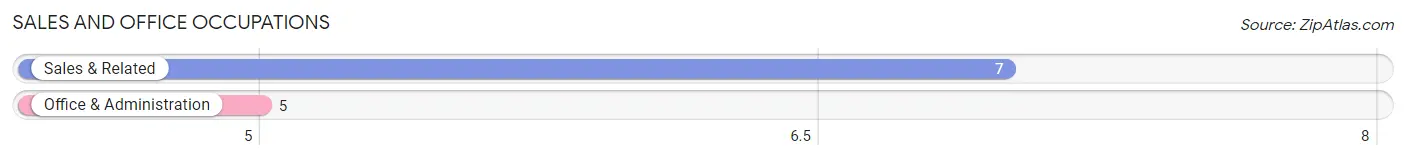
Sales and Office Occupations
The most common Sales and Office occupations in Wilson are Sales & Related (7 | 4.7%), and Office & Administration (5 | 3.4%).
Sales and Office Occupations by Sex
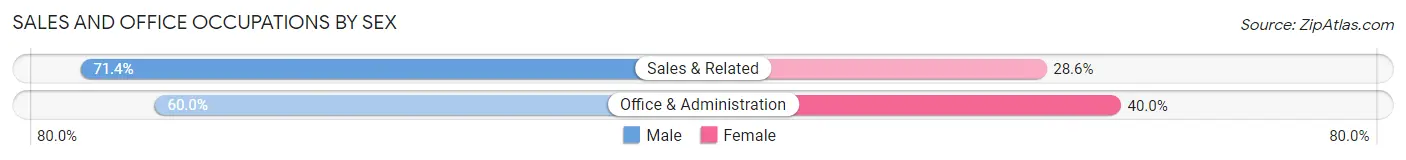
| Occupation | Male | Female |
| Sales & Related | 5 (71.4%) | 2 (28.6%) |
| Office & Administration | 3 (60.0%) | 2 (40.0%) |
| Total (Category) | 8 (66.7%) | 4 (33.3%) |
| Total (Overall) | 95 (64.2%) | 53 (35.8%) |
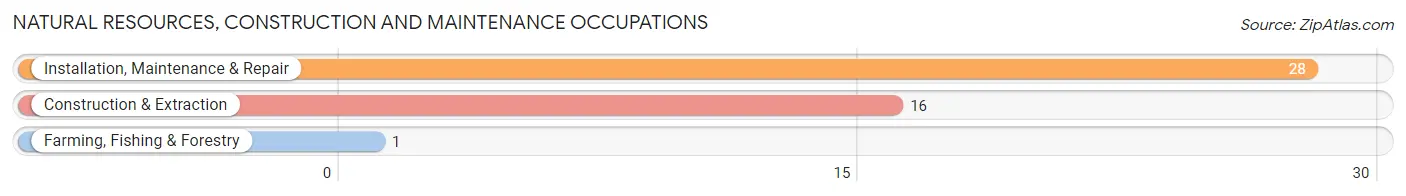
Natural Resources, Construction and Maintenance Occupations
The most common Natural Resources, Construction and Maintenance occupations in Wilson are Installation, Maintenance & Repair (28 | 18.9%), Construction & Extraction (16 | 10.8%), and Farming, Fishing & Forestry (1 | 0.7%).
Natural Resources, Construction and Maintenance Occupations by Sex
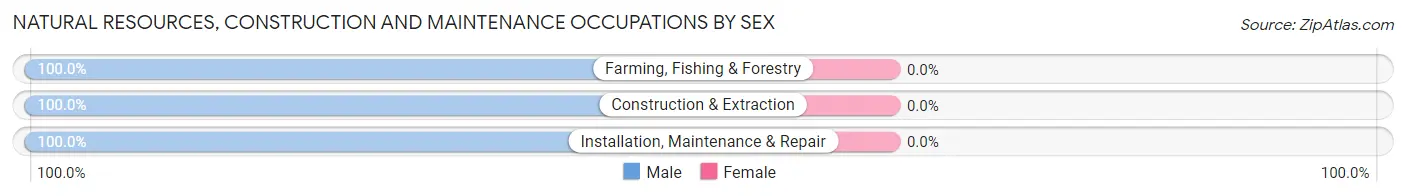
| Occupation | Male | Female |
| Farming, Fishing & Forestry | 1 (100.0%) | 0 (0.0%) |
| Construction & Extraction | 16 (100.0%) | 0 (0.0%) |
| Installation, Maintenance & Repair | 28 (100.0%) | 0 (0.0%) |
| Total (Category) | 45 (100.0%) | 0 (0.0%) |
| Total (Overall) | 95 (64.2%) | 53 (35.8%) |
Production, Transportation and Moving Occupations
The most common Production, Transportation and Moving occupations in Wilson are Production (8 | 5.4%), and Transportation (3 | 2.0%).
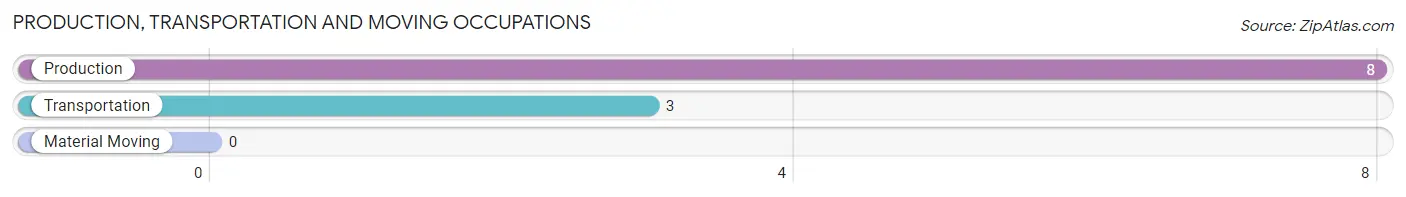
Production, Transportation and Moving Occupations by Sex
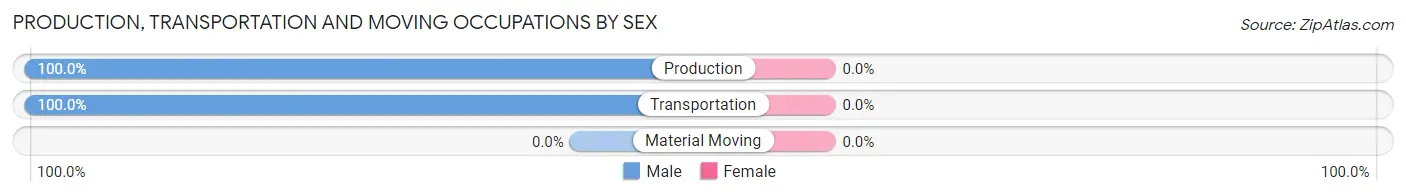
| Occupation | Male | Female |
| Production | 8 (100.0%) | 0 (0.0%) |
| Transportation | 3 (100.0%) | 0 (0.0%) |
| Material Moving | 0 (0.0%) | 0 (0.0%) |
| Total (Category) | 11 (100.0%) | 0 (0.0%) |
| Total (Overall) | 95 (64.2%) | 53 (35.8%) |
Employment Industries by Sex in Wilson
Employment Industries in Wilson
The major employment industries in Wilson include Health Care & Social Assistance (36 | 24.3%), Construction (25 | 16.9%), Educational Services (17 | 11.5%), Real Estate, Rental & Leasing (10 | 6.8%), and Public Administration (10 | 6.8%).
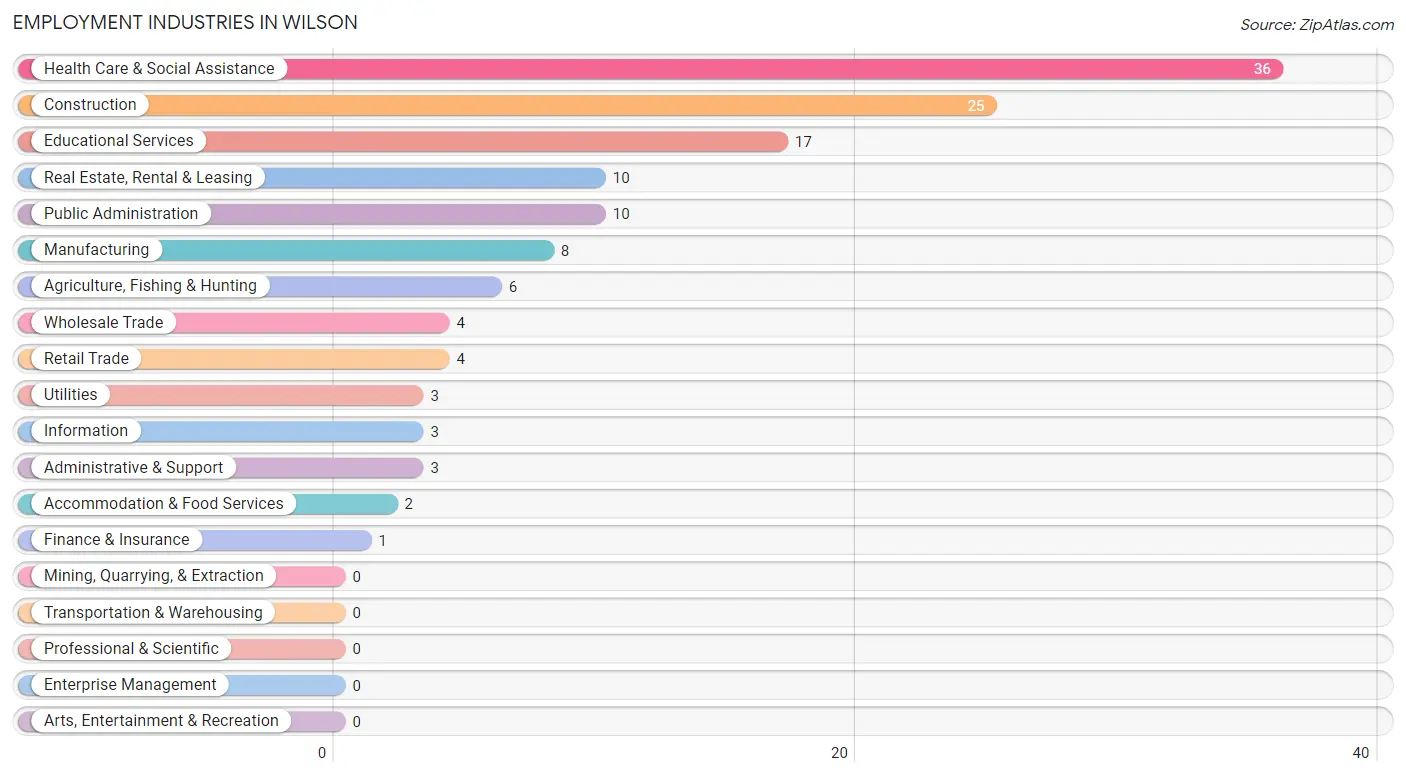
Employment Industries by Sex in Wilson
The Wilson industries that see more men than women are Agriculture, Fishing & Hunting (100.0%), Construction (100.0%), and Manufacturing (100.0%), whereas the industries that tend to have a higher number of women are Information (100.0%), Finance & Insurance (100.0%), and Educational Services (88.2%).
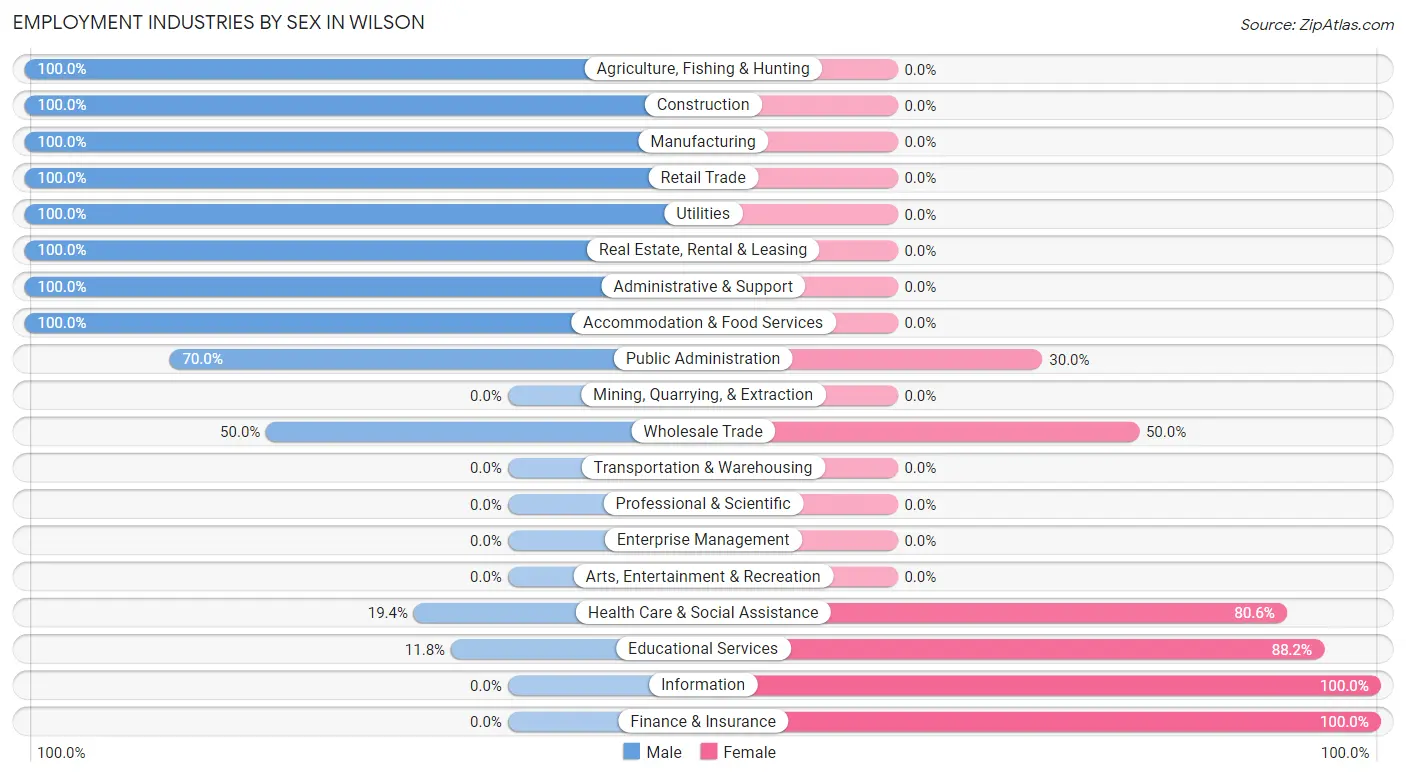
| Industry | Male | Female |
| Agriculture, Fishing & Hunting | 6 (100.0%) | 0 (0.0%) |
| Mining, Quarrying, & Extraction | 0 (0.0%) | 0 (0.0%) |
| Construction | 25 (100.0%) | 0 (0.0%) |
| Manufacturing | 8 (100.0%) | 0 (0.0%) |
| Wholesale Trade | 2 (50.0%) | 2 (50.0%) |
| Retail Trade | 4 (100.0%) | 0 (0.0%) |
| Transportation & Warehousing | 0 (0.0%) | 0 (0.0%) |
| Utilities | 3 (100.0%) | 0 (0.0%) |
| Information | 0 (0.0%) | 3 (100.0%) |
| Finance & Insurance | 0 (0.0%) | 1 (100.0%) |
| Real Estate, Rental & Leasing | 10 (100.0%) | 0 (0.0%) |
| Professional & Scientific | 0 (0.0%) | 0 (0.0%) |
| Enterprise Management | 0 (0.0%) | 0 (0.0%) |
| Administrative & Support | 3 (100.0%) | 0 (0.0%) |
| Educational Services | 2 (11.8%) | 15 (88.2%) |
| Health Care & Social Assistance | 7 (19.4%) | 29 (80.6%) |
| Arts, Entertainment & Recreation | 0 (0.0%) | 0 (0.0%) |
| Accommodation & Food Services | 2 (100.0%) | 0 (0.0%) |
| Public Administration | 7 (70.0%) | 3 (30.0%) |
| Total | 95 (64.2%) | 53 (35.8%) |
Education in Wilson
School Enrollment in Wilson
The most common levels of schooling among the 147 students in Wilson are high school (55 | 37.4%), middle school (50 | 34.0%), and college / undergraduate (20 | 13.6%).
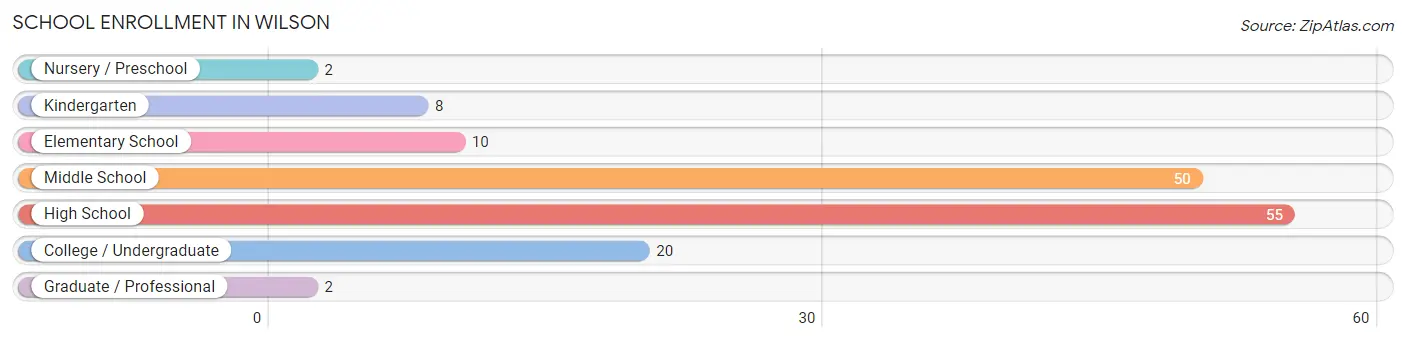
| School Level | # Students | % Students |
| Nursery / Preschool | 2 | 1.4% |
| Kindergarten | 8 | 5.4% |
| Elementary School | 10 | 6.8% |
| Middle School | 50 | 34.0% |
| High School | 55 | 37.4% |
| College / Undergraduate | 20 | 13.6% |
| Graduate / Professional | 2 | 1.4% |
| Total | 147 | 100.0% |
School Enrollment by Age by Funding Source in Wilson
Out of a total of 147 students who are enrolled in schools in Wilson, 48 (32.7%) attend a private institution, while the remaining 99 (67.3%) are enrolled in public schools. The age group of 35 years and over has the highest likelihood of being enrolled in private schools, with 11 (100.0% in the age bracket) enrolled. Conversely, the age group of 3 to 4 year olds has the lowest likelihood of being enrolled in a private school, with 1 (100.0% in the age bracket) attending a public institution.
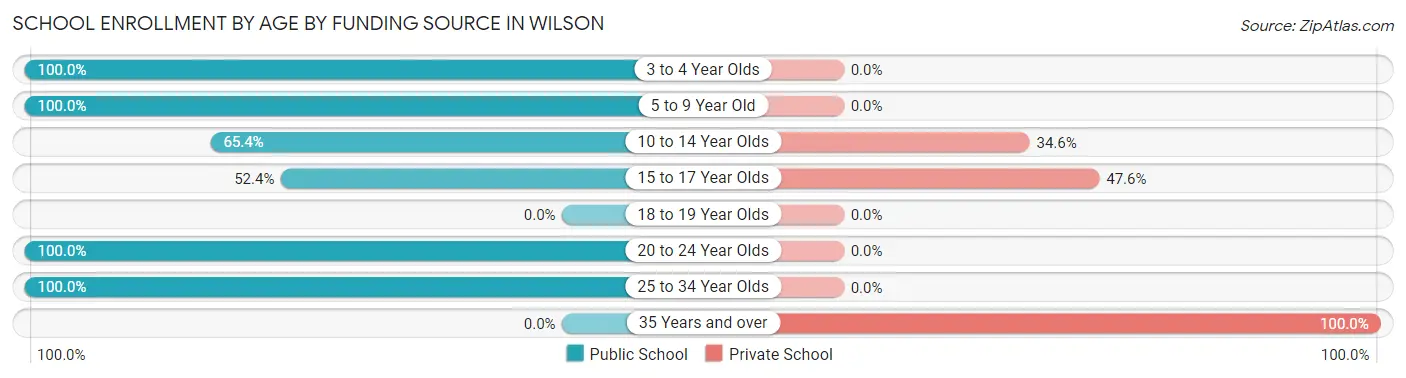
| Age Bracket | Public School | Private School |
| 3 to 4 Year Olds | 1 (100.0%) | 0 (0.0%) |
| 5 to 9 Year Old | 19 (100.0%) | 0 (0.0%) |
| 10 to 14 Year Olds | 51 (65.4%) | 27 (34.6%) |
| 15 to 17 Year Olds | 11 (52.4%) | 10 (47.6%) |
| 18 to 19 Year Olds | 0 (0.0%) | 0 (0.0%) |
| 20 to 24 Year Olds | 6 (100.0%) | 0 (0.0%) |
| 25 to 34 Year Olds | 11 (100.0%) | 0 (0.0%) |
| 35 Years and over | 0 (0.0%) | 11 (100.0%) |
| Total | 99 (67.3%) | 48 (32.7%) |
Educational Attainment by Field of Study in Wilson
Business (10 | 35.7%), science & technology (9 | 32.1%), education (4 | 14.3%), visual & performing arts (3 | 10.7%), and engineering (1 | 3.6%) are the most common fields of study among 28 individuals in Wilson who have obtained a bachelor's degree or higher.
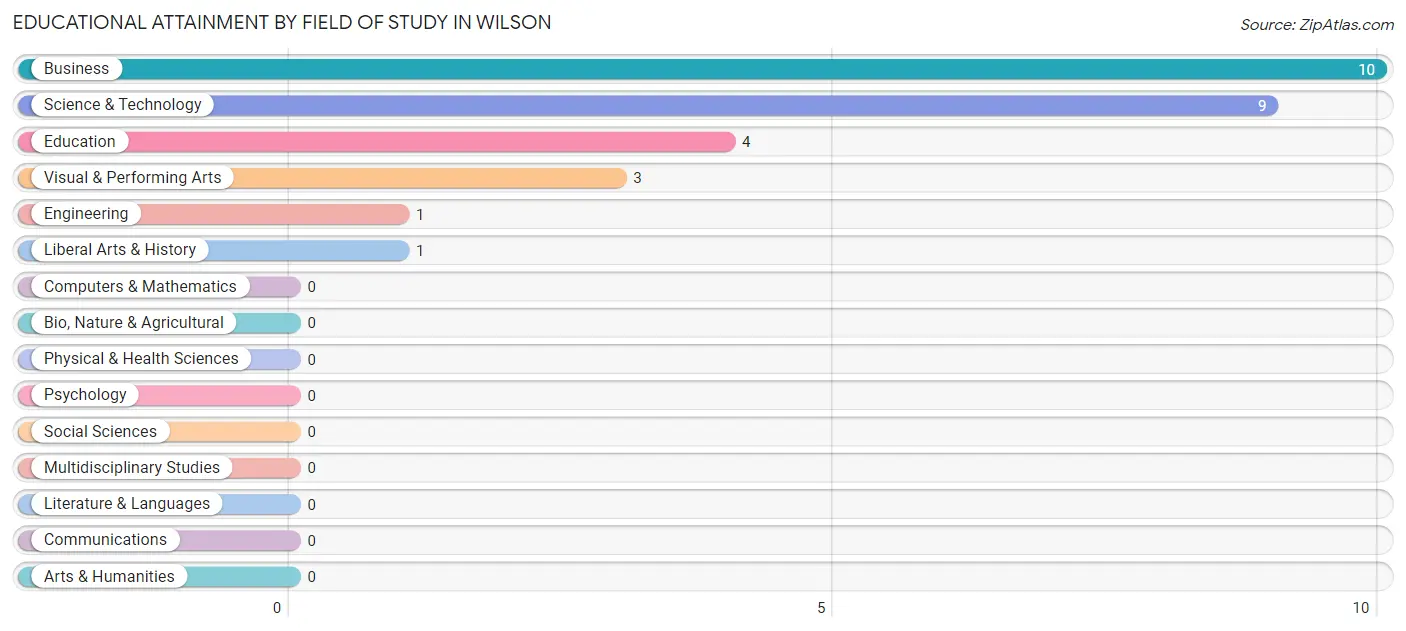
| Field of Study | # Graduates | % Graduates |
| Computers & Mathematics | 0 | 0.0% |
| Bio, Nature & Agricultural | 0 | 0.0% |
| Physical & Health Sciences | 0 | 0.0% |
| Psychology | 0 | 0.0% |
| Social Sciences | 0 | 0.0% |
| Engineering | 1 | 3.6% |
| Multidisciplinary Studies | 0 | 0.0% |
| Science & Technology | 9 | 32.1% |
| Business | 10 | 35.7% |
| Education | 4 | 14.3% |
| Literature & Languages | 0 | 0.0% |
| Liberal Arts & History | 1 | 3.6% |
| Visual & Performing Arts | 3 | 10.7% |
| Communications | 0 | 0.0% |
| Arts & Humanities | 0 | 0.0% |
| Total | 28 | 100.0% |
Transportation & Commute in Wilson
Vehicle Availability by Sex in Wilson
The most prevalent vehicle ownership categories in Wilson are males with 2 vehicles (46, accounting for 48.4%) and females with 2 vehicles (29, making up 82.1%).
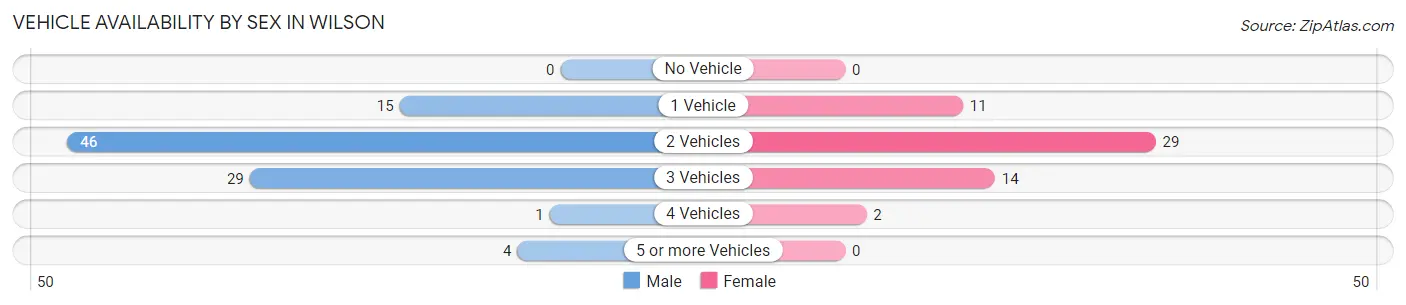
| Vehicles Available | Male | Female |
| No Vehicle | 0 (0.0%) | 0 (0.0%) |
| 1 Vehicle | 15 (15.8%) | 11 (19.6%) |
| 2 Vehicles | 46 (48.4%) | 29 (51.8%) |
| 3 Vehicles | 29 (30.5%) | 14 (25.0%) |
| 4 Vehicles | 1 (1.1%) | 2 (3.6%) |
| 5 or more Vehicles | 4 (4.2%) | 0 (0.0%) |
| Total | 95 (100.0%) | 56 (100.0%) |
Commute Time in Wilson
The most frequently occuring commute durations in Wilson are 30 to 34 minutes (36 commuters, 23.8%), 25 to 29 minutes (29 commuters, 19.2%), and 15 to 19 minutes (19 commuters, 12.6%).
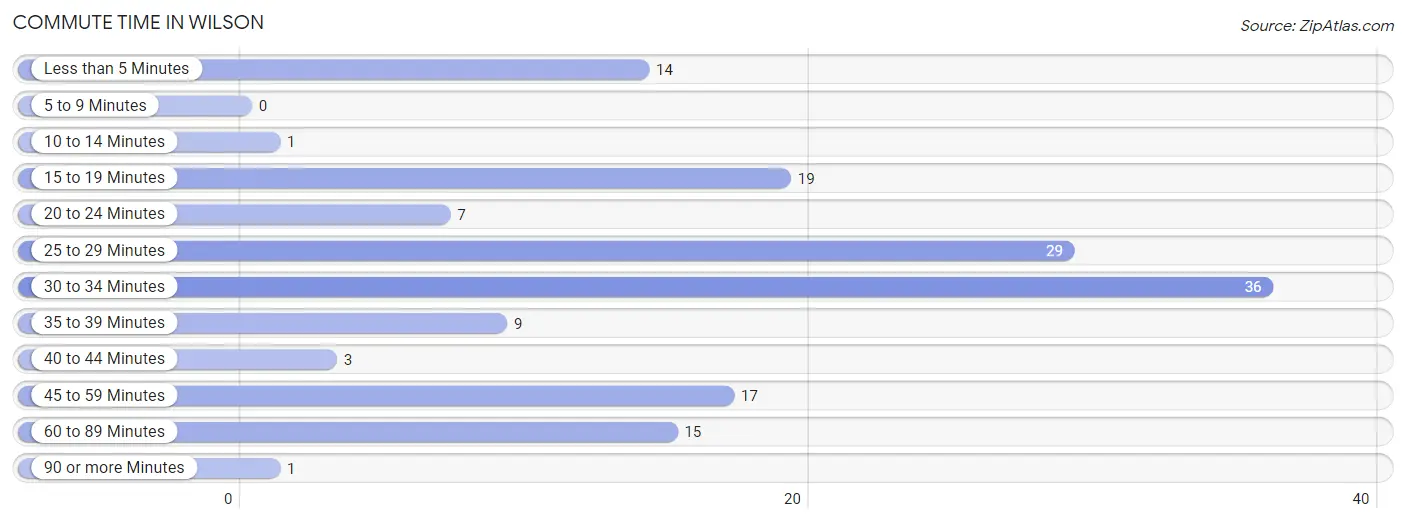
| Commute Time | # Commuters | % Commuters |
| Less than 5 Minutes | 14 | 9.3% |
| 5 to 9 Minutes | 0 | 0.0% |
| 10 to 14 Minutes | 1 | 0.7% |
| 15 to 19 Minutes | 19 | 12.6% |
| 20 to 24 Minutes | 7 | 4.6% |
| 25 to 29 Minutes | 29 | 19.2% |
| 30 to 34 Minutes | 36 | 23.8% |
| 35 to 39 Minutes | 9 | 6.0% |
| 40 to 44 Minutes | 3 | 2.0% |
| 45 to 59 Minutes | 17 | 11.3% |
| 60 to 89 Minutes | 15 | 9.9% |
| 90 or more Minutes | 1 | 0.7% |
Commute Time by Sex in Wilson
The most common commute times in Wilson are 25 to 29 minutes (26 commuters, 27.4%) for males and 30 to 34 minutes (17 commuters, 30.4%) for females.
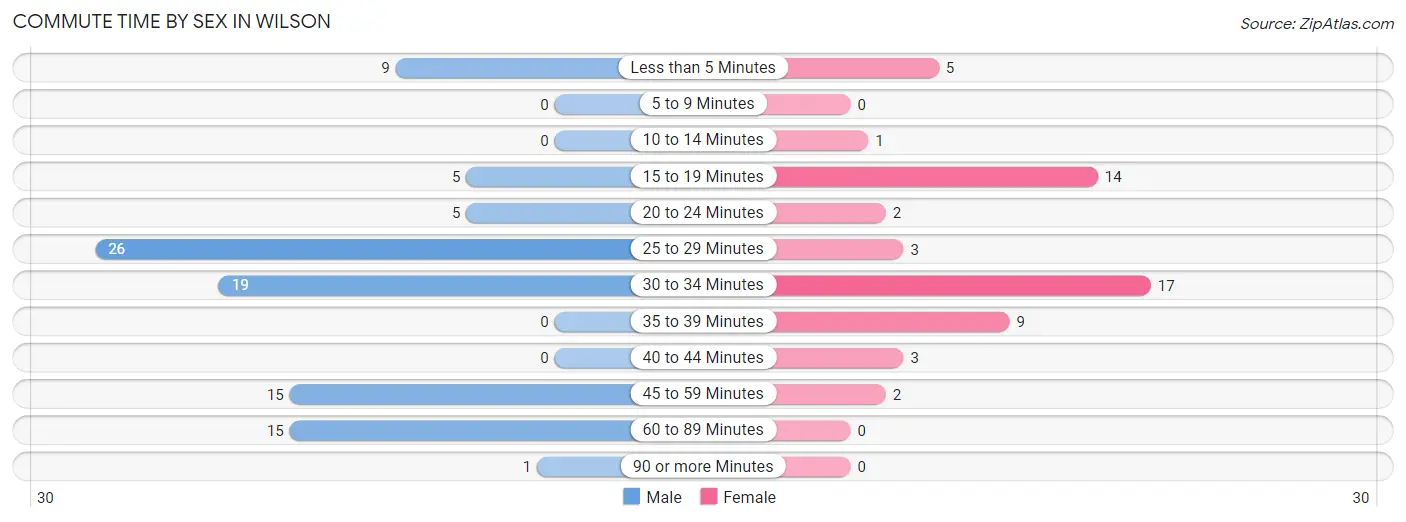
| Commute Time | Male | Female |
| Less than 5 Minutes | 9 (9.5%) | 5 (8.9%) |
| 5 to 9 Minutes | 0 (0.0%) | 0 (0.0%) |
| 10 to 14 Minutes | 0 (0.0%) | 1 (1.8%) |
| 15 to 19 Minutes | 5 (5.3%) | 14 (25.0%) |
| 20 to 24 Minutes | 5 (5.3%) | 2 (3.6%) |
| 25 to 29 Minutes | 26 (27.4%) | 3 (5.4%) |
| 30 to 34 Minutes | 19 (20.0%) | 17 (30.4%) |
| 35 to 39 Minutes | 0 (0.0%) | 9 (16.1%) |
| 40 to 44 Minutes | 0 (0.0%) | 3 (5.4%) |
| 45 to 59 Minutes | 15 (15.8%) | 2 (3.6%) |
| 60 to 89 Minutes | 15 (15.8%) | 0 (0.0%) |
| 90 or more Minutes | 1 (1.1%) | 0 (0.0%) |
Time of Departure to Work by Sex in Wilson
The most frequent times of departure to work in Wilson are 8:00 AM to 8:29 AM (36, 37.9%) for males and 6:30 AM to 6:59 AM (20, 35.7%) for females.
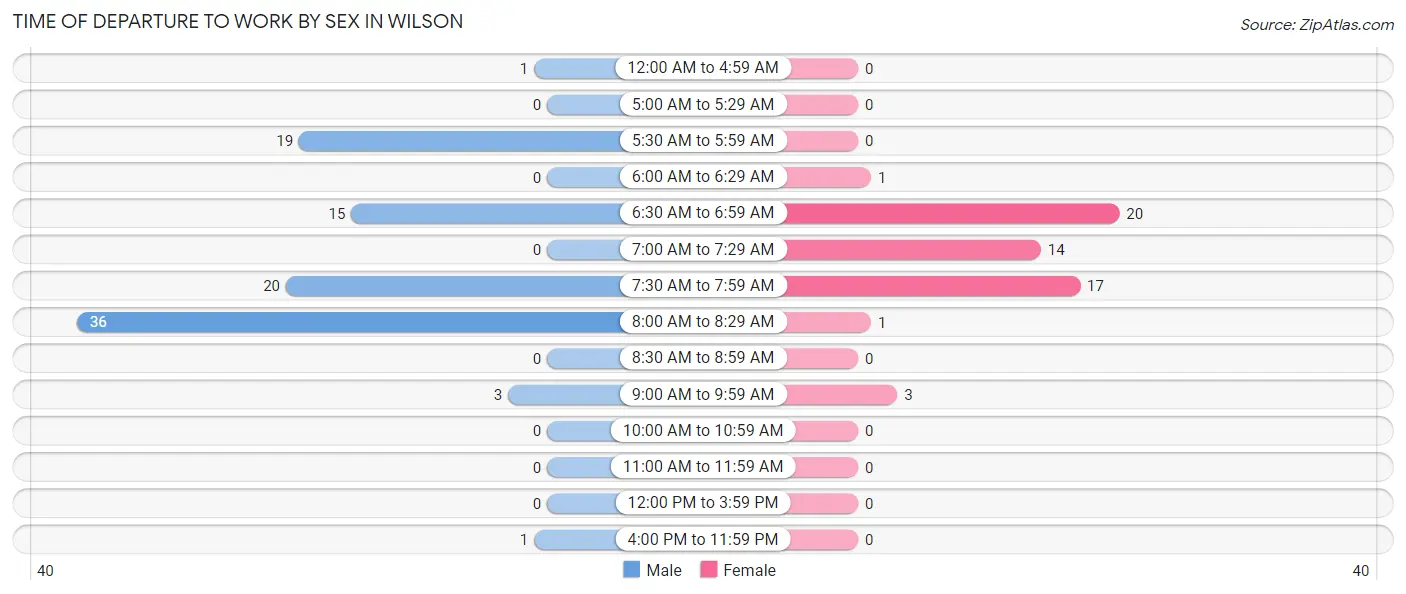
| Time of Departure | Male | Female |
| 12:00 AM to 4:59 AM | 1 (1.1%) | 0 (0.0%) |
| 5:00 AM to 5:29 AM | 0 (0.0%) | 0 (0.0%) |
| 5:30 AM to 5:59 AM | 19 (20.0%) | 0 (0.0%) |
| 6:00 AM to 6:29 AM | 0 (0.0%) | 1 (1.8%) |
| 6:30 AM to 6:59 AM | 15 (15.8%) | 20 (35.7%) |
| 7:00 AM to 7:29 AM | 0 (0.0%) | 14 (25.0%) |
| 7:30 AM to 7:59 AM | 20 (21.0%) | 17 (30.4%) |
| 8:00 AM to 8:29 AM | 36 (37.9%) | 1 (1.8%) |
| 8:30 AM to 8:59 AM | 0 (0.0%) | 0 (0.0%) |
| 9:00 AM to 9:59 AM | 3 (3.2%) | 3 (5.4%) |
| 10:00 AM to 10:59 AM | 0 (0.0%) | 0 (0.0%) |
| 11:00 AM to 11:59 AM | 0 (0.0%) | 0 (0.0%) |
| 12:00 PM to 3:59 PM | 0 (0.0%) | 0 (0.0%) |
| 4:00 PM to 11:59 PM | 1 (1.1%) | 0 (0.0%) |
| Total | 95 (100.0%) | 56 (100.0%) |
Housing Occupancy in Wilson
Occupancy by Ownership in Wilson
Of the total 160 dwellings in Wilson, owner-occupied units account for 108 (67.5%), while renter-occupied units make up 52 (32.5%).
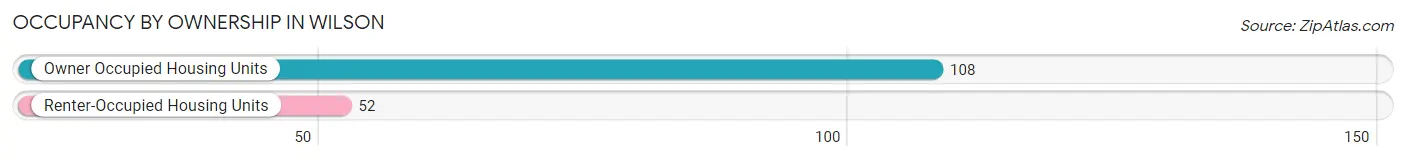
| Occupancy | # Housing Units | % Housing Units |
| Owner Occupied Housing Units | 108 | 67.5% |
| Renter-Occupied Housing Units | 52 | 32.5% |
| Total Occupied Housing Units | 160 | 100.0% |
Occupancy by Household Size in Wilson
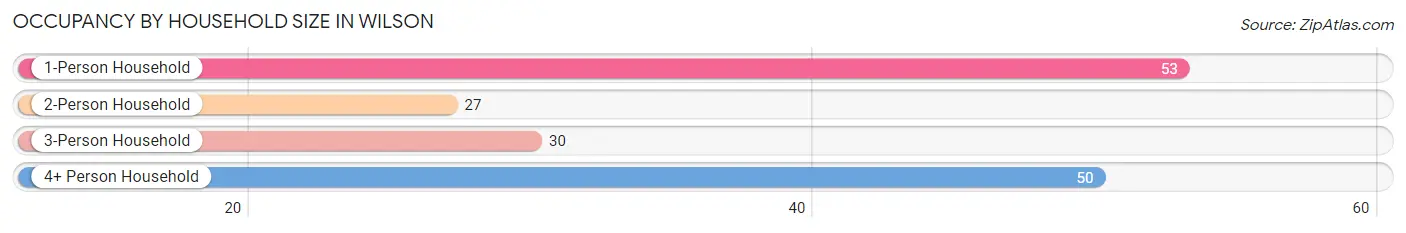
| Household Size | # Housing Units | % Housing Units |
| 1-Person Household | 53 | 33.1% |
| 2-Person Household | 27 | 16.9% |
| 3-Person Household | 30 | 18.8% |
| 4+ Person Household | 50 | 31.2% |
| Total Housing Units | 160 | 100.0% |
Occupancy by Ownership by Household Size in Wilson
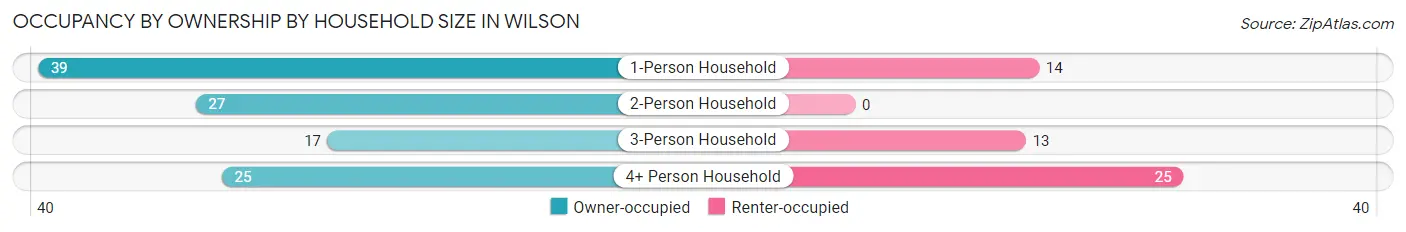
| Household Size | Owner-occupied | Renter-occupied |
| 1-Person Household | 39 (73.6%) | 14 (26.4%) |
| 2-Person Household | 27 (100.0%) | 0 (0.0%) |
| 3-Person Household | 17 (56.7%) | 13 (43.3%) |
| 4+ Person Household | 25 (50.0%) | 25 (50.0%) |
| Total Housing Units | 108 (67.5%) | 52 (32.5%) |
Occupancy by Educational Attainment in Wilson
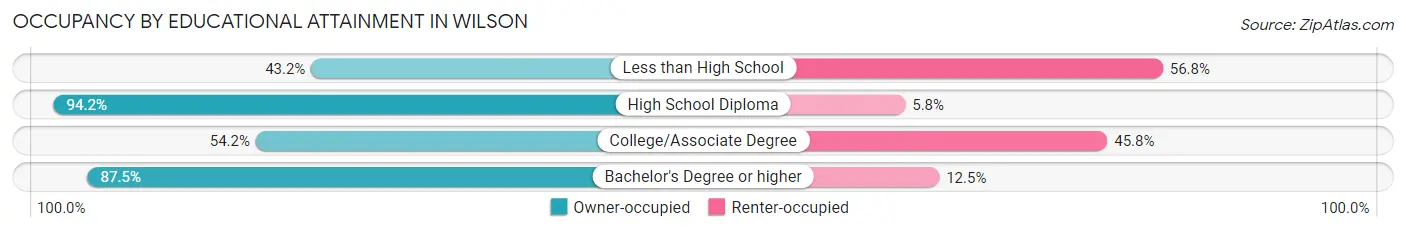
| Household Size | Owner-occupied | Renter-occupied |
| Less than High School | 19 (43.2%) | 25 (56.8%) |
| High School Diploma | 49 (94.2%) | 3 (5.8%) |
| College/Associate Degree | 26 (54.2%) | 22 (45.8%) |
| Bachelor's Degree or higher | 14 (87.5%) | 2 (12.5%) |
Occupancy by Age of Householder in Wilson
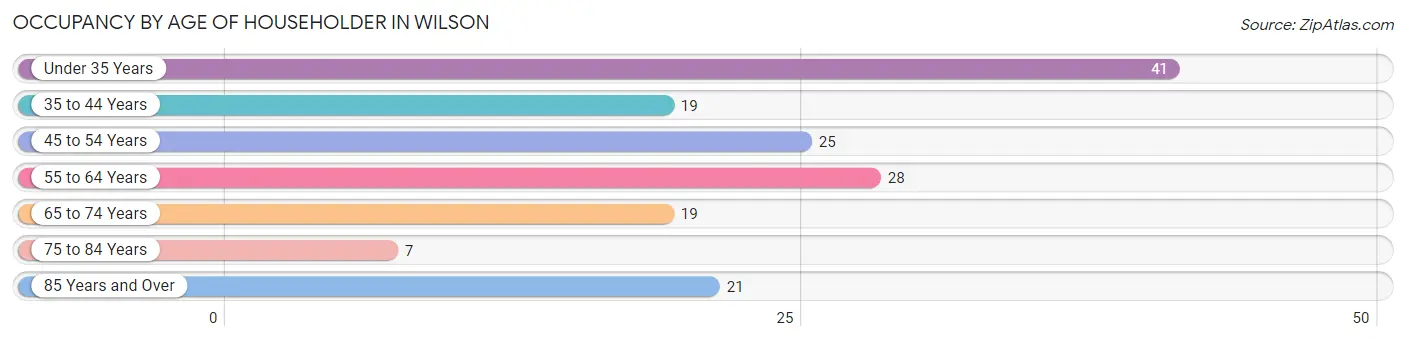
| Age Bracket | # Households | % Households |
| Under 35 Years | 41 | 25.6% |
| 35 to 44 Years | 19 | 11.9% |
| 45 to 54 Years | 25 | 15.6% |
| 55 to 64 Years | 28 | 17.5% |
| 65 to 74 Years | 19 | 11.9% |
| 75 to 84 Years | 7 | 4.4% |
| 85 Years and Over | 21 | 13.1% |
| Total | 160 | 100.0% |
Housing Finances in Wilson
Median Income by Occupancy in Wilson
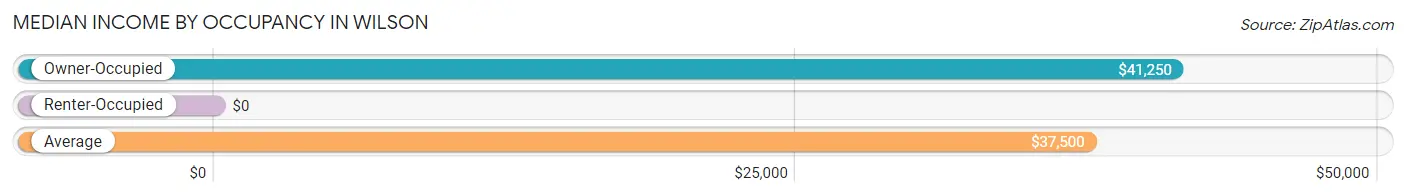
| Occupancy Type | # Households | Median Income |
| Owner-Occupied | 108 (67.5%) | $41,250 |
| Renter-Occupied | 52 (32.5%) | $0 |
| Average | 160 (100.0%) | $37,500 |
Occupancy by Householder Income Bracket in Wilson
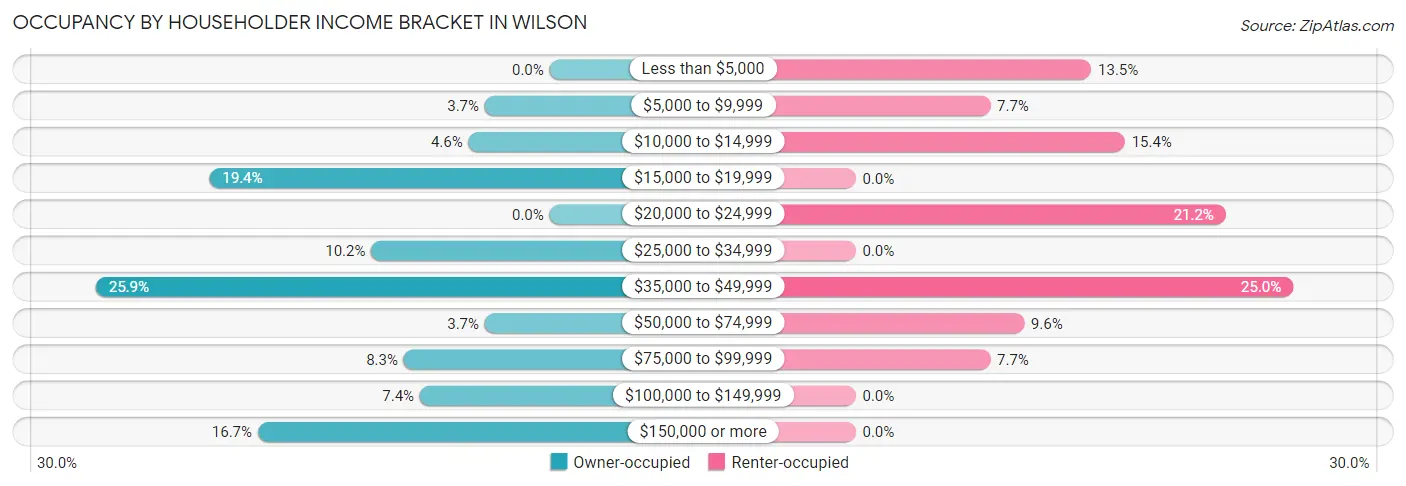
| Income Bracket | Owner-occupied | Renter-occupied |
| Less than $5,000 | 0 (0.0%) | 7 (13.5%) |
| $5,000 to $9,999 | 4 (3.7%) | 4 (7.7%) |
| $10,000 to $14,999 | 5 (4.6%) | 8 (15.4%) |
| $15,000 to $19,999 | 21 (19.4%) | 0 (0.0%) |
| $20,000 to $24,999 | 0 (0.0%) | 11 (21.1%) |
| $25,000 to $34,999 | 11 (10.2%) | 0 (0.0%) |
| $35,000 to $49,999 | 28 (25.9%) | 13 (25.0%) |
| $50,000 to $74,999 | 4 (3.7%) | 5 (9.6%) |
| $75,000 to $99,999 | 9 (8.3%) | 4 (7.7%) |
| $100,000 to $149,999 | 8 (7.4%) | 0 (0.0%) |
| $150,000 or more | 18 (16.7%) | 0 (0.0%) |
| Total | 108 (100.0%) | 52 (100.0%) |
Monthly Housing Cost Tiers in Wilson
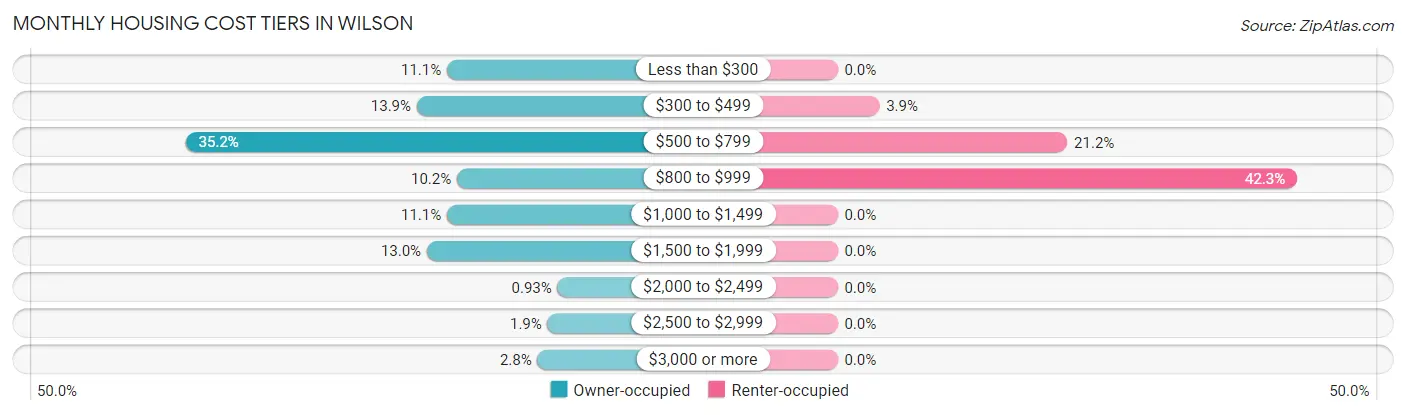
| Monthly Cost | Owner-occupied | Renter-occupied |
| Less than $300 | 12 (11.1%) | 0 (0.0%) |
| $300 to $499 | 15 (13.9%) | 2 (3.8%) |
| $500 to $799 | 38 (35.2%) | 11 (21.1%) |
| $800 to $999 | 11 (10.2%) | 22 (42.3%) |
| $1,000 to $1,499 | 12 (11.1%) | 0 (0.0%) |
| $1,500 to $1,999 | 14 (13.0%) | 0 (0.0%) |
| $2,000 to $2,499 | 1 (0.9%) | 0 (0.0%) |
| $2,500 to $2,999 | 2 (1.8%) | 0 (0.0%) |
| $3,000 or more | 3 (2.8%) | 0 (0.0%) |
| Total | 108 (100.0%) | 52 (100.0%) |
Physical Housing Characteristics in Wilson
Housing Structures in Wilson
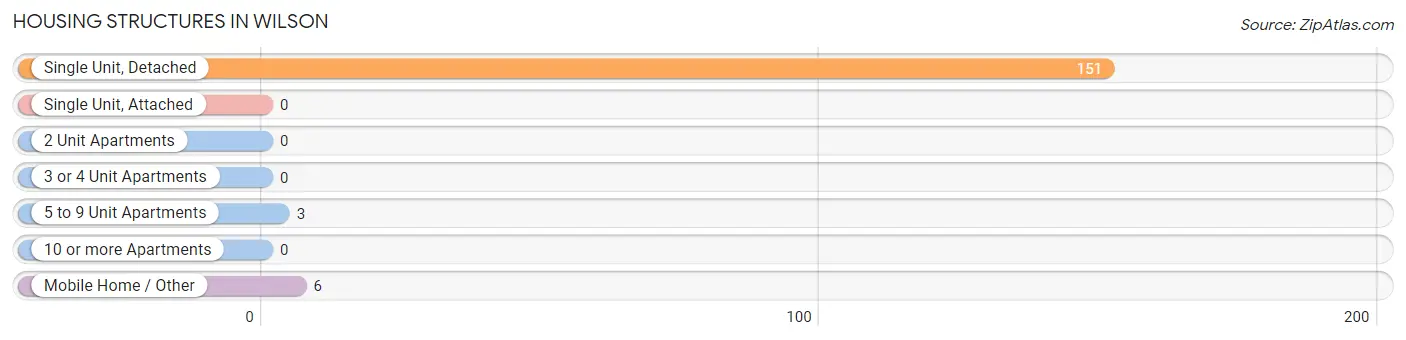
| Structure Type | # Housing Units | % Housing Units |
| Single Unit, Detached | 151 | 94.4% |
| Single Unit, Attached | 0 | 0.0% |
| 2 Unit Apartments | 0 | 0.0% |
| 3 or 4 Unit Apartments | 0 | 0.0% |
| 5 to 9 Unit Apartments | 3 | 1.9% |
| 10 or more Apartments | 0 | 0.0% |
| Mobile Home / Other | 6 | 3.7% |
| Total | 160 | 100.0% |
Housing Structures by Occupancy in Wilson
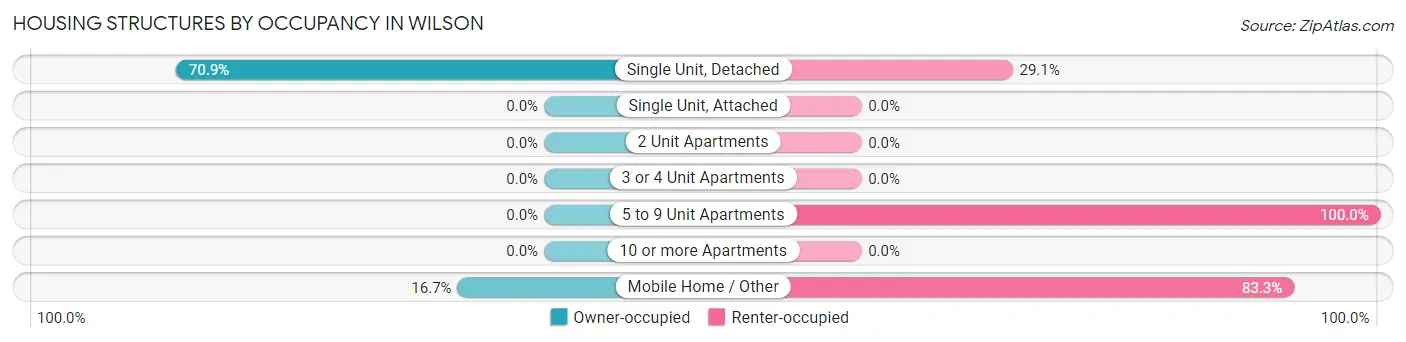
| Structure Type | Owner-occupied | Renter-occupied |
| Single Unit, Detached | 107 (70.9%) | 44 (29.1%) |
| Single Unit, Attached | 0 (0.0%) | 0 (0.0%) |
| 2 Unit Apartments | 0 (0.0%) | 0 (0.0%) |
| 3 or 4 Unit Apartments | 0 (0.0%) | 0 (0.0%) |
| 5 to 9 Unit Apartments | 0 (0.0%) | 3 (100.0%) |
| 10 or more Apartments | 0 (0.0%) | 0 (0.0%) |
| Mobile Home / Other | 1 (16.7%) | 5 (83.3%) |
| Total | 108 (67.5%) | 52 (32.5%) |
Housing Structures by Number of Rooms in Wilson
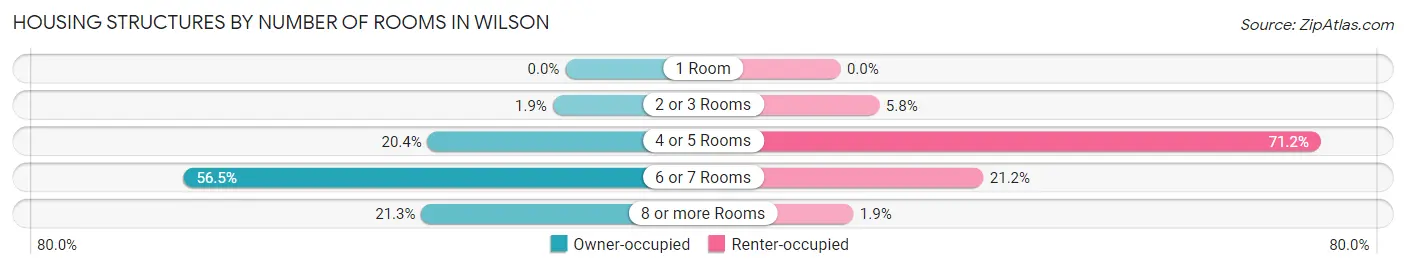
| Number of Rooms | Owner-occupied | Renter-occupied |
| 1 Room | 0 (0.0%) | 0 (0.0%) |
| 2 or 3 Rooms | 2 (1.8%) | 3 (5.8%) |
| 4 or 5 Rooms | 22 (20.4%) | 37 (71.2%) |
| 6 or 7 Rooms | 61 (56.5%) | 11 (21.1%) |
| 8 or more Rooms | 23 (21.3%) | 1 (1.9%) |
| Total | 108 (100.0%) | 52 (100.0%) |
Housing Structure by Heating Type in Wilson
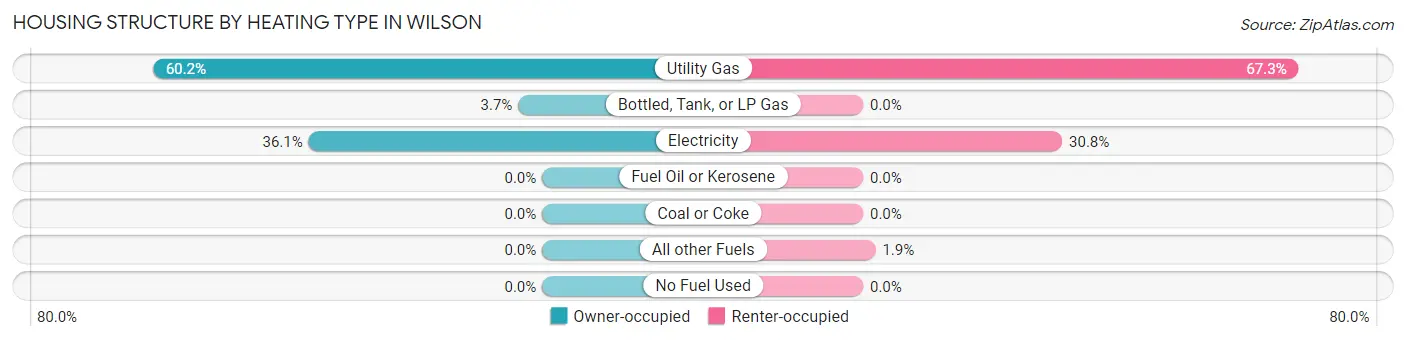
| Heating Type | Owner-occupied | Renter-occupied |
| Utility Gas | 65 (60.2%) | 35 (67.3%) |
| Bottled, Tank, or LP Gas | 4 (3.7%) | 0 (0.0%) |
| Electricity | 39 (36.1%) | 16 (30.8%) |
| Fuel Oil or Kerosene | 0 (0.0%) | 0 (0.0%) |
| Coal or Coke | 0 (0.0%) | 0 (0.0%) |
| All other Fuels | 0 (0.0%) | 1 (1.9%) |
| No Fuel Used | 0 (0.0%) | 0 (0.0%) |
| Total | 108 (100.0%) | 52 (100.0%) |
Household Vehicle Usage in Wilson
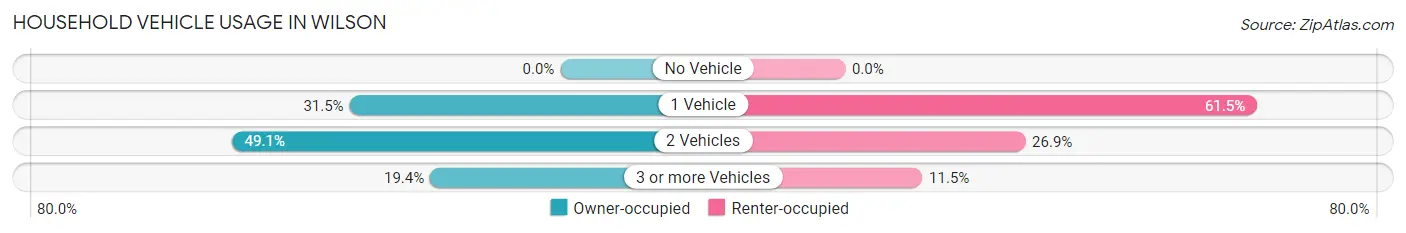
| Vehicles per Household | Owner-occupied | Renter-occupied |
| No Vehicle | 0 (0.0%) | 0 (0.0%) |
| 1 Vehicle | 34 (31.5%) | 32 (61.5%) |
| 2 Vehicles | 53 (49.1%) | 14 (26.9%) |
| 3 or more Vehicles | 21 (19.4%) | 6 (11.5%) |
| Total | 108 (100.0%) | 52 (100.0%) |
Real Estate & Mortgages in Wilson
Real Estate and Mortgage Overview in Wilson
| Characteristic | Without Mortgage | With Mortgage |
| Housing Units | 70 | 38 |
| Median Property Value | $116,700 | $88,200 |
| Median Household Income | $36,944 | $8 |
| Monthly Housing Costs | $542 | $0 |
| Real Estate Taxes | $2,061 | $0 |
Property Value by Mortgage Status in Wilson
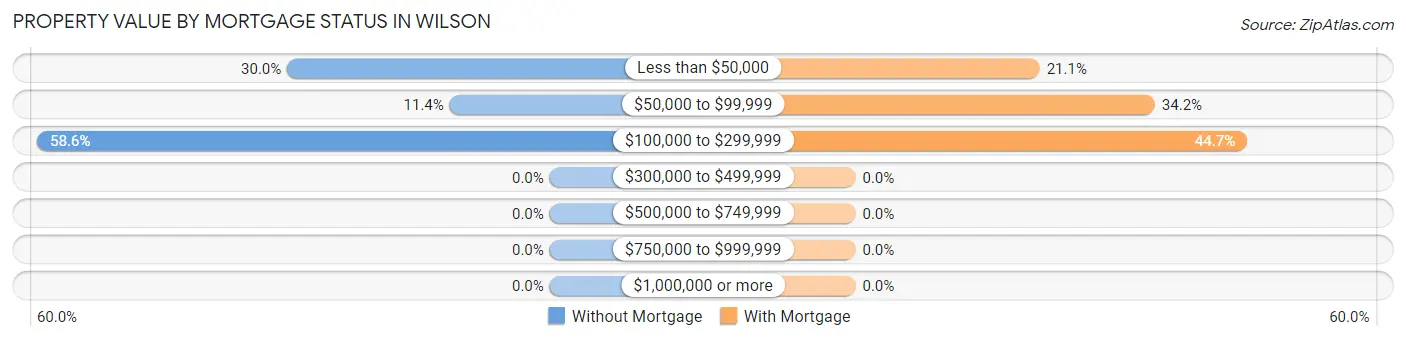
| Property Value | Without Mortgage | With Mortgage |
| Less than $50,000 | 21 (30.0%) | 8 (21.0%) |
| $50,000 to $99,999 | 8 (11.4%) | 13 (34.2%) |
| $100,000 to $299,999 | 41 (58.6%) | 17 (44.7%) |
| $300,000 to $499,999 | 0 (0.0%) | 0 (0.0%) |
| $500,000 to $749,999 | 0 (0.0%) | 0 (0.0%) |
| $750,000 to $999,999 | 0 (0.0%) | 0 (0.0%) |
| $1,000,000 or more | 0 (0.0%) | 0 (0.0%) |
| Total | 70 (100.0%) | 38 (100.0%) |
Household Income by Mortgage Status in Wilson
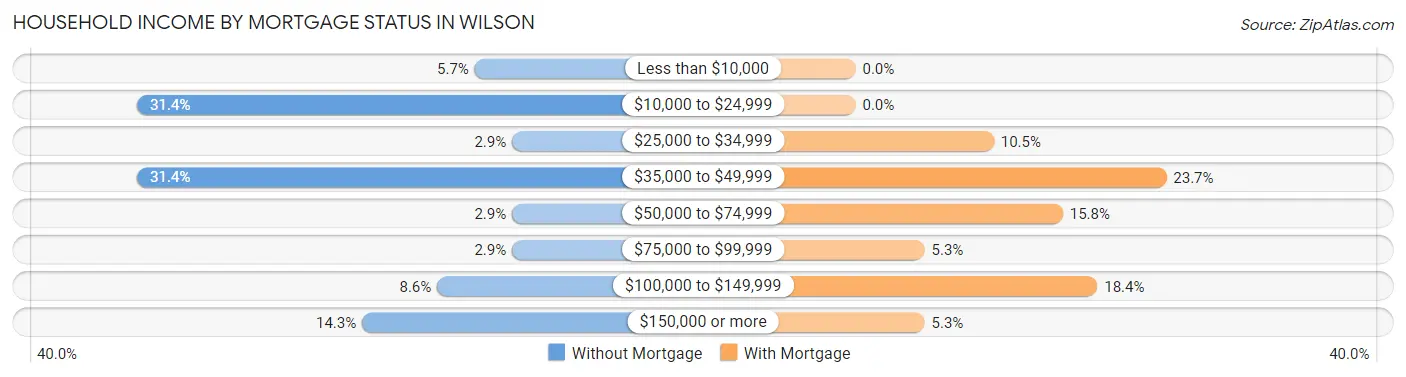
| Household Income | Without Mortgage | With Mortgage |
| Less than $10,000 | 4 (5.7%) | 0 (0.0%) |
| $10,000 to $24,999 | 22 (31.4%) | 0 (0.0%) |
| $25,000 to $34,999 | 2 (2.9%) | 4 (10.5%) |
| $35,000 to $49,999 | 22 (31.4%) | 9 (23.7%) |
| $50,000 to $74,999 | 2 (2.9%) | 6 (15.8%) |
| $75,000 to $99,999 | 2 (2.9%) | 2 (5.3%) |
| $100,000 to $149,999 | 6 (8.6%) | 7 (18.4%) |
| $150,000 or more | 10 (14.3%) | 2 (5.3%) |
| Total | 70 (100.0%) | 38 (100.0%) |
Property Value to Household Income Ratio in Wilson
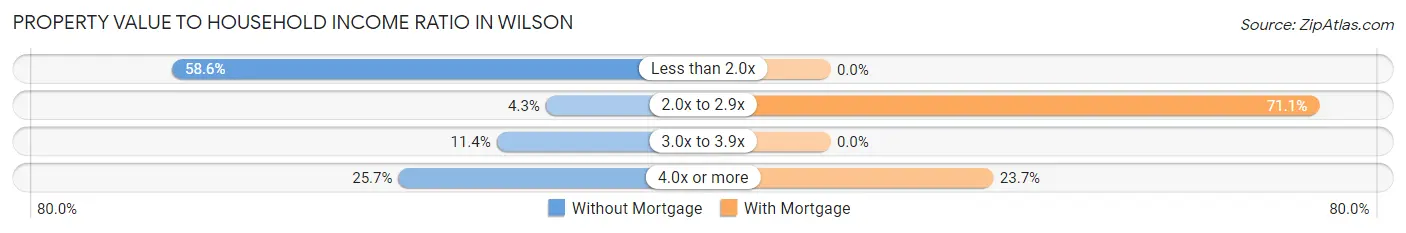
| Value-to-Income Ratio | Without Mortgage | With Mortgage |
| Less than 2.0x | 41 (58.6%) | 0 (0.0%) |
| 2.0x to 2.9x | 3 (4.3%) | 27 (71.1%) |
| 3.0x to 3.9x | 8 (11.4%) | 0 (0.0%) |
| 4.0x or more | 18 (25.7%) | 9 (23.7%) |
| Total | 70 (100.0%) | 38 (100.0%) |
Real Estate Taxes by Mortgage Status in Wilson
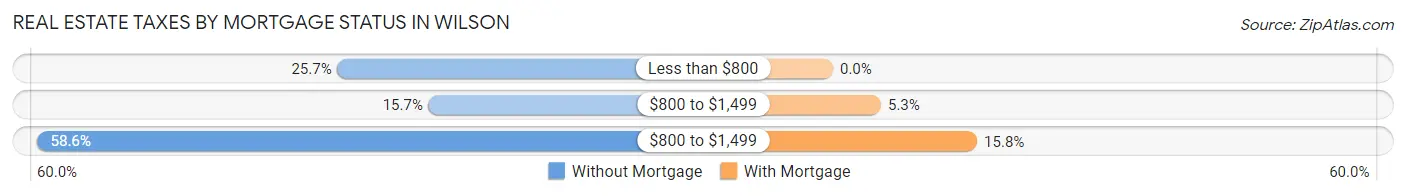
| Property Taxes | Without Mortgage | With Mortgage |
| Less than $800 | 18 (25.7%) | 0 (0.0%) |
| $800 to $1,499 | 11 (15.7%) | 2 (5.3%) |
| $800 to $1,499 | 41 (58.6%) | 6 (15.8%) |
| Total | 70 (100.0%) | 38 (100.0%) |
Health & Disability in Wilson
Health Insurance Coverage by Age in Wilson
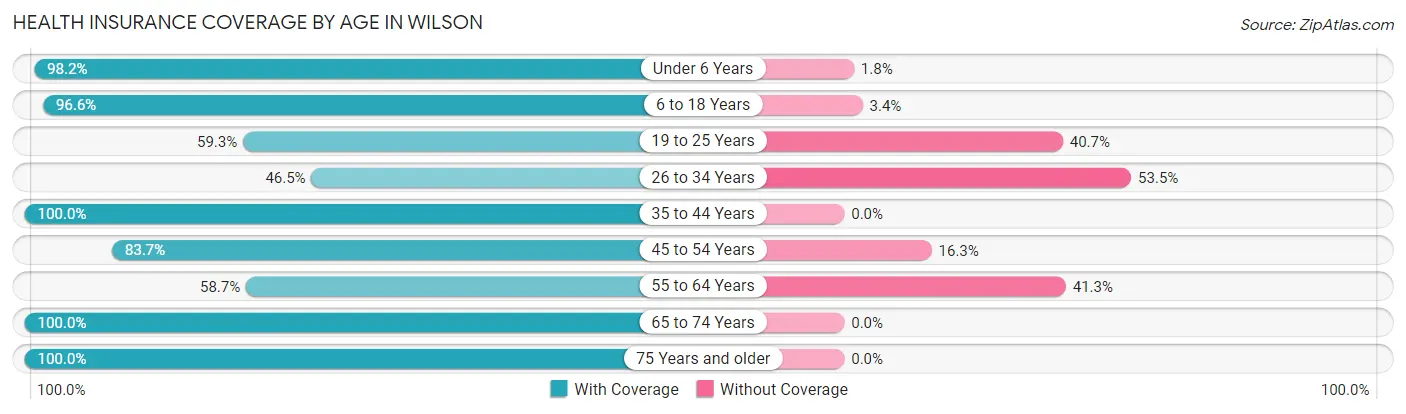
| Age Bracket | With Coverage | Without Coverage |
| Under 6 Years | 55 (98.2%) | 1 (1.8%) |
| 6 to 18 Years | 113 (96.6%) | 4 (3.4%) |
| 19 to 25 Years | 32 (59.3%) | 22 (40.7%) |
| 26 to 34 Years | 20 (46.5%) | 23 (53.5%) |
| 35 to 44 Years | 29 (100.0%) | 0 (0.0%) |
| 45 to 54 Years | 36 (83.7%) | 7 (16.3%) |
| 55 to 64 Years | 27 (58.7%) | 19 (41.3%) |
| 65 to 74 Years | 25 (100.0%) | 0 (0.0%) |
| 75 Years and older | 35 (100.0%) | 0 (0.0%) |
| Total | 372 (83.0%) | 76 (17.0%) |
Health Insurance Coverage by Citizenship Status in Wilson
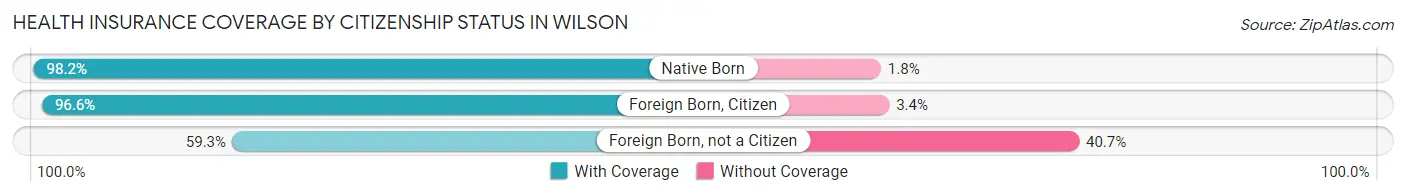
| Citizenship Status | With Coverage | Without Coverage |
| Native Born | 55 (98.2%) | 1 (1.8%) |
| Foreign Born, Citizen | 113 (96.6%) | 4 (3.4%) |
| Foreign Born, not a Citizen | 32 (59.3%) | 22 (40.7%) |
Health Insurance Coverage by Household Income in Wilson
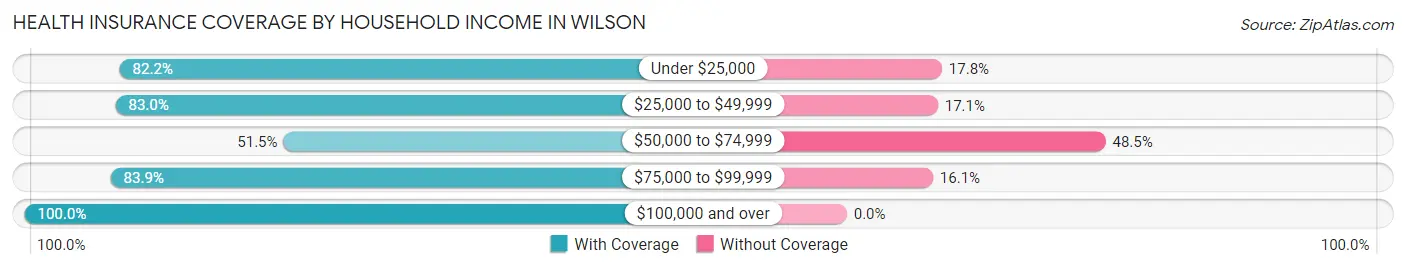
| Household Income | With Coverage | Without Coverage |
| Under $25,000 | 83 (82.2%) | 18 (17.8%) |
| $25,000 to $49,999 | 180 (83.0%) | 37 (17.1%) |
| $50,000 to $74,999 | 17 (51.5%) | 16 (48.5%) |
| $75,000 to $99,999 | 26 (83.9%) | 5 (16.1%) |
| $100,000 and over | 66 (100.0%) | 0 (0.0%) |
Public vs Private Health Insurance Coverage by Age in Wilson
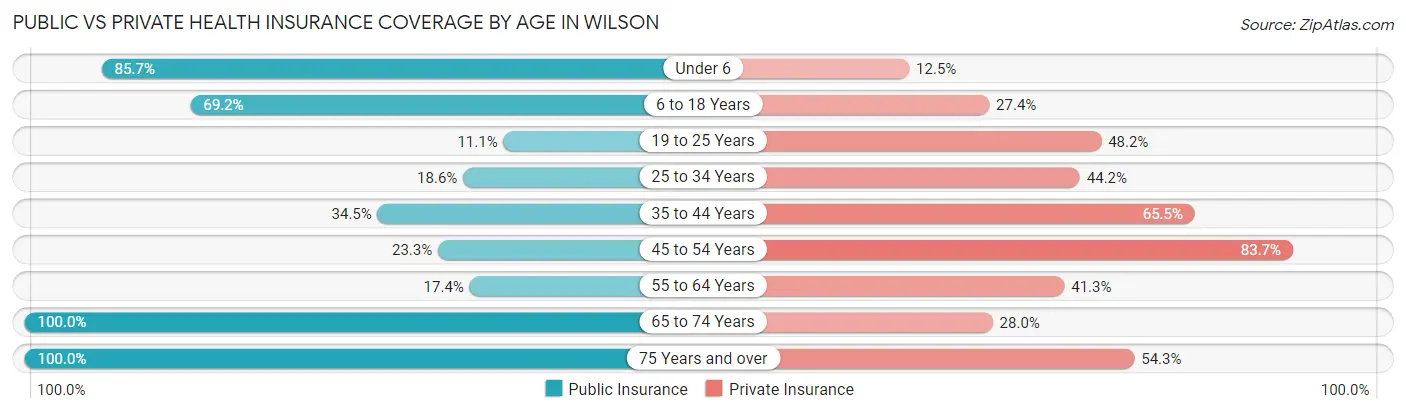
| Age Bracket | Public Insurance | Private Insurance |
| Under 6 | 48 (85.7%) | 7 (12.5%) |
| 6 to 18 Years | 81 (69.2%) | 32 (27.4%) |
| 19 to 25 Years | 6 (11.1%) | 26 (48.1%) |
| 25 to 34 Years | 8 (18.6%) | 19 (44.2%) |
| 35 to 44 Years | 10 (34.5%) | 19 (65.5%) |
| 45 to 54 Years | 10 (23.3%) | 36 (83.7%) |
| 55 to 64 Years | 8 (17.4%) | 19 (41.3%) |
| 65 to 74 Years | 25 (100.0%) | 7 (28.0%) |
| 75 Years and over | 35 (100.0%) | 19 (54.3%) |
| Total | 231 (51.6%) | 184 (41.1%) |
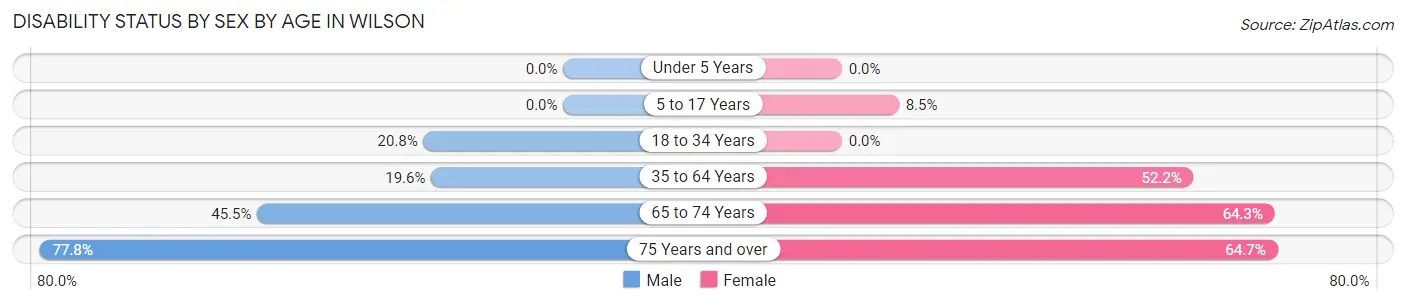
Disability Status by Sex by Age in Wilson
| Age Bracket | Male | Female |
| Under 5 Years | 0 (0.0%) | 0 (0.0%) |
| 5 to 17 Years | 0 (0.0%) | 6 (8.5%) |
| 18 to 34 Years | 11 (20.7%) | 0 (0.0%) |
| 35 to 64 Years | 10 (19.6%) | 35 (52.2%) |
| 65 to 74 Years | 5 (45.5%) | 9 (64.3%) |
| 75 Years and over | 14 (77.8%) | 11 (64.7%) |
Disability Class by Sex by Age in Wilson
Disability Class: Hearing Difficulty
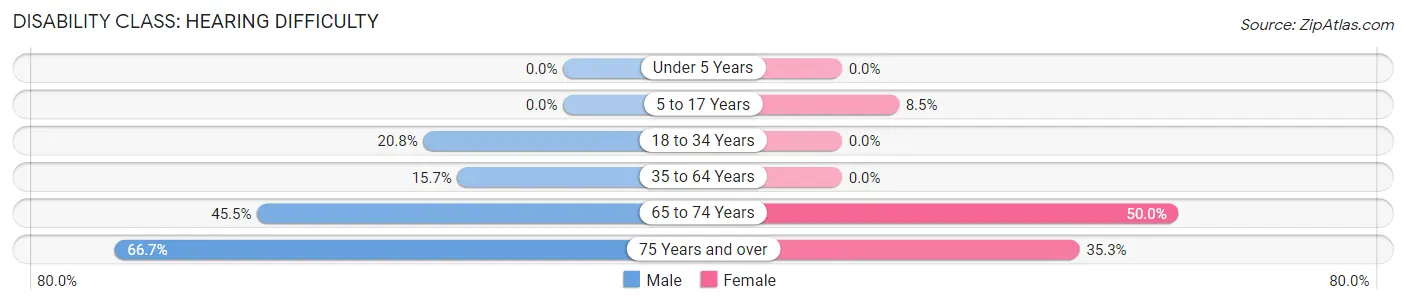
| Age Bracket | Male | Female |
| Under 5 Years | 0 (0.0%) | 0 (0.0%) |
| 5 to 17 Years | 0 (0.0%) | 6 (8.5%) |
| 18 to 34 Years | 11 (20.7%) | 0 (0.0%) |
| 35 to 64 Years | 8 (15.7%) | 0 (0.0%) |
| 65 to 74 Years | 5 (45.5%) | 7 (50.0%) |
| 75 Years and over | 12 (66.7%) | 6 (35.3%) |
Disability Class: Vision Difficulty
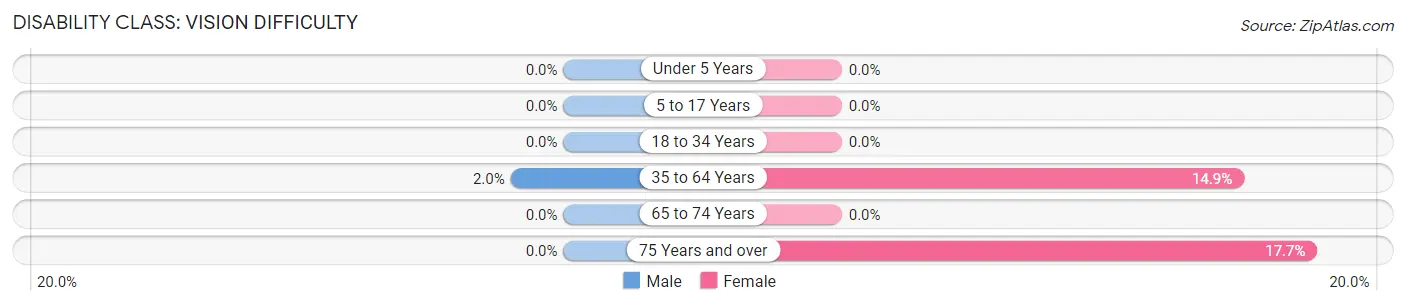
| Age Bracket | Male | Female |
| Under 5 Years | 0 (0.0%) | 0 (0.0%) |
| 5 to 17 Years | 0 (0.0%) | 0 (0.0%) |
| 18 to 34 Years | 0 (0.0%) | 0 (0.0%) |
| 35 to 64 Years | 1 (2.0%) | 10 (14.9%) |
| 65 to 74 Years | 0 (0.0%) | 0 (0.0%) |
| 75 Years and over | 0 (0.0%) | 3 (17.6%) |
Disability Class: Cognitive Difficulty
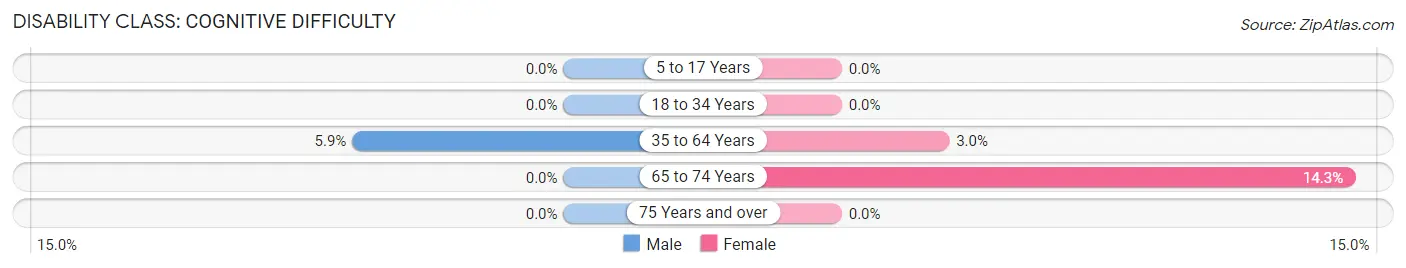
| Age Bracket | Male | Female |
| 5 to 17 Years | 0 (0.0%) | 0 (0.0%) |
| 18 to 34 Years | 0 (0.0%) | 0 (0.0%) |
| 35 to 64 Years | 3 (5.9%) | 2 (3.0%) |
| 65 to 74 Years | 0 (0.0%) | 2 (14.3%) |
| 75 Years and over | 0 (0.0%) | 0 (0.0%) |
Disability Class: Ambulatory Difficulty
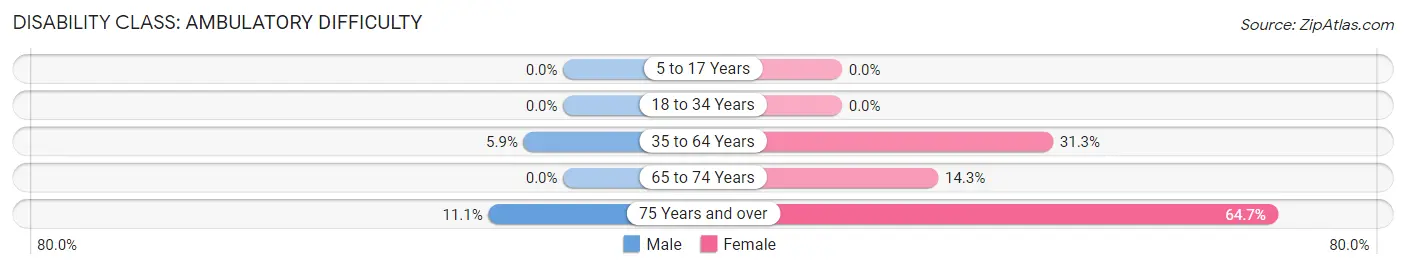
| Age Bracket | Male | Female |
| 5 to 17 Years | 0 (0.0%) | 0 (0.0%) |
| 18 to 34 Years | 0 (0.0%) | 0 (0.0%) |
| 35 to 64 Years | 3 (5.9%) | 21 (31.3%) |
| 65 to 74 Years | 0 (0.0%) | 2 (14.3%) |
| 75 Years and over | 2 (11.1%) | 11 (64.7%) |
Disability Class: Self-Care Difficulty
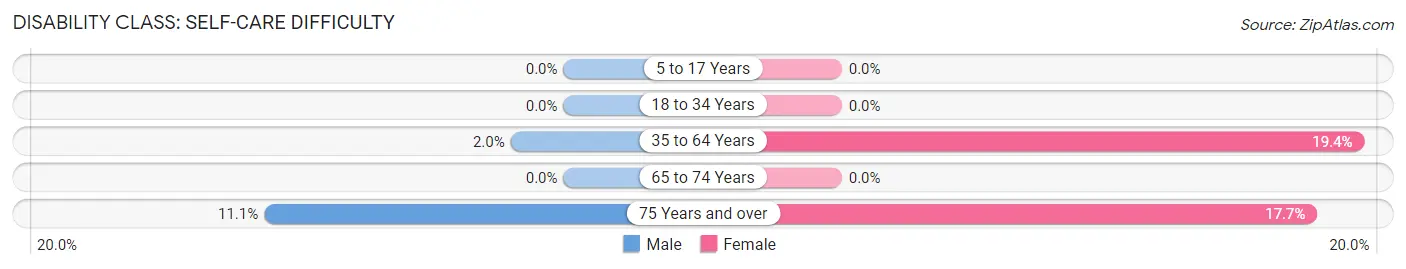
| Age Bracket | Male | Female |
| 5 to 17 Years | 0 (0.0%) | 0 (0.0%) |
| 18 to 34 Years | 0 (0.0%) | 0 (0.0%) |
| 35 to 64 Years | 1 (2.0%) | 13 (19.4%) |
| 65 to 74 Years | 0 (0.0%) | 0 (0.0%) |
| 75 Years and over | 2 (11.1%) | 3 (17.6%) |
Technology Access in Wilson
Computing Device Access in Wilson
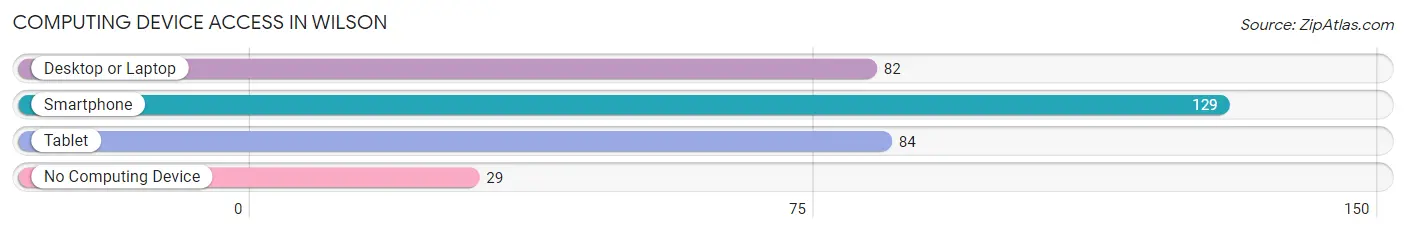
| Device Type | # Households | % Households |
| Desktop or Laptop | 82 | 51.2% |
| Smartphone | 129 | 80.6% |
| Tablet | 84 | 52.5% |
| No Computing Device | 29 | 18.1% |
| Total | 160 | 100.0% |
Internet Access in Wilson
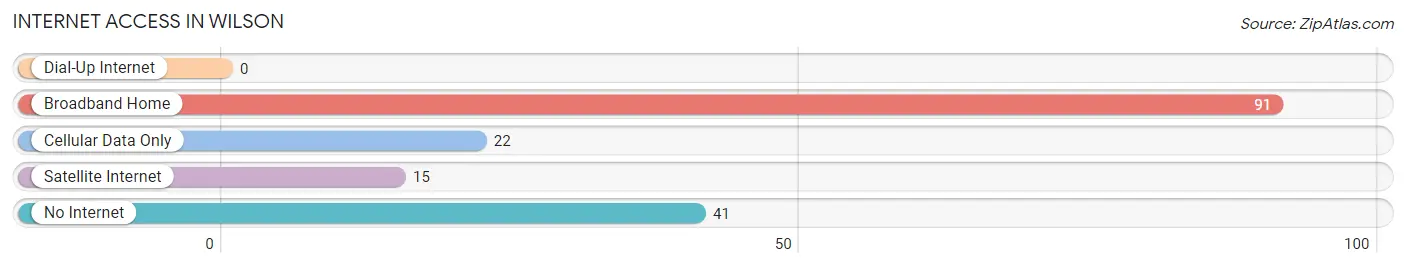
| Internet Type | # Households | % Households |
| Dial-Up Internet | 0 | 0.0% |
| Broadband Home | 91 | 56.9% |
| Cellular Data Only | 22 | 13.8% |
| Satellite Internet | 15 | 9.4% |
| No Internet | 41 | 25.6% |
| Total | 160 | 100.0% |
Wilson Summary
Wilson, Texas is a small town located in the southeastern part of the state, about 25 miles south of San Antonio. It is part of Wilson County, which is one of the oldest counties in Texas, having been established in 1846. The town of Wilson was founded in 1881 and was named after the first postmaster, William Wilson.
Wilson is located in the rolling hills of the Texas Hill Country, and is surrounded by lush vegetation and wildlife. The town is situated on the banks of the San Antonio River, and is home to several parks and recreational areas. The town is also home to a variety of businesses, including a winery, a brewery, and a number of restaurants.
Geographically, Wilson is located at 29°17'N 98°17'W. It is situated at an elevation of 645 feet above sea level. The town covers an area of 1.2 square miles, and has a population of approximately 1,500 people.
The economy of Wilson is largely based on agriculture and tourism. The town is home to several wineries, breweries, and restaurants, which attract visitors from all over the state. The town is also home to a number of small businesses, including a hardware store, a grocery store, and a variety of other retail stores.
The demographics of Wilson are largely made up of white, non-Hispanic residents. According to the 2010 census, the population of Wilson was 1,521, with a median age of 37.7 years. The median household income was $37,917, and the median home value was $90,000.
Wilson is served by the Wilson Independent School District, which includes two elementary schools, one middle school, and one high school. The town is also home to a number of churches, including the First United Methodist Church, the First Baptist Church, and the Church of Jesus Christ of Latter-day Saints.
Wilson is a small town with a rich history and a vibrant economy. It is home to a variety of businesses, churches, and recreational areas, and is a great place to live and work. With its beautiful scenery and friendly people, Wilson is a great place to call home.
Common Questions
What is Per Capita Income in Wilson?
Per Capita income in Wilson is $17,871.
What is the Median Family Income in Wilson?
Median Family Income in Wilson is $42,708.
What is the Median Household income in Wilson?
Median Household Income in Wilson is $37,500.
What is Income or Wage Gap in Wilson?
Income or Wage Gap in Wilson is 30.5%.
Women in Wilson earn 69.5 cents for every dollar earned by a man.
What is Family Income Deficit in Wilson?
Family Income Deficit in Wilson is $8,140.
Families that are below poverty line in Wilson earn $8,140 less on average than the poverty threshold level.
What is Inequality or Gini Index in Wilson?
Inequality or Gini Index in Wilson is 0.47.
What is the Total Population of Wilson?
Total Population of Wilson is 451.
What is the Total Male Population of Wilson?
Total Male Population of Wilson is 215.
What is the Total Female Population of Wilson?
Total Female Population of Wilson is 236.
What is the Ratio of Males per 100 Females in Wilson?
There are 91.10 Males per 100 Females in Wilson.
What is the Ratio of Females per 100 Males in Wilson?
There are 109.77 Females per 100 Males in Wilson.
What is the Median Population Age in Wilson?
Median Population Age in Wilson is 24.5 Years.
What is the Average Family Size in Wilson
Average Family Size in Wilson is 3.5 People.
What is the Average Household Size in Wilson
Average Household Size in Wilson is 2.8 People.
How Large is the Labor Force in Wilson?
There are 154 People in the Labor Forcein in Wilson.
What is the Percentage of People in the Labor Force in Wilson?
52.6% of People are in the Labor Force in Wilson.
What is the Unemployment Rate in Wilson?
Unemployment Rate in Wilson is 2.0%.