Oilton, TX Map & Demographics
Oilton Map
Oilton Overview
$24,276
PER CAPITA INCOME
$88,750
AVG FAMILY INCOME
$39,063
AVG HOUSEHOLD INCOME
38.5%
WAGE / INCOME GAP [ % ]
61.5¢/ $1
WAGE / INCOME GAP [ $ ]
0.38
INEQUALITY / GINI INDEX
130
TOTAL POPULATION
87
MALE POPULATION
43
FEMALE POPULATION
202.33
MALES / 100 FEMALES
49.43
FEMALES / 100 MALES
48.6
MEDIAN AGE
3.8
AVG FAMILY SIZE
2.1
AVG HOUSEHOLD SIZE
68
LABOR FORCE [ PEOPLE ]
54.8%
PERCENT IN LABOR FORCE
8.8%
UNEMPLOYMENT RATE
Oilton Zip Codes
Income in Oilton
Income Overview in Oilton
Per Capita Income in Oilton is $24,276, while median incomes of families and households are $88,750 and $39,063 respectively.
| Characteristic | Number | Measure |
| Per Capita Income | 130 | $24,276 |
| Median Family Income | 24 | $88,750 |
| Mean Family Income | 24 | $80,888 |
| Median Household Income | 62 | $39,063 |
| Mean Household Income | 62 | $48,635 |
| Income Deficit | 24 | $0 |
| Wage / Income Gap (%) | 130 | 38.46% |
| Wage / Income Gap ($) | 130 | 61.54¢ per $1 |
| Gini / Inequality Index | 130 | 0.38 |
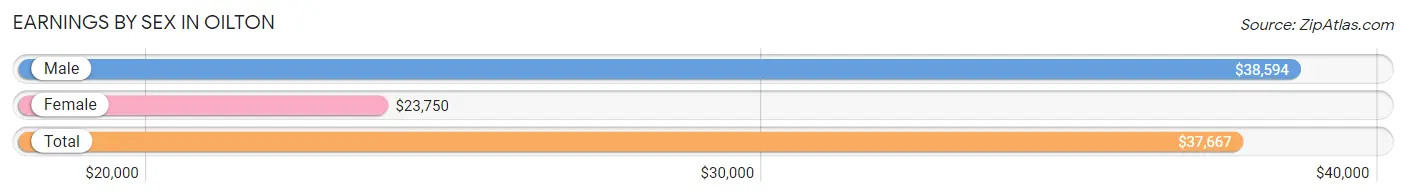
Earnings by Sex in Oilton
Average Earnings in Oilton are $37,667, $38,594 for men and $23,750 for women, a difference of 38.5%.
| Sex | Number | Average Earnings |
| Male | 49 (72.1%) | $38,594 |
| Female | 19 (27.9%) | $23,750 |
| Total | 68 (100.0%) | $37,667 |
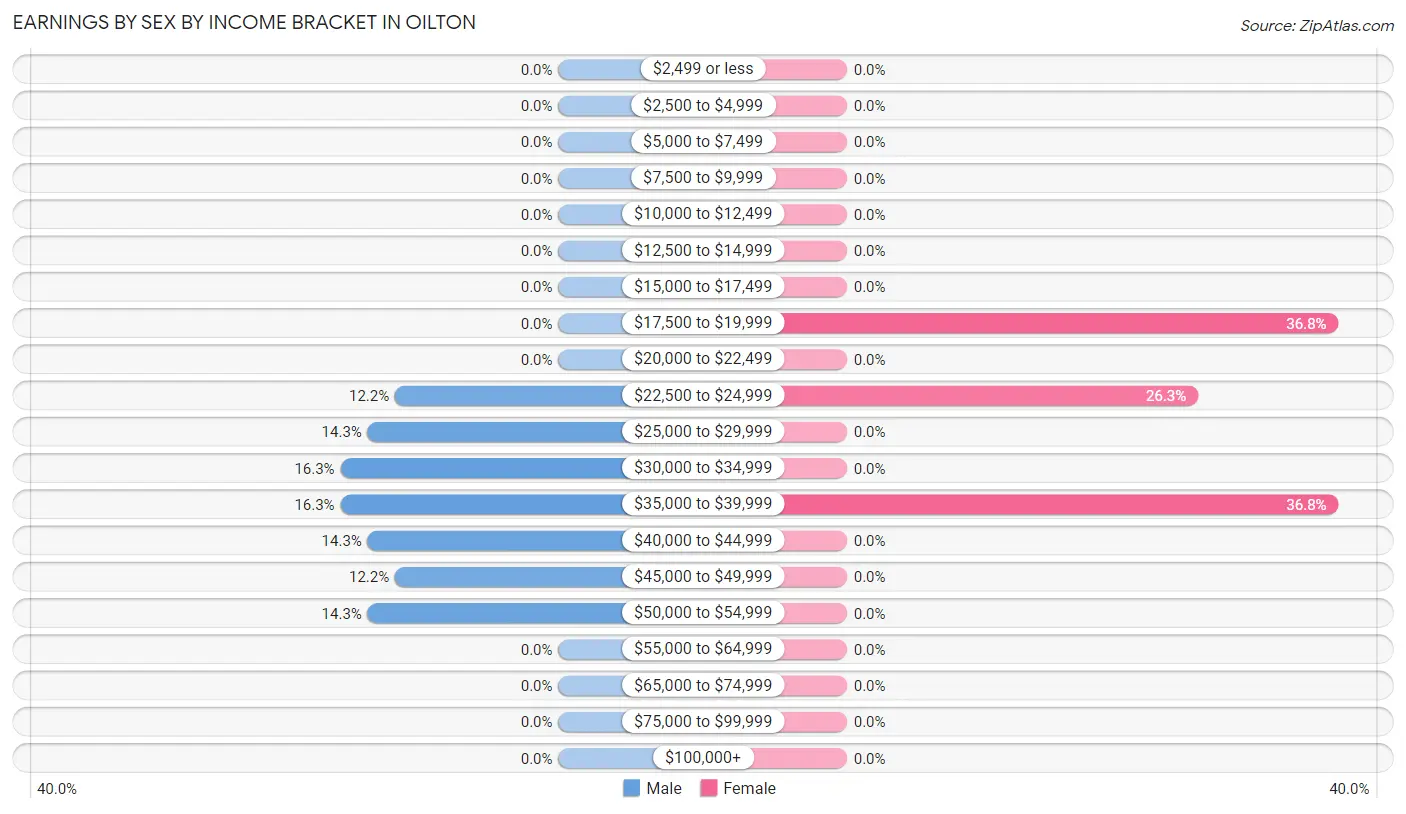
Earnings by Sex by Income Bracket in Oilton
The most common earnings brackets in Oilton are $30,000 to $34,999 for men (8 | 16.3%) and $17,500 to $19,999 for women (7 | 36.8%).
| Income | Male | Female |
| $2,499 or less | 0 (0.0%) | 0 (0.0%) |
| $2,500 to $4,999 | 0 (0.0%) | 0 (0.0%) |
| $5,000 to $7,499 | 0 (0.0%) | 0 (0.0%) |
| $7,500 to $9,999 | 0 (0.0%) | 0 (0.0%) |
| $10,000 to $12,499 | 0 (0.0%) | 0 (0.0%) |
| $12,500 to $14,999 | 0 (0.0%) | 0 (0.0%) |
| $15,000 to $17,499 | 0 (0.0%) | 0 (0.0%) |
| $17,500 to $19,999 | 0 (0.0%) | 7 (36.8%) |
| $20,000 to $22,499 | 0 (0.0%) | 0 (0.0%) |
| $22,500 to $24,999 | 6 (12.2%) | 5 (26.3%) |
| $25,000 to $29,999 | 7 (14.3%) | 0 (0.0%) |
| $30,000 to $34,999 | 8 (16.3%) | 0 (0.0%) |
| $35,000 to $39,999 | 8 (16.3%) | 7 (36.8%) |
| $40,000 to $44,999 | 7 (14.3%) | 0 (0.0%) |
| $45,000 to $49,999 | 6 (12.2%) | 0 (0.0%) |
| $50,000 to $54,999 | 7 (14.3%) | 0 (0.0%) |
| $55,000 to $64,999 | 0 (0.0%) | 0 (0.0%) |
| $65,000 to $74,999 | 0 (0.0%) | 0 (0.0%) |
| $75,000 to $99,999 | 0 (0.0%) | 0 (0.0%) |
| $100,000+ | 0 (0.0%) | 0 (0.0%) |
| Total | 49 (100.0%) | 19 (100.0%) |
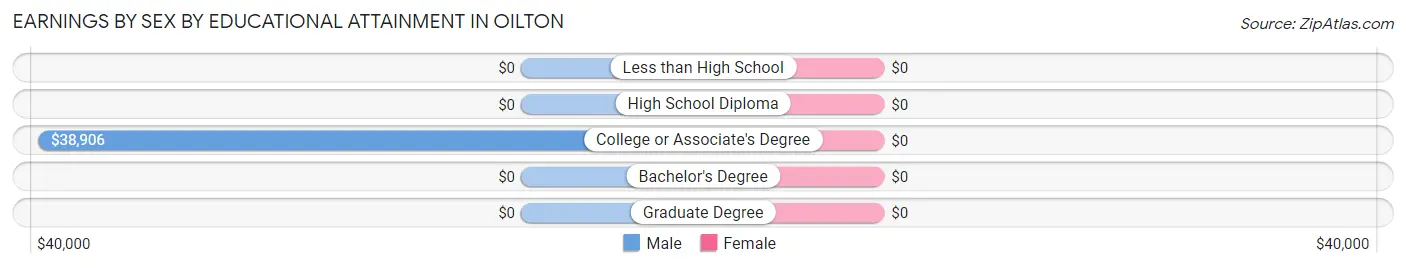
Earnings by Sex by Educational Attainment in Oilton
| Educational Attainment | Male Income | Female Income |
| Less than High School | - | - |
| High School Diploma | - | - |
| College or Associate's Degree | $38,906 | $0 |
| Bachelor's Degree | - | - |
| Graduate Degree | - | - |
| Total | $38,906 | $23,750 |
Family Income in Oilton
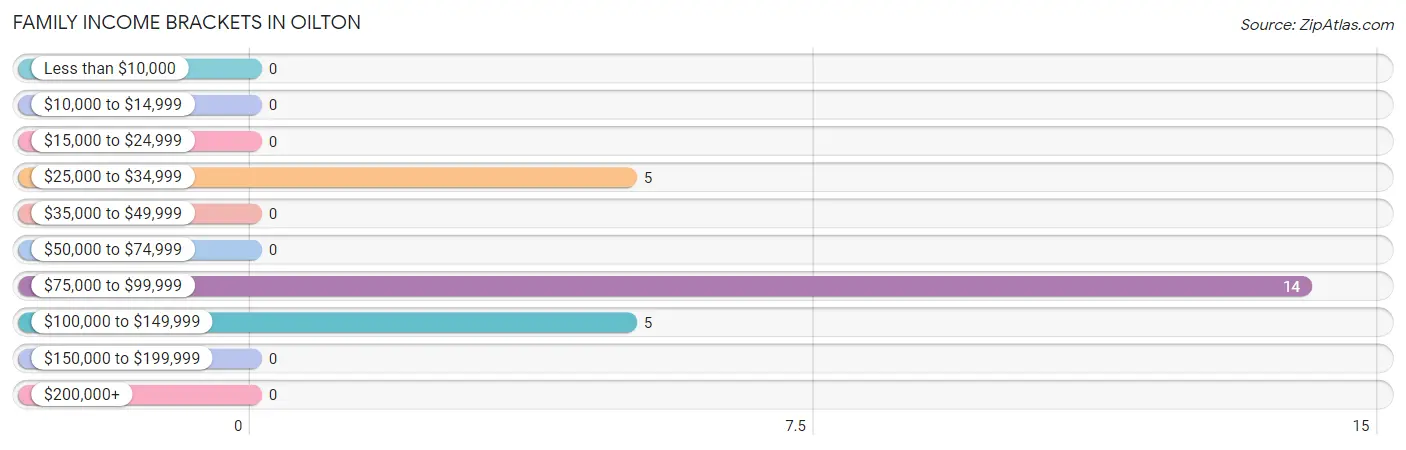
Family Income Brackets in Oilton
According to the Oilton family income data, there are 14 families falling into the $75,000 to $99,999 income range, which is the most common income bracket and makes up 58.3% of all families.
| Income Bracket | # Families | % Families |
| Less than $10,000 | 0 | 0.0% |
| $10,000 to $14,999 | 0 | 0.0% |
| $15,000 to $24,999 | 0 | 0.0% |
| $25,000 to $34,999 | 5 | 20.8% |
| $35,000 to $49,999 | 0 | 0.0% |
| $50,000 to $74,999 | 0 | 0.0% |
| $75,000 to $99,999 | 14 | 58.3% |
| $100,000 to $149,999 | 5 | 20.8% |
| $150,000 to $199,999 | 0 | 0.0% |
| $200,000+ | 0 | 0.0% |
Family Income by Famaliy Size in Oilton
| Income Bracket | # Families | Median Income |
| 2-Person Families | 12 (50.0%) | $0 |
| 3-Person Families | 0 (0.0%) | $0 |
| 4-Person Families | 0 (0.0%) | $0 |
| 5-Person Families | 7 (29.2%) | $0 |
| 6-Person Families | 5 (20.8%) | $0 |
| 7+ Person Families | 0 (0.0%) | $0 |
| Total | 24 (100.0%) | $88,750 |
Family Income by Number of Earners in Oilton
| Number of Earners | # Families | Median Income |
| No Earners | 5 (20.8%) | $0 |
| 1 Earner | 0 (0.0%) | $0 |
| 2 Earners | 7 (29.2%) | $0 |
| 3+ Earners | 12 (50.0%) | $0 |
| Total | 24 (100.0%) | $88,750 |
Household Income in Oilton
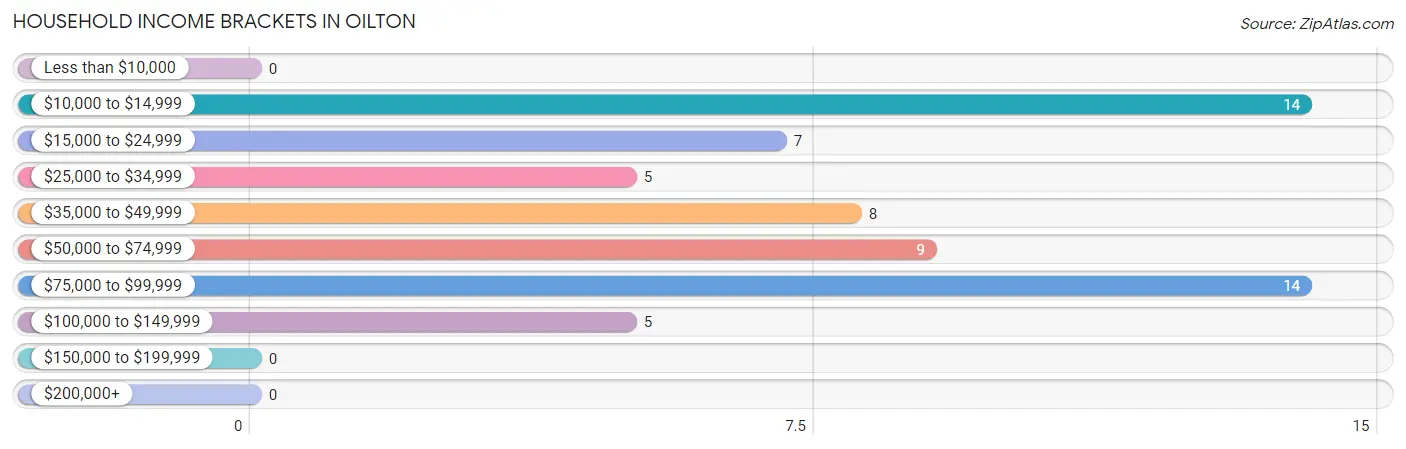
Household Income Brackets in Oilton
With 14 households falling in the category, the $10,000 to $14,999 income range is the most frequent in Oilton, accounting for 22.6% of all households.
| Income Bracket | # Households | % Households |
| Less than $10,000 | 0 | 0.0% |
| $10,000 to $14,999 | 14 | 22.6% |
| $15,000 to $24,999 | 7 | 11.3% |
| $25,000 to $34,999 | 5 | 8.1% |
| $35,000 to $49,999 | 8 | 12.9% |
| $50,000 to $74,999 | 9 | 14.5% |
| $75,000 to $99,999 | 14 | 22.6% |
| $100,000 to $149,999 | 5 | 8.1% |
| $150,000 to $199,999 | 0 | 0.0% |
| $200,000+ | 0 | 0.0% |
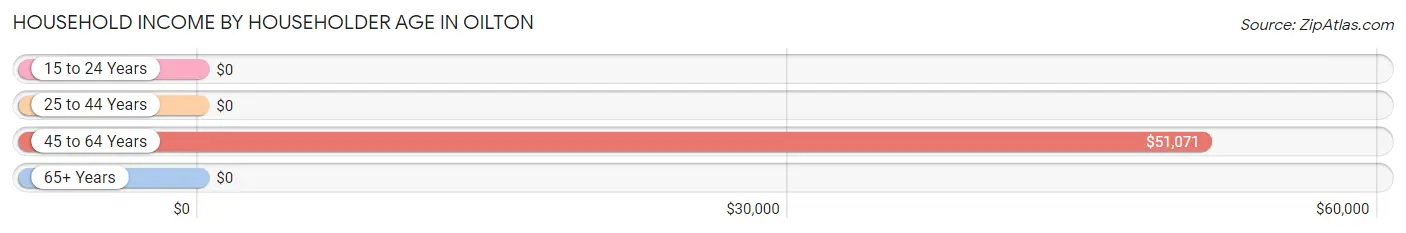
Household Income by Householder Age in Oilton
The median household income in Oilton is $39,063, with the highest median household income of $51,071 found in the 45 to 64 years age bracket for the primary householder. A total of 36 households (58.1%) fall into this category.
| Income Bracket | # Households | Median Income |
| 15 to 24 Years | 0 (0.0%) | $0 |
| 25 to 44 Years | 5 (8.1%) | $0 |
| 45 to 64 Years | 36 (58.1%) | $51,071 |
| 65+ Years | 21 (33.9%) | $0 |
| Total | 62 (100.0%) | $39,063 |
Poverty in Oilton
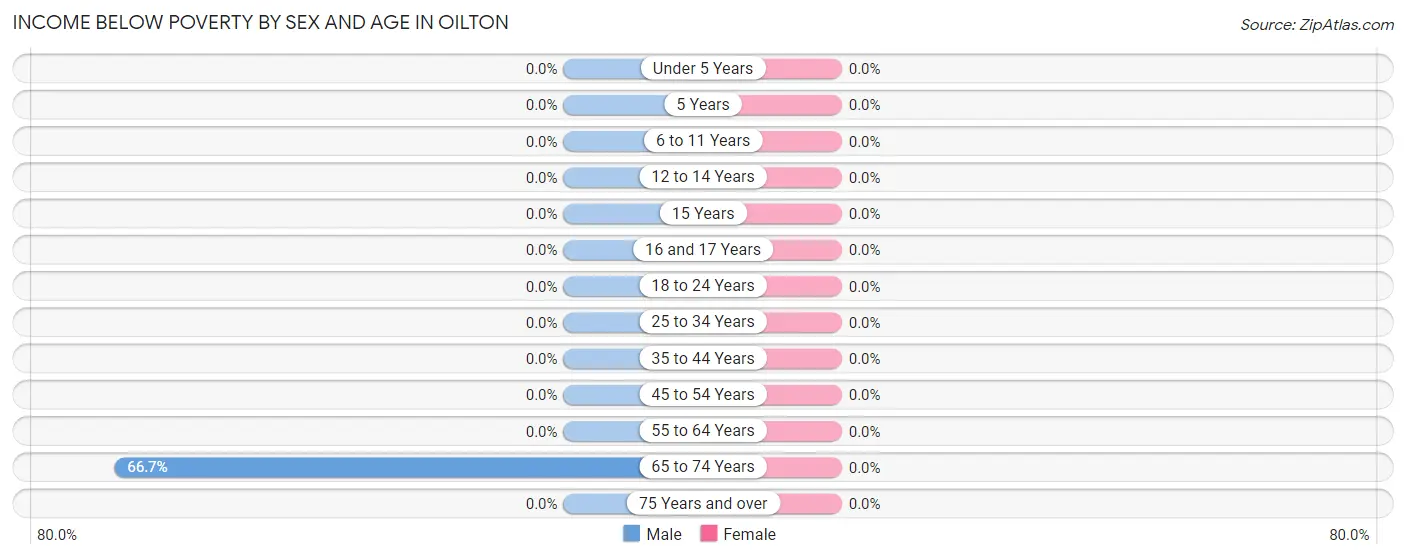
Income Below Poverty by Sex and Age in Oilton
| Age Bracket | Male | Female |
| Under 5 Years | 0 (0.0%) | 0 (0.0%) |
| 5 Years | 0 (0.0%) | 0 (0.0%) |
| 6 to 11 Years | 0 (0.0%) | 0 (0.0%) |
| 12 to 14 Years | 0 (0.0%) | 0 (0.0%) |
| 15 Years | 0 (0.0%) | 0 (0.0%) |
| 16 and 17 Years | 0 (0.0%) | 0 (0.0%) |
| 18 to 24 Years | 0 (0.0%) | 0 (0.0%) |
| 25 to 34 Years | 0 (0.0%) | 0 (0.0%) |
| 35 to 44 Years | 0 (0.0%) | 0 (0.0%) |
| 45 to 54 Years | 0 (0.0%) | 0 (0.0%) |
| 55 to 64 Years | 0 (0.0%) | 0 (0.0%) |
| 65 to 74 Years | 14 (66.7%) | 0 (0.0%) |
| 75 Years and over | 0 (0.0%) | 0 (0.0%) |
| Total | 14 (16.1%) | 0 (0.0%) |
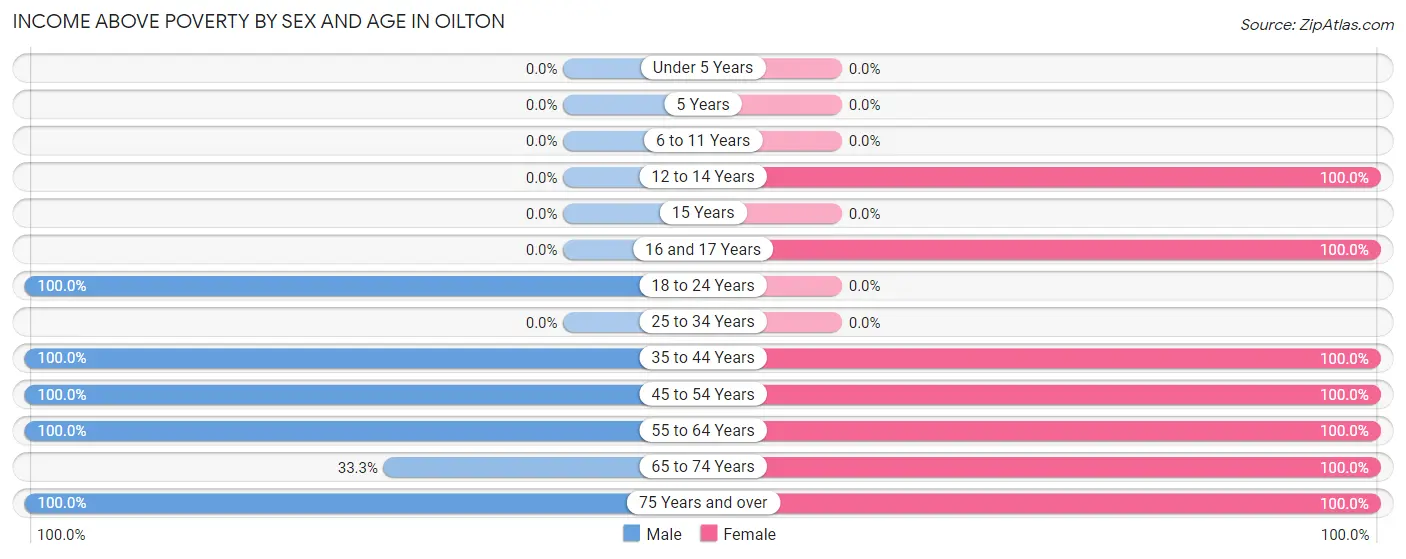
Income Above Poverty by Sex and Age in Oilton
According to the poverty statistics in Oilton, males aged 18 to 24 years and females aged 12 to 14 years are the age groups that are most secure financially, with 100.0% of males and 100.0% of females in these age groups living above the poverty line.
| Age Bracket | Male | Female |
| Under 5 Years | 0 (0.0%) | 0 (0.0%) |
| 5 Years | 0 (0.0%) | 0 (0.0%) |
| 6 to 11 Years | 0 (0.0%) | 0 (0.0%) |
| 12 to 14 Years | 0 (0.0%) | 6 (100.0%) |
| 15 Years | 0 (0.0%) | 0 (0.0%) |
| 16 and 17 Years | 0 (0.0%) | 11 (100.0%) |
| 18 to 24 Years | 25 (100.0%) | 0 (0.0%) |
| 25 to 34 Years | 0 (0.0%) | 0 (0.0%) |
| 35 to 44 Years | 6 (100.0%) | 5 (100.0%) |
| 45 to 54 Years | 15 (100.0%) | 7 (100.0%) |
| 55 to 64 Years | 14 (100.0%) | 7 (100.0%) |
| 65 to 74 Years | 7 (33.3%) | 5 (100.0%) |
| 75 Years and over | 6 (100.0%) | 2 (100.0%) |
| Total | 73 (83.9%) | 43 (100.0%) |
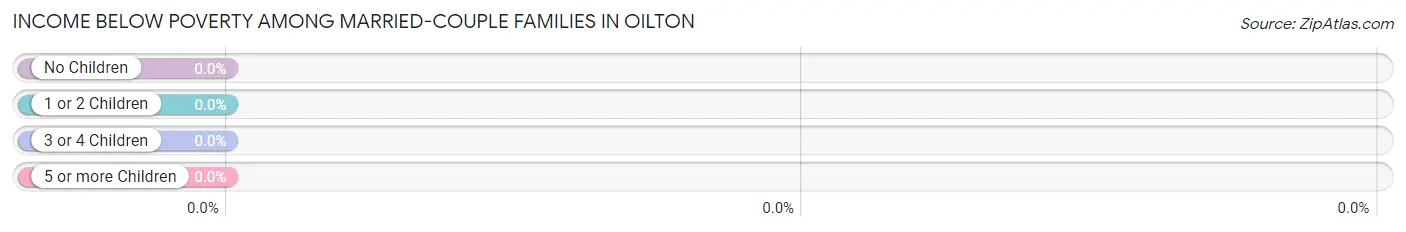
Income Below Poverty Among Married-Couple Families in Oilton
| Children | Above Poverty | Below Poverty |
| No Children | 5 (100.0%) | 0 (0.0%) |
| 1 or 2 Children | 12 (100.0%) | 0 (0.0%) |
| 3 or 4 Children | 0 (0.0%) | 0 (0.0%) |
| 5 or more Children | 0 (0.0%) | 0 (0.0%) |
| Total | 17 (100.0%) | 0 (0.0%) |
Income Below Poverty Among Single-Parent Households in Oilton
| Children | Single Father | Single Mother |
| No Children | 0 (0.0%) | 0 (0.0%) |
| 1 or 2 Children | 0 (0.0%) | 0 (0.0%) |
| 3 or 4 Children | 0 (0.0%) | 0 (0.0%) |
| 5 or more Children | 0 (0.0%) | 0 (0.0%) |
| Total | 0 (0.0%) | 0 (0.0%) |
Income Below Poverty Among Married-Couple vs Single-Parent Households in Oilton
| Children | Married-Couple Families | Single-Parent Households |
| No Children | 0 (0.0%) | 0 (0.0%) |
| 1 or 2 Children | 0 (0.0%) | 0 (0.0%) |
| 3 or 4 Children | 0 (0.0%) | 0 (0.0%) |
| 5 or more Children | 0 (0.0%) | 0 (0.0%) |
| Total | 0 (0.0%) | 0 (0.0%) |
Race in Oilton
The most populous races in Oilton are Hispanic or Latino (128 | 98.5%), Two or more Races (80 | 61.5%), and White / Caucasian (50 | 38.5%).
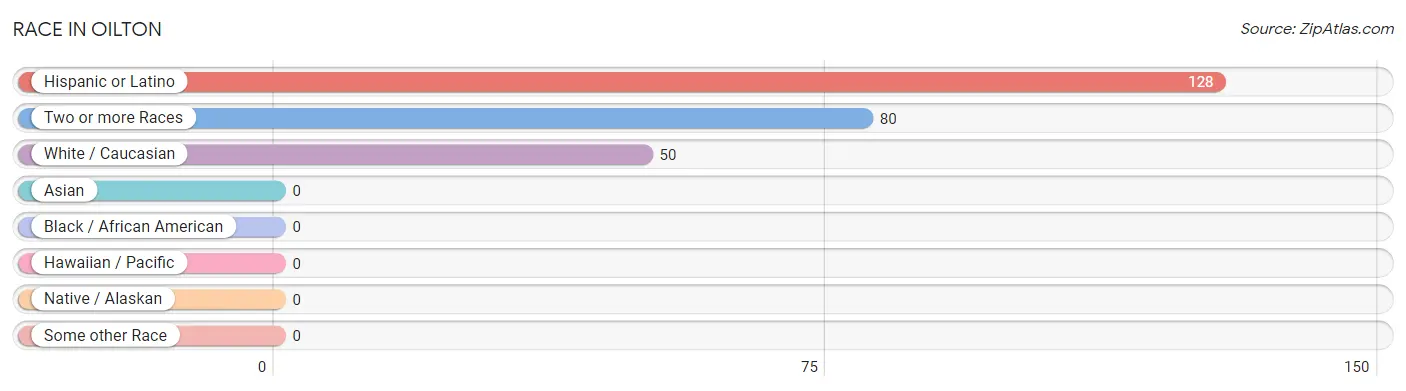
| Race | # Population | % Population |
| Asian | 0 | 0.0% |
| Black / African American | 0 | 0.0% |
| Hawaiian / Pacific | 0 | 0.0% |
| Hispanic or Latino | 128 | 98.5% |
| Native / Alaskan | 0 | 0.0% |
| White / Caucasian | 50 | 38.5% |
| Two or more Races | 80 | 61.5% |
| Some other Race | 0 | 0.0% |
| Total | 130 | 100.0% |
Ancestry in Oilton
The most populous ancestries reported in Oilton are Mexican (128 | 98.5%), and English (2 | 1.5%), together accounting for 100.0% of all Oilton residents.
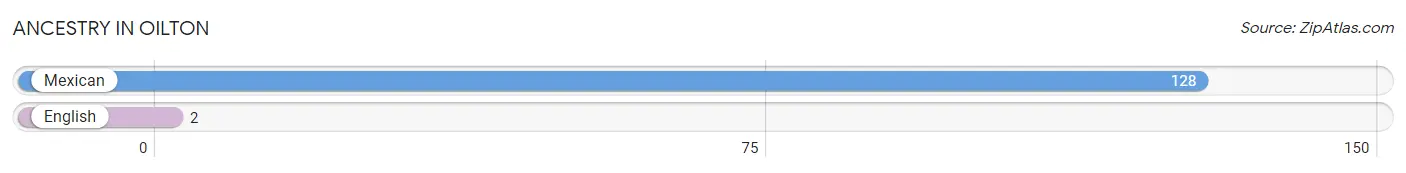
| Ancestry | # Population | % Population |
| English | 2 | 1.5% |
| Mexican | 128 | 98.5% | View All 2 Rows |
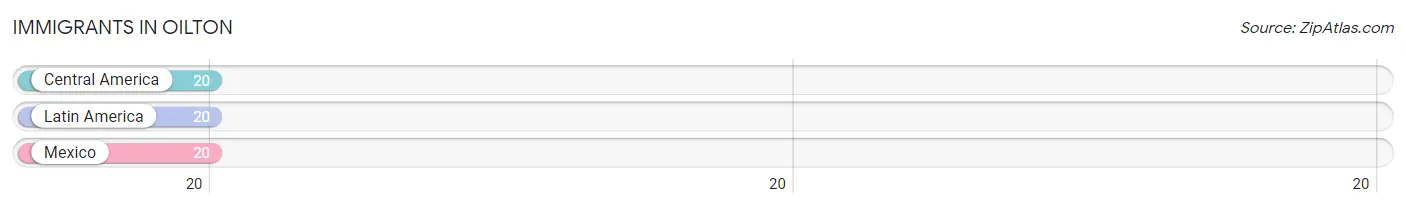
Immigrants in Oilton
The most numerous immigrant groups reported in Oilton came from Central America (20 | 15.4%), Latin America (20 | 15.4%), and Mexico (20 | 15.4%), together accounting for 46.1% of all Oilton residents.
| Immigration Origin | # Population | % Population |
| Central America | 20 | 15.4% |
| Latin America | 20 | 15.4% |
| Mexico | 20 | 15.4% | View All 3 Rows |
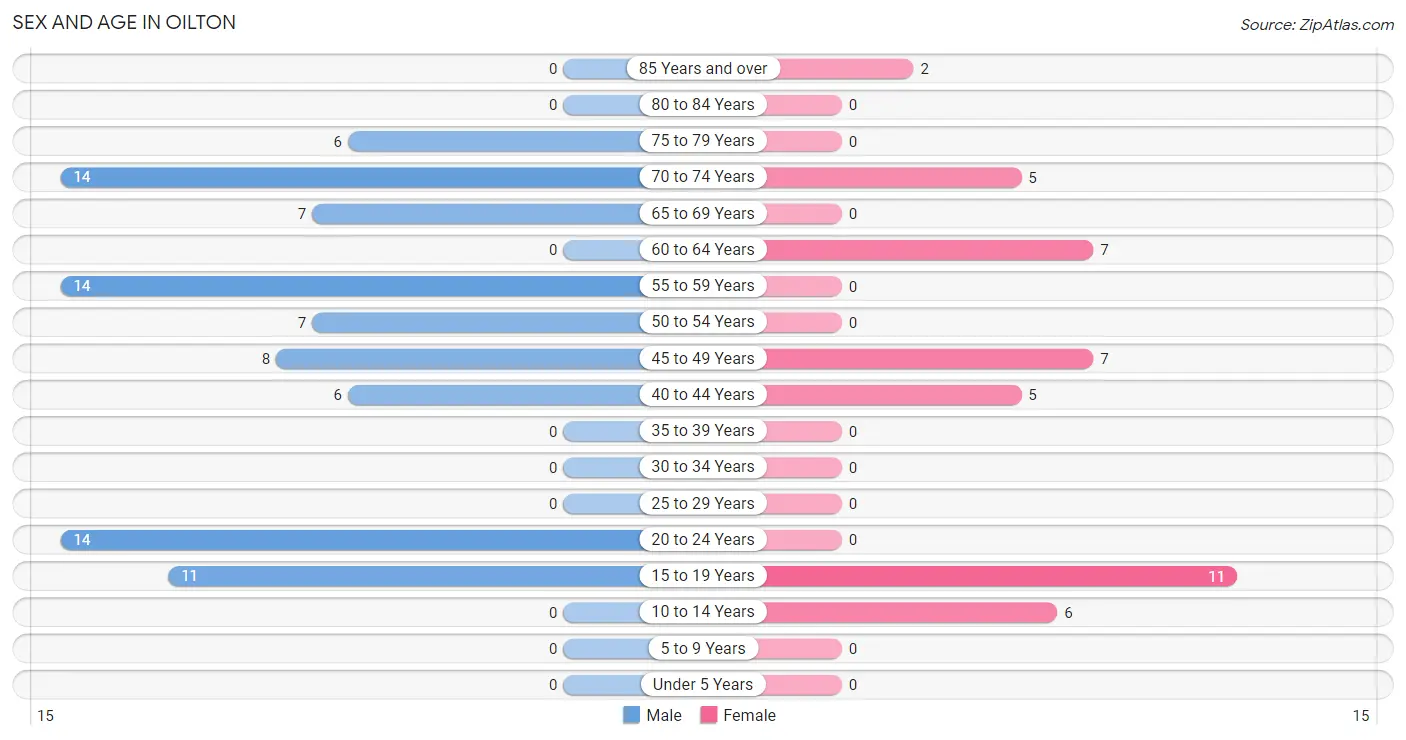
Sex and Age in Oilton
Sex and Age in Oilton
The most populous age groups in Oilton are 20 to 24 Years (14 | 16.1%) for men and 15 to 19 Years (11 | 25.6%) for women.
| Age Bracket | Male | Female |
| Under 5 Years | 0 (0.0%) | 0 (0.0%) |
| 5 to 9 Years | 0 (0.0%) | 0 (0.0%) |
| 10 to 14 Years | 0 (0.0%) | 6 (14.0%) |
| 15 to 19 Years | 11 (12.6%) | 11 (25.6%) |
| 20 to 24 Years | 14 (16.1%) | 0 (0.0%) |
| 25 to 29 Years | 0 (0.0%) | 0 (0.0%) |
| 30 to 34 Years | 0 (0.0%) | 0 (0.0%) |
| 35 to 39 Years | 0 (0.0%) | 0 (0.0%) |
| 40 to 44 Years | 6 (6.9%) | 5 (11.6%) |
| 45 to 49 Years | 8 (9.2%) | 7 (16.3%) |
| 50 to 54 Years | 7 (8.1%) | 0 (0.0%) |
| 55 to 59 Years | 14 (16.1%) | 0 (0.0%) |
| 60 to 64 Years | 0 (0.0%) | 7 (16.3%) |
| 65 to 69 Years | 7 (8.1%) | 0 (0.0%) |
| 70 to 74 Years | 14 (16.1%) | 5 (11.6%) |
| 75 to 79 Years | 6 (6.9%) | 0 (0.0%) |
| 80 to 84 Years | 0 (0.0%) | 0 (0.0%) |
| 85 Years and over | 0 (0.0%) | 2 (4.6%) |
| Total | 87 (100.0%) | 43 (100.0%) |
Families and Households in Oilton
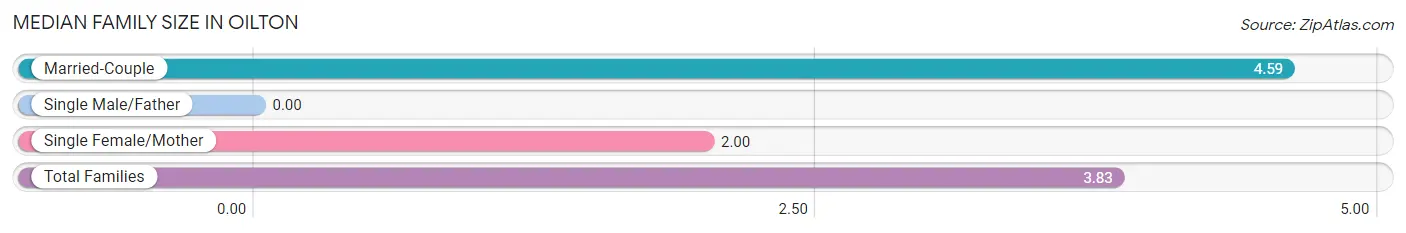
Median Family Size in Oilton
| Family Type | # Families | Family Size |
| Married-Couple | 17 (70.8%) | 4.59 |
| Single Male/Father | 0 (0.0%) | - |
| Single Female/Mother | 7 (29.2%) | 2.00 |
| Total Families | 24 (100.0%) | 3.83 |
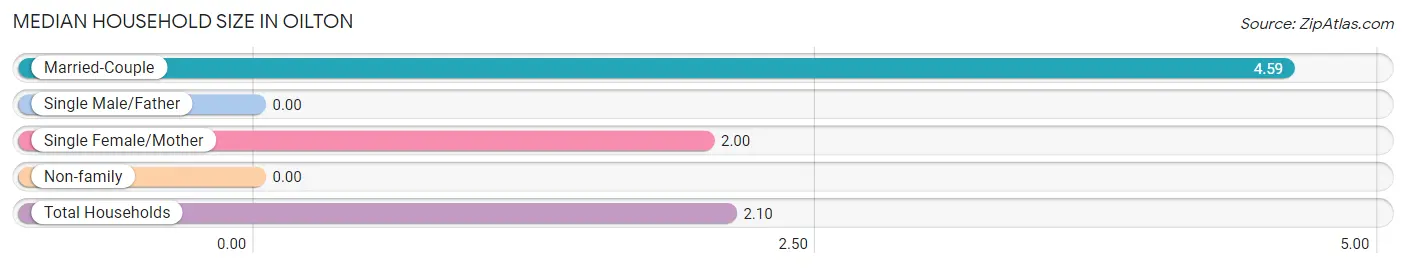
Median Household Size in Oilton
| Household Type | # Households | Household Size |
| Married-Couple | 17 (27.4%) | 4.59 |
| Single Male/Father | 0 (0.0%) | - |
| Single Female/Mother | 7 (11.3%) | 2.00 |
| Non-family | 38 (61.3%) | - |
| Total Households | 62 (100.0%) | 2.10 |
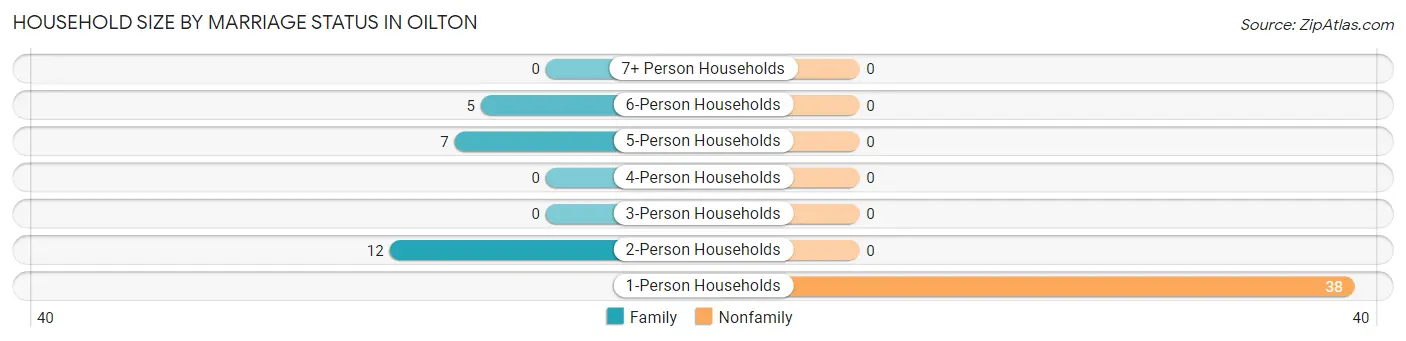
Household Size by Marriage Status in Oilton
Out of a total of 62 households in Oilton, 24 (38.7%) are family households, while 38 (61.3%) are nonfamily households. The most numerous type of family households are 2-person households, comprising 12, and the most common type of nonfamily households are 1-person households, comprising 38.
| Household Size | Family Households | Nonfamily Households |
| 1-Person Households | - | 38 (61.3%) |
| 2-Person Households | 12 (19.4%) | 0 (0.0%) |
| 3-Person Households | 0 (0.0%) | 0 (0.0%) |
| 4-Person Households | 0 (0.0%) | 0 (0.0%) |
| 5-Person Households | 7 (11.3%) | 0 (0.0%) |
| 6-Person Households | 5 (8.1%) | 0 (0.0%) |
| 7+ Person Households | 0 (0.0%) | 0 (0.0%) |
| Total | 24 (38.7%) | 38 (61.3%) |
Female Fertility in Oilton
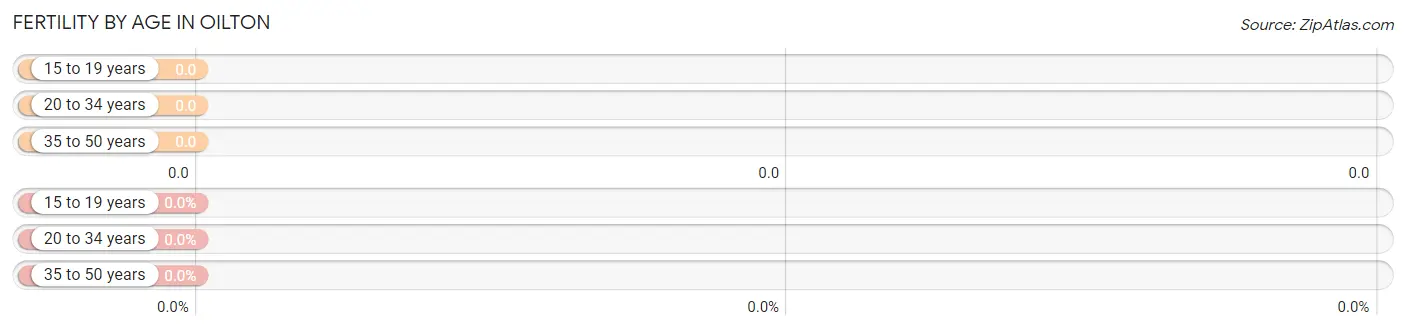
Fertility by Age in Oilton
| Age Bracket | Women with Births | Births / 1,000 Women |
| 15 to 19 years | 0 (0.0%) | 0.0 |
| 20 to 34 years | 0 (0.0%) | 0.0 |
| 35 to 50 years | 0 (0.0%) | 0.0 |
| Total | 0 (0.0%) | 0.0 |
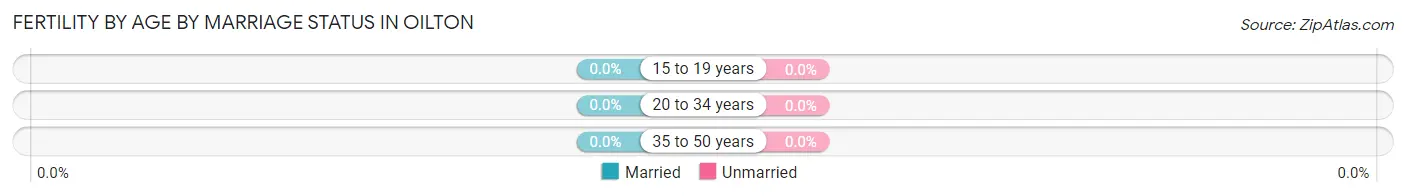
Fertility by Age by Marriage Status in Oilton
| Age Bracket | Married | Unmarried |
| 15 to 19 years | 0 (0.0%) | 0 (0.0%) |
| 20 to 34 years | 0 (0.0%) | 0 (0.0%) |
| 35 to 50 years | 0 (0.0%) | 0 (0.0%) |
| Total | 0 (0.0%) | 0 (0.0%) |
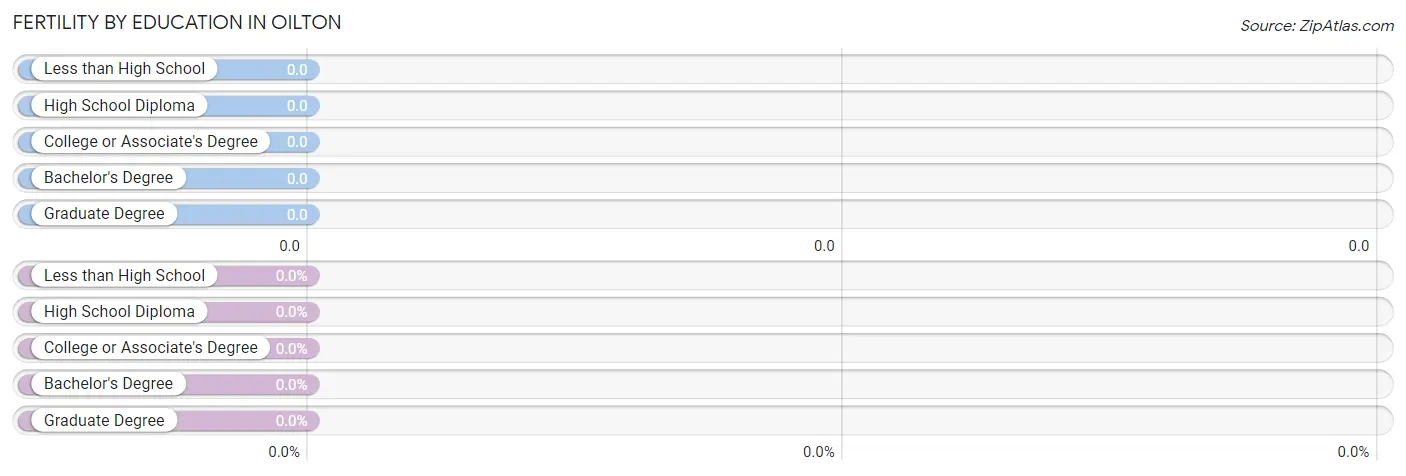
Fertility by Education in Oilton
| Educational Attainment | Women with Births | Births / 1,000 Women |
| Less than High School | 0 (0.0%) | 0.0 |
| High School Diploma | 0 (0.0%) | 0.0 |
| College or Associate's Degree | 0 (0.0%) | 0.0 |
| Bachelor's Degree | 0 (0.0%) | 0.0 |
| Graduate Degree | 0 (0.0%) | 0.0 |
| Total | 0 (0.0%) | 0.0 |
Fertility by Education by Marriage Status in Oilton
| Educational Attainment | Married | Unmarried |
| Less than High School | 0 (0.0%) | 0 (0.0%) |
| High School Diploma | 0 (0.0%) | 0 (0.0%) |
| College or Associate's Degree | 0 (0.0%) | 0 (0.0%) |
| Bachelor's Degree | 0 (0.0%) | 0 (0.0%) |
| Graduate Degree | 0 (0.0%) | 0 (0.0%) |
| Total | 0 (0.0%) | 0 (0.0%) |
Employment Characteristics in Oilton
Employment by Class of Employer in Oilton
Among the 62 employed individuals in Oilton, private company employees (50 | 80.6%), and local government employees (12 | 19.4%) make up the most common classes of employment.
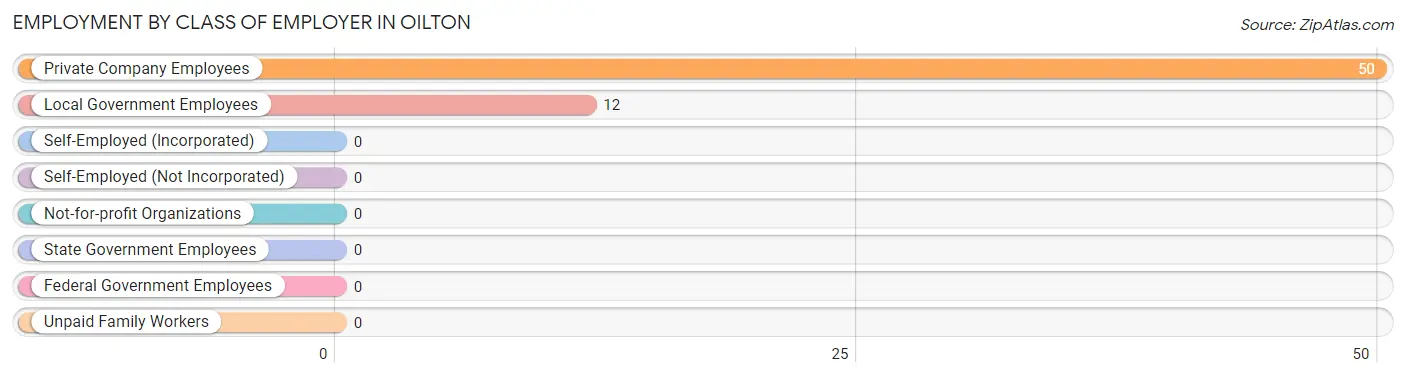
| Employer Class | # Employees | % Employees |
| Private Company Employees | 50 | 80.6% |
| Self-Employed (Incorporated) | 0 | 0.0% |
| Self-Employed (Not Incorporated) | 0 | 0.0% |
| Not-for-profit Organizations | 0 | 0.0% |
| Local Government Employees | 12 | 19.4% |
| State Government Employees | 0 | 0.0% |
| Federal Government Employees | 0 | 0.0% |
| Unpaid Family Workers | 0 | 0.0% |
| Total | 62 | 100.0% |
Employment Status by Age in Oilton
According to the labor force statistics for Oilton, out of the total population over 16 years of age (124), 54.8% or 68 individuals are in the labor force, with 8.8% or 6 of them unemployed. The age group with the highest labor force participation rate is 20 to 24 years, with 100.0% or 14 individuals in the labor force. Within the labor force, the 35 to 44 years age range has the highest percentage of unemployed individuals, with 54.5% or 6 of them being unemployed.
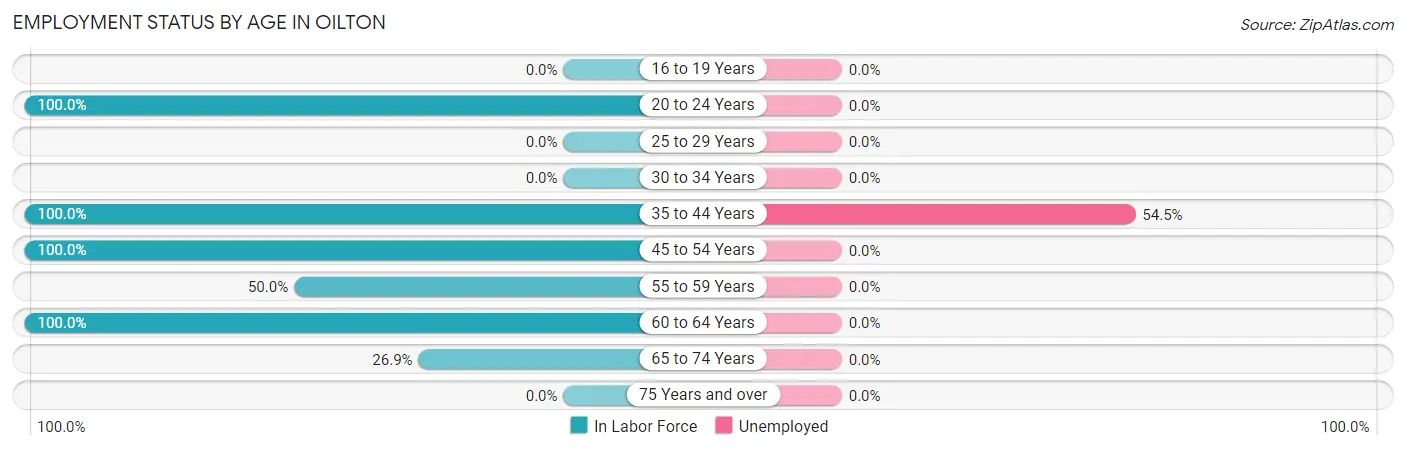
| Age Bracket | In Labor Force | Unemployed |
| 16 to 19 Years | 0 (0.0%) | 0 (0.0%) |
| 20 to 24 Years | 14 (100.0%) | 0 (0.0%) |
| 25 to 29 Years | 0 (0.0%) | 0 (0.0%) |
| 30 to 34 Years | 0 (0.0%) | 0 (0.0%) |
| 35 to 44 Years | 11 (100.0%) | 6 (54.5%) |
| 45 to 54 Years | 22 (100.0%) | 0 (0.0%) |
| 55 to 59 Years | 7 (50.0%) | 0 (0.0%) |
| 60 to 64 Years | 7 (100.0%) | 0 (0.0%) |
| 65 to 74 Years | 7 (26.9%) | 0 (0.0%) |
| 75 Years and over | 0 (0.0%) | 0 (0.0%) |
| Total | 68 (54.8%) | 6 (8.8%) |
Employment Status by Educational Attainment in Oilton
According to labor force statistics for Oilton, 87.0% of individuals (47) out of the total population between 25 and 64 years of age (54) are in the labor force, with 12.8% or 6 of them being unemployed. The group with the highest labor force participation rate are those with the educational attainment of less than high school, with 100.0% or 7 individuals in the labor force. Within the labor force, individuals with college / associate degree education have the highest percentage of unemployment, with 21.4% or 6 of them being unemployed.
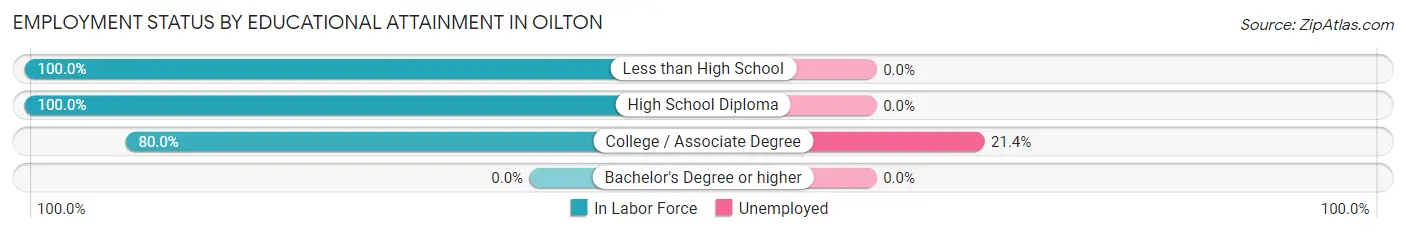
| Educational Attainment | In Labor Force | Unemployed |
| Less than High School | 7 (100.0%) | 0 (0.0%) |
| High School Diploma | 12 (100.0%) | 0 (0.0%) |
| College / Associate Degree | 28 (80.0%) | 7 (21.4%) |
| Bachelor's Degree or higher | 0 (0.0%) | 0 (0.0%) |
| Total | 47 (87.0%) | 7 (12.8%) |
Employment Occupations by Sex in Oilton
Management, Business, Science and Arts Occupations
The most common Management, Business, Science and Arts occupations in Oilton are Community & Social Service (7 | 11.3%), and Education Instruction & Library (7 | 11.3%).
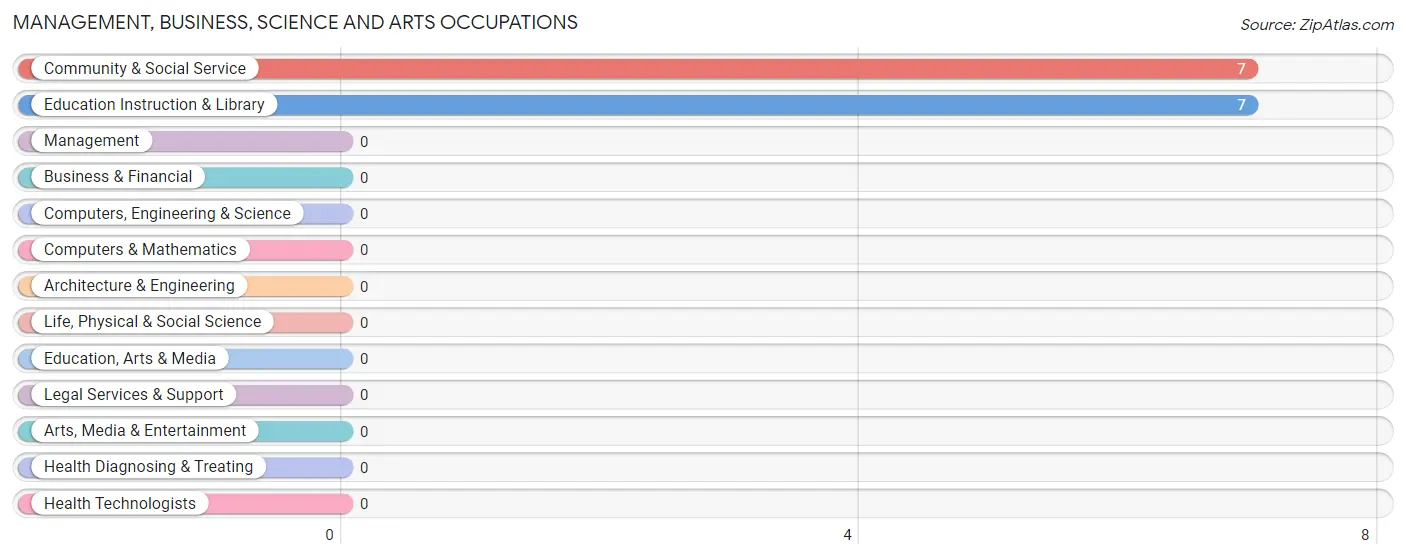
Management, Business, Science and Arts Occupations by Sex
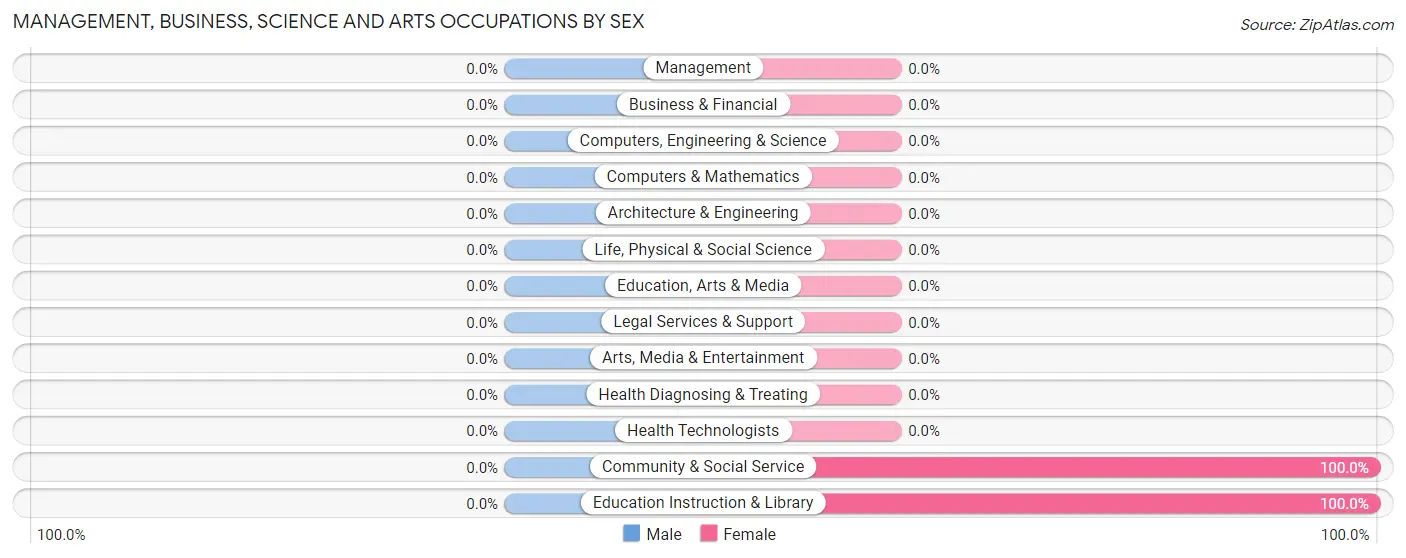
| Occupation | Male | Female |
| Management | 0 (0.0%) | 0 (0.0%) |
| Business & Financial | 0 (0.0%) | 0 (0.0%) |
| Computers, Engineering & Science | 0 (0.0%) | 0 (0.0%) |
| Computers & Mathematics | 0 (0.0%) | 0 (0.0%) |
| Architecture & Engineering | 0 (0.0%) | 0 (0.0%) |
| Life, Physical & Social Science | 0 (0.0%) | 0 (0.0%) |
| Community & Social Service | 0 (0.0%) | 7 (100.0%) |
| Education, Arts & Media | 0 (0.0%) | 0 (0.0%) |
| Legal Services & Support | 0 (0.0%) | 0 (0.0%) |
| Education Instruction & Library | 0 (0.0%) | 7 (100.0%) |
| Arts, Media & Entertainment | 0 (0.0%) | 0 (0.0%) |
| Health Diagnosing & Treating | 0 (0.0%) | 0 (0.0%) |
| Health Technologists | 0 (0.0%) | 0 (0.0%) |
| Total (Category) | 0 (0.0%) | 7 (100.0%) |
| Total (Overall) | 43 (69.4%) | 19 (30.6%) |
Services Occupations
The most common Services occupations in Oilton are Cleaning & Maintenance (7 | 11.3%), and Food Preparation & Serving (5 | 8.1%).
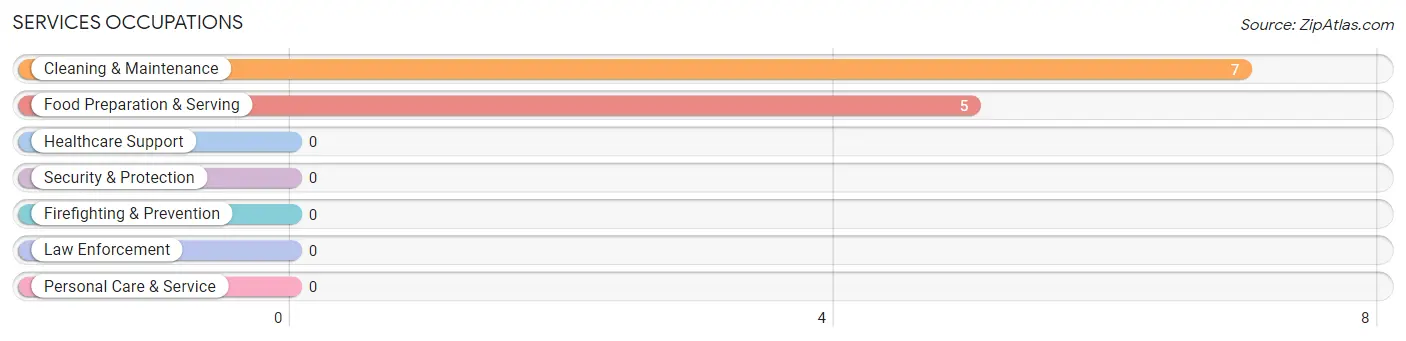
Services Occupations by Sex
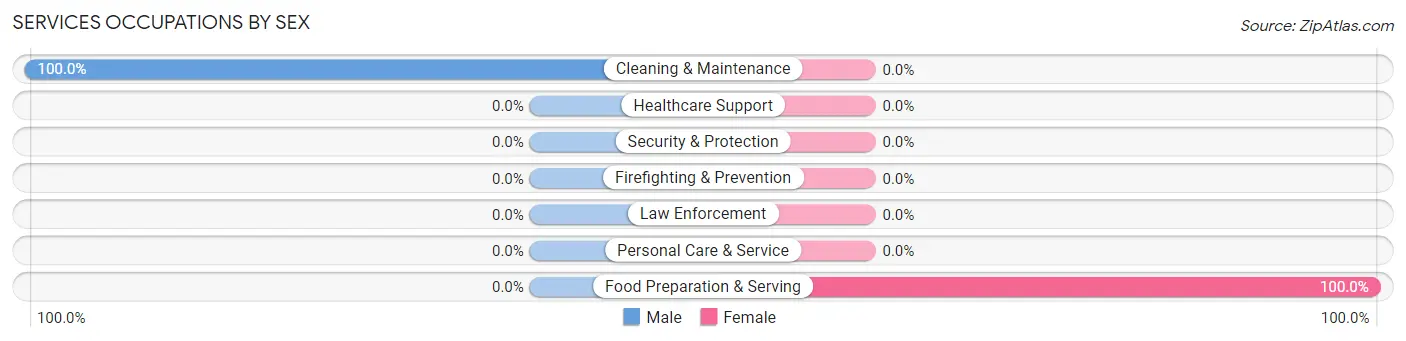
| Occupation | Male | Female |
| Healthcare Support | 0 (0.0%) | 0 (0.0%) |
| Security & Protection | 0 (0.0%) | 0 (0.0%) |
| Firefighting & Prevention | 0 (0.0%) | 0 (0.0%) |
| Law Enforcement | 0 (0.0%) | 0 (0.0%) |
| Food Preparation & Serving | 0 (0.0%) | 5 (100.0%) |
| Cleaning & Maintenance | 7 (100.0%) | 0 (0.0%) |
| Personal Care & Service | 0 (0.0%) | 0 (0.0%) |
| Total (Category) | 7 (58.3%) | 5 (41.7%) |
| Total (Overall) | 43 (69.4%) | 19 (30.6%) |
Sales and Office Occupations
Sales and Office Occupations by Sex
| Occupation | Male | Female |
| Sales & Related | 0 (0.0%) | 0 (0.0%) |
| Office & Administration | 0 (0.0%) | 0 (0.0%) |
| Total (Category) | 0 (0.0%) | 0 (0.0%) |
| Total (Overall) | 43 (69.4%) | 19 (30.6%) |
Natural Resources, Construction and Maintenance Occupations
The most common Natural Resources, Construction and Maintenance occupations in Oilton are , and Construction & Extraction (14 | 22.6%).
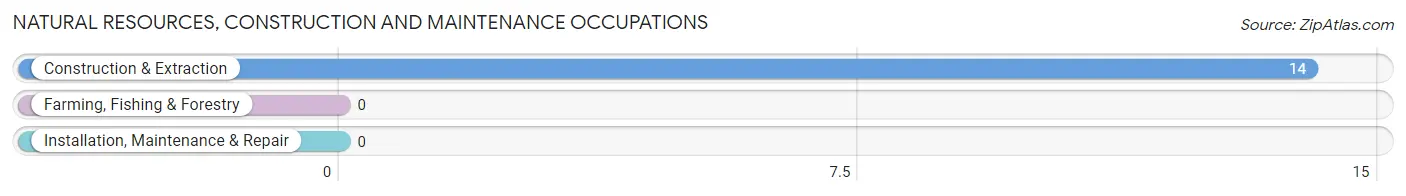
Natural Resources, Construction and Maintenance Occupations by Sex
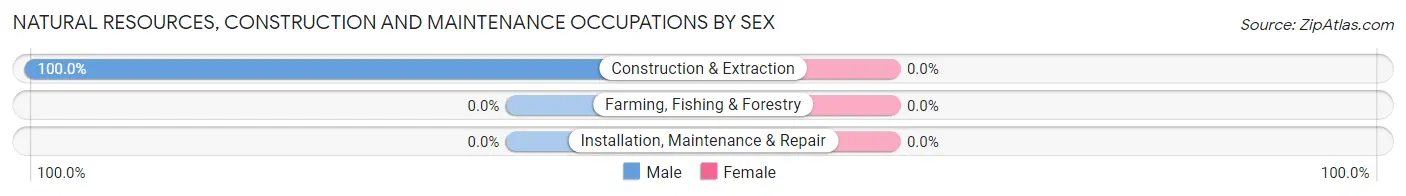
| Occupation | Male | Female |
| Farming, Fishing & Forestry | 0 (0.0%) | 0 (0.0%) |
| Construction & Extraction | 14 (100.0%) | 0 (0.0%) |
| Installation, Maintenance & Repair | 0 (0.0%) | 0 (0.0%) |
| Total (Category) | 14 (100.0%) | 0 (0.0%) |
| Total (Overall) | 43 (69.4%) | 19 (30.6%) |
Production, Transportation and Moving Occupations
The most common Production, Transportation and Moving occupations in Oilton are Production (21 | 33.9%), and Transportation (8 | 12.9%).
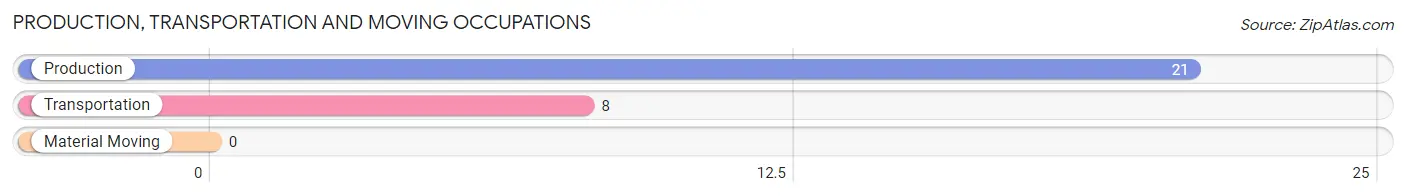
Production, Transportation and Moving Occupations by Sex
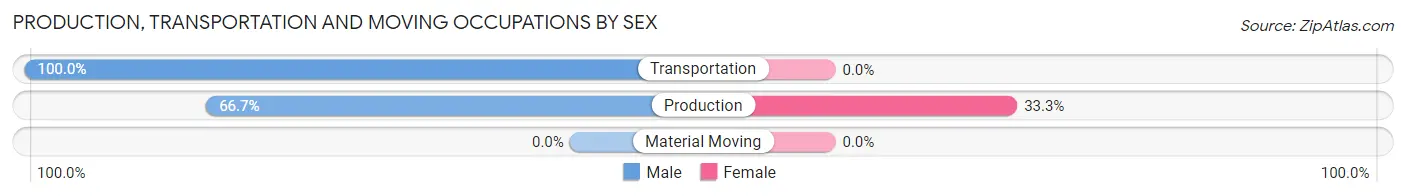
| Occupation | Male | Female |
| Production | 14 (66.7%) | 7 (33.3%) |
| Transportation | 8 (100.0%) | 0 (0.0%) |
| Material Moving | 0 (0.0%) | 0 (0.0%) |
| Total (Category) | 22 (75.9%) | 7 (24.1%) |
| Total (Overall) | 43 (69.4%) | 19 (30.6%) |
Employment Industries by Sex in Oilton
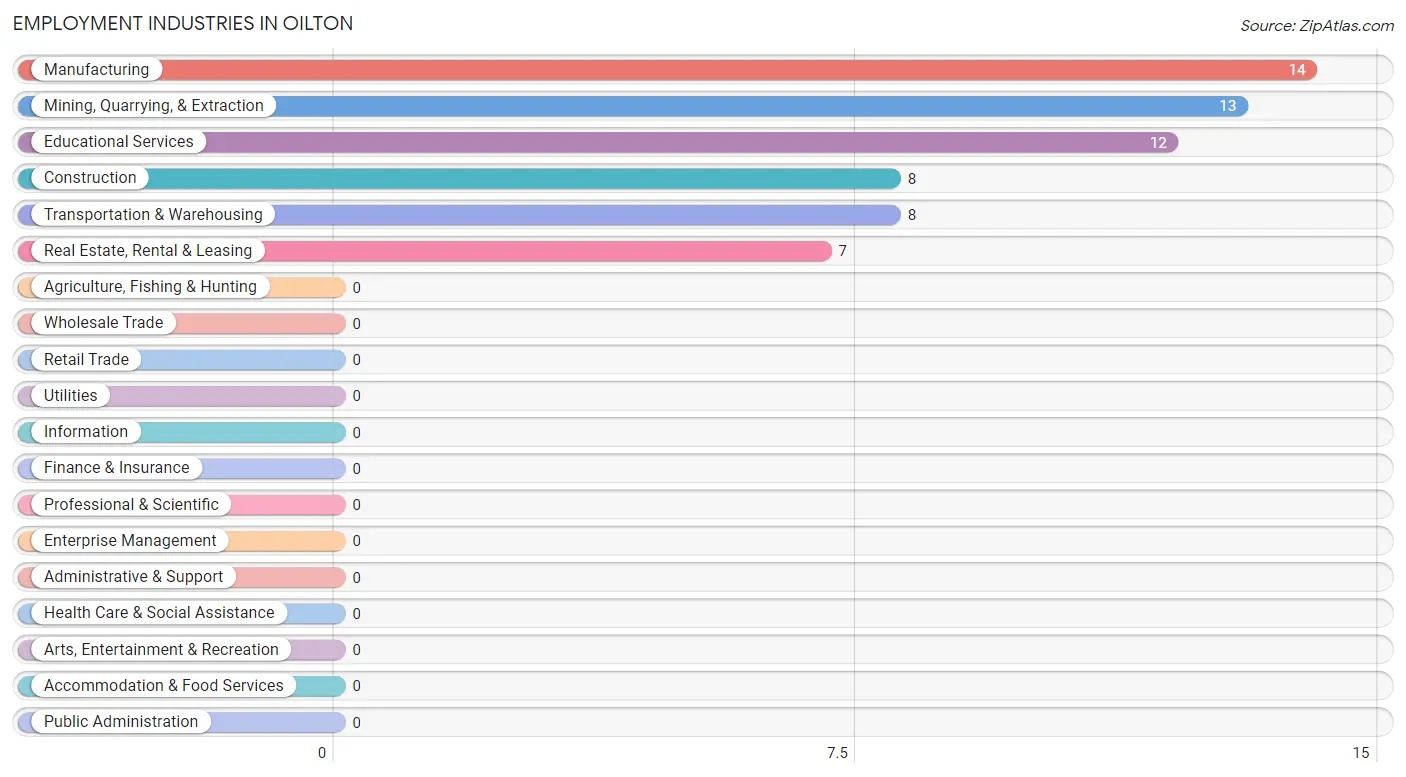
Employment Industries in Oilton
The major employment industries in Oilton include Manufacturing (14 | 22.6%), Mining, Quarrying, & Extraction (13 | 21.0%), Educational Services (12 | 19.4%), Construction (8 | 12.9%), and Transportation & Warehousing (8 | 12.9%).
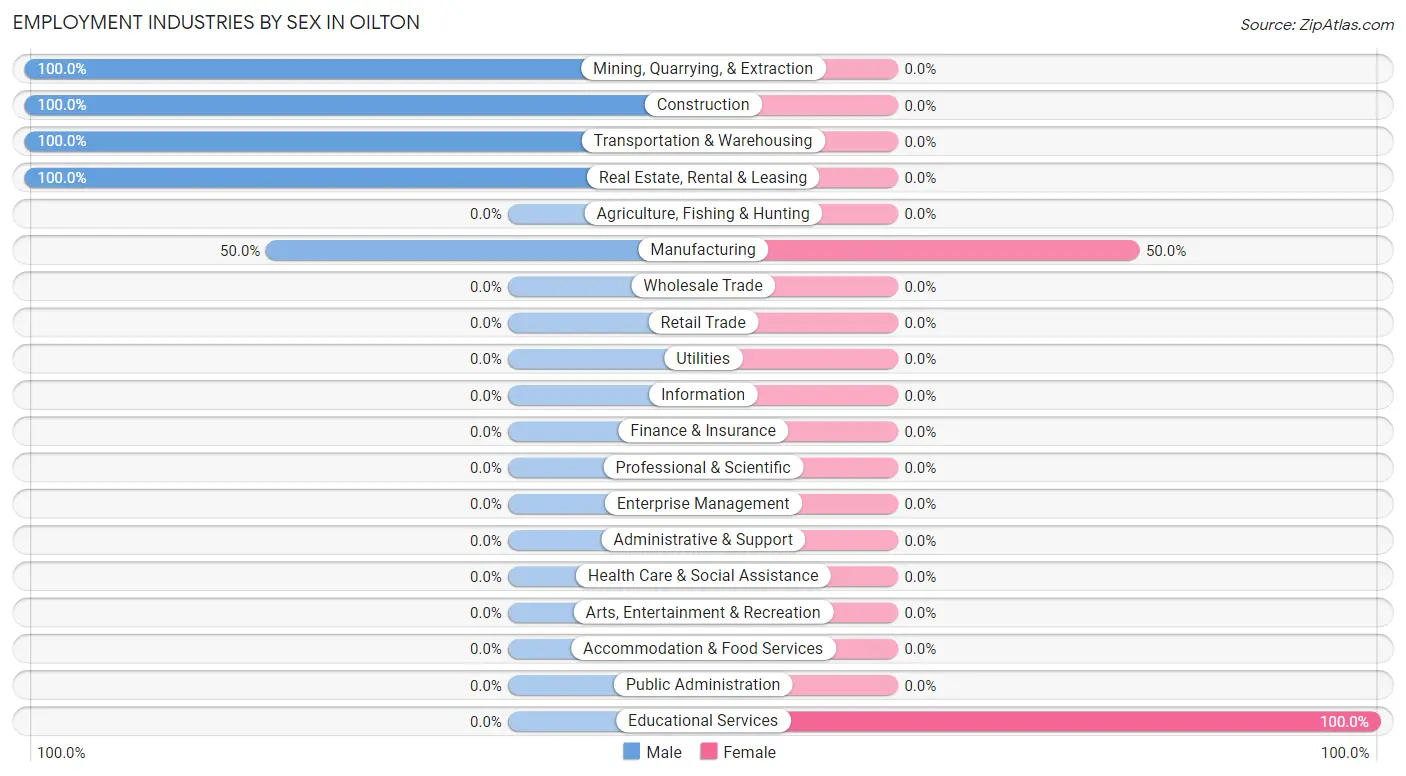
Employment Industries by Sex in Oilton
The Oilton industries that see more men than women are Mining, Quarrying, & Extraction (100.0%), Construction (100.0%), and Transportation & Warehousing (100.0%), whereas the industries that tend to have a higher number of women are Educational Services (100.0%), and Manufacturing (50.0%).
| Industry | Male | Female |
| Agriculture, Fishing & Hunting | 0 (0.0%) | 0 (0.0%) |
| Mining, Quarrying, & Extraction | 13 (100.0%) | 0 (0.0%) |
| Construction | 8 (100.0%) | 0 (0.0%) |
| Manufacturing | 7 (50.0%) | 7 (50.0%) |
| Wholesale Trade | 0 (0.0%) | 0 (0.0%) |
| Retail Trade | 0 (0.0%) | 0 (0.0%) |
| Transportation & Warehousing | 8 (100.0%) | 0 (0.0%) |
| Utilities | 0 (0.0%) | 0 (0.0%) |
| Information | 0 (0.0%) | 0 (0.0%) |
| Finance & Insurance | 0 (0.0%) | 0 (0.0%) |
| Real Estate, Rental & Leasing | 7 (100.0%) | 0 (0.0%) |
| Professional & Scientific | 0 (0.0%) | 0 (0.0%) |
| Enterprise Management | 0 (0.0%) | 0 (0.0%) |
| Administrative & Support | 0 (0.0%) | 0 (0.0%) |
| Educational Services | 0 (0.0%) | 12 (100.0%) |
| Health Care & Social Assistance | 0 (0.0%) | 0 (0.0%) |
| Arts, Entertainment & Recreation | 0 (0.0%) | 0 (0.0%) |
| Accommodation & Food Services | 0 (0.0%) | 0 (0.0%) |
| Public Administration | 0 (0.0%) | 0 (0.0%) |
| Total | 43 (69.4%) | 19 (30.6%) |
Education in Oilton
School Enrollment in Oilton
The most common levels of schooling among the 28 students in Oilton are high school (11 | 39.3%), college / undergraduate (11 | 39.3%), and middle school (6 | 21.4%).
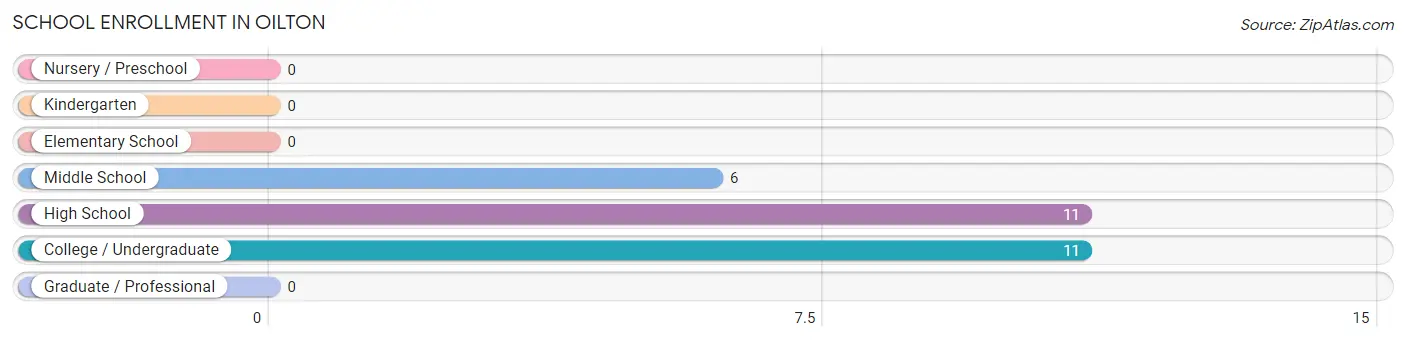
| School Level | # Students | % Students |
| Nursery / Preschool | 0 | 0.0% |
| Kindergarten | 0 | 0.0% |
| Elementary School | 0 | 0.0% |
| Middle School | 6 | 21.4% |
| High School | 11 | 39.3% |
| College / Undergraduate | 11 | 39.3% |
| Graduate / Professional | 0 | 0.0% |
| Total | 28 | 100.0% |
School Enrollment by Age by Funding Source in Oilton
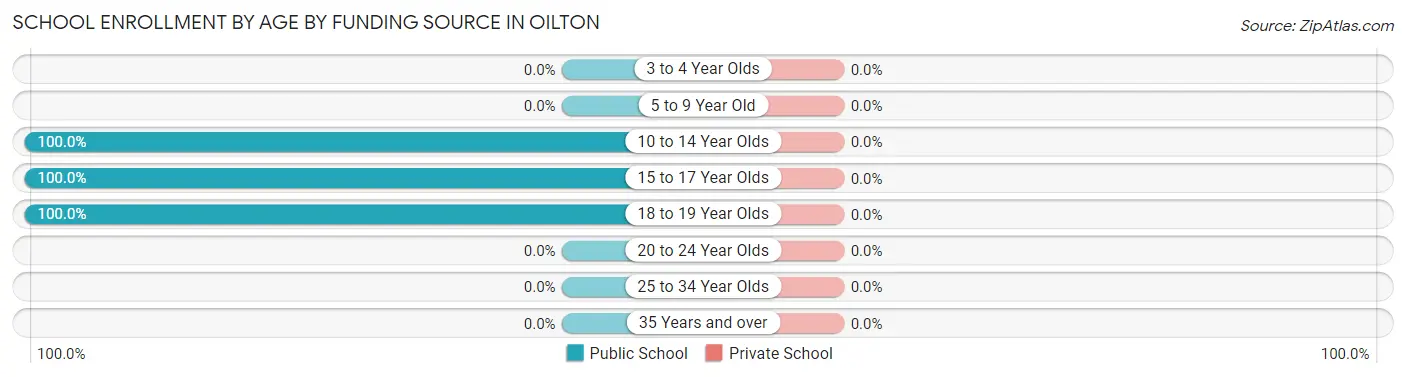
| Age Bracket | Public School | Private School |
| 3 to 4 Year Olds | 0 (0.0%) | 0 (0.0%) |
| 5 to 9 Year Old | 0 (0.0%) | 0 (0.0%) |
| 10 to 14 Year Olds | 6 (100.0%) | 0 (0.0%) |
| 15 to 17 Year Olds | 11 (100.0%) | 0 (0.0%) |
| 18 to 19 Year Olds | 11 (100.0%) | 0 (0.0%) |
| 20 to 24 Year Olds | 0 (0.0%) | 0 (0.0%) |
| 25 to 34 Year Olds | 0 (0.0%) | 0 (0.0%) |
| 35 Years and over | 0 (0.0%) | 0 (0.0%) |
| Total | 28 (100.0%) | 0 (0.0%) |
Educational Attainment by Field of Study in Oilton
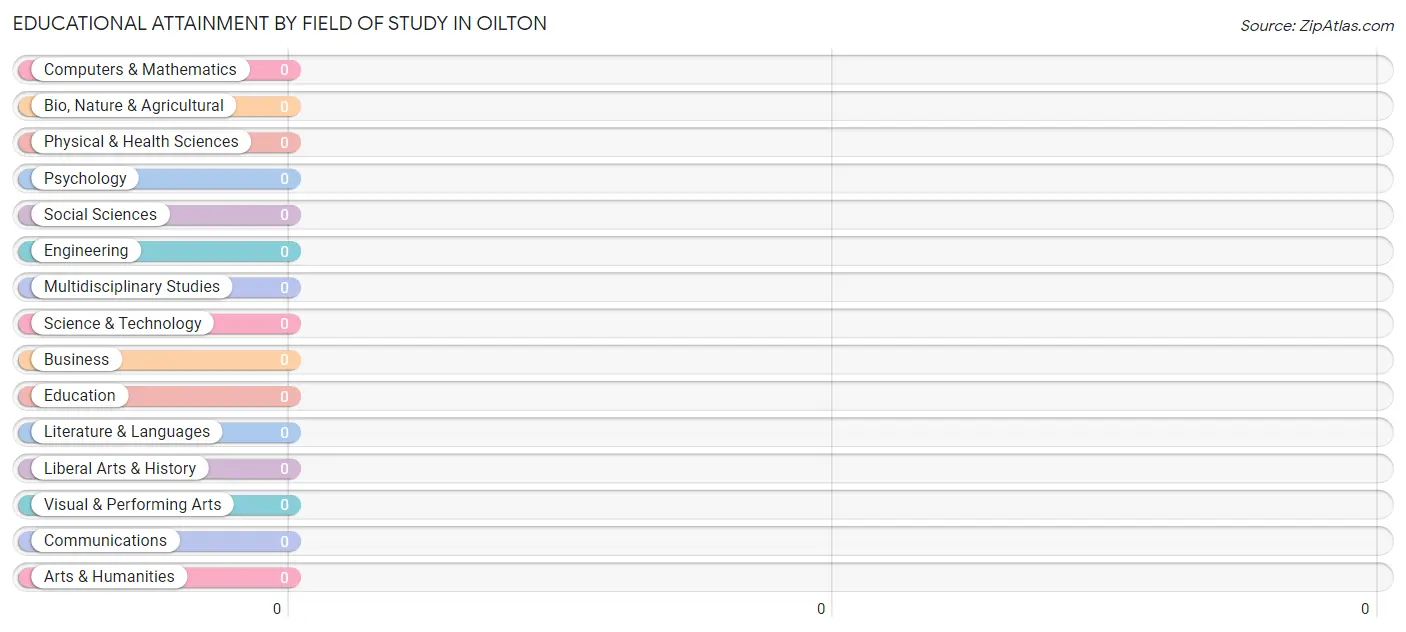
| Field of Study | # Graduates | % Graduates |
| Computers & Mathematics | 0 | 0.0% |
| Bio, Nature & Agricultural | 0 | 0.0% |
| Physical & Health Sciences | 0 | 0.0% |
| Psychology | 0 | 0.0% |
| Social Sciences | 0 | 0.0% |
| Engineering | 0 | 0.0% |
| Multidisciplinary Studies | 0 | 0.0% |
| Science & Technology | 0 | 0.0% |
| Business | 0 | 0.0% |
| Education | 0 | 0.0% |
| Literature & Languages | 0 | 0.0% |
| Liberal Arts & History | 0 | 0.0% |
| Visual & Performing Arts | 0 | 0.0% |
| Communications | 0 | 0.0% |
| Arts & Humanities | 0 | 0.0% |
| Total | 0 | 0.0% |
Transportation & Commute in Oilton
Vehicle Availability by Sex in Oilton
The most prevalent vehicle ownership categories in Oilton are males with 1 vehicle (22, accounting for 51.2%) and females with 1 vehicle (7, making up 115.8%).
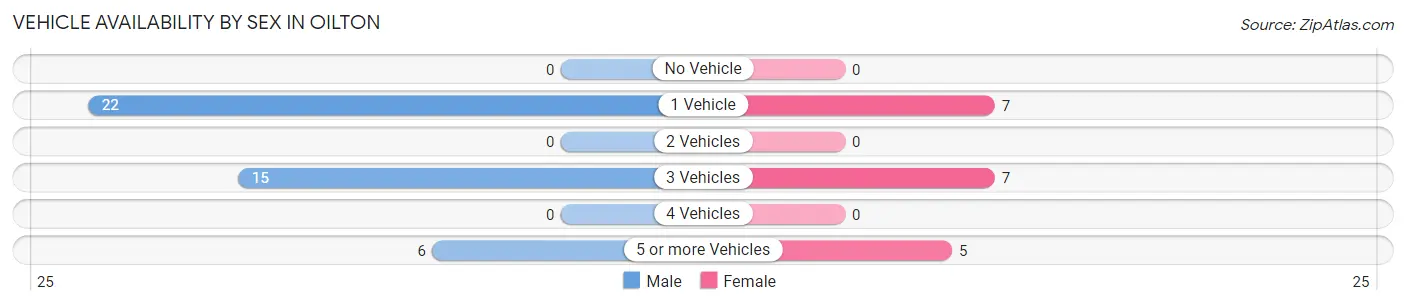
| Vehicles Available | Male | Female |
| No Vehicle | 0 (0.0%) | 0 (0.0%) |
| 1 Vehicle | 22 (51.2%) | 7 (36.8%) |
| 2 Vehicles | 0 (0.0%) | 0 (0.0%) |
| 3 Vehicles | 15 (34.9%) | 7 (36.8%) |
| 4 Vehicles | 0 (0.0%) | 0 (0.0%) |
| 5 or more Vehicles | 6 (14.0%) | 5 (26.3%) |
| Total | 43 (100.0%) | 19 (100.0%) |
Commute Time in Oilton
The most frequently occuring commute durations in Oilton are 30 to 34 minutes (15 commuters, 27.3%), 60 to 89 minutes (14 commuters, 25.5%), and 5 to 9 minutes (13 commuters, 23.6%).
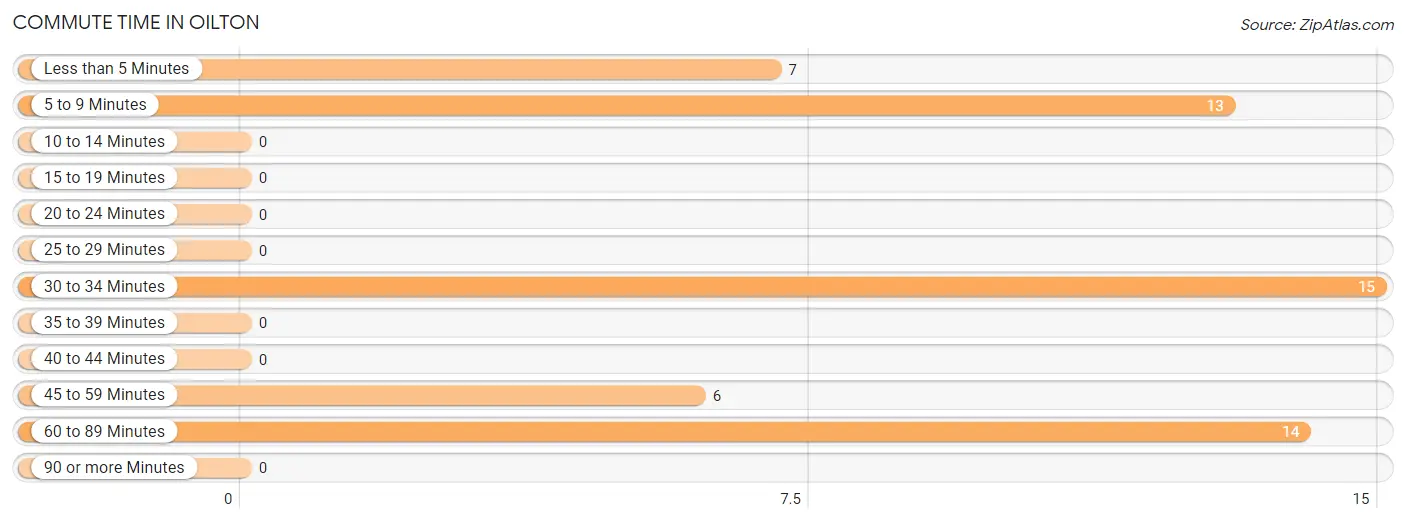
| Commute Time | # Commuters | % Commuters |
| Less than 5 Minutes | 7 | 12.7% |
| 5 to 9 Minutes | 13 | 23.6% |
| 10 to 14 Minutes | 0 | 0.0% |
| 15 to 19 Minutes | 0 | 0.0% |
| 20 to 24 Minutes | 0 | 0.0% |
| 25 to 29 Minutes | 0 | 0.0% |
| 30 to 34 Minutes | 15 | 27.3% |
| 35 to 39 Minutes | 0 | 0.0% |
| 40 to 44 Minutes | 0 | 0.0% |
| 45 to 59 Minutes | 6 | 10.9% |
| 60 to 89 Minutes | 14 | 25.5% |
| 90 or more Minutes | 0 | 0.0% |
Commute Time by Sex in Oilton
The most common commute times in Oilton are 30 to 34 minutes (15 commuters, 41.7%) for males and less than 5 minutes (7 commuters, 36.8%) for females.
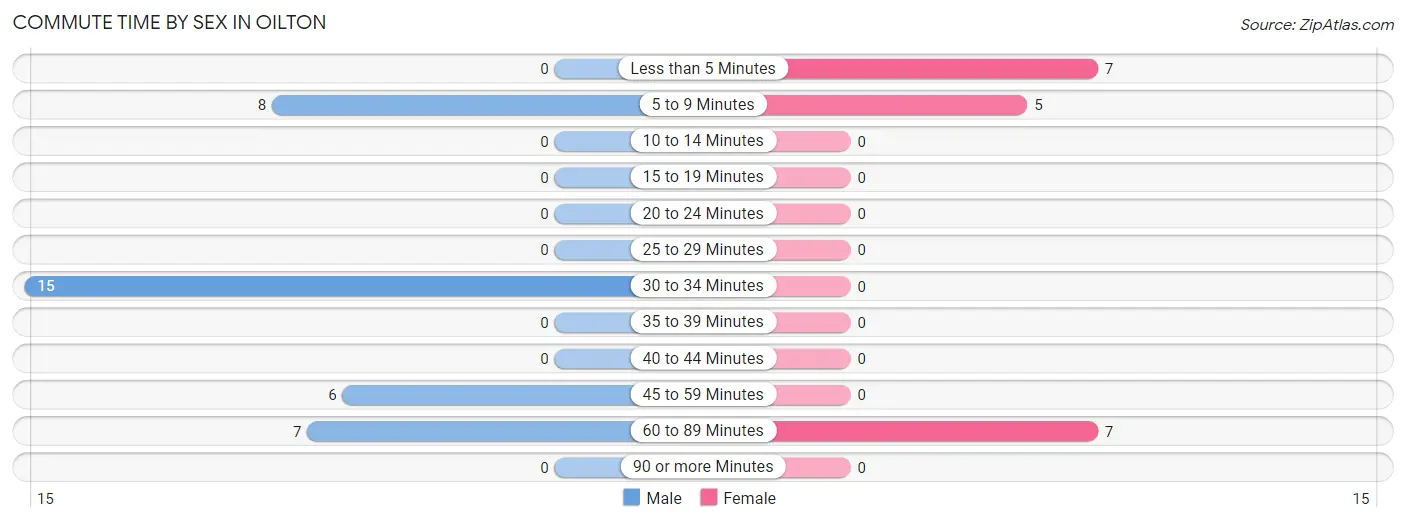
| Commute Time | Male | Female |
| Less than 5 Minutes | 0 (0.0%) | 7 (36.8%) |
| 5 to 9 Minutes | 8 (22.2%) | 5 (26.3%) |
| 10 to 14 Minutes | 0 (0.0%) | 0 (0.0%) |
| 15 to 19 Minutes | 0 (0.0%) | 0 (0.0%) |
| 20 to 24 Minutes | 0 (0.0%) | 0 (0.0%) |
| 25 to 29 Minutes | 0 (0.0%) | 0 (0.0%) |
| 30 to 34 Minutes | 15 (41.7%) | 0 (0.0%) |
| 35 to 39 Minutes | 0 (0.0%) | 0 (0.0%) |
| 40 to 44 Minutes | 0 (0.0%) | 0 (0.0%) |
| 45 to 59 Minutes | 6 (16.7%) | 0 (0.0%) |
| 60 to 89 Minutes | 7 (19.4%) | 7 (36.8%) |
| 90 or more Minutes | 0 (0.0%) | 0 (0.0%) |
Time of Departure to Work by Sex in Oilton
The most frequent times of departure to work in Oilton are 12:00 AM to 4:59 AM (8, 22.2%) for males and 7:00 AM to 7:29 AM (14, 73.7%) for females.
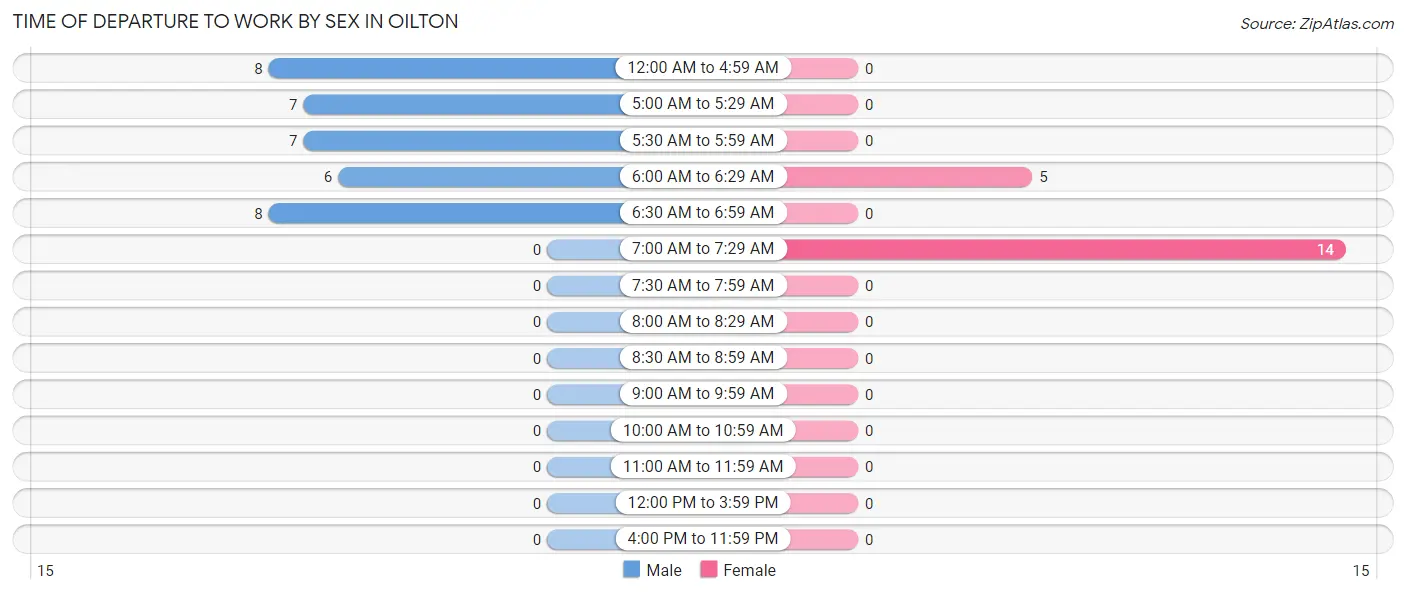
| Time of Departure | Male | Female |
| 12:00 AM to 4:59 AM | 8 (22.2%) | 0 (0.0%) |
| 5:00 AM to 5:29 AM | 7 (19.4%) | 0 (0.0%) |
| 5:30 AM to 5:59 AM | 7 (19.4%) | 0 (0.0%) |
| 6:00 AM to 6:29 AM | 6 (16.7%) | 5 (26.3%) |
| 6:30 AM to 6:59 AM | 8 (22.2%) | 0 (0.0%) |
| 7:00 AM to 7:29 AM | 0 (0.0%) | 14 (73.7%) |
| 7:30 AM to 7:59 AM | 0 (0.0%) | 0 (0.0%) |
| 8:00 AM to 8:29 AM | 0 (0.0%) | 0 (0.0%) |
| 8:30 AM to 8:59 AM | 0 (0.0%) | 0 (0.0%) |
| 9:00 AM to 9:59 AM | 0 (0.0%) | 0 (0.0%) |
| 10:00 AM to 10:59 AM | 0 (0.0%) | 0 (0.0%) |
| 11:00 AM to 11:59 AM | 0 (0.0%) | 0 (0.0%) |
| 12:00 PM to 3:59 PM | 0 (0.0%) | 0 (0.0%) |
| 4:00 PM to 11:59 PM | 0 (0.0%) | 0 (0.0%) |
| Total | 36 (100.0%) | 19 (100.0%) |
Housing Occupancy in Oilton
Occupancy by Ownership in Oilton
Of the total 62 dwellings in Oilton, owner-occupied units account for 55 (88.7%), while renter-occupied units make up 7 (11.3%).
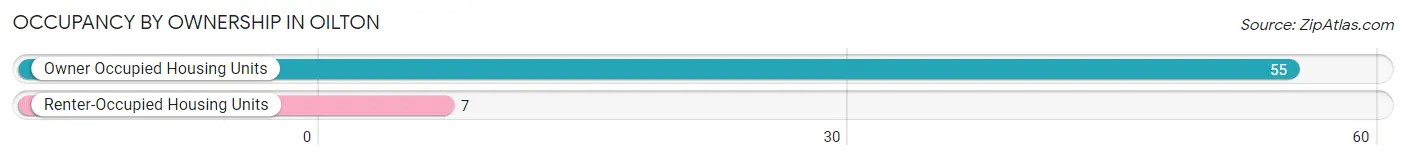
| Occupancy | # Housing Units | % Housing Units |
| Owner Occupied Housing Units | 55 | 88.7% |
| Renter-Occupied Housing Units | 7 | 11.3% |
| Total Occupied Housing Units | 62 | 100.0% |
Occupancy by Household Size in Oilton
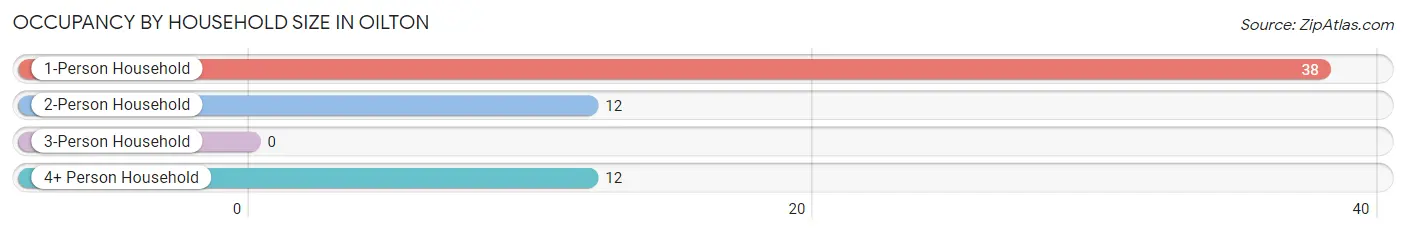
| Household Size | # Housing Units | % Housing Units |
| 1-Person Household | 38 | 61.3% |
| 2-Person Household | 12 | 19.4% |
| 3-Person Household | 0 | 0.0% |
| 4+ Person Household | 12 | 19.4% |
| Total Housing Units | 62 | 100.0% |
Occupancy by Ownership by Household Size in Oilton
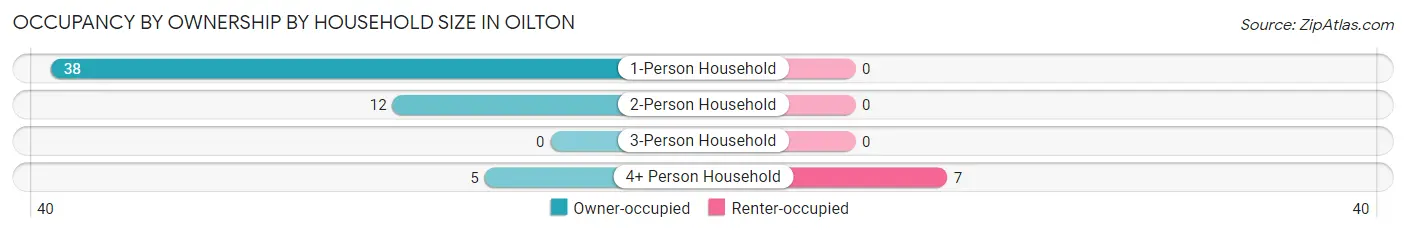
| Household Size | Owner-occupied | Renter-occupied |
| 1-Person Household | 38 (100.0%) | 0 (0.0%) |
| 2-Person Household | 12 (100.0%) | 0 (0.0%) |
| 3-Person Household | 0 (0.0%) | 0 (0.0%) |
| 4+ Person Household | 5 (41.7%) | 7 (58.3%) |
| Total Housing Units | 55 (88.7%) | 7 (11.3%) |
Occupancy by Educational Attainment in Oilton
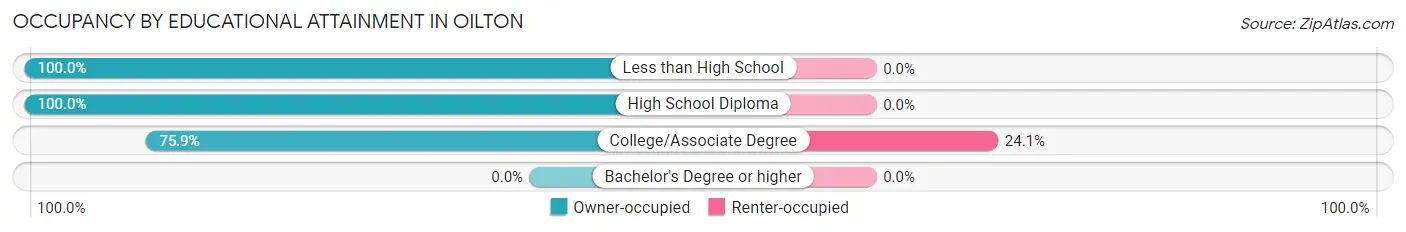
| Household Size | Owner-occupied | Renter-occupied |
| Less than High School | 12 (100.0%) | 0 (0.0%) |
| High School Diploma | 21 (100.0%) | 0 (0.0%) |
| College/Associate Degree | 22 (75.9%) | 7 (24.1%) |
| Bachelor's Degree or higher | 0 (0.0%) | 0 (0.0%) |
Occupancy by Age of Householder in Oilton
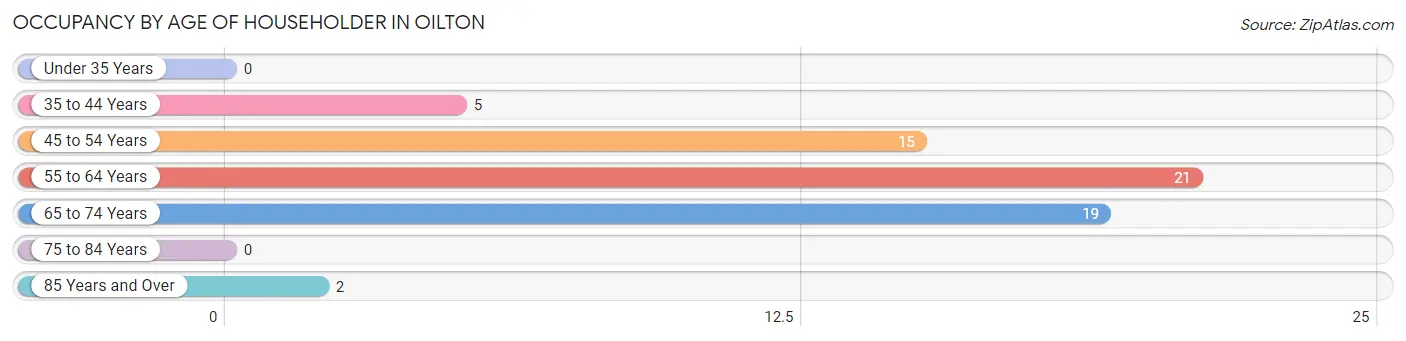
| Age Bracket | # Households | % Households |
| Under 35 Years | 0 | 0.0% |
| 35 to 44 Years | 5 | 8.1% |
| 45 to 54 Years | 15 | 24.2% |
| 55 to 64 Years | 21 | 33.9% |
| 65 to 74 Years | 19 | 30.6% |
| 75 to 84 Years | 0 | 0.0% |
| 85 Years and Over | 2 | 3.2% |
| Total | 62 | 100.0% |
Housing Finances in Oilton
Median Income by Occupancy in Oilton
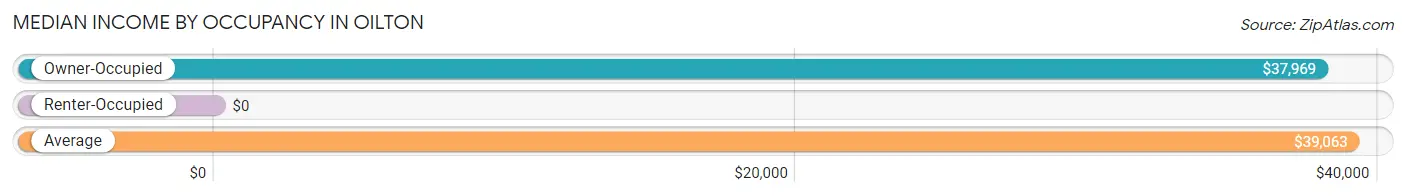
| Occupancy Type | # Households | Median Income |
| Owner-Occupied | 55 (88.7%) | $37,969 |
| Renter-Occupied | 7 (11.3%) | $0 |
| Average | 62 (100.0%) | $39,063 |
Occupancy by Householder Income Bracket in Oilton
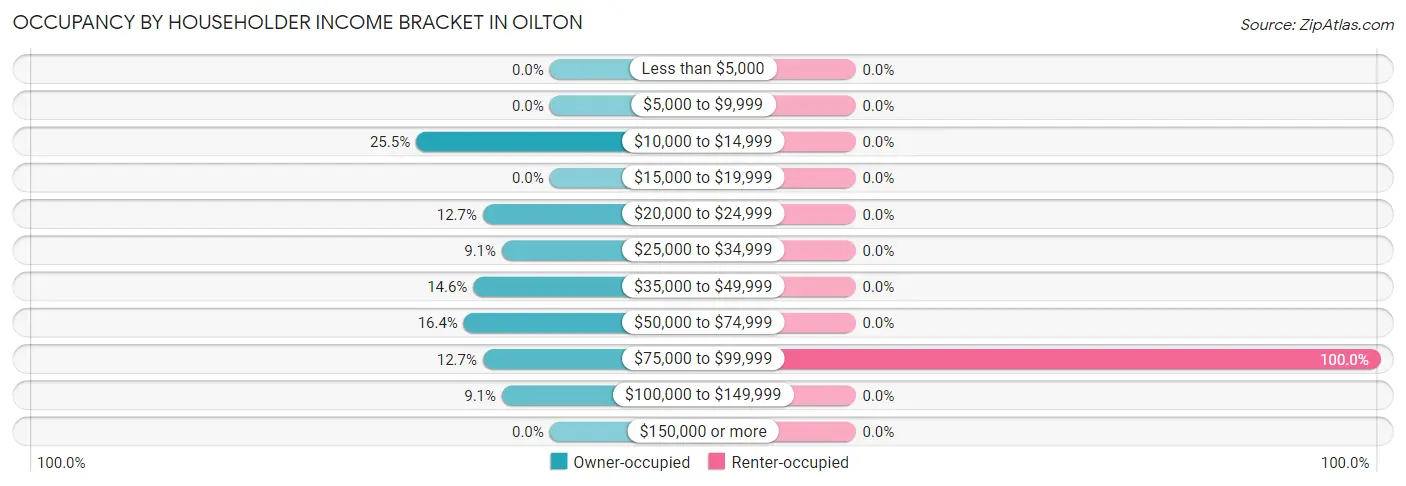
| Income Bracket | Owner-occupied | Renter-occupied |
| Less than $5,000 | 0 (0.0%) | 0 (0.0%) |
| $5,000 to $9,999 | 0 (0.0%) | 0 (0.0%) |
| $10,000 to $14,999 | 14 (25.5%) | 0 (0.0%) |
| $15,000 to $19,999 | 0 (0.0%) | 0 (0.0%) |
| $20,000 to $24,999 | 7 (12.7%) | 0 (0.0%) |
| $25,000 to $34,999 | 5 (9.1%) | 0 (0.0%) |
| $35,000 to $49,999 | 8 (14.5%) | 0 (0.0%) |
| $50,000 to $74,999 | 9 (16.4%) | 0 (0.0%) |
| $75,000 to $99,999 | 7 (12.7%) | 7 (100.0%) |
| $100,000 to $149,999 | 5 (9.1%) | 0 (0.0%) |
| $150,000 or more | 0 (0.0%) | 0 (0.0%) |
| Total | 55 (100.0%) | 7 (100.0%) |
Monthly Housing Cost Tiers in Oilton
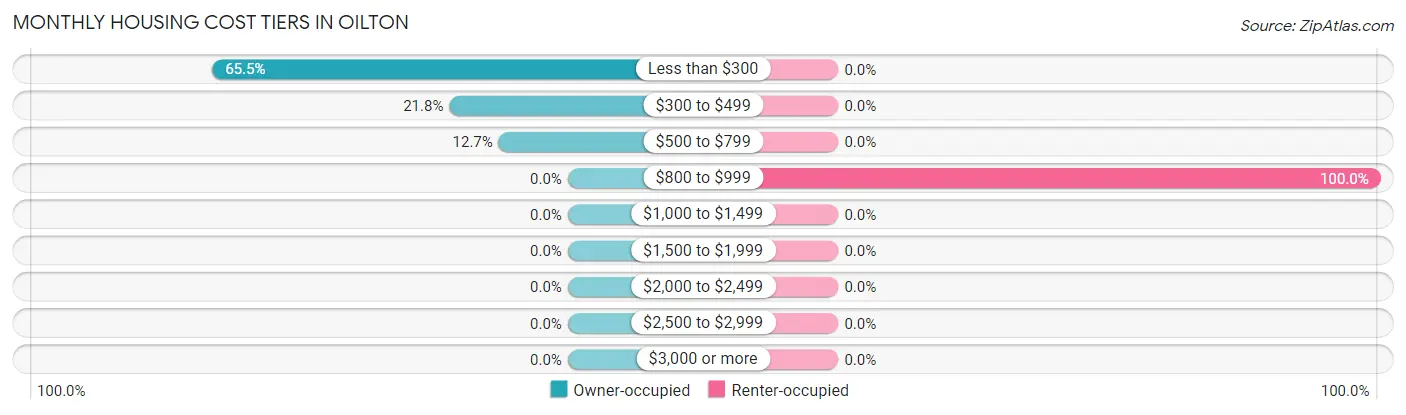
| Monthly Cost | Owner-occupied | Renter-occupied |
| Less than $300 | 36 (65.4%) | 0 (0.0%) |
| $300 to $499 | 12 (21.8%) | 0 (0.0%) |
| $500 to $799 | 7 (12.7%) | 0 (0.0%) |
| $800 to $999 | 0 (0.0%) | 7 (100.0%) |
| $1,000 to $1,499 | 0 (0.0%) | 0 (0.0%) |
| $1,500 to $1,999 | 0 (0.0%) | 0 (0.0%) |
| $2,000 to $2,499 | 0 (0.0%) | 0 (0.0%) |
| $2,500 to $2,999 | 0 (0.0%) | 0 (0.0%) |
| $3,000 or more | 0 (0.0%) | 0 (0.0%) |
| Total | 55 (100.0%) | 7 (100.0%) |
Physical Housing Characteristics in Oilton
Housing Structures in Oilton
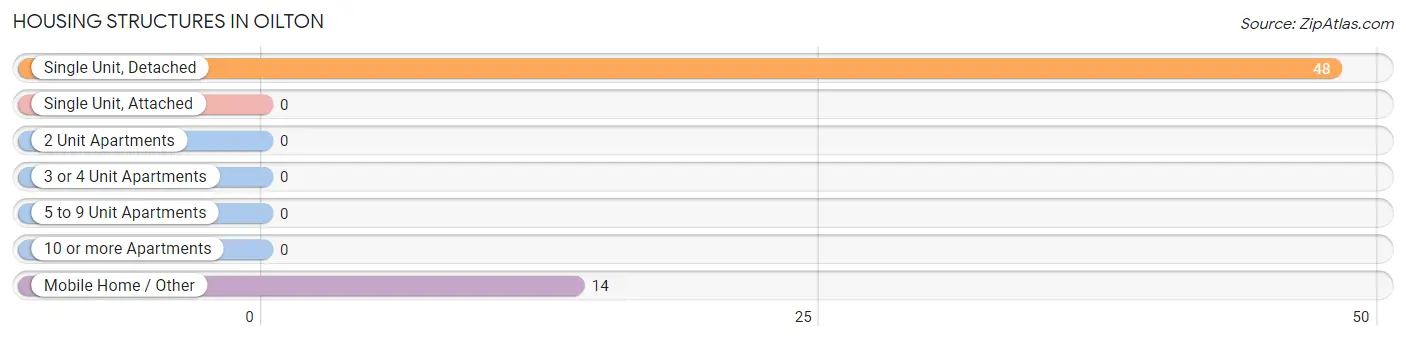
| Structure Type | # Housing Units | % Housing Units |
| Single Unit, Detached | 48 | 77.4% |
| Single Unit, Attached | 0 | 0.0% |
| 2 Unit Apartments | 0 | 0.0% |
| 3 or 4 Unit Apartments | 0 | 0.0% |
| 5 to 9 Unit Apartments | 0 | 0.0% |
| 10 or more Apartments | 0 | 0.0% |
| Mobile Home / Other | 14 | 22.6% |
| Total | 62 | 100.0% |
Housing Structures by Occupancy in Oilton
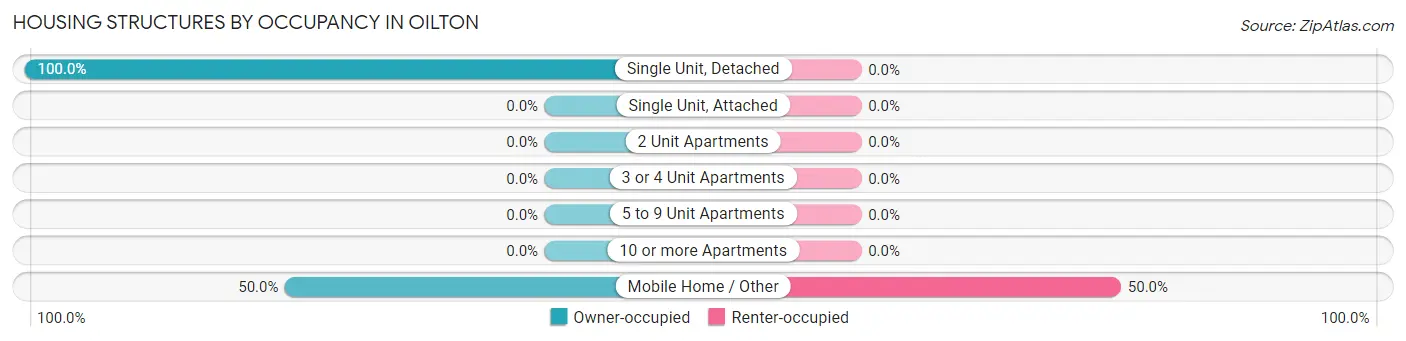
| Structure Type | Owner-occupied | Renter-occupied |
| Single Unit, Detached | 48 (100.0%) | 0 (0.0%) |
| Single Unit, Attached | 0 (0.0%) | 0 (0.0%) |
| 2 Unit Apartments | 0 (0.0%) | 0 (0.0%) |
| 3 or 4 Unit Apartments | 0 (0.0%) | 0 (0.0%) |
| 5 to 9 Unit Apartments | 0 (0.0%) | 0 (0.0%) |
| 10 or more Apartments | 0 (0.0%) | 0 (0.0%) |
| Mobile Home / Other | 7 (50.0%) | 7 (50.0%) |
| Total | 55 (88.7%) | 7 (11.3%) |
Housing Structures by Number of Rooms in Oilton
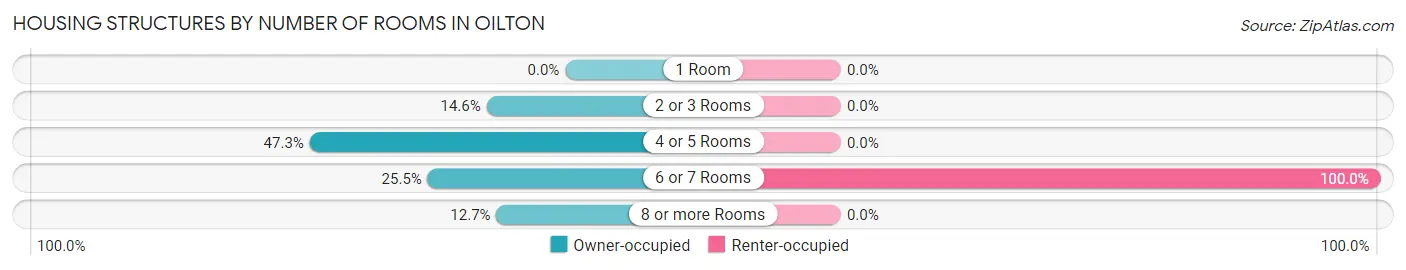
| Number of Rooms | Owner-occupied | Renter-occupied |
| 1 Room | 0 (0.0%) | 0 (0.0%) |
| 2 or 3 Rooms | 8 (14.5%) | 0 (0.0%) |
| 4 or 5 Rooms | 26 (47.3%) | 0 (0.0%) |
| 6 or 7 Rooms | 14 (25.5%) | 7 (100.0%) |
| 8 or more Rooms | 7 (12.7%) | 0 (0.0%) |
| Total | 55 (100.0%) | 7 (100.0%) |
Housing Structure by Heating Type in Oilton
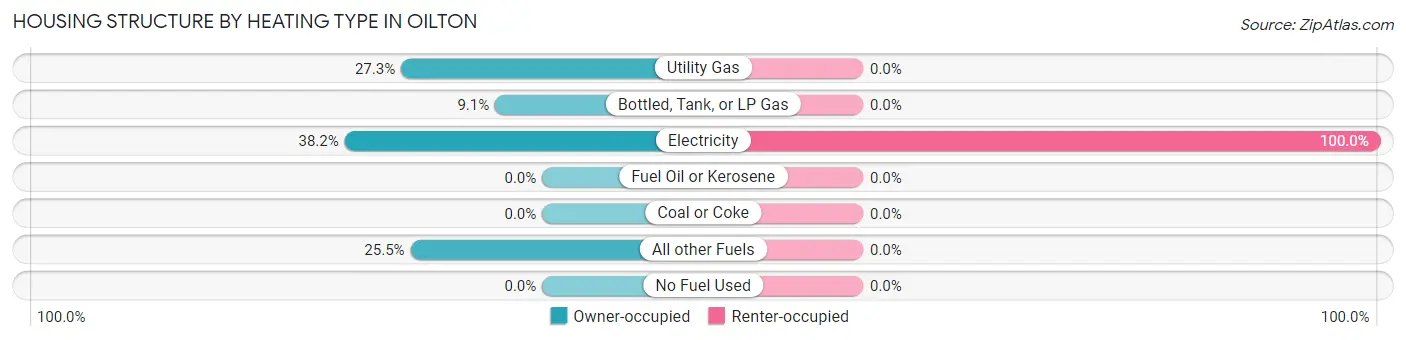
| Heating Type | Owner-occupied | Renter-occupied |
| Utility Gas | 15 (27.3%) | 0 (0.0%) |
| Bottled, Tank, or LP Gas | 5 (9.1%) | 0 (0.0%) |
| Electricity | 21 (38.2%) | 7 (100.0%) |
| Fuel Oil or Kerosene | 0 (0.0%) | 0 (0.0%) |
| Coal or Coke | 0 (0.0%) | 0 (0.0%) |
| All other Fuels | 14 (25.5%) | 0 (0.0%) |
| No Fuel Used | 0 (0.0%) | 0 (0.0%) |
| Total | 55 (100.0%) | 7 (100.0%) |
Household Vehicle Usage in Oilton
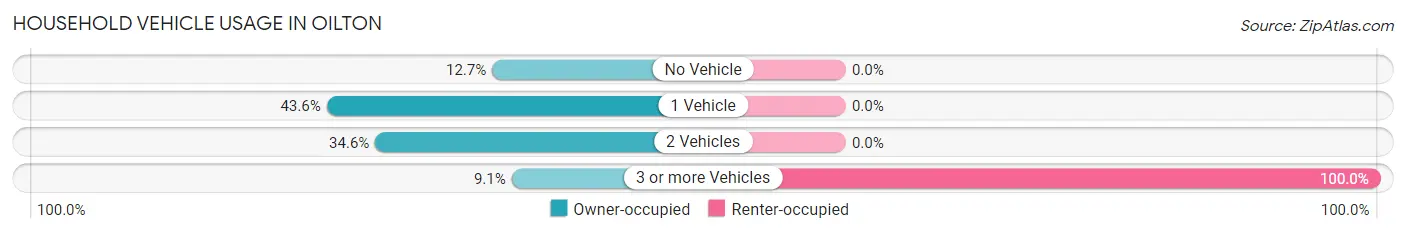
| Vehicles per Household | Owner-occupied | Renter-occupied |
| No Vehicle | 7 (12.7%) | 0 (0.0%) |
| 1 Vehicle | 24 (43.6%) | 0 (0.0%) |
| 2 Vehicles | 19 (34.5%) | 0 (0.0%) |
| 3 or more Vehicles | 5 (9.1%) | 7 (100.0%) |
| Total | 55 (100.0%) | 7 (100.0%) |
Real Estate & Mortgages in Oilton
Real Estate and Mortgage Overview in Oilton
| Characteristic | Without Mortgage | With Mortgage |
| Housing Units | 55 | 0 |
| Median Property Value | $75,000 | $0 |
| Median Household Income | $37,969 | $0 |
| Monthly Housing Costs | $243 | $0 |
| Real Estate Taxes | - | - |
Property Value by Mortgage Status in Oilton
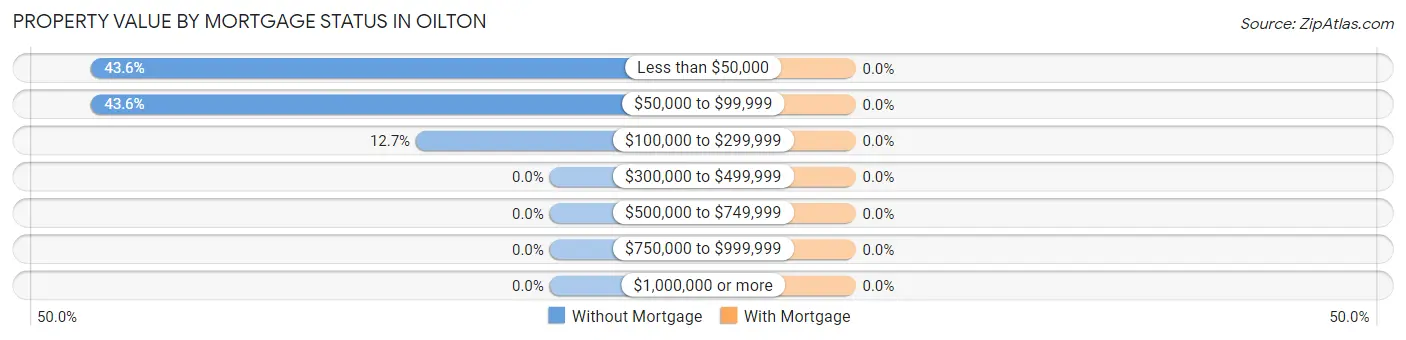
| Property Value | Without Mortgage | With Mortgage |
| Less than $50,000 | 24 (43.6%) | 0 (0.0%) |
| $50,000 to $99,999 | 24 (43.6%) | 0 (0.0%) |
| $100,000 to $299,999 | 7 (12.7%) | 0 (0.0%) |
| $300,000 to $499,999 | 0 (0.0%) | 0 (0.0%) |
| $500,000 to $749,999 | 0 (0.0%) | 0 (0.0%) |
| $750,000 to $999,999 | 0 (0.0%) | 0 (0.0%) |
| $1,000,000 or more | 0 (0.0%) | 0 (0.0%) |
| Total | 55 (100.0%) | 0 (0.0%) |
Household Income by Mortgage Status in Oilton
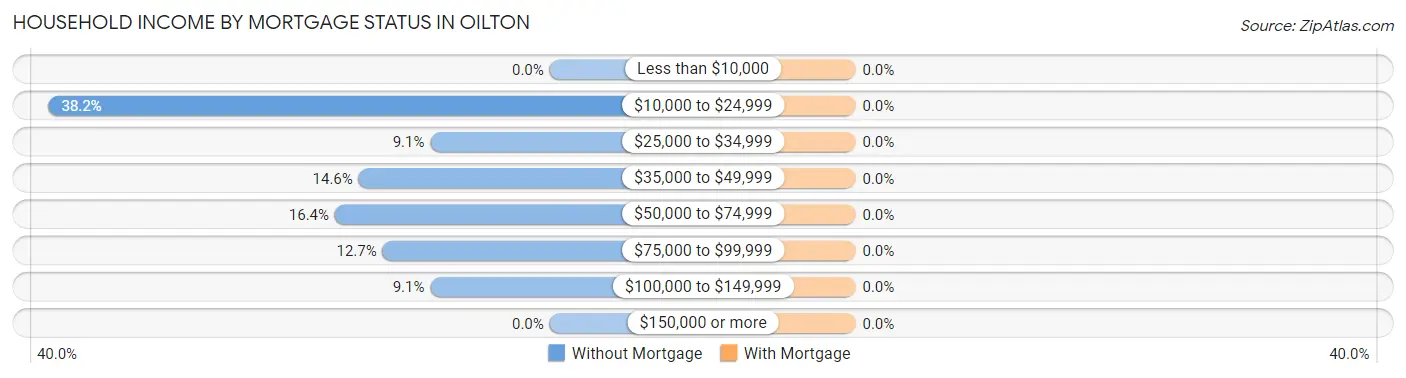
| Household Income | Without Mortgage | With Mortgage |
| Less than $10,000 | 0 (0.0%) | 0 (0.0%) |
| $10,000 to $24,999 | 21 (38.2%) | 0 (0.0%) |
| $25,000 to $34,999 | 5 (9.1%) | 0 (0.0%) |
| $35,000 to $49,999 | 8 (14.5%) | 0 (0.0%) |
| $50,000 to $74,999 | 9 (16.4%) | 0 (0.0%) |
| $75,000 to $99,999 | 7 (12.7%) | 0 (0.0%) |
| $100,000 to $149,999 | 5 (9.1%) | 0 (0.0%) |
| $150,000 or more | 0 (0.0%) | 0 (0.0%) |
| Total | 55 (100.0%) | 0 (0.0%) |
Property Value to Household Income Ratio in Oilton
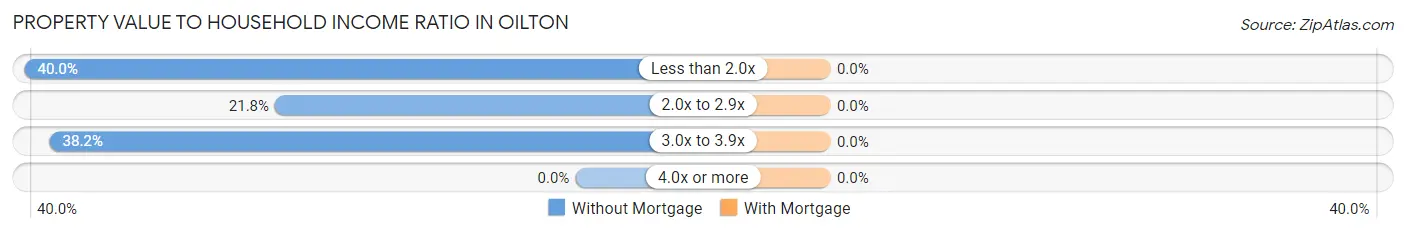
| Value-to-Income Ratio | Without Mortgage | With Mortgage |
| Less than 2.0x | 22 (40.0%) | 0 (0.0%) |
| 2.0x to 2.9x | 12 (21.8%) | 0 (0.0%) |
| 3.0x to 3.9x | 21 (38.2%) | 0 (0.0%) |
| 4.0x or more | 0 (0.0%) | 0 (0.0%) |
| Total | 55 (100.0%) | 0 (0.0%) |
Real Estate Taxes by Mortgage Status in Oilton
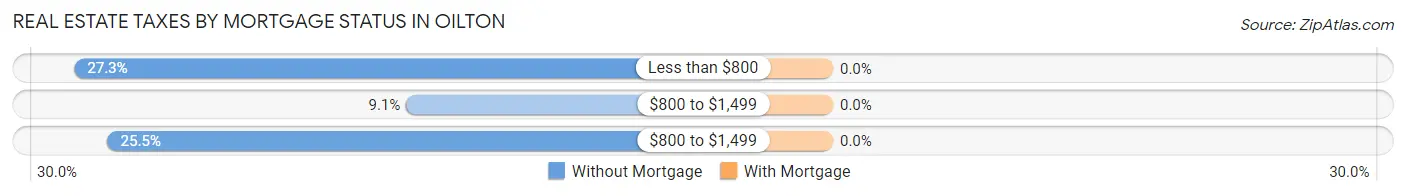
| Property Taxes | Without Mortgage | With Mortgage |
| Less than $800 | 15 (27.3%) | 0 (0.0%) |
| $800 to $1,499 | 5 (9.1%) | 0 (0.0%) |
| $800 to $1,499 | 14 (25.5%) | 0 (0.0%) |
| Total | 55 (100.0%) | 0 (0.0%) |
Health & Disability in Oilton
Health Insurance Coverage by Age in Oilton
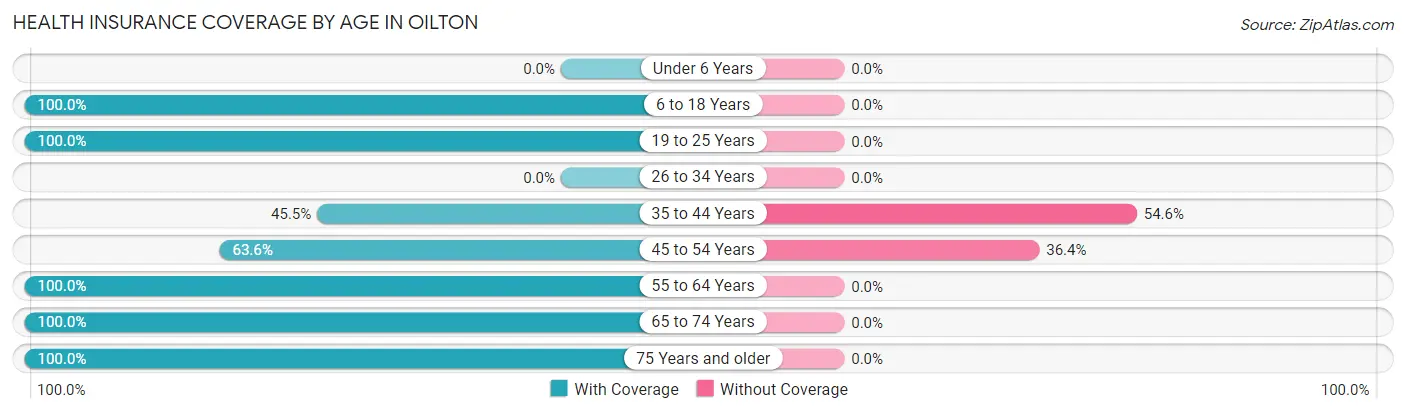
| Age Bracket | With Coverage | Without Coverage |
| Under 6 Years | 0 (0.0%) | 0 (0.0%) |
| 6 to 18 Years | 17 (100.0%) | 0 (0.0%) |
| 19 to 25 Years | 25 (100.0%) | 0 (0.0%) |
| 26 to 34 Years | 0 (0.0%) | 0 (0.0%) |
| 35 to 44 Years | 5 (45.5%) | 6 (54.5%) |
| 45 to 54 Years | 14 (63.6%) | 8 (36.4%) |
| 55 to 64 Years | 21 (100.0%) | 0 (0.0%) |
| 65 to 74 Years | 26 (100.0%) | 0 (0.0%) |
| 75 Years and older | 8 (100.0%) | 0 (0.0%) |
| Total | 116 (89.2%) | 14 (10.8%) |
Health Insurance Coverage by Citizenship Status in Oilton
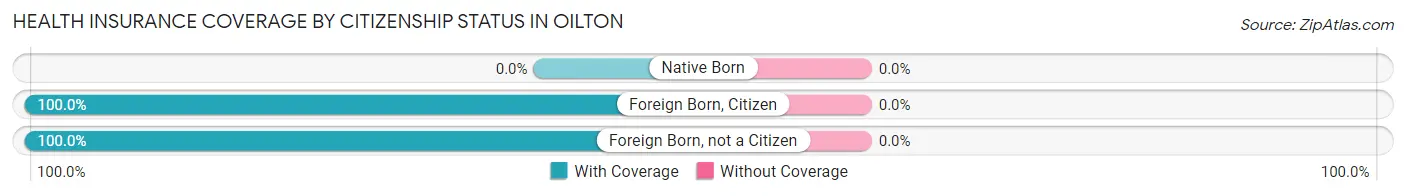
| Citizenship Status | With Coverage | Without Coverage |
| Native Born | 0 (0.0%) | 0 (0.0%) |
| Foreign Born, Citizen | 17 (100.0%) | 0 (0.0%) |
| Foreign Born, not a Citizen | 25 (100.0%) | 0 (0.0%) |
Health Insurance Coverage by Household Income in Oilton
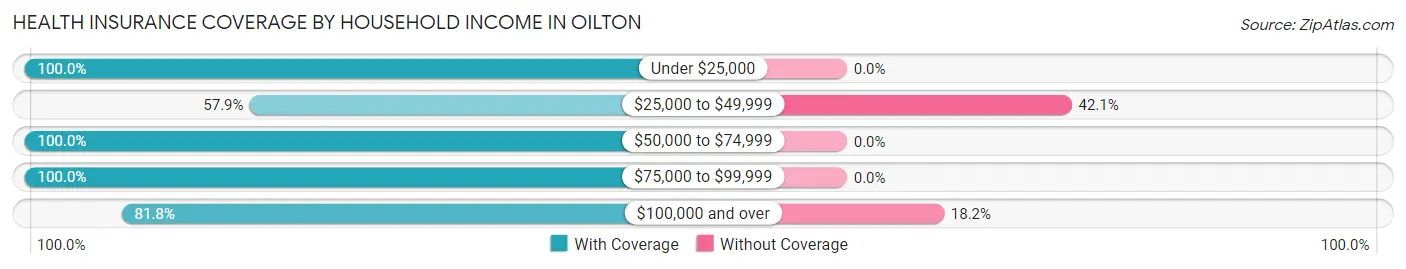
| Household Income | With Coverage | Without Coverage |
| Under $25,000 | 21 (100.0%) | 0 (0.0%) |
| $25,000 to $49,999 | 11 (57.9%) | 8 (42.1%) |
| $50,000 to $74,999 | 9 (100.0%) | 0 (0.0%) |
| $75,000 to $99,999 | 48 (100.0%) | 0 (0.0%) |
| $100,000 and over | 27 (81.8%) | 6 (18.2%) |
Public vs Private Health Insurance Coverage by Age in Oilton
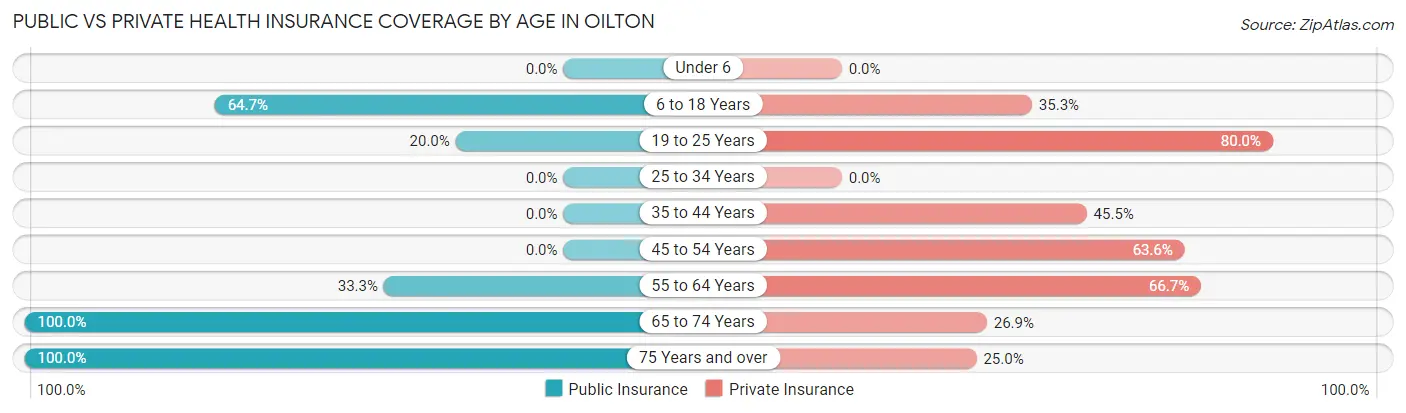
| Age Bracket | Public Insurance | Private Insurance |
| Under 6 | 0 (0.0%) | 0 (0.0%) |
| 6 to 18 Years | 11 (64.7%) | 6 (35.3%) |
| 19 to 25 Years | 5 (20.0%) | 20 (80.0%) |
| 25 to 34 Years | 0 (0.0%) | 0 (0.0%) |
| 35 to 44 Years | 0 (0.0%) | 5 (45.5%) |
| 45 to 54 Years | 0 (0.0%) | 14 (63.6%) |
| 55 to 64 Years | 7 (33.3%) | 14 (66.7%) |
| 65 to 74 Years | 26 (100.0%) | 7 (26.9%) |
| 75 Years and over | 8 (100.0%) | 2 (25.0%) |
| Total | 57 (43.9%) | 68 (52.3%) |
Disability Status by Sex by Age in Oilton
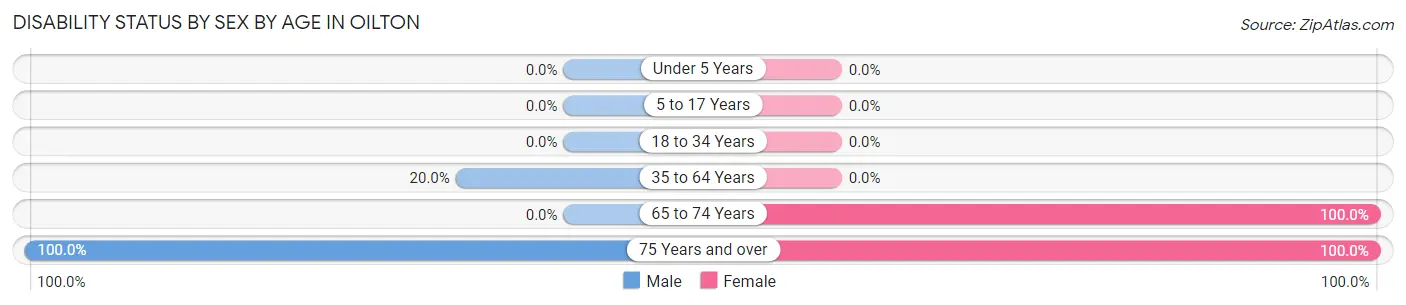
| Age Bracket | Male | Female |
| Under 5 Years | 0 (0.0%) | 0 (0.0%) |
| 5 to 17 Years | 0 (0.0%) | 0 (0.0%) |
| 18 to 34 Years | 0 (0.0%) | 0 (0.0%) |
| 35 to 64 Years | 7 (20.0%) | 0 (0.0%) |
| 65 to 74 Years | 0 (0.0%) | 5 (100.0%) |
| 75 Years and over | 6 (100.0%) | 2 (100.0%) |
Disability Class by Sex by Age in Oilton
Disability Class: Hearing Difficulty
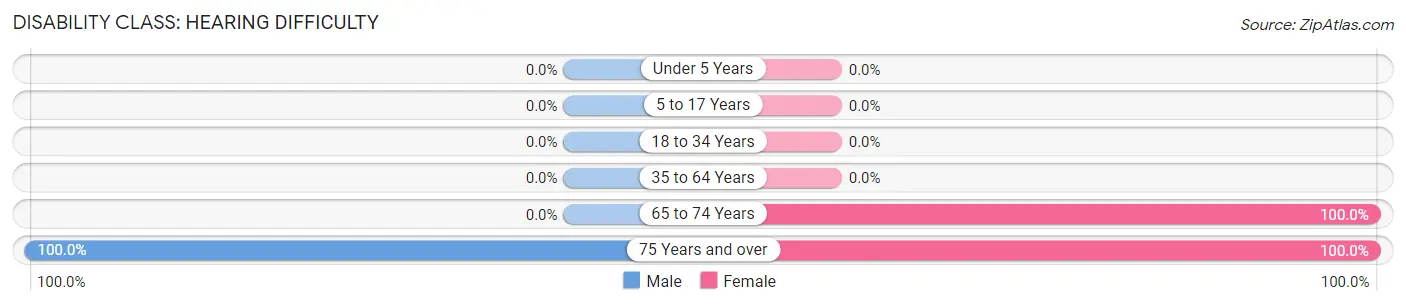
| Age Bracket | Male | Female |
| Under 5 Years | 0 (0.0%) | 0 (0.0%) |
| 5 to 17 Years | 0 (0.0%) | 0 (0.0%) |
| 18 to 34 Years | 0 (0.0%) | 0 (0.0%) |
| 35 to 64 Years | 0 (0.0%) | 0 (0.0%) |
| 65 to 74 Years | 0 (0.0%) | 5 (100.0%) |
| 75 Years and over | 6 (100.0%) | 2 (100.0%) |
Disability Class: Vision Difficulty
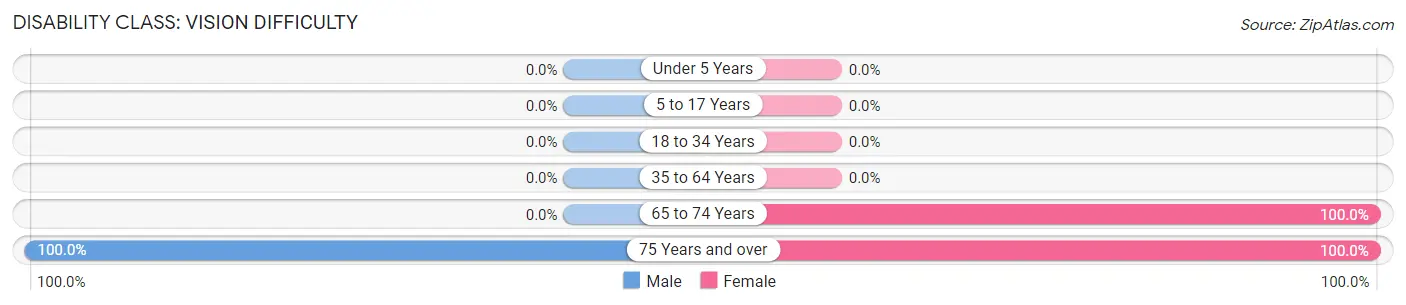
| Age Bracket | Male | Female |
| Under 5 Years | 0 (0.0%) | 0 (0.0%) |
| 5 to 17 Years | 0 (0.0%) | 0 (0.0%) |
| 18 to 34 Years | 0 (0.0%) | 0 (0.0%) |
| 35 to 64 Years | 0 (0.0%) | 0 (0.0%) |
| 65 to 74 Years | 0 (0.0%) | 5 (100.0%) |
| 75 Years and over | 6 (100.0%) | 2 (100.0%) |
Disability Class: Cognitive Difficulty
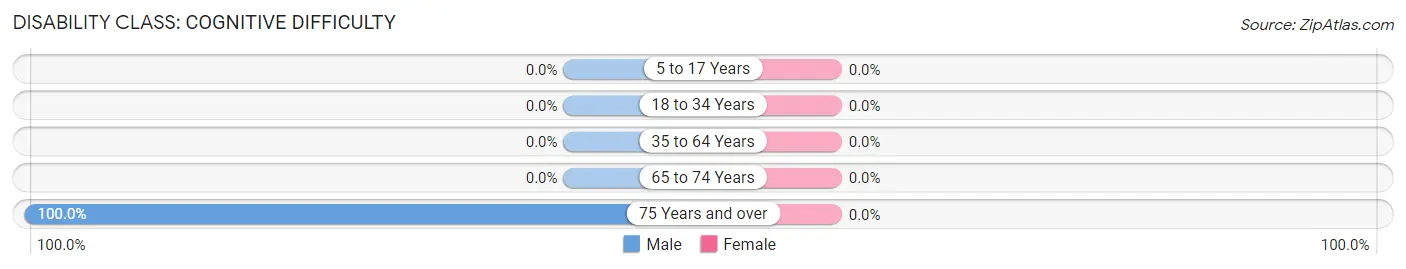
| Age Bracket | Male | Female |
| 5 to 17 Years | 0 (0.0%) | 0 (0.0%) |
| 18 to 34 Years | 0 (0.0%) | 0 (0.0%) |
| 35 to 64 Years | 0 (0.0%) | 0 (0.0%) |
| 65 to 74 Years | 0 (0.0%) | 0 (0.0%) |
| 75 Years and over | 6 (100.0%) | 0 (0.0%) |
Disability Class: Ambulatory Difficulty
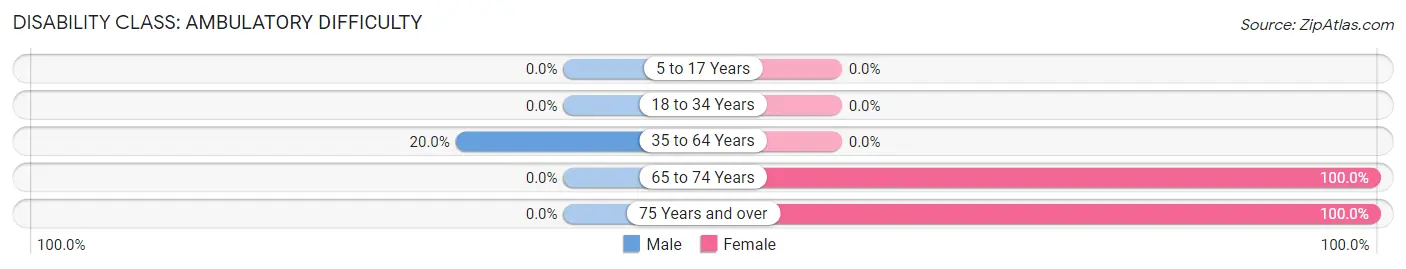
| Age Bracket | Male | Female |
| 5 to 17 Years | 0 (0.0%) | 0 (0.0%) |
| 18 to 34 Years | 0 (0.0%) | 0 (0.0%) |
| 35 to 64 Years | 7 (20.0%) | 0 (0.0%) |
| 65 to 74 Years | 0 (0.0%) | 5 (100.0%) |
| 75 Years and over | 0 (0.0%) | 2 (100.0%) |
Disability Class: Self-Care Difficulty
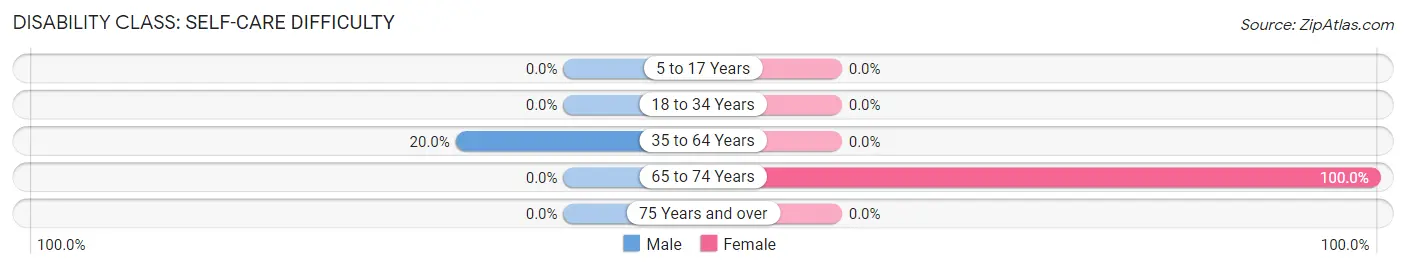
| Age Bracket | Male | Female |
| 5 to 17 Years | 0 (0.0%) | 0 (0.0%) |
| 18 to 34 Years | 0 (0.0%) | 0 (0.0%) |
| 35 to 64 Years | 7 (20.0%) | 0 (0.0%) |
| 65 to 74 Years | 0 (0.0%) | 5 (100.0%) |
| 75 Years and over | 0 (0.0%) | 0 (0.0%) |
Technology Access in Oilton
Computing Device Access in Oilton
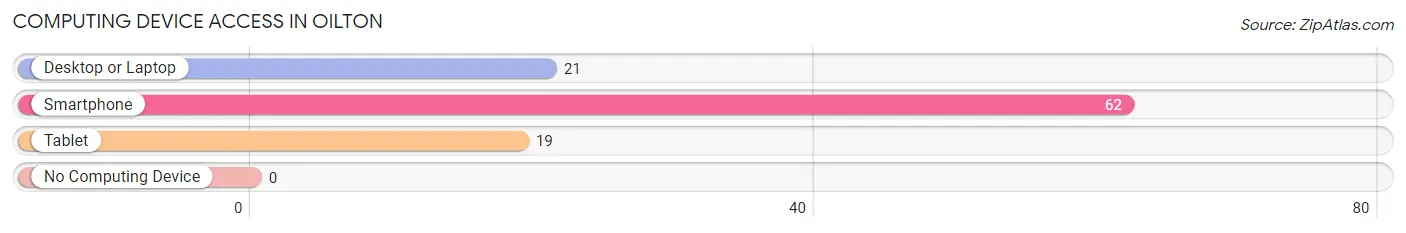
| Device Type | # Households | % Households |
| Desktop or Laptop | 21 | 33.9% |
| Smartphone | 62 | 100.0% |
| Tablet | 19 | 30.6% |
| No Computing Device | 0 | 0.0% |
| Total | 62 | 100.0% |
Internet Access in Oilton
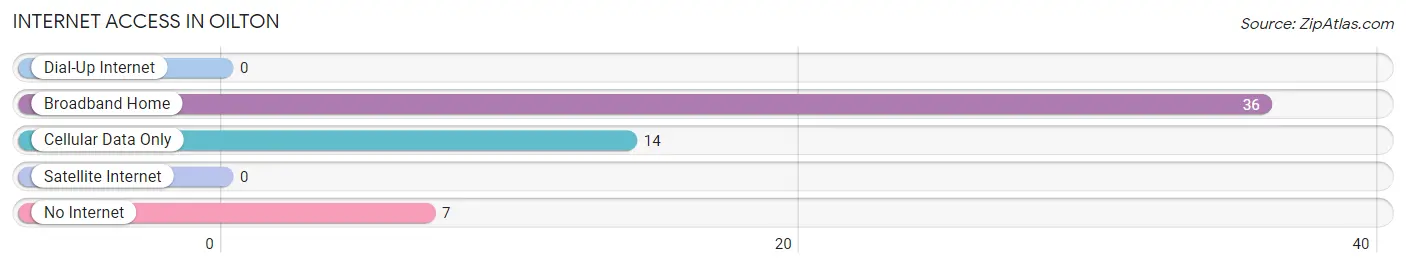
| Internet Type | # Households | % Households |
| Dial-Up Internet | 0 | 0.0% |
| Broadband Home | 36 | 58.1% |
| Cellular Data Only | 14 | 22.6% |
| Satellite Internet | 0 | 0.0% |
| No Internet | 7 | 11.3% |
| Total | 62 | 100.0% |
Oilton Summary
Oilton, Texas is a small town located in the western part of the state, in the county of Deaf Smith. It is situated on the banks of the Canadian River, about 25 miles east of Amarillo. The town was founded in 1891 by a group of settlers from Oklahoma, and was named after the nearby Oilton oil field. The population of Oilton was estimated to be around 1,000 in 2020.
Geography
Oilton is located in the western part of the Texas Panhandle, in Deaf Smith County. It is situated on the banks of the Canadian River, about 25 miles east of Amarillo. The town is surrounded by flat, open plains, with the Canadian River providing a natural boundary to the east. The climate in Oilton is semi-arid, with hot summers and cold winters. The average annual precipitation is around 17 inches.
Economy
The economy of Oilton is largely based on agriculture and oil production. The town is home to several large farms, which produce a variety of crops, including wheat, corn, and cotton. The oil industry is also an important part of the local economy, with several oil wells located in the area. In addition, Oilton is home to several small businesses, including restaurants, grocery stores, and other retail outlets.
Demographics
As of the 2010 census, the population of Oilton was 1,000. The racial makeup of the town was 94.2% White, 0.7% African American, 0.3% Native American, 0.2% Asian, 0.1% Pacific Islander, and 4.5% from other races. The median household income was $35,000, and the median family income was $41,000. The per capita income was $17,000.
History
Oilton was founded in 1891 by a group of settlers from Oklahoma. The town was named after the nearby Oilton oil field, which was discovered in 1891. The town quickly grew, and by the early 1900s, it had become a thriving community. In the 1920s, the oil industry began to decline, and the town's population began to decline as well. However, the town was able to survive, and by the 1950s, it had become a popular tourist destination. In the 1970s, the oil industry began to rebound, and the town's population began to grow again. Today, Oilton is a small, rural town, with a population of around 1,000.
Common Questions
What is Per Capita Income in Oilton?
Per Capita income in Oilton is $24,276.
What is the Median Family Income in Oilton?
Median Family Income in Oilton is $88,750.
What is the Median Household income in Oilton?
Median Household Income in Oilton is $39,063.
What is Income or Wage Gap in Oilton?
Income or Wage Gap in Oilton is 38.5%.
Women in Oilton earn 61.5 cents for every dollar earned by a man.
What is Inequality or Gini Index in Oilton?
Inequality or Gini Index in Oilton is 0.38.
What is the Total Population of Oilton?
Total Population of Oilton is 130.
What is the Total Male Population of Oilton?
Total Male Population of Oilton is 87.
What is the Total Female Population of Oilton?
Total Female Population of Oilton is 43.
What is the Ratio of Males per 100 Females in Oilton?
There are 202.33 Males per 100 Females in Oilton.
What is the Ratio of Females per 100 Males in Oilton?
There are 49.43 Females per 100 Males in Oilton.
What is the Median Population Age in Oilton?
Median Population Age in Oilton is 48.6 Years.
What is the Average Family Size in Oilton
Average Family Size in Oilton is 3.8 People.
What is the Average Household Size in Oilton
Average Household Size in Oilton is 2.1 People.
How Large is the Labor Force in Oilton?
There are 68 People in the Labor Forcein in Oilton.
What is the Percentage of People in the Labor Force in Oilton?
54.8% of People are in the Labor Force in Oilton.
What is the Unemployment Rate in Oilton?
Unemployment Rate in Oilton is 8.8%.