Wimberley, TX Map & Demographics
Wimberley Map
Wimberley Overview
$51,592
PER CAPITA INCOME
$121,722
AVG FAMILY INCOME
$92,868
AVG HOUSEHOLD INCOME
24.7%
WAGE / INCOME GAP [ % ]
75.3¢/ $1
WAGE / INCOME GAP [ $ ]
0.46
INEQUALITY / GINI INDEX
2,858
TOTAL POPULATION
1,656
MALE POPULATION
1,202
FEMALE POPULATION
137.77
MALES / 100 FEMALES
72.58
FEMALES / 100 MALES
54.2
MEDIAN AGE
2.7
AVG FAMILY SIZE
2.2
AVG HOUSEHOLD SIZE
1,659
LABOR FORCE [ PEOPLE ]
63.7%
PERCENT IN LABOR FORCE
11.6%
UNEMPLOYMENT RATE
Wimberley Zip Codes
Wimberley Area Codes
Income in Wimberley
Income Overview in Wimberley
Per Capita Income in Wimberley is $51,592, while median incomes of families and households are $121,722 and $92,868 respectively.
| Characteristic | Number | Measure |
| Per Capita Income | 2,858 | $51,592 |
| Median Family Income | 766 | $121,722 |
| Mean Family Income | 766 | $157,199 |
| Median Household Income | 1,275 | $92,868 |
| Mean Household Income | 1,275 | $118,040 |
| Income Deficit | 766 | $0 |
| Wage / Income Gap (%) | 2,858 | 24.73% |
| Wage / Income Gap ($) | 2,858 | 75.27¢ per $1 |
| Gini / Inequality Index | 2,858 | 0.46 |
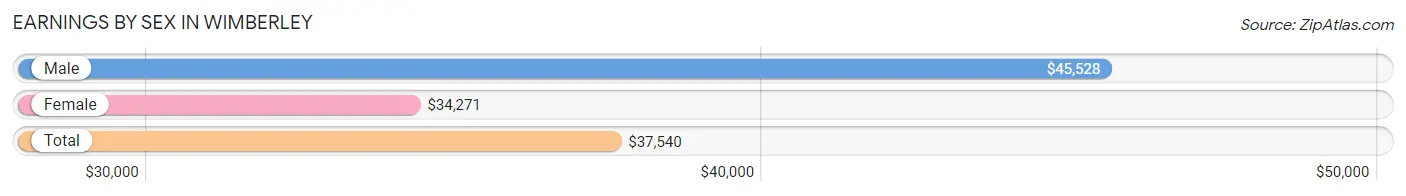
Earnings by Sex in Wimberley
Average Earnings in Wimberley are $37,540, $45,528 for men and $34,271 for women, a difference of 24.7%.
| Sex | Number | Average Earnings |
| Male | 1,163 (70.1%) | $45,528 |
| Female | 495 (29.9%) | $34,271 |
| Total | 1,658 (100.0%) | $37,540 |
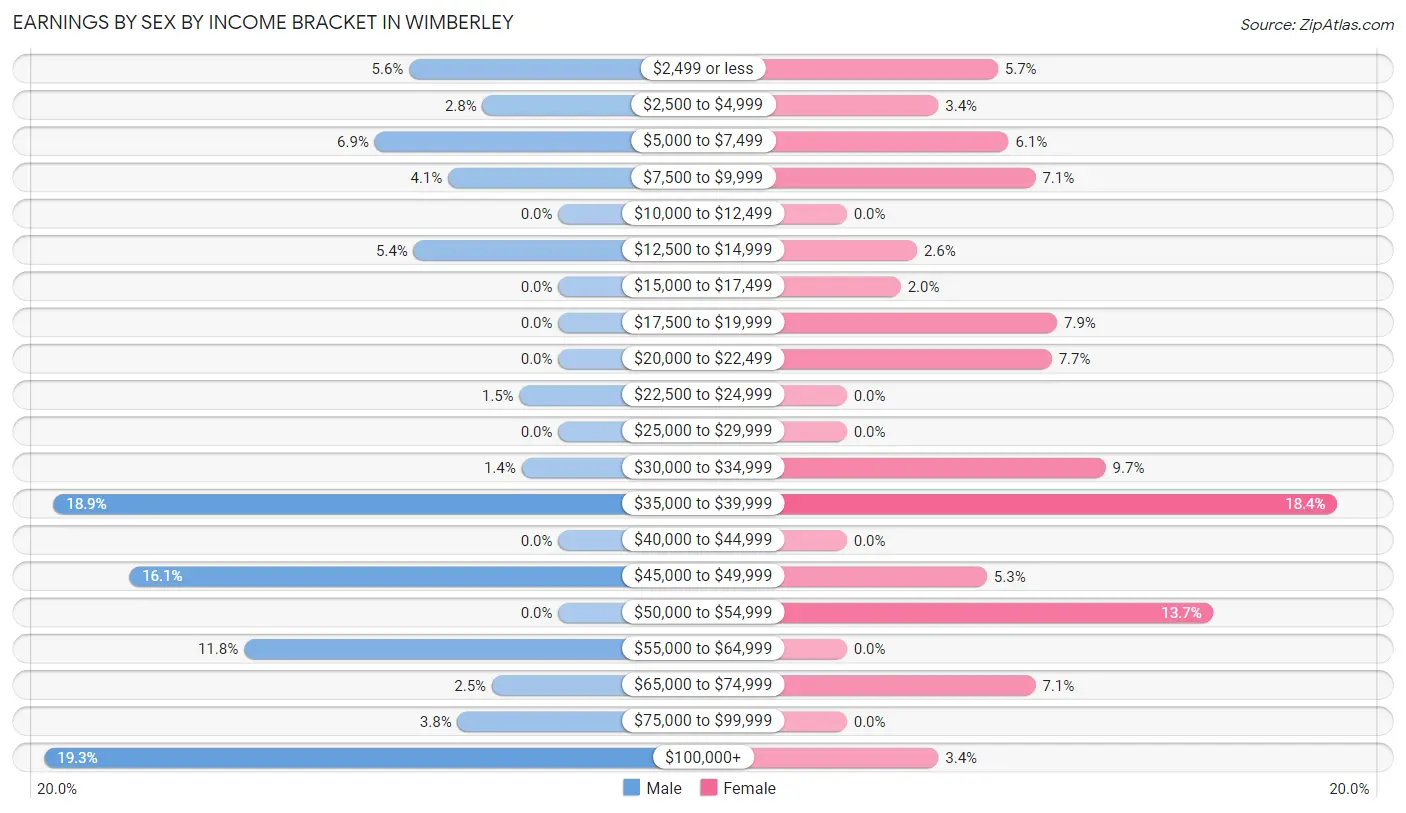
Earnings by Sex by Income Bracket in Wimberley
The most common earnings brackets in Wimberley are $100,000+ for men (224 | 19.3%) and $35,000 to $39,999 for women (91 | 18.4%).
| Income | Male | Female |
| $2,499 or less | 65 (5.6%) | 28 (5.7%) |
| $2,500 to $4,999 | 33 (2.8%) | 17 (3.4%) |
| $5,000 to $7,499 | 80 (6.9%) | 30 (6.1%) |
| $7,500 to $9,999 | 48 (4.1%) | 35 (7.1%) |
| $10,000 to $12,499 | 0 (0.0%) | 0 (0.0%) |
| $12,500 to $14,999 | 63 (5.4%) | 13 (2.6%) |
| $15,000 to $17,499 | 0 (0.0%) | 10 (2.0%) |
| $17,500 to $19,999 | 0 (0.0%) | 39 (7.9%) |
| $20,000 to $22,499 | 0 (0.0%) | 38 (7.7%) |
| $22,500 to $24,999 | 17 (1.5%) | 0 (0.0%) |
| $25,000 to $29,999 | 0 (0.0%) | 0 (0.0%) |
| $30,000 to $34,999 | 16 (1.4%) | 48 (9.7%) |
| $35,000 to $39,999 | 220 (18.9%) | 91 (18.4%) |
| $40,000 to $44,999 | 0 (0.0%) | 0 (0.0%) |
| $45,000 to $49,999 | 187 (16.1%) | 26 (5.2%) |
| $50,000 to $54,999 | 0 (0.0%) | 68 (13.7%) |
| $55,000 to $64,999 | 137 (11.8%) | 0 (0.0%) |
| $65,000 to $74,999 | 29 (2.5%) | 35 (7.1%) |
| $75,000 to $99,999 | 44 (3.8%) | 0 (0.0%) |
| $100,000+ | 224 (19.3%) | 17 (3.4%) |
| Total | 1,163 (100.0%) | 495 (100.0%) |
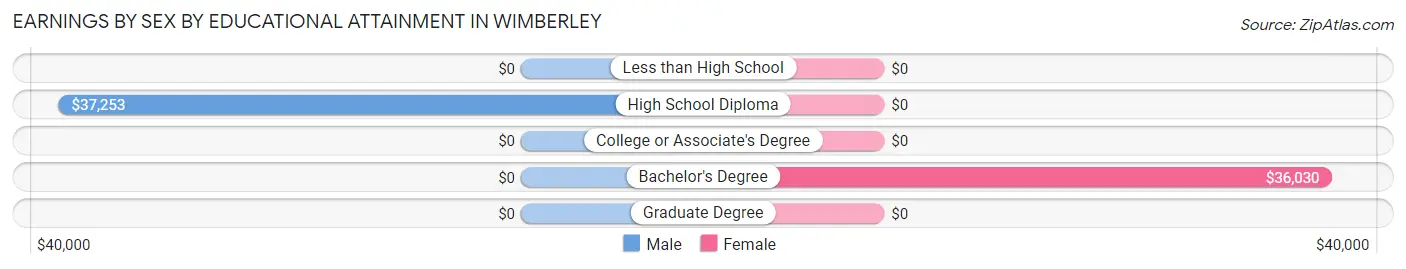
Earnings by Sex by Educational Attainment in Wimberley
Average earnings in Wimberley are $47,198 for men and $35,632 for women, a difference of 24.5%. Men with an educational attainment of high school diploma enjoy the highest average annual earnings of $37,253, while those with high school diploma education earn the least with $37,253. Women with an educational attainment of bachelor's degree earn the most with the average annual earnings of $36,030, while those with bachelor's degree education have the smallest earnings of $36,030.
| Educational Attainment | Male Income | Female Income |
| Less than High School | - | - |
| High School Diploma | $37,253 | $0 |
| College or Associate's Degree | - | - |
| Bachelor's Degree | - | - |
| Graduate Degree | - | - |
| Total | $47,198 | $35,632 |
Family Income in Wimberley
Family Income Brackets in Wimberley
According to the Wimberley family income data, there are 208 families falling into the $200,000+ income range, which is the most common income bracket and makes up 27.2% of all families.
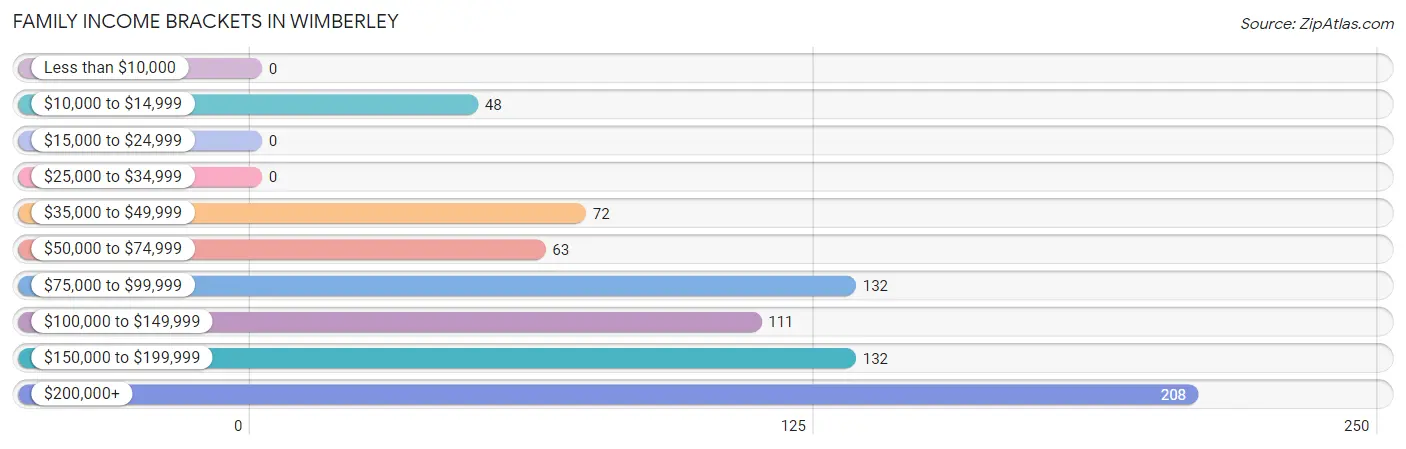
| Income Bracket | # Families | % Families |
| Less than $10,000 | 0 | 0.0% |
| $10,000 to $14,999 | 48 | 6.3% |
| $15,000 to $24,999 | 0 | 0.0% |
| $25,000 to $34,999 | 0 | 0.0% |
| $35,000 to $49,999 | 72 | 9.4% |
| $50,000 to $74,999 | 63 | 8.2% |
| $75,000 to $99,999 | 132 | 17.2% |
| $100,000 to $149,999 | 111 | 14.5% |
| $150,000 to $199,999 | 132 | 17.2% |
| $200,000+ | 208 | 27.2% |
Family Income by Famaliy Size in Wimberley
3-person families (181 | 23.6%) account for the highest median family income in Wimberley with $189,491 per family, while 3-person families (181 | 23.6%) have the highest median income of $63,164 per family member.
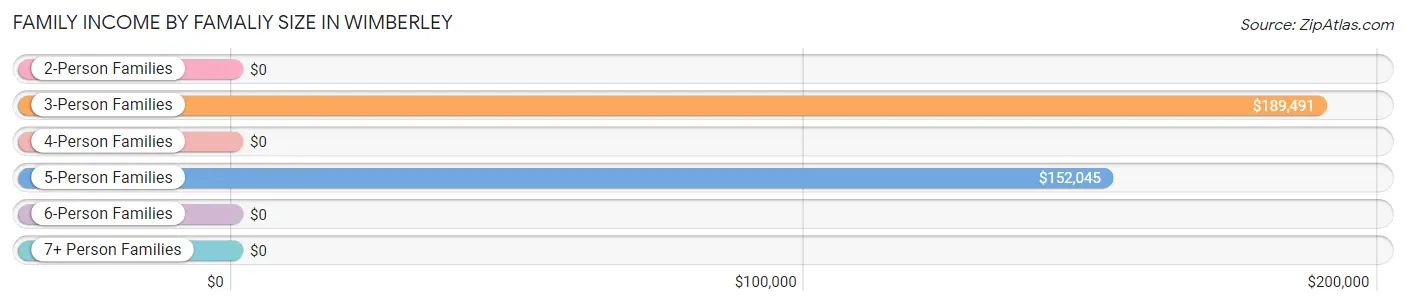
| Income Bracket | # Families | Median Income |
| 2-Person Families | 475 (62.0%) | $0 |
| 3-Person Families | 181 (23.6%) | $189,491 |
| 4-Person Families | 59 (7.7%) | $0 |
| 5-Person Families | 36 (4.7%) | $152,045 |
| 6-Person Families | 15 (2.0%) | $0 |
| 7+ Person Families | 0 (0.0%) | $0 |
| Total | 766 (100.0%) | $121,722 |
Family Income by Number of Earners in Wimberley
The median family income in Wimberley is $121,722, with families comprising 2 earners (355) having the highest median family income of $247,871, while families with 1 earner (266) have the lowest median family income of $76,607, accounting for 46.3% and 34.7% of families, respectively.
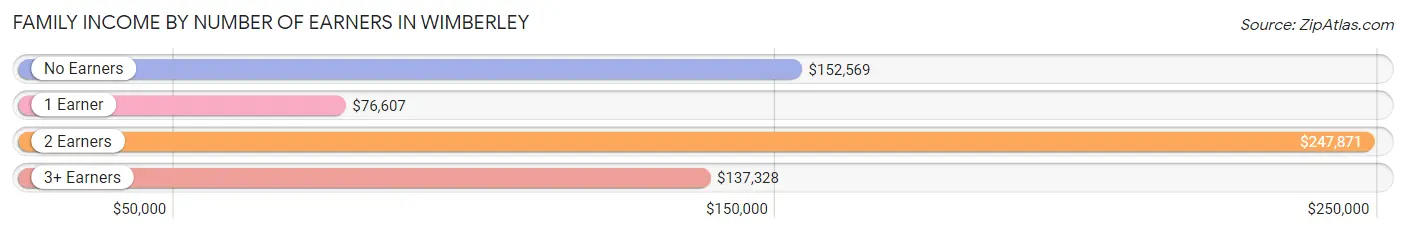
| Number of Earners | # Families | Median Income |
| No Earners | 91 (11.9%) | $152,569 |
| 1 Earner | 266 (34.7%) | $76,607 |
| 2 Earners | 355 (46.3%) | $247,871 |
| 3+ Earners | 54 (7.0%) | $137,328 |
| Total | 766 (100.0%) | $121,722 |
Household Income in Wimberley
Household Income Brackets in Wimberley
With 280 households falling in the category, the $35,000 to $49,999 income range is the most frequent in Wimberley, accounting for 22.0% of all households. In contrast, only 17 households (1.3%) fall into the $25,000 to $34,999 income bracket, making it the least populous group.
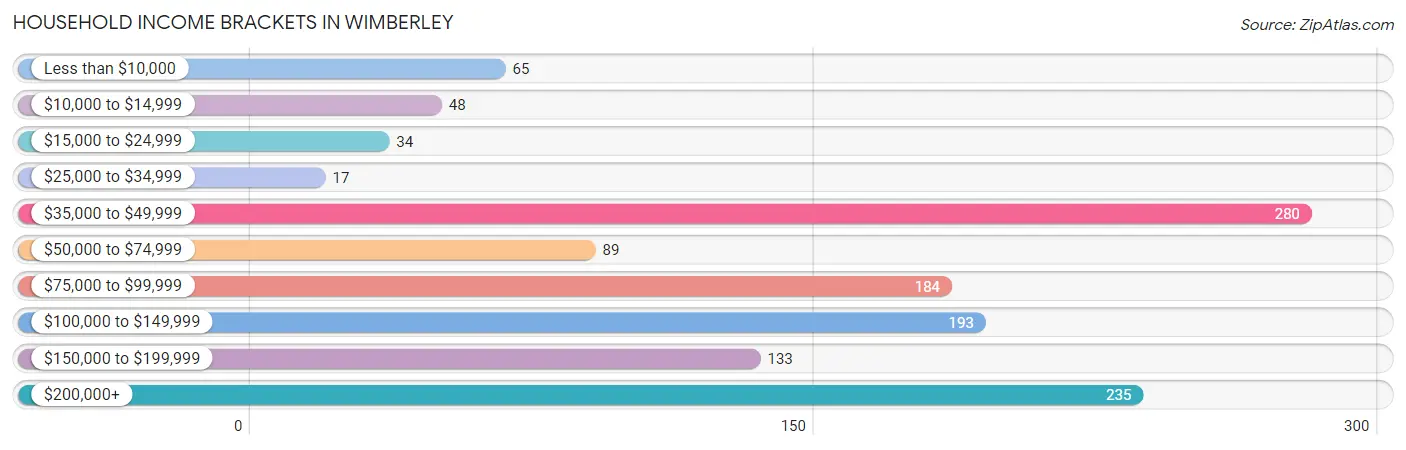
| Income Bracket | # Households | % Households |
| Less than $10,000 | 65 | 5.1% |
| $10,000 to $14,999 | 48 | 3.8% |
| $15,000 to $24,999 | 34 | 2.7% |
| $25,000 to $34,999 | 17 | 1.3% |
| $35,000 to $49,999 | 280 | 22.0% |
| $50,000 to $74,999 | 89 | 7.0% |
| $75,000 to $99,999 | 184 | 14.4% |
| $100,000 to $149,999 | 193 | 15.1% |
| $150,000 to $199,999 | 133 | 10.4% |
| $200,000+ | 235 | 18.4% |
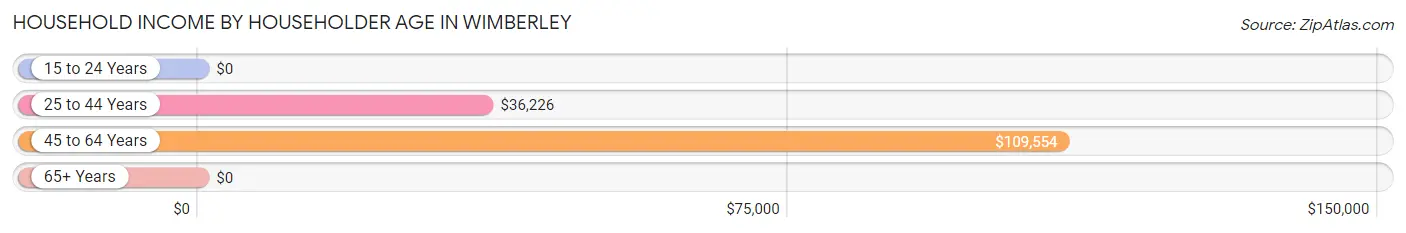
Household Income by Householder Age in Wimberley
The median household income in Wimberley is $92,868, with the highest median household income of $109,554 found in the 45 to 64 years age bracket for the primary householder. A total of 659 households (51.7%) fall into this category.
| Income Bracket | # Households | Median Income |
| 15 to 24 Years | 0 (0.0%) | $0 |
| 25 to 44 Years | 250 (19.6%) | $36,226 |
| 45 to 64 Years | 659 (51.7%) | $109,554 |
| 65+ Years | 366 (28.7%) | $0 |
| Total | 1,275 (100.0%) | $92,868 |
Poverty in Wimberley
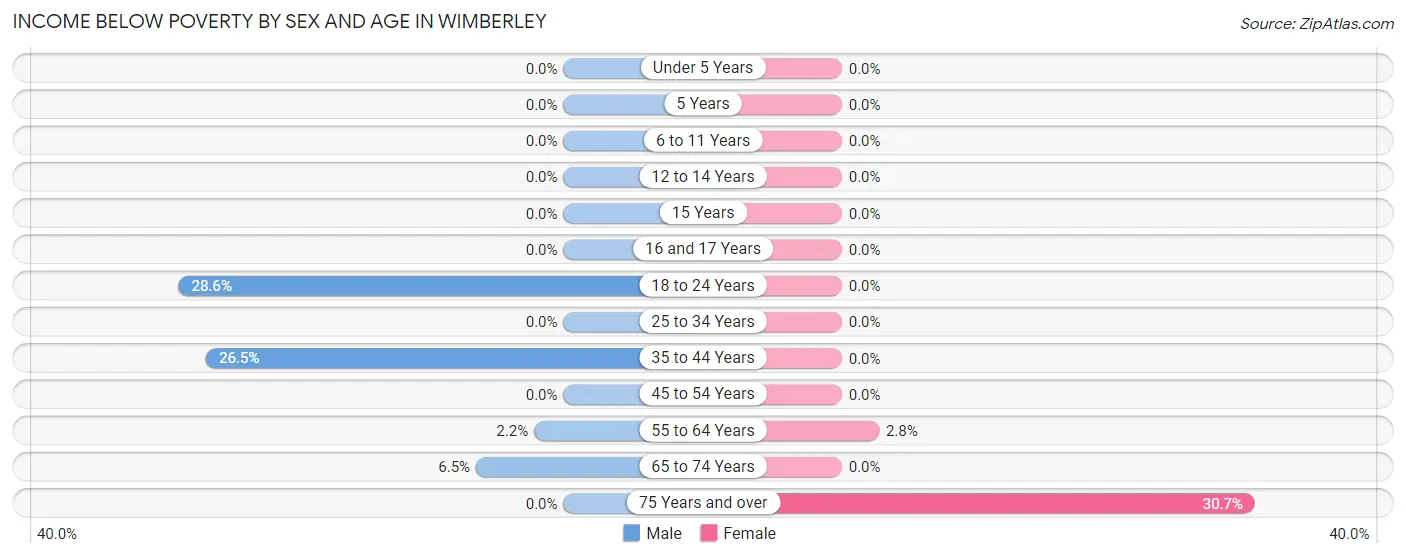
Income Below Poverty by Sex and Age in Wimberley
With 9.4% poverty level for males and 6.5% for females among the residents of Wimberley, 18 to 24 year old males and 75 year old and over females are the most vulnerable to poverty, with 80 males (28.6%) and 65 females (30.7%) in their respective age groups living below the poverty level.
| Age Bracket | Male | Female |
| Under 5 Years | 0 (0.0%) | 0 (0.0%) |
| 5 Years | 0 (0.0%) | 0 (0.0%) |
| 6 to 11 Years | 0 (0.0%) | 0 (0.0%) |
| 12 to 14 Years | 0 (0.0%) | 0 (0.0%) |
| 15 Years | 0 (0.0%) | 0 (0.0%) |
| 16 and 17 Years | 0 (0.0%) | 0 (0.0%) |
| 18 to 24 Years | 80 (28.6%) | 0 (0.0%) |
| 25 to 34 Years | 0 (0.0%) | 0 (0.0%) |
| 35 to 44 Years | 48 (26.5%) | 0 (0.0%) |
| 45 to 54 Years | 0 (0.0%) | 0 (0.0%) |
| 55 to 64 Years | 7 (2.2%) | 9 (2.8%) |
| 65 to 74 Years | 10 (6.5%) | 0 (0.0%) |
| 75 Years and over | 0 (0.0%) | 65 (30.7%) |
| Total | 145 (9.4%) | 74 (6.5%) |
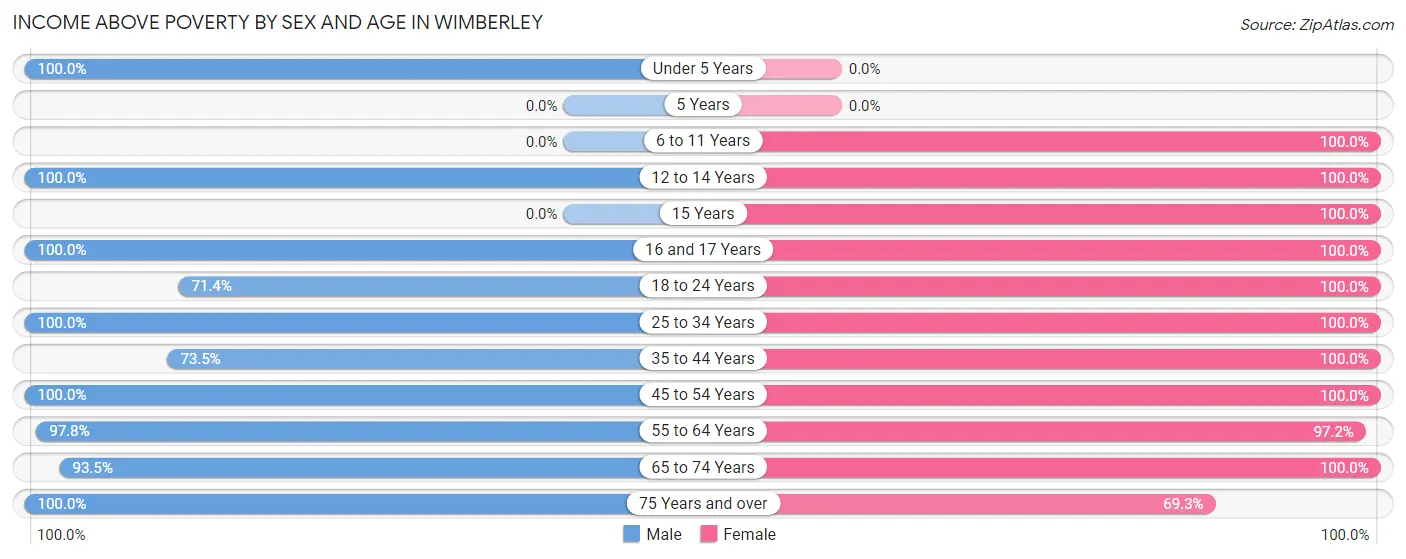
Income Above Poverty by Sex and Age in Wimberley
According to the poverty statistics in Wimberley, males aged under 5 years and females aged 6 to 11 years are the age groups that are most secure financially, with 100.0% of males and 100.0% of females in these age groups living above the poverty line.
| Age Bracket | Male | Female |
| Under 5 Years | 15 (100.0%) | 0 (0.0%) |
| 5 Years | 0 (0.0%) | 0 (0.0%) |
| 6 to 11 Years | 0 (0.0%) | 38 (100.0%) |
| 12 to 14 Years | 80 (100.0%) | 32 (100.0%) |
| 15 Years | 0 (0.0%) | 14 (100.0%) |
| 16 and 17 Years | 24 (100.0%) | 3 (100.0%) |
| 18 to 24 Years | 200 (71.4%) | 74 (100.0%) |
| 25 to 34 Years | 217 (100.0%) | 53 (100.0%) |
| 35 to 44 Years | 133 (73.5%) | 37 (100.0%) |
| 45 to 54 Years | 153 (100.0%) | 242 (100.0%) |
| 55 to 64 Years | 314 (97.8%) | 317 (97.2%) |
| 65 to 74 Years | 144 (93.5%) | 117 (100.0%) |
| 75 Years and over | 118 (100.0%) | 147 (69.3%) |
| Total | 1,398 (90.6%) | 1,074 (93.5%) |
Income Below Poverty Among Married-Couple Families in Wimberley
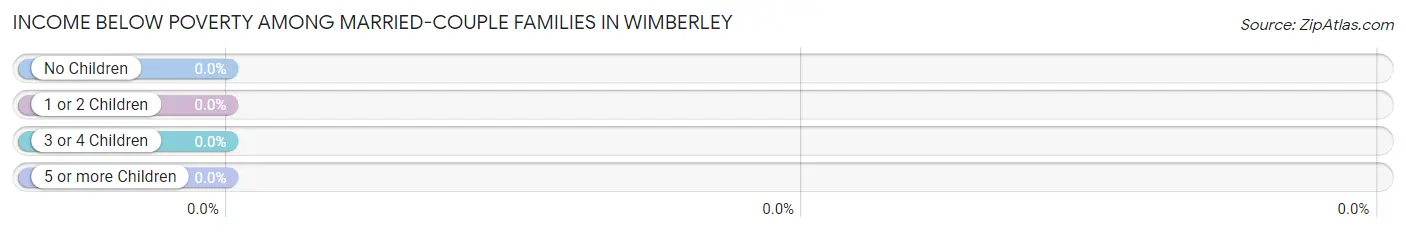
| Children | Above Poverty | Below Poverty |
| No Children | 448 (100.0%) | 0 (0.0%) |
| 1 or 2 Children | 101 (100.0%) | 0 (0.0%) |
| 3 or 4 Children | 11 (100.0%) | 0 (0.0%) |
| 5 or more Children | 0 (0.0%) | 0 (0.0%) |
| Total | 560 (100.0%) | 0 (0.0%) |
Income Below Poverty Among Single-Parent Households in Wimberley
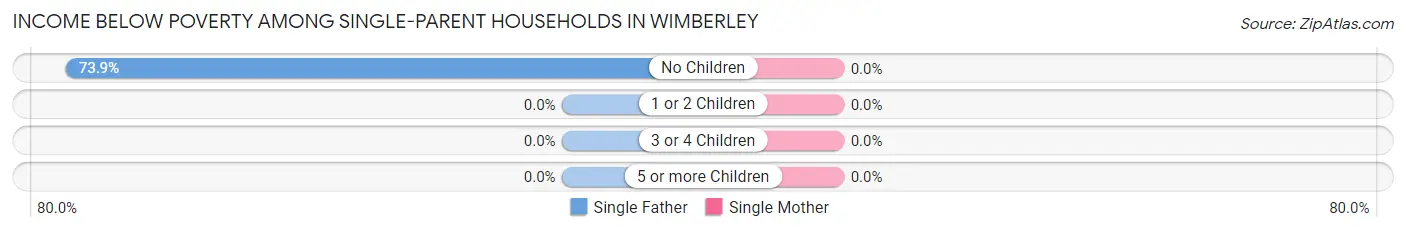
| Children | Single Father | Single Mother |
| No Children | 48 (73.9%) | 0 (0.0%) |
| 1 or 2 Children | 0 (0.0%) | 0 (0.0%) |
| 3 or 4 Children | 0 (0.0%) | 0 (0.0%) |
| 5 or more Children | 0 (0.0%) | 0 (0.0%) |
| Total | 48 (70.6%) | 0 (0.0%) |
Income Below Poverty Among Married-Couple vs Single-Parent Households in Wimberley
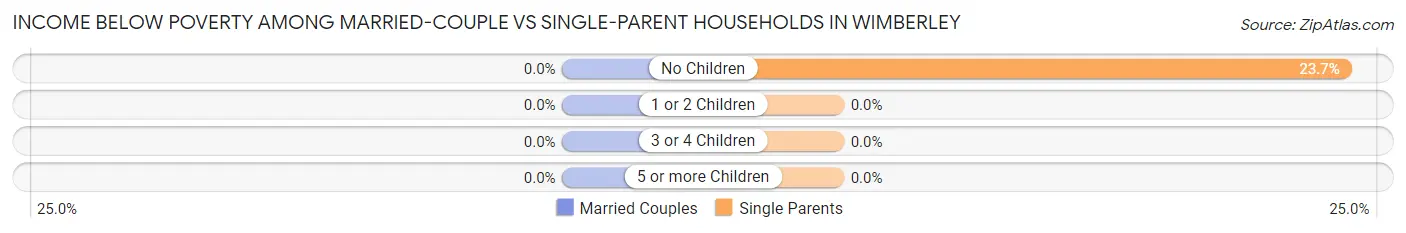
| Children | Married-Couple Families | Single-Parent Households |
| No Children | 0 (0.0%) | 48 (23.6%) |
| 1 or 2 Children | 0 (0.0%) | 0 (0.0%) |
| 3 or 4 Children | 0 (0.0%) | 0 (0.0%) |
| 5 or more Children | 0 (0.0%) | 0 (0.0%) |
| Total | 0 (0.0%) | 48 (23.3%) |
Race in Wimberley
The most populous races in Wimberley are White / Caucasian (2,699 | 94.4%), Hispanic or Latino (312 | 10.9%), and Two or more Races (114 | 4.0%).
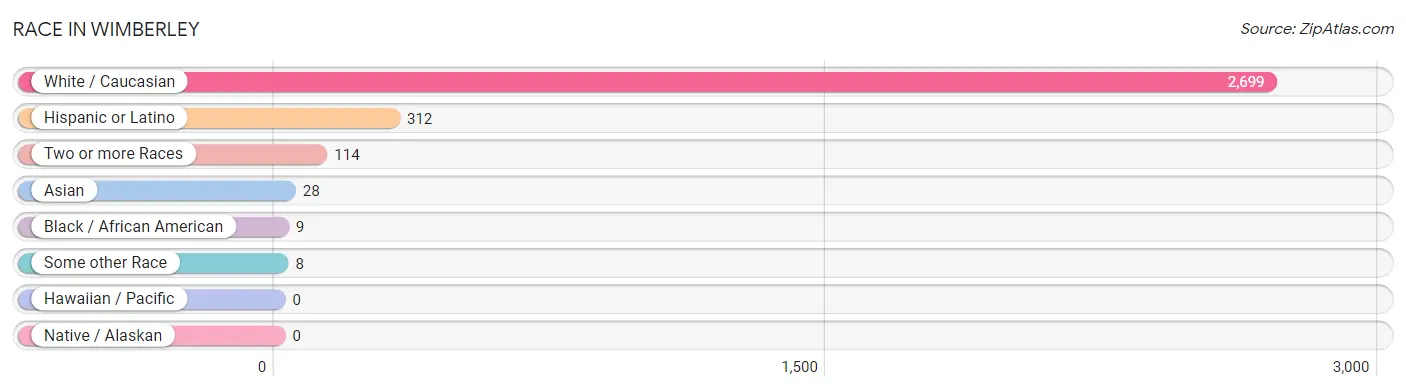
| Race | # Population | % Population |
| Asian | 28 | 1.0% |
| Black / African American | 9 | 0.3% |
| Hawaiian / Pacific | 0 | 0.0% |
| Hispanic or Latino | 312 | 10.9% |
| Native / Alaskan | 0 | 0.0% |
| White / Caucasian | 2,699 | 94.4% |
| Two or more Races | 114 | 4.0% |
| Some other Race | 8 | 0.3% |
| Total | 2,858 | 100.0% |
Ancestry in Wimberley
The most populous ancestries reported in Wimberley are Irish (689 | 24.1%), English (572 | 20.0%), German (483 | 16.9%), Mexican (282 | 9.9%), and British (147 | 5.1%), together accounting for 76.0% of all Wimberley residents.
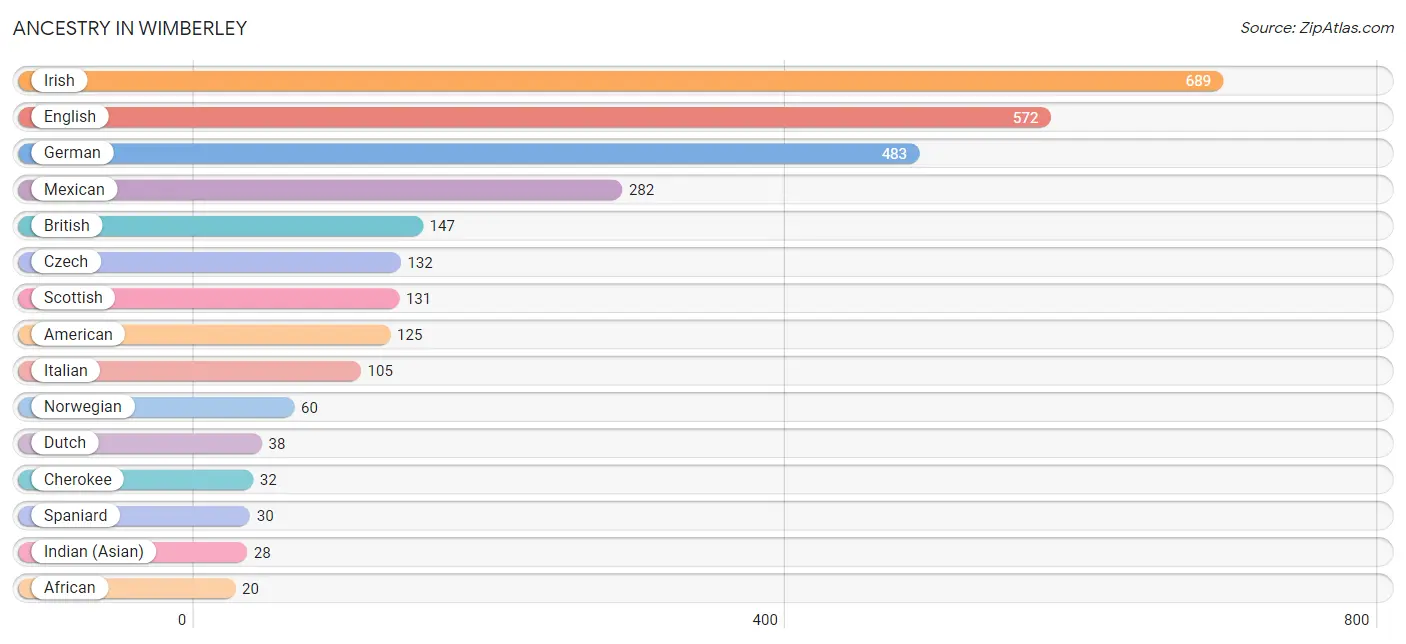
| Ancestry | # Population | % Population |
| African | 20 | 0.7% |
| American | 125 | 4.4% |
| British | 147 | 5.1% |
| Cherokee | 32 | 1.1% |
| Czech | 132 | 4.6% |
| Dutch | 38 | 1.3% |
| English | 572 | 20.0% |
| French | 10 | 0.4% |
| German | 483 | 16.9% |
| Indian (Asian) | 28 | 1.0% |
| Irish | 689 | 24.1% |
| Italian | 105 | 3.7% |
| Jamaican | 9 | 0.3% |
| Mexican | 282 | 9.9% |
| Norwegian | 60 | 2.1% |
| Portuguese | 10 | 0.4% |
| Russian | 14 | 0.5% |
| Scandinavian | 9 | 0.3% |
| Scottish | 131 | 4.6% |
| Spaniard | 30 | 1.1% |
| Subsaharan African | 20 | 0.7% | View All 21 Rows |
Immigrants in Wimberley
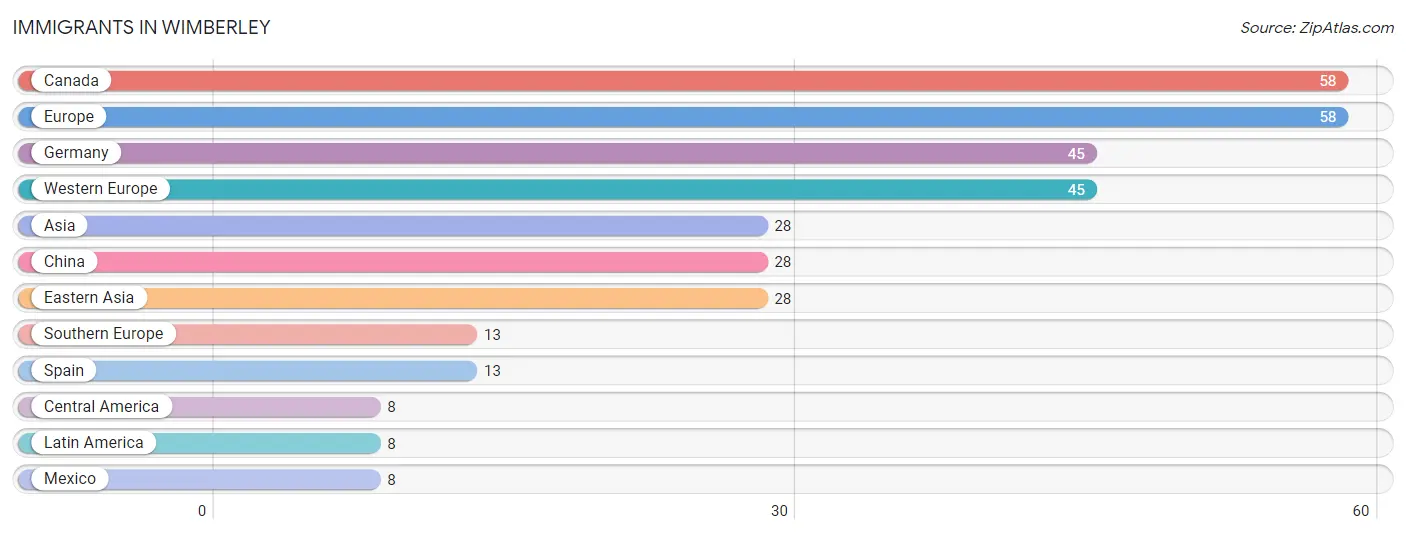
The most numerous immigrant groups reported in Wimberley came from Canada (58 | 2.0%), Europe (58 | 2.0%), Germany (45 | 1.6%), Western Europe (45 | 1.6%), and Asia (28 | 1.0%), together accounting for 8.2% of all Wimberley residents.
| Immigration Origin | # Population | % Population |
| Asia | 28 | 1.0% |
| Canada | 58 | 2.0% |
| Central America | 8 | 0.3% |
| China | 28 | 1.0% |
| Eastern Asia | 28 | 1.0% |
| Europe | 58 | 2.0% |
| Germany | 45 | 1.6% |
| Latin America | 8 | 0.3% |
| Mexico | 8 | 0.3% |
| Southern Europe | 13 | 0.4% |
| Spain | 13 | 0.4% |
| Western Europe | 45 | 1.6% | View All 12 Rows |
Sex and Age in Wimberley
Sex and Age in Wimberley
The most populous age groups in Wimberley are 60 to 64 Years (194 | 11.7%) for men and 55 to 59 Years (217 | 18.0%) for women.
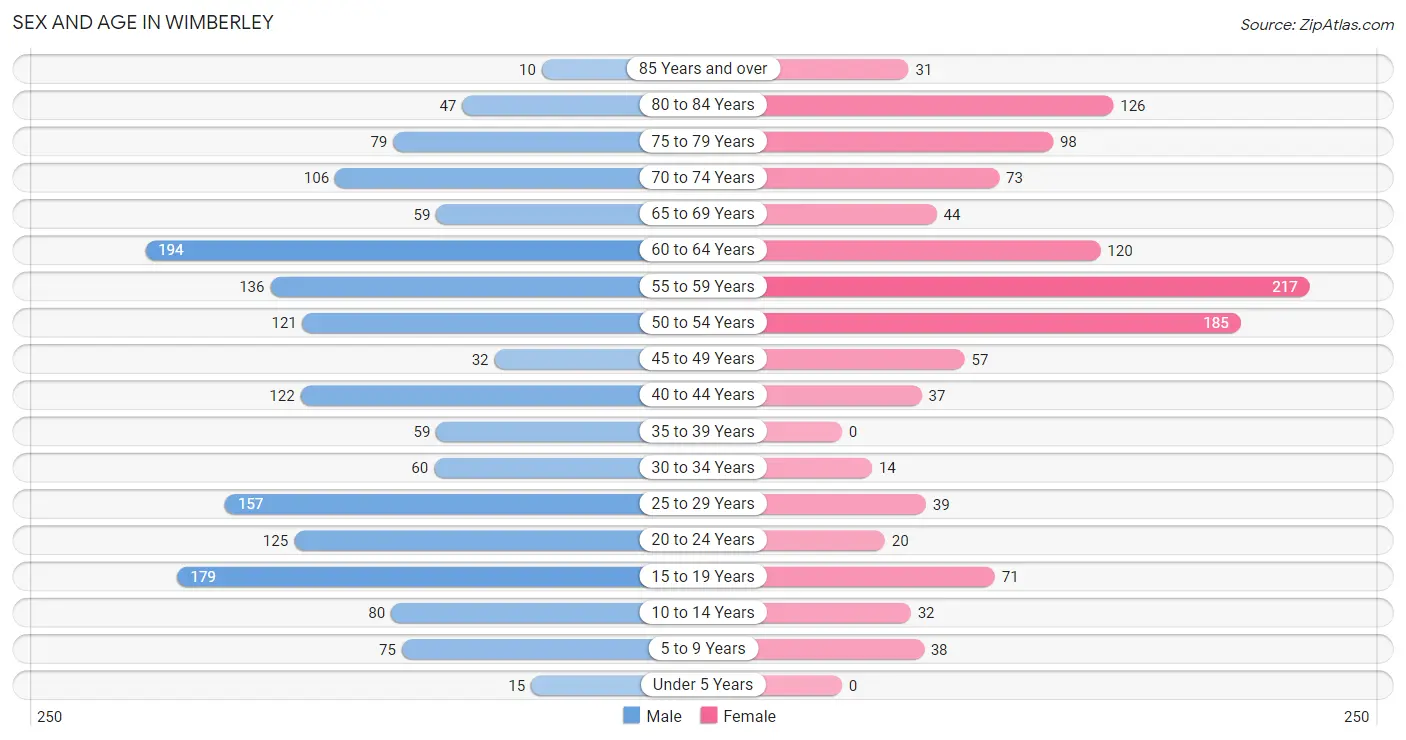
| Age Bracket | Male | Female |
| Under 5 Years | 15 (0.9%) | 0 (0.0%) |
| 5 to 9 Years | 75 (4.5%) | 38 (3.2%) |
| 10 to 14 Years | 80 (4.8%) | 32 (2.7%) |
| 15 to 19 Years | 179 (10.8%) | 71 (5.9%) |
| 20 to 24 Years | 125 (7.5%) | 20 (1.7%) |
| 25 to 29 Years | 157 (9.5%) | 39 (3.2%) |
| 30 to 34 Years | 60 (3.6%) | 14 (1.2%) |
| 35 to 39 Years | 59 (3.6%) | 0 (0.0%) |
| 40 to 44 Years | 122 (7.4%) | 37 (3.1%) |
| 45 to 49 Years | 32 (1.9%) | 57 (4.7%) |
| 50 to 54 Years | 121 (7.3%) | 185 (15.4%) |
| 55 to 59 Years | 136 (8.2%) | 217 (18.0%) |
| 60 to 64 Years | 194 (11.7%) | 120 (10.0%) |
| 65 to 69 Years | 59 (3.6%) | 44 (3.7%) |
| 70 to 74 Years | 106 (6.4%) | 73 (6.1%) |
| 75 to 79 Years | 79 (4.8%) | 98 (8.2%) |
| 80 to 84 Years | 47 (2.8%) | 126 (10.5%) |
| 85 Years and over | 10 (0.6%) | 31 (2.6%) |
| Total | 1,656 (100.0%) | 1,202 (100.0%) |
Families and Households in Wimberley
Median Family Size in Wimberley
The median family size in Wimberley is 2.72 persons per family, with married-couple families (560 | 73.1%) accounting for the largest median family size of 2.96 persons per family. On the other hand, single female/mother families (138 | 18.0%) represent the smallest median family size with 1.84 persons per family.
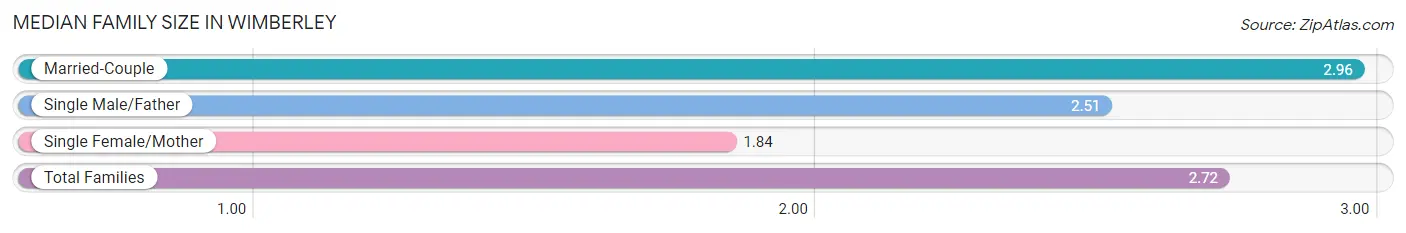
| Family Type | # Families | Family Size |
| Married-Couple | 560 (73.1%) | 2.96 |
| Single Male/Father | 68 (8.9%) | 2.51 |
| Single Female/Mother | 138 (18.0%) | 1.84 |
| Total Families | 766 (100.0%) | 2.72 |
Median Household Size in Wimberley
The median household size in Wimberley is 2.16 persons per household, with married-couple households (560 | 43.9%) accounting for the largest median household size of 2.96 persons per household. non-family households (509 | 39.9%) represent the smallest median household size with 1.33 persons per household.
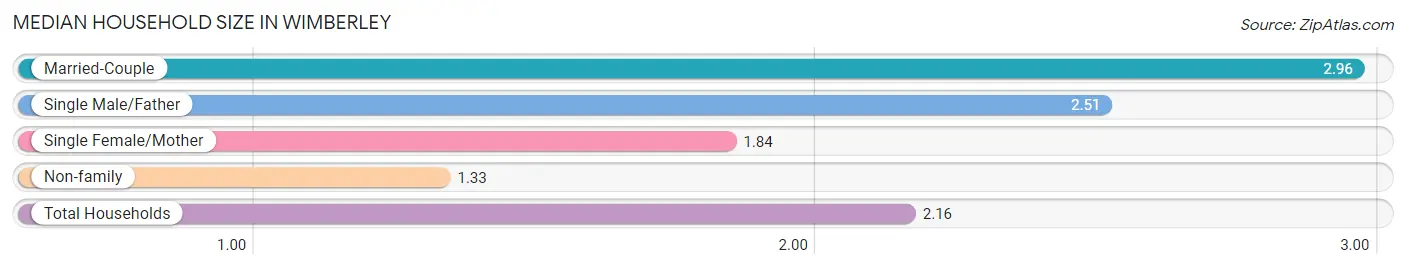
| Household Type | # Households | Household Size |
| Married-Couple | 560 (43.9%) | 2.96 |
| Single Male/Father | 68 (5.3%) | 2.51 |
| Single Female/Mother | 138 (10.8%) | 1.84 |
| Non-family | 509 (39.9%) | 1.33 |
| Total Households | 1,275 (100.0%) | 2.16 |
Household Size by Marriage Status in Wimberley
Out of a total of 1,275 households in Wimberley, 766 (60.1%) are family households, while 509 (39.9%) are nonfamily households. The most numerous type of family households are 2-person households, comprising 475, and the most common type of nonfamily households are 1-person households, comprising 432.
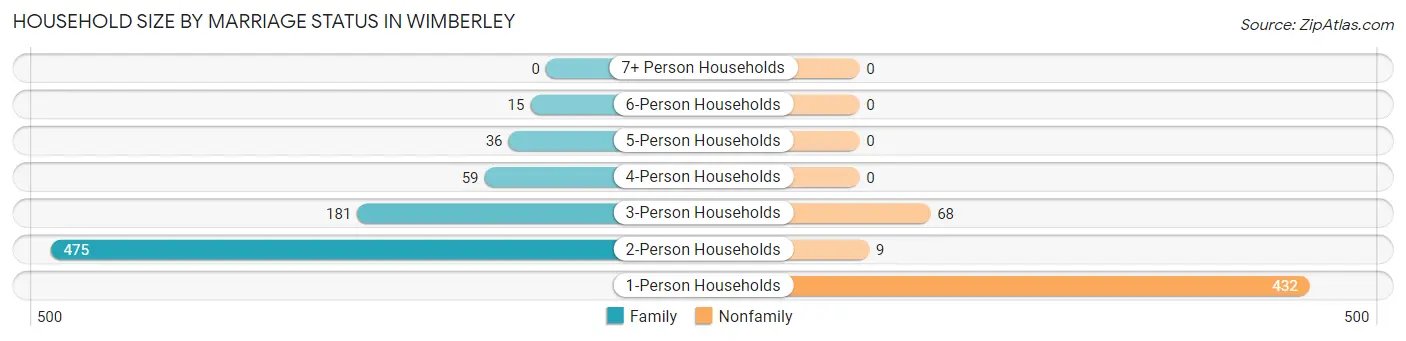
| Household Size | Family Households | Nonfamily Households |
| 1-Person Households | - | 432 (33.9%) |
| 2-Person Households | 475 (37.2%) | 9 (0.7%) |
| 3-Person Households | 181 (14.2%) | 68 (5.3%) |
| 4-Person Households | 59 (4.6%) | 0 (0.0%) |
| 5-Person Households | 36 (2.8%) | 0 (0.0%) |
| 6-Person Households | 15 (1.2%) | 0 (0.0%) |
| 7+ Person Households | 0 (0.0%) | 0 (0.0%) |
| Total | 766 (60.1%) | 509 (39.9%) |
Female Fertility in Wimberley
Fertility by Age in Wimberley
| Age Bracket | Women with Births | Births / 1,000 Women |
| 15 to 19 years | 0 (0.0%) | 0.0 |
| 20 to 34 years | 0 (0.0%) | 0.0 |
| 35 to 50 years | 0 (0.0%) | 0.0 |
| Total | 0 (0.0%) | 0.0 |
Fertility by Age by Marriage Status in Wimberley
| Age Bracket | Married | Unmarried |
| 15 to 19 years | 0 (0.0%) | 0 (0.0%) |
| 20 to 34 years | 0 (0.0%) | 0 (0.0%) |
| 35 to 50 years | 0 (0.0%) | 0 (0.0%) |
| Total | 0 (0.0%) | 0 (0.0%) |
Fertility by Education in Wimberley
| Educational Attainment | Women with Births | Births / 1,000 Women |
| Less than High School | 0 (0.0%) | 0.0 |
| High School Diploma | 0 (0.0%) | 0.0 |
| College or Associate's Degree | 0 (0.0%) | 0.0 |
| Bachelor's Degree | 0 (0.0%) | 0.0 |
| Graduate Degree | 0 (0.0%) | 0.0 |
| Total | 0 (0.0%) | 0.0 |
Fertility by Education by Marriage Status in Wimberley
| Educational Attainment | Married | Unmarried |
| Less than High School | 0 (0.0%) | 0 (0.0%) |
| High School Diploma | 0 (0.0%) | 0 (0.0%) |
| College or Associate's Degree | 0 (0.0%) | 0 (0.0%) |
| Bachelor's Degree | 0 (0.0%) | 0 (0.0%) |
| Graduate Degree | 0 (0.0%) | 0 (0.0%) |
| Total | 0 (0.0%) | 0 (0.0%) |
Employment Characteristics in Wimberley
Employment by Class of Employer in Wimberley
Among the 1,454 employed individuals in Wimberley, private company employees (974 | 67.0%), self-employed (not incorporated) (250 | 17.2%), and not-for-profit organizations (91 | 6.3%) make up the most common classes of employment.
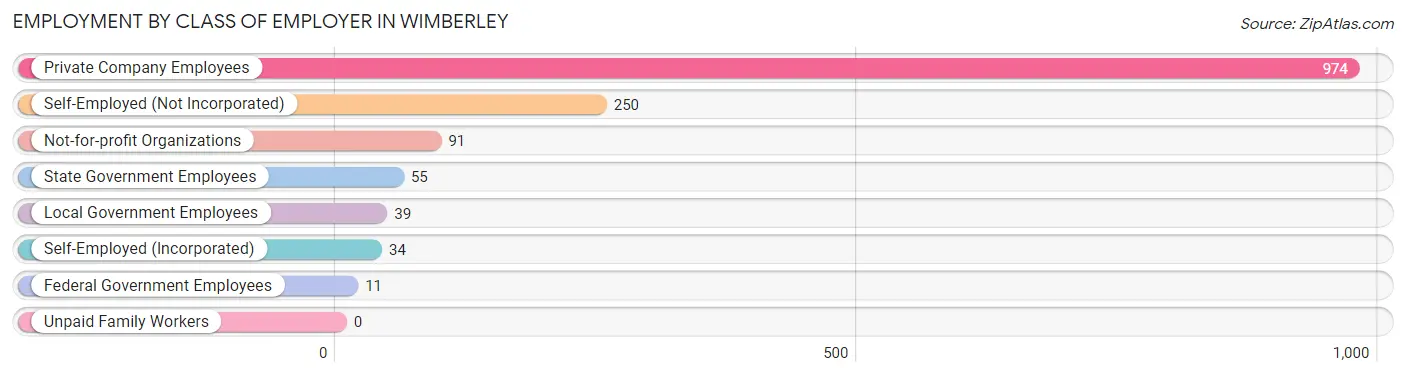
| Employer Class | # Employees | % Employees |
| Private Company Employees | 974 | 67.0% |
| Self-Employed (Incorporated) | 34 | 2.3% |
| Self-Employed (Not Incorporated) | 250 | 17.2% |
| Not-for-profit Organizations | 91 | 6.3% |
| Local Government Employees | 39 | 2.7% |
| State Government Employees | 55 | 3.8% |
| Federal Government Employees | 11 | 0.8% |
| Unpaid Family Workers | 0 | 0.0% |
| Total | 1,454 | 100.0% |
Employment Status by Age in Wimberley
According to the labor force statistics for Wimberley, out of the total population over 16 years of age (2,604), 63.7% or 1,659 individuals are in the labor force, with 11.6% or 192 of them unemployed. The age group with the highest labor force participation rate is 25 to 29 years, with 100.0% or 196 individuals in the labor force. Within the labor force, the 20 to 24 years age range has the highest percentage of unemployed individuals, with 100.0% or 135 of them being unemployed.
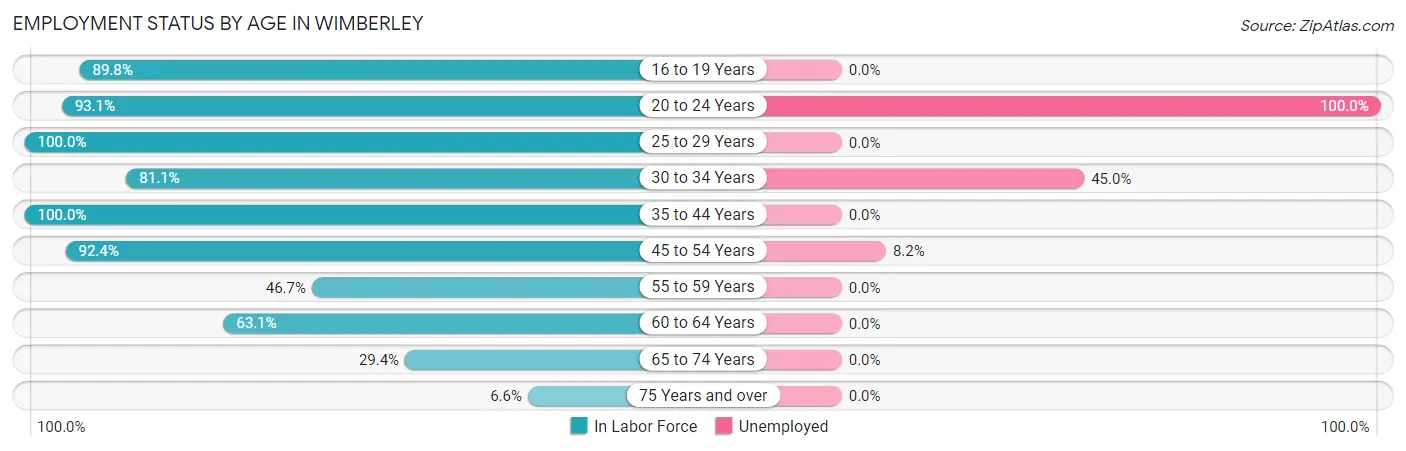
| Age Bracket | In Labor Force | Unemployed |
| 16 to 19 Years | 212 (89.8%) | 0 (0.0%) |
| 20 to 24 Years | 135 (93.1%) | 135 (100.0%) |
| 25 to 29 Years | 196 (100.0%) | 0 (0.0%) |
| 30 to 34 Years | 60 (81.1%) | 27 (45.0%) |
| 35 to 44 Years | 218 (100.0%) | 0 (0.0%) |
| 45 to 54 Years | 365 (92.4%) | 30 (8.2%) |
| 55 to 59 Years | 165 (46.7%) | 0 (0.0%) |
| 60 to 64 Years | 198 (63.1%) | 0 (0.0%) |
| 65 to 74 Years | 83 (29.4%) | 0 (0.0%) |
| 75 Years and over | 26 (6.6%) | 0 (0.0%) |
| Total | 1,659 (63.7%) | 192 (11.6%) |
Employment Status by Educational Attainment in Wimberley
According to labor force statistics for Wimberley, 77.5% of individuals (1,201) out of the total population between 25 and 64 years of age (1,550) are in the labor force, with 4.7% or 56 of them being unemployed. The group with the highest labor force participation rate are those with the educational attainment of less than high school, with 100.0% or 65 individuals in the labor force. Within the labor force, individuals with college / associate degree education have the highest percentage of unemployment, with 13.6% or 30 of them being unemployed.
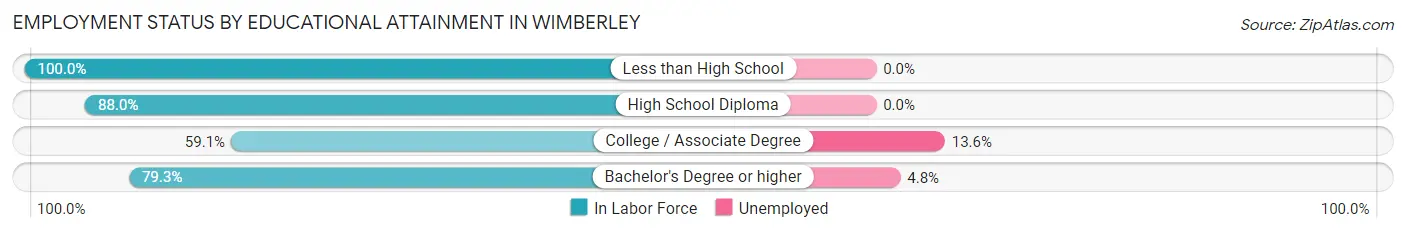
| Educational Attainment | In Labor Force | Unemployed |
| Less than High School | 65 (100.0%) | 0 (0.0%) |
| High School Diploma | 351 (88.0%) | 0 (0.0%) |
| College / Associate Degree | 220 (59.1%) | 51 (13.6%) |
| Bachelor's Degree or higher | 566 (79.3%) | 34 (4.8%) |
| Total | 1,201 (77.5%) | 73 (4.7%) |
Employment Occupations by Sex in Wimberley
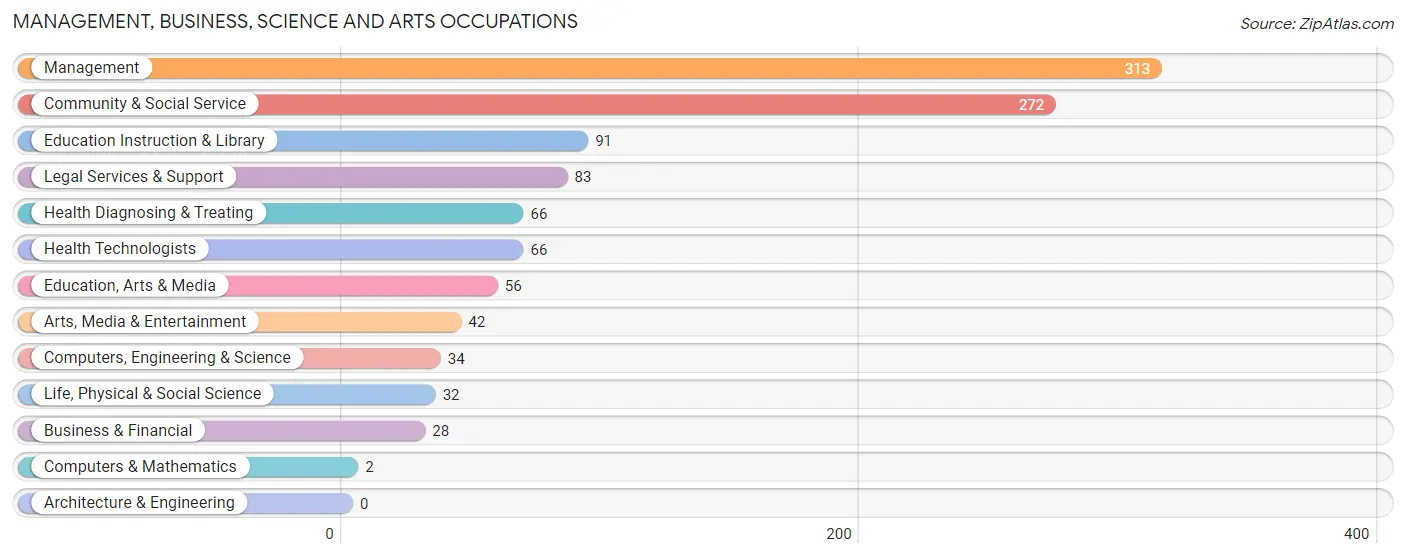
Management, Business, Science and Arts Occupations
The most common Management, Business, Science and Arts occupations in Wimberley are Management (313 | 21.3%), Community & Social Service (272 | 18.5%), Education Instruction & Library (91 | 6.2%), Legal Services & Support (83 | 5.7%), and Health Diagnosing & Treating (66 | 4.5%).
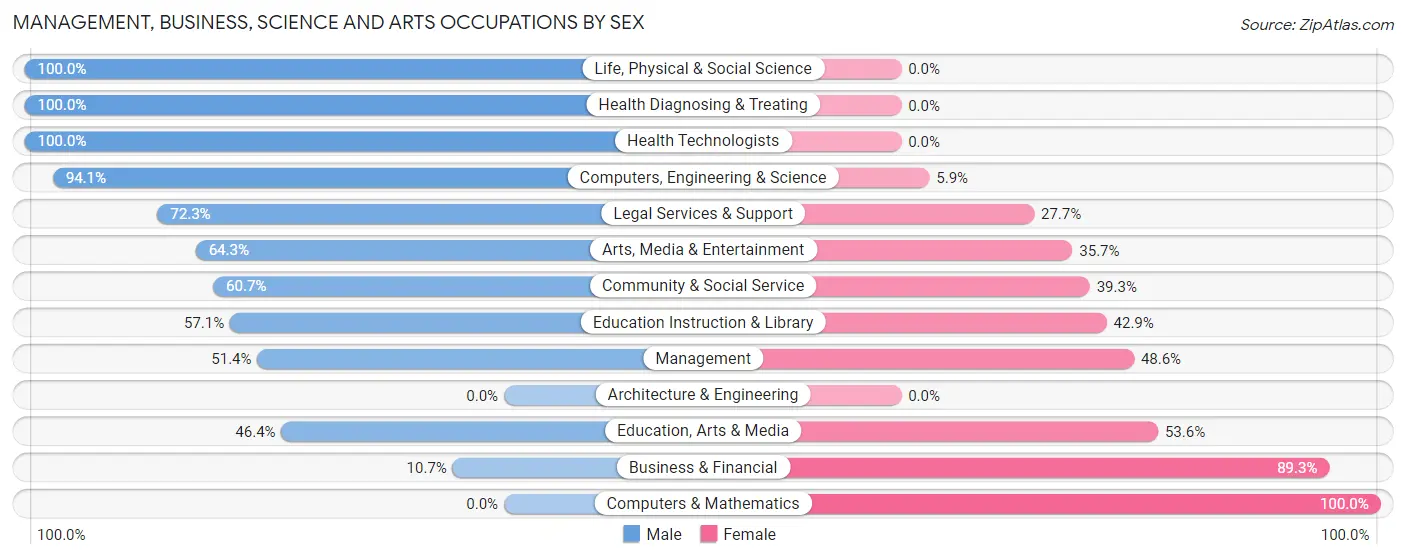
Management, Business, Science and Arts Occupations by Sex
Within the Management, Business, Science and Arts occupations in Wimberley, the most male-oriented occupations are Life, Physical & Social Science (100.0%), Health Diagnosing & Treating (100.0%), and Health Technologists (100.0%), while the most female-oriented occupations are Computers & Mathematics (100.0%), Business & Financial (89.3%), and Education, Arts & Media (53.6%).
| Occupation | Male | Female |
| Management | 161 (51.4%) | 152 (48.6%) |
| Business & Financial | 3 (10.7%) | 25 (89.3%) |
| Computers, Engineering & Science | 32 (94.1%) | 2 (5.9%) |
| Computers & Mathematics | 0 (0.0%) | 2 (100.0%) |
| Architecture & Engineering | 0 (0.0%) | 0 (0.0%) |
| Life, Physical & Social Science | 32 (100.0%) | 0 (0.0%) |
| Community & Social Service | 165 (60.7%) | 107 (39.3%) |
| Education, Arts & Media | 26 (46.4%) | 30 (53.6%) |
| Legal Services & Support | 60 (72.3%) | 23 (27.7%) |
| Education Instruction & Library | 52 (57.1%) | 39 (42.9%) |
| Arts, Media & Entertainment | 27 (64.3%) | 15 (35.7%) |
| Health Diagnosing & Treating | 66 (100.0%) | 0 (0.0%) |
| Health Technologists | 66 (100.0%) | 0 (0.0%) |
| Total (Category) | 427 (59.9%) | 286 (40.1%) |
| Total (Overall) | 995 (67.9%) | 471 (32.1%) |
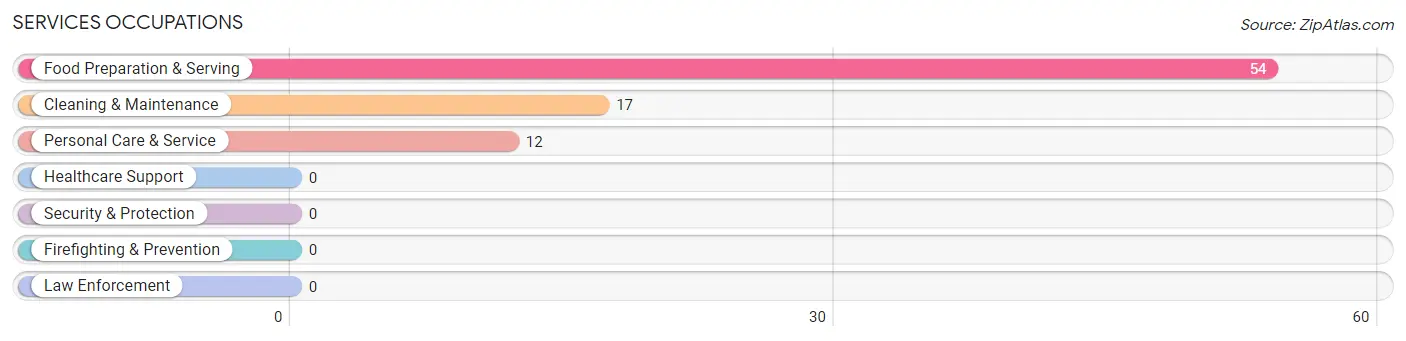
Services Occupations
The most common Services occupations in Wimberley are Food Preparation & Serving (54 | 3.7%), Cleaning & Maintenance (17 | 1.2%), and Personal Care & Service (12 | 0.8%).
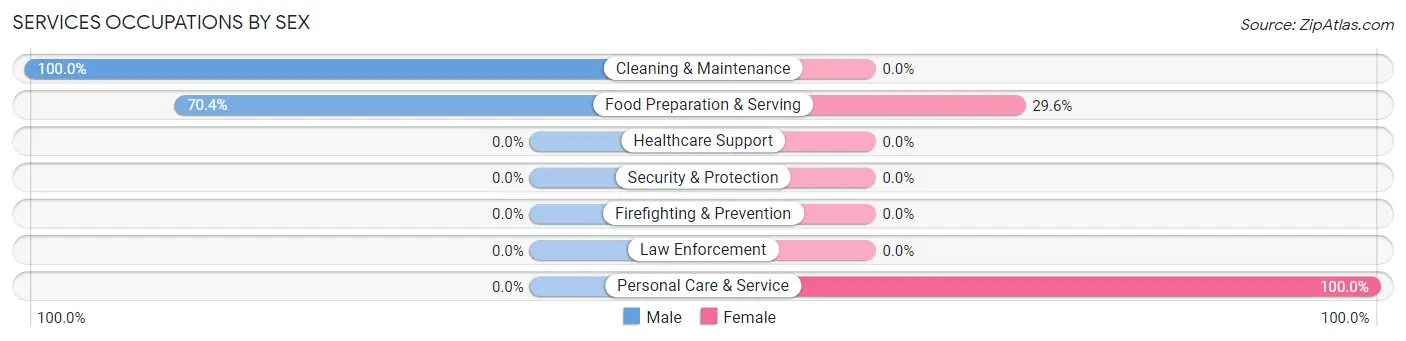
Services Occupations by Sex
Within the Services occupations in Wimberley, the most male-oriented occupations are Cleaning & Maintenance (100.0%), and Food Preparation & Serving (70.4%), while the most female-oriented occupations are Personal Care & Service (100.0%), and Food Preparation & Serving (29.6%).
| Occupation | Male | Female |
| Healthcare Support | 0 (0.0%) | 0 (0.0%) |
| Security & Protection | 0 (0.0%) | 0 (0.0%) |
| Firefighting & Prevention | 0 (0.0%) | 0 (0.0%) |
| Law Enforcement | 0 (0.0%) | 0 (0.0%) |
| Food Preparation & Serving | 38 (70.4%) | 16 (29.6%) |
| Cleaning & Maintenance | 17 (100.0%) | 0 (0.0%) |
| Personal Care & Service | 0 (0.0%) | 12 (100.0%) |
| Total (Category) | 55 (66.3%) | 28 (33.7%) |
| Total (Overall) | 995 (67.9%) | 471 (32.1%) |
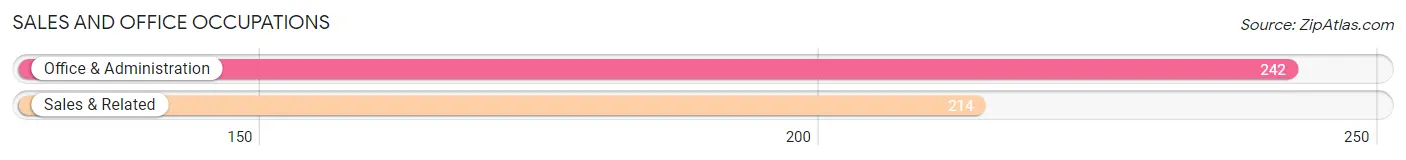
Sales and Office Occupations
The most common Sales and Office occupations in Wimberley are Office & Administration (242 | 16.5%), and Sales & Related (214 | 14.6%).
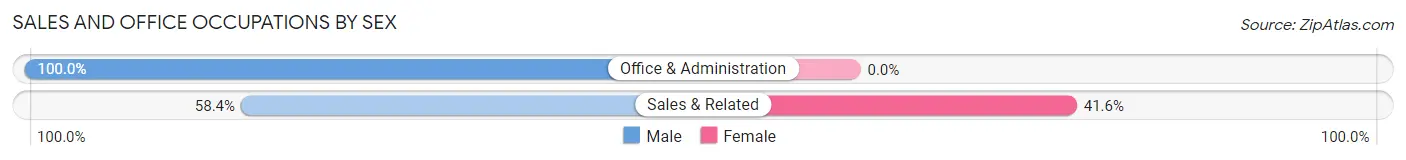
Sales and Office Occupations by Sex
| Occupation | Male | Female |
| Sales & Related | 125 (58.4%) | 89 (41.6%) |
| Office & Administration | 242 (100.0%) | 0 (0.0%) |
| Total (Category) | 367 (80.5%) | 89 (19.5%) |
| Total (Overall) | 995 (67.9%) | 471 (32.1%) |
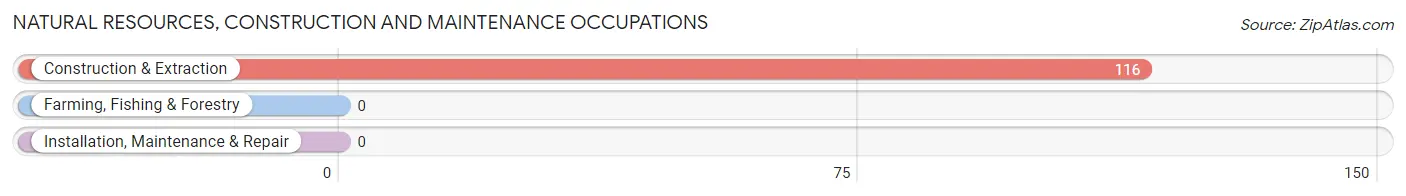
Natural Resources, Construction and Maintenance Occupations
The most common Natural Resources, Construction and Maintenance occupations in Wimberley are , and Construction & Extraction (116 | 7.9%).
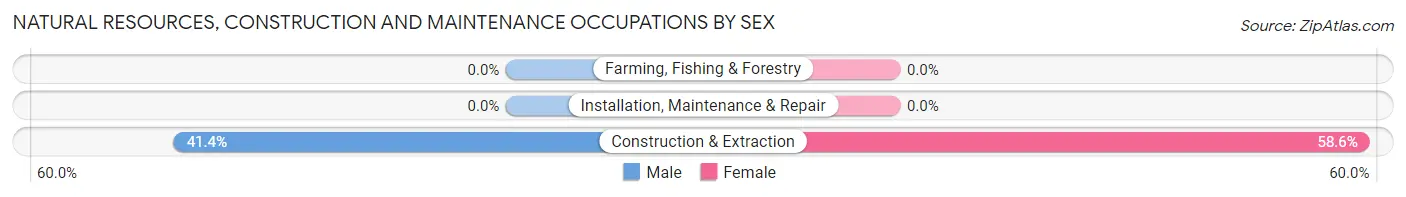
Natural Resources, Construction and Maintenance Occupations by Sex
| Occupation | Male | Female |
| Farming, Fishing & Forestry | 0 (0.0%) | 0 (0.0%) |
| Construction & Extraction | 48 (41.4%) | 68 (58.6%) |
| Installation, Maintenance & Repair | 0 (0.0%) | 0 (0.0%) |
| Total (Category) | 48 (41.4%) | 68 (58.6%) |
| Total (Overall) | 995 (67.9%) | 471 (32.1%) |
Production, Transportation and Moving Occupations
The most common Production, Transportation and Moving occupations in Wimberley are Material Moving (70 | 4.8%), and Production (28 | 1.9%).
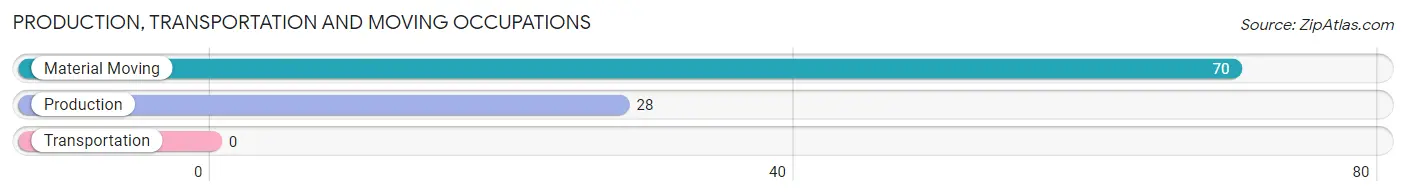
Production, Transportation and Moving Occupations by Sex
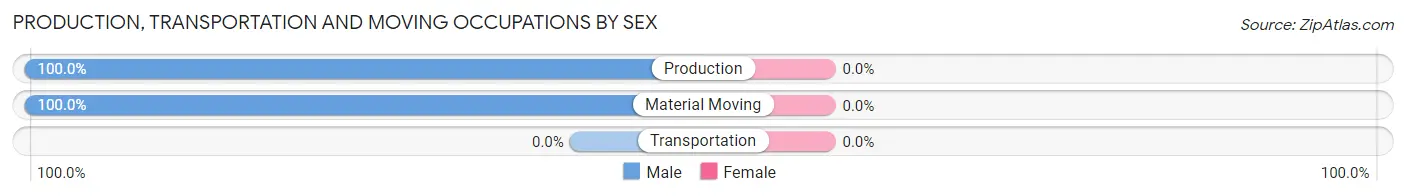
| Occupation | Male | Female |
| Production | 28 (100.0%) | 0 (0.0%) |
| Transportation | 0 (0.0%) | 0 (0.0%) |
| Material Moving | 70 (100.0%) | 0 (0.0%) |
| Total (Category) | 98 (100.0%) | 0 (0.0%) |
| Total (Overall) | 995 (67.9%) | 471 (32.1%) |
Employment Industries by Sex in Wimberley
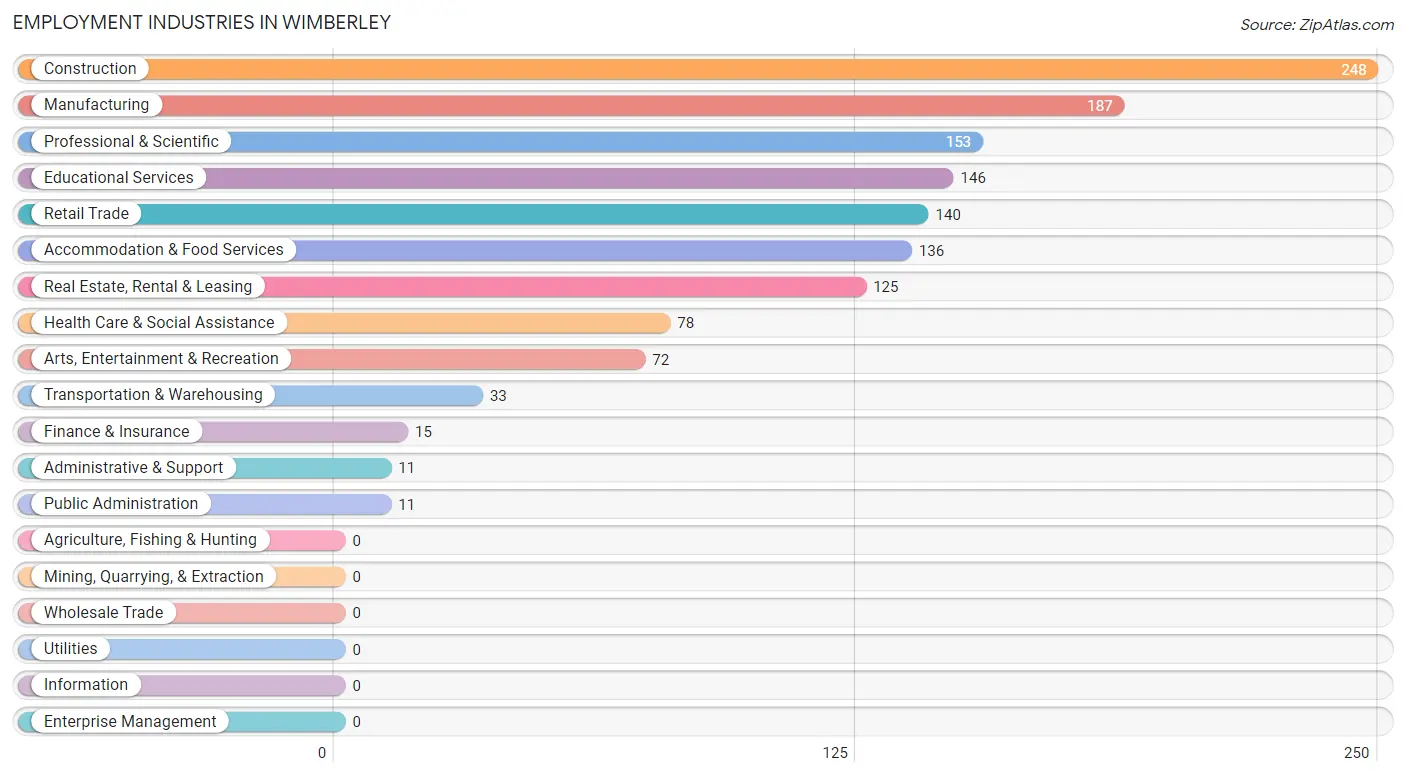
Employment Industries in Wimberley
The major employment industries in Wimberley include Construction (248 | 16.9%), Manufacturing (187 | 12.8%), Professional & Scientific (153 | 10.4%), Educational Services (146 | 10.0%), and Retail Trade (140 | 9.6%).
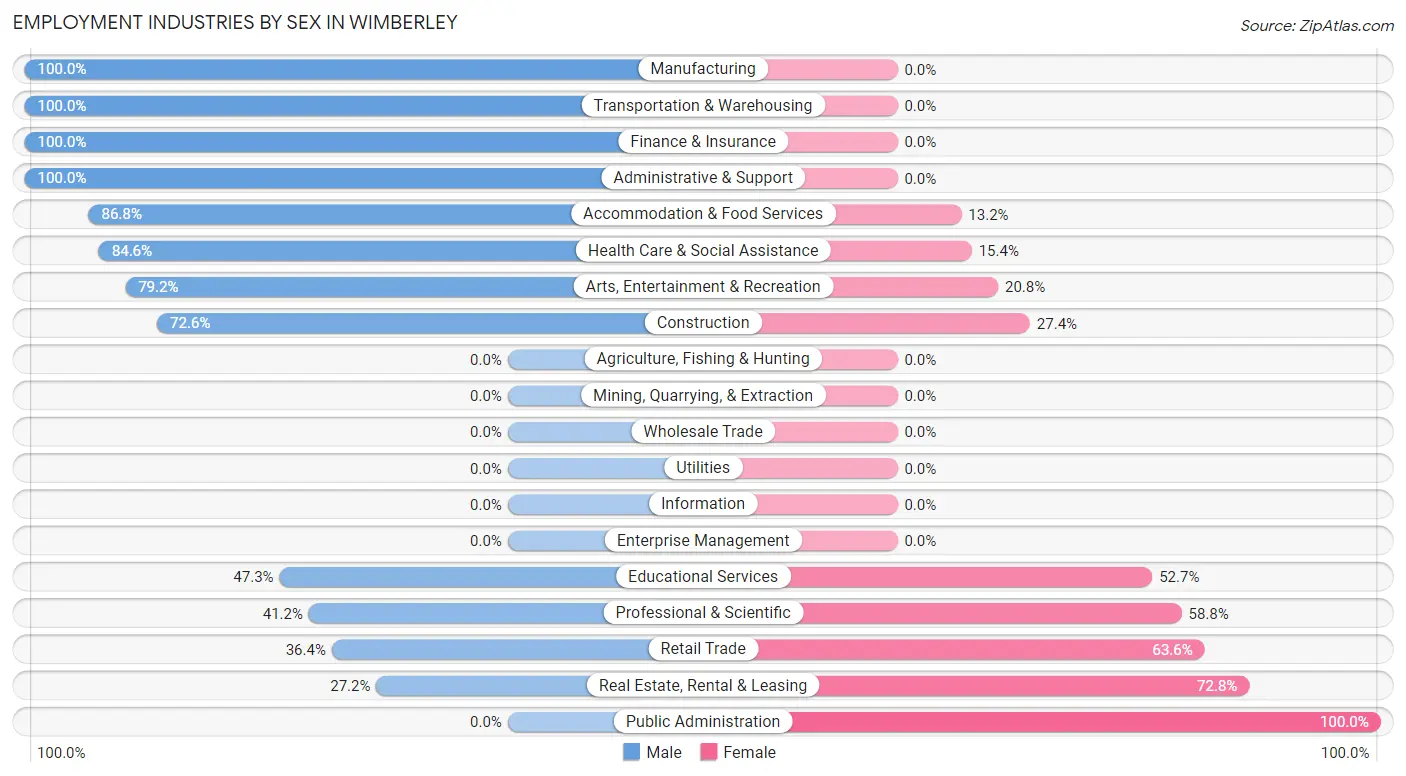
Employment Industries by Sex in Wimberley
The Wimberley industries that see more men than women are Manufacturing (100.0%), Transportation & Warehousing (100.0%), and Finance & Insurance (100.0%), whereas the industries that tend to have a higher number of women are Public Administration (100.0%), Real Estate, Rental & Leasing (72.8%), and Retail Trade (63.6%).
| Industry | Male | Female |
| Agriculture, Fishing & Hunting | 0 (0.0%) | 0 (0.0%) |
| Mining, Quarrying, & Extraction | 0 (0.0%) | 0 (0.0%) |
| Construction | 180 (72.6%) | 68 (27.4%) |
| Manufacturing | 187 (100.0%) | 0 (0.0%) |
| Wholesale Trade | 0 (0.0%) | 0 (0.0%) |
| Retail Trade | 51 (36.4%) | 89 (63.6%) |
| Transportation & Warehousing | 33 (100.0%) | 0 (0.0%) |
| Utilities | 0 (0.0%) | 0 (0.0%) |
| Information | 0 (0.0%) | 0 (0.0%) |
| Finance & Insurance | 15 (100.0%) | 0 (0.0%) |
| Real Estate, Rental & Leasing | 34 (27.2%) | 91 (72.8%) |
| Professional & Scientific | 63 (41.2%) | 90 (58.8%) |
| Enterprise Management | 0 (0.0%) | 0 (0.0%) |
| Administrative & Support | 11 (100.0%) | 0 (0.0%) |
| Educational Services | 69 (47.3%) | 77 (52.7%) |
| Health Care & Social Assistance | 66 (84.6%) | 12 (15.4%) |
| Arts, Entertainment & Recreation | 57 (79.2%) | 15 (20.8%) |
| Accommodation & Food Services | 118 (86.8%) | 18 (13.2%) |
| Public Administration | 0 (0.0%) | 11 (100.0%) |
| Total | 995 (67.9%) | 471 (32.1%) |
Education in Wimberley
School Enrollment in Wimberley
The most common levels of schooling among the 405 students in Wimberley are elementary school (113 | 27.9%), college / undergraduate (113 | 27.9%), and middle school (110 | 27.2%).
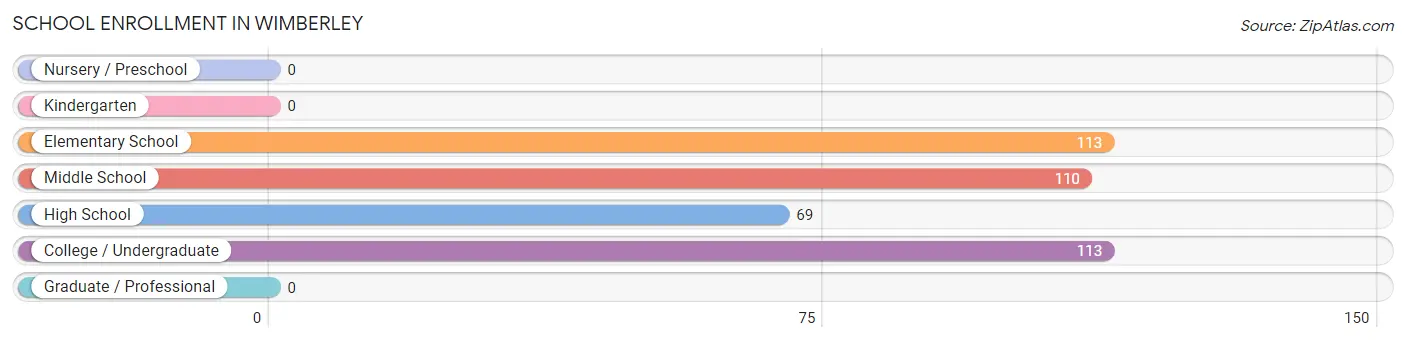
| School Level | # Students | % Students |
| Nursery / Preschool | 0 | 0.0% |
| Kindergarten | 0 | 0.0% |
| Elementary School | 113 | 27.9% |
| Middle School | 110 | 27.2% |
| High School | 69 | 17.0% |
| College / Undergraduate | 113 | 27.9% |
| Graduate / Professional | 0 | 0.0% |
| Total | 405 | 100.0% |
School Enrollment by Age by Funding Source in Wimberley
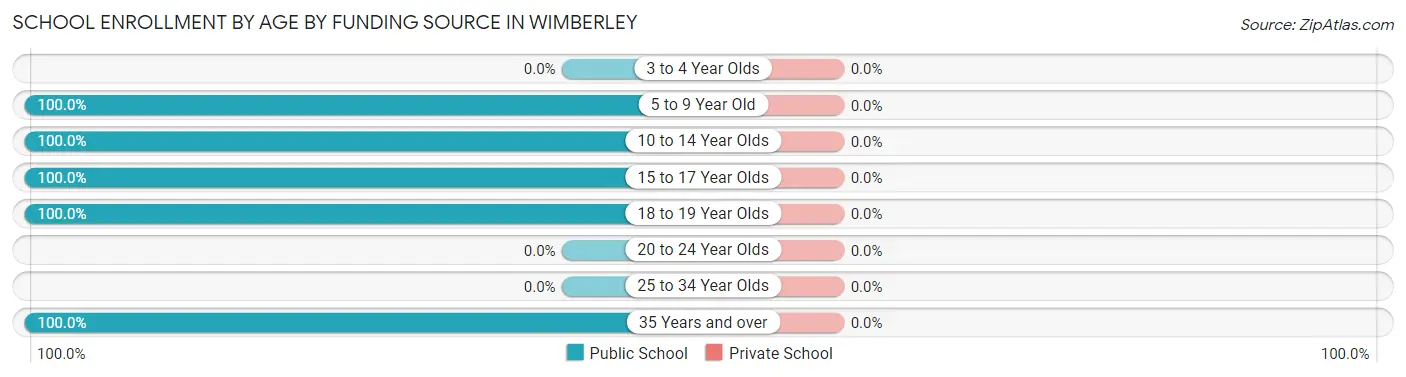
| Age Bracket | Public School | Private School |
| 3 to 4 Year Olds | 0 (0.0%) | 0 (0.0%) |
| 5 to 9 Year Old | 113 (100.0%) | 0 (0.0%) |
| 10 to 14 Year Olds | 110 (100.0%) | 0 (0.0%) |
| 15 to 17 Year Olds | 41 (100.0%) | 0 (0.0%) |
| 18 to 19 Year Olds | 129 (100.0%) | 0 (0.0%) |
| 20 to 24 Year Olds | 0 (0.0%) | 0 (0.0%) |
| 25 to 34 Year Olds | 0 (0.0%) | 0 (0.0%) |
| 35 Years and over | 12 (100.0%) | 0 (0.0%) |
| Total | 405 (100.0%) | 0 (0.0%) |
Educational Attainment by Field of Study in Wimberley
Education (260 | 22.6%), business (161 | 14.0%), literature & languages (156 | 13.5%), science & technology (119 | 10.3%), and bio, nature & agricultural (97 | 8.4%) are the most common fields of study among 1,153 individuals in Wimberley who have obtained a bachelor's degree or higher.
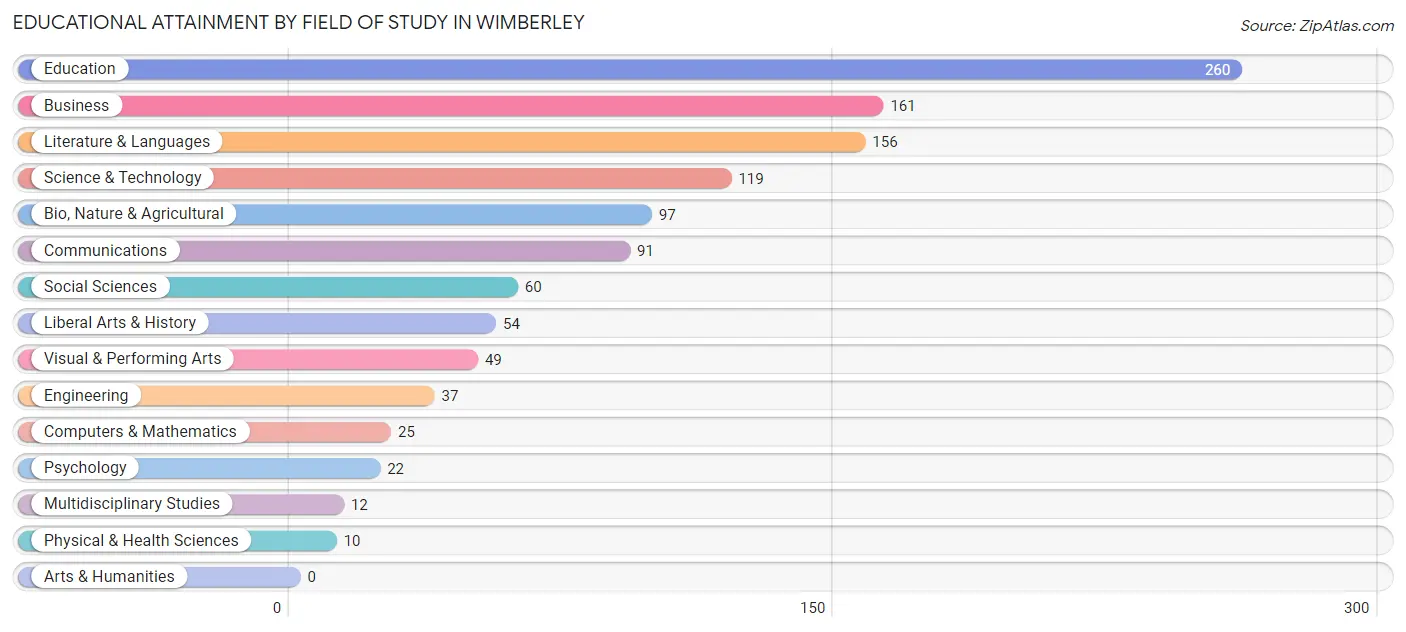
| Field of Study | # Graduates | % Graduates |
| Computers & Mathematics | 25 | 2.2% |
| Bio, Nature & Agricultural | 97 | 8.4% |
| Physical & Health Sciences | 10 | 0.9% |
| Psychology | 22 | 1.9% |
| Social Sciences | 60 | 5.2% |
| Engineering | 37 | 3.2% |
| Multidisciplinary Studies | 12 | 1.0% |
| Science & Technology | 119 | 10.3% |
| Business | 161 | 14.0% |
| Education | 260 | 22.6% |
| Literature & Languages | 156 | 13.5% |
| Liberal Arts & History | 54 | 4.7% |
| Visual & Performing Arts | 49 | 4.3% |
| Communications | 91 | 7.9% |
| Arts & Humanities | 0 | 0.0% |
| Total | 1,153 | 100.0% |
Transportation & Commute in Wimberley
Vehicle Availability by Sex in Wimberley
The most prevalent vehicle ownership categories in Wimberley are males with 2 vehicles (442, accounting for 44.4%) and females with 2 vehicles (94, making up 96.3%).
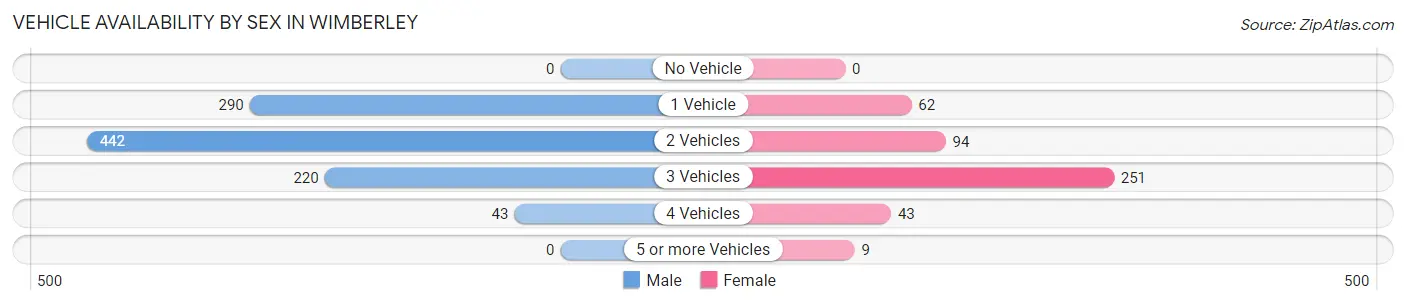
| Vehicles Available | Male | Female |
| No Vehicle | 0 (0.0%) | 0 (0.0%) |
| 1 Vehicle | 290 (29.1%) | 62 (13.5%) |
| 2 Vehicles | 442 (44.4%) | 94 (20.5%) |
| 3 Vehicles | 220 (22.1%) | 251 (54.7%) |
| 4 Vehicles | 43 (4.3%) | 43 (9.4%) |
| 5 or more Vehicles | 0 (0.0%) | 9 (2.0%) |
| Total | 995 (100.0%) | 459 (100.0%) |
Commute Time in Wimberley
The most frequently occuring commute durations in Wimberley are 10 to 14 minutes (330 commuters, 28.1%), 35 to 39 minutes (235 commuters, 20.0%), and 15 to 19 minutes (181 commuters, 15.4%).
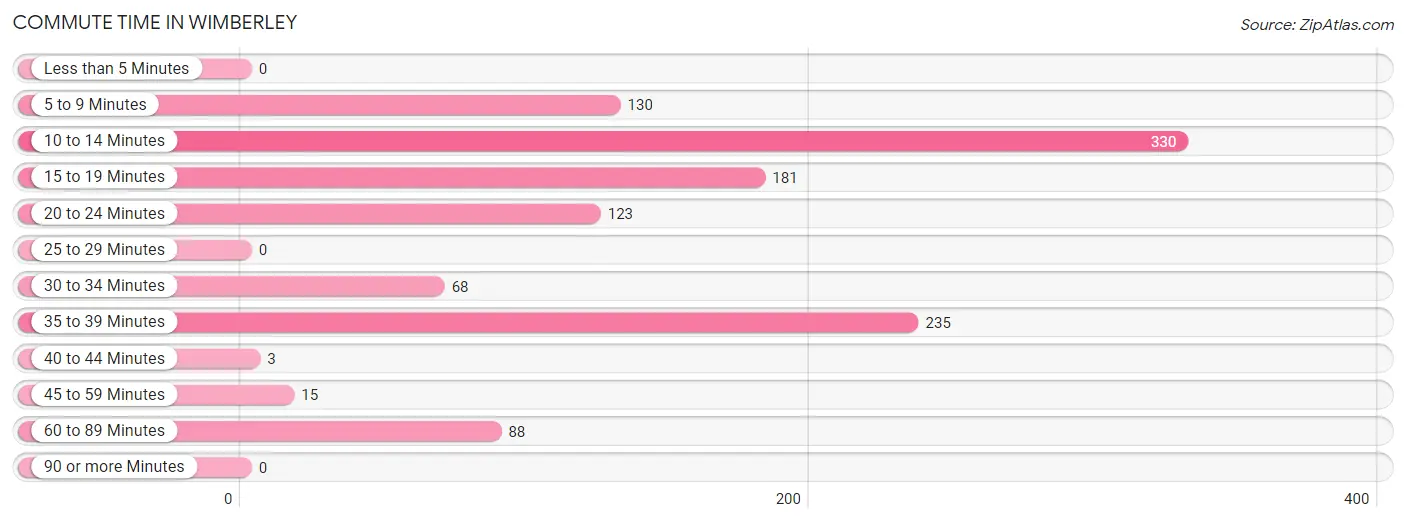
| Commute Time | # Commuters | % Commuters |
| Less than 5 Minutes | 0 | 0.0% |
| 5 to 9 Minutes | 130 | 11.1% |
| 10 to 14 Minutes | 330 | 28.1% |
| 15 to 19 Minutes | 181 | 15.4% |
| 20 to 24 Minutes | 123 | 10.5% |
| 25 to 29 Minutes | 0 | 0.0% |
| 30 to 34 Minutes | 68 | 5.8% |
| 35 to 39 Minutes | 235 | 20.0% |
| 40 to 44 Minutes | 3 | 0.3% |
| 45 to 59 Minutes | 15 | 1.3% |
| 60 to 89 Minutes | 88 | 7.5% |
| 90 or more Minutes | 0 | 0.0% |
Commute Time by Sex in Wimberley
The most common commute times in Wimberley are 10 to 14 minutes (282 commuters, 31.7%) for males and 30 to 34 minutes (68 commuters, 24.0%) for females.
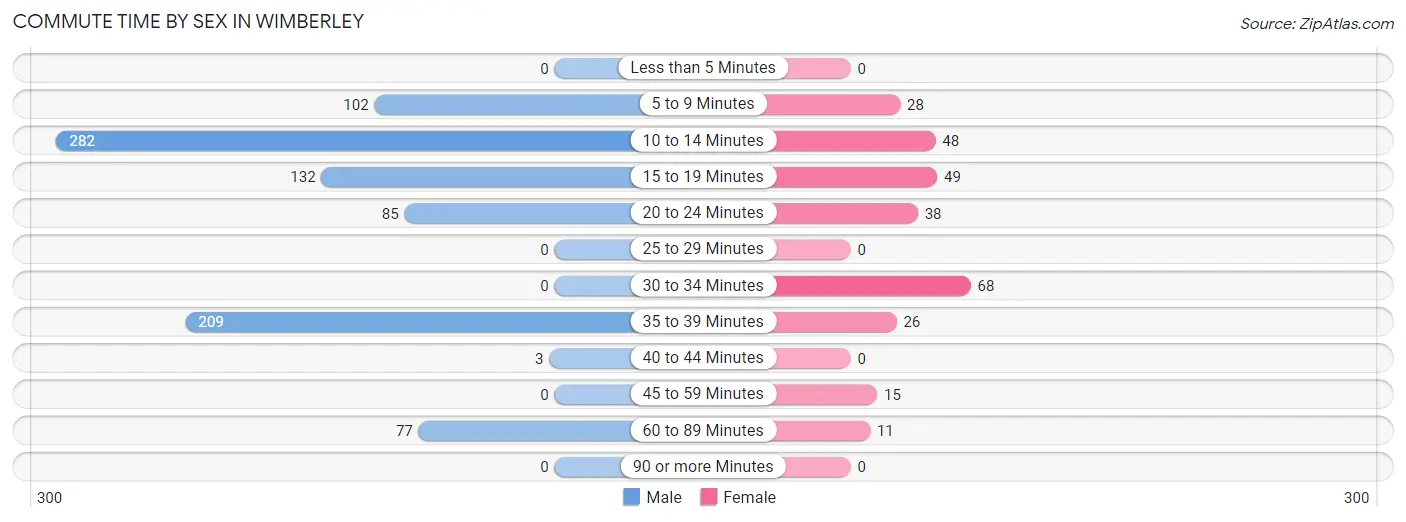
| Commute Time | Male | Female |
| Less than 5 Minutes | 0 (0.0%) | 0 (0.0%) |
| 5 to 9 Minutes | 102 (11.5%) | 28 (9.9%) |
| 10 to 14 Minutes | 282 (31.7%) | 48 (17.0%) |
| 15 to 19 Minutes | 132 (14.8%) | 49 (17.3%) |
| 20 to 24 Minutes | 85 (9.6%) | 38 (13.4%) |
| 25 to 29 Minutes | 0 (0.0%) | 0 (0.0%) |
| 30 to 34 Minutes | 0 (0.0%) | 68 (24.0%) |
| 35 to 39 Minutes | 209 (23.5%) | 26 (9.2%) |
| 40 to 44 Minutes | 3 (0.3%) | 0 (0.0%) |
| 45 to 59 Minutes | 0 (0.0%) | 15 (5.3%) |
| 60 to 89 Minutes | 77 (8.6%) | 11 (3.9%) |
| 90 or more Minutes | 0 (0.0%) | 0 (0.0%) |
Time of Departure to Work by Sex in Wimberley
The most frequent times of departure to work in Wimberley are 7:00 AM to 7:29 AM (172, 19.3%) for males and 7:00 AM to 7:29 AM (80, 28.3%) for females.
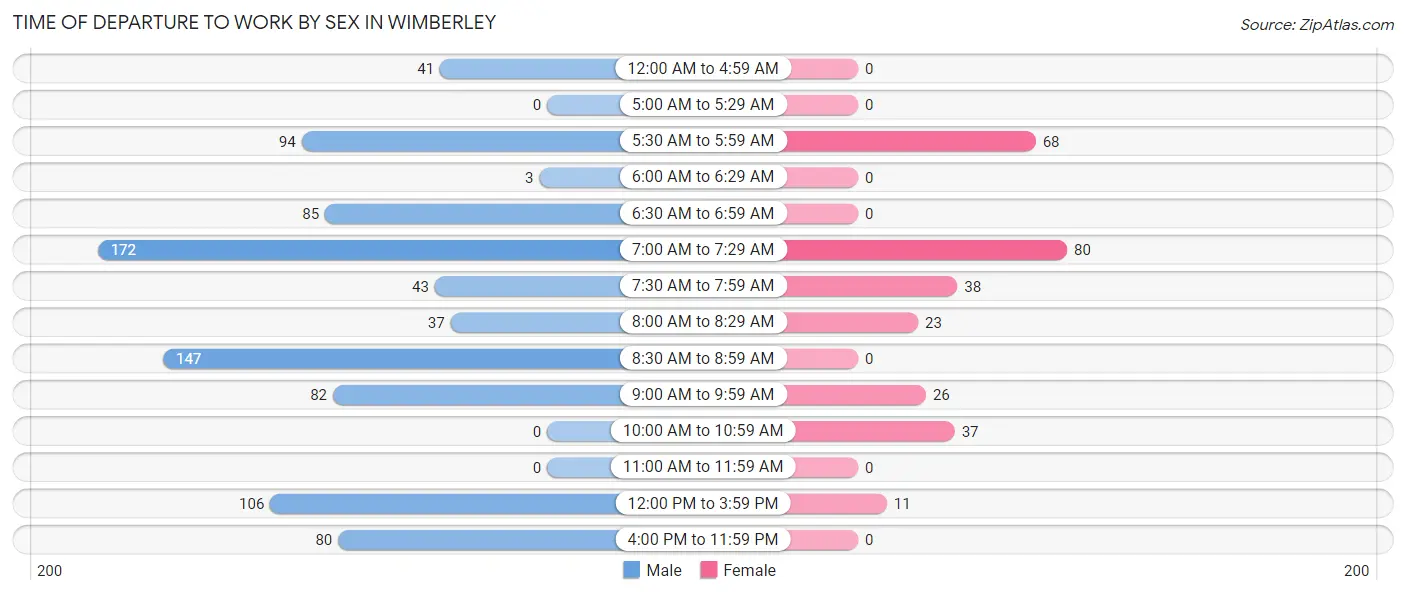
| Time of Departure | Male | Female |
| 12:00 AM to 4:59 AM | 41 (4.6%) | 0 (0.0%) |
| 5:00 AM to 5:29 AM | 0 (0.0%) | 0 (0.0%) |
| 5:30 AM to 5:59 AM | 94 (10.6%) | 68 (24.0%) |
| 6:00 AM to 6:29 AM | 3 (0.3%) | 0 (0.0%) |
| 6:30 AM to 6:59 AM | 85 (9.6%) | 0 (0.0%) |
| 7:00 AM to 7:29 AM | 172 (19.3%) | 80 (28.3%) |
| 7:30 AM to 7:59 AM | 43 (4.8%) | 38 (13.4%) |
| 8:00 AM to 8:29 AM | 37 (4.2%) | 23 (8.1%) |
| 8:30 AM to 8:59 AM | 147 (16.5%) | 0 (0.0%) |
| 9:00 AM to 9:59 AM | 82 (9.2%) | 26 (9.2%) |
| 10:00 AM to 10:59 AM | 0 (0.0%) | 37 (13.1%) |
| 11:00 AM to 11:59 AM | 0 (0.0%) | 0 (0.0%) |
| 12:00 PM to 3:59 PM | 106 (11.9%) | 11 (3.9%) |
| 4:00 PM to 11:59 PM | 80 (9.0%) | 0 (0.0%) |
| Total | 890 (100.0%) | 283 (100.0%) |
Housing Occupancy in Wimberley
Occupancy by Ownership in Wimberley
Of the total 1,275 dwellings in Wimberley, owner-occupied units account for 911 (71.5%), while renter-occupied units make up 364 (28.5%).
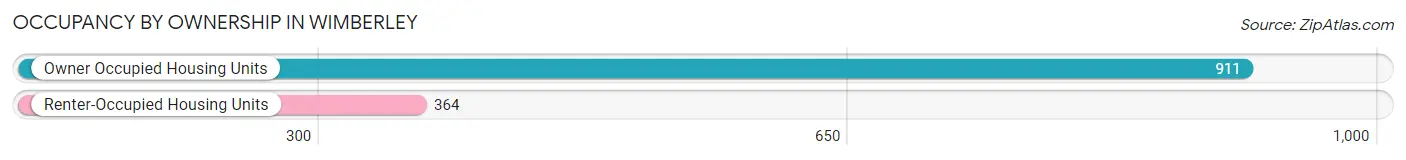
| Occupancy | # Housing Units | % Housing Units |
| Owner Occupied Housing Units | 911 | 71.5% |
| Renter-Occupied Housing Units | 364 | 28.5% |
| Total Occupied Housing Units | 1,275 | 100.0% |
Occupancy by Household Size in Wimberley
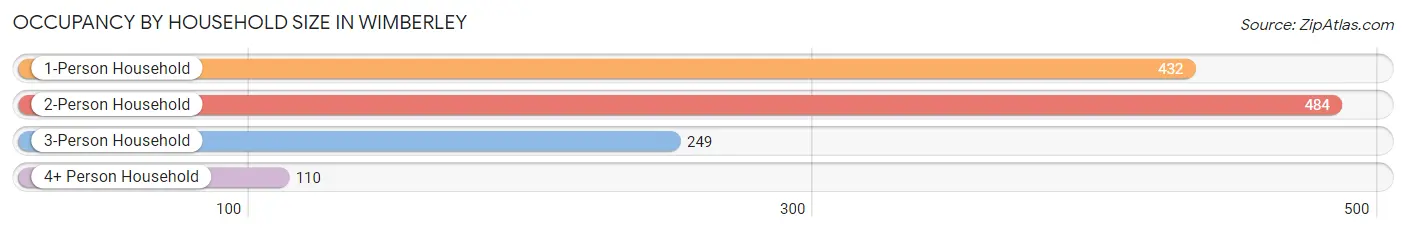
| Household Size | # Housing Units | % Housing Units |
| 1-Person Household | 432 | 33.9% |
| 2-Person Household | 484 | 38.0% |
| 3-Person Household | 249 | 19.5% |
| 4+ Person Household | 110 | 8.6% |
| Total Housing Units | 1,275 | 100.0% |
Occupancy by Ownership by Household Size in Wimberley
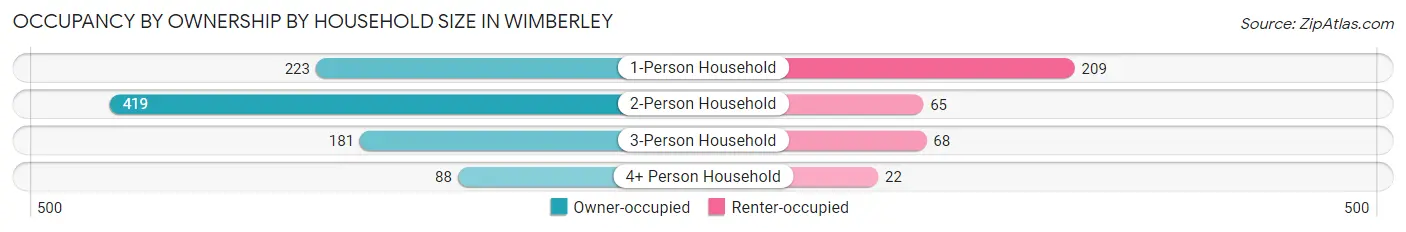
| Household Size | Owner-occupied | Renter-occupied |
| 1-Person Household | 223 (51.6%) | 209 (48.4%) |
| 2-Person Household | 419 (86.6%) | 65 (13.4%) |
| 3-Person Household | 181 (72.7%) | 68 (27.3%) |
| 4+ Person Household | 88 (80.0%) | 22 (20.0%) |
| Total Housing Units | 911 (71.5%) | 364 (28.5%) |
Occupancy by Educational Attainment in Wimberley
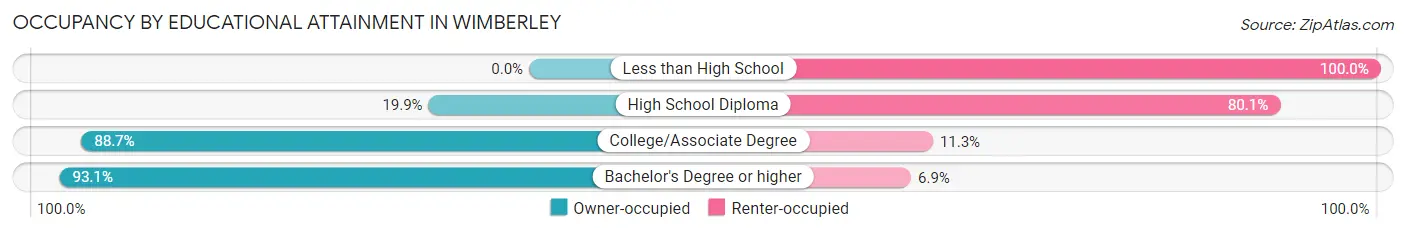
| Household Size | Owner-occupied | Renter-occupied |
| Less than High School | 0 (0.0%) | 65 (100.0%) |
| High School Diploma | 56 (19.9%) | 225 (80.1%) |
| College/Associate Degree | 197 (88.7%) | 25 (11.3%) |
| Bachelor's Degree or higher | 658 (93.1%) | 49 (6.9%) |
Occupancy by Age of Householder in Wimberley
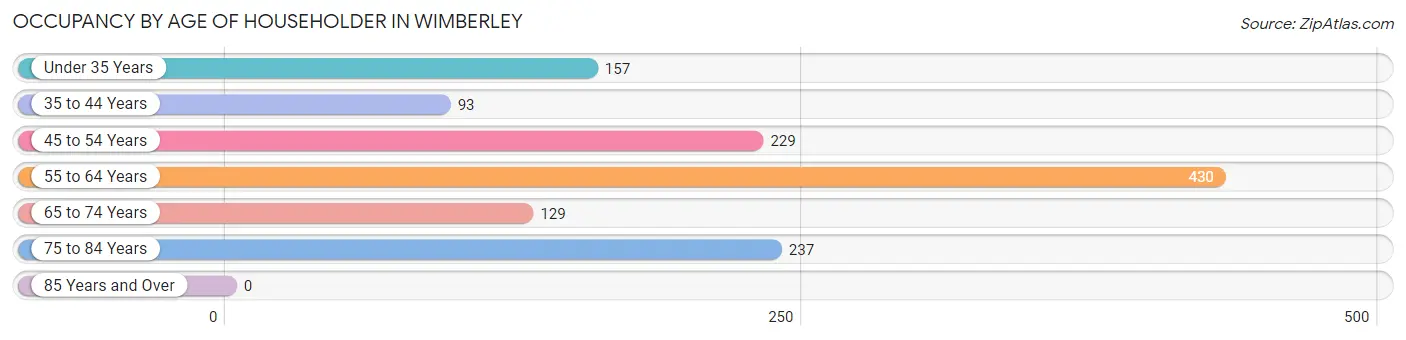
| Age Bracket | # Households | % Households |
| Under 35 Years | 157 | 12.3% |
| 35 to 44 Years | 93 | 7.3% |
| 45 to 54 Years | 229 | 18.0% |
| 55 to 64 Years | 430 | 33.7% |
| 65 to 74 Years | 129 | 10.1% |
| 75 to 84 Years | 237 | 18.6% |
| 85 Years and Over | 0 | 0.0% |
| Total | 1,275 | 100.0% |
Housing Finances in Wimberley
Median Income by Occupancy in Wimberley
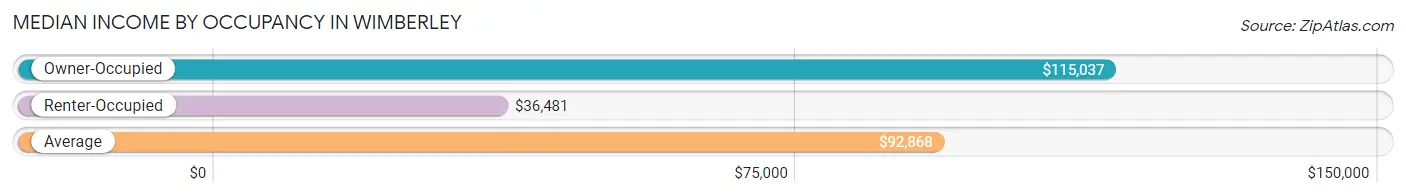
| Occupancy Type | # Households | Median Income |
| Owner-Occupied | 911 (71.5%) | $115,037 |
| Renter-Occupied | 364 (28.5%) | $36,481 |
| Average | 1,275 (100.0%) | $92,868 |
Occupancy by Householder Income Bracket in Wimberley
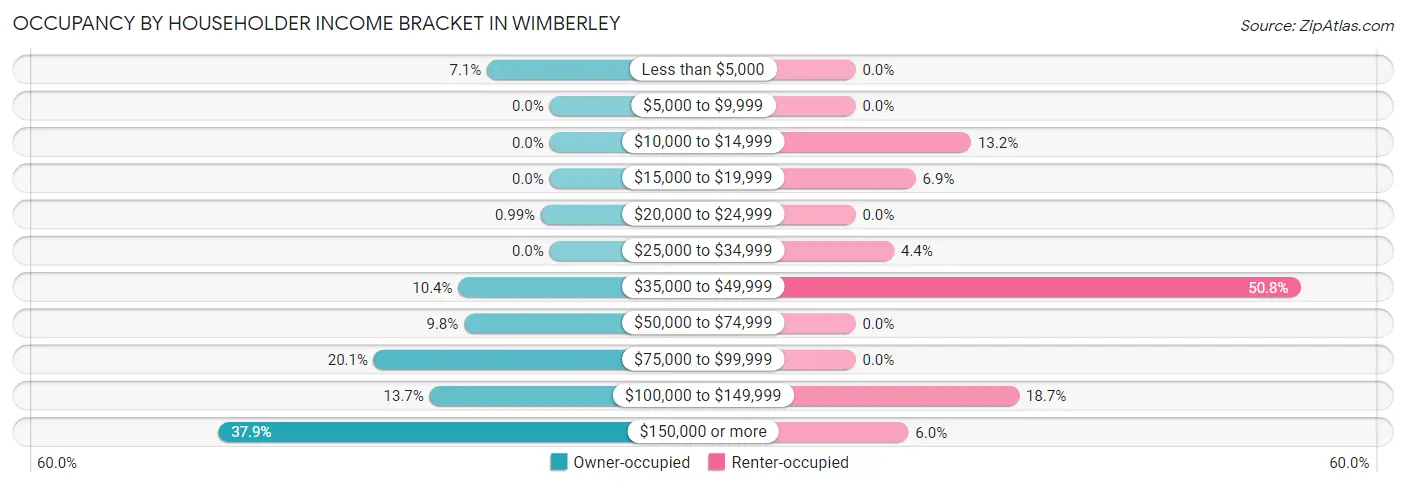
| Income Bracket | Owner-occupied | Renter-occupied |
| Less than $5,000 | 65 (7.1%) | 0 (0.0%) |
| $5,000 to $9,999 | 0 (0.0%) | 0 (0.0%) |
| $10,000 to $14,999 | 0 (0.0%) | 48 (13.2%) |
| $15,000 to $19,999 | 0 (0.0%) | 25 (6.9%) |
| $20,000 to $24,999 | 9 (1.0%) | 0 (0.0%) |
| $25,000 to $34,999 | 0 (0.0%) | 16 (4.4%) |
| $35,000 to $49,999 | 95 (10.4%) | 185 (50.8%) |
| $50,000 to $74,999 | 89 (9.8%) | 0 (0.0%) |
| $75,000 to $99,999 | 183 (20.1%) | 0 (0.0%) |
| $100,000 to $149,999 | 125 (13.7%) | 68 (18.7%) |
| $150,000 or more | 345 (37.9%) | 22 (6.0%) |
| Total | 911 (100.0%) | 364 (100.0%) |
Monthly Housing Cost Tiers in Wimberley
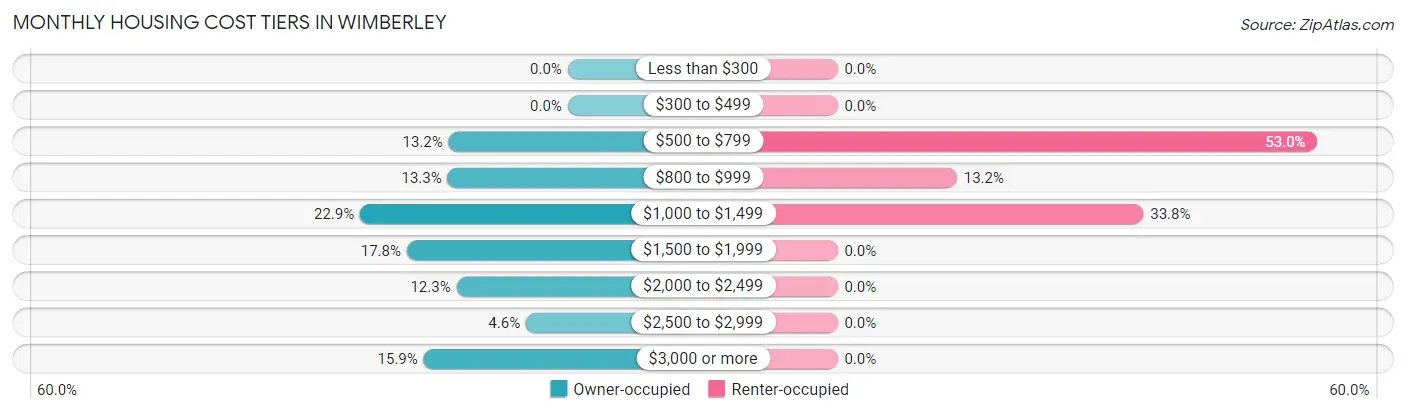
| Monthly Cost | Owner-occupied | Renter-occupied |
| Less than $300 | 0 (0.0%) | 0 (0.0%) |
| $300 to $499 | 0 (0.0%) | 0 (0.0%) |
| $500 to $799 | 120 (13.2%) | 193 (53.0%) |
| $800 to $999 | 121 (13.3%) | 48 (13.2%) |
| $1,000 to $1,499 | 209 (22.9%) | 123 (33.8%) |
| $1,500 to $1,999 | 162 (17.8%) | 0 (0.0%) |
| $2,000 to $2,499 | 112 (12.3%) | 0 (0.0%) |
| $2,500 to $2,999 | 42 (4.6%) | 0 (0.0%) |
| $3,000 or more | 145 (15.9%) | 0 (0.0%) |
| Total | 911 (100.0%) | 364 (100.0%) |
Physical Housing Characteristics in Wimberley
Housing Structures in Wimberley
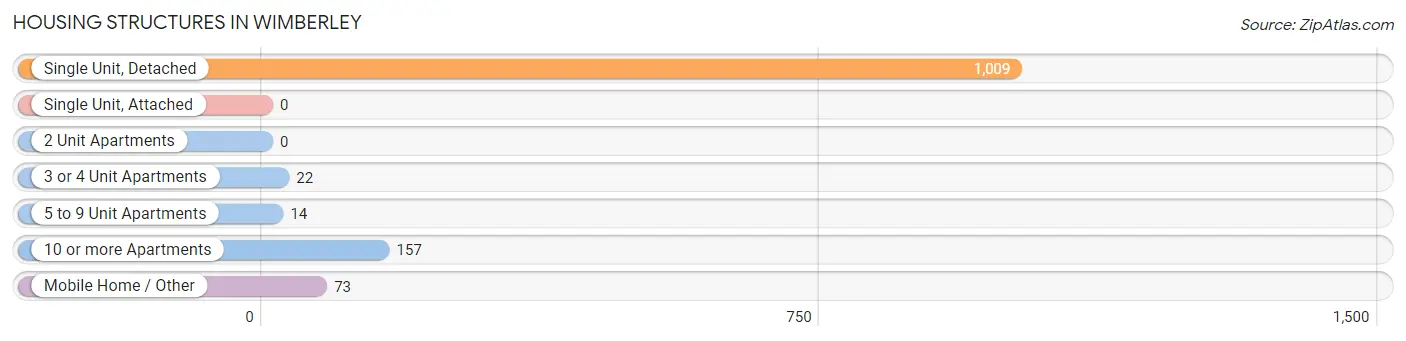
| Structure Type | # Housing Units | % Housing Units |
| Single Unit, Detached | 1,009 | 79.1% |
| Single Unit, Attached | 0 | 0.0% |
| 2 Unit Apartments | 0 | 0.0% |
| 3 or 4 Unit Apartments | 22 | 1.7% |
| 5 to 9 Unit Apartments | 14 | 1.1% |
| 10 or more Apartments | 157 | 12.3% |
| Mobile Home / Other | 73 | 5.7% |
| Total | 1,275 | 100.0% |
Housing Structures by Occupancy in Wimberley
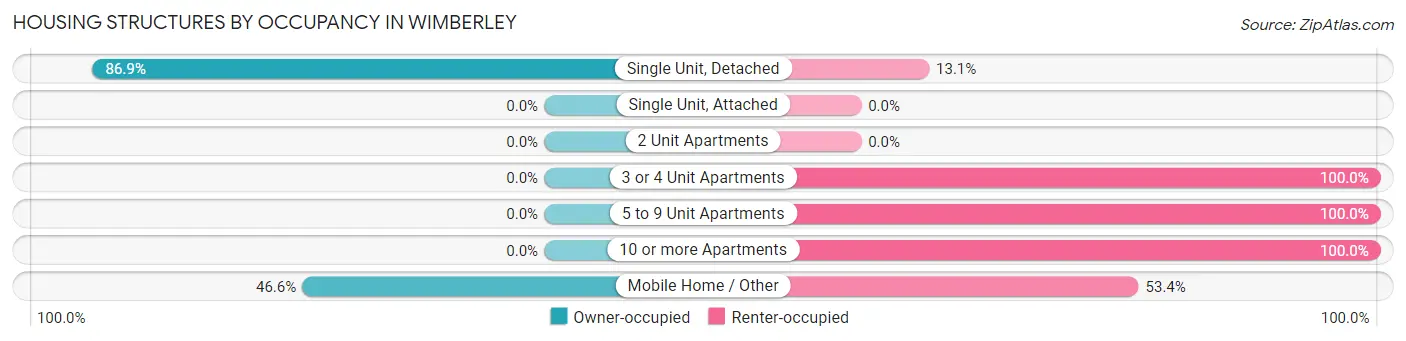
| Structure Type | Owner-occupied | Renter-occupied |
| Single Unit, Detached | 877 (86.9%) | 132 (13.1%) |
| Single Unit, Attached | 0 (0.0%) | 0 (0.0%) |
| 2 Unit Apartments | 0 (0.0%) | 0 (0.0%) |
| 3 or 4 Unit Apartments | 0 (0.0%) | 22 (100.0%) |
| 5 to 9 Unit Apartments | 0 (0.0%) | 14 (100.0%) |
| 10 or more Apartments | 0 (0.0%) | 157 (100.0%) |
| Mobile Home / Other | 34 (46.6%) | 39 (53.4%) |
| Total | 911 (71.5%) | 364 (28.5%) |
Housing Structures by Number of Rooms in Wimberley
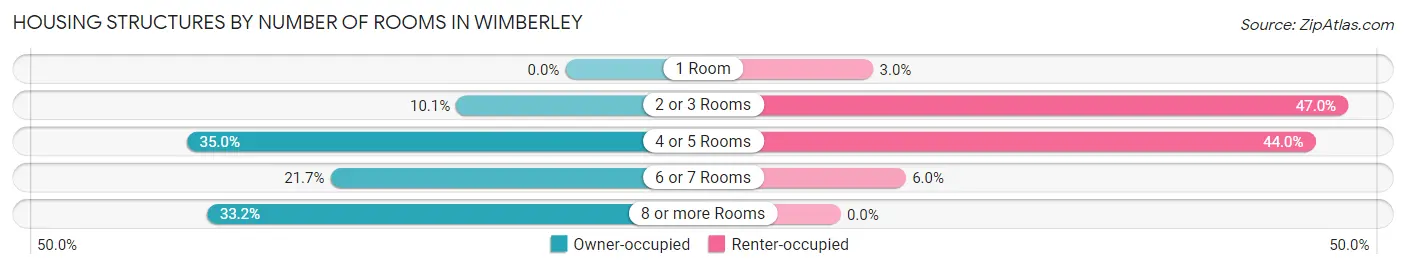
| Number of Rooms | Owner-occupied | Renter-occupied |
| 1 Room | 0 (0.0%) | 11 (3.0%) |
| 2 or 3 Rooms | 92 (10.1%) | 171 (47.0%) |
| 4 or 5 Rooms | 319 (35.0%) | 160 (44.0%) |
| 6 or 7 Rooms | 198 (21.7%) | 22 (6.0%) |
| 8 or more Rooms | 302 (33.2%) | 0 (0.0%) |
| Total | 911 (100.0%) | 364 (100.0%) |
Housing Structure by Heating Type in Wimberley
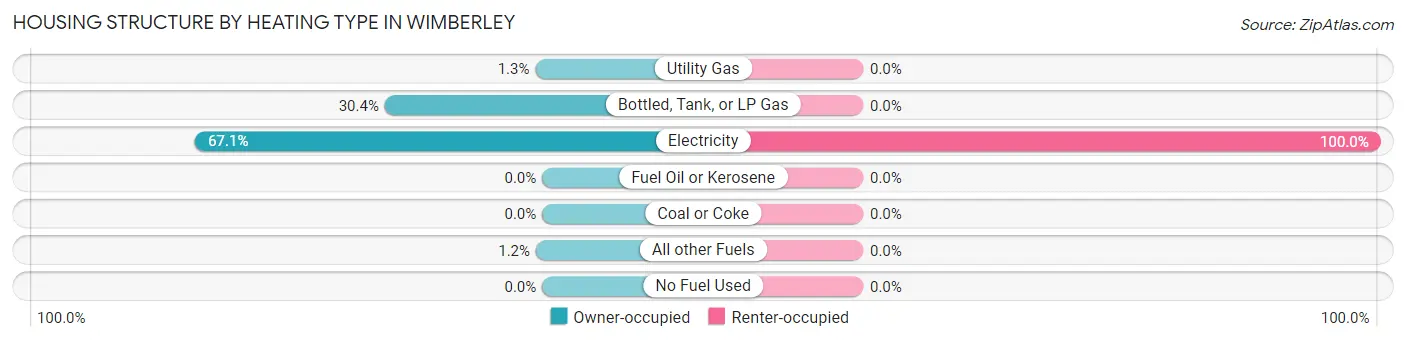
| Heating Type | Owner-occupied | Renter-occupied |
| Utility Gas | 12 (1.3%) | 0 (0.0%) |
| Bottled, Tank, or LP Gas | 277 (30.4%) | 0 (0.0%) |
| Electricity | 611 (67.1%) | 364 (100.0%) |
| Fuel Oil or Kerosene | 0 (0.0%) | 0 (0.0%) |
| Coal or Coke | 0 (0.0%) | 0 (0.0%) |
| All other Fuels | 11 (1.2%) | 0 (0.0%) |
| No Fuel Used | 0 (0.0%) | 0 (0.0%) |
| Total | 911 (100.0%) | 364 (100.0%) |
Household Vehicle Usage in Wimberley
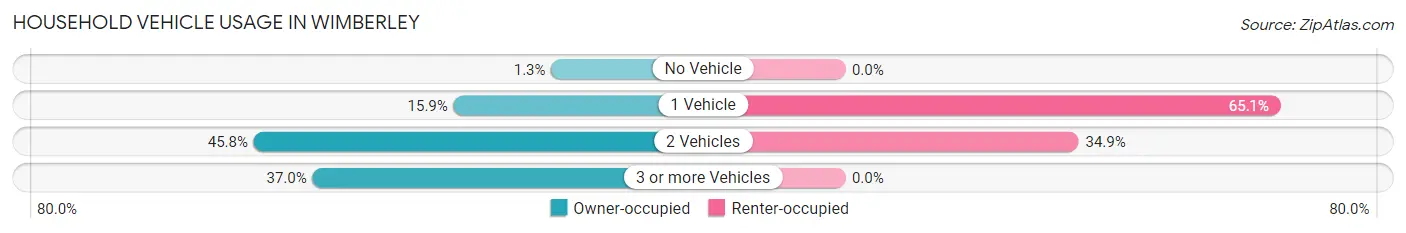
| Vehicles per Household | Owner-occupied | Renter-occupied |
| No Vehicle | 12 (1.3%) | 0 (0.0%) |
| 1 Vehicle | 145 (15.9%) | 237 (65.1%) |
| 2 Vehicles | 417 (45.8%) | 127 (34.9%) |
| 3 or more Vehicles | 337 (37.0%) | 0 (0.0%) |
| Total | 911 (100.0%) | 364 (100.0%) |
Real Estate & Mortgages in Wimberley
Real Estate and Mortgage Overview in Wimberley
| Characteristic | Without Mortgage | With Mortgage |
| Housing Units | 451 | 460 |
| Median Property Value | $780,200 | $423,800 |
| Median Household Income | $99,408 | $170 |
| Monthly Housing Costs | $976 | $145 |
| Real Estate Taxes | $6,645 | $0 |
Property Value by Mortgage Status in Wimberley
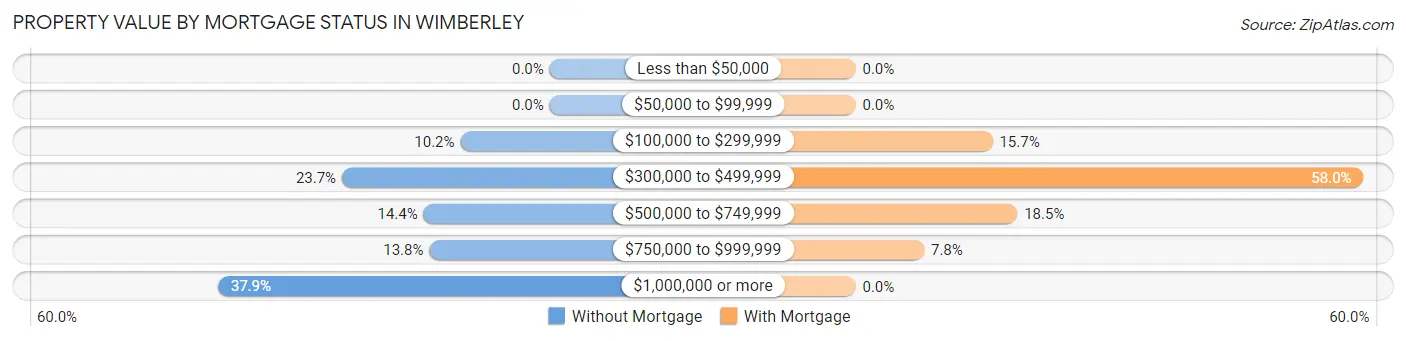
| Property Value | Without Mortgage | With Mortgage |
| Less than $50,000 | 0 (0.0%) | 0 (0.0%) |
| $50,000 to $99,999 | 0 (0.0%) | 0 (0.0%) |
| $100,000 to $299,999 | 46 (10.2%) | 72 (15.7%) |
| $300,000 to $499,999 | 107 (23.7%) | 267 (58.0%) |
| $500,000 to $749,999 | 65 (14.4%) | 85 (18.5%) |
| $750,000 to $999,999 | 62 (13.8%) | 36 (7.8%) |
| $1,000,000 or more | 171 (37.9%) | 0 (0.0%) |
| Total | 451 (100.0%) | 460 (100.0%) |
Household Income by Mortgage Status in Wimberley
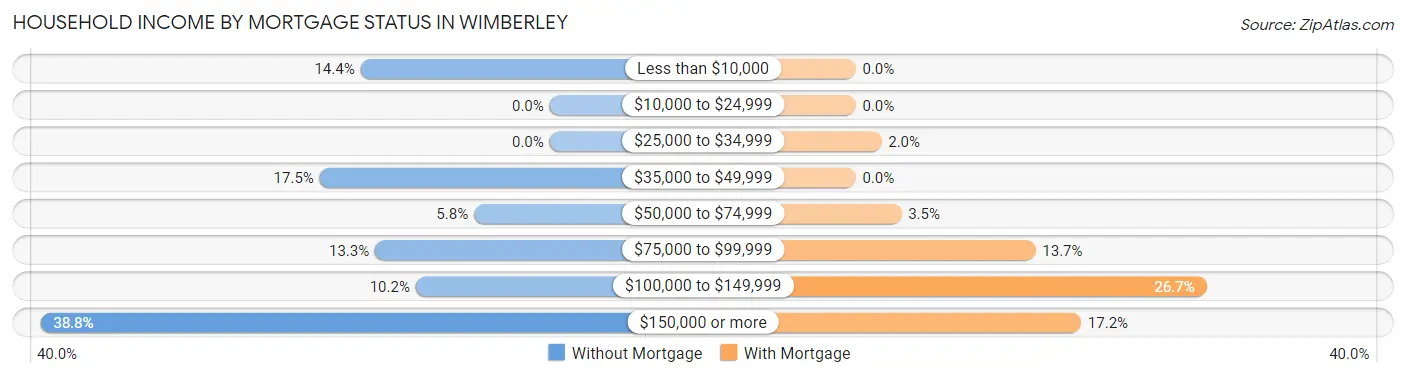
| Household Income | Without Mortgage | With Mortgage |
| Less than $10,000 | 65 (14.4%) | 0 (0.0%) |
| $10,000 to $24,999 | 0 (0.0%) | 0 (0.0%) |
| $25,000 to $34,999 | 0 (0.0%) | 9 (2.0%) |
| $35,000 to $49,999 | 79 (17.5%) | 0 (0.0%) |
| $50,000 to $74,999 | 26 (5.8%) | 16 (3.5%) |
| $75,000 to $99,999 | 60 (13.3%) | 63 (13.7%) |
| $100,000 to $149,999 | 46 (10.2%) | 123 (26.7%) |
| $150,000 or more | 175 (38.8%) | 79 (17.2%) |
| Total | 451 (100.0%) | 460 (100.0%) |
Property Value to Household Income Ratio in Wimberley
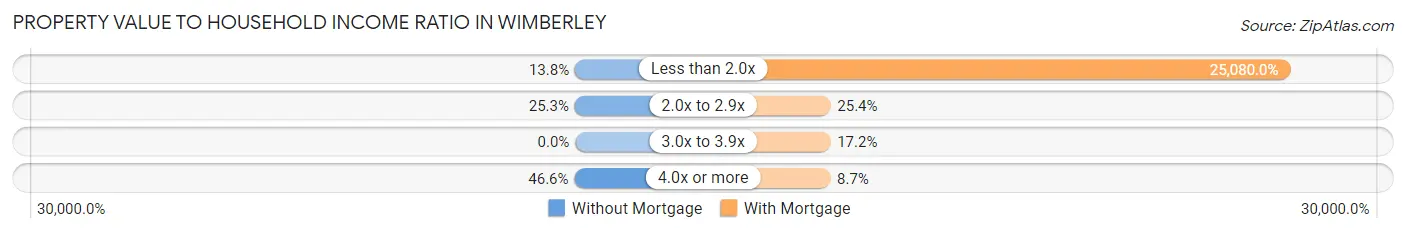
| Value-to-Income Ratio | Without Mortgage | With Mortgage |
| Less than 2.0x | 62 (13.8%) | 115,368 (25,080.0%) |
| 2.0x to 2.9x | 114 (25.3%) | 117 (25.4%) |
| 3.0x to 3.9x | 0 (0.0%) | 79 (17.2%) |
| 4.0x or more | 210 (46.6%) | 40 (8.7%) |
| Total | 451 (100.0%) | 460 (100.0%) |
Real Estate Taxes by Mortgage Status in Wimberley
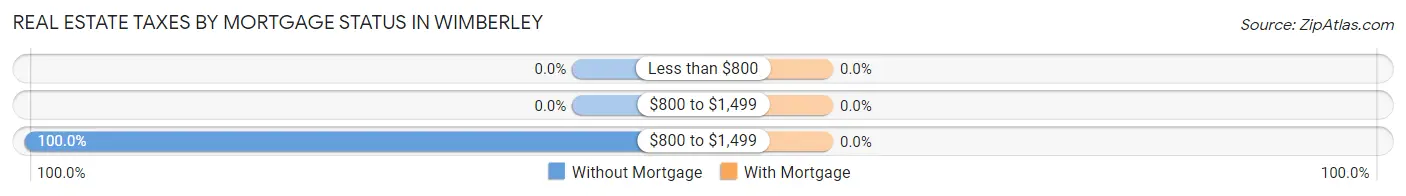
| Property Taxes | Without Mortgage | With Mortgage |
| Less than $800 | 0 (0.0%) | 0 (0.0%) |
| $800 to $1,499 | 0 (0.0%) | 0 (0.0%) |
| $800 to $1,499 | 451 (100.0%) | 0 (0.0%) |
| Total | 451 (100.0%) | 460 (100.0%) |
Health & Disability in Wimberley
Health Insurance Coverage by Age in Wimberley
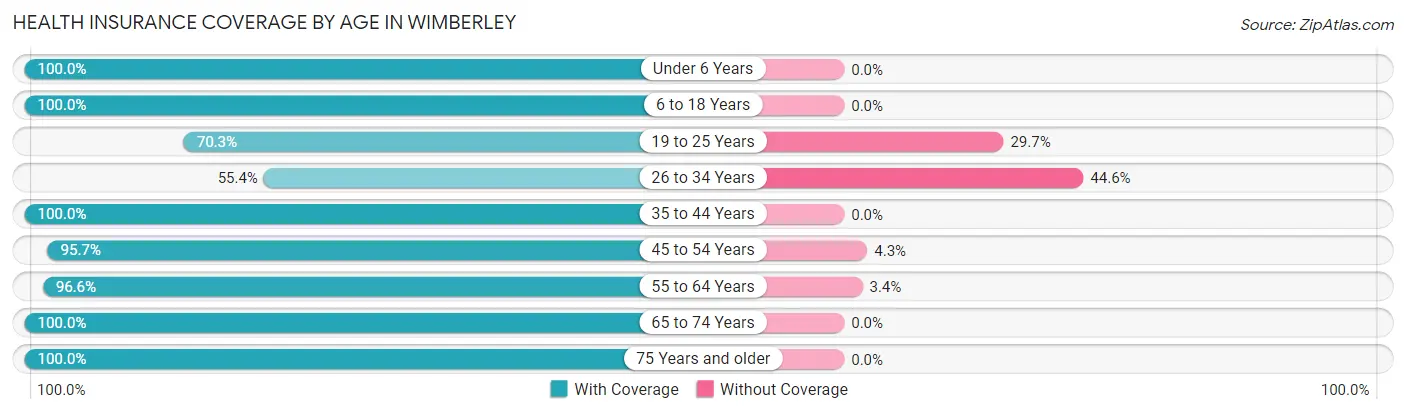
| Age Bracket | With Coverage | Without Coverage |
| Under 6 Years | 15 (100.0%) | 0 (0.0%) |
| 6 to 18 Years | 294 (100.0%) | 0 (0.0%) |
| 19 to 25 Years | 367 (70.3%) | 155 (29.7%) |
| 26 to 34 Years | 41 (55.4%) | 33 (44.6%) |
| 35 to 44 Years | 218 (100.0%) | 0 (0.0%) |
| 45 to 54 Years | 378 (95.7%) | 17 (4.3%) |
| 55 to 64 Years | 625 (96.6%) | 22 (3.4%) |
| 65 to 74 Years | 271 (100.0%) | 0 (0.0%) |
| 75 Years and older | 330 (100.0%) | 0 (0.0%) |
| Total | 2,539 (91.8%) | 227 (8.2%) |
Health Insurance Coverage by Citizenship Status in Wimberley
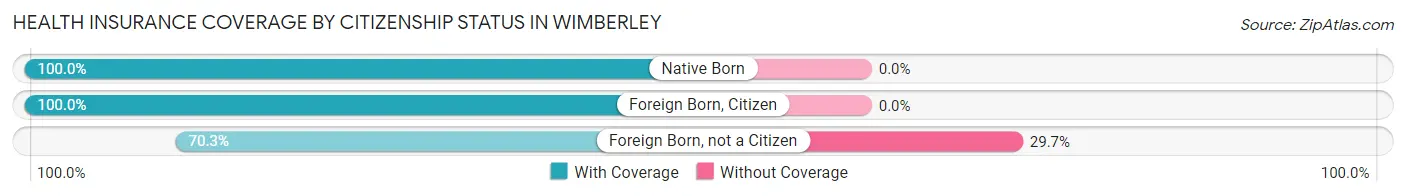
| Citizenship Status | With Coverage | Without Coverage |
| Native Born | 15 (100.0%) | 0 (0.0%) |
| Foreign Born, Citizen | 294 (100.0%) | 0 (0.0%) |
| Foreign Born, not a Citizen | 367 (70.3%) | 155 (29.7%) |
Health Insurance Coverage by Household Income in Wimberley
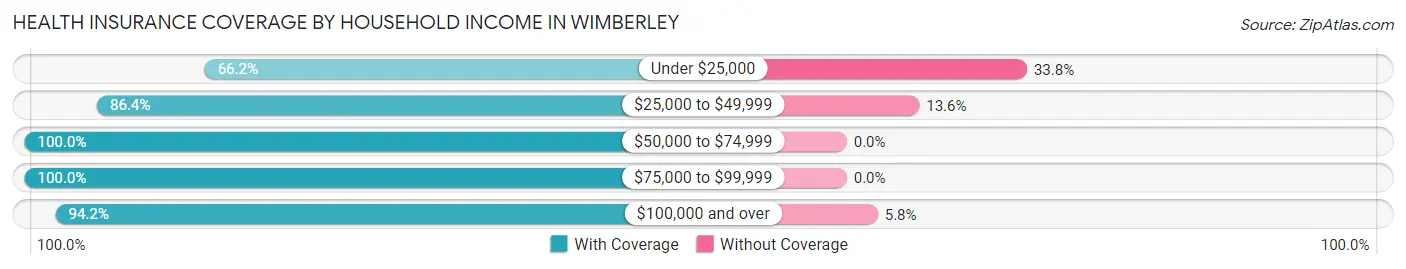
| Household Income | With Coverage | Without Coverage |
| Under $25,000 | 157 (66.2%) | 80 (33.8%) |
| $25,000 to $49,999 | 318 (86.4%) | 50 (13.6%) |
| $50,000 to $74,999 | 207 (100.0%) | 0 (0.0%) |
| $75,000 to $99,999 | 277 (100.0%) | 0 (0.0%) |
| $100,000 and over | 1,573 (94.2%) | 97 (5.8%) |
Public vs Private Health Insurance Coverage by Age in Wimberley
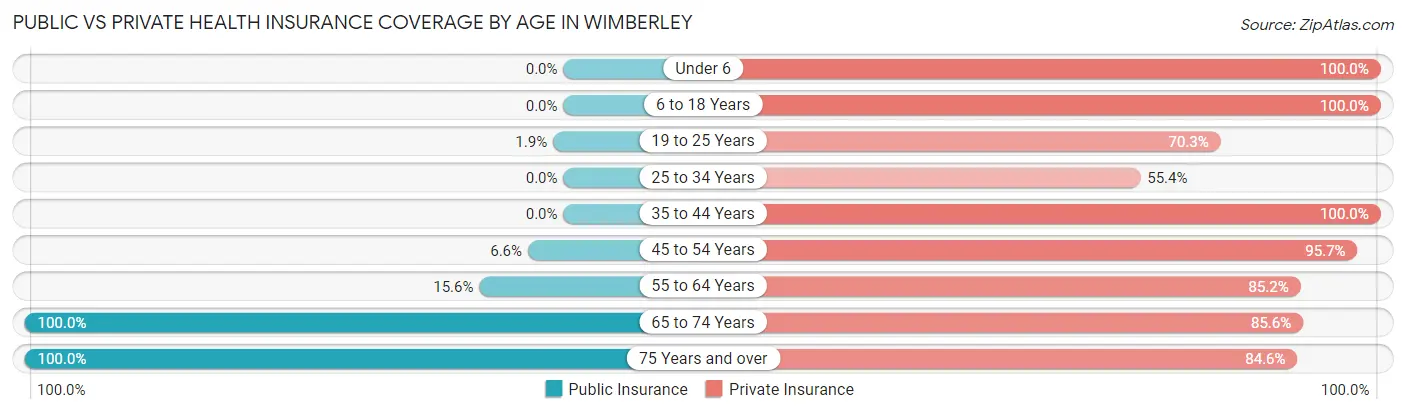
| Age Bracket | Public Insurance | Private Insurance |
| Under 6 | 0 (0.0%) | 15 (100.0%) |
| 6 to 18 Years | 0 (0.0%) | 294 (100.0%) |
| 19 to 25 Years | 10 (1.9%) | 367 (70.3%) |
| 25 to 34 Years | 0 (0.0%) | 41 (55.4%) |
| 35 to 44 Years | 0 (0.0%) | 218 (100.0%) |
| 45 to 54 Years | 26 (6.6%) | 378 (95.7%) |
| 55 to 64 Years | 101 (15.6%) | 551 (85.2%) |
| 65 to 74 Years | 271 (100.0%) | 232 (85.6%) |
| 75 Years and over | 330 (100.0%) | 279 (84.6%) |
| Total | 738 (26.7%) | 2,375 (85.9%) |
Disability Status by Sex by Age in Wimberley
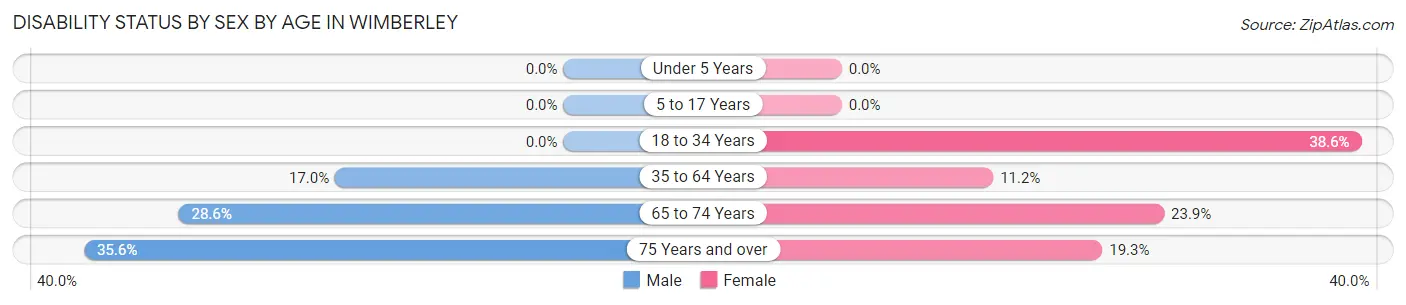
| Age Bracket | Male | Female |
| Under 5 Years | 0 (0.0%) | 0 (0.0%) |
| 5 to 17 Years | 0 (0.0%) | 0 (0.0%) |
| 18 to 34 Years | 0 (0.0%) | 49 (38.6%) |
| 35 to 64 Years | 111 (17.0%) | 68 (11.2%) |
| 65 to 74 Years | 44 (28.6%) | 28 (23.9%) |
| 75 Years and over | 42 (35.6%) | 41 (19.3%) |
Disability Class by Sex by Age in Wimberley
Disability Class: Hearing Difficulty
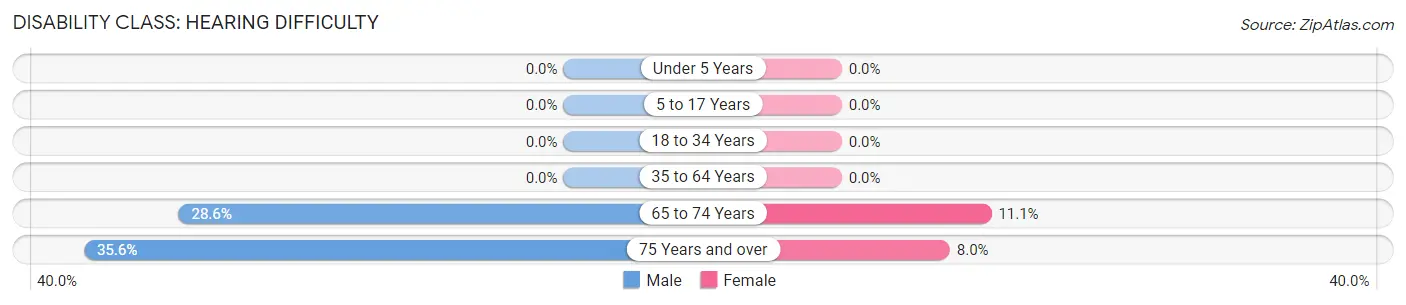
| Age Bracket | Male | Female |
| Under 5 Years | 0 (0.0%) | 0 (0.0%) |
| 5 to 17 Years | 0 (0.0%) | 0 (0.0%) |
| 18 to 34 Years | 0 (0.0%) | 0 (0.0%) |
| 35 to 64 Years | 0 (0.0%) | 0 (0.0%) |
| 65 to 74 Years | 44 (28.6%) | 13 (11.1%) |
| 75 Years and over | 42 (35.6%) | 17 (8.0%) |
Disability Class: Vision Difficulty
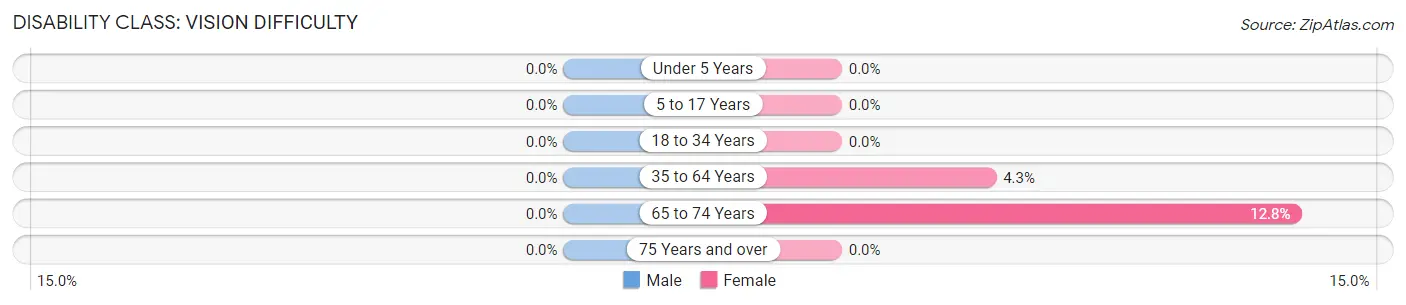
| Age Bracket | Male | Female |
| Under 5 Years | 0 (0.0%) | 0 (0.0%) |
| 5 to 17 Years | 0 (0.0%) | 0 (0.0%) |
| 18 to 34 Years | 0 (0.0%) | 0 (0.0%) |
| 35 to 64 Years | 0 (0.0%) | 26 (4.3%) |
| 65 to 74 Years | 0 (0.0%) | 15 (12.8%) |
| 75 Years and over | 0 (0.0%) | 0 (0.0%) |
Disability Class: Cognitive Difficulty
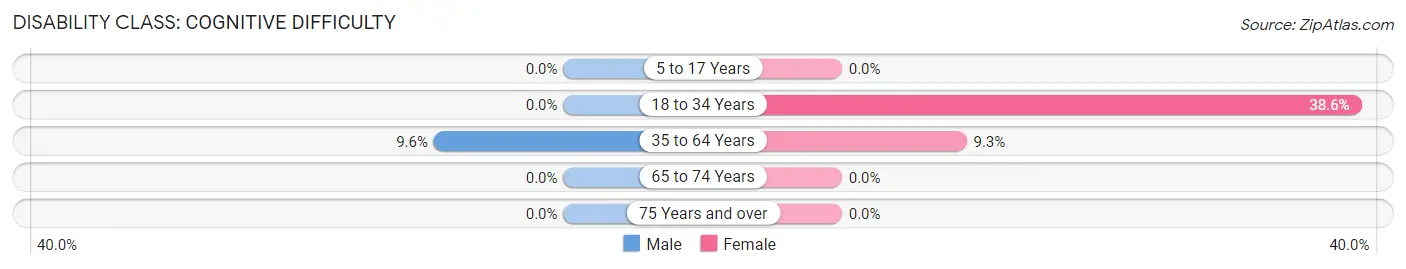
| Age Bracket | Male | Female |
| 5 to 17 Years | 0 (0.0%) | 0 (0.0%) |
| 18 to 34 Years | 0 (0.0%) | 49 (38.6%) |
| 35 to 64 Years | 63 (9.6%) | 56 (9.3%) |
| 65 to 74 Years | 0 (0.0%) | 0 (0.0%) |
| 75 Years and over | 0 (0.0%) | 0 (0.0%) |
Disability Class: Ambulatory Difficulty
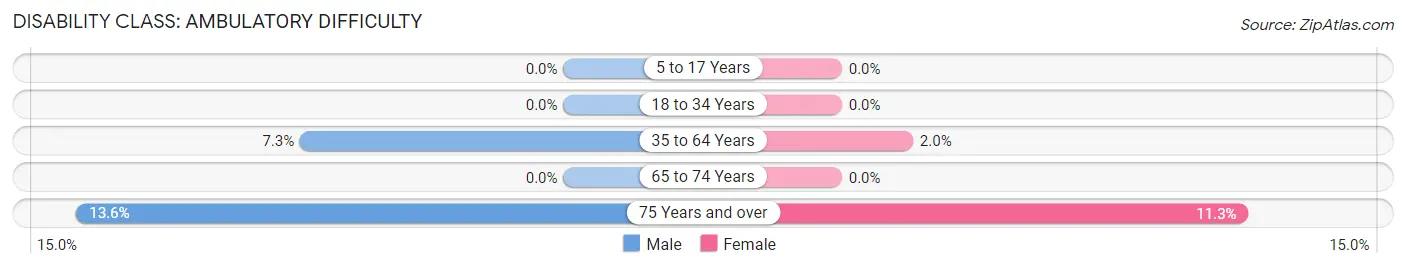
| Age Bracket | Male | Female |
| 5 to 17 Years | 0 (0.0%) | 0 (0.0%) |
| 18 to 34 Years | 0 (0.0%) | 0 (0.0%) |
| 35 to 64 Years | 48 (7.3%) | 12 (2.0%) |
| 65 to 74 Years | 0 (0.0%) | 0 (0.0%) |
| 75 Years and over | 16 (13.6%) | 24 (11.3%) |
Disability Class: Self-Care Difficulty
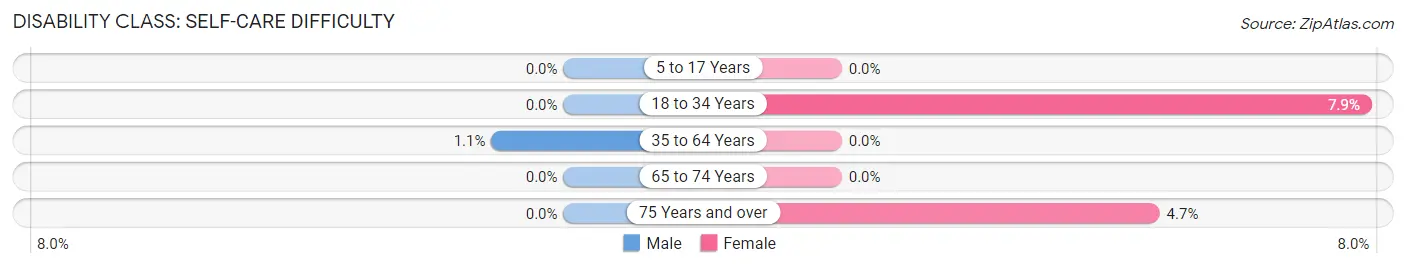
| Age Bracket | Male | Female |
| 5 to 17 Years | 0 (0.0%) | 0 (0.0%) |
| 18 to 34 Years | 0 (0.0%) | 10 (7.9%) |
| 35 to 64 Years | 7 (1.1%) | 0 (0.0%) |
| 65 to 74 Years | 0 (0.0%) | 0 (0.0%) |
| 75 Years and over | 0 (0.0%) | 10 (4.7%) |
Technology Access in Wimberley
Computing Device Access in Wimberley
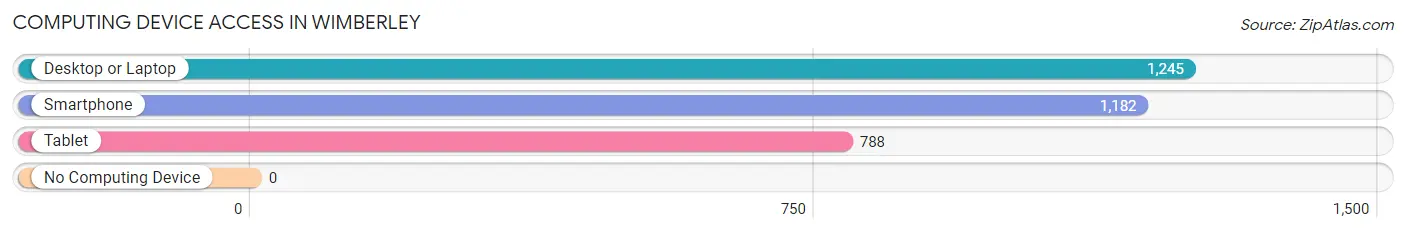
| Device Type | # Households | % Households |
| Desktop or Laptop | 1,245 | 97.7% |
| Smartphone | 1,182 | 92.7% |
| Tablet | 788 | 61.8% |
| No Computing Device | 0 | 0.0% |
| Total | 1,275 | 100.0% |
Internet Access in Wimberley
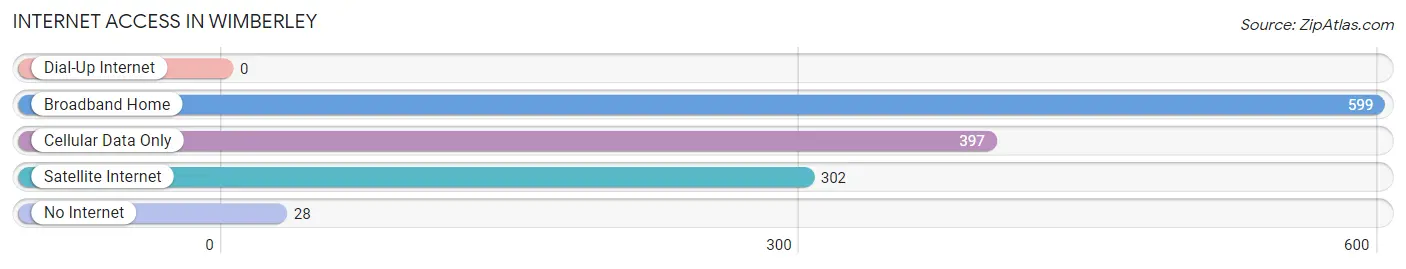
| Internet Type | # Households | % Households |
| Dial-Up Internet | 0 | 0.0% |
| Broadband Home | 599 | 47.0% |
| Cellular Data Only | 397 | 31.1% |
| Satellite Internet | 302 | 23.7% |
| No Internet | 28 | 2.2% |
| Total | 1,275 | 100.0% |
Wimberley Summary
Wimberley, Texas is a small town located in Hays County, Texas, about 32 miles southwest of Austin. It is situated in the Texas Hill Country, and is known for its natural beauty, outdoor recreation, and small-town charm. The population of Wimberley was 2,626 at the 2010 census, and the estimated population in 2019 was 3,072.
History
The area that is now Wimberley was first settled in the 1850s by German and Irish immigrants. The town was officially founded in 1880 and named after John O. Wimberley, a local rancher and businessman. The town was incorporated in 1948.
In the early 1900s, Wimberley was a thriving agricultural community, with cotton, corn, and hay being the main crops. The town also had a number of businesses, including a cotton gin, a grist mill, and a blacksmith shop.
In the 1950s, Wimberley began to transition from an agricultural economy to a tourist economy. The town was featured in a number of movies and television shows, and the local businesses began to cater to tourists. The town also became a popular destination for weekend getaways and family vacations.
Geography
Wimberley is located in the Texas Hill Country, about 32 miles southwest of Austin. The town is situated on the banks of the Blanco River, and is surrounded by rolling hills and lush vegetation. The town is also home to a number of creeks, springs, and other natural features.
The climate in Wimberley is mild and temperate, with hot summers and mild winters. The average annual temperature is 68°F, and the average annual precipitation is 33 inches.
Economy
The economy of Wimberley is largely based on tourism. The town is home to a number of bed and breakfasts, restaurants, and other businesses that cater to tourists. The town is also home to a number of art galleries, antique stores, and other specialty shops.
The town is also home to a number of manufacturing and technology companies, including a number of software companies. The town is also home to a number of wineries and vineyards.
Demographics
The population of Wimberley was 2,626 at the 2010 census, and the estimated population in 2019 was 3,072. The population is predominantly white (90.2%), with the remaining population being Hispanic (7.2%), African American (1.2%), and other (1.4%).
The median household income in Wimberley is $60,938, and the median home value is $310,000. The town has a low unemployment rate (3.2%) and a high rate of homeownership (77.2%).
Conclusion
Wimberley, Texas is a small town located in Hays County, Texas, about 32 miles southwest of Austin. It is situated in the Texas Hill Country, and is known for its natural beauty, outdoor recreation, and small-town charm. The town was founded in 1880 and has a population of 3,072. The economy of Wimberley is largely based on tourism, and the town is home to a number of bed and breakfasts, restaurants, and other businesses that cater to tourists. The population is predominantly white, with the median household income being $60,938 and the median home value being $310,000.
Common Questions
What is Per Capita Income in Wimberley?
Per Capita income in Wimberley is $51,592.
What is the Median Family Income in Wimberley?
Median Family Income in Wimberley is $121,722.
What is the Median Household income in Wimberley?
Median Household Income in Wimberley is $92,868.
What is Income or Wage Gap in Wimberley?
Income or Wage Gap in Wimberley is 24.7%.
Women in Wimberley earn 75.3 cents for every dollar earned by a man.
What is Inequality or Gini Index in Wimberley?
Inequality or Gini Index in Wimberley is 0.46.
What is the Total Population of Wimberley?
Total Population of Wimberley is 2,858.
What is the Total Male Population of Wimberley?
Total Male Population of Wimberley is 1,656.
What is the Total Female Population of Wimberley?
Total Female Population of Wimberley is 1,202.
What is the Ratio of Males per 100 Females in Wimberley?
There are 137.77 Males per 100 Females in Wimberley.
What is the Ratio of Females per 100 Males in Wimberley?
There are 72.58 Females per 100 Males in Wimberley.
What is the Median Population Age in Wimberley?
Median Population Age in Wimberley is 54.2 Years.
What is the Average Family Size in Wimberley
Average Family Size in Wimberley is 2.7 People.
What is the Average Household Size in Wimberley
Average Household Size in Wimberley is 2.2 People.
How Large is the Labor Force in Wimberley?
There are 1,659 People in the Labor Forcein in Wimberley.
What is the Percentage of People in the Labor Force in Wimberley?
63.7% of People are in the Labor Force in Wimberley.
What is the Unemployment Rate in Wimberley?
Unemployment Rate in Wimberley is 11.6%.