Zip Codes with the Highest Percentage of Population Employed in Real Estate, Rental & Leasing in Rockwall, TX
RELATED REPORTS & OPTIONS
Real Estate, Rental & Leasing
Rockwall
Compare Zip Codes
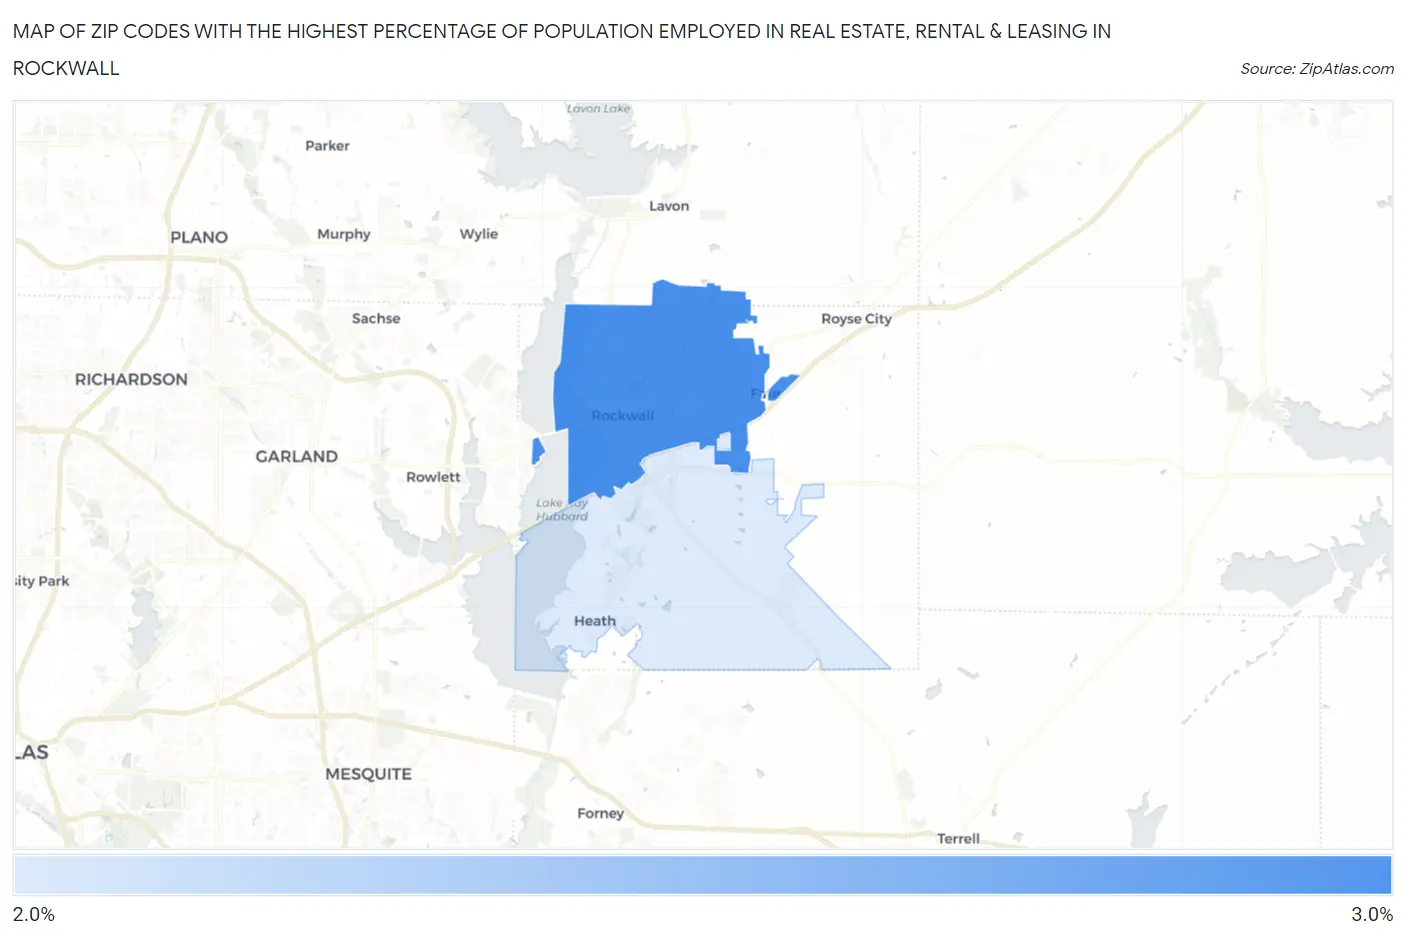
Map of Zip Codes with the Highest Percentage of Population Employed in Real Estate, Rental & Leasing in Rockwall
2.1%
2.8%
Zip Codes with the Highest Percentage of Population Employed in Real Estate, Rental & Leasing in Rockwall, TX
| Zip Code | % Employed | vs State | vs National | |
| 1. | 75087 | 2.8% | 2.0%(+0.810)#305 | 1.9%(+0.926)#4,382 |
| 2. | 75032 | 2.1% | 2.0%(+0.097)#535 | 1.9%(+0.213)#7,301 |
1
Common Questions
What are the Top Zip Codes with the Highest Percentage of Population Employed in Real Estate, Rental & Leasing in Rockwall, TX?
Top Zip Codes with the Highest Percentage of Population Employed in Real Estate, Rental & Leasing in Rockwall, TX are:
What zip code has the Highest Percentage of Population Employed in Real Estate, Rental & Leasing in Rockwall, TX?
75087 has the Highest Percentage of Population Employed in Real Estate, Rental & Leasing in Rockwall, TX with 2.8%.
What is the Percentage of Population Employed in Real Estate, Rental & Leasing in Rockwall, TX?
Percentage of Population Employed in Real Estate, Rental & Leasing in Rockwall is 2.6%.
What is the Percentage of Population Employed in Real Estate, Rental & Leasing in Texas?
Percentage of Population Employed in Real Estate, Rental & Leasing in Texas is 2.0%.
What is the Percentage of Population Employed in Real Estate, Rental & Leasing in the United States?
Percentage of Population Employed in Real Estate, Rental & Leasing in the United States is 1.9%.