Highland Park, TX Map & Demographics
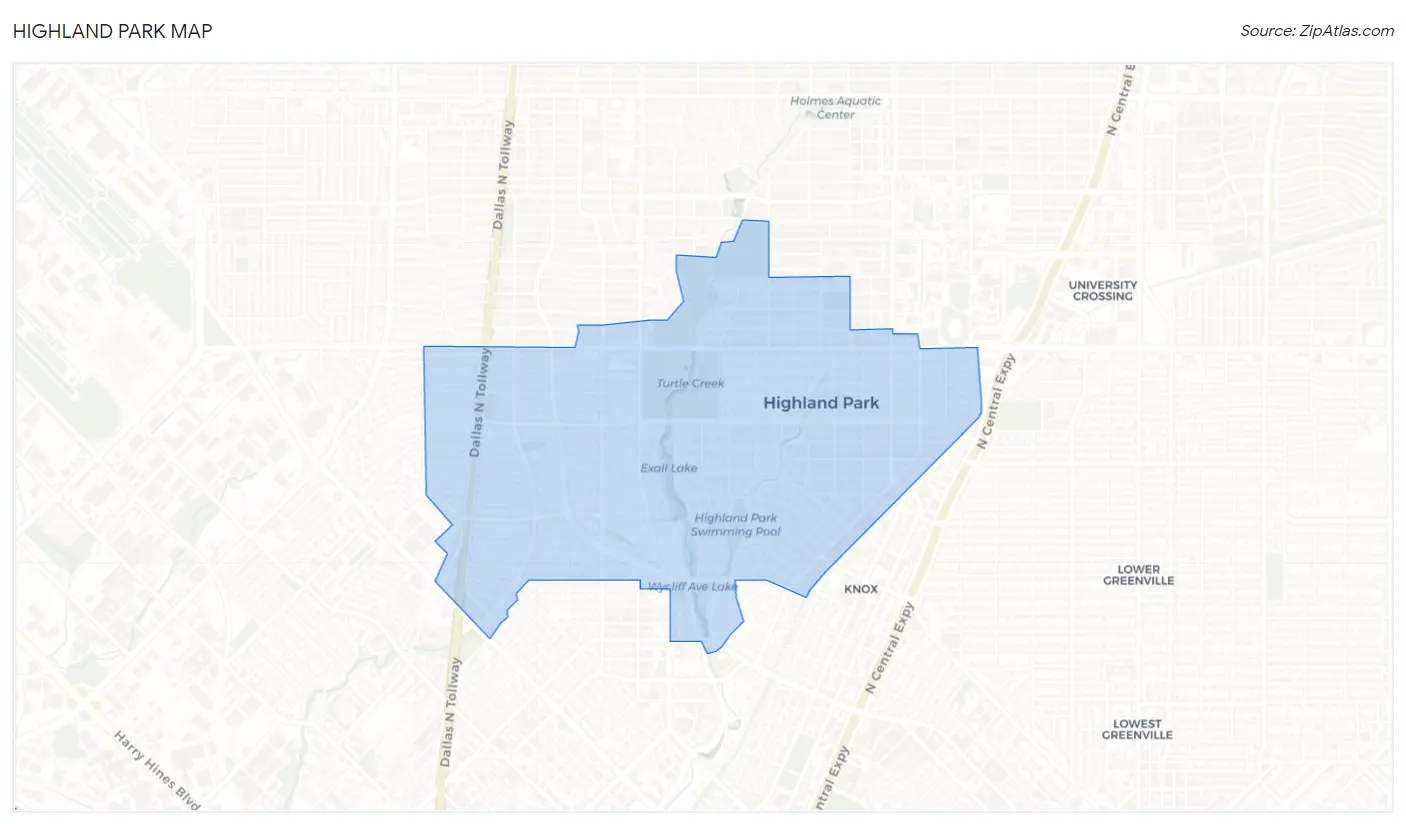
Highland Park Map
Highland Park Overview
$171,411
PER CAPITA INCOME
$250,001
AVG FAMILY INCOME
$249,923
AVG HOUSEHOLD INCOME
57.2%
WAGE / INCOME GAP [ % ]
42.8¢/ $1
WAGE / INCOME GAP [ $ ]
0.56
INEQUALITY / GINI INDEX
8,840
TOTAL POPULATION
4,511
MALE POPULATION
4,329
FEMALE POPULATION
104.20
MALES / 100 FEMALES
95.97
FEMALES / 100 MALES
44.4
MEDIAN AGE
3.2
AVG FAMILY SIZE
2.8
AVG HOUSEHOLD SIZE
3,777
LABOR FORCE [ PEOPLE ]
55.5%
PERCENT IN LABOR FORCE
4.8%
UNEMPLOYMENT RATE
Income in Highland Park
Income Overview in Highland Park
Per Capita Income in Highland Park is $171,411, while median incomes of families and households are $250,001 and $249,923 respectively.
| Characteristic | Number | Measure |
| Per Capita Income | 8,840 | $171,411 |
| Median Family Income | 2,517 | $250,001 |
| Mean Family Income | 2,517 | $503,701 |
| Median Household Income | 3,191 | $249,923 |
| Mean Household Income | 3,191 | $469,267 |
| Income Deficit | 2,517 | $0 |
| Wage / Income Gap (%) | 8,840 | 57.23% |
| Wage / Income Gap ($) | 8,840 | 42.77¢ per $1 |
| Gini / Inequality Index | 8,840 | 0.56 |
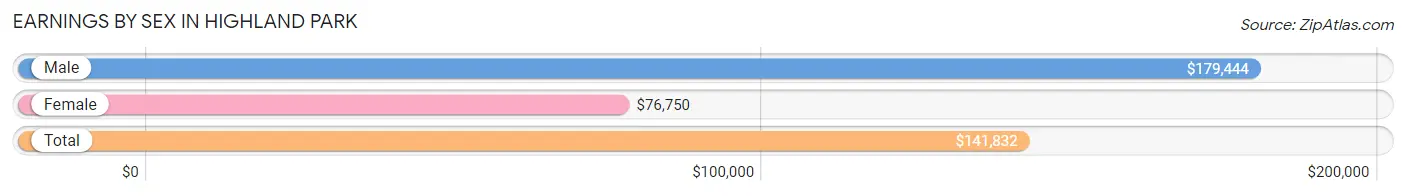
Earnings by Sex in Highland Park
Average Earnings in Highland Park are $141,832, $179,444 for men and $76,750 for women, a difference of 57.2%.
| Sex | Number | Average Earnings |
| Male | 2,380 (62.3%) | $179,444 |
| Female | 1,439 (37.7%) | $76,750 |
| Total | 3,819 (100.0%) | $141,832 |
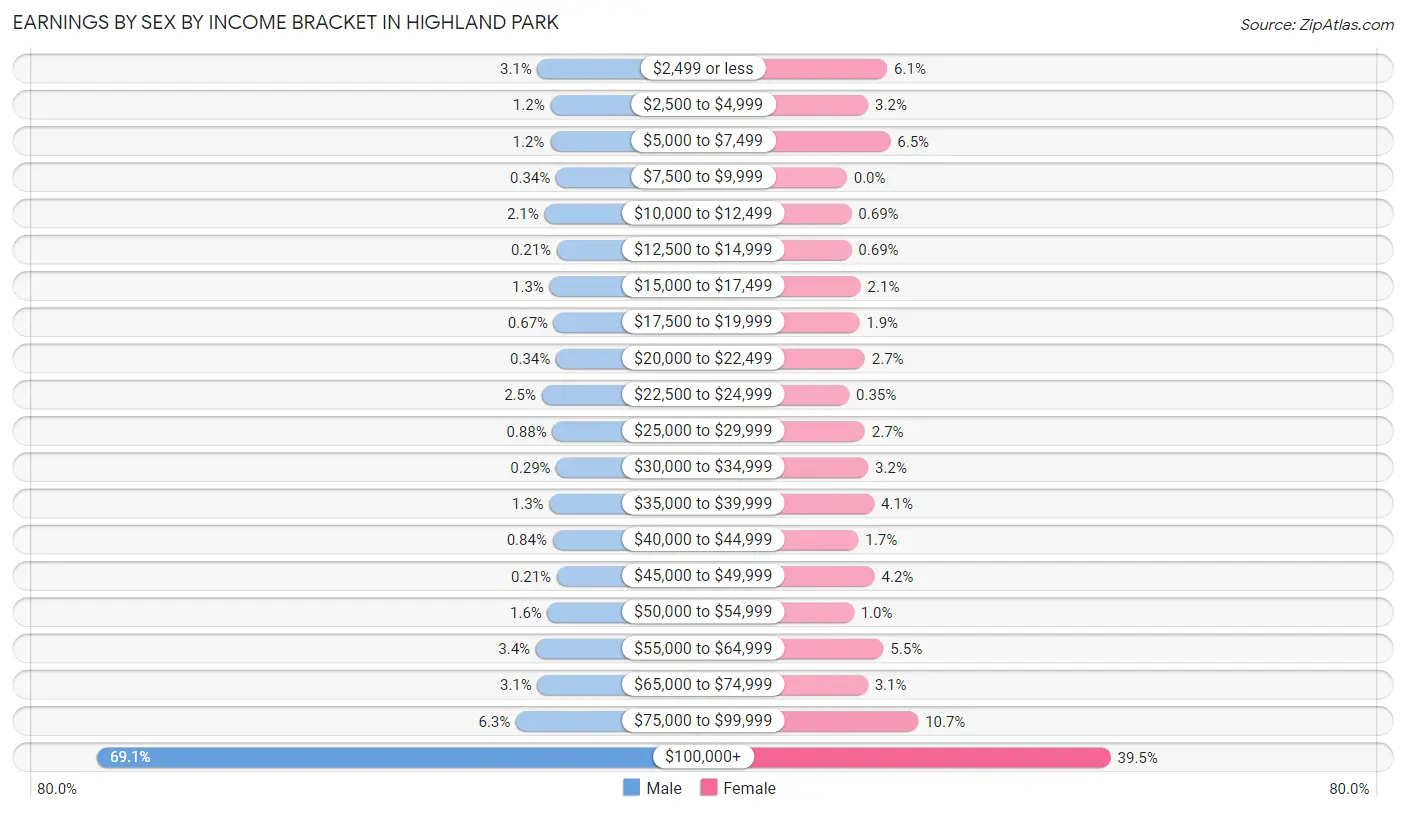
Earnings by Sex by Income Bracket in Highland Park
The most common earnings brackets in Highland Park are $100,000+ for men (1,645 | 69.1%) and $100,000+ for women (569 | 39.5%).
| Income | Male | Female |
| $2,499 or less | 74 (3.1%) | 87 (6.0%) |
| $2,500 to $4,999 | 28 (1.2%) | 46 (3.2%) |
| $5,000 to $7,499 | 29 (1.2%) | 94 (6.5%) |
| $7,500 to $9,999 | 8 (0.3%) | 0 (0.0%) |
| $10,000 to $12,499 | 49 (2.1%) | 10 (0.7%) |
| $12,500 to $14,999 | 5 (0.2%) | 10 (0.7%) |
| $15,000 to $17,499 | 31 (1.3%) | 30 (2.1%) |
| $17,500 to $19,999 | 16 (0.7%) | 27 (1.9%) |
| $20,000 to $22,499 | 8 (0.3%) | 39 (2.7%) |
| $22,500 to $24,999 | 59 (2.5%) | 5 (0.4%) |
| $25,000 to $29,999 | 21 (0.9%) | 39 (2.7%) |
| $30,000 to $34,999 | 7 (0.3%) | 46 (3.2%) |
| $35,000 to $39,999 | 32 (1.3%) | 59 (4.1%) |
| $40,000 to $44,999 | 20 (0.8%) | 25 (1.7%) |
| $45,000 to $49,999 | 5 (0.2%) | 60 (4.2%) |
| $50,000 to $54,999 | 38 (1.6%) | 15 (1.0%) |
| $55,000 to $64,999 | 80 (3.4%) | 79 (5.5%) |
| $65,000 to $74,999 | 74 (3.1%) | 45 (3.1%) |
| $75,000 to $99,999 | 151 (6.3%) | 154 (10.7%) |
| $100,000+ | 1,645 (69.1%) | 569 (39.5%) |
| Total | 2,380 (100.0%) | 1,439 (100.0%) |
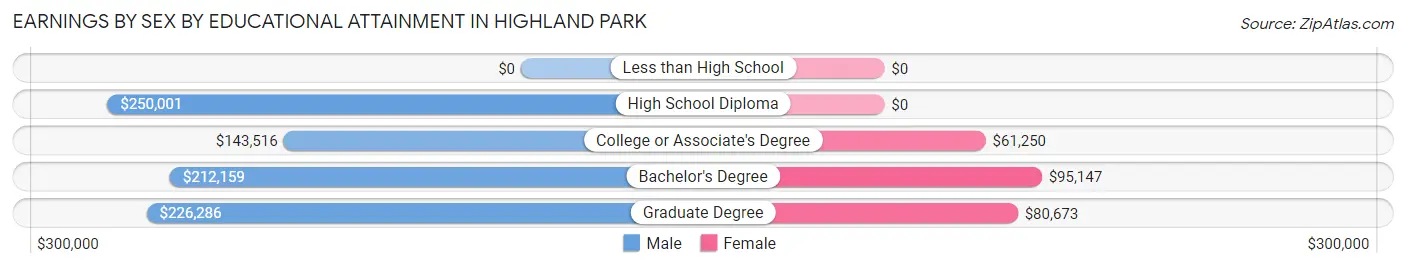
Earnings by Sex by Educational Attainment in Highland Park
Average earnings in Highland Park are $209,281 for men and $80,982 for women, a difference of 61.3%. Men with an educational attainment of high school diploma enjoy the highest average annual earnings of $250,001, while those with college or associate's degree education earn the least with $143,516. Women with an educational attainment of bachelor's degree earn the most with the average annual earnings of $95,147, while those with college or associate's degree education have the smallest earnings of $61,250.
| Educational Attainment | Male Income | Female Income |
| Less than High School | - | - |
| High School Diploma | $250,001 | $0 |
| College or Associate's Degree | $143,516 | $61,250 |
| Bachelor's Degree | $212,159 | $95,147 |
| Graduate Degree | $226,286 | $80,673 |
| Total | $209,281 | $80,982 |
Family Income in Highland Park
Family Income Brackets in Highland Park
According to the Highland Park family income data, there are 1,744 families falling into the $200,000+ income range, which is the most common income bracket and makes up 69.3% of all families. Conversely, the $10,000 to $14,999 income bracket is the least frequent group with only 10 families (0.4%) belonging to this category.
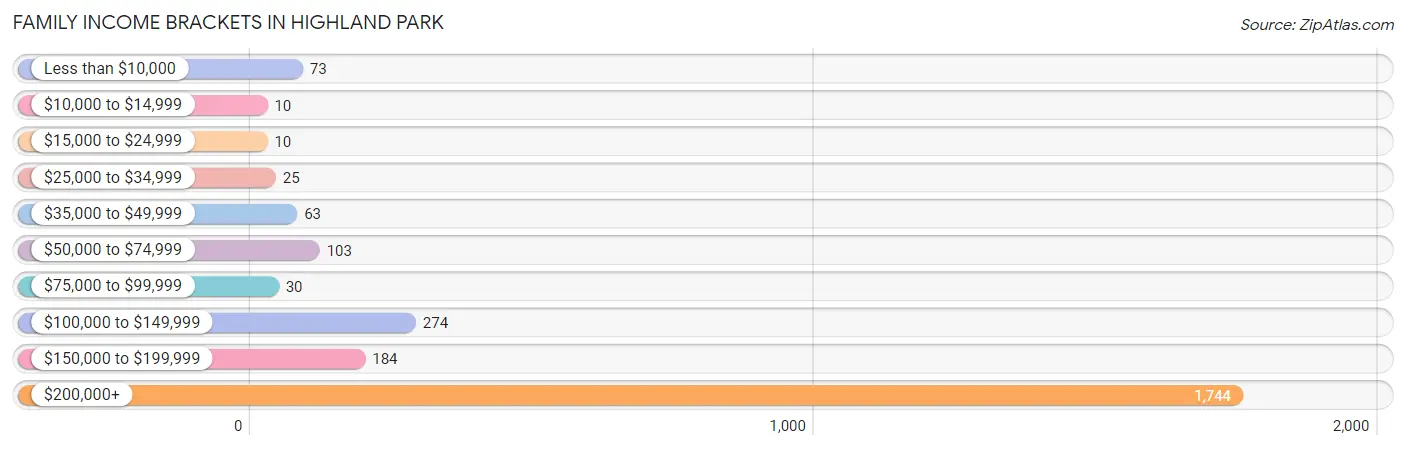
| Income Bracket | # Families | % Families |
| Less than $10,000 | 73 | 2.9% |
| $10,000 to $14,999 | 10 | 0.4% |
| $15,000 to $24,999 | 10 | 0.4% |
| $25,000 to $34,999 | 25 | 1.0% |
| $35,000 to $49,999 | 63 | 2.5% |
| $50,000 to $74,999 | 103 | 4.1% |
| $75,000 to $99,999 | 30 | 1.2% |
| $100,000 to $149,999 | 274 | 10.9% |
| $150,000 to $199,999 | 184 | 7.3% |
| $200,000+ | 1,744 | 69.3% |
Family Income by Famaliy Size in Highland Park
2-person families (1,166 | 46.3%) account for the highest median family income in Highland Park with $250,001 per family, while 2-person families (1,166 | 46.3%) have the highest median income of $125,000 per family member.
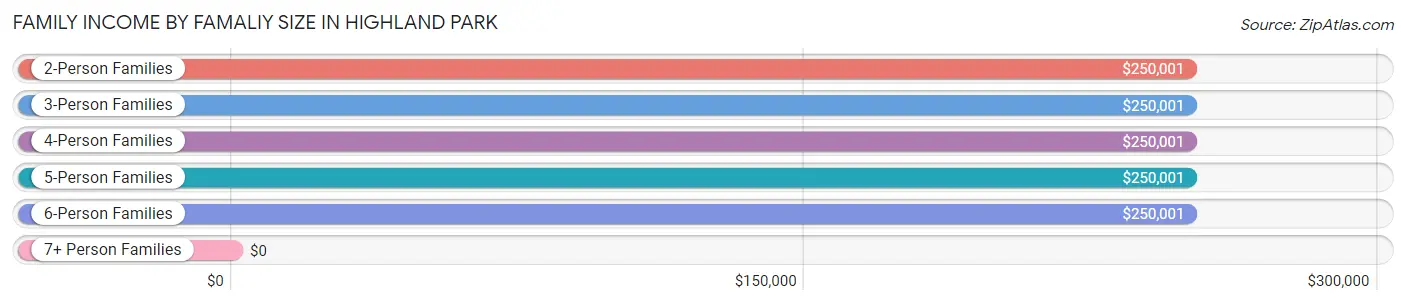
| Income Bracket | # Families | Median Income |
| 2-Person Families | 1,166 (46.3%) | $250,001 |
| 3-Person Families | 408 (16.2%) | $250,001 |
| 4-Person Families | 577 (22.9%) | $250,001 |
| 5-Person Families | 290 (11.5%) | $250,001 |
| 6-Person Families | 42 (1.7%) | $250,001 |
| 7+ Person Families | 34 (1.3%) | $0 |
| Total | 2,517 (100.0%) | $250,001 |
Family Income by Number of Earners in Highland Park
The median family income in Highland Park is $250,001, with families comprising 1 earner (1,179) having the highest median family income of $250,001, while families with no earners (360) have the lowest median family income of $105,700, accounting for 46.8% and 14.3% of families, respectively.
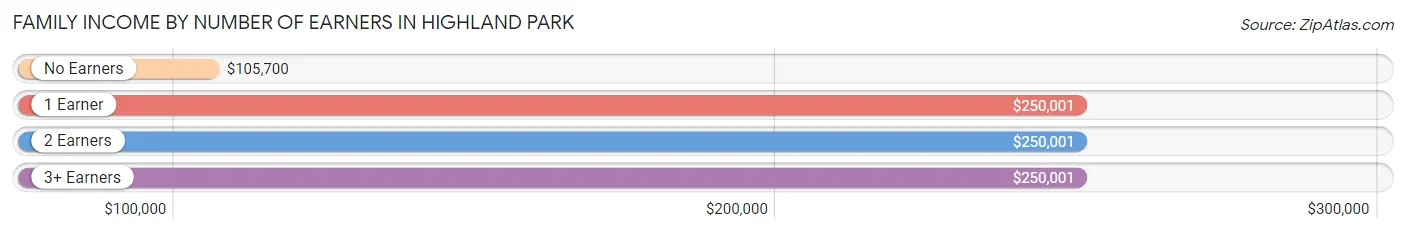
| Number of Earners | # Families | Median Income |
| No Earners | 360 (14.3%) | $105,700 |
| 1 Earner | 1,179 (46.8%) | $250,001 |
| 2 Earners | 809 (32.1%) | $250,001 |
| 3+ Earners | 169 (6.7%) | $250,001 |
| Total | 2,517 (100.0%) | $250,001 |
Household Income in Highland Park
Household Income Brackets in Highland Park
With 1,978 households falling in the category, the $200,000+ income range is the most frequent in Highland Park, accounting for 62.0% of all households. In contrast, only 29 households (0.9%) fall into the $10,000 to $14,999 income bracket, making it the least populous group.
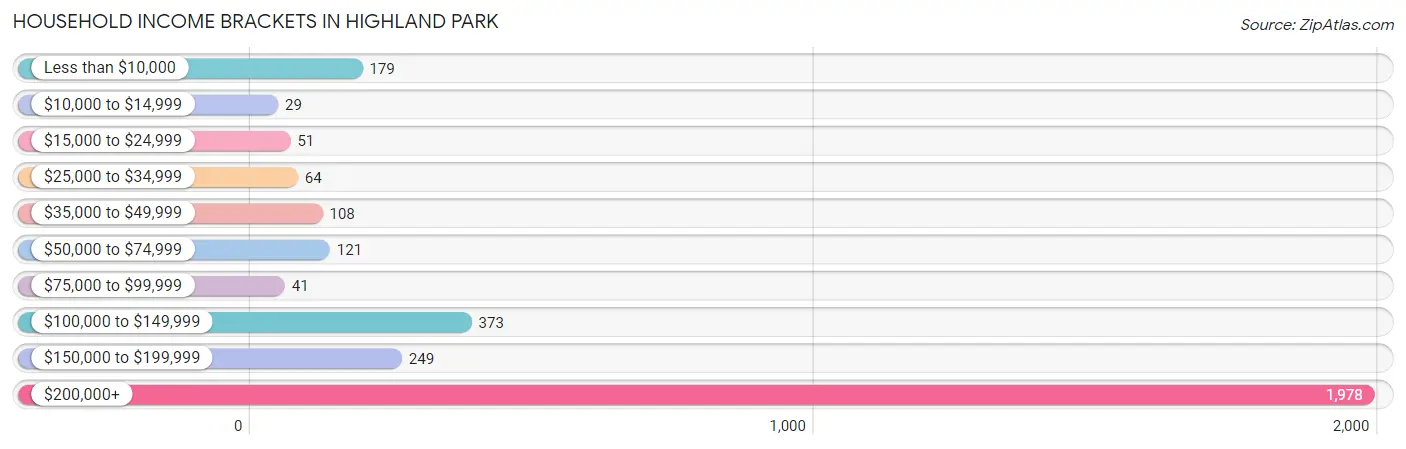
| Income Bracket | # Households | % Households |
| Less than $10,000 | 179 | 5.6% |
| $10,000 to $14,999 | 29 | 0.9% |
| $15,000 to $24,999 | 51 | 1.6% |
| $25,000 to $34,999 | 64 | 2.0% |
| $35,000 to $49,999 | 108 | 3.4% |
| $50,000 to $74,999 | 121 | 3.8% |
| $75,000 to $99,999 | 41 | 1.3% |
| $100,000 to $149,999 | 373 | 11.7% |
| $150,000 to $199,999 | 249 | 7.8% |
| $200,000+ | 1,978 | 62.0% |
Household Income by Householder Age in Highland Park
The median household income in Highland Park is $249,923, with the highest median household income of $250,001 found in the 25 to 44 years age bracket for the primary householder. A total of 833 households (26.1%) fall into this category. Meanwhile, the 15 to 24 years age bracket for the primary householder has the lowest median household income of $31,250, with 42 households (1.3%) in this group.
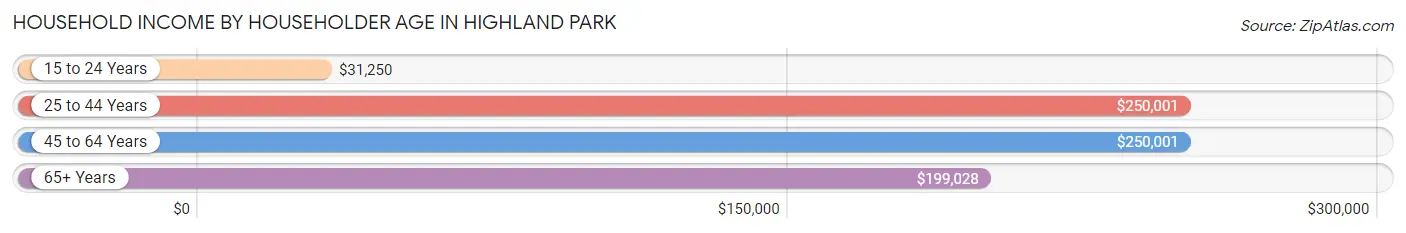
| Income Bracket | # Households | Median Income |
| 15 to 24 Years | 42 (1.3%) | $31,250 |
| 25 to 44 Years | 833 (26.1%) | $250,001 |
| 45 to 64 Years | 1,327 (41.6%) | $250,001 |
| 65+ Years | 989 (31.0%) | $199,028 |
| Total | 3,191 (100.0%) | $249,923 |
Poverty in Highland Park
Income Below Poverty by Sex and Age in Highland Park
With 3.1% poverty level for males and 8.7% for females among the residents of Highland Park, 65 to 74 year old males and under 5 year old females are the most vulnerable to poverty, with 59 males (11.9%) and 67 females (30.6%) in their respective age groups living below the poverty level.
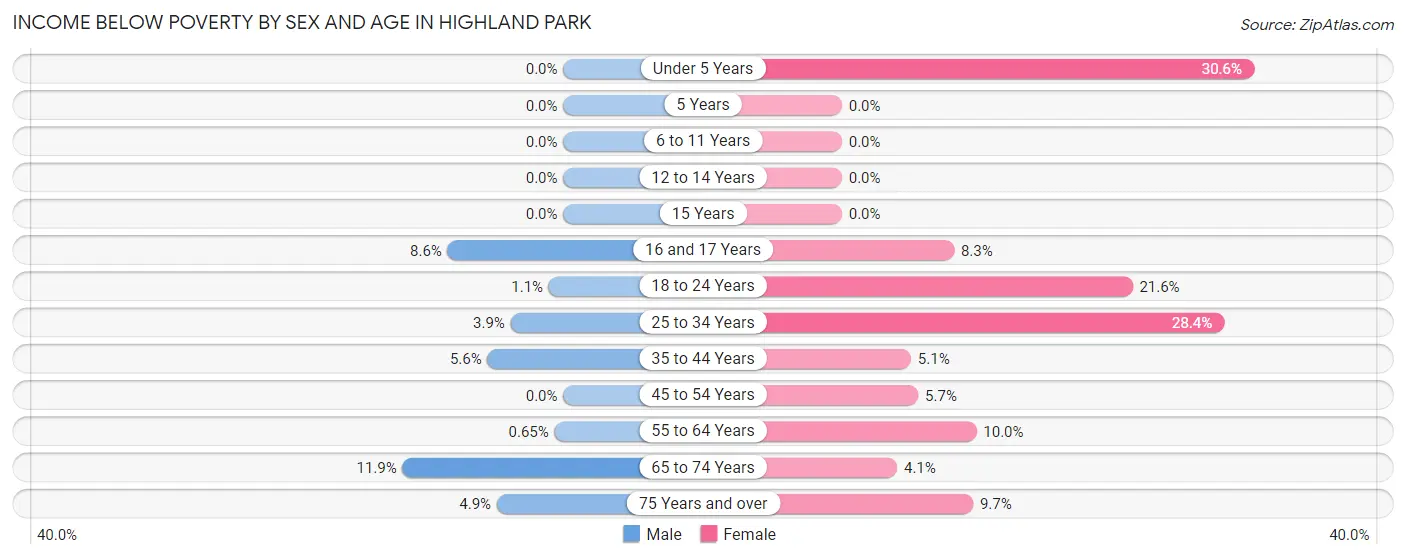
| Age Bracket | Male | Female |
| Under 5 Years | 0 (0.0%) | 67 (30.6%) |
| 5 Years | 0 (0.0%) | 0 (0.0%) |
| 6 to 11 Years | 0 (0.0%) | 0 (0.0%) |
| 12 to 14 Years | 0 (0.0%) | 0 (0.0%) |
| 15 Years | 0 (0.0%) | 0 (0.0%) |
| 16 and 17 Years | 17 (8.6%) | 8 (8.3%) |
| 18 to 24 Years | 5 (1.1%) | 30 (21.6%) |
| 25 to 34 Years | 5 (3.9%) | 63 (28.4%) |
| 35 to 44 Years | 32 (5.6%) | 33 (5.1%) |
| 45 to 54 Years | 0 (0.0%) | 33 (5.7%) |
| 55 to 64 Years | 5 (0.6%) | 82 (10.0%) |
| 65 to 74 Years | 59 (11.9%) | 18 (4.1%) |
| 75 Years and over | 15 (4.9%) | 42 (9.7%) |
| Total | 138 (3.1%) | 376 (8.7%) |
Income Above Poverty by Sex and Age in Highland Park
According to the poverty statistics in Highland Park, males aged under 5 years and females aged 5 years are the age groups that are most secure financially, with 100.0% of males and 100.0% of females in these age groups living above the poverty line.
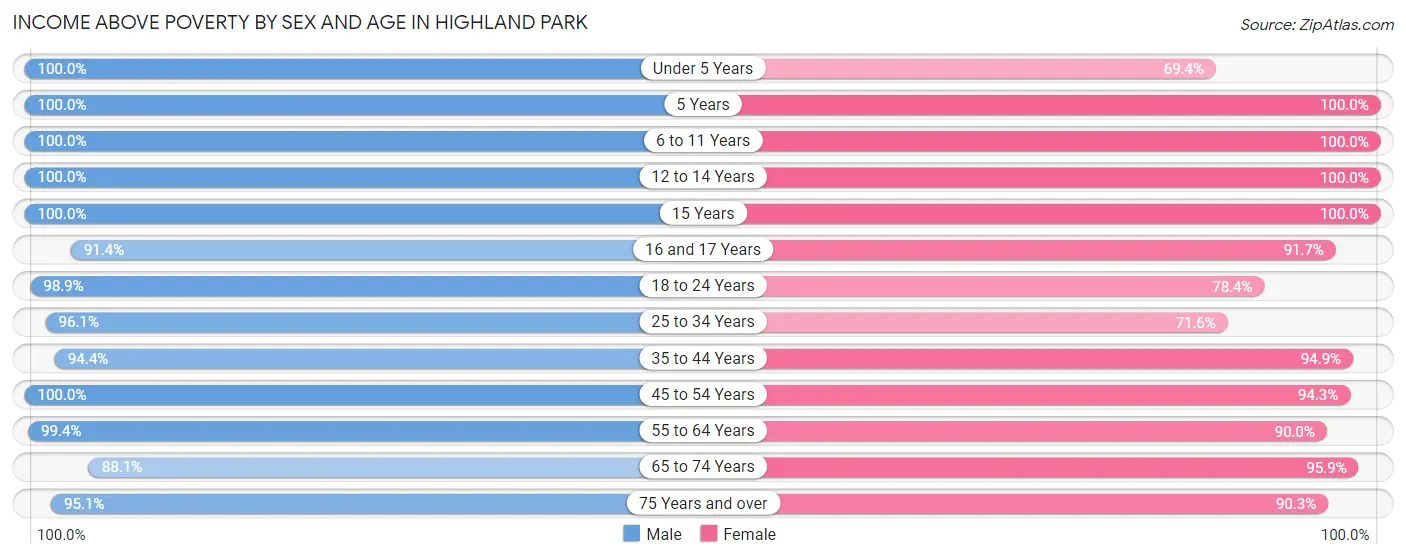
| Age Bracket | Male | Female |
| Under 5 Years | 319 (100.0%) | 152 (69.4%) |
| 5 Years | 53 (100.0%) | 71 (100.0%) |
| 6 to 11 Years | 377 (100.0%) | 433 (100.0%) |
| 12 to 14 Years | 217 (100.0%) | 211 (100.0%) |
| 15 Years | 112 (100.0%) | 22 (100.0%) |
| 16 and 17 Years | 181 (91.4%) | 88 (91.7%) |
| 18 to 24 Years | 462 (98.9%) | 109 (78.4%) |
| 25 to 34 Years | 123 (96.1%) | 159 (71.6%) |
| 35 to 44 Years | 536 (94.4%) | 610 (94.9%) |
| 45 to 54 Years | 508 (100.0%) | 549 (94.3%) |
| 55 to 64 Years | 761 (99.4%) | 739 (90.0%) |
| 65 to 74 Years | 435 (88.1%) | 421 (95.9%) |
| 75 Years and over | 289 (95.1%) | 389 (90.3%) |
| Total | 4,373 (96.9%) | 3,953 (91.3%) |
Income Below Poverty Among Married-Couple Families in Highland Park
The poverty statistics for married-couple families in Highland Park show that 3.4% or 79 of the total 2,338 families live below the poverty line. Families with 1 or 2 children have the highest poverty rate of 5.7%, comprising of 49 families. On the other hand, families with 3 or 4 children have the lowest poverty rate of 0.0%, which includes 0 families.
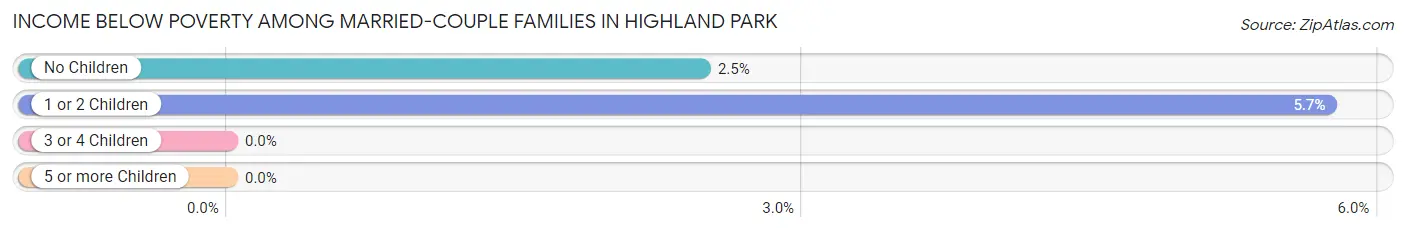
| Children | Above Poverty | Below Poverty |
| No Children | 1,185 (97.5%) | 30 (2.5%) |
| 1 or 2 Children | 804 (94.3%) | 49 (5.7%) |
| 3 or 4 Children | 270 (100.0%) | 0 (0.0%) |
| 5 or more Children | 0 (0.0%) | 0 (0.0%) |
| Total | 2,259 (96.6%) | 79 (3.4%) |
Income Below Poverty Among Single-Parent Households in Highland Park
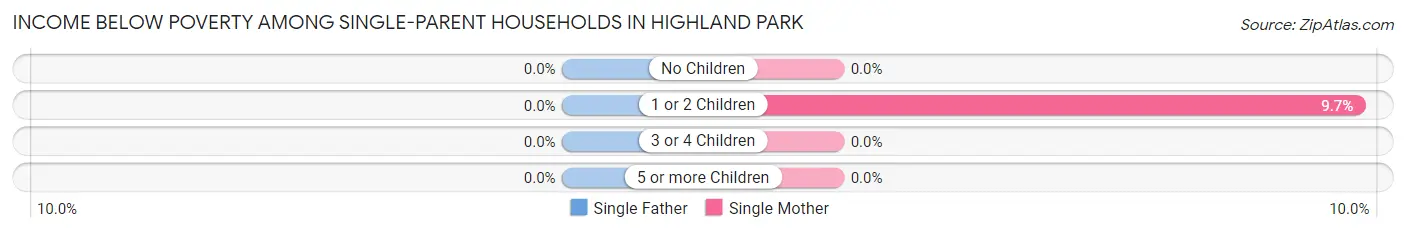
| Children | Single Father | Single Mother |
| No Children | 0 (0.0%) | 0 (0.0%) |
| 1 or 2 Children | 0 (0.0%) | 10 (9.7%) |
| 3 or 4 Children | 0 (0.0%) | 0 (0.0%) |
| 5 or more Children | 0 (0.0%) | 0 (0.0%) |
| Total | 0 (0.0%) | 10 (7.9%) |
Income Below Poverty Among Married-Couple vs Single-Parent Households in Highland Park
The poverty data for Highland Park shows that 79 of the married-couple family households (3.4%) and 10 of the single-parent households (5.6%) are living below the poverty level. Within the married-couple family households, those with 1 or 2 children have the highest poverty rate, with 49 households (5.7%) falling below the poverty line. Among the single-parent households, those with 1 or 2 children have the highest poverty rate, with 10 household (6.6%) living below poverty.

| Children | Married-Couple Families | Single-Parent Households |
| No Children | 30 (2.5%) | 0 (0.0%) |
| 1 or 2 Children | 49 (5.7%) | 10 (6.6%) |
| 3 or 4 Children | 0 (0.0%) | 0 (0.0%) |
| 5 or more Children | 0 (0.0%) | 0 (0.0%) |
| Total | 79 (3.4%) | 10 (5.6%) |
Race in Highland Park
The most populous races in Highland Park are White / Caucasian (8,069 | 91.3%), Asian (454 | 5.1%), and Hispanic or Latino (349 | 4.0%).
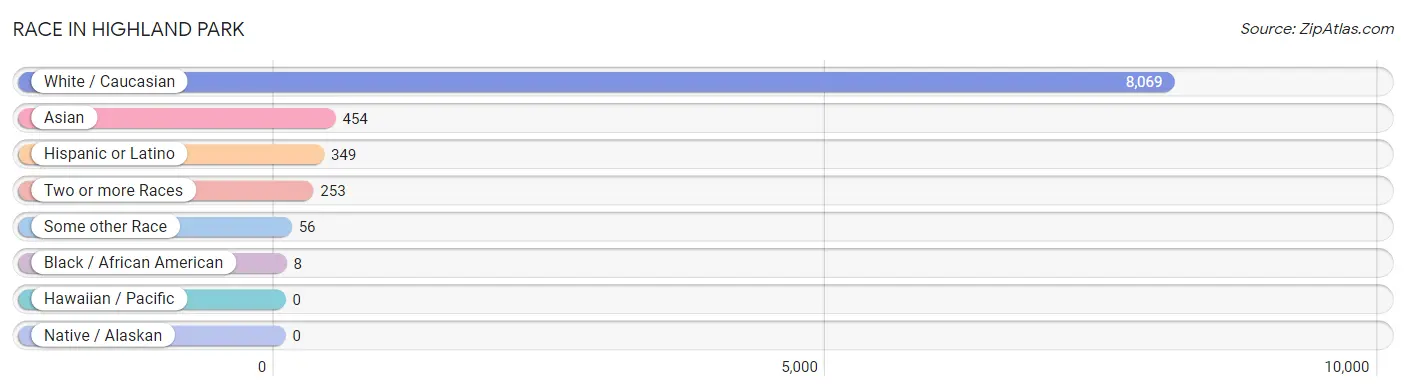
| Race | # Population | % Population |
| Asian | 454 | 5.1% |
| Black / African American | 8 | 0.1% |
| Hawaiian / Pacific | 0 | 0.0% |
| Hispanic or Latino | 349 | 4.0% |
| Native / Alaskan | 0 | 0.0% |
| White / Caucasian | 8,069 | 91.3% |
| Two or more Races | 253 | 2.9% |
| Some other Race | 56 | 0.6% |
| Total | 8,840 | 100.0% |
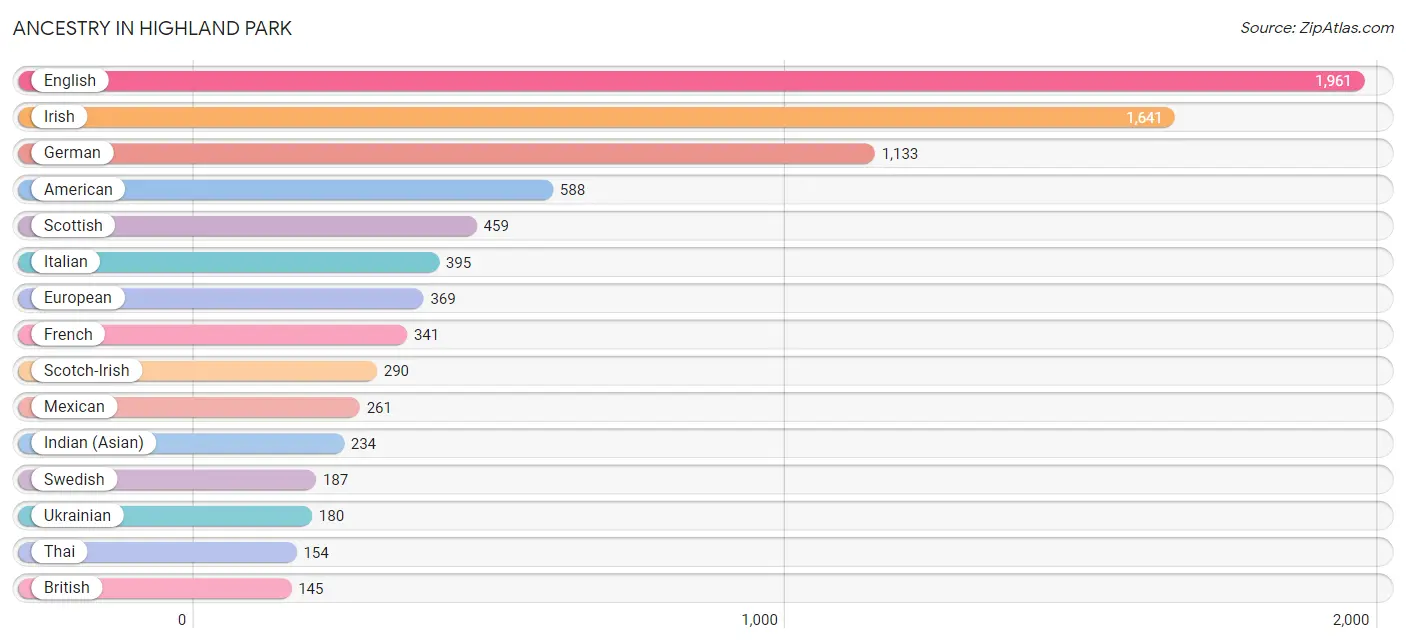
Ancestry in Highland Park
The most populous ancestries reported in Highland Park are English (1,961 | 22.2%), Irish (1,641 | 18.6%), German (1,133 | 12.8%), American (588 | 6.7%), and Scottish (459 | 5.2%), together accounting for 65.4% of all Highland Park residents.
| Ancestry | # Population | % Population |
| Alsatian | 9 | 0.1% |
| American | 588 | 6.7% |
| Arab | 83 | 0.9% |
| Australian | 25 | 0.3% |
| Austrian | 67 | 0.8% |
| Belgian | 16 | 0.2% |
| Bhutanese | 56 | 0.6% |
| British | 145 | 1.6% |
| Burmese | 15 | 0.2% |
| Canadian | 15 | 0.2% |
| Colombian | 40 | 0.4% |
| Croatian | 40 | 0.4% |
| Cuban | 14 | 0.2% |
| Czech | 11 | 0.1% |
| Czechoslovakian | 11 | 0.1% |
| Danish | 21 | 0.2% |
| Dutch | 87 | 1.0% |
| Eastern European | 37 | 0.4% |
| Egyptian | 10 | 0.1% |
| English | 1,961 | 22.2% |
| Estonian | 7 | 0.1% |
| European | 369 | 4.2% |
| Filipino | 23 | 0.3% |
| Finnish | 9 | 0.1% |
| French | 341 | 3.9% |
| French Canadian | 22 | 0.3% |
| German | 1,133 | 12.8% |
| Greek | 15 | 0.2% |
| Hungarian | 20 | 0.2% |
| Indian (Asian) | 234 | 2.6% |
| Iranian | 6 | 0.1% |
| Irish | 1,641 | 18.6% |
| Italian | 395 | 4.5% |
| Korean | 15 | 0.2% |
| Lebanese | 62 | 0.7% |
| Lithuanian | 10 | 0.1% |
| Mexican | 261 | 2.9% |
| Mongolian | 6 | 0.1% |
| Northern European | 74 | 0.8% |
| Norwegian | 34 | 0.4% |
| Polish | 109 | 1.2% |
| Puerto Rican | 16 | 0.2% |
| Romanian | 6 | 0.1% |
| Russian | 82 | 0.9% |
| Scandinavian | 9 | 0.1% |
| Scotch-Irish | 290 | 3.3% |
| Scottish | 459 | 5.2% |
| Sioux | 2 | 0.0% |
| South American | 40 | 0.4% |
| Spanish | 18 | 0.2% |
| Sri Lankan | 11 | 0.1% |
| Swedish | 187 | 2.1% |
| Swiss | 69 | 0.8% |
| Thai | 154 | 1.7% |
| Ukrainian | 180 | 2.0% |
| Welsh | 54 | 0.6% | View All 56 Rows |
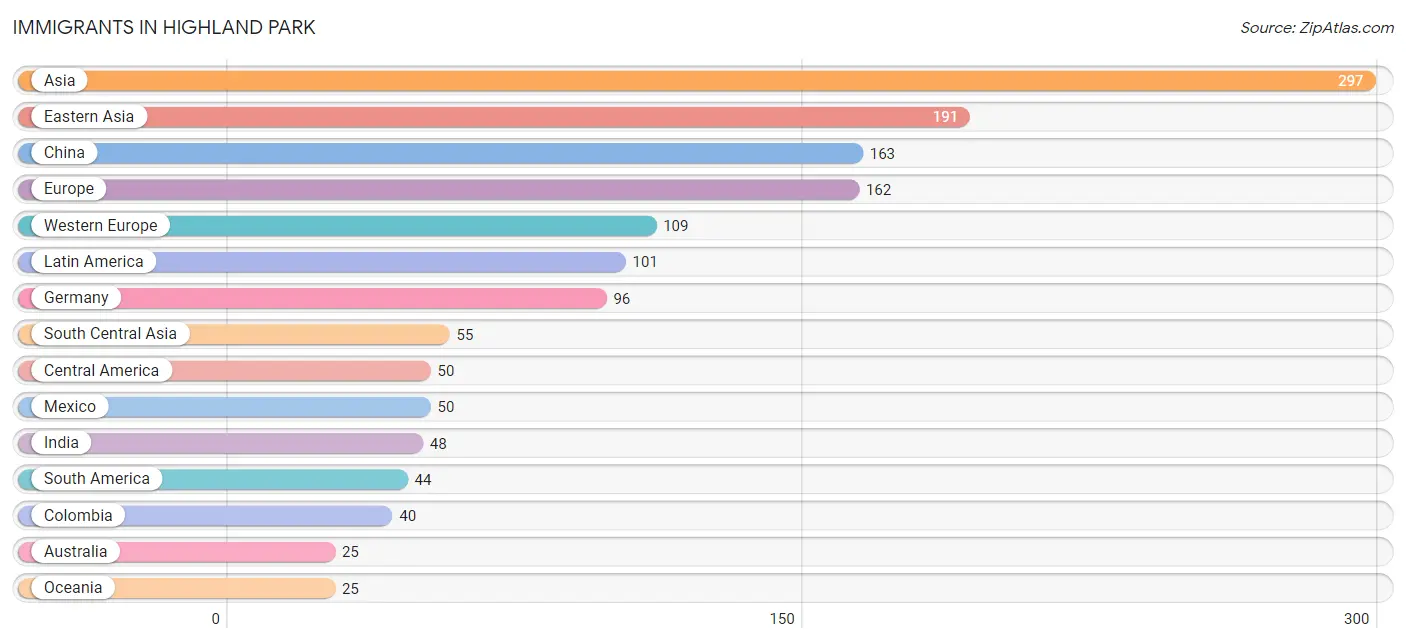
Immigrants in Highland Park
The most numerous immigrant groups reported in Highland Park came from Asia (297 | 3.4%), Eastern Asia (191 | 2.2%), China (163 | 1.8%), Europe (162 | 1.8%), and Western Europe (109 | 1.2%), together accounting for 10.4% of all Highland Park residents.
| Immigration Origin | # Population | % Population |
| Africa | 10 | 0.1% |
| Asia | 297 | 3.4% |
| Australia | 25 | 0.3% |
| Austria | 5 | 0.1% |
| Brazil | 4 | 0.1% |
| Canada | 11 | 0.1% |
| Caribbean | 7 | 0.1% |
| Central America | 50 | 0.6% |
| China | 163 | 1.8% |
| Colombia | 40 | 0.4% |
| Cuba | 7 | 0.1% |
| Eastern Asia | 191 | 2.2% |
| Eastern Europe | 24 | 0.3% |
| Egypt | 10 | 0.1% |
| England | 8 | 0.1% |
| Europe | 162 | 1.8% |
| Germany | 96 | 1.1% |
| Greece | 5 | 0.1% |
| Hong Kong | 16 | 0.2% |
| India | 48 | 0.5% |
| Japan | 22 | 0.3% |
| Korea | 6 | 0.1% |
| Latin America | 101 | 1.1% |
| Latvia | 7 | 0.1% |
| Malaysia | 6 | 0.1% |
| Mexico | 50 | 0.6% |
| Netherlands | 8 | 0.1% |
| Northern Africa | 10 | 0.1% |
| Northern Europe | 24 | 0.3% |
| Oceania | 25 | 0.3% |
| Pakistan | 3 | 0.0% |
| Philippines | 5 | 0.1% |
| Poland | 6 | 0.1% |
| South America | 44 | 0.5% |
| South Central Asia | 55 | 0.6% |
| South Eastern Asia | 22 | 0.3% |
| Southern Europe | 5 | 0.1% |
| Sweden | 10 | 0.1% |
| Turkey | 18 | 0.2% |
| Ukraine | 7 | 0.1% |
| Vietnam | 11 | 0.1% |
| Western Asia | 18 | 0.2% |
| Western Europe | 109 | 1.2% | View All 43 Rows |
Sex and Age in Highland Park
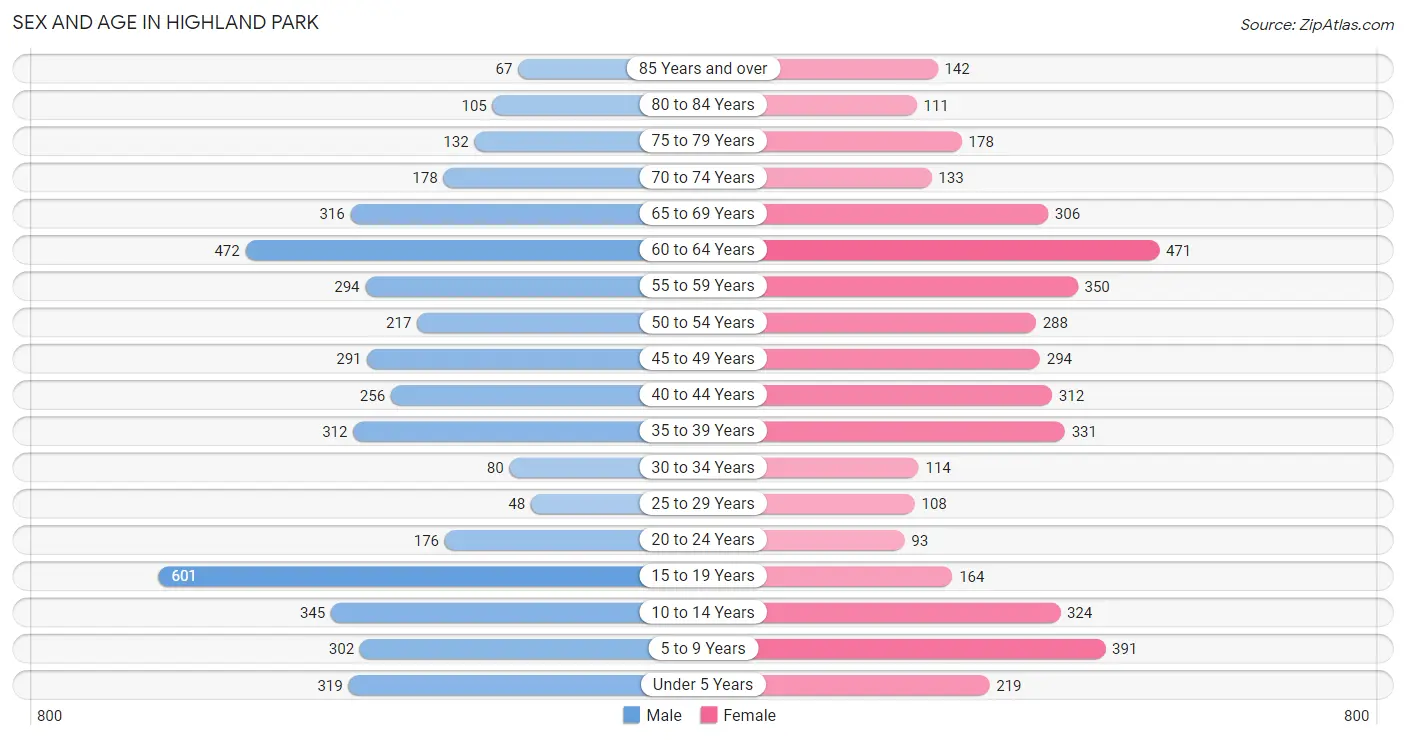
Sex and Age in Highland Park
The most populous age groups in Highland Park are 15 to 19 Years (601 | 13.3%) for men and 60 to 64 Years (471 | 10.9%) for women.
| Age Bracket | Male | Female |
| Under 5 Years | 319 (7.1%) | 219 (5.1%) |
| 5 to 9 Years | 302 (6.7%) | 391 (9.0%) |
| 10 to 14 Years | 345 (7.6%) | 324 (7.5%) |
| 15 to 19 Years | 601 (13.3%) | 164 (3.8%) |
| 20 to 24 Years | 176 (3.9%) | 93 (2.1%) |
| 25 to 29 Years | 48 (1.1%) | 108 (2.5%) |
| 30 to 34 Years | 80 (1.8%) | 114 (2.6%) |
| 35 to 39 Years | 312 (6.9%) | 331 (7.6%) |
| 40 to 44 Years | 256 (5.7%) | 312 (7.2%) |
| 45 to 49 Years | 291 (6.5%) | 294 (6.8%) |
| 50 to 54 Years | 217 (4.8%) | 288 (6.7%) |
| 55 to 59 Years | 294 (6.5%) | 350 (8.1%) |
| 60 to 64 Years | 472 (10.5%) | 471 (10.9%) |
| 65 to 69 Years | 316 (7.0%) | 306 (7.1%) |
| 70 to 74 Years | 178 (4.0%) | 133 (3.1%) |
| 75 to 79 Years | 132 (2.9%) | 178 (4.1%) |
| 80 to 84 Years | 105 (2.3%) | 111 (2.6%) |
| 85 Years and over | 67 (1.5%) | 142 (3.3%) |
| Total | 4,511 (100.0%) | 4,329 (100.0%) |
Families and Households in Highland Park
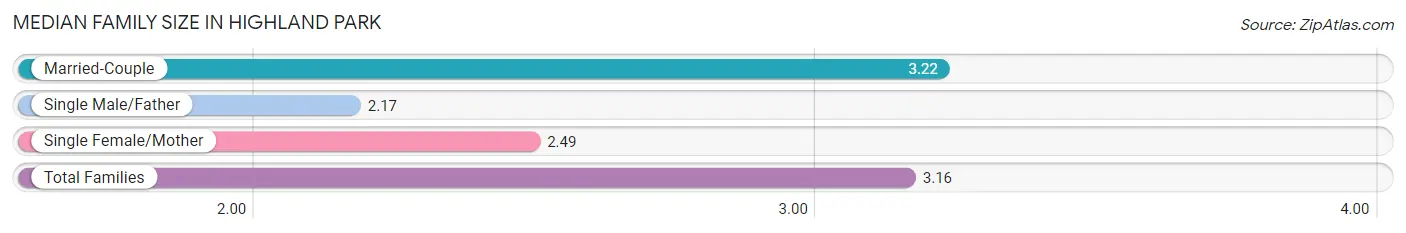
Median Family Size in Highland Park
The median family size in Highland Park is 3.16 persons per family, with married-couple families (2,338 | 92.9%) accounting for the largest median family size of 3.22 persons per family. On the other hand, single male/father families (53 | 2.1%) represent the smallest median family size with 2.17 persons per family.
| Family Type | # Families | Family Size |
| Married-Couple | 2,338 (92.9%) | 3.22 |
| Single Male/Father | 53 (2.1%) | 2.17 |
| Single Female/Mother | 126 (5.0%) | 2.49 |
| Total Families | 2,517 (100.0%) | 3.16 |
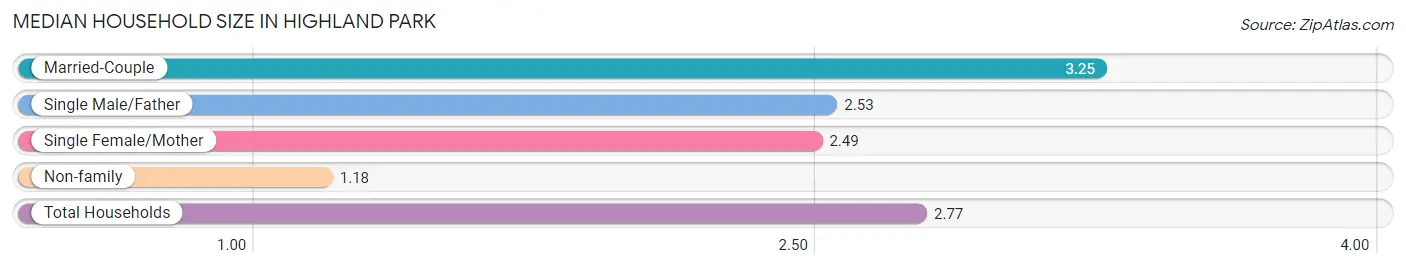
Median Household Size in Highland Park
The median household size in Highland Park is 2.77 persons per household, with married-couple households (2,338 | 73.3%) accounting for the largest median household size of 3.25 persons per household. non-family households (674 | 21.1%) represent the smallest median household size with 1.18 persons per household.
| Household Type | # Households | Household Size |
| Married-Couple | 2,338 (73.3%) | 3.25 |
| Single Male/Father | 53 (1.7%) | 2.53 |
| Single Female/Mother | 126 (4.0%) | 2.49 |
| Non-family | 674 (21.1%) | 1.18 |
| Total Households | 3,191 (100.0%) | 2.77 |
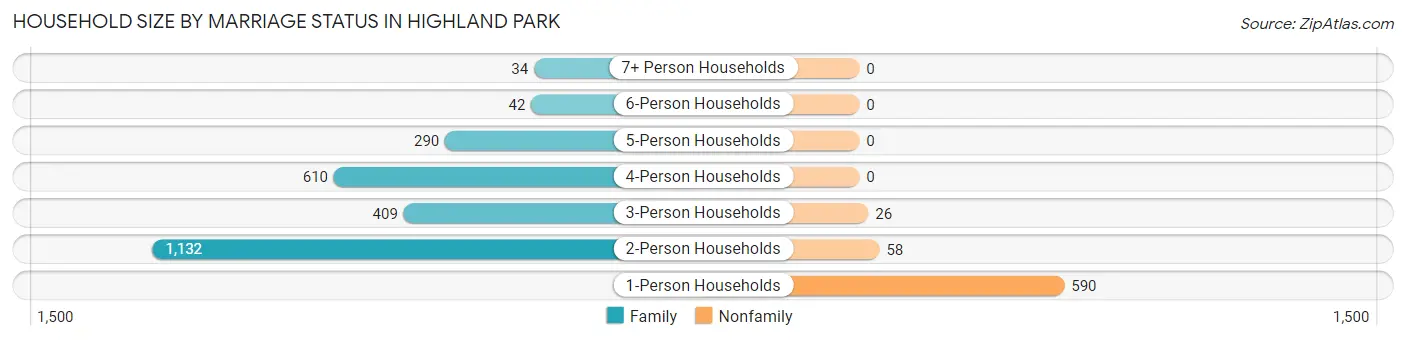
Household Size by Marriage Status in Highland Park
Out of a total of 3,191 households in Highland Park, 2,517 (78.9%) are family households, while 674 (21.1%) are nonfamily households. The most numerous type of family households are 2-person households, comprising 1,132, and the most common type of nonfamily households are 1-person households, comprising 590.
| Household Size | Family Households | Nonfamily Households |
| 1-Person Households | - | 590 (18.5%) |
| 2-Person Households | 1,132 (35.5%) | 58 (1.8%) |
| 3-Person Households | 409 (12.8%) | 26 (0.8%) |
| 4-Person Households | 610 (19.1%) | 0 (0.0%) |
| 5-Person Households | 290 (9.1%) | 0 (0.0%) |
| 6-Person Households | 42 (1.3%) | 0 (0.0%) |
| 7+ Person Households | 34 (1.1%) | 0 (0.0%) |
| Total | 2,517 (78.9%) | 674 (21.1%) |
Female Fertility in Highland Park
Fertility by Age in Highland Park
Average fertility rate in Highland Park is 45.0 births per 1,000 women. Women in the age bracket of 20 to 34 years have the highest fertility rate with 149.0 births per 1,000 women. Women in the age bracket of 20 to 34 years acount for 72.3% of all women with births.
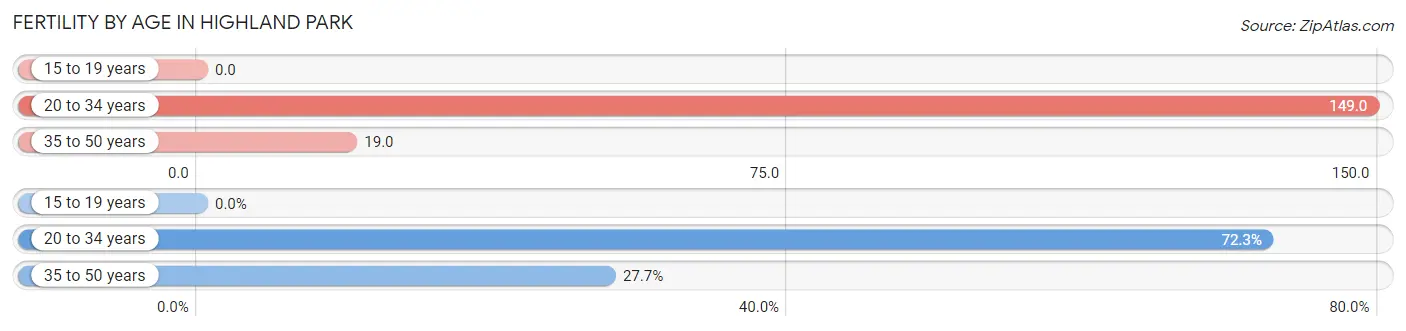
| Age Bracket | Women with Births | Births / 1,000 Women |
| 15 to 19 years | 0 (0.0%) | 0.0 |
| 20 to 34 years | 47 (72.3%) | 149.0 |
| 35 to 50 years | 18 (27.7%) | 19.0 |
| Total | 65 (100.0%) | 45.0 |
Fertility by Age by Marriage Status in Highland Park
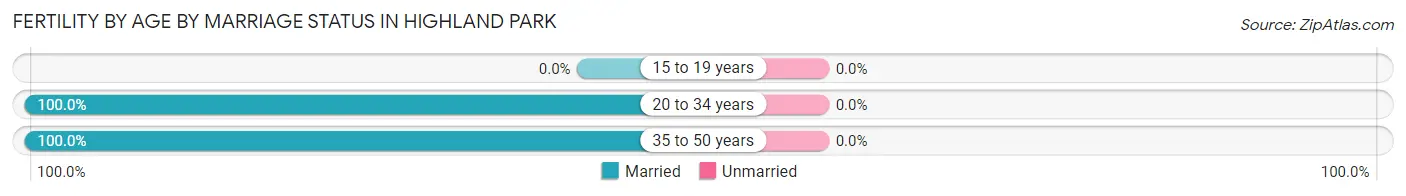
| Age Bracket | Married | Unmarried |
| 15 to 19 years | 0 (0.0%) | 0 (0.0%) |
| 20 to 34 years | 47 (100.0%) | 0 (0.0%) |
| 35 to 50 years | 18 (100.0%) | 0 (0.0%) |
| Total | 65 (100.0%) | 0 (0.0%) |
Fertility by Education in Highland Park
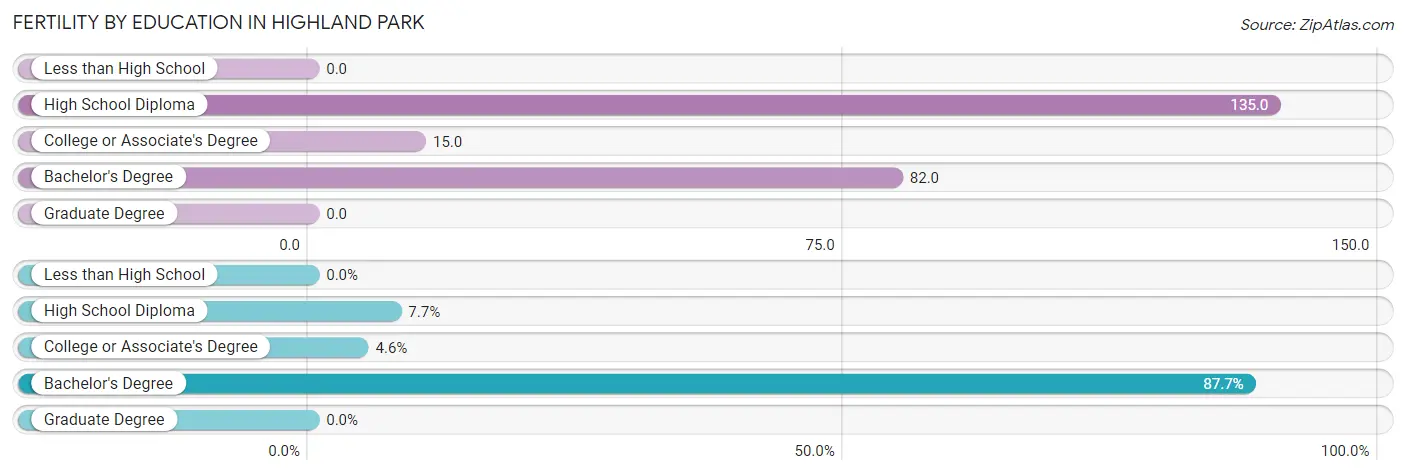
| Educational Attainment | Women with Births | Births / 1,000 Women |
| Less than High School | 0 (0.0%) | 0.0 |
| High School Diploma | 5 (7.7%) | 135.0 |
| College or Associate's Degree | 3 (4.6%) | 15.0 |
| Bachelor's Degree | 57 (87.7%) | 82.0 |
| Graduate Degree | 0 (0.0%) | 0.0 |
| Total | 65 (100.0%) | 45.0 |
Fertility by Education by Marriage Status in Highland Park
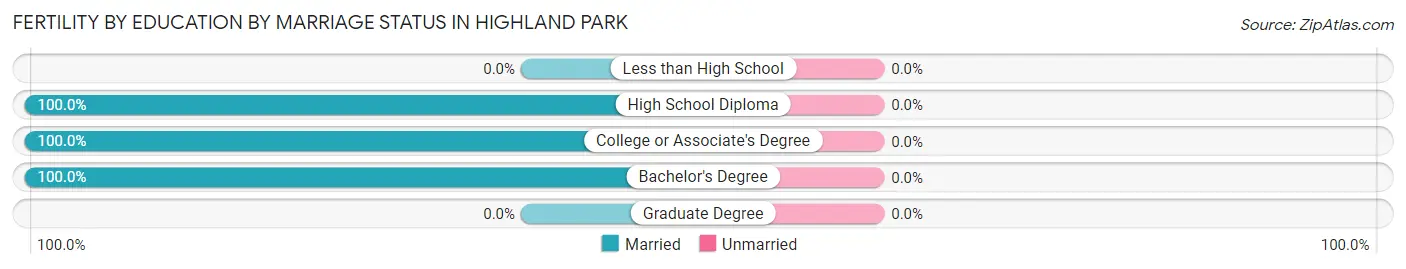
| Educational Attainment | Married | Unmarried |
| Less than High School | 0 (0.0%) | 0 (0.0%) |
| High School Diploma | 5 (100.0%) | 0 (0.0%) |
| College or Associate's Degree | 3 (100.0%) | 0 (0.0%) |
| Bachelor's Degree | 57 (100.0%) | 0 (0.0%) |
| Graduate Degree | 0 (0.0%) | 0 (0.0%) |
| Total | 65 (100.0%) | 0 (0.0%) |
Employment Characteristics in Highland Park
Employment by Class of Employer in Highland Park
Among the 3,559 employed individuals in Highland Park, private company employees (2,191 | 61.6%), self-employed (incorporated) (586 | 16.5%), and self-employed (not incorporated) (373 | 10.5%) make up the most common classes of employment.
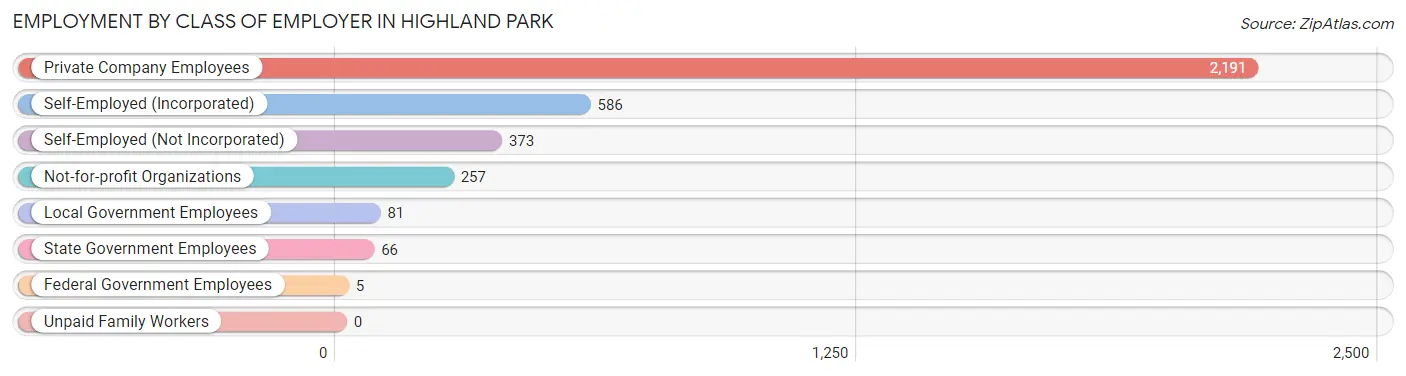
| Employer Class | # Employees | % Employees |
| Private Company Employees | 2,191 | 61.6% |
| Self-Employed (Incorporated) | 586 | 16.5% |
| Self-Employed (Not Incorporated) | 373 | 10.5% |
| Not-for-profit Organizations | 257 | 7.2% |
| Local Government Employees | 81 | 2.3% |
| State Government Employees | 66 | 1.8% |
| Federal Government Employees | 5 | 0.1% |
| Unpaid Family Workers | 0 | 0.0% |
| Total | 3,559 | 100.0% |
Employment Status by Age in Highland Park
According to the labor force statistics for Highland Park, out of the total population over 16 years of age (6,806), 55.5% or 3,777 individuals are in the labor force, with 4.8% or 181 of them unemployed. The age group with the highest labor force participation rate is 30 to 34 years, with 97.9% or 190 individuals in the labor force. Within the labor force, the 20 to 24 years age range has the highest percentage of unemployed individuals, with 43.2% or 101 of them being unemployed.
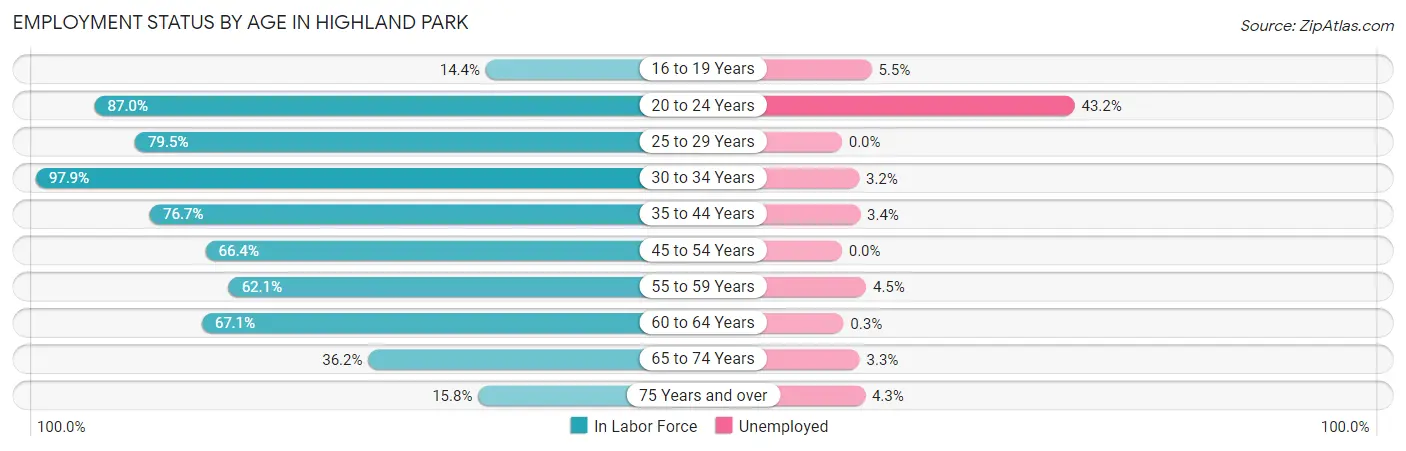
| Age Bracket | In Labor Force | Unemployed |
| 16 to 19 Years | 91 (14.4%) | 5 (5.5%) |
| 20 to 24 Years | 234 (87.0%) | 101 (43.2%) |
| 25 to 29 Years | 124 (79.5%) | 0 (0.0%) |
| 30 to 34 Years | 190 (97.9%) | 6 (3.2%) |
| 35 to 44 Years | 929 (76.7%) | 32 (3.4%) |
| 45 to 54 Years | 724 (66.4%) | 0 (0.0%) |
| 55 to 59 Years | 400 (62.1%) | 18 (4.5%) |
| 60 to 64 Years | 633 (67.1%) | 2 (0.3%) |
| 65 to 74 Years | 338 (36.2%) | 11 (3.3%) |
| 75 Years and over | 116 (15.8%) | 5 (4.3%) |
| Total | 3,777 (55.5%) | 181 (4.8%) |
Employment Status by Educational Attainment in Highland Park
According to labor force statistics for Highland Park, 70.8% of individuals (3,001) out of the total population between 25 and 64 years of age (4,238) are in the labor force, with 1.9% or 57 of them being unemployed. The group with the highest labor force participation rate are those with the educational attainment of high school diploma, with 73.5% or 72 individuals in the labor force. Within the labor force, individuals with bachelor's degree or higher education have the highest percentage of unemployment, with 2.2% or 58 of them being unemployed.
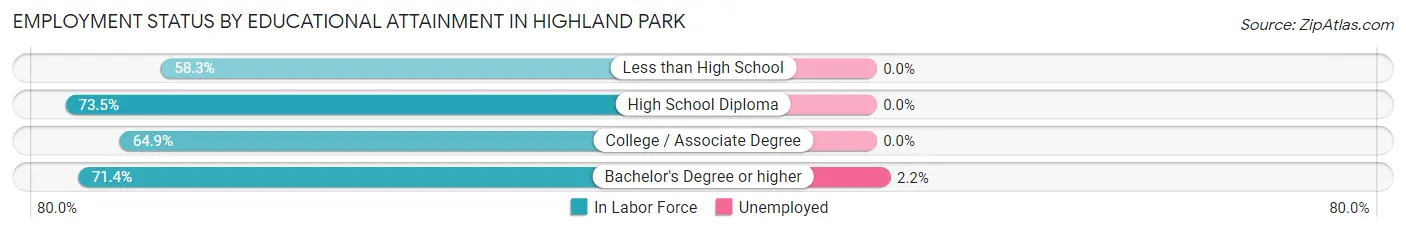
| Educational Attainment | In Labor Force | Unemployed |
| Less than High School | 7 (58.3%) | 0 (0.0%) |
| High School Diploma | 72 (73.5%) | 0 (0.0%) |
| College / Associate Degree | 268 (64.9%) | 0 (0.0%) |
| Bachelor's Degree or higher | 2,653 (71.4%) | 82 (2.2%) |
| Total | 3,001 (70.8%) | 81 (1.9%) |
Employment Occupations by Sex in Highland Park
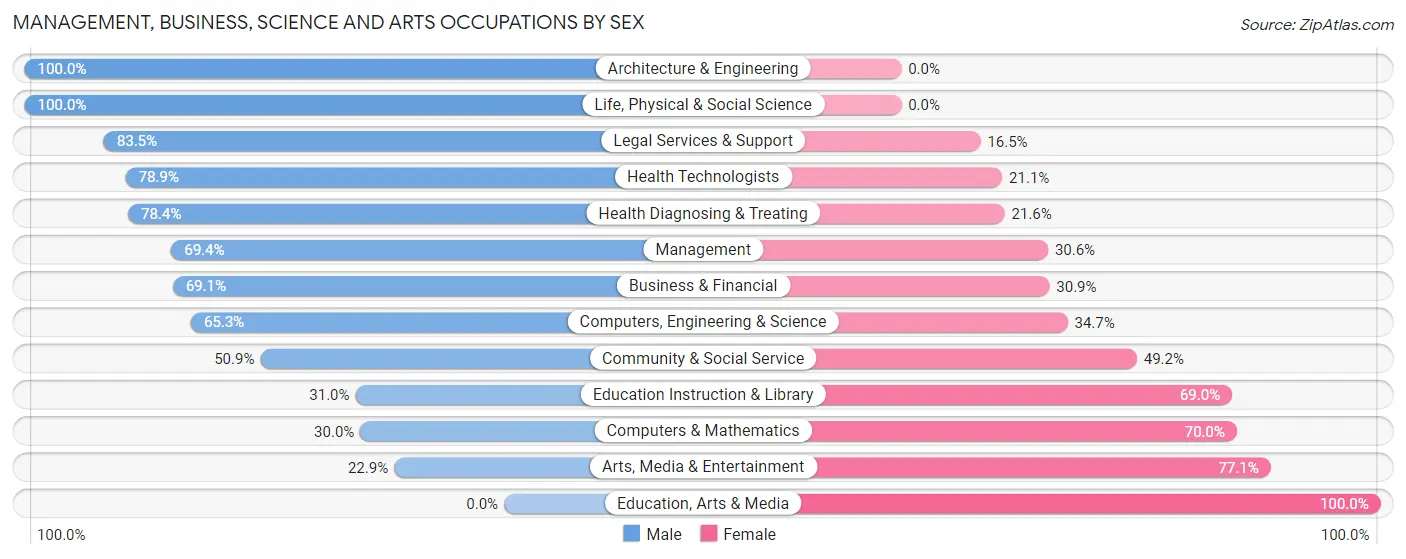
Management, Business, Science and Arts Occupations
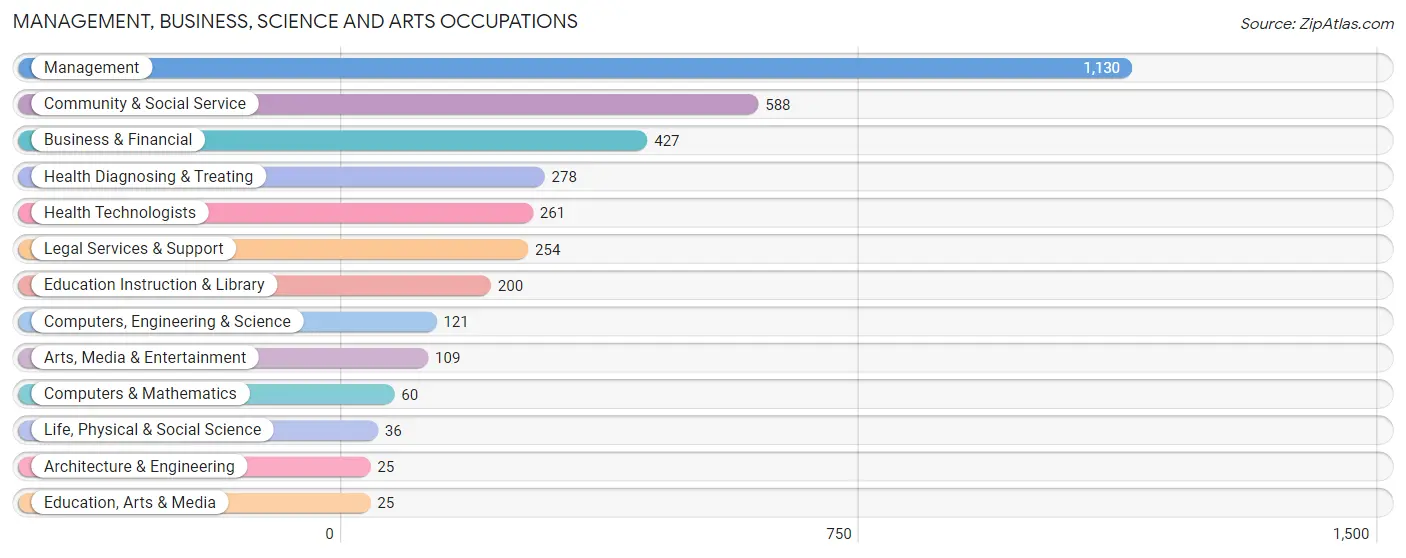
The most common Management, Business, Science and Arts occupations in Highland Park are Management (1,130 | 31.4%), Community & Social Service (588 | 16.3%), Business & Financial (427 | 11.9%), Health Diagnosing & Treating (278 | 7.7%), and Health Technologists (261 | 7.2%).
Management, Business, Science and Arts Occupations by Sex
Within the Management, Business, Science and Arts occupations in Highland Park, the most male-oriented occupations are Architecture & Engineering (100.0%), Life, Physical & Social Science (100.0%), and Legal Services & Support (83.5%), while the most female-oriented occupations are Education, Arts & Media (100.0%), Arts, Media & Entertainment (77.1%), and Computers & Mathematics (70.0%).
| Occupation | Male | Female |
| Management | 784 (69.4%) | 346 (30.6%) |
| Business & Financial | 295 (69.1%) | 132 (30.9%) |
| Computers, Engineering & Science | 79 (65.3%) | 42 (34.7%) |
| Computers & Mathematics | 18 (30.0%) | 42 (70.0%) |
| Architecture & Engineering | 25 (100.0%) | 0 (0.0%) |
| Life, Physical & Social Science | 36 (100.0%) | 0 (0.0%) |
| Community & Social Service | 299 (50.8%) | 289 (49.1%) |
| Education, Arts & Media | 0 (0.0%) | 25 (100.0%) |
| Legal Services & Support | 212 (83.5%) | 42 (16.5%) |
| Education Instruction & Library | 62 (31.0%) | 138 (69.0%) |
| Arts, Media & Entertainment | 25 (22.9%) | 84 (77.1%) |
| Health Diagnosing & Treating | 218 (78.4%) | 60 (21.6%) |
| Health Technologists | 206 (78.9%) | 55 (21.1%) |
| Total (Category) | 1,675 (65.8%) | 869 (34.2%) |
| Total (Overall) | 2,219 (61.7%) | 1,380 (38.3%) |
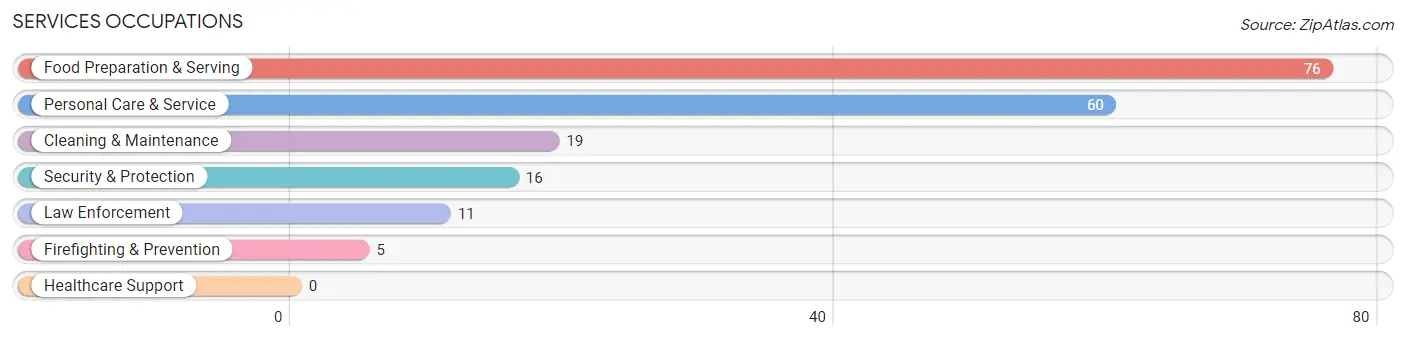
Services Occupations
The most common Services occupations in Highland Park are Food Preparation & Serving (76 | 2.1%), Personal Care & Service (60 | 1.7%), Cleaning & Maintenance (19 | 0.5%), Security & Protection (16 | 0.4%), and Law Enforcement (11 | 0.3%).
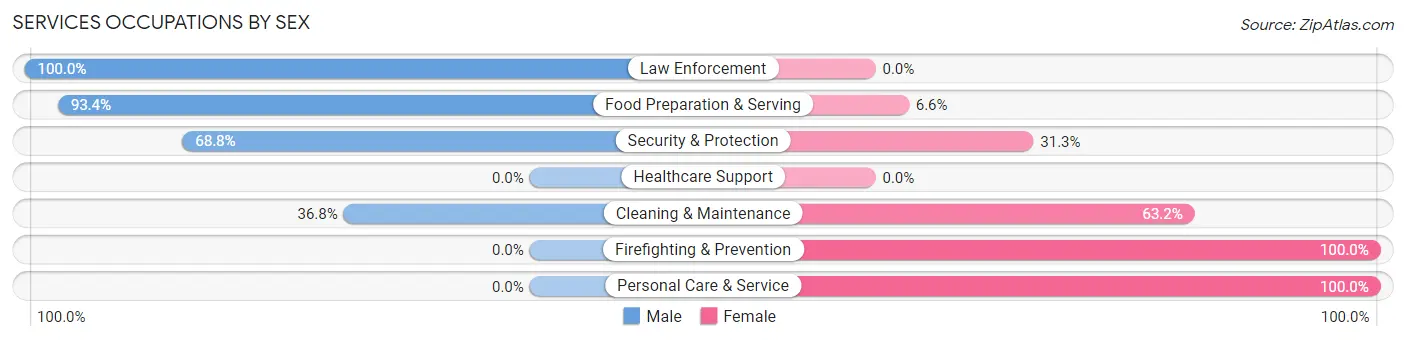
Services Occupations by Sex
Within the Services occupations in Highland Park, the most male-oriented occupations are Law Enforcement (100.0%), Food Preparation & Serving (93.4%), and Security & Protection (68.8%), while the most female-oriented occupations are Firefighting & Prevention (100.0%), Personal Care & Service (100.0%), and Cleaning & Maintenance (63.2%).
| Occupation | Male | Female |
| Healthcare Support | 0 (0.0%) | 0 (0.0%) |
| Security & Protection | 11 (68.8%) | 5 (31.2%) |
| Firefighting & Prevention | 0 (0.0%) | 5 (100.0%) |
| Law Enforcement | 11 (100.0%) | 0 (0.0%) |
| Food Preparation & Serving | 71 (93.4%) | 5 (6.6%) |
| Cleaning & Maintenance | 7 (36.8%) | 12 (63.2%) |
| Personal Care & Service | 0 (0.0%) | 60 (100.0%) |
| Total (Category) | 89 (52.0%) | 82 (47.9%) |
| Total (Overall) | 2,219 (61.7%) | 1,380 (38.3%) |
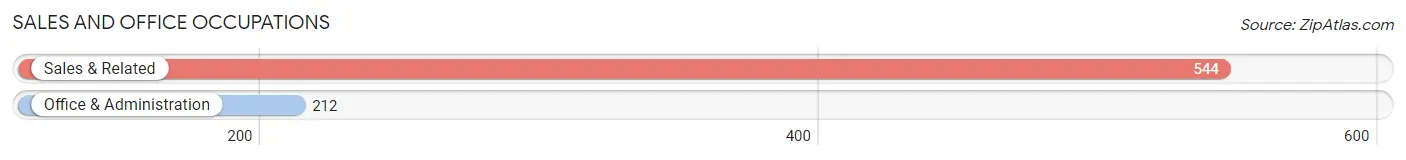
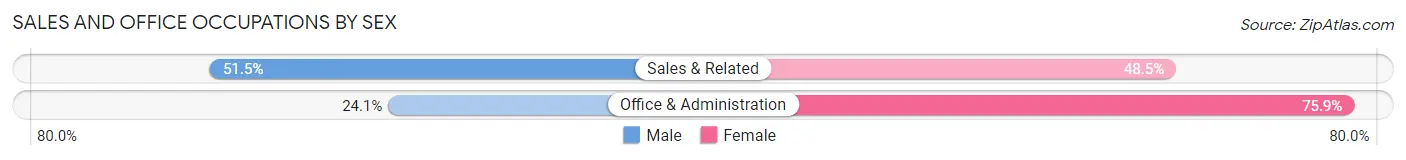
Sales and Office Occupations
The most common Sales and Office occupations in Highland Park are Sales & Related (544 | 15.1%), and Office & Administration (212 | 5.9%).
Sales and Office Occupations by Sex
| Occupation | Male | Female |
| Sales & Related | 280 (51.5%) | 264 (48.5%) |
| Office & Administration | 51 (24.1%) | 161 (75.9%) |
| Total (Category) | 331 (43.8%) | 425 (56.2%) |
| Total (Overall) | 2,219 (61.7%) | 1,380 (38.3%) |
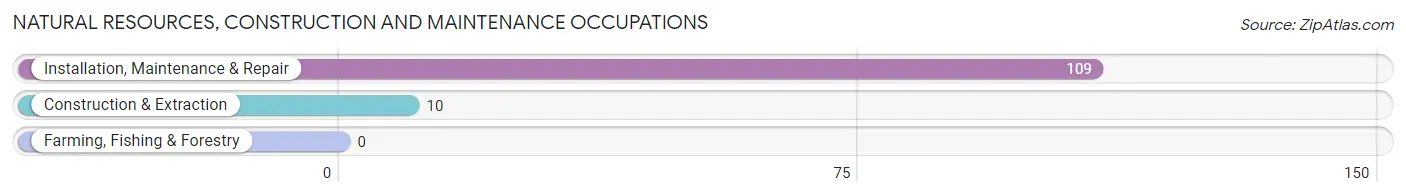
Natural Resources, Construction and Maintenance Occupations
The most common Natural Resources, Construction and Maintenance occupations in Highland Park are Installation, Maintenance & Repair (109 | 3.0%), and Construction & Extraction (10 | 0.3%).
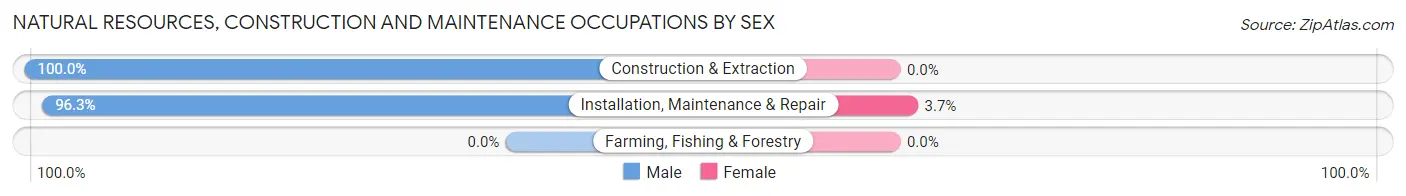
Natural Resources, Construction and Maintenance Occupations by Sex
| Occupation | Male | Female |
| Farming, Fishing & Forestry | 0 (0.0%) | 0 (0.0%) |
| Construction & Extraction | 10 (100.0%) | 0 (0.0%) |
| Installation, Maintenance & Repair | 105 (96.3%) | 4 (3.7%) |
| Total (Category) | 115 (96.6%) | 4 (3.4%) |
| Total (Overall) | 2,219 (61.7%) | 1,380 (38.3%) |
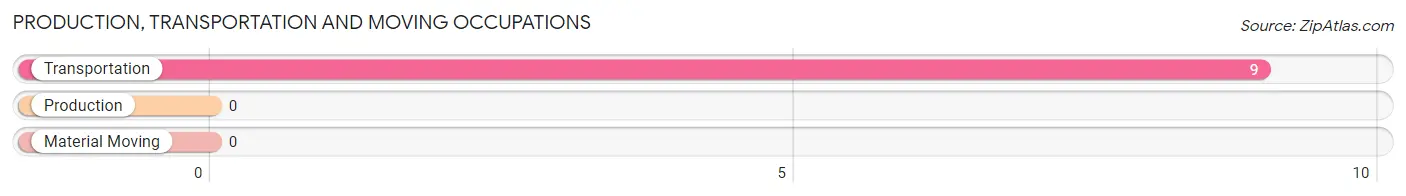
Production, Transportation and Moving Occupations
The most common Production, Transportation and Moving occupations in Highland Park are , and Transportation (9 | 0.3%).
Production, Transportation and Moving Occupations by Sex
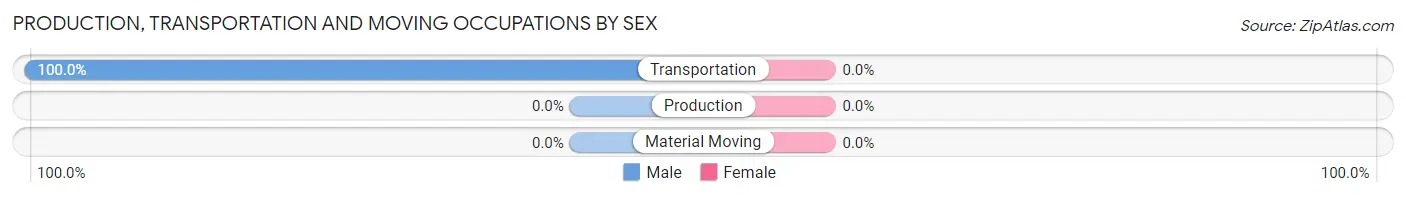
| Occupation | Male | Female |
| Production | 0 (0.0%) | 0 (0.0%) |
| Transportation | 9 (100.0%) | 0 (0.0%) |
| Material Moving | 0 (0.0%) | 0 (0.0%) |
| Total (Category) | 9 (100.0%) | 0 (0.0%) |
| Total (Overall) | 2,219 (61.7%) | 1,380 (38.3%) |
Employment Industries by Sex in Highland Park
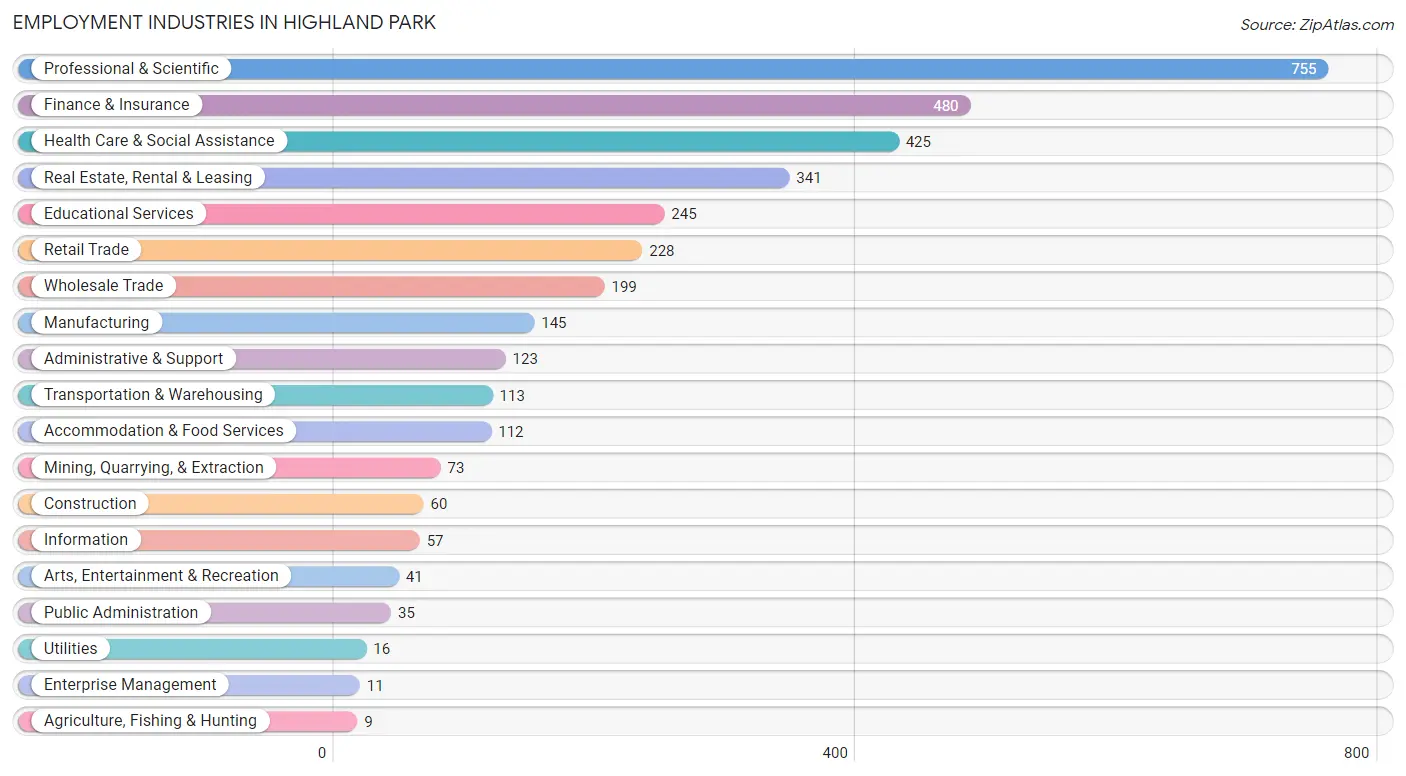
Employment Industries in Highland Park
The major employment industries in Highland Park include Professional & Scientific (755 | 21.0%), Finance & Insurance (480 | 13.3%), Health Care & Social Assistance (425 | 11.8%), Real Estate, Rental & Leasing (341 | 9.5%), and Educational Services (245 | 6.8%).
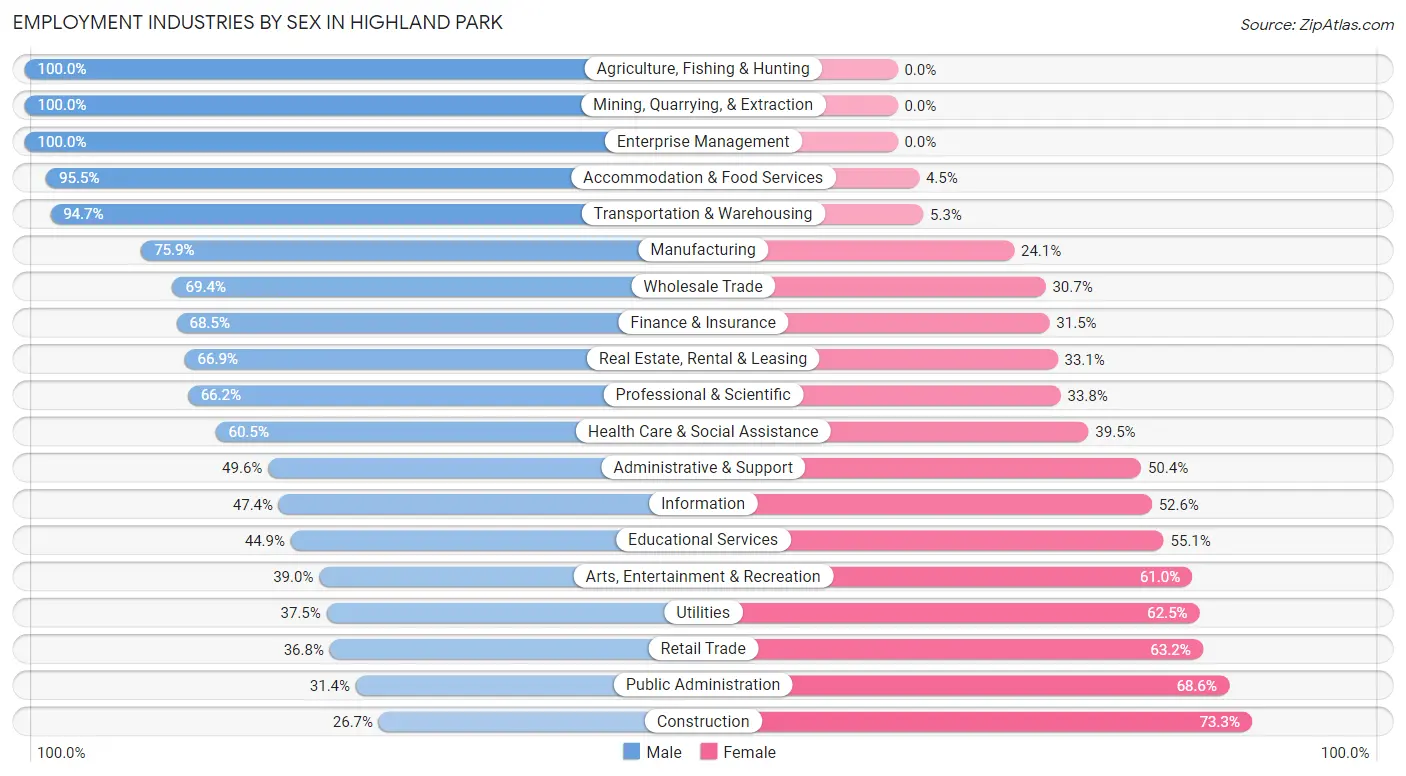
Employment Industries by Sex in Highland Park
The Highland Park industries that see more men than women are Agriculture, Fishing & Hunting (100.0%), Mining, Quarrying, & Extraction (100.0%), and Enterprise Management (100.0%), whereas the industries that tend to have a higher number of women are Construction (73.3%), Public Administration (68.6%), and Retail Trade (63.2%).
| Industry | Male | Female |
| Agriculture, Fishing & Hunting | 9 (100.0%) | 0 (0.0%) |
| Mining, Quarrying, & Extraction | 73 (100.0%) | 0 (0.0%) |
| Construction | 16 (26.7%) | 44 (73.3%) |
| Manufacturing | 110 (75.9%) | 35 (24.1%) |
| Wholesale Trade | 138 (69.4%) | 61 (30.6%) |
| Retail Trade | 84 (36.8%) | 144 (63.2%) |
| Transportation & Warehousing | 107 (94.7%) | 6 (5.3%) |
| Utilities | 6 (37.5%) | 10 (62.5%) |
| Information | 27 (47.4%) | 30 (52.6%) |
| Finance & Insurance | 329 (68.5%) | 151 (31.5%) |
| Real Estate, Rental & Leasing | 228 (66.9%) | 113 (33.1%) |
| Professional & Scientific | 500 (66.2%) | 255 (33.8%) |
| Enterprise Management | 11 (100.0%) | 0 (0.0%) |
| Administrative & Support | 61 (49.6%) | 62 (50.4%) |
| Educational Services | 110 (44.9%) | 135 (55.1%) |
| Health Care & Social Assistance | 257 (60.5%) | 168 (39.5%) |
| Arts, Entertainment & Recreation | 16 (39.0%) | 25 (61.0%) |
| Accommodation & Food Services | 107 (95.5%) | 5 (4.5%) |
| Public Administration | 11 (31.4%) | 24 (68.6%) |
| Total | 2,219 (61.7%) | 1,380 (38.3%) |
Education in Highland Park
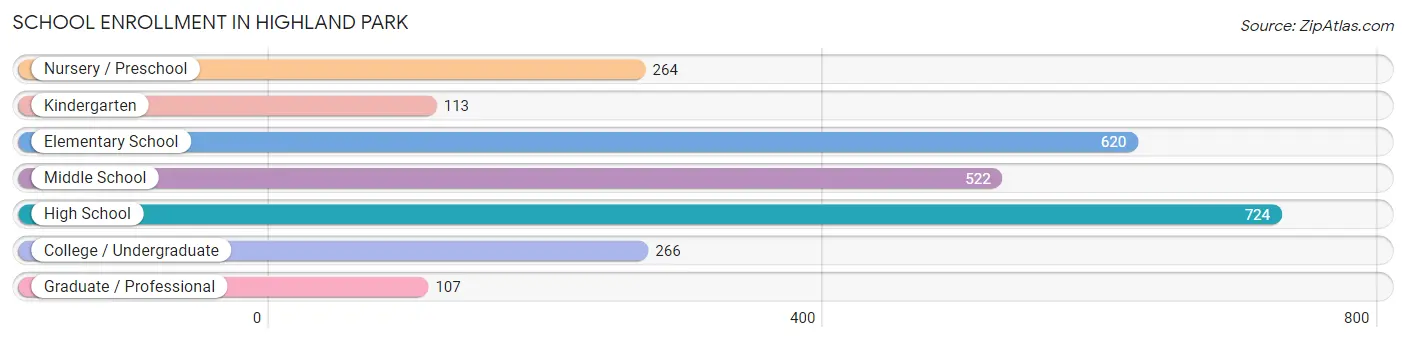
School Enrollment in Highland Park
The most common levels of schooling among the 2,616 students in Highland Park are high school (724 | 27.7%), elementary school (620 | 23.7%), and middle school (522 | 20.0%).
| School Level | # Students | % Students |
| Nursery / Preschool | 264 | 10.1% |
| Kindergarten | 113 | 4.3% |
| Elementary School | 620 | 23.7% |
| Middle School | 522 | 20.0% |
| High School | 724 | 27.7% |
| College / Undergraduate | 266 | 10.2% |
| Graduate / Professional | 107 | 4.1% |
| Total | 2,616 | 100.0% |
School Enrollment by Age by Funding Source in Highland Park
Out of a total of 2,616 students who are enrolled in schools in Highland Park, 1,188 (45.4%) attend a private institution, while the remaining 1,428 (54.6%) are enrolled in public schools. The age group of 3 to 4 year olds has the highest likelihood of being enrolled in private schools, with 218 (96.0% in the age bracket) enrolled. Conversely, the age group of 5 to 9 year old has the lowest likelihood of being enrolled in a private school, with 571 (86.4% in the age bracket) attending a public institution.
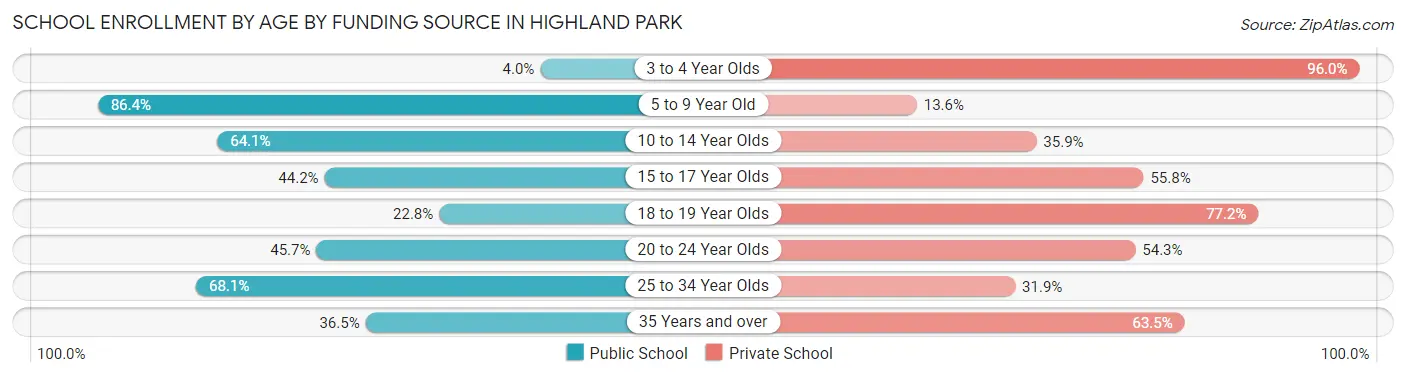
| Age Bracket | Public School | Private School |
| 3 to 4 Year Olds | 9 (4.0%) | 218 (96.0%) |
| 5 to 9 Year Old | 571 (86.4%) | 90 (13.6%) |
| 10 to 14 Year Olds | 425 (64.1%) | 238 (35.9%) |
| 15 to 17 Year Olds | 189 (44.2%) | 239 (55.8%) |
| 18 to 19 Year Olds | 67 (22.8%) | 227 (77.2%) |
| 20 to 24 Year Olds | 95 (45.7%) | 113 (54.3%) |
| 25 to 34 Year Olds | 49 (68.1%) | 23 (31.9%) |
| 35 Years and over | 23 (36.5%) | 40 (63.5%) |
| Total | 1,428 (54.6%) | 1,188 (45.4%) |
Educational Attainment by Field of Study in Highland Park
Business (2,076 | 37.1%), social sciences (589 | 10.5%), communications (392 | 7.0%), bio, nature & agricultural (384 | 6.9%), and literature & languages (318 | 5.7%) are the most common fields of study among 5,590 individuals in Highland Park who have obtained a bachelor's degree or higher.
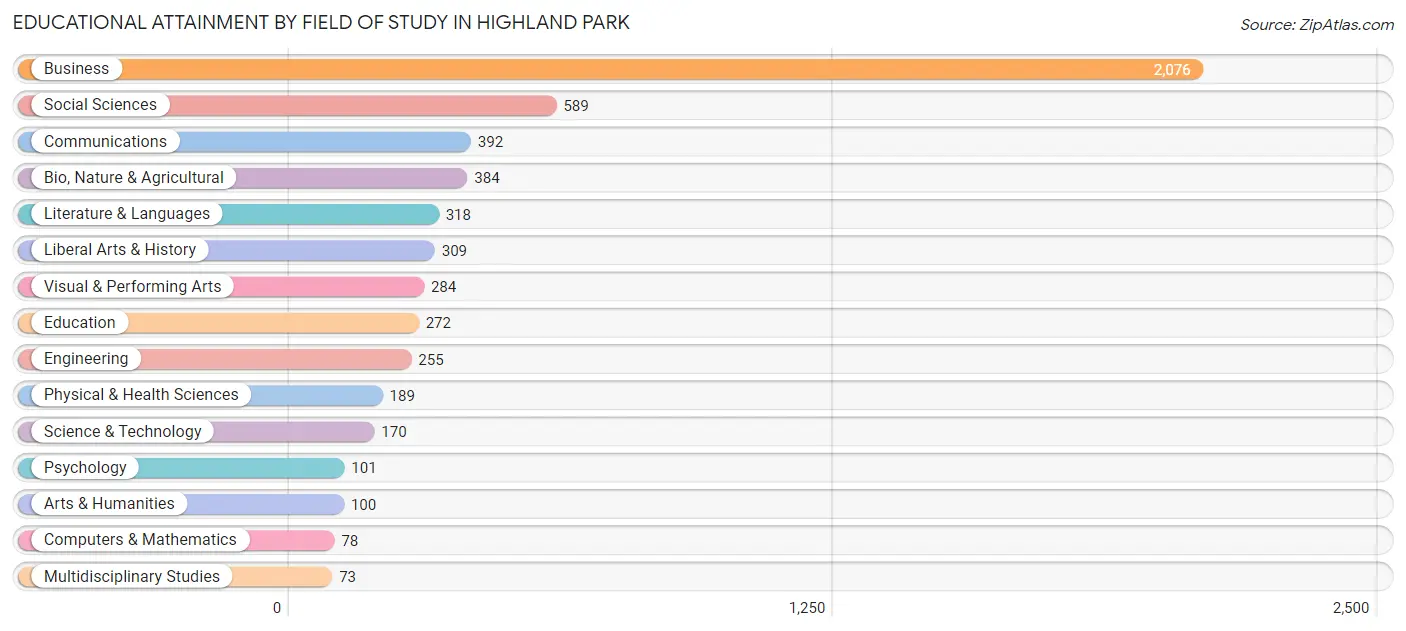
| Field of Study | # Graduates | % Graduates |
| Computers & Mathematics | 78 | 1.4% |
| Bio, Nature & Agricultural | 384 | 6.9% |
| Physical & Health Sciences | 189 | 3.4% |
| Psychology | 101 | 1.8% |
| Social Sciences | 589 | 10.5% |
| Engineering | 255 | 4.6% |
| Multidisciplinary Studies | 73 | 1.3% |
| Science & Technology | 170 | 3.0% |
| Business | 2,076 | 37.1% |
| Education | 272 | 4.9% |
| Literature & Languages | 318 | 5.7% |
| Liberal Arts & History | 309 | 5.5% |
| Visual & Performing Arts | 284 | 5.1% |
| Communications | 392 | 7.0% |
| Arts & Humanities | 100 | 1.8% |
| Total | 5,590 | 100.0% |
Transportation & Commute in Highland Park
Vehicle Availability by Sex in Highland Park
The most prevalent vehicle ownership categories in Highland Park are males with 2 vehicles (1,162, accounting for 52.5%) and females with 2 vehicles (602, making up 86.4%).
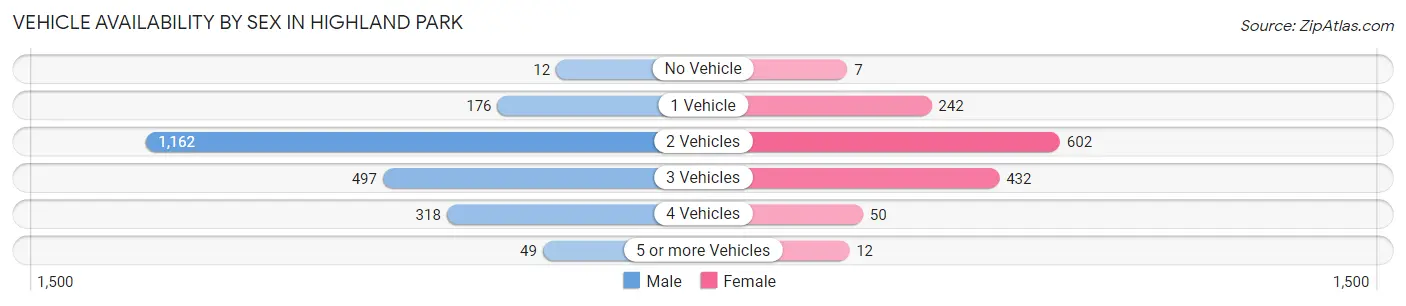
| Vehicles Available | Male | Female |
| No Vehicle | 12 (0.5%) | 7 (0.5%) |
| 1 Vehicle | 176 (8.0%) | 242 (18.0%) |
| 2 Vehicles | 1,162 (52.5%) | 602 (44.8%) |
| 3 Vehicles | 497 (22.5%) | 432 (32.1%) |
| 4 Vehicles | 318 (14.4%) | 50 (3.7%) |
| 5 or more Vehicles | 49 (2.2%) | 12 (0.9%) |
| Total | 2,214 (100.0%) | 1,345 (100.0%) |
Commute Time in Highland Park
The most frequently occuring commute durations in Highland Park are 15 to 19 minutes (694 commuters, 25.4%), 10 to 14 minutes (630 commuters, 23.0%), and 20 to 24 minutes (463 commuters, 16.9%).
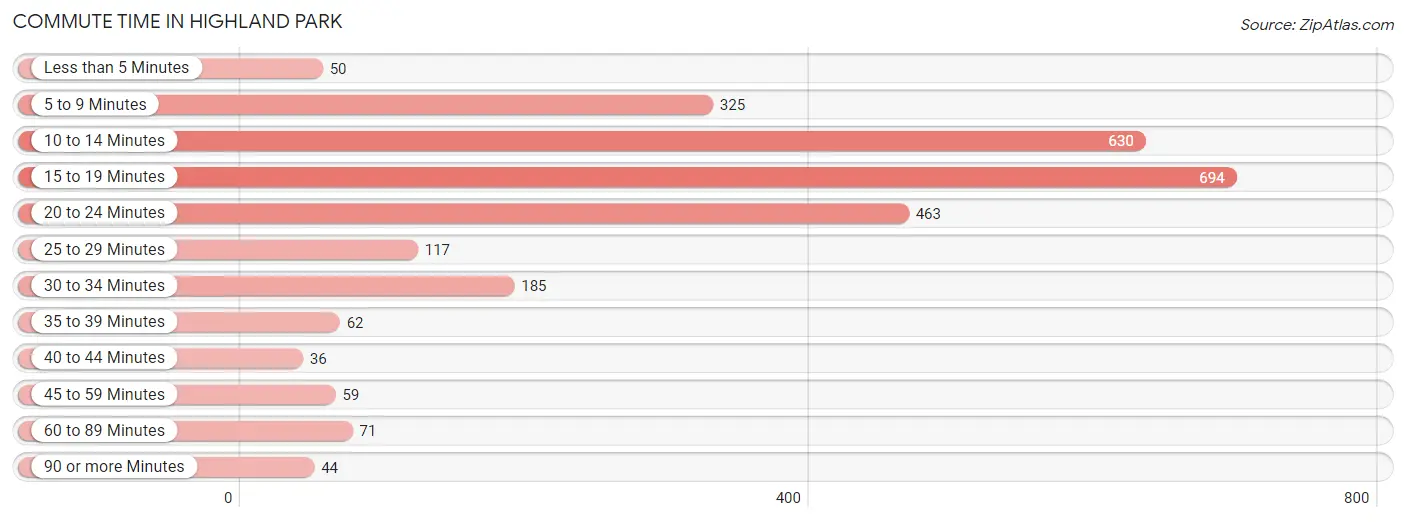
| Commute Time | # Commuters | % Commuters |
| Less than 5 Minutes | 50 | 1.8% |
| 5 to 9 Minutes | 325 | 11.9% |
| 10 to 14 Minutes | 630 | 23.0% |
| 15 to 19 Minutes | 694 | 25.4% |
| 20 to 24 Minutes | 463 | 16.9% |
| 25 to 29 Minutes | 117 | 4.3% |
| 30 to 34 Minutes | 185 | 6.8% |
| 35 to 39 Minutes | 62 | 2.3% |
| 40 to 44 Minutes | 36 | 1.3% |
| 45 to 59 Minutes | 59 | 2.2% |
| 60 to 89 Minutes | 71 | 2.6% |
| 90 or more Minutes | 44 | 1.6% |
Commute Time by Sex in Highland Park
The most common commute times in Highland Park are 10 to 14 minutes (446 commuters, 24.8%) for males and 15 to 19 minutes (351 commuters, 37.4%) for females.
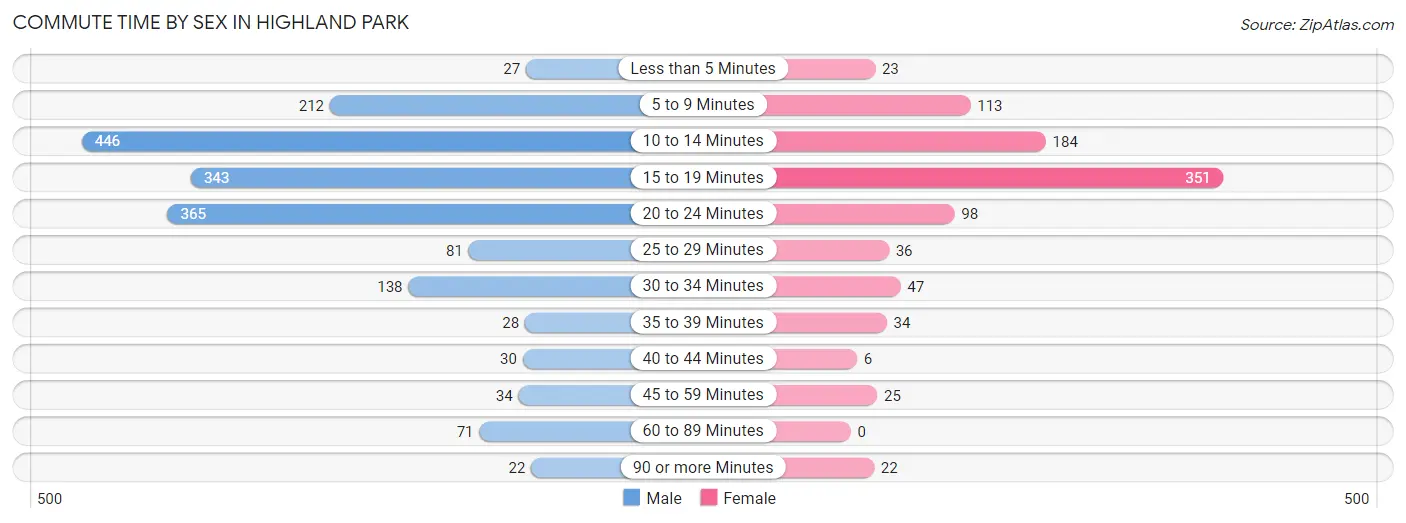
| Commute Time | Male | Female |
| Less than 5 Minutes | 27 (1.5%) | 23 (2.5%) |
| 5 to 9 Minutes | 212 (11.8%) | 113 (12.0%) |
| 10 to 14 Minutes | 446 (24.8%) | 184 (19.6%) |
| 15 to 19 Minutes | 343 (19.1%) | 351 (37.4%) |
| 20 to 24 Minutes | 365 (20.3%) | 98 (10.4%) |
| 25 to 29 Minutes | 81 (4.5%) | 36 (3.8%) |
| 30 to 34 Minutes | 138 (7.7%) | 47 (5.0%) |
| 35 to 39 Minutes | 28 (1.6%) | 34 (3.6%) |
| 40 to 44 Minutes | 30 (1.7%) | 6 (0.6%) |
| 45 to 59 Minutes | 34 (1.9%) | 25 (2.7%) |
| 60 to 89 Minutes | 71 (4.0%) | 0 (0.0%) |
| 90 or more Minutes | 22 (1.2%) | 22 (2.3%) |
Time of Departure to Work by Sex in Highland Park
The most frequent times of departure to work in Highland Park are 8:00 AM to 8:29 AM (392, 21.8%) for males and 8:00 AM to 8:29 AM (197, 21.0%) for females.
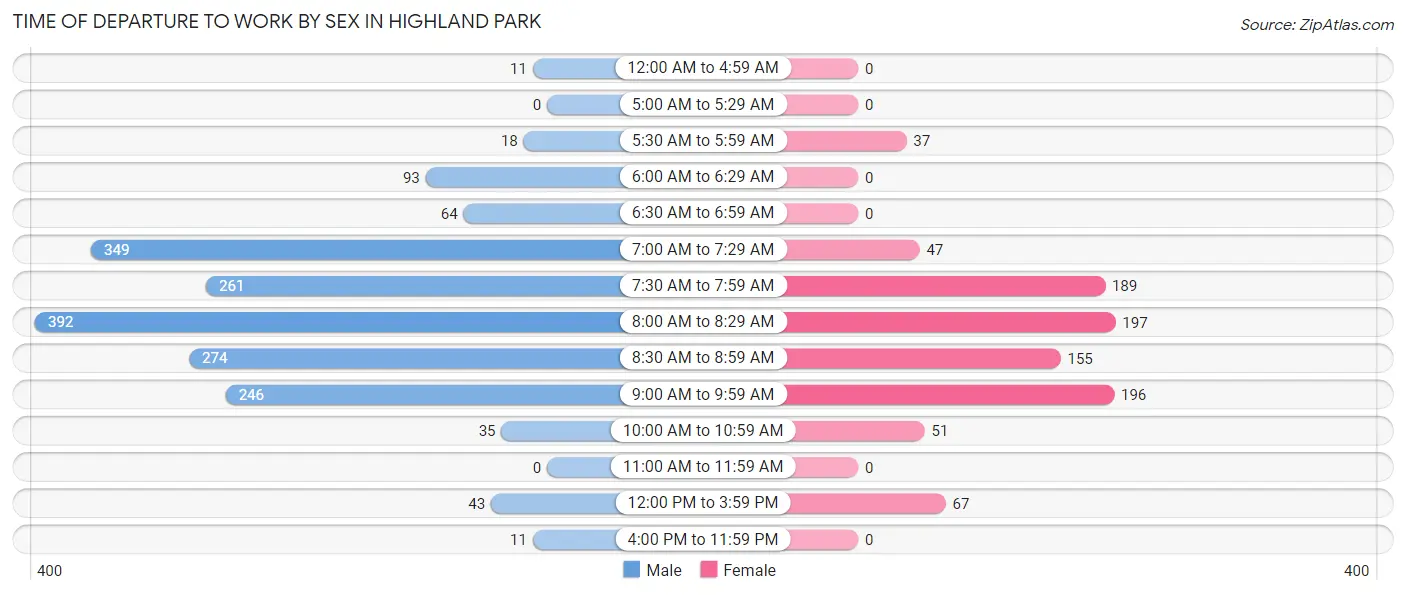
| Time of Departure | Male | Female |
| 12:00 AM to 4:59 AM | 11 (0.6%) | 0 (0.0%) |
| 5:00 AM to 5:29 AM | 0 (0.0%) | 0 (0.0%) |
| 5:30 AM to 5:59 AM | 18 (1.0%) | 37 (3.9%) |
| 6:00 AM to 6:29 AM | 93 (5.2%) | 0 (0.0%) |
| 6:30 AM to 6:59 AM | 64 (3.6%) | 0 (0.0%) |
| 7:00 AM to 7:29 AM | 349 (19.4%) | 47 (5.0%) |
| 7:30 AM to 7:59 AM | 261 (14.5%) | 189 (20.1%) |
| 8:00 AM to 8:29 AM | 392 (21.8%) | 197 (21.0%) |
| 8:30 AM to 8:59 AM | 274 (15.2%) | 155 (16.5%) |
| 9:00 AM to 9:59 AM | 246 (13.7%) | 196 (20.9%) |
| 10:00 AM to 10:59 AM | 35 (1.9%) | 51 (5.4%) |
| 11:00 AM to 11:59 AM | 0 (0.0%) | 0 (0.0%) |
| 12:00 PM to 3:59 PM | 43 (2.4%) | 67 (7.1%) |
| 4:00 PM to 11:59 PM | 11 (0.6%) | 0 (0.0%) |
| Total | 1,797 (100.0%) | 939 (100.0%) |
Housing Occupancy in Highland Park
Occupancy by Ownership in Highland Park
Of the total 3,191 dwellings in Highland Park, owner-occupied units account for 2,786 (87.3%), while renter-occupied units make up 405 (12.7%).
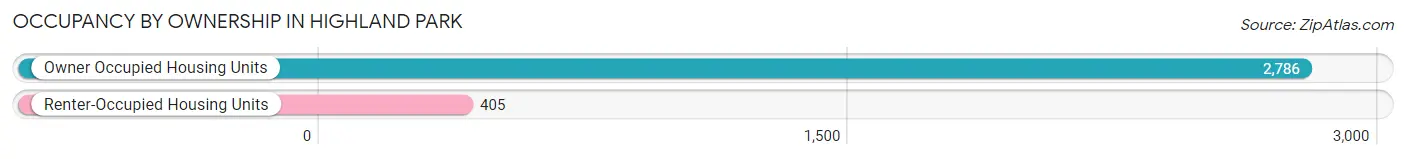
| Occupancy | # Housing Units | % Housing Units |
| Owner Occupied Housing Units | 2,786 | 87.3% |
| Renter-Occupied Housing Units | 405 | 12.7% |
| Total Occupied Housing Units | 3,191 | 100.0% |
Occupancy by Household Size in Highland Park
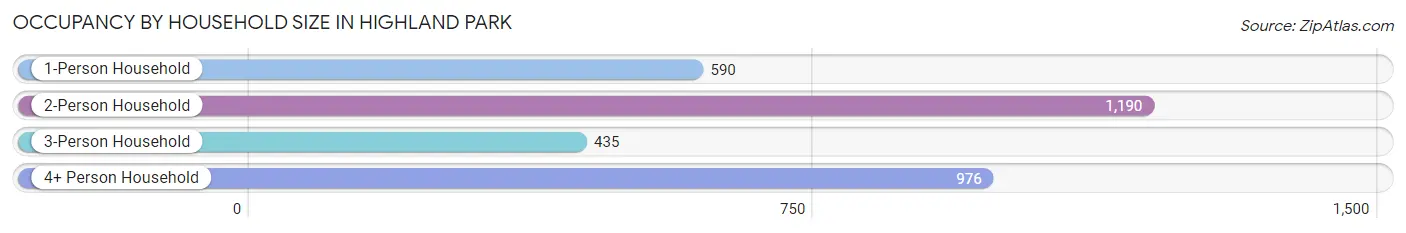
| Household Size | # Housing Units | % Housing Units |
| 1-Person Household | 590 | 18.5% |
| 2-Person Household | 1,190 | 37.3% |
| 3-Person Household | 435 | 13.6% |
| 4+ Person Household | 976 | 30.6% |
| Total Housing Units | 3,191 | 100.0% |
Occupancy by Ownership by Household Size in Highland Park
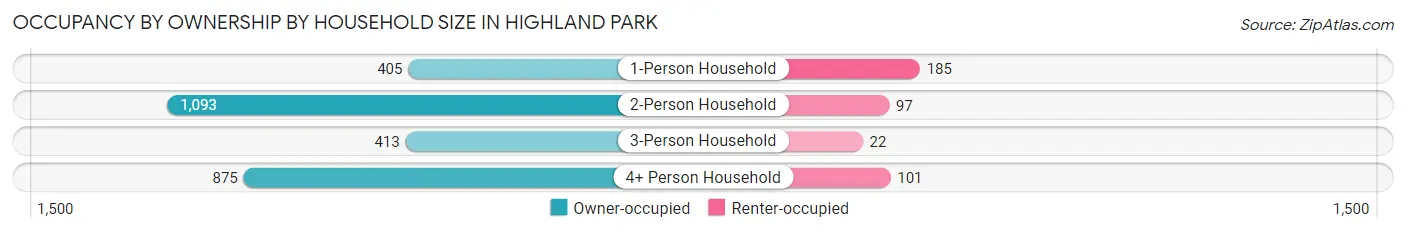
| Household Size | Owner-occupied | Renter-occupied |
| 1-Person Household | 405 (68.6%) | 185 (31.4%) |
| 2-Person Household | 1,093 (91.8%) | 97 (8.2%) |
| 3-Person Household | 413 (94.9%) | 22 (5.1%) |
| 4+ Person Household | 875 (89.6%) | 101 (10.3%) |
| Total Housing Units | 2,786 (87.3%) | 405 (12.7%) |
Occupancy by Educational Attainment in Highland Park
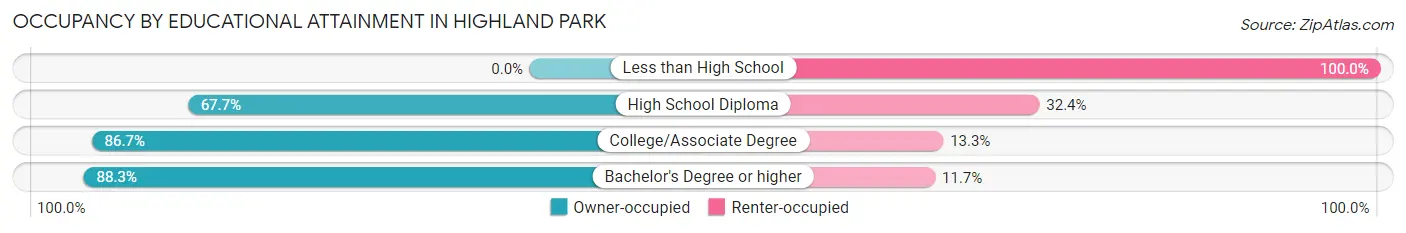
| Household Size | Owner-occupied | Renter-occupied |
| Less than High School | 0 (0.0%) | 14 (100.0%) |
| High School Diploma | 46 (67.6%) | 22 (32.4%) |
| College/Associate Degree | 300 (86.7%) | 46 (13.3%) |
| Bachelor's Degree or higher | 2,440 (88.3%) | 323 (11.7%) |
Occupancy by Age of Householder in Highland Park
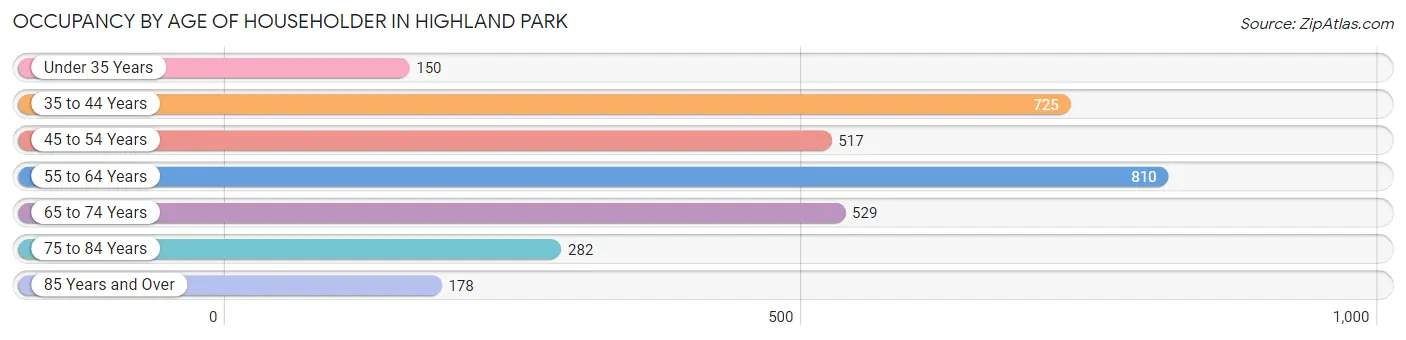
| Age Bracket | # Households | % Households |
| Under 35 Years | 150 | 4.7% |
| 35 to 44 Years | 725 | 22.7% |
| 45 to 54 Years | 517 | 16.2% |
| 55 to 64 Years | 810 | 25.4% |
| 65 to 74 Years | 529 | 16.6% |
| 75 to 84 Years | 282 | 8.8% |
| 85 Years and Over | 178 | 5.6% |
| Total | 3,191 | 100.0% |
Housing Finances in Highland Park
Median Income by Occupancy in Highland Park
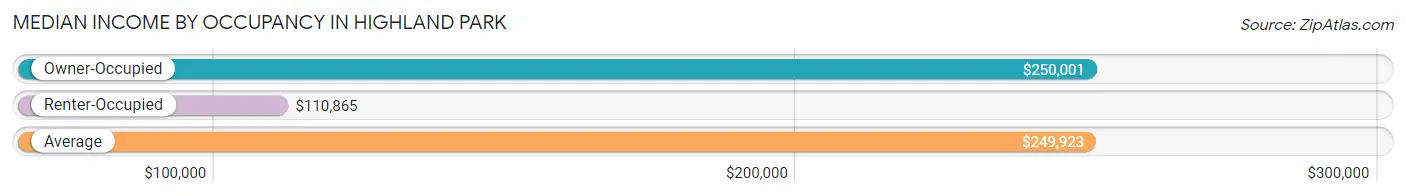
| Occupancy Type | # Households | Median Income |
| Owner-Occupied | 2,786 (87.3%) | $250,001 |
| Renter-Occupied | 405 (12.7%) | $110,865 |
| Average | 3,191 (100.0%) | $249,923 |
Occupancy by Householder Income Bracket in Highland Park
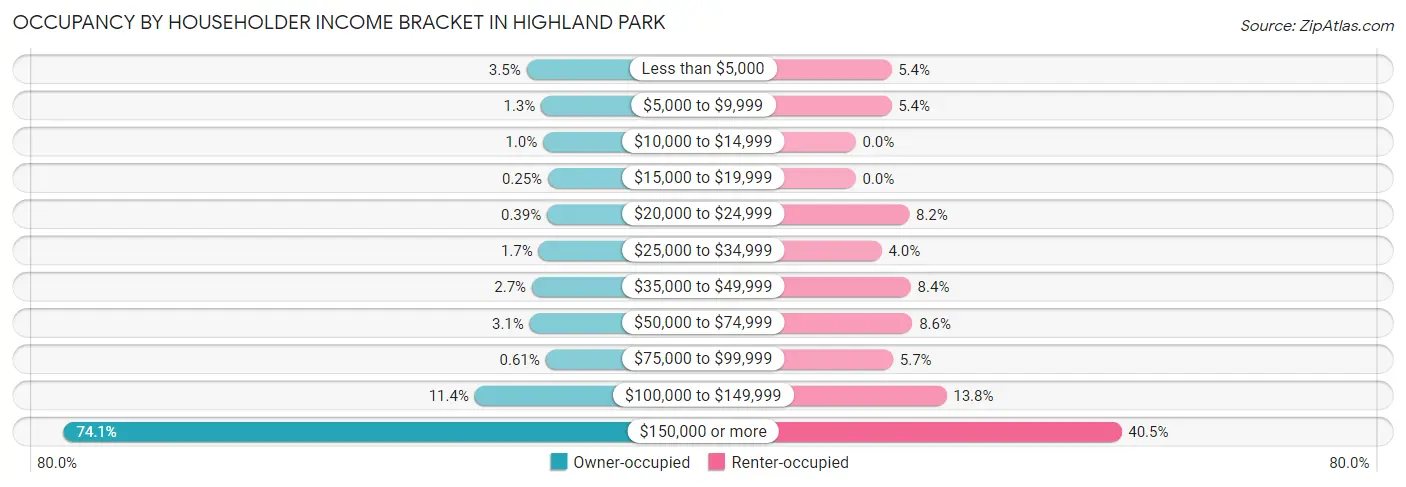
| Income Bracket | Owner-occupied | Renter-occupied |
| Less than $5,000 | 98 (3.5%) | 22 (5.4%) |
| $5,000 to $9,999 | 36 (1.3%) | 22 (5.4%) |
| $10,000 to $14,999 | 28 (1.0%) | 0 (0.0%) |
| $15,000 to $19,999 | 7 (0.3%) | 0 (0.0%) |
| $20,000 to $24,999 | 11 (0.4%) | 33 (8.2%) |
| $25,000 to $34,999 | 47 (1.7%) | 16 (4.0%) |
| $35,000 to $49,999 | 75 (2.7%) | 34 (8.4%) |
| $50,000 to $74,999 | 85 (3.0%) | 35 (8.6%) |
| $75,000 to $99,999 | 17 (0.6%) | 23 (5.7%) |
| $100,000 to $149,999 | 318 (11.4%) | 56 (13.8%) |
| $150,000 or more | 2,064 (74.1%) | 164 (40.5%) |
| Total | 2,786 (100.0%) | 405 (100.0%) |
Monthly Housing Cost Tiers in Highland Park
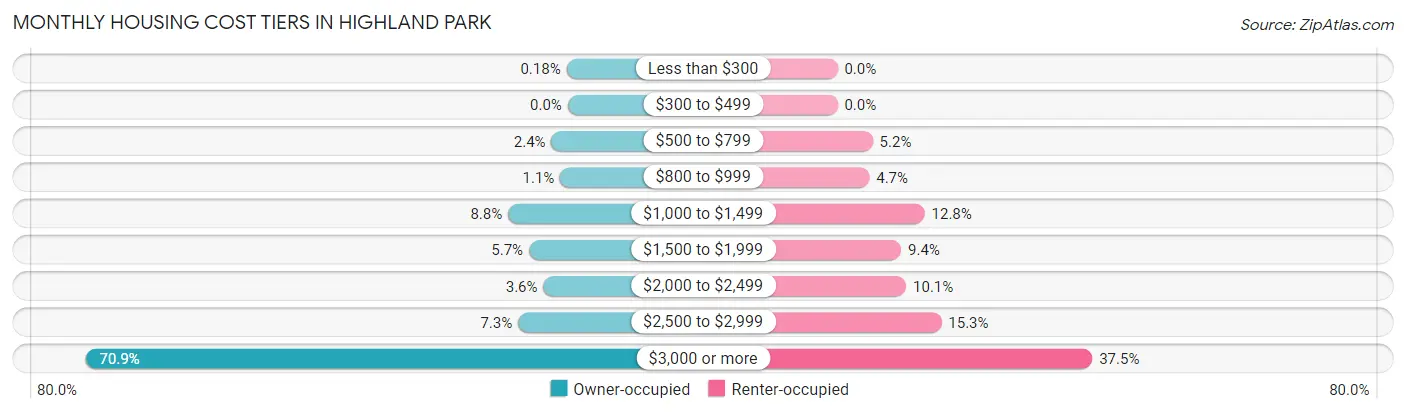
| Monthly Cost | Owner-occupied | Renter-occupied |
| Less than $300 | 5 (0.2%) | 0 (0.0%) |
| $300 to $499 | 0 (0.0%) | 0 (0.0%) |
| $500 to $799 | 67 (2.4%) | 21 (5.2%) |
| $800 to $999 | 31 (1.1%) | 19 (4.7%) |
| $1,000 to $1,499 | 245 (8.8%) | 52 (12.8%) |
| $1,500 to $1,999 | 159 (5.7%) | 38 (9.4%) |
| $2,000 to $2,499 | 100 (3.6%) | 41 (10.1%) |
| $2,500 to $2,999 | 204 (7.3%) | 62 (15.3%) |
| $3,000 or more | 1,975 (70.9%) | 152 (37.5%) |
| Total | 2,786 (100.0%) | 405 (100.0%) |
Physical Housing Characteristics in Highland Park
Housing Structures in Highland Park
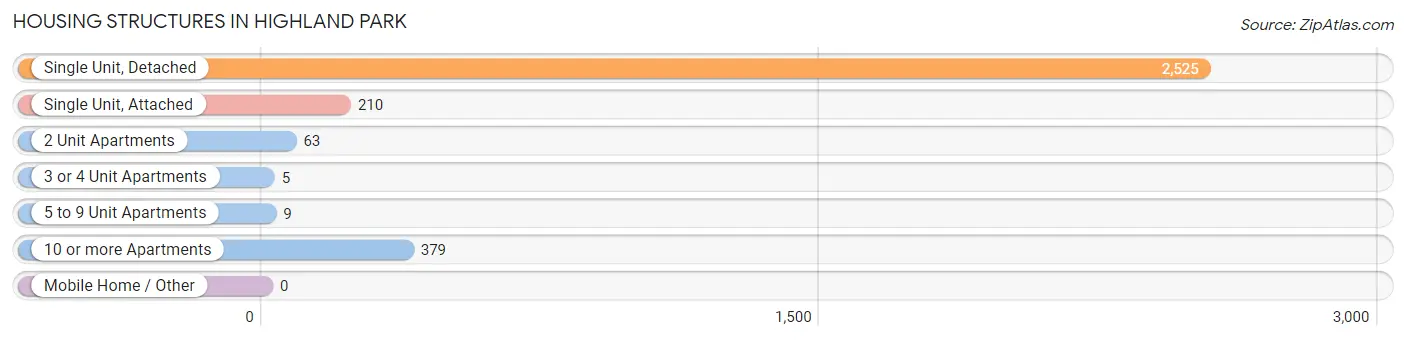
| Structure Type | # Housing Units | % Housing Units |
| Single Unit, Detached | 2,525 | 79.1% |
| Single Unit, Attached | 210 | 6.6% |
| 2 Unit Apartments | 63 | 2.0% |
| 3 or 4 Unit Apartments | 5 | 0.2% |
| 5 to 9 Unit Apartments | 9 | 0.3% |
| 10 or more Apartments | 379 | 11.9% |
| Mobile Home / Other | 0 | 0.0% |
| Total | 3,191 | 100.0% |
Housing Structures by Occupancy in Highland Park
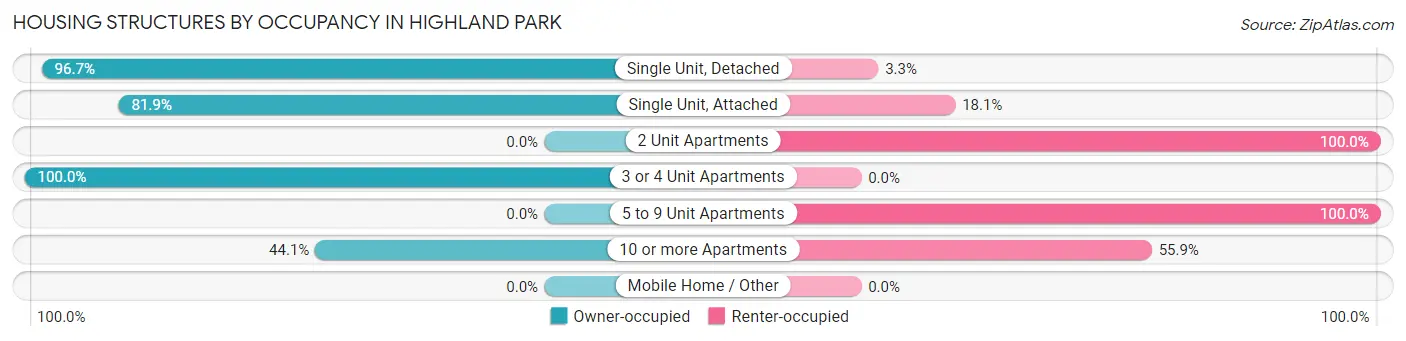
| Structure Type | Owner-occupied | Renter-occupied |
| Single Unit, Detached | 2,442 (96.7%) | 83 (3.3%) |
| Single Unit, Attached | 172 (81.9%) | 38 (18.1%) |
| 2 Unit Apartments | 0 (0.0%) | 63 (100.0%) |
| 3 or 4 Unit Apartments | 5 (100.0%) | 0 (0.0%) |
| 5 to 9 Unit Apartments | 0 (0.0%) | 9 (100.0%) |
| 10 or more Apartments | 167 (44.1%) | 212 (55.9%) |
| Mobile Home / Other | 0 (0.0%) | 0 (0.0%) |
| Total | 2,786 (87.3%) | 405 (12.7%) |
Housing Structures by Number of Rooms in Highland Park
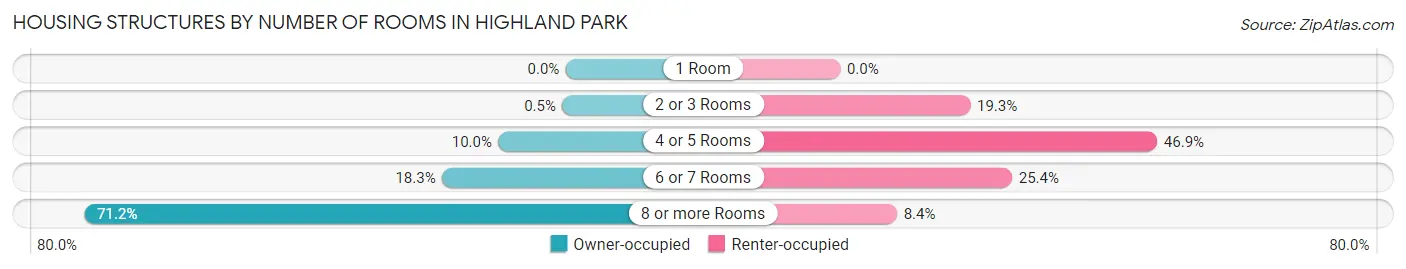
| Number of Rooms | Owner-occupied | Renter-occupied |
| 1 Room | 0 (0.0%) | 0 (0.0%) |
| 2 or 3 Rooms | 14 (0.5%) | 78 (19.3%) |
| 4 or 5 Rooms | 278 (10.0%) | 190 (46.9%) |
| 6 or 7 Rooms | 510 (18.3%) | 103 (25.4%) |
| 8 or more Rooms | 1,984 (71.2%) | 34 (8.4%) |
| Total | 2,786 (100.0%) | 405 (100.0%) |
Housing Structure by Heating Type in Highland Park
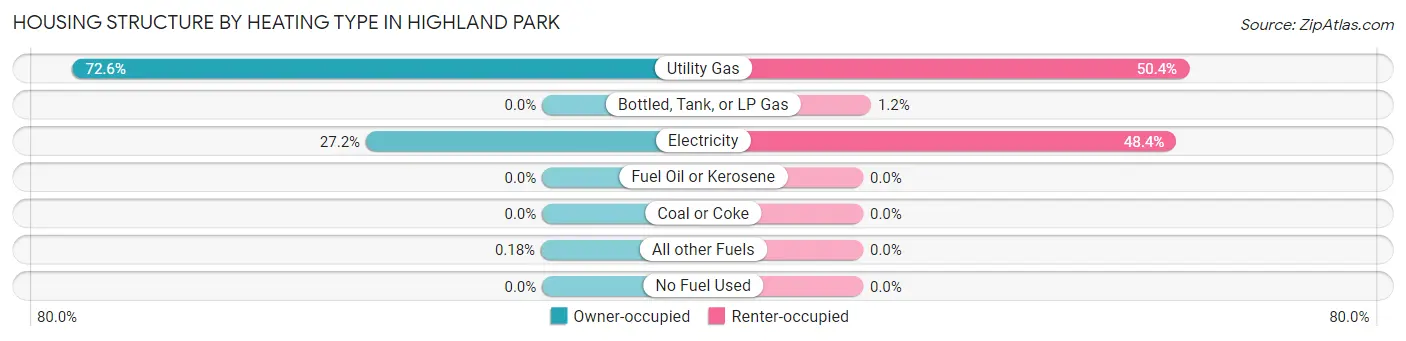
| Heating Type | Owner-occupied | Renter-occupied |
| Utility Gas | 2,022 (72.6%) | 204 (50.4%) |
| Bottled, Tank, or LP Gas | 0 (0.0%) | 5 (1.2%) |
| Electricity | 759 (27.2%) | 196 (48.4%) |
| Fuel Oil or Kerosene | 0 (0.0%) | 0 (0.0%) |
| Coal or Coke | 0 (0.0%) | 0 (0.0%) |
| All other Fuels | 5 (0.2%) | 0 (0.0%) |
| No Fuel Used | 0 (0.0%) | 0 (0.0%) |
| Total | 2,786 (100.0%) | 405 (100.0%) |
Household Vehicle Usage in Highland Park
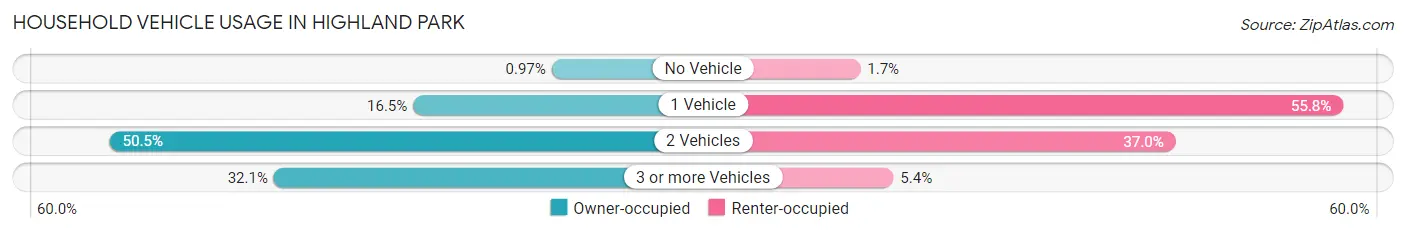
| Vehicles per Household | Owner-occupied | Renter-occupied |
| No Vehicle | 27 (1.0%) | 7 (1.7%) |
| 1 Vehicle | 459 (16.5%) | 226 (55.8%) |
| 2 Vehicles | 1,406 (50.5%) | 150 (37.0%) |
| 3 or more Vehicles | 894 (32.1%) | 22 (5.4%) |
| Total | 2,786 (100.0%) | 405 (100.0%) |
Real Estate & Mortgages in Highland Park
Real Estate and Mortgage Overview in Highland Park
| Characteristic | Without Mortgage | With Mortgage |
| Housing Units | 1,402 | 1,384 |
| Median Property Value | $1,514,600 | $1,806,400 |
| Median Household Income | $248,296 | $1,086 |
| Monthly Housing Costs | $1,501 | $1,315 |
| Real Estate Taxes | $10,001 | $0 |
Property Value by Mortgage Status in Highland Park
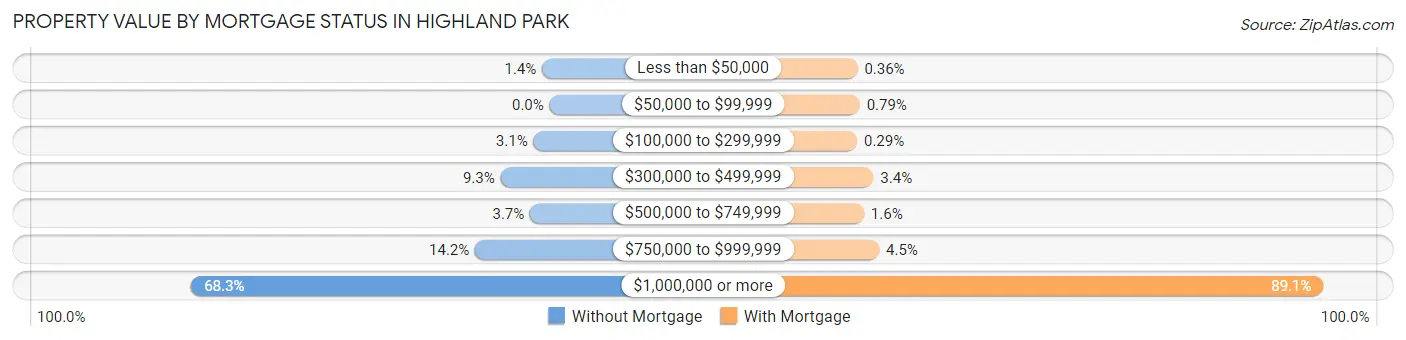
| Property Value | Without Mortgage | With Mortgage |
| Less than $50,000 | 20 (1.4%) | 5 (0.4%) |
| $50,000 to $99,999 | 0 (0.0%) | 11 (0.8%) |
| $100,000 to $299,999 | 43 (3.1%) | 4 (0.3%) |
| $300,000 to $499,999 | 131 (9.3%) | 47 (3.4%) |
| $500,000 to $749,999 | 52 (3.7%) | 22 (1.6%) |
| $750,000 to $999,999 | 199 (14.2%) | 62 (4.5%) |
| $1,000,000 or more | 957 (68.3%) | 1,233 (89.1%) |
| Total | 1,402 (100.0%) | 1,384 (100.0%) |
Household Income by Mortgage Status in Highland Park
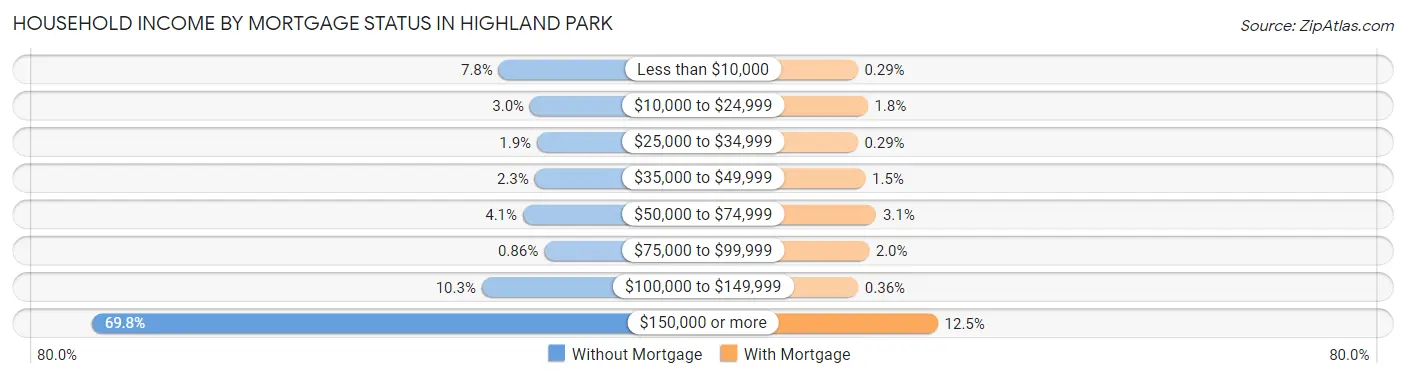
| Household Income | Without Mortgage | With Mortgage |
| Less than $10,000 | 109 (7.8%) | 4 (0.3%) |
| $10,000 to $24,999 | 42 (3.0%) | 25 (1.8%) |
| $25,000 to $34,999 | 27 (1.9%) | 4 (0.3%) |
| $35,000 to $49,999 | 32 (2.3%) | 20 (1.5%) |
| $50,000 to $74,999 | 57 (4.1%) | 43 (3.1%) |
| $75,000 to $99,999 | 12 (0.9%) | 28 (2.0%) |
| $100,000 to $149,999 | 145 (10.3%) | 5 (0.4%) |
| $150,000 or more | 978 (69.8%) | 173 (12.5%) |
| Total | 1,402 (100.0%) | 1,384 (100.0%) |
Property Value to Household Income Ratio in Highland Park
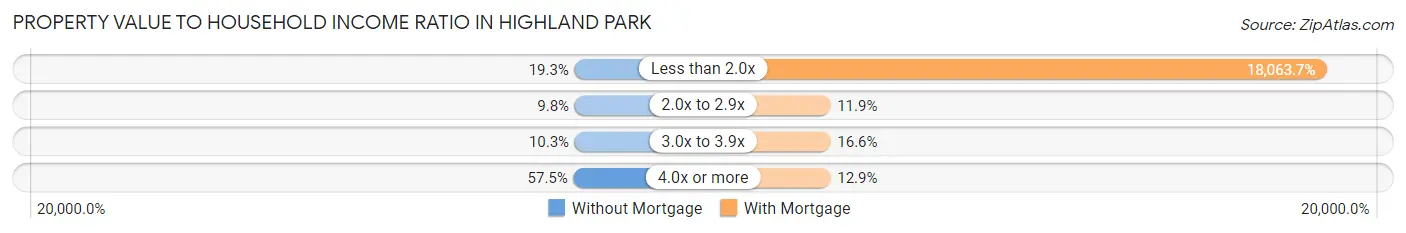
| Value-to-Income Ratio | Without Mortgage | With Mortgage |
| Less than 2.0x | 271 (19.3%) | 250,001 (18,063.7%) |
| 2.0x to 2.9x | 137 (9.8%) | 165 (11.9%) |
| 3.0x to 3.9x | 144 (10.3%) | 230 (16.6%) |
| 4.0x or more | 806 (57.5%) | 179 (12.9%) |
| Total | 1,402 (100.0%) | 1,384 (100.0%) |
Real Estate Taxes by Mortgage Status in Highland Park
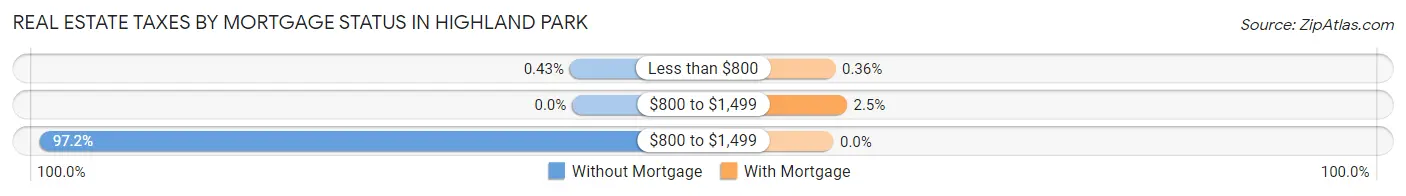
| Property Taxes | Without Mortgage | With Mortgage |
| Less than $800 | 6 (0.4%) | 5 (0.4%) |
| $800 to $1,499 | 0 (0.0%) | 34 (2.5%) |
| $800 to $1,499 | 1,363 (97.2%) | 0 (0.0%) |
| Total | 1,402 (100.0%) | 1,384 (100.0%) |
Health & Disability in Highland Park
Health Insurance Coverage by Age in Highland Park
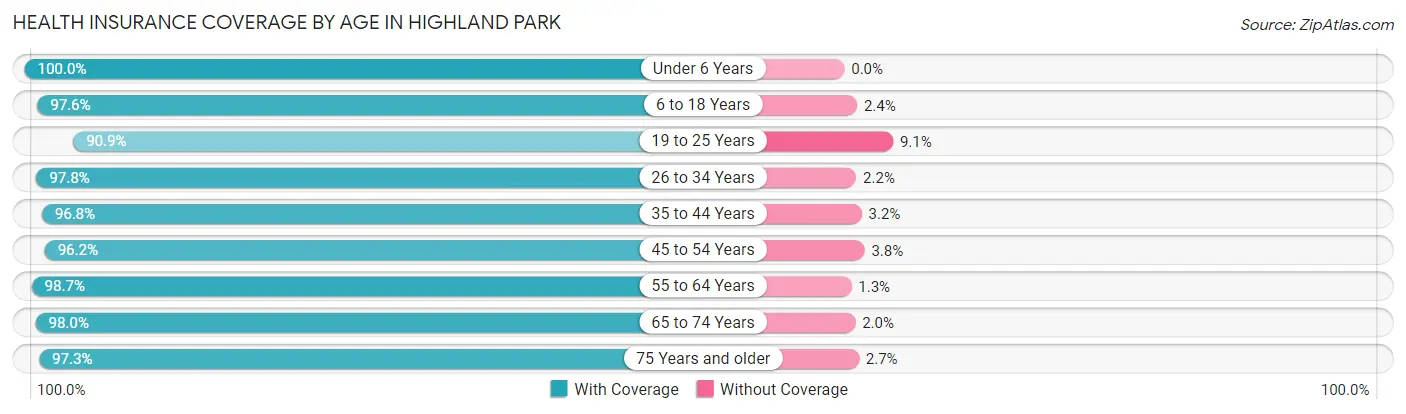
| Age Bracket | With Coverage | Without Coverage |
| Under 6 Years | 662 (100.0%) | 0 (0.0%) |
| 6 to 18 Years | 1,895 (97.6%) | 46 (2.4%) |
| 19 to 25 Years | 331 (90.9%) | 33 (9.1%) |
| 26 to 34 Years | 310 (97.8%) | 7 (2.2%) |
| 35 to 44 Years | 1,172 (96.8%) | 39 (3.2%) |
| 45 to 54 Years | 1,049 (96.2%) | 41 (3.8%) |
| 55 to 64 Years | 1,566 (98.7%) | 21 (1.3%) |
| 65 to 74 Years | 914 (98.0%) | 19 (2.0%) |
| 75 Years and older | 715 (97.3%) | 20 (2.7%) |
| Total | 8,614 (97.4%) | 226 (2.6%) |
Health Insurance Coverage by Citizenship Status in Highland Park
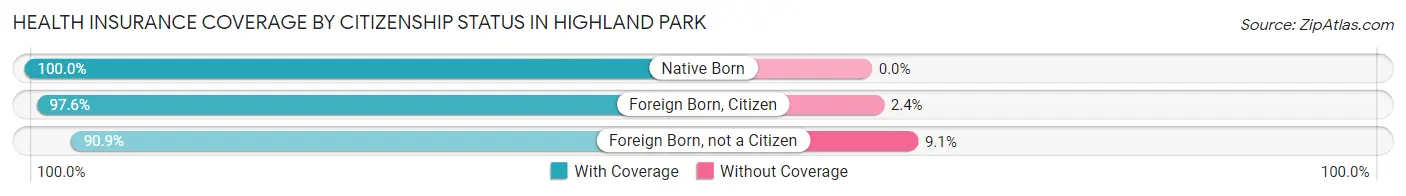
| Citizenship Status | With Coverage | Without Coverage |
| Native Born | 662 (100.0%) | 0 (0.0%) |
| Foreign Born, Citizen | 1,895 (97.6%) | 46 (2.4%) |
| Foreign Born, not a Citizen | 331 (90.9%) | 33 (9.1%) |
Health Insurance Coverage by Household Income in Highland Park
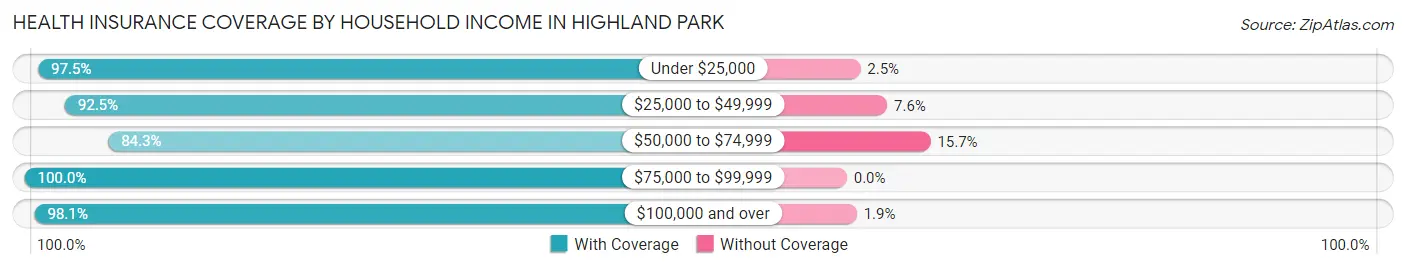
| Household Income | With Coverage | Without Coverage |
| Under $25,000 | 461 (97.5%) | 12 (2.5%) |
| $25,000 to $49,999 | 294 (92.4%) | 24 (7.5%) |
| $50,000 to $74,999 | 253 (84.3%) | 47 (15.7%) |
| $75,000 to $99,999 | 81 (100.0%) | 0 (0.0%) |
| $100,000 and over | 7,525 (98.1%) | 143 (1.9%) |
Public vs Private Health Insurance Coverage by Age in Highland Park
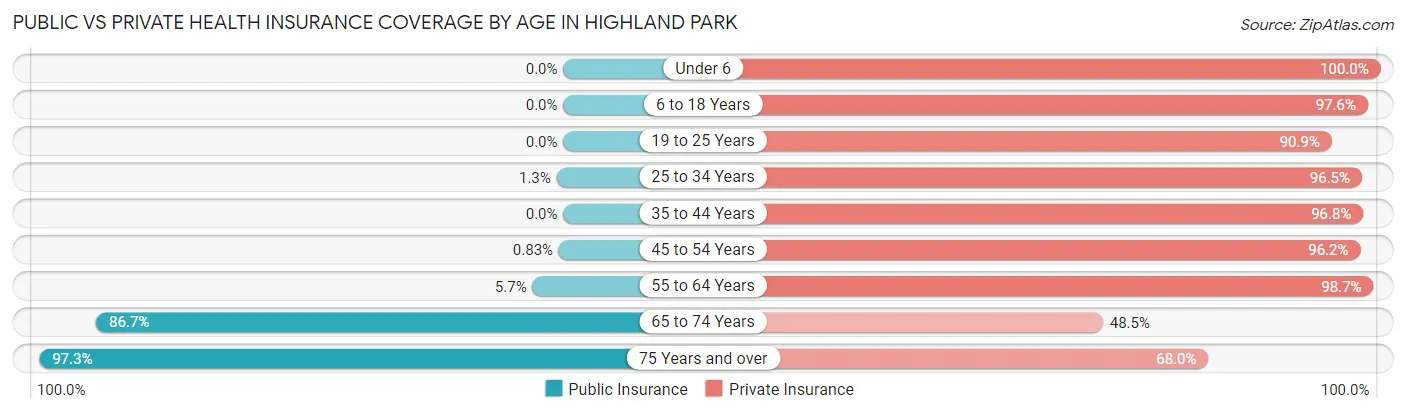
| Age Bracket | Public Insurance | Private Insurance |
| Under 6 | 0 (0.0%) | 662 (100.0%) |
| 6 to 18 Years | 0 (0.0%) | 1,895 (97.6%) |
| 19 to 25 Years | 0 (0.0%) | 331 (90.9%) |
| 25 to 34 Years | 4 (1.3%) | 306 (96.5%) |
| 35 to 44 Years | 0 (0.0%) | 1,172 (96.8%) |
| 45 to 54 Years | 9 (0.8%) | 1,049 (96.2%) |
| 55 to 64 Years | 91 (5.7%) | 1,566 (98.7%) |
| 65 to 74 Years | 809 (86.7%) | 452 (48.4%) |
| 75 Years and over | 715 (97.3%) | 500 (68.0%) |
| Total | 1,628 (18.4%) | 7,933 (89.7%) |
Disability Status by Sex by Age in Highland Park
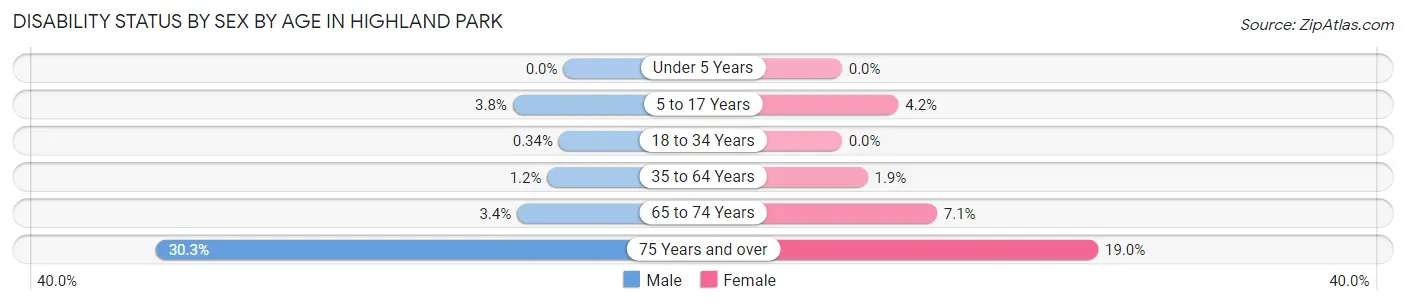
| Age Bracket | Male | Female |
| Under 5 Years | 0 (0.0%) | 0 (0.0%) |
| 5 to 17 Years | 36 (3.8%) | 35 (4.2%) |
| 18 to 34 Years | 2 (0.3%) | 0 (0.0%) |
| 35 to 64 Years | 22 (1.2%) | 39 (1.9%) |
| 65 to 74 Years | 17 (3.4%) | 31 (7.1%) |
| 75 Years and over | 92 (30.3%) | 82 (19.0%) |
Disability Class by Sex by Age in Highland Park
Disability Class: Hearing Difficulty
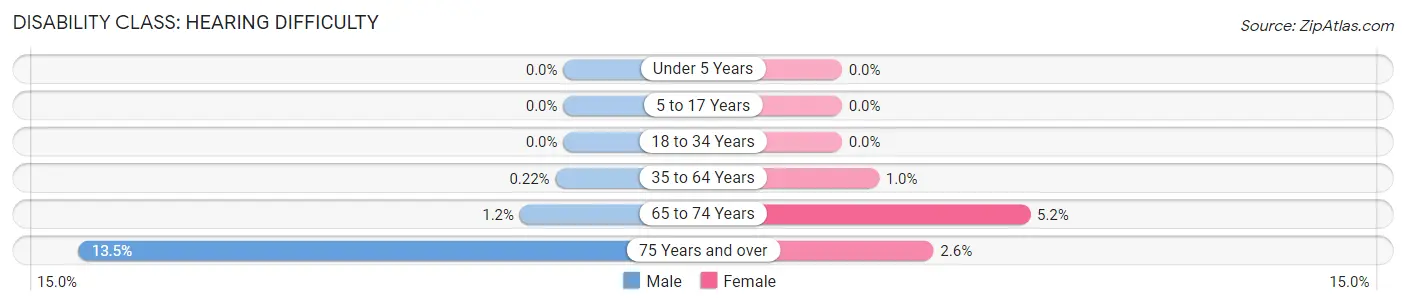
| Age Bracket | Male | Female |
| Under 5 Years | 0 (0.0%) | 0 (0.0%) |
| 5 to 17 Years | 0 (0.0%) | 0 (0.0%) |
| 18 to 34 Years | 0 (0.0%) | 0 (0.0%) |
| 35 to 64 Years | 4 (0.2%) | 21 (1.0%) |
| 65 to 74 Years | 6 (1.2%) | 23 (5.2%) |
| 75 Years and over | 41 (13.5%) | 11 (2.5%) |
Disability Class: Vision Difficulty
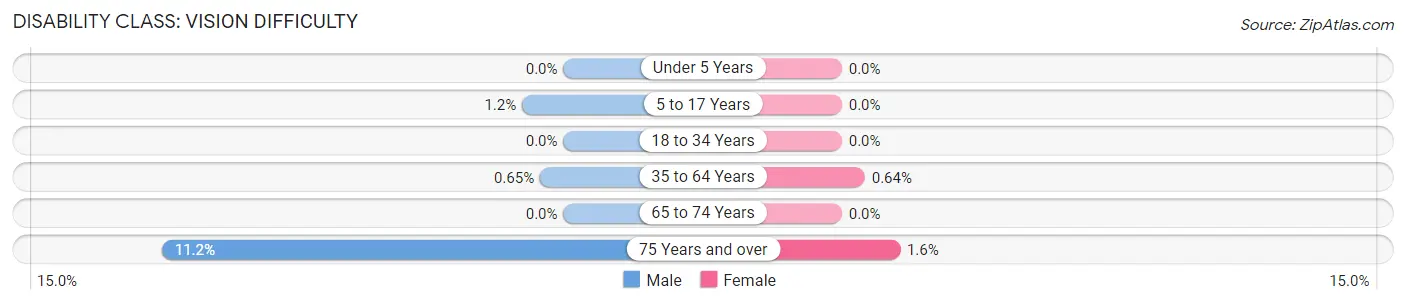
| Age Bracket | Male | Female |
| Under 5 Years | 0 (0.0%) | 0 (0.0%) |
| 5 to 17 Years | 11 (1.1%) | 0 (0.0%) |
| 18 to 34 Years | 0 (0.0%) | 0 (0.0%) |
| 35 to 64 Years | 12 (0.6%) | 13 (0.6%) |
| 65 to 74 Years | 0 (0.0%) | 0 (0.0%) |
| 75 Years and over | 34 (11.2%) | 7 (1.6%) |
Disability Class: Cognitive Difficulty
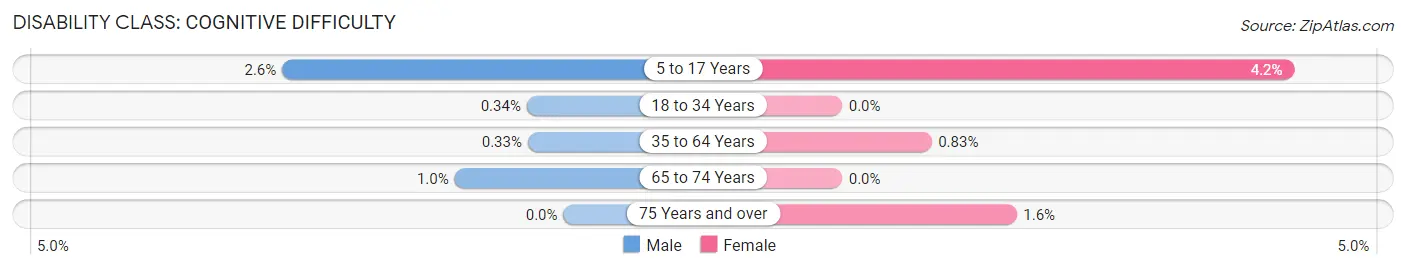
| Age Bracket | Male | Female |
| 5 to 17 Years | 25 (2.6%) | 35 (4.2%) |
| 18 to 34 Years | 2 (0.3%) | 0 (0.0%) |
| 35 to 64 Years | 6 (0.3%) | 17 (0.8%) |
| 65 to 74 Years | 5 (1.0%) | 0 (0.0%) |
| 75 Years and over | 0 (0.0%) | 7 (1.6%) |
Disability Class: Ambulatory Difficulty
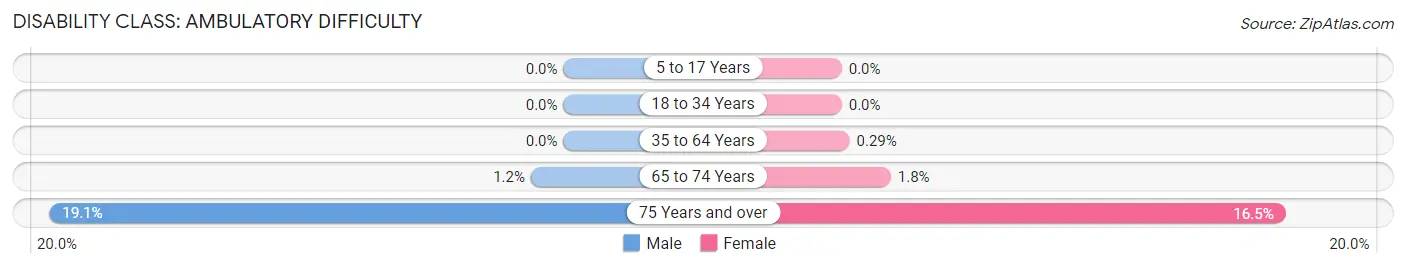
| Age Bracket | Male | Female |
| 5 to 17 Years | 0 (0.0%) | 0 (0.0%) |
| 18 to 34 Years | 0 (0.0%) | 0 (0.0%) |
| 35 to 64 Years | 0 (0.0%) | 6 (0.3%) |
| 65 to 74 Years | 6 (1.2%) | 8 (1.8%) |
| 75 Years and over | 58 (19.1%) | 71 (16.5%) |
Disability Class: Self-Care Difficulty
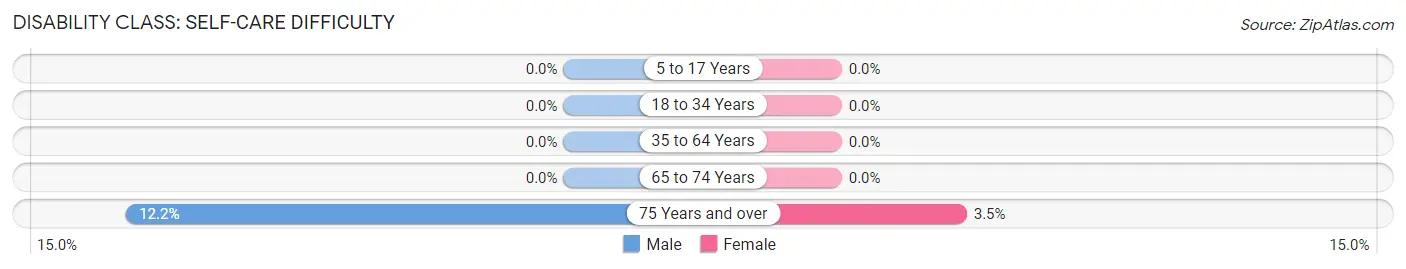
| Age Bracket | Male | Female |
| 5 to 17 Years | 0 (0.0%) | 0 (0.0%) |
| 18 to 34 Years | 0 (0.0%) | 0 (0.0%) |
| 35 to 64 Years | 0 (0.0%) | 0 (0.0%) |
| 65 to 74 Years | 0 (0.0%) | 0 (0.0%) |
| 75 Years and over | 37 (12.2%) | 15 (3.5%) |
Technology Access in Highland Park
Computing Device Access in Highland Park
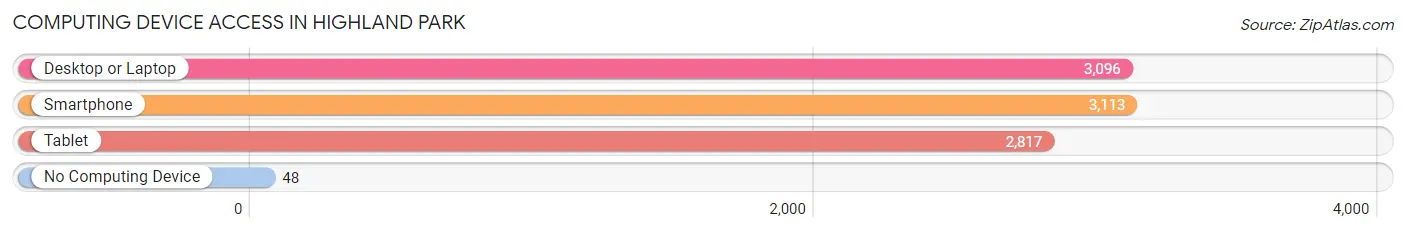
| Device Type | # Households | % Households |
| Desktop or Laptop | 3,096 | 97.0% |
| Smartphone | 3,113 | 97.6% |
| Tablet | 2,817 | 88.3% |
| No Computing Device | 48 | 1.5% |
| Total | 3,191 | 100.0% |
Internet Access in Highland Park
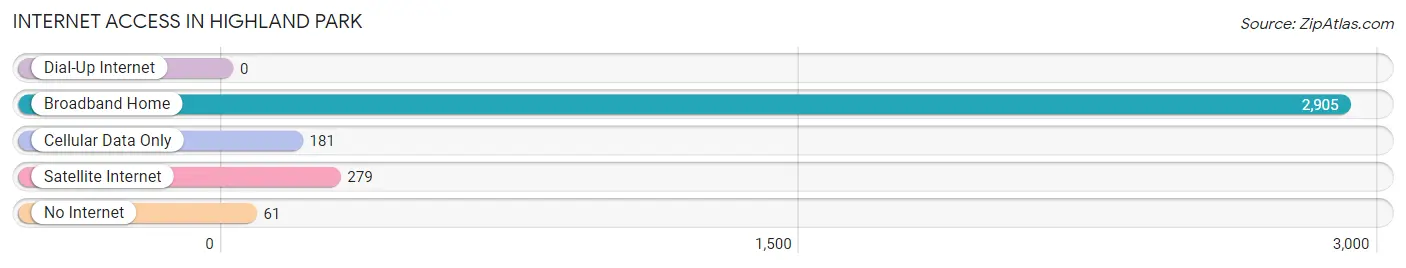
| Internet Type | # Households | % Households |
| Dial-Up Internet | 0 | 0.0% |
| Broadband Home | 2,905 | 91.0% |
| Cellular Data Only | 181 | 5.7% |
| Satellite Internet | 279 | 8.7% |
| No Internet | 61 | 1.9% |
| Total | 3,191 | 100.0% |
Highland Park Summary
Highland Park is a town located in Dallas County, Texas, United States. It is an affluent inner suburb of Dallas and is part of the Dallas–Fort Worth metroplex. As of the 2010 census, the population of Highland Park was 8,564. It is located between the Dallas North Tollway and U.S. Route 75 (Central Expressway), 4 miles (6.4 km) north of downtown Dallas.
History
Highland Park was founded in 1846 by settlers from the Peters Colony. The town was named after the high elevation of the area, which was then known as the Highland Park Addition. The town was incorporated in 1913 and was annexed by the City of Dallas in 1915.
Highland Park was originally developed as a residential area for wealthy Dallas residents. The town was designed by Wilbur David Cook, a landscape architect who also designed many of the city's parks. The town was known for its strict zoning regulations, which limited the size and types of buildings that could be constructed.
Geography
Highland Park is located at 32°51′34″N 96°47′39″W (32.859444, -96.794167). It is situated on the banks of Turtle Creek, a tributary of the Trinity River. The town is bordered by the City of Dallas to the south, University Park to the west, and the City of Richardson to the north.
The town has a total area of 4 2 square miles 10 8 km2 all of which is land
Economy
Highland Park is home to many corporate headquarters, including AT&T, Southwest Airlines, and Texas Instruments. The town is also home to several shopping centers, including Highland Park Village, which is one of the oldest shopping centers in the United States.
The town is also home to several private schools, including the prestigious Highland Park High School. The school is known for its academic excellence and has been ranked among the top high schools in the nation.
Demographics
As of the 2010 census, there were 8,564 people, 3,541 households, and 2,541 families residing in the town. The population density was 2,039.2 people per square mile (788.3/km2). There were 3,817 housing units at an average density of 912.3 per square mile (352.3/km2). The racial makeup of the town was 92.2% White, 2.3% African American, 0.2% Native American, 3.7% Asian, 0.1% Pacific Islander, 0.7% from other races, and 1.0% from two or more races. Hispanic or Latino of any race were 4.2% of the population.
There were 3,541 households, out of which 33.2% had children under the age of 18 living with them, 68.2% were married couples living together, 5.7% had a female householder with no husband present, and 24.2% were non-families. 21.2% of all households were made up of individuals, and 11.2% had someone living alone who was 65 years of age or older. The average household size was 2.43 and the average family size was 2.86.
In the town, the population was spread out, with 24.2% under the age of 18, 4.2% from 18 to 24, 22.2% from 25 to 44, 29.2% from 45 to 64, and 20.2% who were 65 years of age or older. The median age was 44 years. For every 100 females, there were 91.2 males. For every 100 females age 18 and over, there were 87.2 males.
The median income for a household in the town was $150,966, and the median income for a family was $179,966. Males had a median income of $100,000 versus $60,000 for females. The per capita income for the town was $90,966. About 2.2% of families and 3.2% of the population were below the poverty line, including 3.2% of those under age 18 and 3.2% of those age 65 or over.
Common Questions
What is Per Capita Income in Highland Park?
Per Capita income in Highland Park is $171,411.
What is the Median Family Income in Highland Park?
Median Family Income in Highland Park is $250,001.
What is the Median Household income in Highland Park?
Median Household Income in Highland Park is $249,923.
What is Income or Wage Gap in Highland Park?
Income or Wage Gap in Highland Park is 57.2%.
Women in Highland Park earn 42.8 cents for every dollar earned by a man.
What is Inequality or Gini Index in Highland Park?
Inequality or Gini Index in Highland Park is 0.56.
What is the Total Population of Highland Park?
Total Population of Highland Park is 8,840.
What is the Total Male Population of Highland Park?
Total Male Population of Highland Park is 4,511.
What is the Total Female Population of Highland Park?
Total Female Population of Highland Park is 4,329.
What is the Ratio of Males per 100 Females in Highland Park?
There are 104.20 Males per 100 Females in Highland Park.
What is the Ratio of Females per 100 Males in Highland Park?
There are 95.97 Females per 100 Males in Highland Park.
What is the Median Population Age in Highland Park?
Median Population Age in Highland Park is 44.4 Years.
What is the Average Family Size in Highland Park
Average Family Size in Highland Park is 3.2 People.
What is the Average Household Size in Highland Park
Average Household Size in Highland Park is 2.8 People.
How Large is the Labor Force in Highland Park?
There are 3,777 People in the Labor Forcein in Highland Park.
What is the Percentage of People in the Labor Force in Highland Park?
55.5% of People are in the Labor Force in Highland Park.
What is the Unemployment Rate in Highland Park?
Unemployment Rate in Highland Park is 4.8%.