Zip Codes with the Highest Percentage of Population Employed in Real Estate, Rental & Leasing in Harlingen, TX
RELATED REPORTS & OPTIONS
Real Estate, Rental & Leasing
Harlingen
Compare Zip Codes
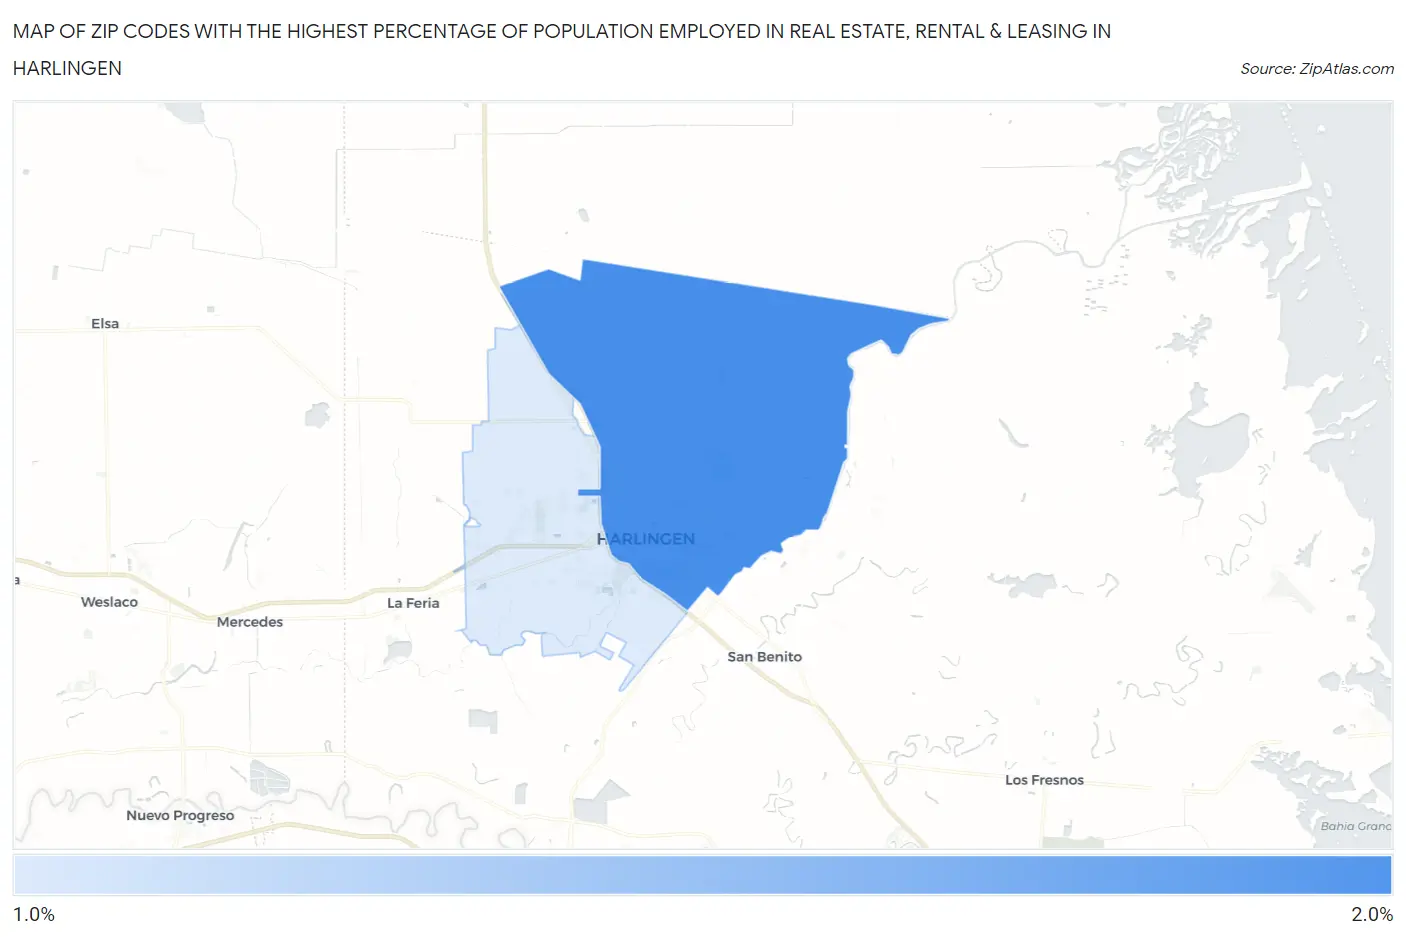
Map of Zip Codes with the Highest Percentage of Population Employed in Real Estate, Rental & Leasing in Harlingen
1.2%
1.5%
Zip Codes with the Highest Percentage of Population Employed in Real Estate, Rental & Leasing in Harlingen, TX
| Zip Code | % Employed | vs State | vs National | |
| 1. | 78550 | 1.5% | 2.0%(-0.489)#795 | 1.9%(-0.373)#11,009 |
| 2. | 78552 | 1.2% | 2.0%(-0.805)#950 | 1.9%(-0.689)#13,460 |
1
Common Questions
What are the Top Zip Codes with the Highest Percentage of Population Employed in Real Estate, Rental & Leasing in Harlingen, TX?
Top Zip Codes with the Highest Percentage of Population Employed in Real Estate, Rental & Leasing in Harlingen, TX are:
What zip code has the Highest Percentage of Population Employed in Real Estate, Rental & Leasing in Harlingen, TX?
78550 has the Highest Percentage of Population Employed in Real Estate, Rental & Leasing in Harlingen, TX with 1.5%.
What is the Percentage of Population Employed in Real Estate, Rental & Leasing in Harlingen, TX?
Percentage of Population Employed in Real Estate, Rental & Leasing in Harlingen is 1.5%.
What is the Percentage of Population Employed in Real Estate, Rental & Leasing in Texas?
Percentage of Population Employed in Real Estate, Rental & Leasing in Texas is 2.0%.
What is the Percentage of Population Employed in Real Estate, Rental & Leasing in the United States?
Percentage of Population Employed in Real Estate, Rental & Leasing in the United States is 1.9%.