Lake Dunlap, TX Map & Demographics
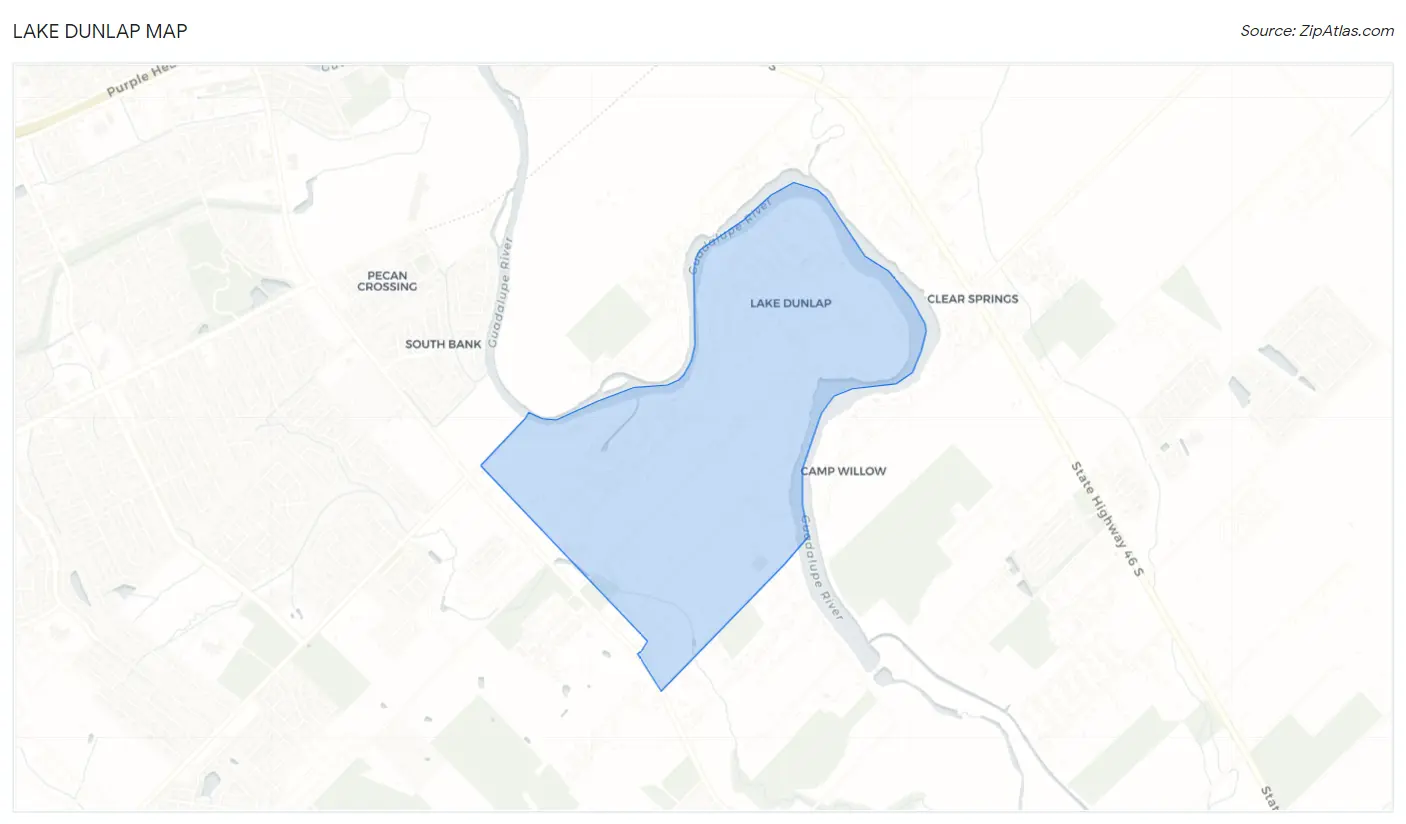
Lake Dunlap Map
Lake Dunlap Overview
$39,835
PER CAPITA INCOME
$117,877
AVG FAMILY INCOME
$101,667
AVG HOUSEHOLD INCOME
22.4%
WAGE / INCOME GAP [ % ]
77.6¢/ $1
WAGE / INCOME GAP [ $ ]
0.35
INEQUALITY / GINI INDEX
1,484
TOTAL POPULATION
773
MALE POPULATION
711
FEMALE POPULATION
108.72
MALES / 100 FEMALES
91.98
FEMALES / 100 MALES
41.9
MEDIAN AGE
3.4
AVG FAMILY SIZE
2.9
AVG HOUSEHOLD SIZE
740
LABOR FORCE [ PEOPLE ]
60.2%
PERCENT IN LABOR FORCE
Income in Lake Dunlap
Income Overview in Lake Dunlap
Per Capita Income in Lake Dunlap is $39,835, while median incomes of families and households are $117,877 and $101,667 respectively.
| Characteristic | Number | Measure |
| Per Capita Income | 1,484 | $39,835 |
| Median Family Income | 394 | $117,877 |
| Mean Family Income | 394 | $111,856 |
| Median Household Income | 516 | $101,667 |
| Mean Household Income | 516 | $96,734 |
| Income Deficit | 394 | $0 |
| Wage / Income Gap (%) | 1,484 | 22.38% |
| Wage / Income Gap ($) | 1,484 | 77.62¢ per $1 |
| Gini / Inequality Index | 1,484 | 0.35 |
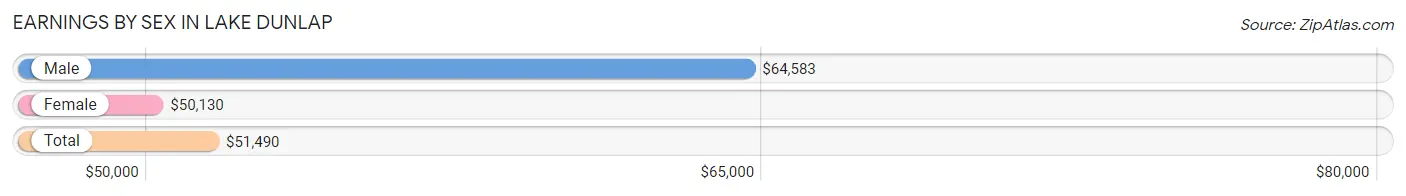
Earnings by Sex in Lake Dunlap
Average Earnings in Lake Dunlap are $51,490, $64,583 for men and $50,130 for women, a difference of 22.4%.
| Sex | Number | Average Earnings |
| Male | 434 (53.6%) | $64,583 |
| Female | 375 (46.4%) | $50,130 |
| Total | 809 (100.0%) | $51,490 |
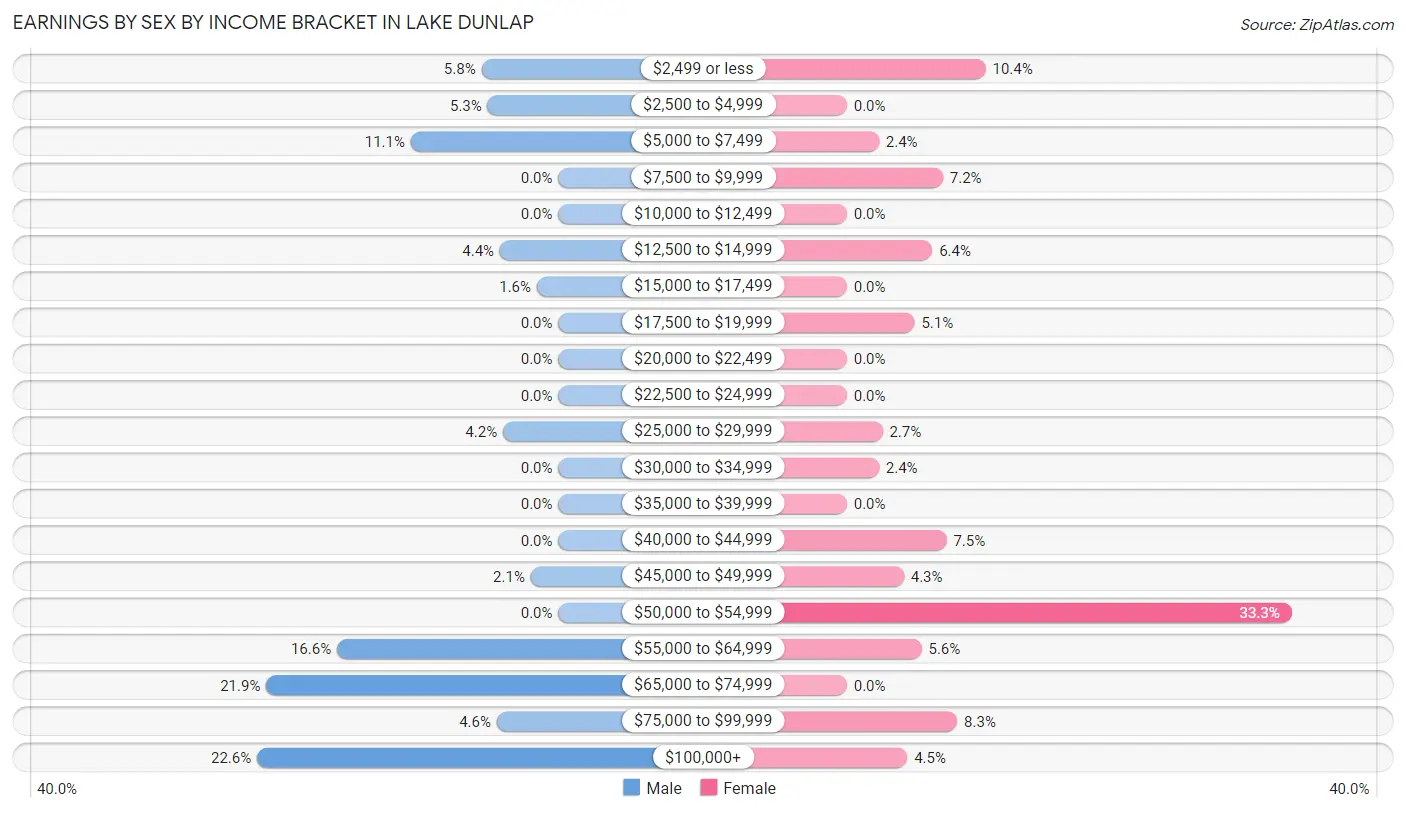
Earnings by Sex by Income Bracket in Lake Dunlap
The most common earnings brackets in Lake Dunlap are $100,000+ for men (98 | 22.6%) and $50,000 to $54,999 for women (125 | 33.3%).
| Income | Male | Female |
| $2,499 or less | 25 (5.8%) | 39 (10.4%) |
| $2,500 to $4,999 | 23 (5.3%) | 0 (0.0%) |
| $5,000 to $7,499 | 48 (11.1%) | 9 (2.4%) |
| $7,500 to $9,999 | 0 (0.0%) | 27 (7.2%) |
| $10,000 to $12,499 | 0 (0.0%) | 0 (0.0%) |
| $12,500 to $14,999 | 19 (4.4%) | 24 (6.4%) |
| $15,000 to $17,499 | 7 (1.6%) | 0 (0.0%) |
| $17,500 to $19,999 | 0 (0.0%) | 19 (5.1%) |
| $20,000 to $22,499 | 0 (0.0%) | 0 (0.0%) |
| $22,500 to $24,999 | 0 (0.0%) | 0 (0.0%) |
| $25,000 to $29,999 | 18 (4.2%) | 10 (2.7%) |
| $30,000 to $34,999 | 0 (0.0%) | 9 (2.4%) |
| $35,000 to $39,999 | 0 (0.0%) | 0 (0.0%) |
| $40,000 to $44,999 | 0 (0.0%) | 28 (7.5%) |
| $45,000 to $49,999 | 9 (2.1%) | 16 (4.3%) |
| $50,000 to $54,999 | 0 (0.0%) | 125 (33.3%) |
| $55,000 to $64,999 | 72 (16.6%) | 21 (5.6%) |
| $65,000 to $74,999 | 95 (21.9%) | 0 (0.0%) |
| $75,000 to $99,999 | 20 (4.6%) | 31 (8.3%) |
| $100,000+ | 98 (22.6%) | 17 (4.5%) |
| Total | 434 (100.0%) | 375 (100.0%) |
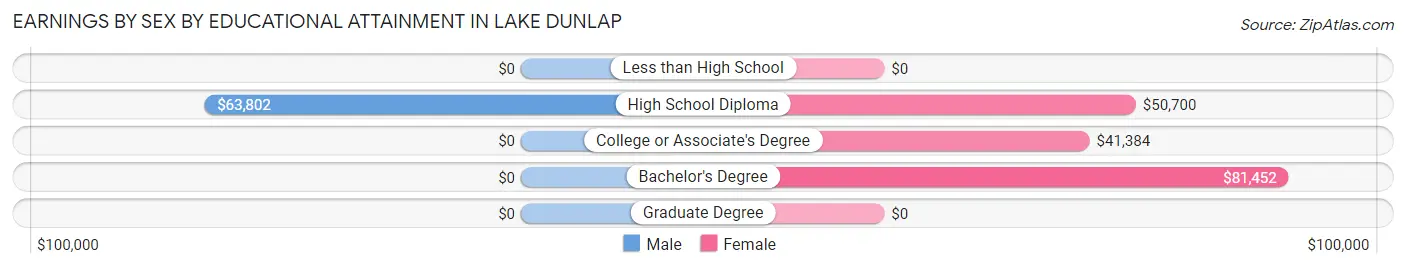
Earnings by Sex by Educational Attainment in Lake Dunlap
Average earnings in Lake Dunlap are $70,956 for men and $50,520 for women, a difference of 28.8%. Men with an educational attainment of high school diploma enjoy the highest average annual earnings of $63,802, while those with high school diploma education earn the least with $63,802. Women with an educational attainment of bachelor's degree earn the most with the average annual earnings of $81,452, while those with college or associate's degree education have the smallest earnings of $41,384.
| Educational Attainment | Male Income | Female Income |
| Less than High School | - | - |
| High School Diploma | $63,802 | $50,700 |
| College or Associate's Degree | - | - |
| Bachelor's Degree | - | - |
| Graduate Degree | - | - |
| Total | $70,956 | $50,520 |
Family Income in Lake Dunlap
Family Income Brackets in Lake Dunlap
According to the Lake Dunlap family income data, there are 209 families falling into the $100,000 to $149,999 income range, which is the most common income bracket and makes up 53.0% of all families.
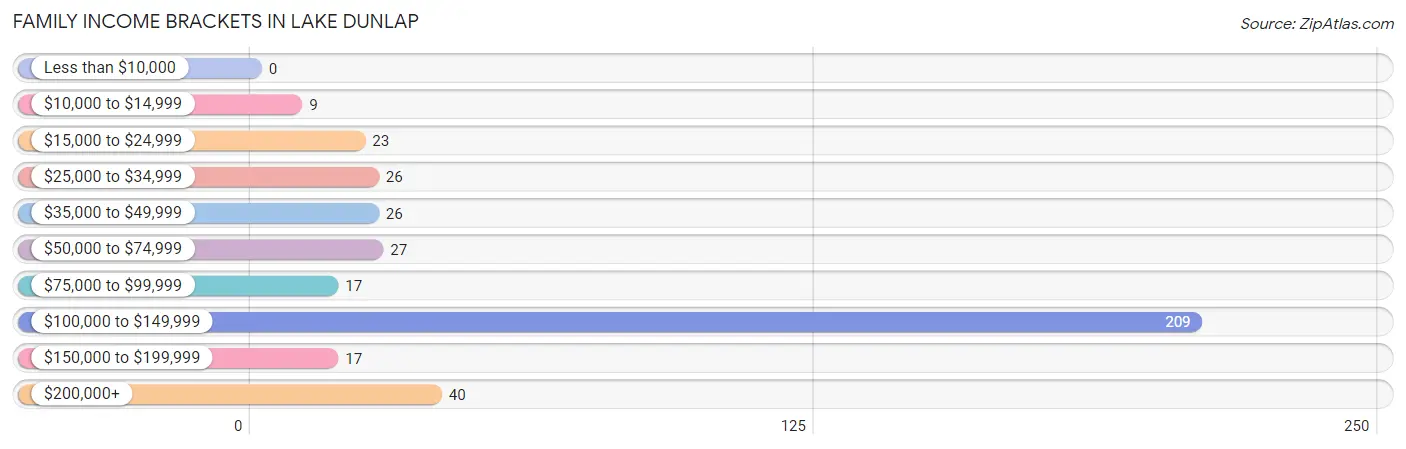
| Income Bracket | # Families | % Families |
| Less than $10,000 | 0 | 0.0% |
| $10,000 to $14,999 | 9 | 2.3% |
| $15,000 to $24,999 | 23 | 5.8% |
| $25,000 to $34,999 | 26 | 6.6% |
| $35,000 to $49,999 | 26 | 6.6% |
| $50,000 to $74,999 | 27 | 6.9% |
| $75,000 to $99,999 | 17 | 4.3% |
| $100,000 to $149,999 | 209 | 53.0% |
| $150,000 to $199,999 | 17 | 4.3% |
| $200,000+ | 40 | 10.2% |
Family Income by Famaliy Size in Lake Dunlap
3-person families (212 | 53.8%) account for the highest median family income in Lake Dunlap with $120,227 per family, while 3-person families (212 | 53.8%) have the highest median income of $40,076 per family member.
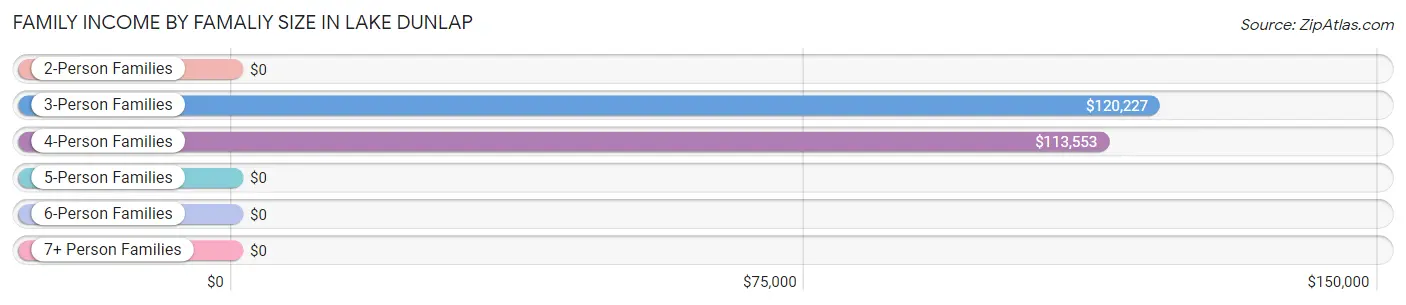
| Income Bracket | # Families | Median Income |
| 2-Person Families | 93 (23.6%) | $0 |
| 3-Person Families | 212 (53.8%) | $120,227 |
| 4-Person Families | 46 (11.7%) | $113,553 |
| 5-Person Families | 43 (10.9%) | $0 |
| 6-Person Families | 0 (0.0%) | $0 |
| 7+ Person Families | 0 (0.0%) | $0 |
| Total | 394 (100.0%) | $117,877 |
Family Income by Number of Earners in Lake Dunlap
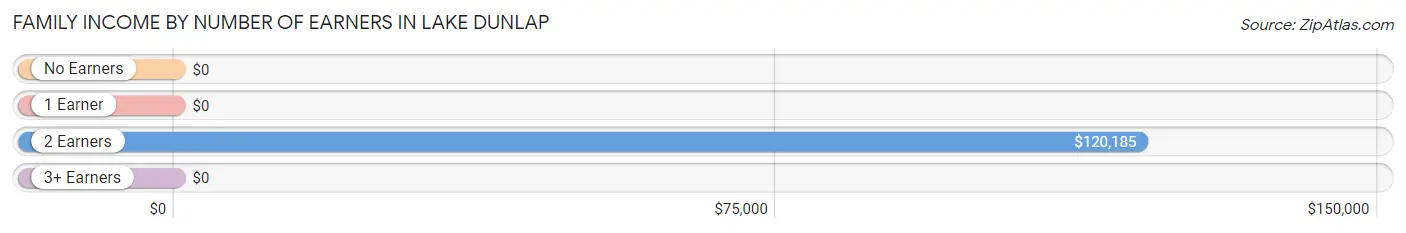
| Number of Earners | # Families | Median Income |
| No Earners | 59 (15.0%) | $0 |
| 1 Earner | 84 (21.3%) | $0 |
| 2 Earners | 211 (53.5%) | $120,185 |
| 3+ Earners | 40 (10.2%) | $0 |
| Total | 394 (100.0%) | $117,877 |
Household Income in Lake Dunlap
Household Income Brackets in Lake Dunlap
With 209 households falling in the category, the $100,000 to $149,999 income range is the most frequent in Lake Dunlap, accounting for 40.5% of all households.
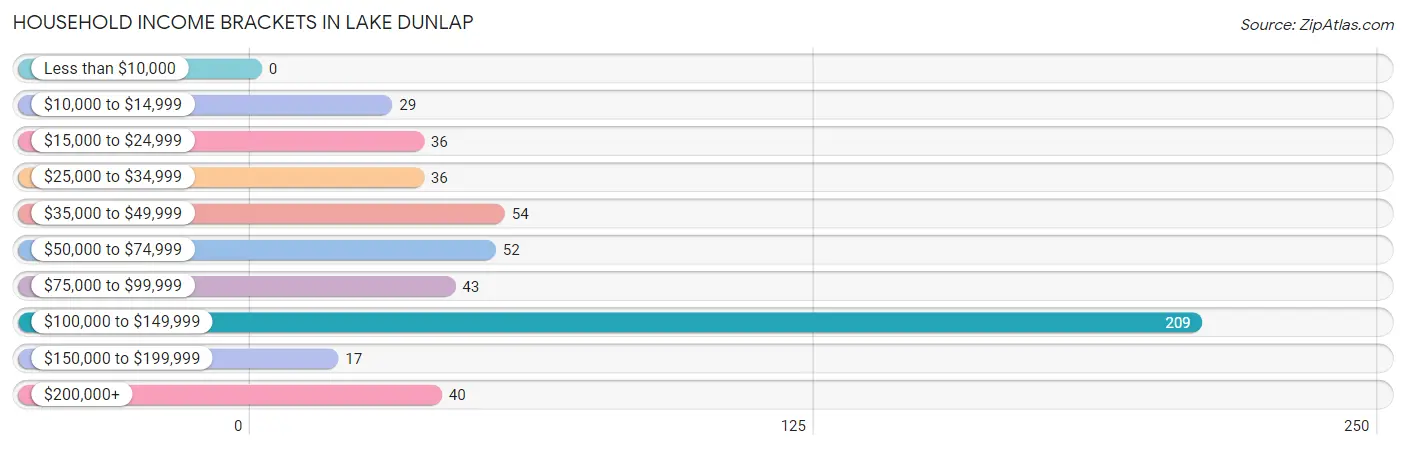
| Income Bracket | # Households | % Households |
| Less than $10,000 | 0 | 0.0% |
| $10,000 to $14,999 | 29 | 5.6% |
| $15,000 to $24,999 | 36 | 7.0% |
| $25,000 to $34,999 | 36 | 7.0% |
| $35,000 to $49,999 | 54 | 10.5% |
| $50,000 to $74,999 | 52 | 10.1% |
| $75,000 to $99,999 | 43 | 8.3% |
| $100,000 to $149,999 | 209 | 40.5% |
| $150,000 to $199,999 | 17 | 3.3% |
| $200,000+ | 40 | 7.8% |
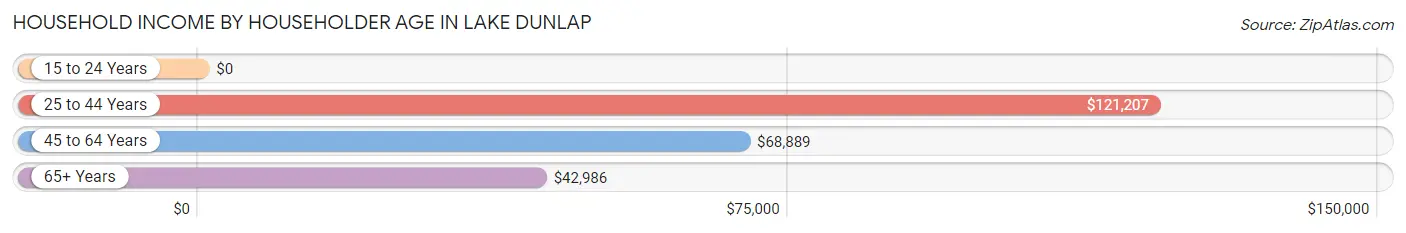
Household Income by Householder Age in Lake Dunlap
The median household income in Lake Dunlap is $101,667, with the highest median household income of $121,207 found in the 25 to 44 years age bracket for the primary householder. A total of 205 households (39.7%) fall into this category.
| Income Bracket | # Households | Median Income |
| 15 to 24 Years | 0 (0.0%) | $0 |
| 25 to 44 Years | 205 (39.7%) | $121,207 |
| 45 to 64 Years | 170 (33.0%) | $68,889 |
| 65+ Years | 141 (27.3%) | $42,986 |
| Total | 516 (100.0%) | $101,667 |
Poverty in Lake Dunlap
Income Below Poverty by Sex and Age in Lake Dunlap
With 2.5% poverty level for males and 9.6% for females among the residents of Lake Dunlap, under 5 year old males and 6 to 11 year old females are the most vulnerable to poverty, with 10 males (23.3%) and 16 females (31.4%) in their respective age groups living below the poverty level.
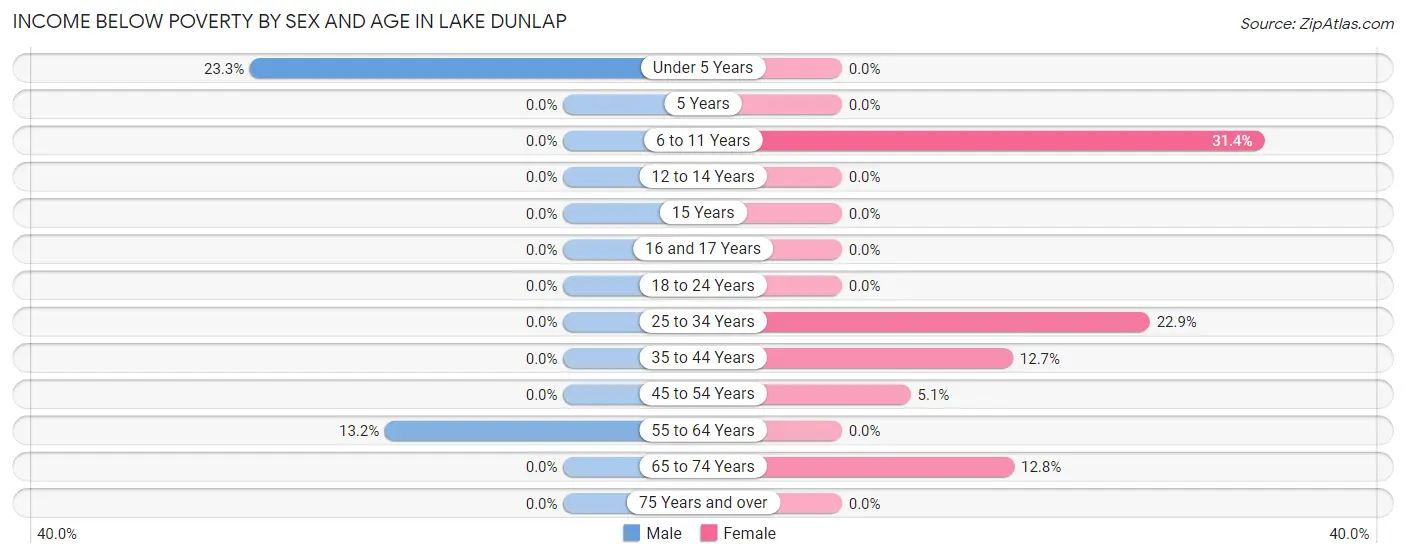
| Age Bracket | Male | Female |
| Under 5 Years | 10 (23.3%) | 0 (0.0%) |
| 5 Years | 0 (0.0%) | 0 (0.0%) |
| 6 to 11 Years | 0 (0.0%) | 16 (31.4%) |
| 12 to 14 Years | 0 (0.0%) | 0 (0.0%) |
| 15 Years | 0 (0.0%) | 0 (0.0%) |
| 16 and 17 Years | 0 (0.0%) | 0 (0.0%) |
| 18 to 24 Years | 0 (0.0%) | 0 (0.0%) |
| 25 to 34 Years | 0 (0.0%) | 24 (22.9%) |
| 35 to 44 Years | 0 (0.0%) | 8 (12.7%) |
| 45 to 54 Years | 0 (0.0%) | 9 (5.1%) |
| 55 to 64 Years | 9 (13.2%) | 0 (0.0%) |
| 65 to 74 Years | 0 (0.0%) | 11 (12.8%) |
| 75 Years and over | 0 (0.0%) | 0 (0.0%) |
| Total | 19 (2.5%) | 68 (9.6%) |
Income Above Poverty by Sex and Age in Lake Dunlap
According to the poverty statistics in Lake Dunlap, males aged 5 years and females aged under 5 years are the age groups that are most secure financially, with 100.0% of males and 100.0% of females in these age groups living above the poverty line.
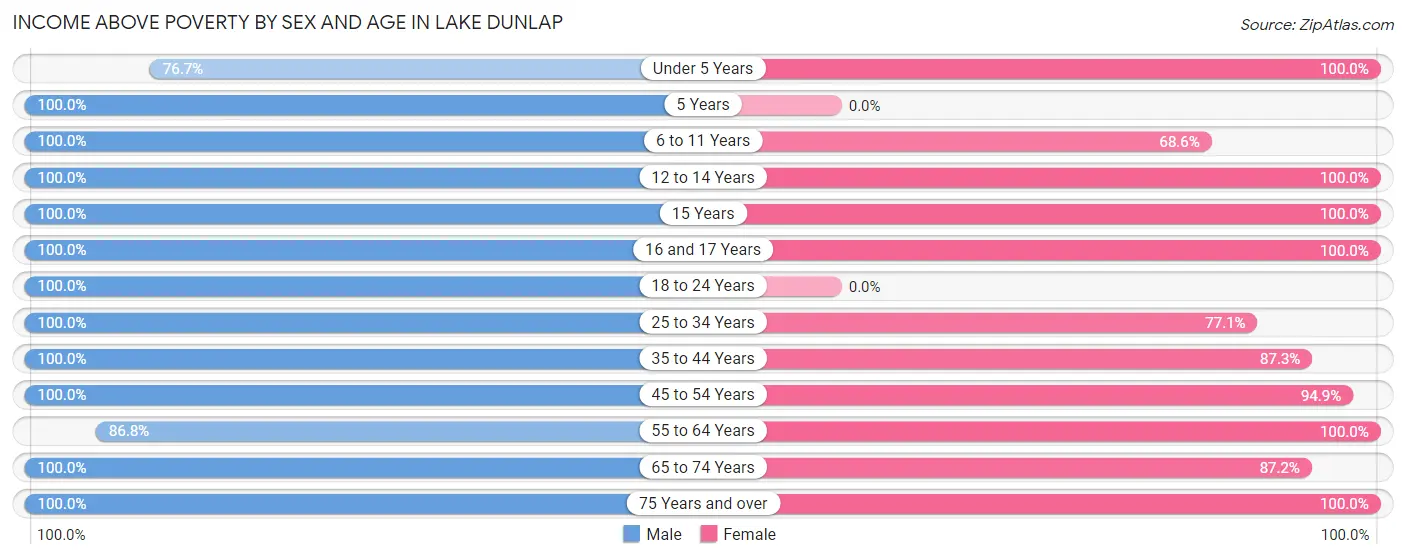
| Age Bracket | Male | Female |
| Under 5 Years | 33 (76.7%) | 40 (100.0%) |
| 5 Years | 15 (100.0%) | 0 (0.0%) |
| 6 to 11 Years | 17 (100.0%) | 35 (68.6%) |
| 12 to 14 Years | 36 (100.0%) | 34 (100.0%) |
| 15 Years | 9 (100.0%) | 9 (100.0%) |
| 16 and 17 Years | 73 (100.0%) | 39 (100.0%) |
| 18 to 24 Years | 84 (100.0%) | 0 (0.0%) |
| 25 to 34 Years | 43 (100.0%) | 81 (77.1%) |
| 35 to 44 Years | 137 (100.0%) | 55 (87.3%) |
| 45 to 54 Years | 168 (100.0%) | 167 (94.9%) |
| 55 to 64 Years | 59 (86.8%) | 74 (100.0%) |
| 65 to 74 Years | 51 (100.0%) | 75 (87.2%) |
| 75 Years and over | 29 (100.0%) | 34 (100.0%) |
| Total | 754 (97.5%) | 643 (90.4%) |
Income Below Poverty Among Married-Couple Families in Lake Dunlap
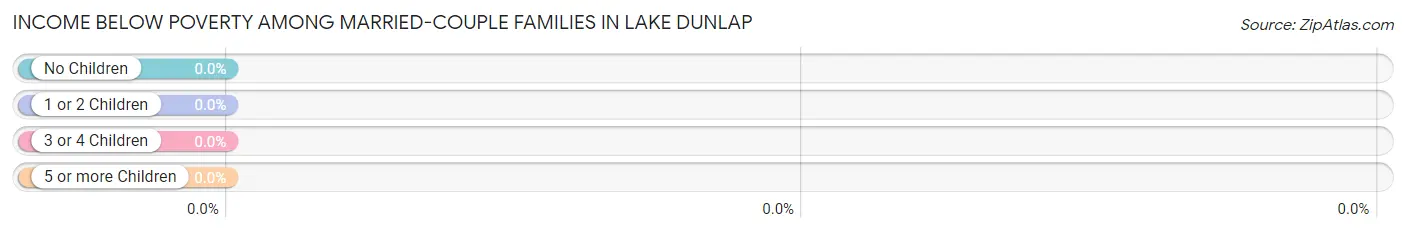
| Children | Above Poverty | Below Poverty |
| No Children | 104 (100.0%) | 0 (0.0%) |
| 1 or 2 Children | 253 (100.0%) | 0 (0.0%) |
| 3 or 4 Children | 0 (0.0%) | 0 (0.0%) |
| 5 or more Children | 0 (0.0%) | 0 (0.0%) |
| Total | 357 (100.0%) | 0 (0.0%) |
Income Below Poverty Among Single-Parent Households in Lake Dunlap
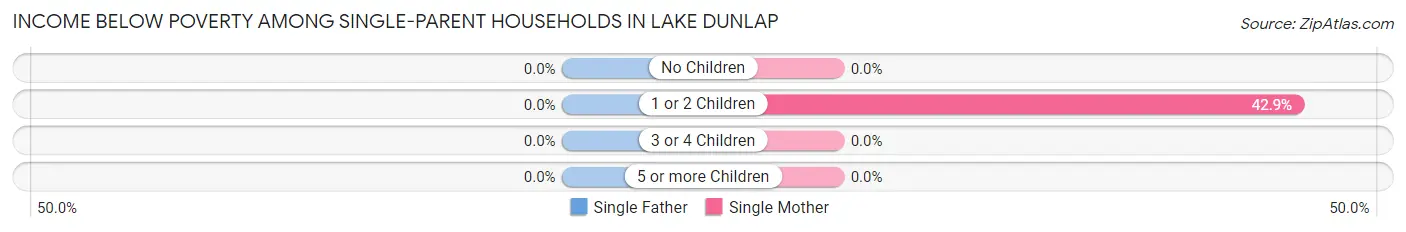
| Children | Single Father | Single Mother |
| No Children | 0 (0.0%) | 0 (0.0%) |
| 1 or 2 Children | 0 (0.0%) | 9 (42.9%) |
| 3 or 4 Children | 0 (0.0%) | 0 (0.0%) |
| 5 or more Children | 0 (0.0%) | 0 (0.0%) |
| Total | 0 (0.0%) | 9 (42.9%) |
Income Below Poverty Among Married-Couple vs Single-Parent Households in Lake Dunlap
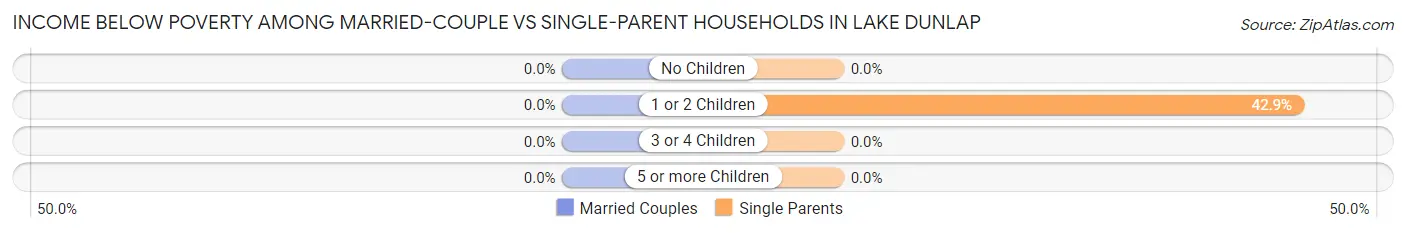
| Children | Married-Couple Families | Single-Parent Households |
| No Children | 0 (0.0%) | 0 (0.0%) |
| 1 or 2 Children | 0 (0.0%) | 9 (42.9%) |
| 3 or 4 Children | 0 (0.0%) | 0 (0.0%) |
| 5 or more Children | 0 (0.0%) | 0 (0.0%) |
| Total | 0 (0.0%) | 9 (24.3%) |
Race in Lake Dunlap
The most populous races in Lake Dunlap are White / Caucasian (1,319 | 88.9%), Hispanic or Latino (309 | 20.8%), and Two or more Races (112 | 7.5%).
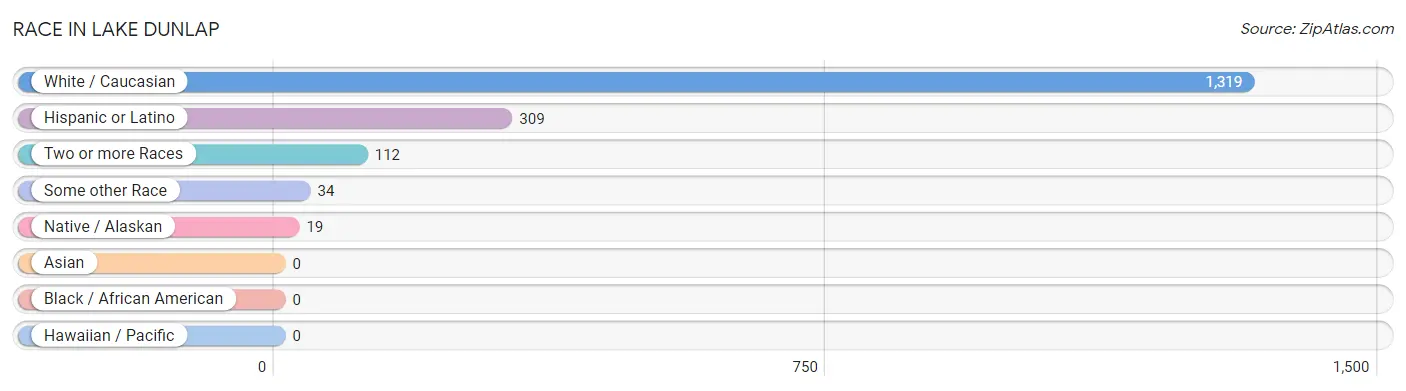
| Race | # Population | % Population |
| Asian | 0 | 0.0% |
| Black / African American | 0 | 0.0% |
| Hawaiian / Pacific | 0 | 0.0% |
| Hispanic or Latino | 309 | 20.8% |
| Native / Alaskan | 19 | 1.3% |
| White / Caucasian | 1,319 | 88.9% |
| Two or more Races | 112 | 7.5% |
| Some other Race | 34 | 2.3% |
| Total | 1,484 | 100.0% |
Ancestry in Lake Dunlap
The most populous ancestries reported in Lake Dunlap are German (268 | 18.1%), Mexican (231 | 15.6%), French (165 | 11.1%), English (130 | 8.8%), and Irish (99 | 6.7%), together accounting for 60.2% of all Lake Dunlap residents.
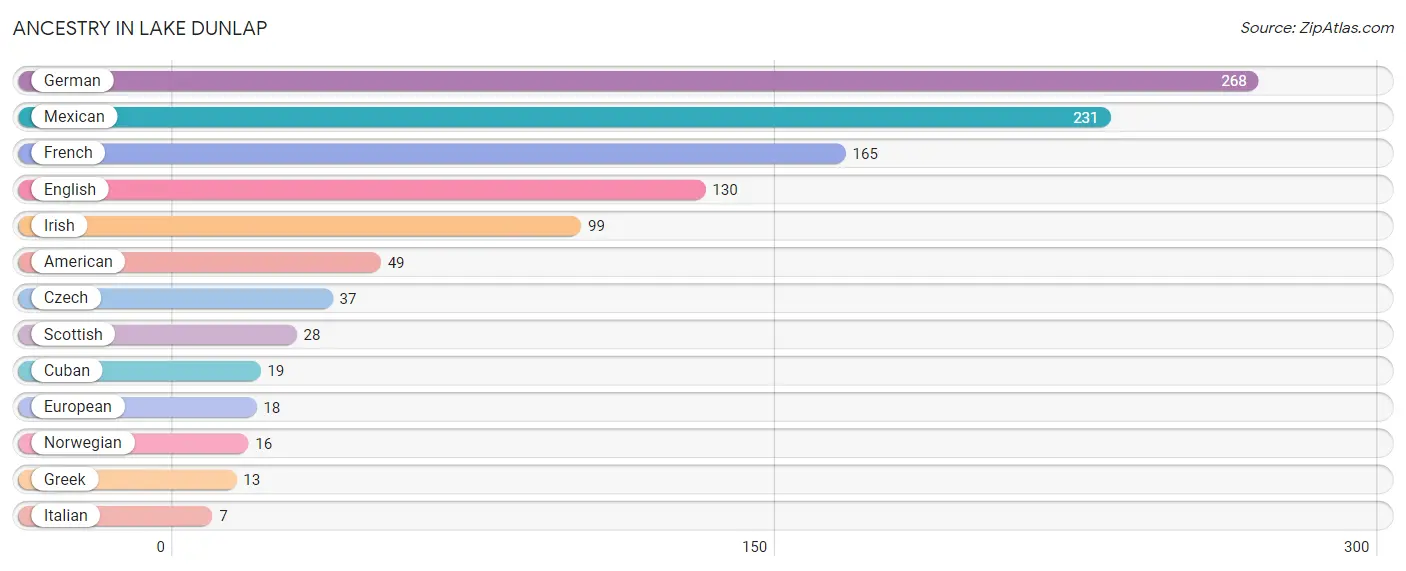
| Ancestry | # Population | % Population |
| American | 49 | 3.3% |
| Cuban | 19 | 1.3% |
| Czech | 37 | 2.5% |
| English | 130 | 8.8% |
| European | 18 | 1.2% |
| French | 165 | 11.1% |
| German | 268 | 18.1% |
| Greek | 13 | 0.9% |
| Irish | 99 | 6.7% |
| Italian | 7 | 0.5% |
| Mexican | 231 | 15.6% |
| Norwegian | 16 | 1.1% |
| Scottish | 28 | 1.9% | View All 13 Rows |
Immigrants in Lake Dunlap
The most numerous immigrant groups reported in Lake Dunlap came from Central America (104 | 7.0%), Latin America (104 | 7.0%), Mexico (104 | 7.0%), Asia (17 | 1.1%), and Israel (17 | 1.1%), together accounting for 23.3% of all Lake Dunlap residents.
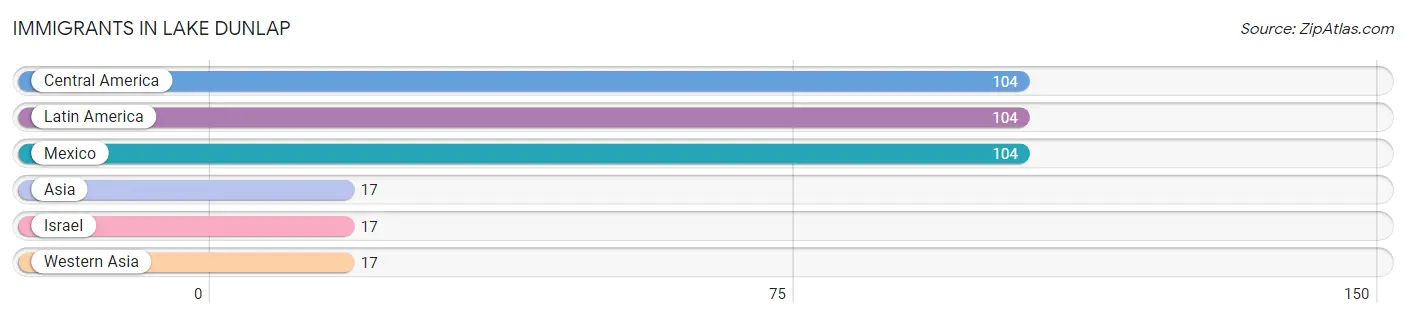
| Immigration Origin | # Population | % Population |
| Asia | 17 | 1.1% |
| Central America | 104 | 7.0% |
| Israel | 17 | 1.1% |
| Latin America | 104 | 7.0% |
| Mexico | 104 | 7.0% |
| Western Asia | 17 | 1.1% | View All 6 Rows |
Sex and Age in Lake Dunlap
Sex and Age in Lake Dunlap
The most populous age groups in Lake Dunlap are 40 to 44 Years (106 | 13.7%) for men and 45 to 49 Years (124 | 17.4%) for women.
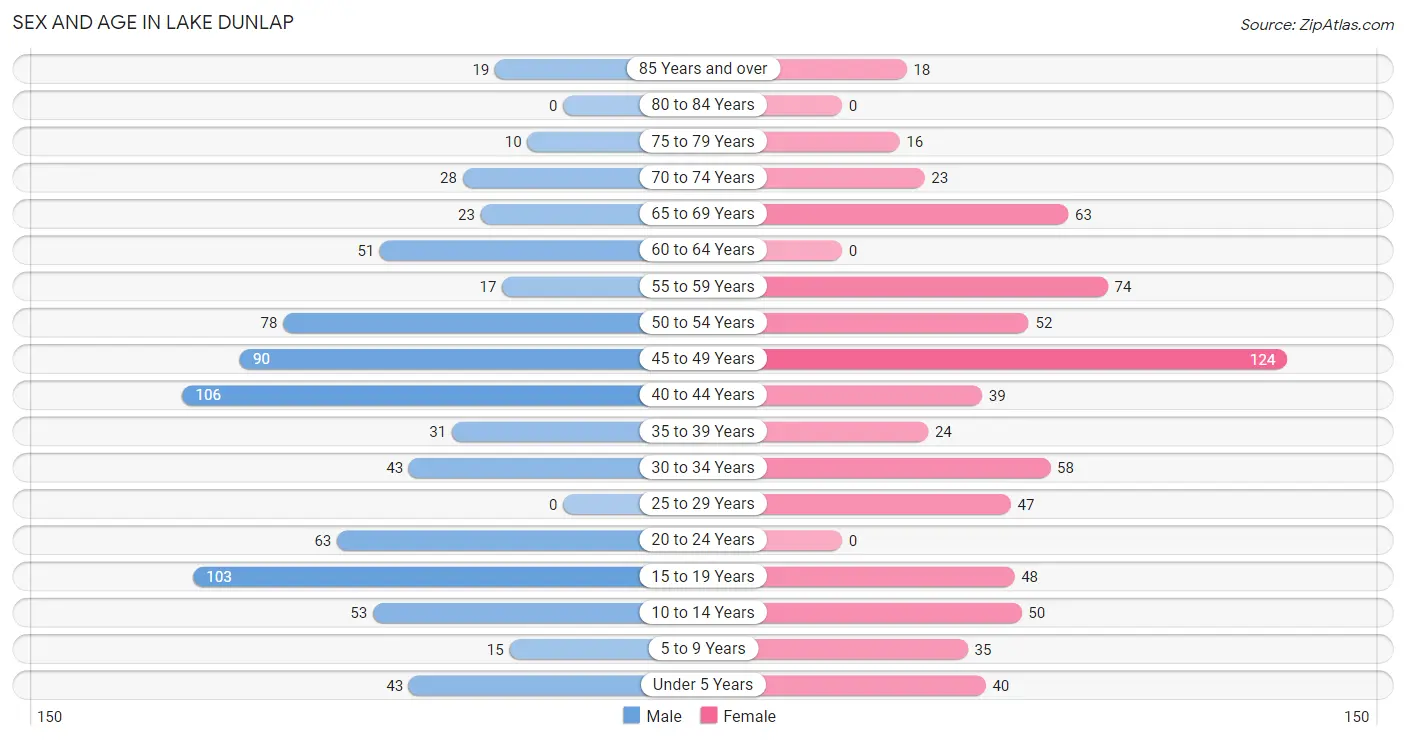
| Age Bracket | Male | Female |
| Under 5 Years | 43 (5.6%) | 40 (5.6%) |
| 5 to 9 Years | 15 (1.9%) | 35 (4.9%) |
| 10 to 14 Years | 53 (6.9%) | 50 (7.0%) |
| 15 to 19 Years | 103 (13.3%) | 48 (6.8%) |
| 20 to 24 Years | 63 (8.2%) | 0 (0.0%) |
| 25 to 29 Years | 0 (0.0%) | 47 (6.6%) |
| 30 to 34 Years | 43 (5.6%) | 58 (8.2%) |
| 35 to 39 Years | 31 (4.0%) | 24 (3.4%) |
| 40 to 44 Years | 106 (13.7%) | 39 (5.5%) |
| 45 to 49 Years | 90 (11.6%) | 124 (17.4%) |
| 50 to 54 Years | 78 (10.1%) | 52 (7.3%) |
| 55 to 59 Years | 17 (2.2%) | 74 (10.4%) |
| 60 to 64 Years | 51 (6.6%) | 0 (0.0%) |
| 65 to 69 Years | 23 (3.0%) | 63 (8.9%) |
| 70 to 74 Years | 28 (3.6%) | 23 (3.2%) |
| 75 to 79 Years | 10 (1.3%) | 16 (2.2%) |
| 80 to 84 Years | 0 (0.0%) | 0 (0.0%) |
| 85 Years and over | 19 (2.5%) | 18 (2.5%) |
| Total | 773 (100.0%) | 711 (100.0%) |
Families and Households in Lake Dunlap
Median Family Size in Lake Dunlap
The median family size in Lake Dunlap is 3.41 persons per family, with single female/mother families (21 | 5.3%) accounting for the largest median family size of 5.86 persons per family. On the other hand, single male/father families (16 | 4.1%) represent the smallest median family size with 2.13 persons per family.
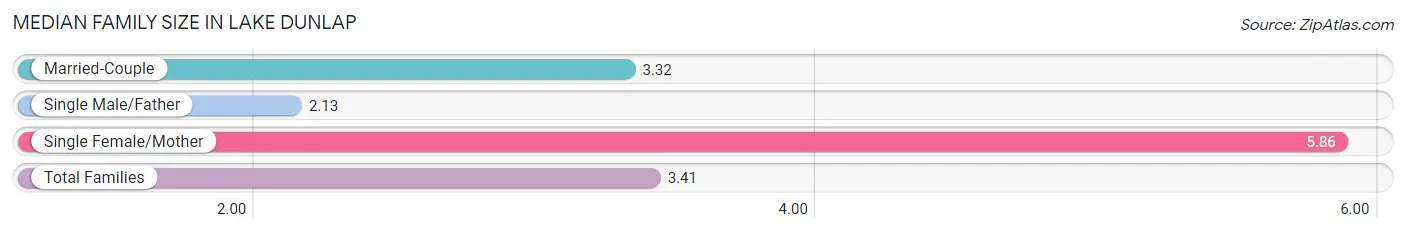
| Family Type | # Families | Family Size |
| Married-Couple | 357 (90.6%) | 3.32 |
| Single Male/Father | 16 (4.1%) | 2.13 |
| Single Female/Mother | 21 (5.3%) | 5.86 |
| Total Families | 394 (100.0%) | 3.41 |
Median Household Size in Lake Dunlap
The median household size in Lake Dunlap is 2.88 persons per household, with single female/mother households (21 | 4.1%) accounting for the largest median household size of 5.86 persons per household. non-family households (122 | 23.6%) represent the smallest median household size with 1.15 persons per household.
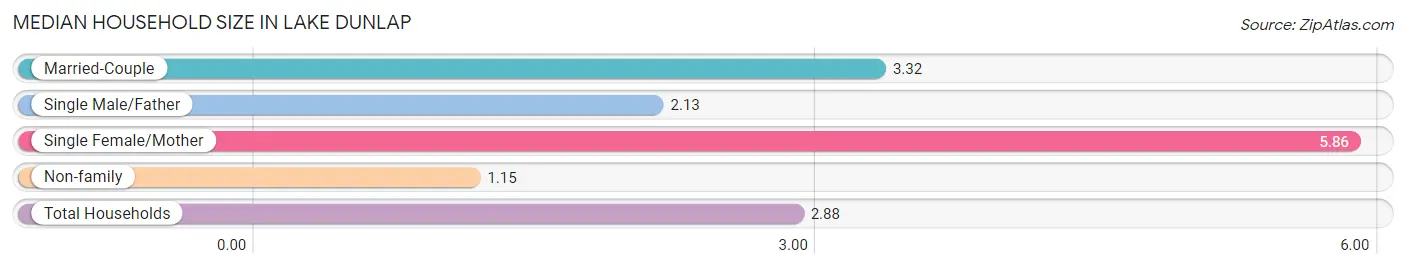
| Household Type | # Households | Household Size |
| Married-Couple | 357 (69.2%) | 3.32 |
| Single Male/Father | 16 (3.1%) | 2.13 |
| Single Female/Mother | 21 (4.1%) | 5.86 |
| Non-family | 122 (23.6%) | 1.15 |
| Total Households | 516 (100.0%) | 2.88 |
Household Size by Marriage Status in Lake Dunlap
Out of a total of 516 households in Lake Dunlap, 394 (76.4%) are family households, while 122 (23.6%) are nonfamily households. The most numerous type of family households are 3-person households, comprising 212, and the most common type of nonfamily households are 1-person households, comprising 105.
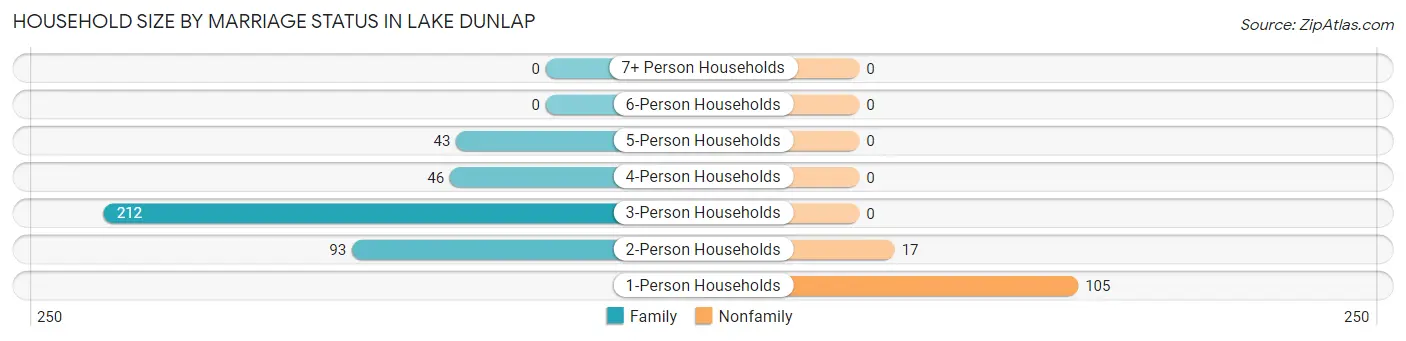
| Household Size | Family Households | Nonfamily Households |
| 1-Person Households | - | 105 (20.3%) |
| 2-Person Households | 93 (18.0%) | 17 (3.3%) |
| 3-Person Households | 212 (41.1%) | 0 (0.0%) |
| 4-Person Households | 46 (8.9%) | 0 (0.0%) |
| 5-Person Households | 43 (8.3%) | 0 (0.0%) |
| 6-Person Households | 0 (0.0%) | 0 (0.0%) |
| 7+ Person Households | 0 (0.0%) | 0 (0.0%) |
| Total | 394 (76.4%) | 122 (23.6%) |
Female Fertility in Lake Dunlap
Fertility by Age in Lake Dunlap
| Age Bracket | Women with Births | Births / 1,000 Women |
| 15 to 19 years | 0 (0.0%) | 0.0 |
| 20 to 34 years | 0 (0.0%) | 0.0 |
| 35 to 50 years | 0 (0.0%) | 0.0 |
| Total | 0 (0.0%) | 0.0 |
Fertility by Age by Marriage Status in Lake Dunlap
| Age Bracket | Married | Unmarried |
| 15 to 19 years | 0 (0.0%) | 0 (0.0%) |
| 20 to 34 years | 0 (0.0%) | 0 (0.0%) |
| 35 to 50 years | 0 (0.0%) | 0 (0.0%) |
| Total | 0 (0.0%) | 0 (0.0%) |
Fertility by Education in Lake Dunlap
| Educational Attainment | Women with Births | Births / 1,000 Women |
| Less than High School | 0 (0.0%) | 0.0 |
| High School Diploma | 0 (0.0%) | 0.0 |
| College or Associate's Degree | 0 (0.0%) | 0.0 |
| Bachelor's Degree | 0 (0.0%) | 0.0 |
| Graduate Degree | 0 (0.0%) | 0.0 |
| Total | 0 (0.0%) | 0.0 |
Fertility by Education by Marriage Status in Lake Dunlap
| Educational Attainment | Married | Unmarried |
| Less than High School | 0 (0.0%) | 0 (0.0%) |
| High School Diploma | 0 (0.0%) | 0 (0.0%) |
| College or Associate's Degree | 0 (0.0%) | 0 (0.0%) |
| Bachelor's Degree | 0 (0.0%) | 0 (0.0%) |
| Graduate Degree | 0 (0.0%) | 0 (0.0%) |
| Total | 0 (0.0%) | 0 (0.0%) |
Employment Characteristics in Lake Dunlap
Employment by Class of Employer in Lake Dunlap
Among the 731 employed individuals in Lake Dunlap, private company employees (651 | 89.1%), self-employed (not incorporated) (49 | 6.7%), and local government employees (12 | 1.6%) make up the most common classes of employment.
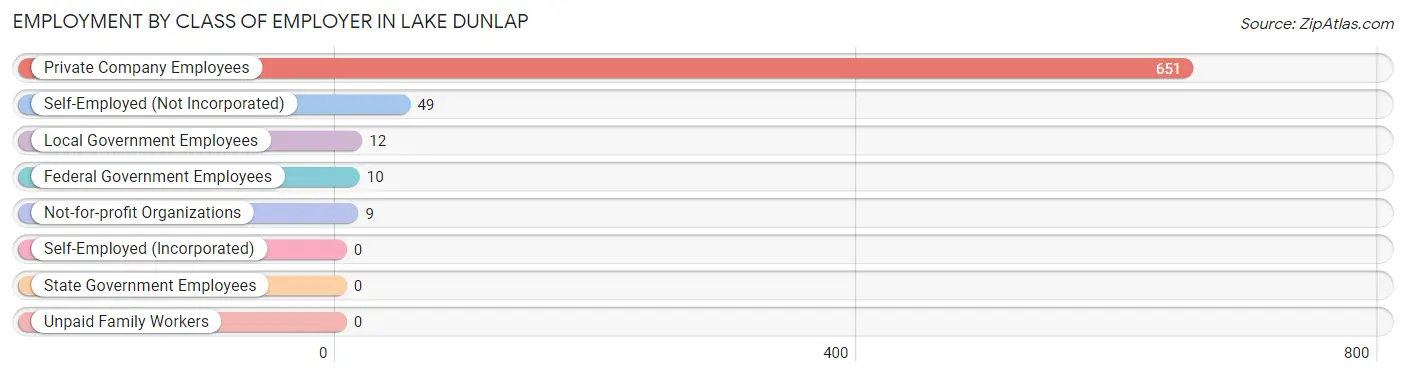
| Employer Class | # Employees | % Employees |
| Private Company Employees | 651 | 89.1% |
| Self-Employed (Incorporated) | 0 | 0.0% |
| Self-Employed (Not Incorporated) | 49 | 6.7% |
| Not-for-profit Organizations | 9 | 1.2% |
| Local Government Employees | 12 | 1.6% |
| State Government Employees | 0 | 0.0% |
| Federal Government Employees | 10 | 1.4% |
| Unpaid Family Workers | 0 | 0.0% |
| Total | 731 | 100.0% |
Employment Status by Age in Lake Dunlap
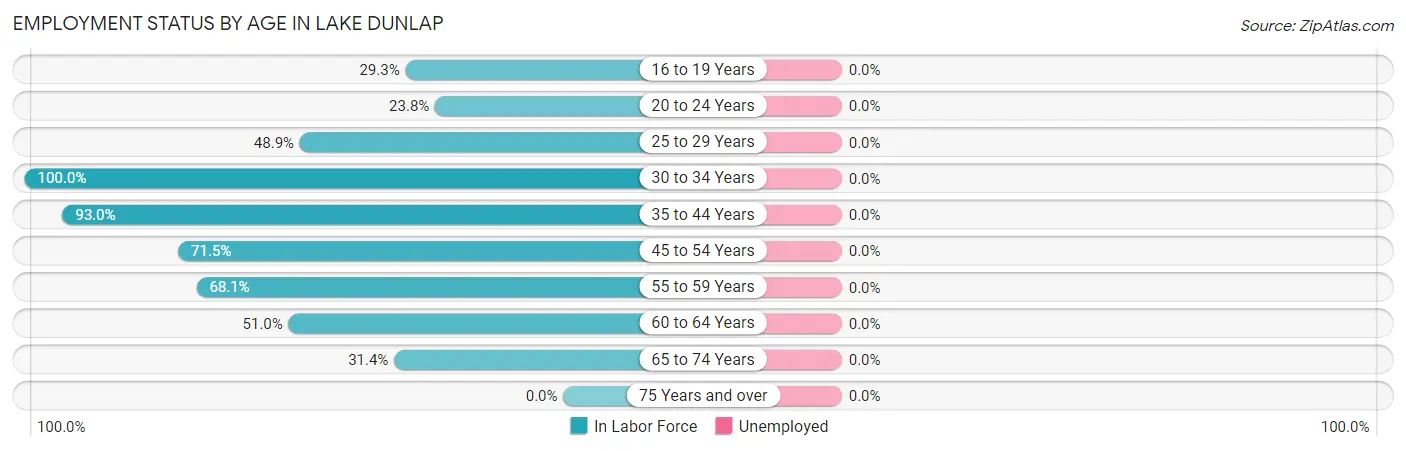
| Age Bracket | In Labor Force | Unemployed |
| 16 to 19 Years | 39 (29.3%) | 0 (0.0%) |
| 20 to 24 Years | 15 (23.8%) | 0 (0.0%) |
| 25 to 29 Years | 23 (48.9%) | 0 (0.0%) |
| 30 to 34 Years | 101 (100.0%) | 0 (0.0%) |
| 35 to 44 Years | 186 (93.0%) | 0 (0.0%) |
| 45 to 54 Years | 246 (71.5%) | 0 (0.0%) |
| 55 to 59 Years | 62 (68.1%) | 0 (0.0%) |
| 60 to 64 Years | 26 (51.0%) | 0 (0.0%) |
| 65 to 74 Years | 43 (31.4%) | 0 (0.0%) |
| 75 Years and over | 0 (0.0%) | 0 (0.0%) |
| Total | 740 (60.2%) | 0 (0.0%) |
Employment Status by Educational Attainment in Lake Dunlap
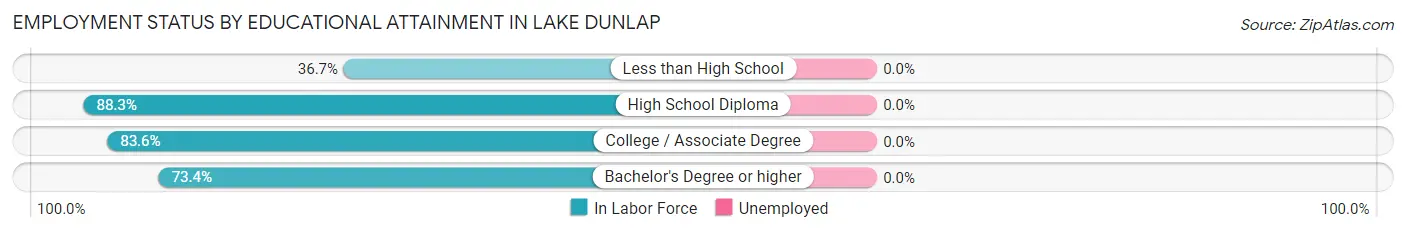
| Educational Attainment | In Labor Force | Unemployed |
| Less than High School | 44 (36.7%) | 0 (0.0%) |
| High School Diploma | 241 (88.3%) | 0 (0.0%) |
| College / Associate Degree | 290 (83.6%) | 0 (0.0%) |
| Bachelor's Degree or higher | 69 (73.4%) | 0 (0.0%) |
| Total | 644 (77.2%) | 0 (0.0%) |
Employment Occupations by Sex in Lake Dunlap
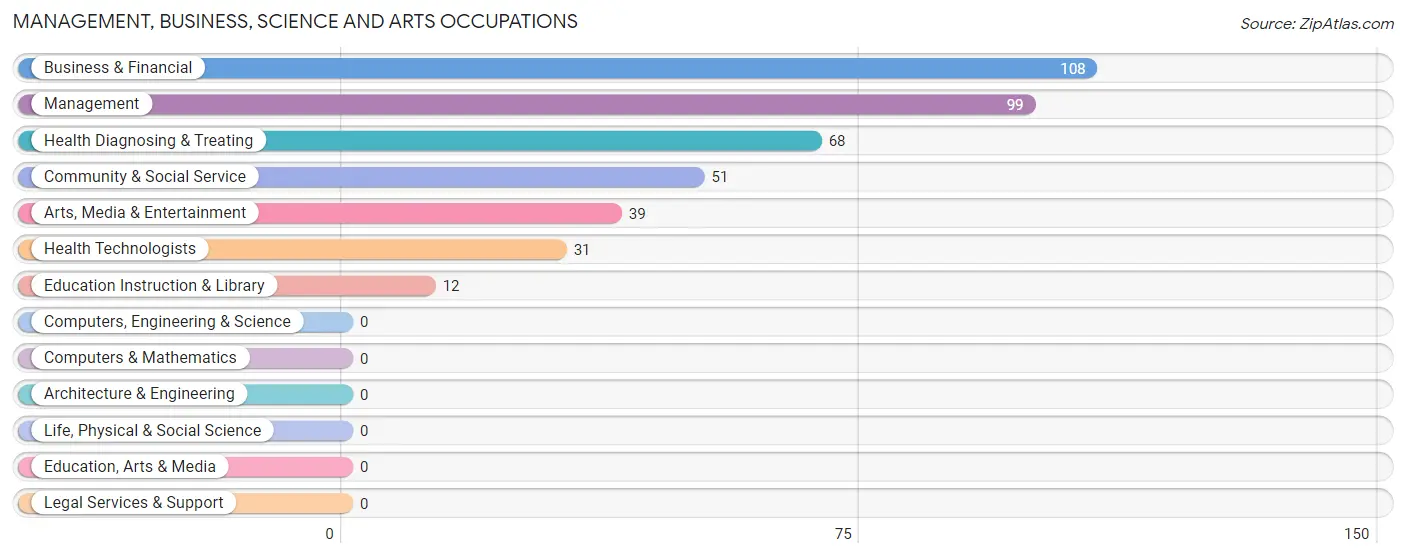
Management, Business, Science and Arts Occupations
The most common Management, Business, Science and Arts occupations in Lake Dunlap are Business & Financial (108 | 14.6%), Management (99 | 13.4%), Health Diagnosing & Treating (68 | 9.2%), Community & Social Service (51 | 6.9%), and Arts, Media & Entertainment (39 | 5.3%).
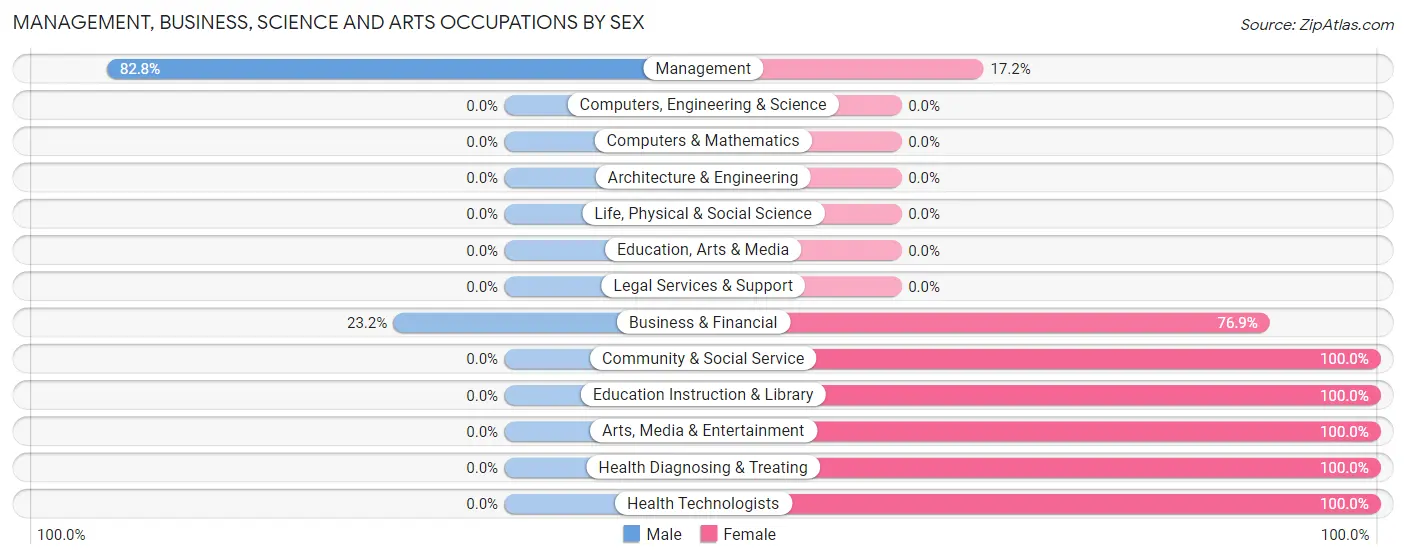
Management, Business, Science and Arts Occupations by Sex
Within the Management, Business, Science and Arts occupations in Lake Dunlap, the most male-oriented occupations are Management (82.8%), and Business & Financial (23.2%), while the most female-oriented occupations are Community & Social Service (100.0%), Education Instruction & Library (100.0%), and Arts, Media & Entertainment (100.0%).
| Occupation | Male | Female |
| Management | 82 (82.8%) | 17 (17.2%) |
| Business & Financial | 25 (23.2%) | 83 (76.8%) |
| Computers, Engineering & Science | 0 (0.0%) | 0 (0.0%) |
| Computers & Mathematics | 0 (0.0%) | 0 (0.0%) |
| Architecture & Engineering | 0 (0.0%) | 0 (0.0%) |
| Life, Physical & Social Science | 0 (0.0%) | 0 (0.0%) |
| Community & Social Service | 0 (0.0%) | 51 (100.0%) |
| Education, Arts & Media | 0 (0.0%) | 0 (0.0%) |
| Legal Services & Support | 0 (0.0%) | 0 (0.0%) |
| Education Instruction & Library | 0 (0.0%) | 12 (100.0%) |
| Arts, Media & Entertainment | 0 (0.0%) | 39 (100.0%) |
| Health Diagnosing & Treating | 0 (0.0%) | 68 (100.0%) |
| Health Technologists | 0 (0.0%) | 31 (100.0%) |
| Total (Category) | 107 (32.8%) | 219 (67.2%) |
| Total (Overall) | 366 (49.4%) | 375 (50.6%) |
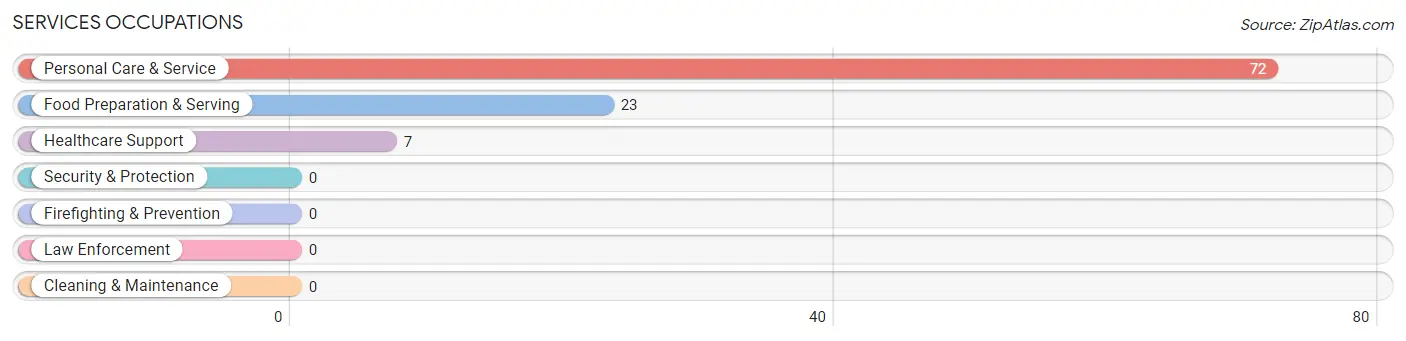
Services Occupations
The most common Services occupations in Lake Dunlap are Personal Care & Service (72 | 9.7%), Food Preparation & Serving (23 | 3.1%), and Healthcare Support (7 | 0.9%).
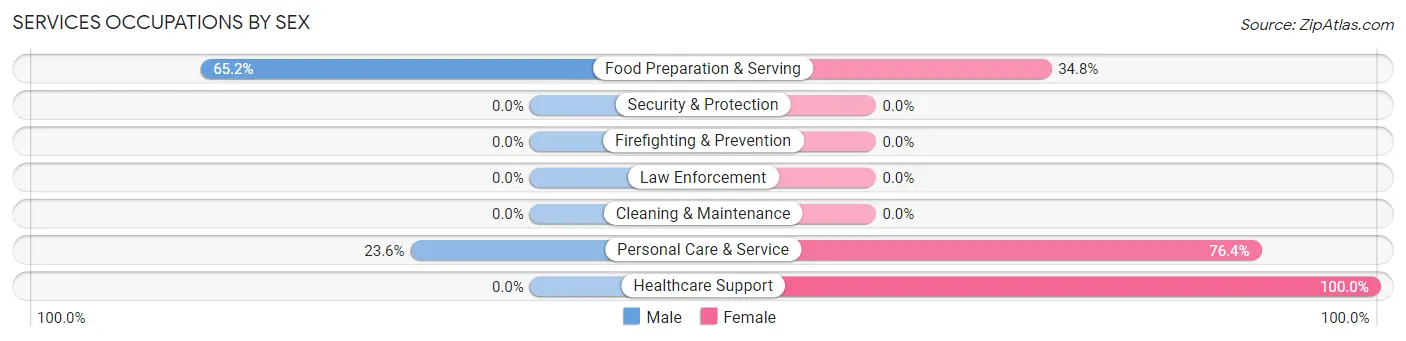
Services Occupations by Sex
Within the Services occupations in Lake Dunlap, the most male-oriented occupations are Food Preparation & Serving (65.2%), and Personal Care & Service (23.6%), while the most female-oriented occupations are Healthcare Support (100.0%), Personal Care & Service (76.4%), and Food Preparation & Serving (34.8%).
| Occupation | Male | Female |
| Healthcare Support | 0 (0.0%) | 7 (100.0%) |
| Security & Protection | 0 (0.0%) | 0 (0.0%) |
| Firefighting & Prevention | 0 (0.0%) | 0 (0.0%) |
| Law Enforcement | 0 (0.0%) | 0 (0.0%) |
| Food Preparation & Serving | 15 (65.2%) | 8 (34.8%) |
| Cleaning & Maintenance | 0 (0.0%) | 0 (0.0%) |
| Personal Care & Service | 17 (23.6%) | 55 (76.4%) |
| Total (Category) | 32 (31.4%) | 70 (68.6%) |
| Total (Overall) | 366 (49.4%) | 375 (50.6%) |
Sales and Office Occupations
The most common Sales and Office occupations in Lake Dunlap are Sales & Related (101 | 13.6%), and Office & Administration (66 | 8.9%).
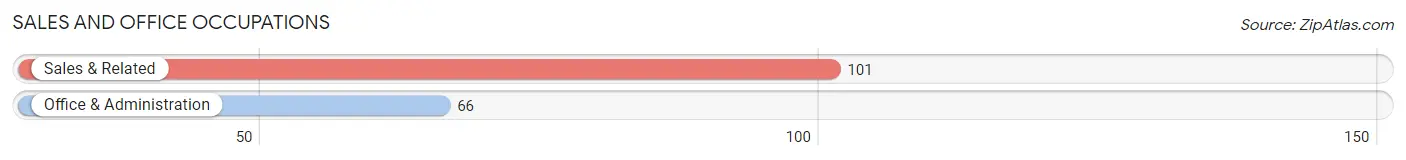
Sales and Office Occupations by Sex
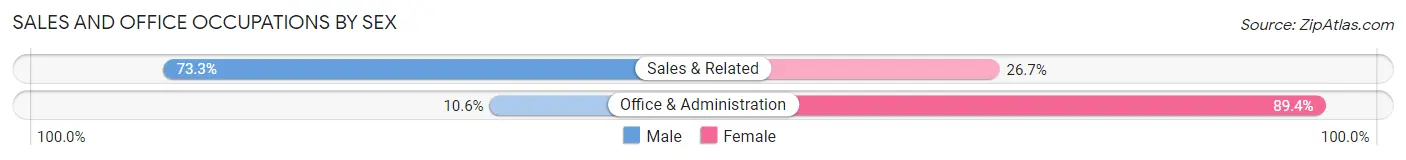
| Occupation | Male | Female |
| Sales & Related | 74 (73.3%) | 27 (26.7%) |
| Office & Administration | 7 (10.6%) | 59 (89.4%) |
| Total (Category) | 81 (48.5%) | 86 (51.5%) |
| Total (Overall) | 366 (49.4%) | 375 (50.6%) |
Natural Resources, Construction and Maintenance Occupations
The most common Natural Resources, Construction and Maintenance occupations in Lake Dunlap are Construction & Extraction (36 | 4.9%), and Installation, Maintenance & Repair (10 | 1.3%).
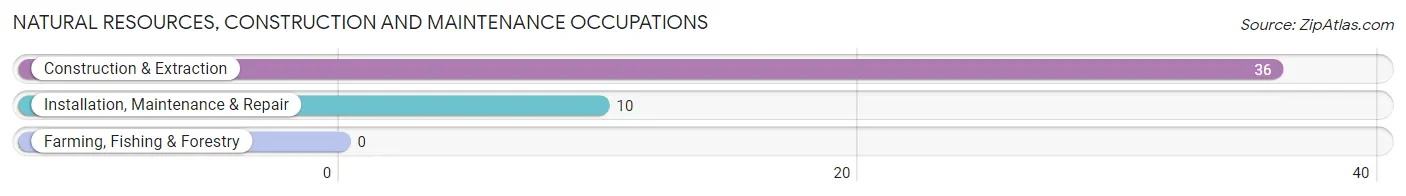
Natural Resources, Construction and Maintenance Occupations by Sex
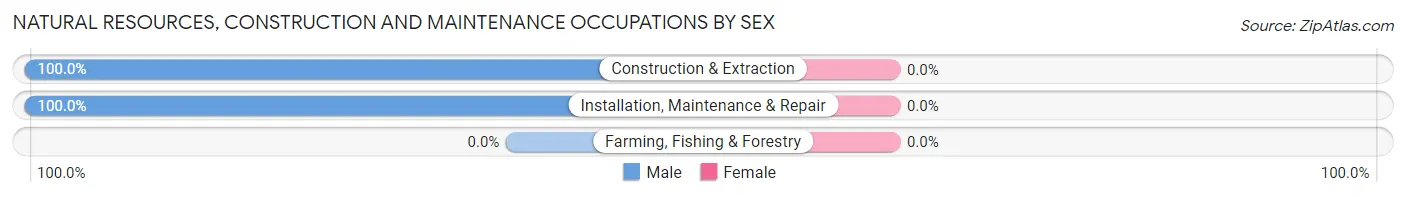
| Occupation | Male | Female |
| Farming, Fishing & Forestry | 0 (0.0%) | 0 (0.0%) |
| Construction & Extraction | 36 (100.0%) | 0 (0.0%) |
| Installation, Maintenance & Repair | 10 (100.0%) | 0 (0.0%) |
| Total (Category) | 46 (100.0%) | 0 (0.0%) |
| Total (Overall) | 366 (49.4%) | 375 (50.6%) |
Production, Transportation and Moving Occupations
The most common Production, Transportation and Moving occupations in Lake Dunlap are Transportation (57 | 7.7%), Material Moving (25 | 3.4%), and Production (18 | 2.4%).
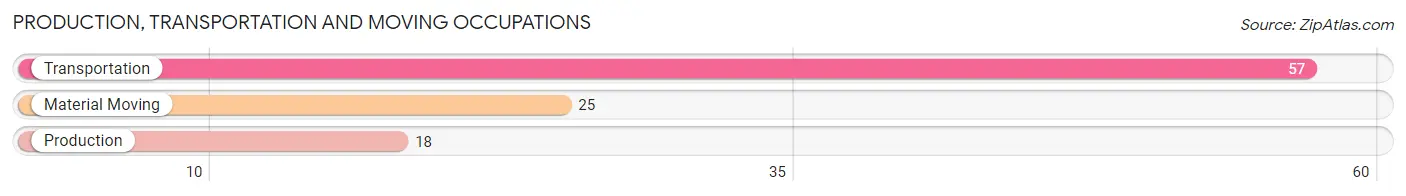
Production, Transportation and Moving Occupations by Sex
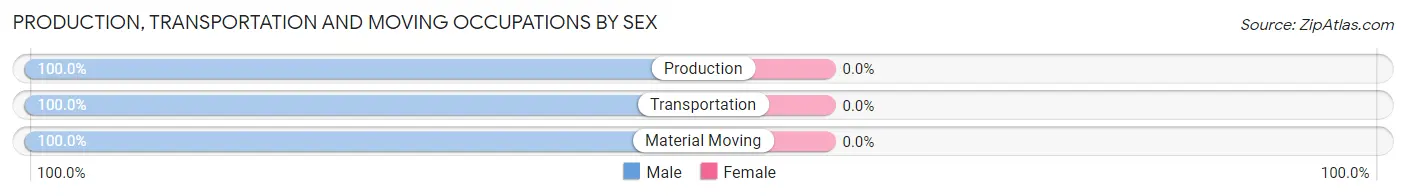
| Occupation | Male | Female |
| Production | 18 (100.0%) | 0 (0.0%) |
| Transportation | 57 (100.0%) | 0 (0.0%) |
| Material Moving | 25 (100.0%) | 0 (0.0%) |
| Total (Category) | 100 (100.0%) | 0 (0.0%) |
| Total (Overall) | 366 (49.4%) | 375 (50.6%) |
Employment Industries by Sex in Lake Dunlap
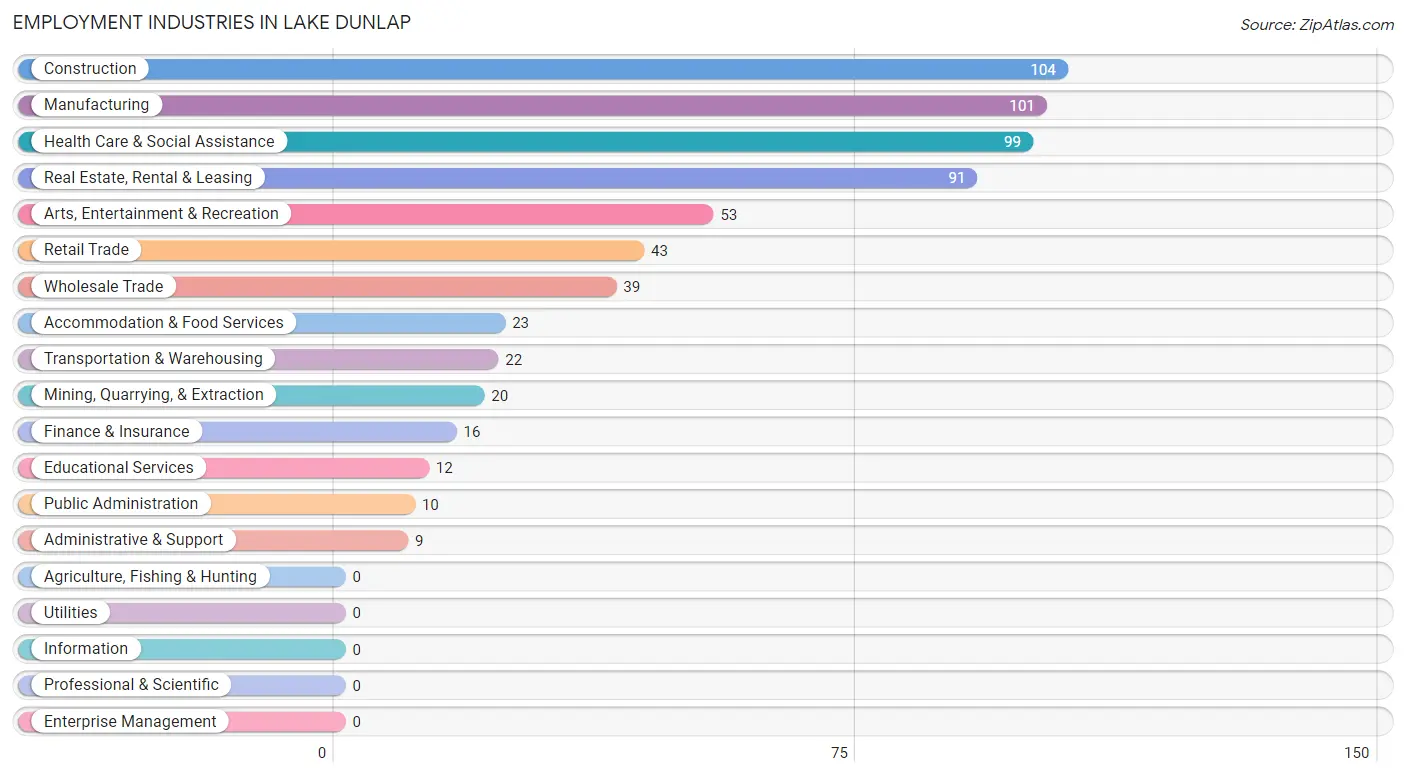
Employment Industries in Lake Dunlap
The major employment industries in Lake Dunlap include Construction (104 | 14.0%), Manufacturing (101 | 13.6%), Health Care & Social Assistance (99 | 13.4%), Real Estate, Rental & Leasing (91 | 12.3%), and Arts, Entertainment & Recreation (53 | 7.1%).
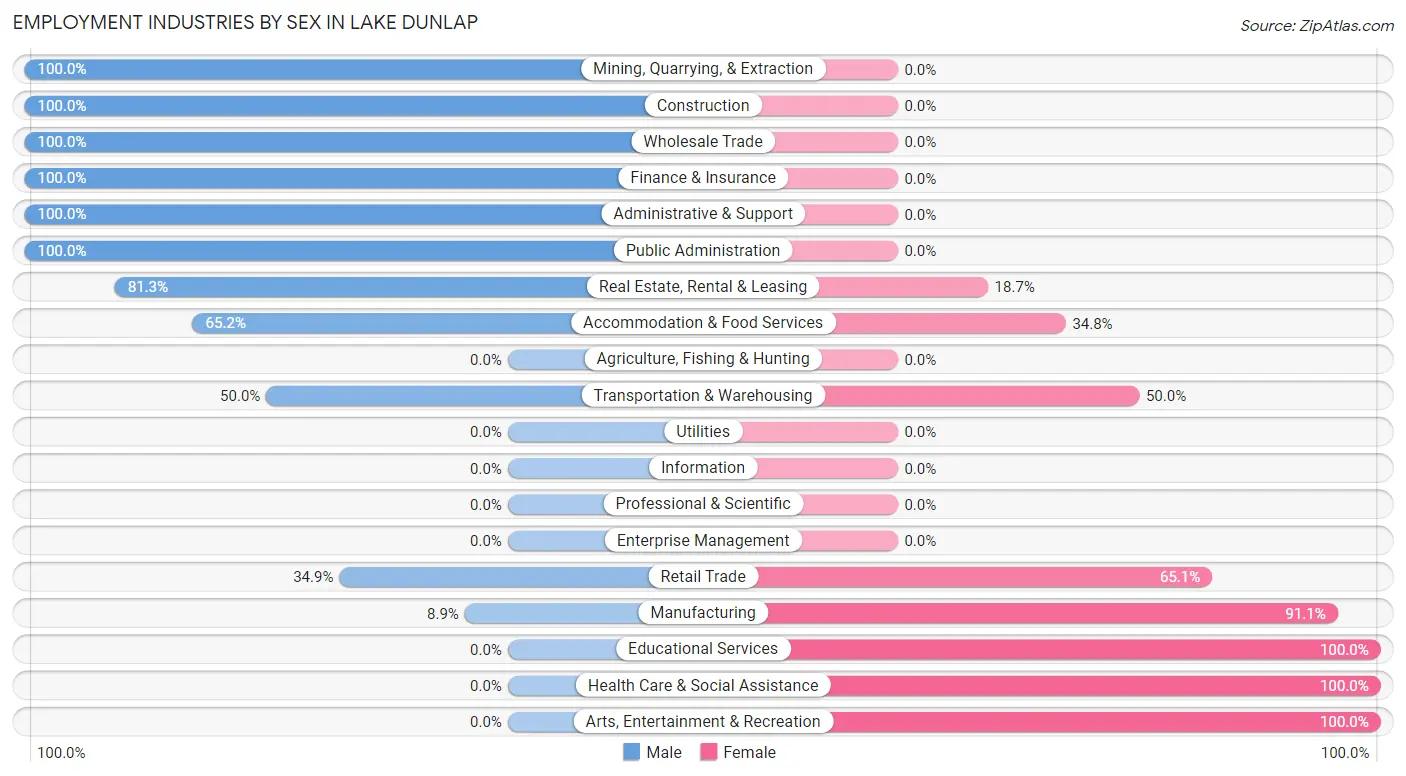
Employment Industries by Sex in Lake Dunlap
The Lake Dunlap industries that see more men than women are Mining, Quarrying, & Extraction (100.0%), Construction (100.0%), and Wholesale Trade (100.0%), whereas the industries that tend to have a higher number of women are Educational Services (100.0%), Health Care & Social Assistance (100.0%), and Arts, Entertainment & Recreation (100.0%).
| Industry | Male | Female |
| Agriculture, Fishing & Hunting | 0 (0.0%) | 0 (0.0%) |
| Mining, Quarrying, & Extraction | 20 (100.0%) | 0 (0.0%) |
| Construction | 104 (100.0%) | 0 (0.0%) |
| Manufacturing | 9 (8.9%) | 92 (91.1%) |
| Wholesale Trade | 39 (100.0%) | 0 (0.0%) |
| Retail Trade | 15 (34.9%) | 28 (65.1%) |
| Transportation & Warehousing | 11 (50.0%) | 11 (50.0%) |
| Utilities | 0 (0.0%) | 0 (0.0%) |
| Information | 0 (0.0%) | 0 (0.0%) |
| Finance & Insurance | 16 (100.0%) | 0 (0.0%) |
| Real Estate, Rental & Leasing | 74 (81.3%) | 17 (18.7%) |
| Professional & Scientific | 0 (0.0%) | 0 (0.0%) |
| Enterprise Management | 0 (0.0%) | 0 (0.0%) |
| Administrative & Support | 9 (100.0%) | 0 (0.0%) |
| Educational Services | 0 (0.0%) | 12 (100.0%) |
| Health Care & Social Assistance | 0 (0.0%) | 99 (100.0%) |
| Arts, Entertainment & Recreation | 0 (0.0%) | 53 (100.0%) |
| Accommodation & Food Services | 15 (65.2%) | 8 (34.8%) |
| Public Administration | 10 (100.0%) | 0 (0.0%) |
| Total | 366 (49.4%) | 375 (50.6%) |
Education in Lake Dunlap
School Enrollment in Lake Dunlap
The most common levels of schooling among the 370 students in Lake Dunlap are high school (119 | 32.2%), middle school (103 | 27.8%), and college / undergraduate (98 | 26.5%).
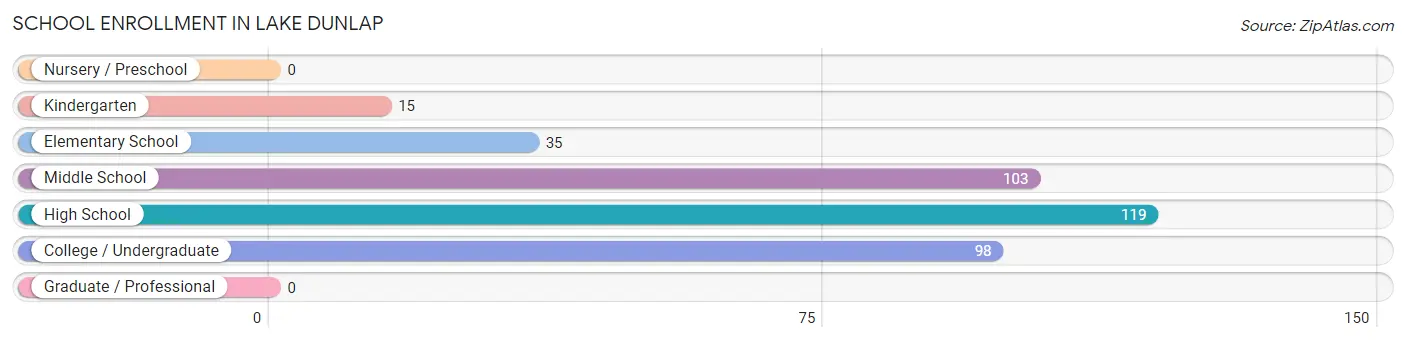
| School Level | # Students | % Students |
| Nursery / Preschool | 0 | 0.0% |
| Kindergarten | 15 | 4.1% |
| Elementary School | 35 | 9.5% |
| Middle School | 103 | 27.8% |
| High School | 119 | 32.2% |
| College / Undergraduate | 98 | 26.5% |
| Graduate / Professional | 0 | 0.0% |
| Total | 370 | 100.0% |
School Enrollment by Age by Funding Source in Lake Dunlap
Out of a total of 370 students who are enrolled in schools in Lake Dunlap, 26 (7.0%) attend a private institution, while the remaining 344 (93.0%) are enrolled in public schools. The age group of 18 to 19 year olds has the highest likelihood of being enrolled in private schools, with 10 (47.6% in the age bracket) enrolled. Conversely, the age group of 5 to 9 year old has the lowest likelihood of being enrolled in a private school, with 50 (100.0% in the age bracket) attending a public institution.
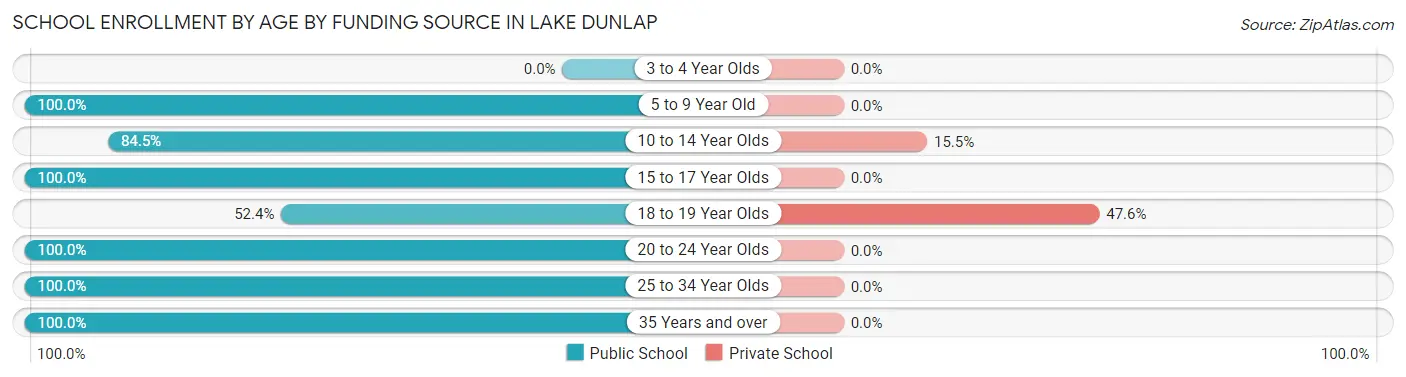
| Age Bracket | Public School | Private School |
| 3 to 4 Year Olds | 0 (0.0%) | 0 (0.0%) |
| 5 to 9 Year Old | 50 (100.0%) | 0 (0.0%) |
| 10 to 14 Year Olds | 87 (84.5%) | 16 (15.5%) |
| 15 to 17 Year Olds | 130 (100.0%) | 0 (0.0%) |
| 18 to 19 Year Olds | 11 (52.4%) | 10 (47.6%) |
| 20 to 24 Year Olds | 48 (100.0%) | 0 (0.0%) |
| 25 to 34 Year Olds | 11 (100.0%) | 0 (0.0%) |
| 35 Years and over | 7 (100.0%) | 0 (0.0%) |
| Total | 344 (93.0%) | 26 (7.0%) |
Educational Attainment by Field of Study in Lake Dunlap
Science & technology (66 | 42.6%), business (24 | 15.5%), arts & humanities (23 | 14.8%), visual & performing arts (19 | 12.3%), and multidisciplinary studies (12 | 7.7%) are the most common fields of study among 155 individuals in Lake Dunlap who have obtained a bachelor's degree or higher.
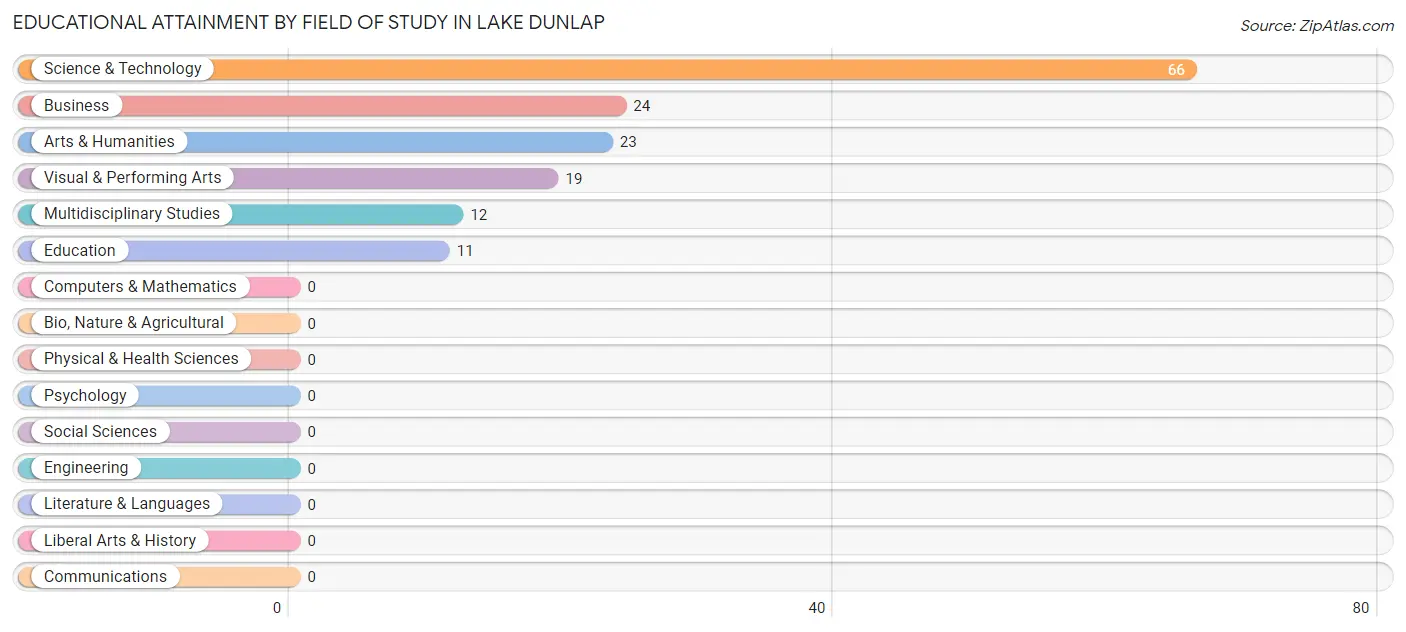
| Field of Study | # Graduates | % Graduates |
| Computers & Mathematics | 0 | 0.0% |
| Bio, Nature & Agricultural | 0 | 0.0% |
| Physical & Health Sciences | 0 | 0.0% |
| Psychology | 0 | 0.0% |
| Social Sciences | 0 | 0.0% |
| Engineering | 0 | 0.0% |
| Multidisciplinary Studies | 12 | 7.7% |
| Science & Technology | 66 | 42.6% |
| Business | 24 | 15.5% |
| Education | 11 | 7.1% |
| Literature & Languages | 0 | 0.0% |
| Liberal Arts & History | 0 | 0.0% |
| Visual & Performing Arts | 19 | 12.3% |
| Communications | 0 | 0.0% |
| Arts & Humanities | 23 | 14.8% |
| Total | 155 | 100.0% |
Transportation & Commute in Lake Dunlap
Vehicle Availability by Sex in Lake Dunlap
The most prevalent vehicle ownership categories in Lake Dunlap are males with 3 vehicles (146, accounting for 39.9%) and females with 3 vehicles (157, making up 40.0%).
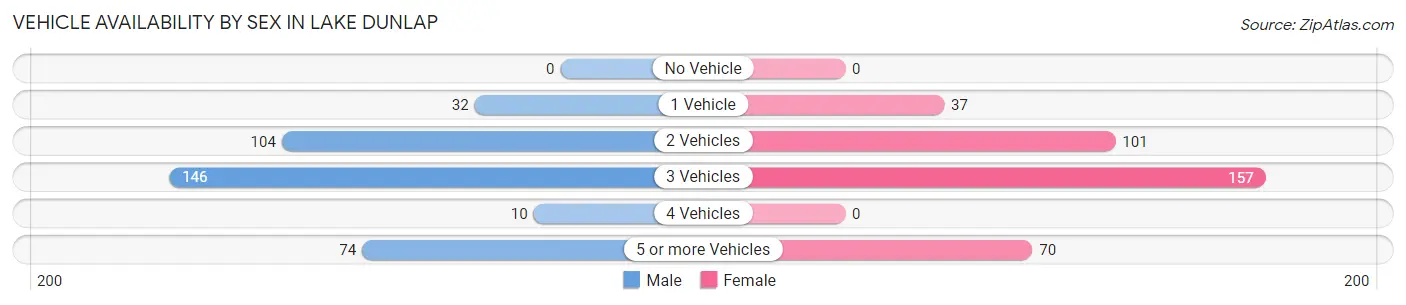
| Vehicles Available | Male | Female |
| No Vehicle | 0 (0.0%) | 0 (0.0%) |
| 1 Vehicle | 32 (8.7%) | 37 (10.1%) |
| 2 Vehicles | 104 (28.4%) | 101 (27.7%) |
| 3 Vehicles | 146 (39.9%) | 157 (43.0%) |
| 4 Vehicles | 10 (2.7%) | 0 (0.0%) |
| 5 or more Vehicles | 74 (20.2%) | 70 (19.2%) |
| Total | 366 (100.0%) | 365 (100.0%) |
Commute Time in Lake Dunlap
The most frequently occuring commute durations in Lake Dunlap are 20 to 24 minutes (231 commuters, 38.0%), 15 to 19 minutes (112 commuters, 18.4%), and 60 to 89 minutes (91 commuters, 15.0%).
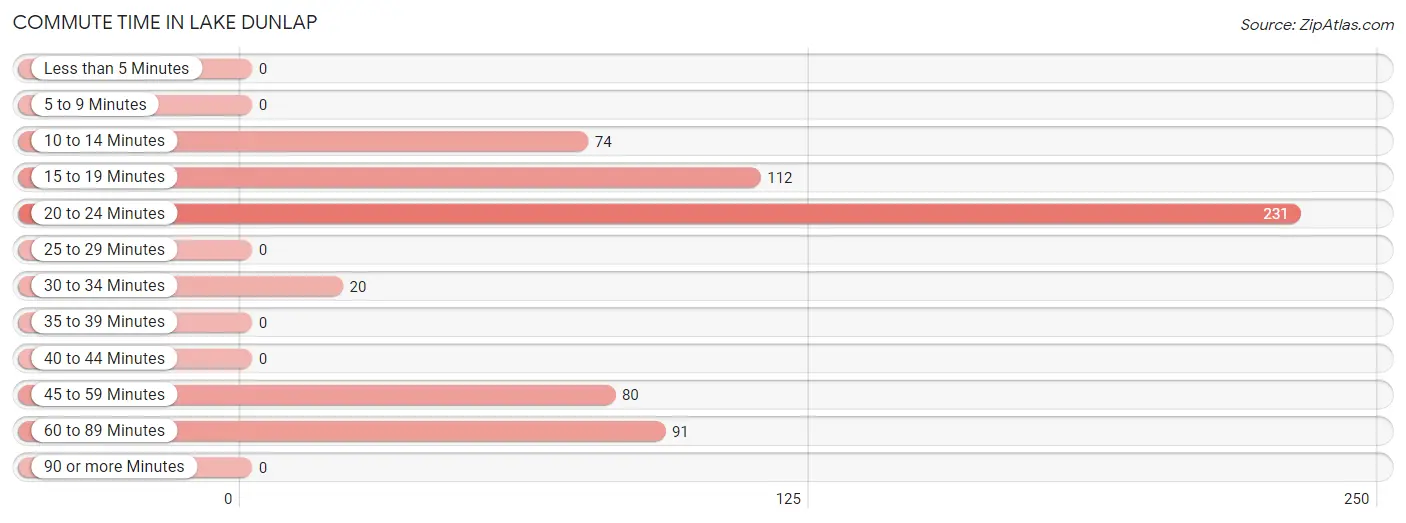
| Commute Time | # Commuters | % Commuters |
| Less than 5 Minutes | 0 | 0.0% |
| 5 to 9 Minutes | 0 | 0.0% |
| 10 to 14 Minutes | 74 | 12.2% |
| 15 to 19 Minutes | 112 | 18.4% |
| 20 to 24 Minutes | 231 | 38.0% |
| 25 to 29 Minutes | 0 | 0.0% |
| 30 to 34 Minutes | 20 | 3.3% |
| 35 to 39 Minutes | 0 | 0.0% |
| 40 to 44 Minutes | 0 | 0.0% |
| 45 to 59 Minutes | 80 | 13.2% |
| 60 to 89 Minutes | 91 | 15.0% |
| 90 or more Minutes | 0 | 0.0% |
Commute Time by Sex in Lake Dunlap
The most common commute times in Lake Dunlap are 60 to 89 minutes (74 commuters, 25.3%) for males and 20 to 24 minutes (166 commuters, 52.5%) for females.
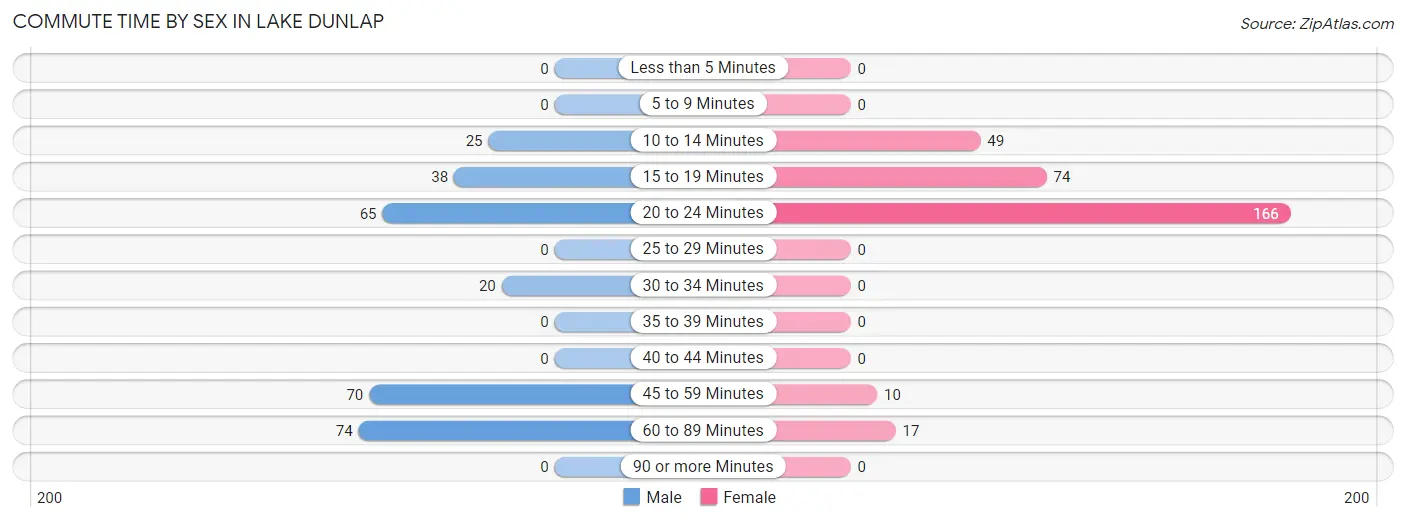
| Commute Time | Male | Female |
| Less than 5 Minutes | 0 (0.0%) | 0 (0.0%) |
| 5 to 9 Minutes | 0 (0.0%) | 0 (0.0%) |
| 10 to 14 Minutes | 25 (8.6%) | 49 (15.5%) |
| 15 to 19 Minutes | 38 (13.0%) | 74 (23.4%) |
| 20 to 24 Minutes | 65 (22.3%) | 166 (52.5%) |
| 25 to 29 Minutes | 0 (0.0%) | 0 (0.0%) |
| 30 to 34 Minutes | 20 (6.9%) | 0 (0.0%) |
| 35 to 39 Minutes | 0 (0.0%) | 0 (0.0%) |
| 40 to 44 Minutes | 0 (0.0%) | 0 (0.0%) |
| 45 to 59 Minutes | 70 (24.0%) | 10 (3.2%) |
| 60 to 89 Minutes | 74 (25.3%) | 17 (5.4%) |
| 90 or more Minutes | 0 (0.0%) | 0 (0.0%) |
Time of Departure to Work by Sex in Lake Dunlap
The most frequent times of departure to work in Lake Dunlap are 6:30 AM to 6:59 AM (97, 33.2%) for males and 7:00 AM to 7:29 AM (124, 39.2%) for females.
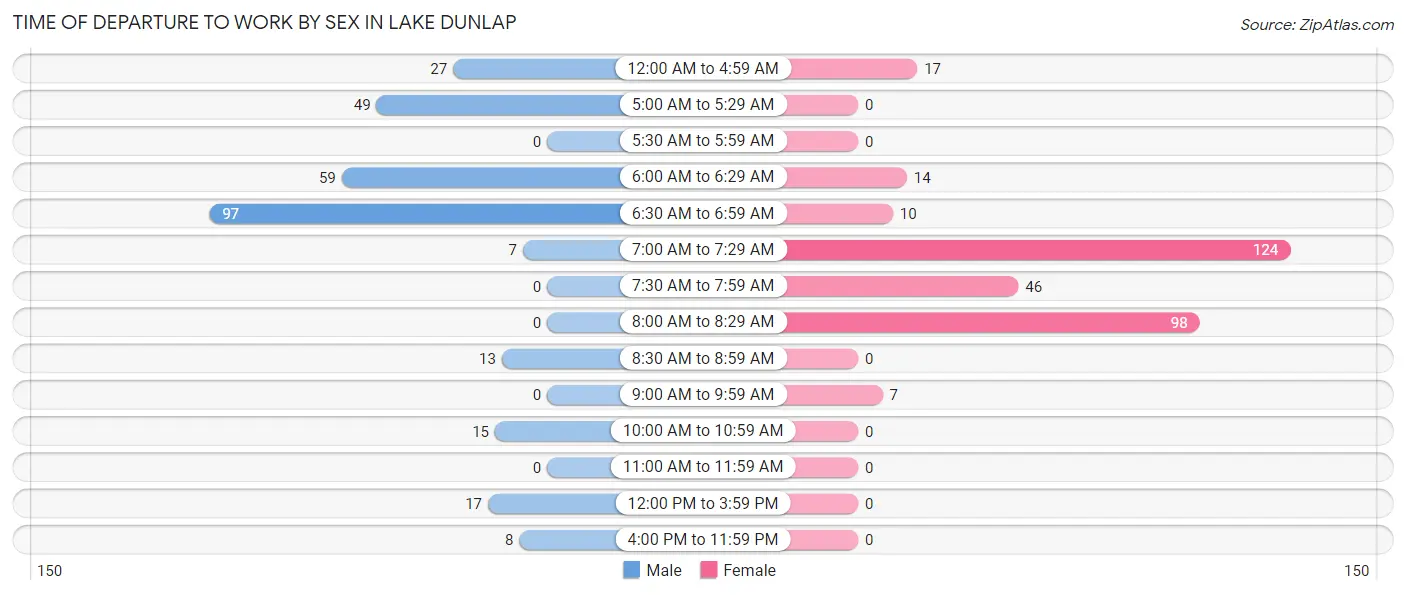
| Time of Departure | Male | Female |
| 12:00 AM to 4:59 AM | 27 (9.2%) | 17 (5.4%) |
| 5:00 AM to 5:29 AM | 49 (16.8%) | 0 (0.0%) |
| 5:30 AM to 5:59 AM | 0 (0.0%) | 0 (0.0%) |
| 6:00 AM to 6:29 AM | 59 (20.2%) | 14 (4.4%) |
| 6:30 AM to 6:59 AM | 97 (33.2%) | 10 (3.2%) |
| 7:00 AM to 7:29 AM | 7 (2.4%) | 124 (39.2%) |
| 7:30 AM to 7:59 AM | 0 (0.0%) | 46 (14.6%) |
| 8:00 AM to 8:29 AM | 0 (0.0%) | 98 (31.0%) |
| 8:30 AM to 8:59 AM | 13 (4.4%) | 0 (0.0%) |
| 9:00 AM to 9:59 AM | 0 (0.0%) | 7 (2.2%) |
| 10:00 AM to 10:59 AM | 15 (5.1%) | 0 (0.0%) |
| 11:00 AM to 11:59 AM | 0 (0.0%) | 0 (0.0%) |
| 12:00 PM to 3:59 PM | 17 (5.8%) | 0 (0.0%) |
| 4:00 PM to 11:59 PM | 8 (2.7%) | 0 (0.0%) |
| Total | 292 (100.0%) | 316 (100.0%) |
Housing Occupancy in Lake Dunlap
Occupancy by Ownership in Lake Dunlap
Of the total 516 dwellings in Lake Dunlap, owner-occupied units account for 483 (93.6%), while renter-occupied units make up 33 (6.4%).
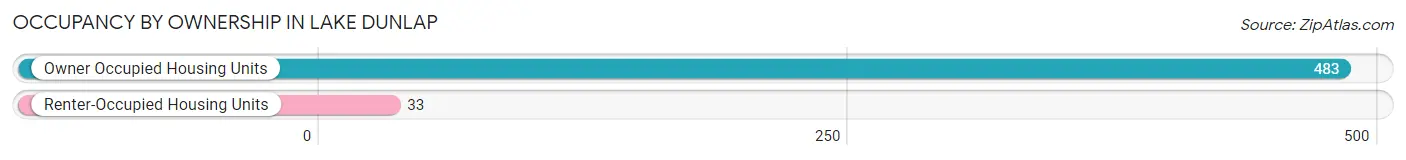
| Occupancy | # Housing Units | % Housing Units |
| Owner Occupied Housing Units | 483 | 93.6% |
| Renter-Occupied Housing Units | 33 | 6.4% |
| Total Occupied Housing Units | 516 | 100.0% |
Occupancy by Household Size in Lake Dunlap
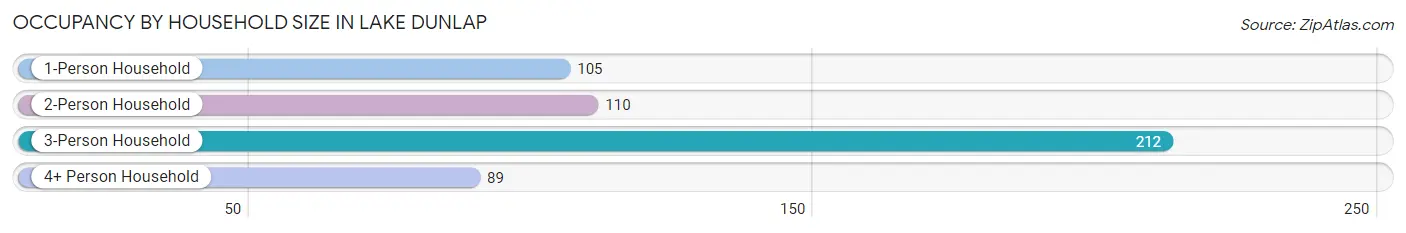
| Household Size | # Housing Units | % Housing Units |
| 1-Person Household | 105 | 20.3% |
| 2-Person Household | 110 | 21.3% |
| 3-Person Household | 212 | 41.1% |
| 4+ Person Household | 89 | 17.2% |
| Total Housing Units | 516 | 100.0% |
Occupancy by Ownership by Household Size in Lake Dunlap
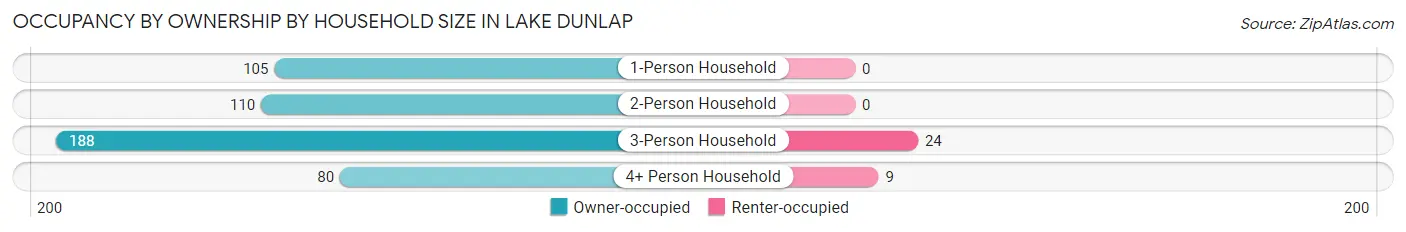
| Household Size | Owner-occupied | Renter-occupied |
| 1-Person Household | 105 (100.0%) | 0 (0.0%) |
| 2-Person Household | 110 (100.0%) | 0 (0.0%) |
| 3-Person Household | 188 (88.7%) | 24 (11.3%) |
| 4+ Person Household | 80 (89.9%) | 9 (10.1%) |
| Total Housing Units | 483 (93.6%) | 33 (6.4%) |
Occupancy by Educational Attainment in Lake Dunlap
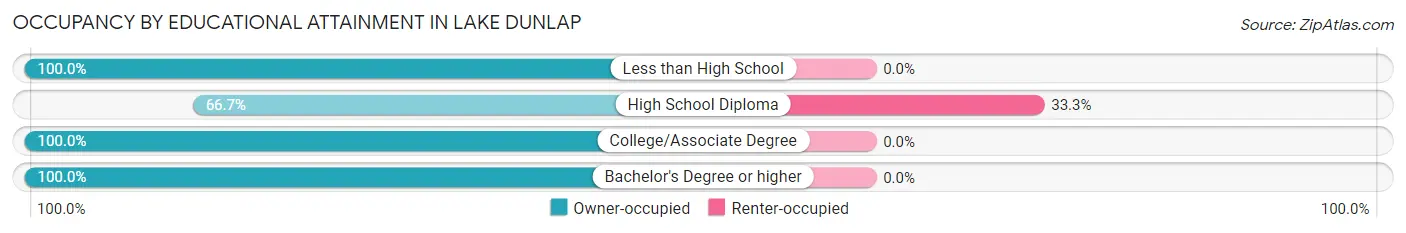
| Household Size | Owner-occupied | Renter-occupied |
| Less than High School | 44 (100.0%) | 0 (0.0%) |
| High School Diploma | 66 (66.7%) | 33 (33.3%) |
| College/Associate Degree | 279 (100.0%) | 0 (0.0%) |
| Bachelor's Degree or higher | 94 (100.0%) | 0 (0.0%) |
Occupancy by Age of Householder in Lake Dunlap
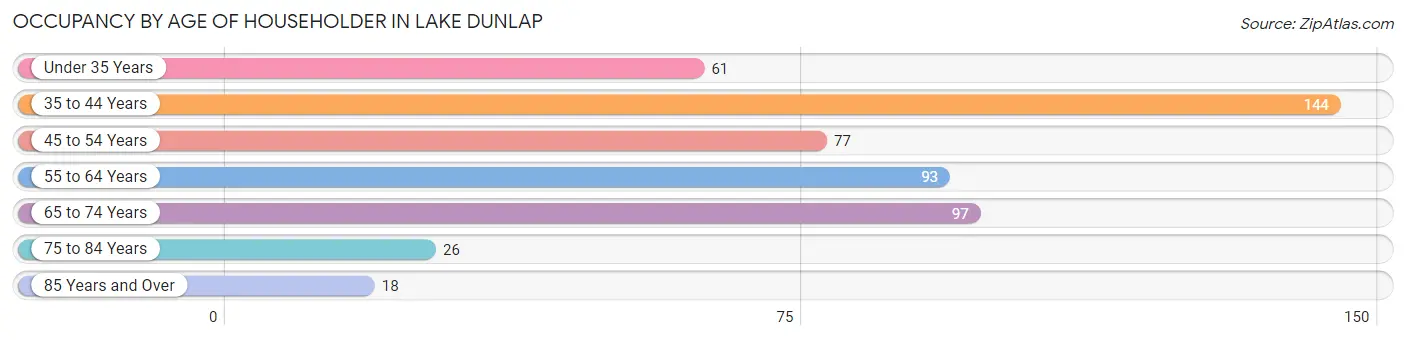
| Age Bracket | # Households | % Households |
| Under 35 Years | 61 | 11.8% |
| 35 to 44 Years | 144 | 27.9% |
| 45 to 54 Years | 77 | 14.9% |
| 55 to 64 Years | 93 | 18.0% |
| 65 to 74 Years | 97 | 18.8% |
| 75 to 84 Years | 26 | 5.0% |
| 85 Years and Over | 18 | 3.5% |
| Total | 516 | 100.0% |
Housing Finances in Lake Dunlap
Median Income by Occupancy in Lake Dunlap
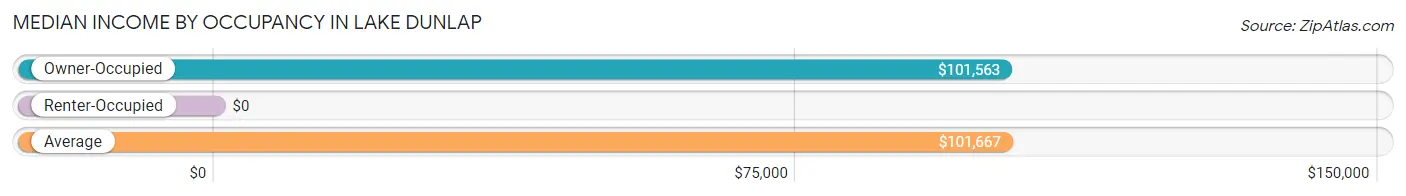
| Occupancy Type | # Households | Median Income |
| Owner-Occupied | 483 (93.6%) | $101,563 |
| Renter-Occupied | 33 (6.4%) | $0 |
| Average | 516 (100.0%) | $101,667 |
Occupancy by Householder Income Bracket in Lake Dunlap
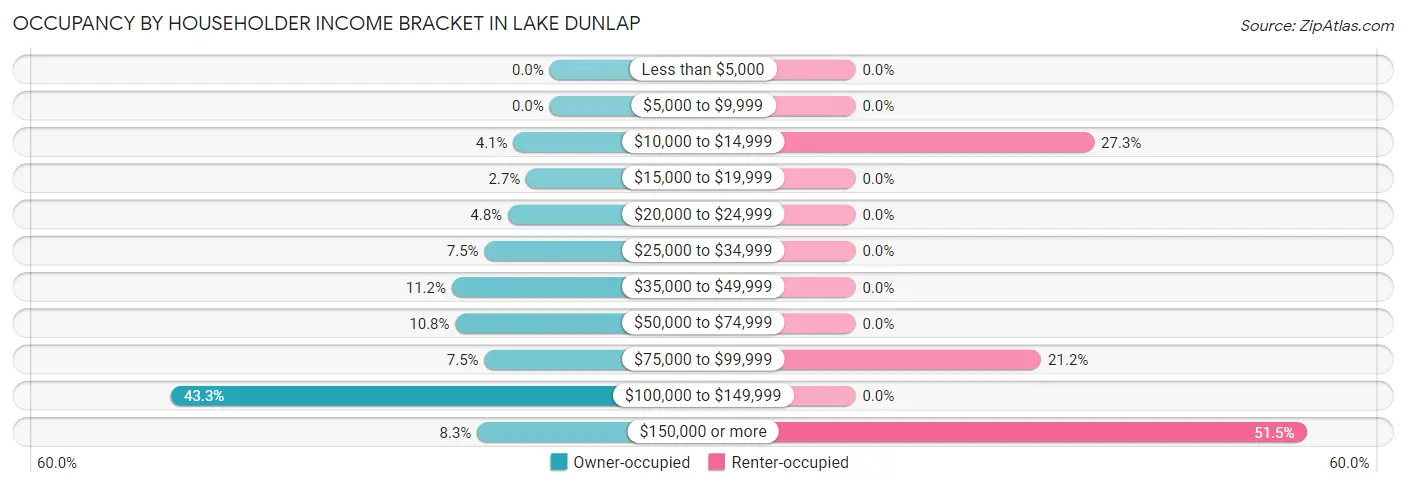
| Income Bracket | Owner-occupied | Renter-occupied |
| Less than $5,000 | 0 (0.0%) | 0 (0.0%) |
| $5,000 to $9,999 | 0 (0.0%) | 0 (0.0%) |
| $10,000 to $14,999 | 20 (4.1%) | 9 (27.3%) |
| $15,000 to $19,999 | 13 (2.7%) | 0 (0.0%) |
| $20,000 to $24,999 | 23 (4.8%) | 0 (0.0%) |
| $25,000 to $34,999 | 36 (7.4%) | 0 (0.0%) |
| $35,000 to $49,999 | 54 (11.2%) | 0 (0.0%) |
| $50,000 to $74,999 | 52 (10.8%) | 0 (0.0%) |
| $75,000 to $99,999 | 36 (7.4%) | 7 (21.2%) |
| $100,000 to $149,999 | 209 (43.3%) | 0 (0.0%) |
| $150,000 or more | 40 (8.3%) | 17 (51.5%) |
| Total | 483 (100.0%) | 33 (100.0%) |
Monthly Housing Cost Tiers in Lake Dunlap
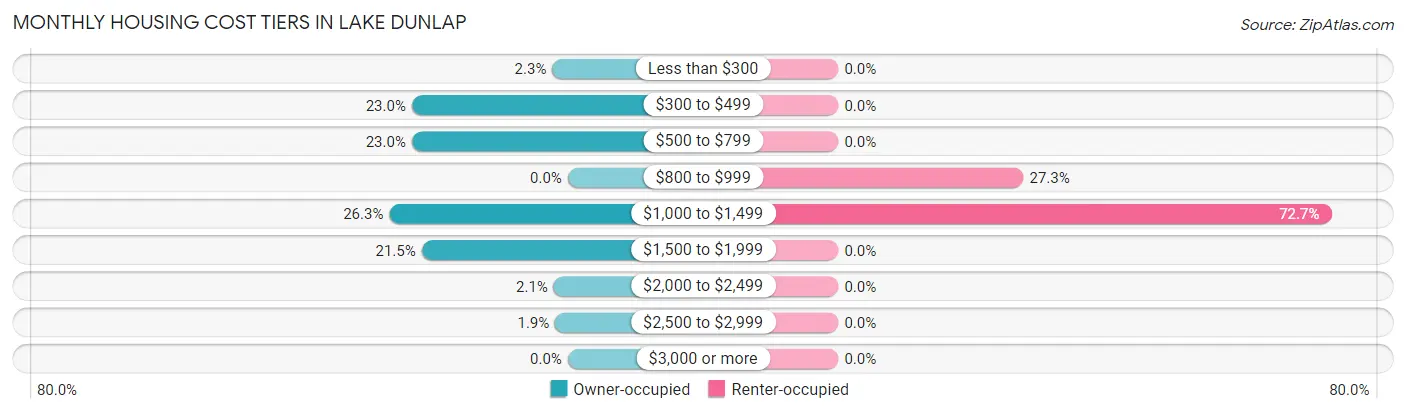
| Monthly Cost | Owner-occupied | Renter-occupied |
| Less than $300 | 11 (2.3%) | 0 (0.0%) |
| $300 to $499 | 111 (23.0%) | 0 (0.0%) |
| $500 to $799 | 111 (23.0%) | 0 (0.0%) |
| $800 to $999 | 0 (0.0%) | 9 (27.3%) |
| $1,000 to $1,499 | 127 (26.3%) | 24 (72.7%) |
| $1,500 to $1,999 | 104 (21.5%) | 0 (0.0%) |
| $2,000 to $2,499 | 10 (2.1%) | 0 (0.0%) |
| $2,500 to $2,999 | 9 (1.9%) | 0 (0.0%) |
| $3,000 or more | 0 (0.0%) | 0 (0.0%) |
| Total | 483 (100.0%) | 33 (100.0%) |
Physical Housing Characteristics in Lake Dunlap
Housing Structures in Lake Dunlap
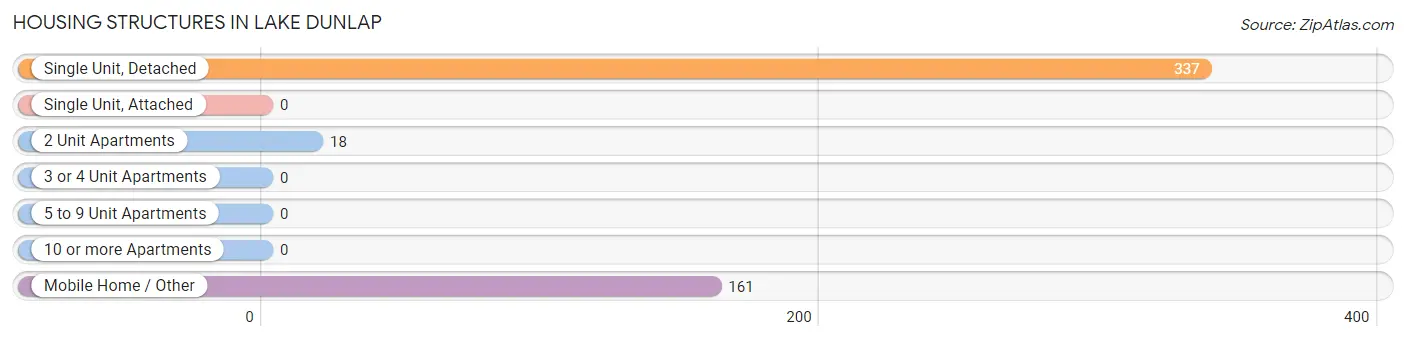
| Structure Type | # Housing Units | % Housing Units |
| Single Unit, Detached | 337 | 65.3% |
| Single Unit, Attached | 0 | 0.0% |
| 2 Unit Apartments | 18 | 3.5% |
| 3 or 4 Unit Apartments | 0 | 0.0% |
| 5 to 9 Unit Apartments | 0 | 0.0% |
| 10 or more Apartments | 0 | 0.0% |
| Mobile Home / Other | 161 | 31.2% |
| Total | 516 | 100.0% |
Housing Structures by Occupancy in Lake Dunlap
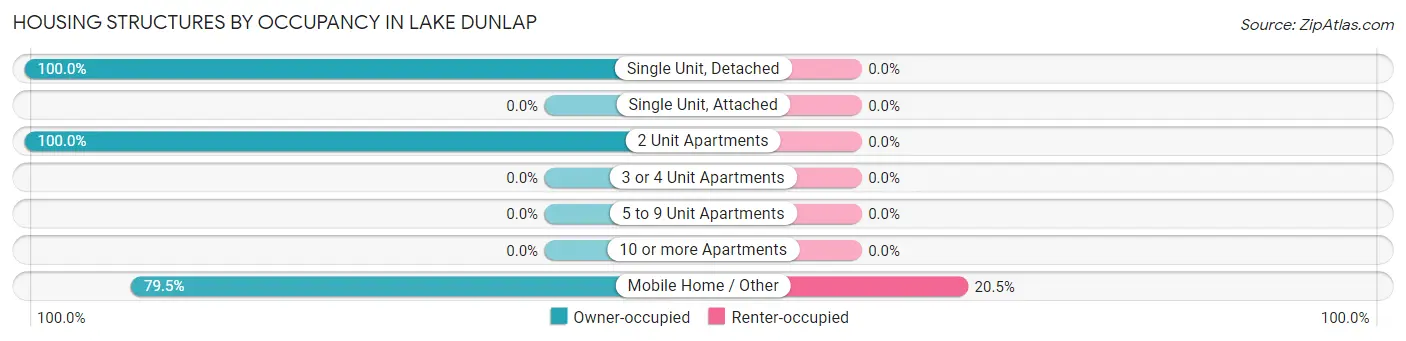
| Structure Type | Owner-occupied | Renter-occupied |
| Single Unit, Detached | 337 (100.0%) | 0 (0.0%) |
| Single Unit, Attached | 0 (0.0%) | 0 (0.0%) |
| 2 Unit Apartments | 18 (100.0%) | 0 (0.0%) |
| 3 or 4 Unit Apartments | 0 (0.0%) | 0 (0.0%) |
| 5 to 9 Unit Apartments | 0 (0.0%) | 0 (0.0%) |
| 10 or more Apartments | 0 (0.0%) | 0 (0.0%) |
| Mobile Home / Other | 128 (79.5%) | 33 (20.5%) |
| Total | 483 (93.6%) | 33 (6.4%) |
Housing Structures by Number of Rooms in Lake Dunlap
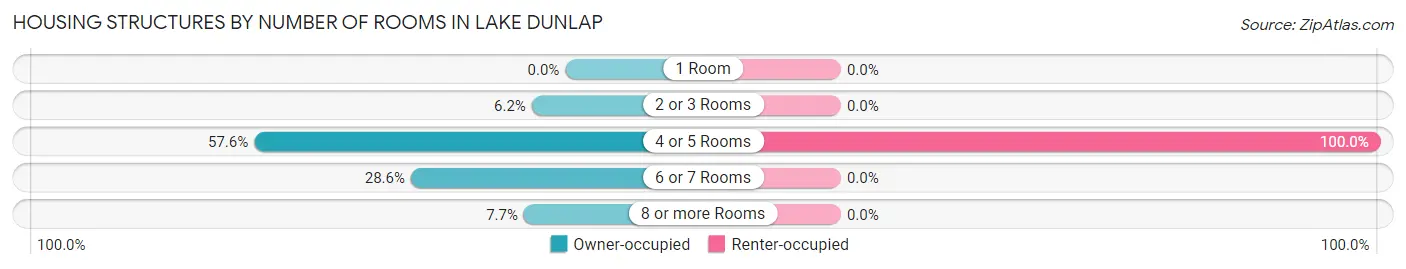
| Number of Rooms | Owner-occupied | Renter-occupied |
| 1 Room | 0 (0.0%) | 0 (0.0%) |
| 2 or 3 Rooms | 30 (6.2%) | 0 (0.0%) |
| 4 or 5 Rooms | 278 (57.6%) | 33 (100.0%) |
| 6 or 7 Rooms | 138 (28.6%) | 0 (0.0%) |
| 8 or more Rooms | 37 (7.7%) | 0 (0.0%) |
| Total | 483 (100.0%) | 33 (100.0%) |
Housing Structure by Heating Type in Lake Dunlap
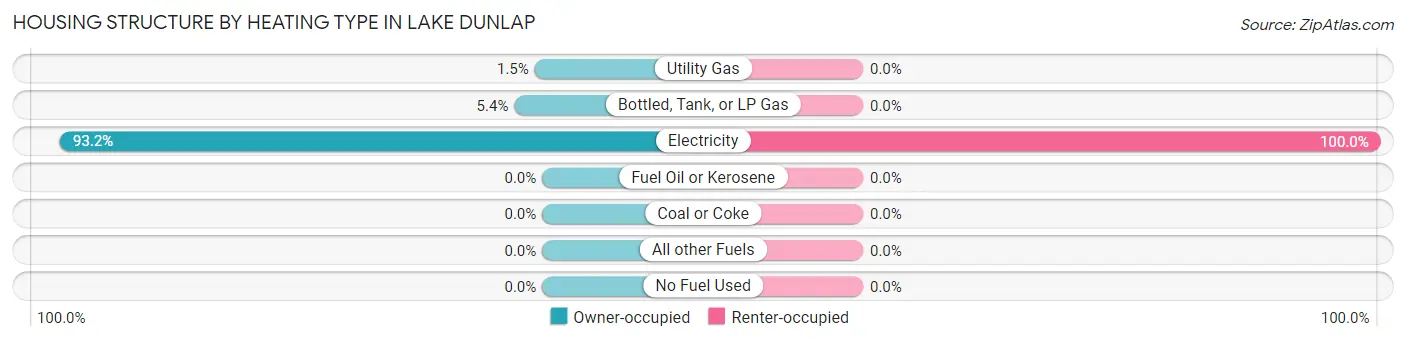
| Heating Type | Owner-occupied | Renter-occupied |
| Utility Gas | 7 (1.5%) | 0 (0.0%) |
| Bottled, Tank, or LP Gas | 26 (5.4%) | 0 (0.0%) |
| Electricity | 450 (93.2%) | 33 (100.0%) |
| Fuel Oil or Kerosene | 0 (0.0%) | 0 (0.0%) |
| Coal or Coke | 0 (0.0%) | 0 (0.0%) |
| All other Fuels | 0 (0.0%) | 0 (0.0%) |
| No Fuel Used | 0 (0.0%) | 0 (0.0%) |
| Total | 483 (100.0%) | 33 (100.0%) |
Household Vehicle Usage in Lake Dunlap
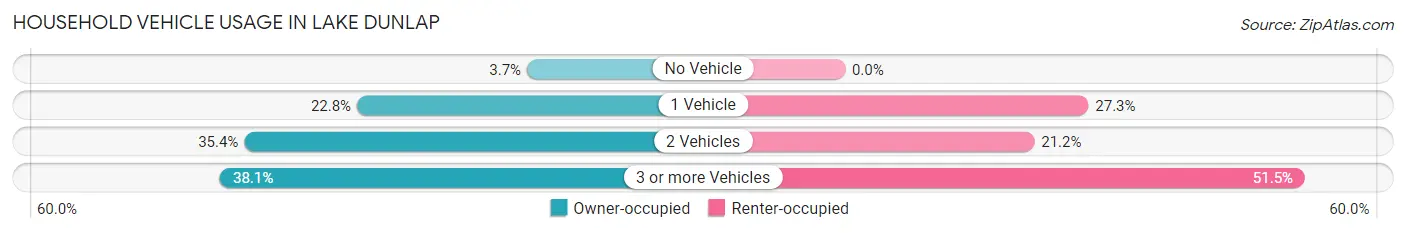
| Vehicles per Household | Owner-occupied | Renter-occupied |
| No Vehicle | 18 (3.7%) | 0 (0.0%) |
| 1 Vehicle | 110 (22.8%) | 9 (27.3%) |
| 2 Vehicles | 171 (35.4%) | 7 (21.2%) |
| 3 or more Vehicles | 184 (38.1%) | 17 (51.5%) |
| Total | 483 (100.0%) | 33 (100.0%) |
Real Estate & Mortgages in Lake Dunlap
Real Estate and Mortgage Overview in Lake Dunlap
| Characteristic | Without Mortgage | With Mortgage |
| Housing Units | 251 | 232 |
| Median Property Value | $132,800 | $263,000 |
| Median Household Income | $43,264 | $9 |
| Monthly Housing Costs | $519 | $0 |
| Real Estate Taxes | $2,520 | $0 |
Property Value by Mortgage Status in Lake Dunlap
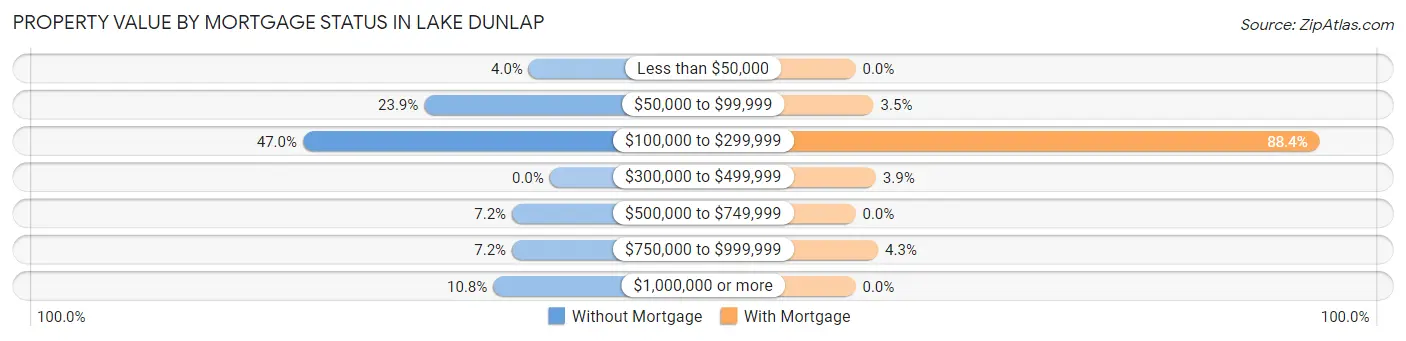
| Property Value | Without Mortgage | With Mortgage |
| Less than $50,000 | 10 (4.0%) | 0 (0.0%) |
| $50,000 to $99,999 | 60 (23.9%) | 8 (3.5%) |
| $100,000 to $299,999 | 118 (47.0%) | 205 (88.4%) |
| $300,000 to $499,999 | 0 (0.0%) | 9 (3.9%) |
| $500,000 to $749,999 | 18 (7.2%) | 0 (0.0%) |
| $750,000 to $999,999 | 18 (7.2%) | 10 (4.3%) |
| $1,000,000 or more | 27 (10.8%) | 0 (0.0%) |
| Total | 251 (100.0%) | 232 (100.0%) |
Household Income by Mortgage Status in Lake Dunlap
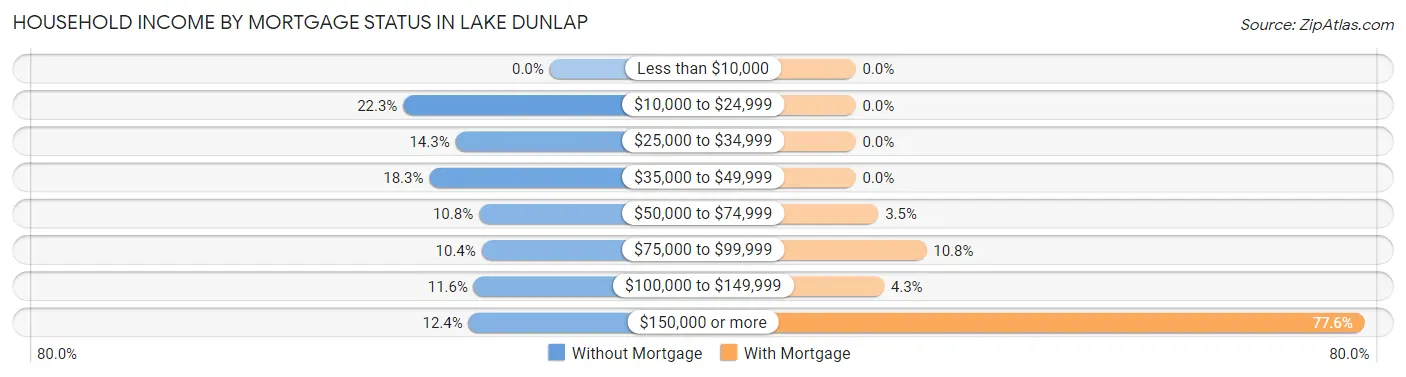
| Household Income | Without Mortgage | With Mortgage |
| Less than $10,000 | 0 (0.0%) | 0 (0.0%) |
| $10,000 to $24,999 | 56 (22.3%) | 0 (0.0%) |
| $25,000 to $34,999 | 36 (14.3%) | 0 (0.0%) |
| $35,000 to $49,999 | 46 (18.3%) | 0 (0.0%) |
| $50,000 to $74,999 | 27 (10.8%) | 8 (3.5%) |
| $75,000 to $99,999 | 26 (10.4%) | 25 (10.8%) |
| $100,000 to $149,999 | 29 (11.6%) | 10 (4.3%) |
| $150,000 or more | 31 (12.3%) | 180 (77.6%) |
| Total | 251 (100.0%) | 232 (100.0%) |
Property Value to Household Income Ratio in Lake Dunlap
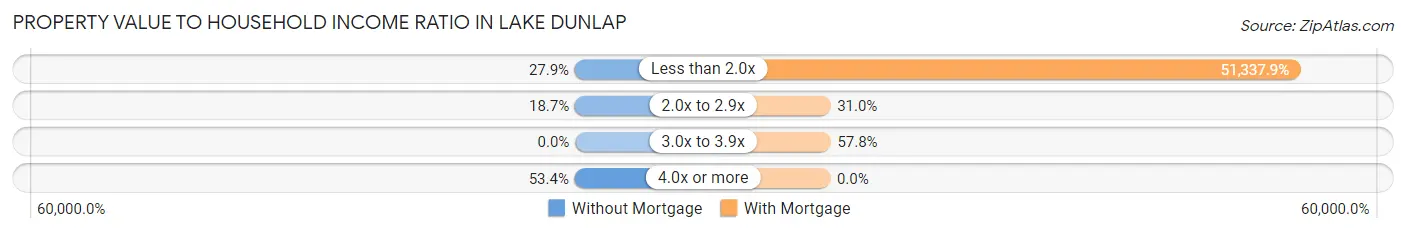
| Value-to-Income Ratio | Without Mortgage | With Mortgage |
| Less than 2.0x | 70 (27.9%) | 119,104 (51,337.9%) |
| 2.0x to 2.9x | 47 (18.7%) | 72 (31.0%) |
| 3.0x to 3.9x | 0 (0.0%) | 134 (57.8%) |
| 4.0x or more | 134 (53.4%) | 0 (0.0%) |
| Total | 251 (100.0%) | 232 (100.0%) |
Real Estate Taxes by Mortgage Status in Lake Dunlap
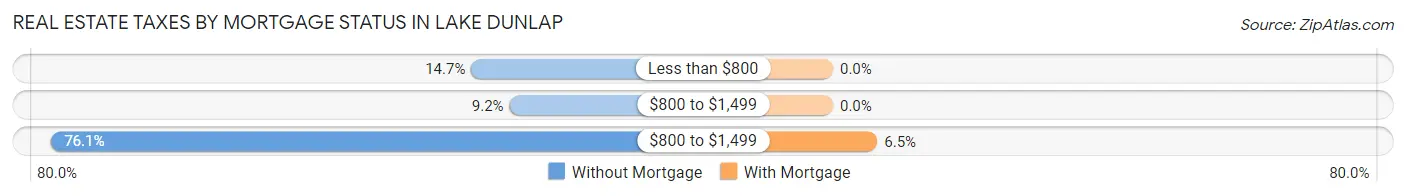
| Property Taxes | Without Mortgage | With Mortgage |
| Less than $800 | 37 (14.7%) | 0 (0.0%) |
| $800 to $1,499 | 23 (9.2%) | 0 (0.0%) |
| $800 to $1,499 | 191 (76.1%) | 15 (6.5%) |
| Total | 251 (100.0%) | 232 (100.0%) |
Health & Disability in Lake Dunlap
Health Insurance Coverage by Age in Lake Dunlap
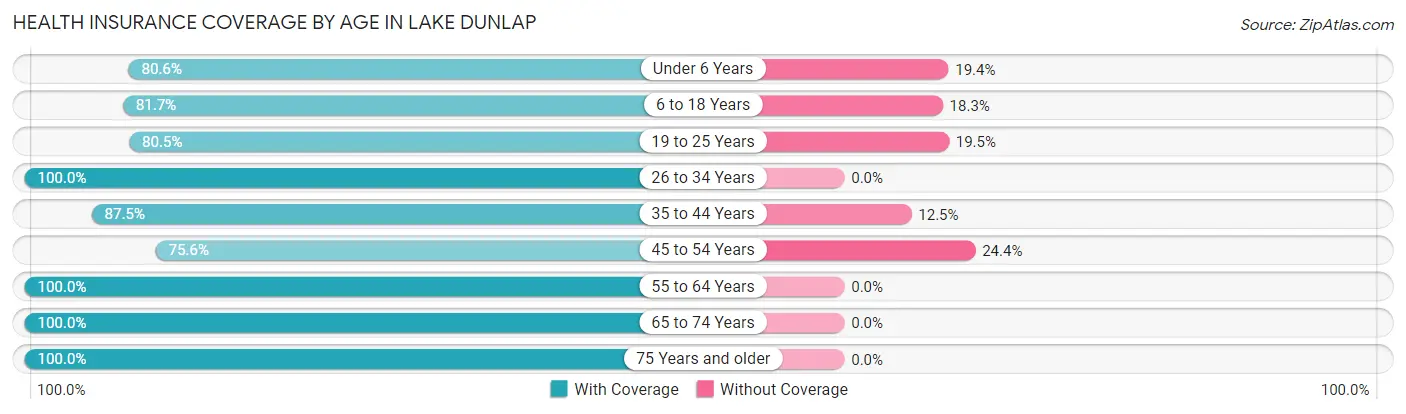
| Age Bracket | With Coverage | Without Coverage |
| Under 6 Years | 79 (80.6%) | 19 (19.4%) |
| 6 to 18 Years | 236 (81.7%) | 53 (18.3%) |
| 19 to 25 Years | 62 (80.5%) | 15 (19.5%) |
| 26 to 34 Years | 134 (100.0%) | 0 (0.0%) |
| 35 to 44 Years | 175 (87.5%) | 25 (12.5%) |
| 45 to 54 Years | 260 (75.6%) | 84 (24.4%) |
| 55 to 64 Years | 142 (100.0%) | 0 (0.0%) |
| 65 to 74 Years | 137 (100.0%) | 0 (0.0%) |
| 75 Years and older | 63 (100.0%) | 0 (0.0%) |
| Total | 1,288 (86.8%) | 196 (13.2%) |
Health Insurance Coverage by Citizenship Status in Lake Dunlap
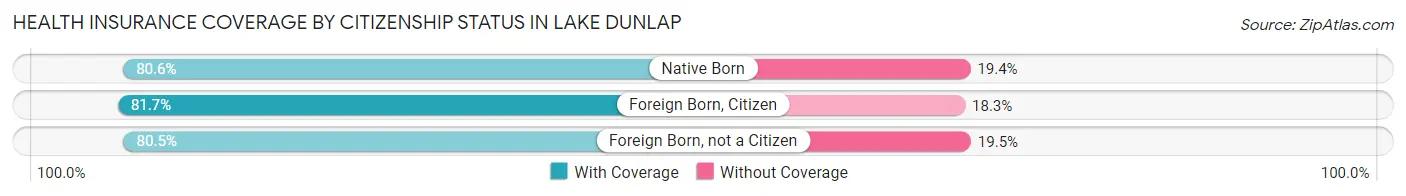
| Citizenship Status | With Coverage | Without Coverage |
| Native Born | 79 (80.6%) | 19 (19.4%) |
| Foreign Born, Citizen | 236 (81.7%) | 53 (18.3%) |
| Foreign Born, not a Citizen | 62 (80.5%) | 15 (19.5%) |
Health Insurance Coverage by Household Income in Lake Dunlap
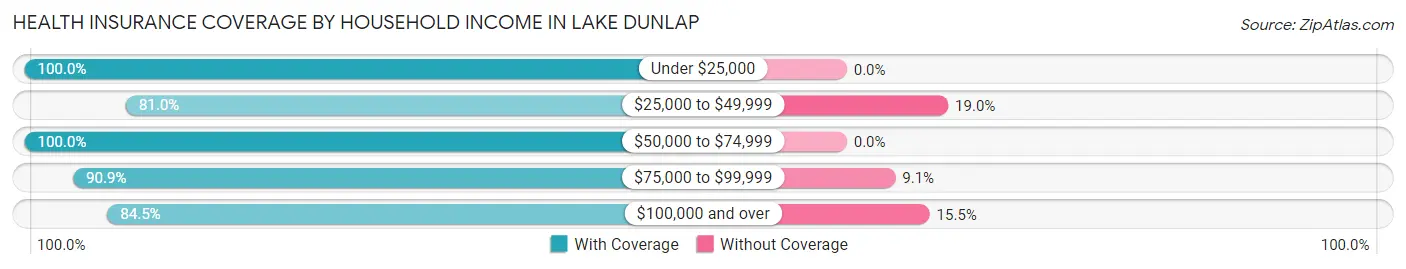
| Household Income | With Coverage | Without Coverage |
| Under $25,000 | 135 (100.0%) | 0 (0.0%) |
| $25,000 to $49,999 | 145 (81.0%) | 34 (19.0%) |
| $50,000 to $74,999 | 90 (100.0%) | 0 (0.0%) |
| $75,000 to $99,999 | 80 (90.9%) | 8 (9.1%) |
| $100,000 and over | 838 (84.5%) | 154 (15.5%) |
Public vs Private Health Insurance Coverage by Age in Lake Dunlap
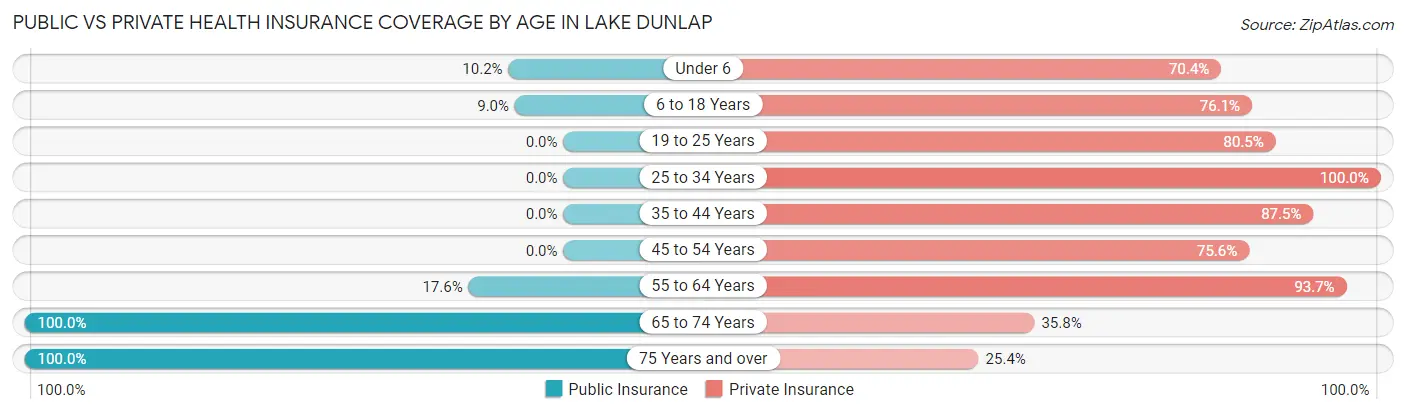
| Age Bracket | Public Insurance | Private Insurance |
| Under 6 | 10 (10.2%) | 69 (70.4%) |
| 6 to 18 Years | 26 (9.0%) | 220 (76.1%) |
| 19 to 25 Years | 0 (0.0%) | 62 (80.5%) |
| 25 to 34 Years | 0 (0.0%) | 134 (100.0%) |
| 35 to 44 Years | 0 (0.0%) | 175 (87.5%) |
| 45 to 54 Years | 0 (0.0%) | 260 (75.6%) |
| 55 to 64 Years | 25 (17.6%) | 133 (93.7%) |
| 65 to 74 Years | 137 (100.0%) | 49 (35.8%) |
| 75 Years and over | 63 (100.0%) | 16 (25.4%) |
| Total | 261 (17.6%) | 1,118 (75.3%) |
Disability Status by Sex by Age in Lake Dunlap
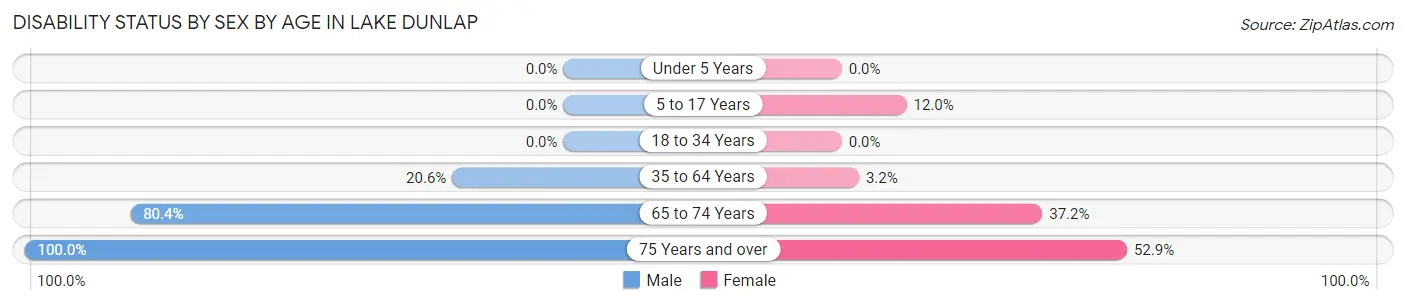
| Age Bracket | Male | Female |
| Under 5 Years | 0 (0.0%) | 0 (0.0%) |
| 5 to 17 Years | 0 (0.0%) | 16 (12.0%) |
| 18 to 34 Years | 0 (0.0%) | 0 (0.0%) |
| 35 to 64 Years | 77 (20.6%) | 10 (3.2%) |
| 65 to 74 Years | 41 (80.4%) | 32 (37.2%) |
| 75 Years and over | 29 (100.0%) | 18 (52.9%) |
Disability Class by Sex by Age in Lake Dunlap
Disability Class: Hearing Difficulty
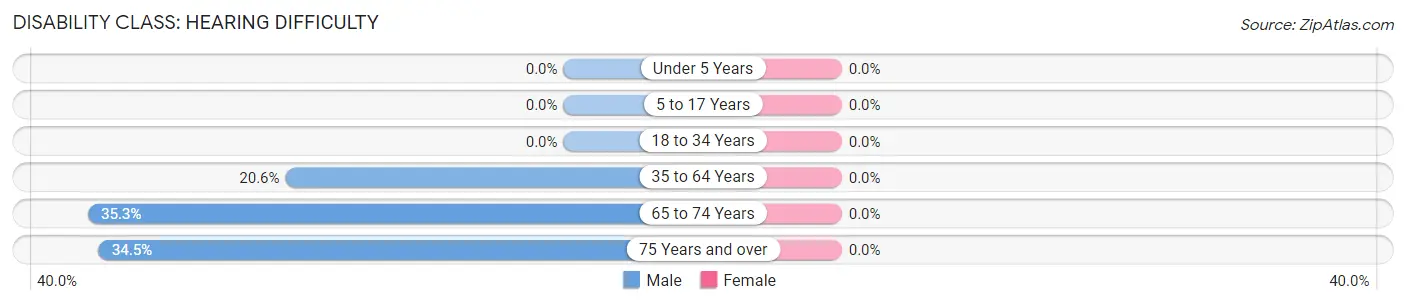
| Age Bracket | Male | Female |
| Under 5 Years | 0 (0.0%) | 0 (0.0%) |
| 5 to 17 Years | 0 (0.0%) | 0 (0.0%) |
| 18 to 34 Years | 0 (0.0%) | 0 (0.0%) |
| 35 to 64 Years | 77 (20.6%) | 0 (0.0%) |
| 65 to 74 Years | 18 (35.3%) | 0 (0.0%) |
| 75 Years and over | 10 (34.5%) | 0 (0.0%) |
Disability Class: Vision Difficulty
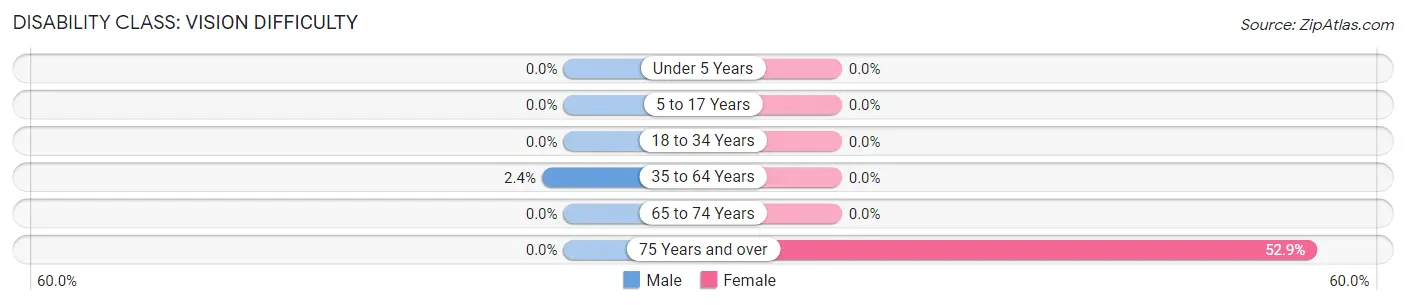
| Age Bracket | Male | Female |
| Under 5 Years | 0 (0.0%) | 0 (0.0%) |
| 5 to 17 Years | 0 (0.0%) | 0 (0.0%) |
| 18 to 34 Years | 0 (0.0%) | 0 (0.0%) |
| 35 to 64 Years | 9 (2.4%) | 0 (0.0%) |
| 65 to 74 Years | 0 (0.0%) | 0 (0.0%) |
| 75 Years and over | 0 (0.0%) | 18 (52.9%) |
Disability Class: Cognitive Difficulty
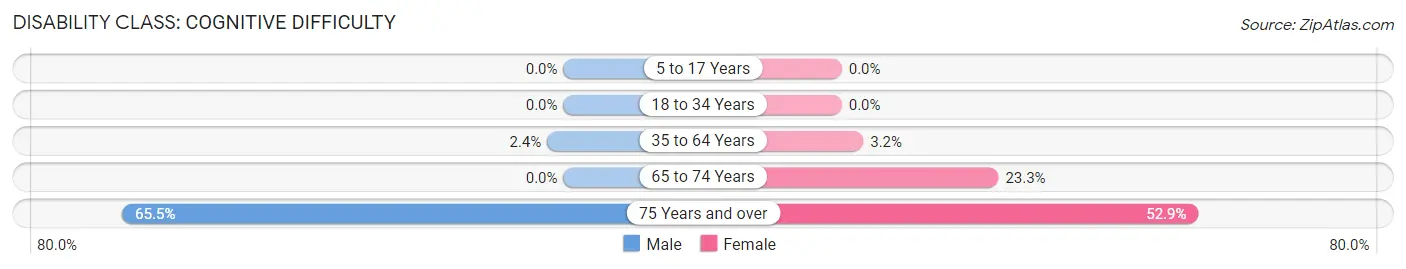
| Age Bracket | Male | Female |
| 5 to 17 Years | 0 (0.0%) | 0 (0.0%) |
| 18 to 34 Years | 0 (0.0%) | 0 (0.0%) |
| 35 to 64 Years | 9 (2.4%) | 10 (3.2%) |
| 65 to 74 Years | 0 (0.0%) | 20 (23.3%) |
| 75 Years and over | 19 (65.5%) | 18 (52.9%) |
Disability Class: Ambulatory Difficulty
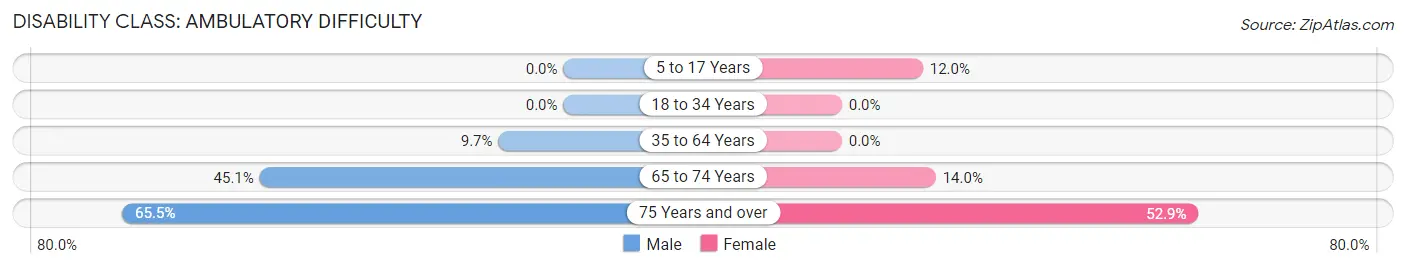
| Age Bracket | Male | Female |
| 5 to 17 Years | 0 (0.0%) | 16 (12.0%) |
| 18 to 34 Years | 0 (0.0%) | 0 (0.0%) |
| 35 to 64 Years | 36 (9.7%) | 0 (0.0%) |
| 65 to 74 Years | 23 (45.1%) | 12 (14.0%) |
| 75 Years and over | 19 (65.5%) | 18 (52.9%) |
Disability Class: Self-Care Difficulty
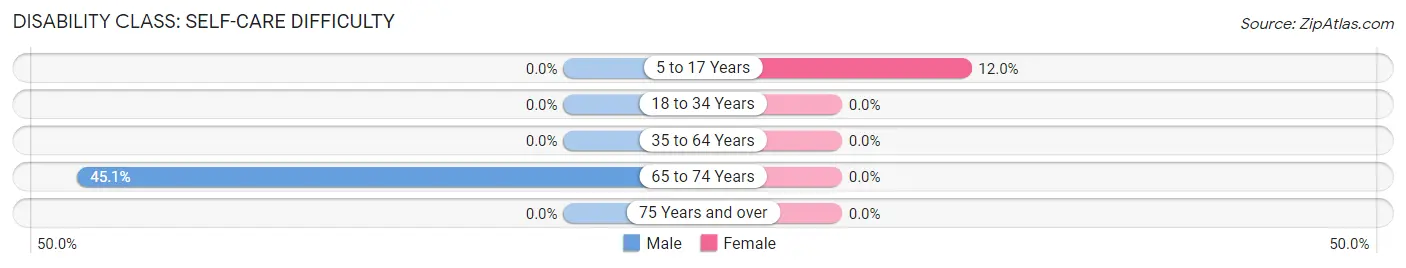
| Age Bracket | Male | Female |
| 5 to 17 Years | 0 (0.0%) | 16 (12.0%) |
| 18 to 34 Years | 0 (0.0%) | 0 (0.0%) |
| 35 to 64 Years | 0 (0.0%) | 0 (0.0%) |
| 65 to 74 Years | 23 (45.1%) | 0 (0.0%) |
| 75 Years and over | 0 (0.0%) | 0 (0.0%) |
Technology Access in Lake Dunlap
Computing Device Access in Lake Dunlap
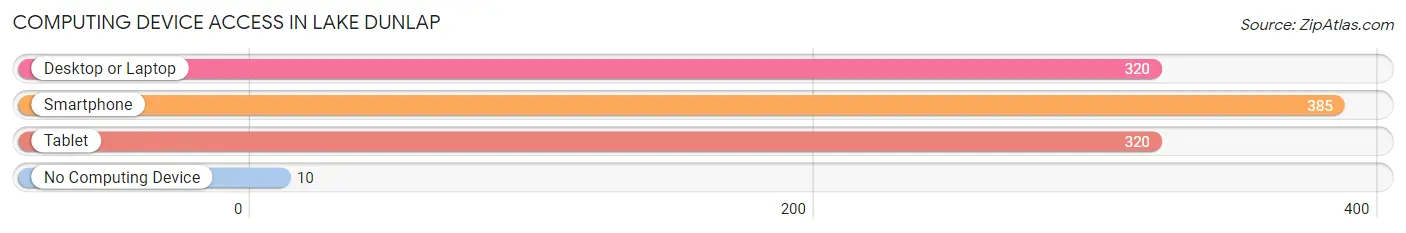
| Device Type | # Households | % Households |
| Desktop or Laptop | 320 | 62.0% |
| Smartphone | 385 | 74.6% |
| Tablet | 320 | 62.0% |
| No Computing Device | 10 | 1.9% |
| Total | 516 | 100.0% |
Internet Access in Lake Dunlap
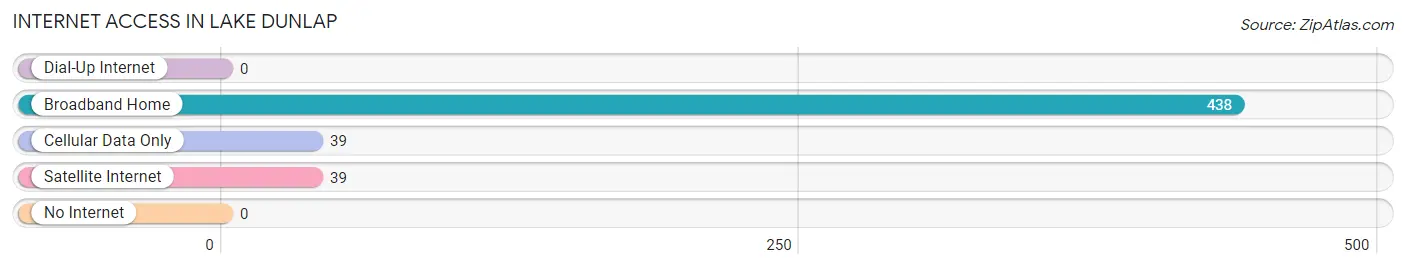
| Internet Type | # Households | % Households |
| Dial-Up Internet | 0 | 0.0% |
| Broadband Home | 438 | 84.9% |
| Cellular Data Only | 39 | 7.6% |
| Satellite Internet | 39 | 7.6% |
| No Internet | 0 | 0.0% |
| Total | 516 | 100.0% |
Lake Dunlap Summary
Lake Dunlap is a small, unincorporated community located in Guadalupe County, Texas. It is situated on the banks of Lake Dunlap, a reservoir on the Guadalupe River. The community is located approximately 20 miles northeast of San Antonio and is part of the San Antonio–New Braunfels Metropolitan Statistical Area.
History
The area around Lake Dunlap was first settled in the late 1800s by German immigrants. The community was originally known as “Gruene”, after the nearby town of Gruene, Texas. In the early 1900s, the area was renamed “Lake Dunlap” after the lake that was created when the Guadalupe River was dammed in 1929. The lake was named after John Dunlap, a local rancher and businessman who owned much of the land around the lake.
Geography
Lake Dunlap is located in Guadalupe County, Texas, approximately 20 miles northeast of San Antonio. The community is situated on the banks of Lake Dunlap, a reservoir on the Guadalupe River. The lake covers an area of approximately 1,400 acres and is a popular destination for fishing, boating, and other recreational activities.
Economy
The economy of Lake Dunlap is largely based on tourism and recreation. The lake is a popular destination for fishing, boating, and other recreational activities. There are several marinas and boat ramps located around the lake, as well as several restaurants and other businesses catering to visitors.
Demographics
As of the 2010 census, the population of Lake Dunlap was 1,845. The racial makeup of the community was 94.3% White, 0.7% African American, 0.3% Native American, 0.2% Asian, 0.1% Pacific Islander, 2.7% from other races, and 1.9% from two or more races. Hispanic or Latino of any race were 8.2% of the population.
The median household income in Lake Dunlap was $45,938, and the median family income was $50,938. The per capita income for the community was $20,938. About 8.2% of families and 10.2% of the population were below the poverty line, including 14.2% of those under age 18 and 6.2% of those age 65 or over.
Conclusion
Lake Dunlap is a small, unincorporated community located in Guadalupe County, Texas. It is situated on the banks of Lake Dunlap, a reservoir on the Guadalupe River. The community was originally settled by German immigrants in the late 1800s and was renamed “Lake Dunlap” after the lake that was created when the Guadalupe River was dammed in 1929. The economy of Lake Dunlap is largely based on tourism and recreation, and the population of the community was 1,845 as of the 2010 census.
Common Questions
What is Per Capita Income in Lake Dunlap?
Per Capita income in Lake Dunlap is $39,835.
What is the Median Family Income in Lake Dunlap?
Median Family Income in Lake Dunlap is $117,877.
What is the Median Household income in Lake Dunlap?
Median Household Income in Lake Dunlap is $101,667.
What is Income or Wage Gap in Lake Dunlap?
Income or Wage Gap in Lake Dunlap is 22.4%.
Women in Lake Dunlap earn 77.6 cents for every dollar earned by a man.
What is Inequality or Gini Index in Lake Dunlap?
Inequality or Gini Index in Lake Dunlap is 0.35.
What is the Total Population of Lake Dunlap?
Total Population of Lake Dunlap is 1,484.
What is the Total Male Population of Lake Dunlap?
Total Male Population of Lake Dunlap is 773.
What is the Total Female Population of Lake Dunlap?
Total Female Population of Lake Dunlap is 711.
What is the Ratio of Males per 100 Females in Lake Dunlap?
There are 108.72 Males per 100 Females in Lake Dunlap.
What is the Ratio of Females per 100 Males in Lake Dunlap?
There are 91.98 Females per 100 Males in Lake Dunlap.
What is the Median Population Age in Lake Dunlap?
Median Population Age in Lake Dunlap is 41.9 Years.
What is the Average Family Size in Lake Dunlap
Average Family Size in Lake Dunlap is 3.4 People.
What is the Average Household Size in Lake Dunlap
Average Household Size in Lake Dunlap is 2.9 People.
How Large is the Labor Force in Lake Dunlap?
There are 740 People in the Labor Forcein in Lake Dunlap.
What is the Percentage of People in the Labor Force in Lake Dunlap?
60.2% of People are in the Labor Force in Lake Dunlap.