South Houston, TX Map & Demographics
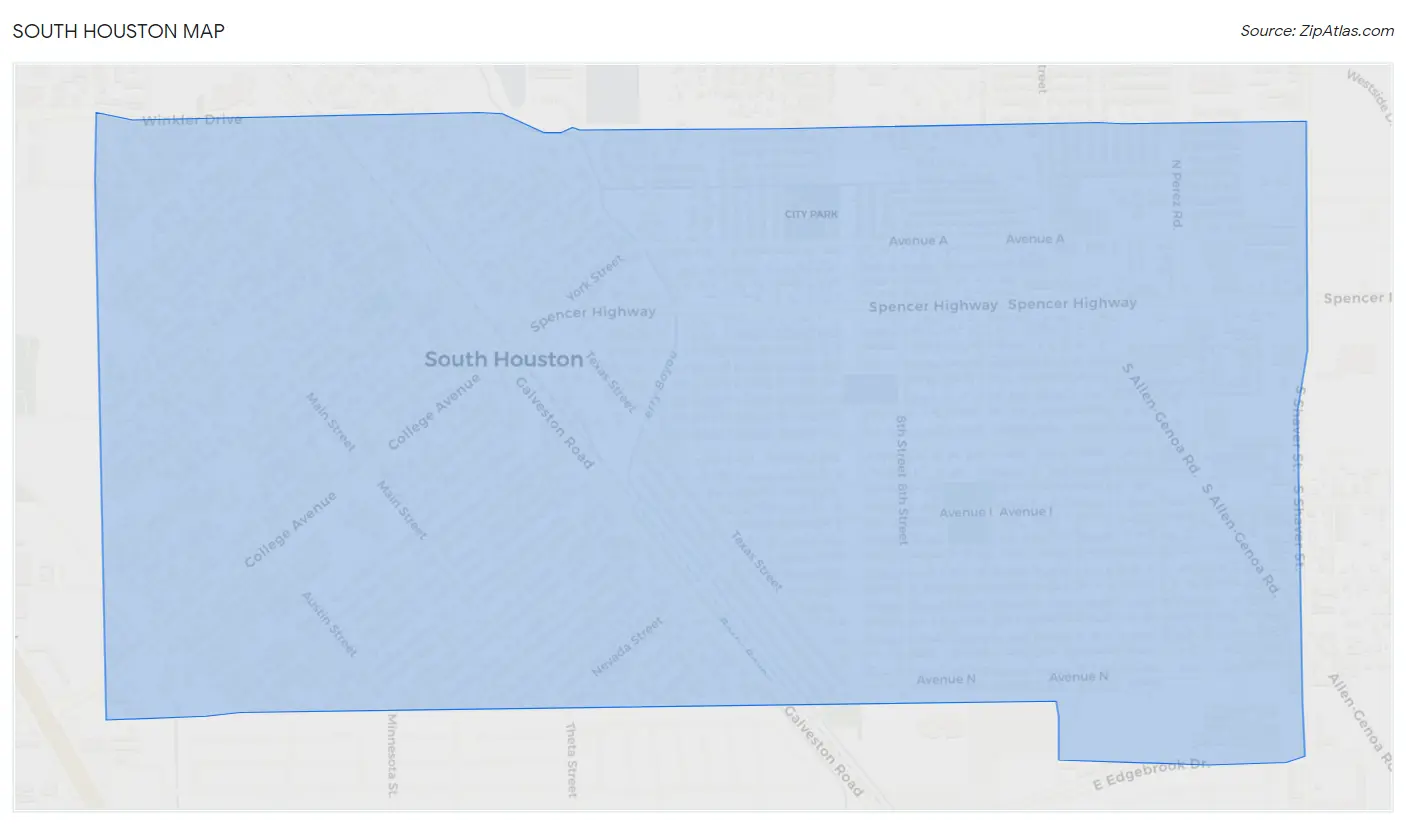
South Houston Map
South Houston Overview
$20,716
PER CAPITA INCOME
$58,836
AVG FAMILY INCOME
$51,006
AVG HOUSEHOLD INCOME
36.5%
WAGE / INCOME GAP [ % ]
63.5¢/ $1
WAGE / INCOME GAP [ $ ]
$10,349
FAMILY INCOME DEFICIT
0.43
INEQUALITY / GINI INDEX
16,169
TOTAL POPULATION
7,811
MALE POPULATION
8,358
FEMALE POPULATION
93.46
MALES / 100 FEMALES
107.00
FEMALES / 100 MALES
28.3
MEDIAN AGE
3.9
AVG FAMILY SIZE
3.4
AVG HOUSEHOLD SIZE
7,636
LABOR FORCE [ PEOPLE ]
64.6%
PERCENT IN LABOR FORCE
9.2%
UNEMPLOYMENT RATE
South Houston Zip Codes
South Houston Area Codes
Income in South Houston
Income Overview in South Houston
Per Capita Income in South Houston is $20,716, while median incomes of families and households are $58,836 and $51,006 respectively.
| Characteristic | Number | Measure |
| Per Capita Income | 16,169 | $20,716 |
| Median Family Income | 3,715 | $58,836 |
| Mean Family Income | 3,715 | $72,296 |
| Median Household Income | 4,821 | $51,006 |
| Mean Household Income | 4,821 | $67,197 |
| Income Deficit | 3,715 | $10,349 |
| Wage / Income Gap (%) | 16,169 | 36.49% |
| Wage / Income Gap ($) | 16,169 | 63.51¢ per $1 |
| Gini / Inequality Index | 16,169 | 0.43 |
Earnings by Sex in South Houston
Average Earnings in South Houston are $30,018, $36,112 for men and $22,936 for women, a difference of 36.5%.
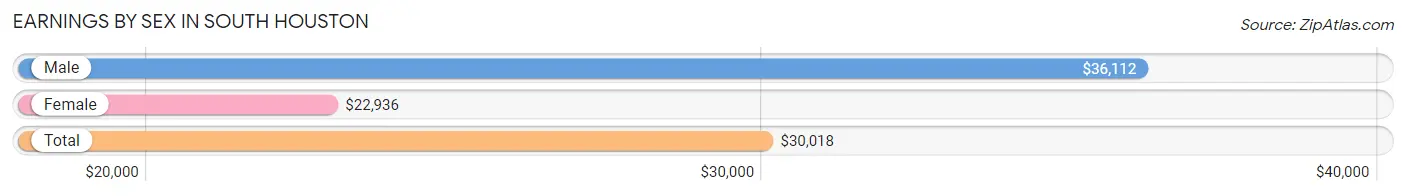
| Sex | Number | Average Earnings |
| Male | 4,277 (55.8%) | $36,112 |
| Female | 3,394 (44.2%) | $22,936 |
| Total | 7,671 (100.0%) | $30,018 |
Earnings by Sex by Income Bracket in South Houston
The most common earnings brackets in South Houston are $55,000 to $64,999 for men (466 | 10.9%) and $30,000 to $34,999 for women (321 | 9.5%).
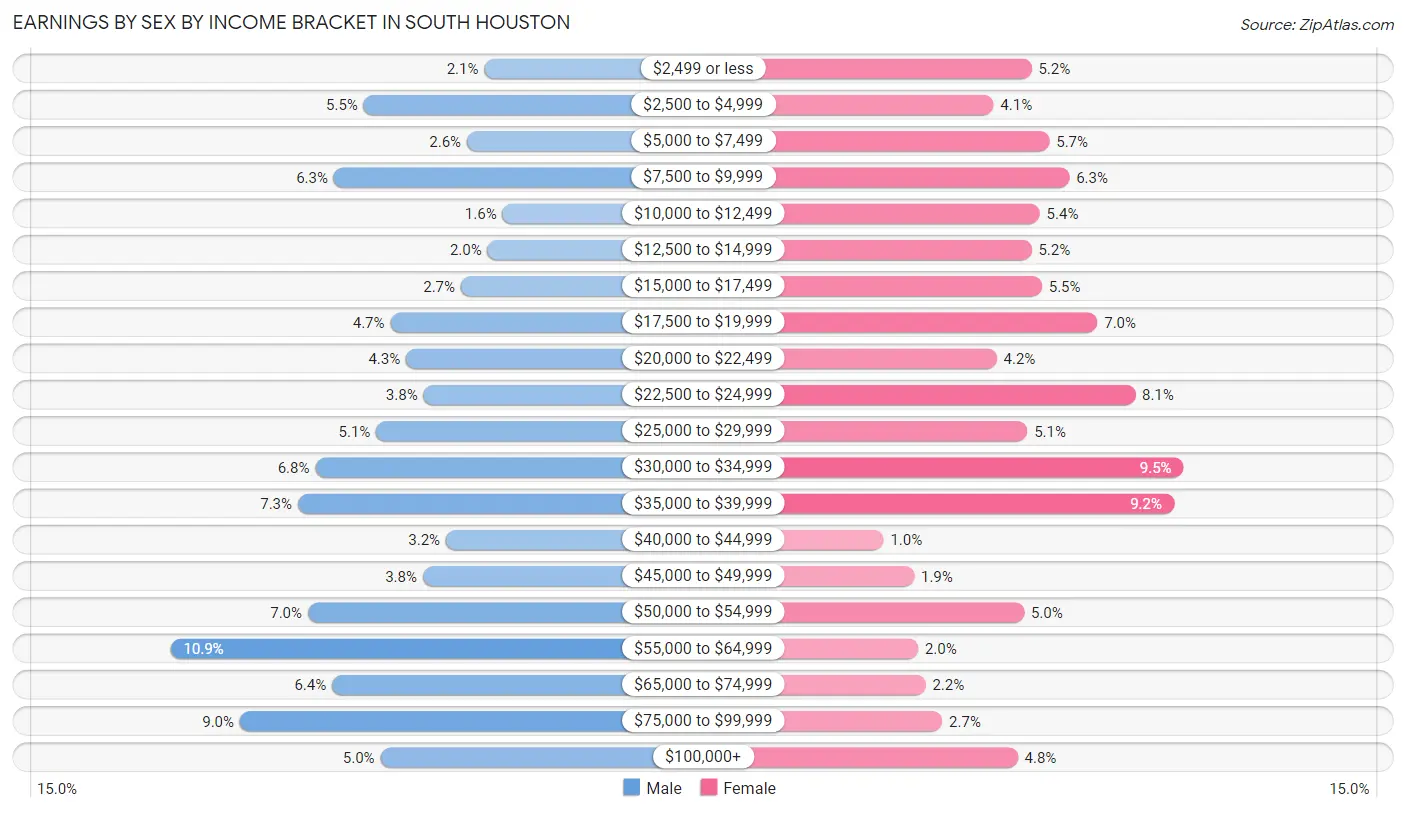
| Income | Male | Female |
| $2,499 or less | 89 (2.1%) | 176 (5.2%) |
| $2,500 to $4,999 | 234 (5.5%) | 140 (4.1%) |
| $5,000 to $7,499 | 110 (2.6%) | 193 (5.7%) |
| $7,500 to $9,999 | 270 (6.3%) | 212 (6.2%) |
| $10,000 to $12,499 | 67 (1.6%) | 184 (5.4%) |
| $12,500 to $14,999 | 85 (2.0%) | 176 (5.2%) |
| $15,000 to $17,499 | 117 (2.7%) | 186 (5.5%) |
| $17,500 to $19,999 | 202 (4.7%) | 239 (7.0%) |
| $20,000 to $22,499 | 183 (4.3%) | 143 (4.2%) |
| $22,500 to $24,999 | 162 (3.8%) | 275 (8.1%) |
| $25,000 to $29,999 | 219 (5.1%) | 172 (5.1%) |
| $30,000 to $34,999 | 292 (6.8%) | 321 (9.5%) |
| $35,000 to $39,999 | 313 (7.3%) | 312 (9.2%) |
| $40,000 to $44,999 | 135 (3.2%) | 35 (1.0%) |
| $45,000 to $49,999 | 163 (3.8%) | 64 (1.9%) |
| $50,000 to $54,999 | 301 (7.0%) | 169 (5.0%) |
| $55,000 to $64,999 | 466 (10.9%) | 68 (2.0%) |
| $65,000 to $74,999 | 272 (6.4%) | 75 (2.2%) |
| $75,000 to $99,999 | 383 (8.9%) | 91 (2.7%) |
| $100,000+ | 214 (5.0%) | 163 (4.8%) |
| Total | 4,277 (100.0%) | 3,394 (100.0%) |
Earnings by Sex by Educational Attainment in South Houston
Average earnings in South Houston are $46,107 for men and $30,649 for women, a difference of 33.5%. Men with an educational attainment of college or associate's degree enjoy the highest average annual earnings of $56,424, while those with less than high school education earn the least with $31,458. Women with an educational attainment of high school diploma earn the most with the average annual earnings of $35,402, while those with less than high school education have the smallest earnings of $14,572.
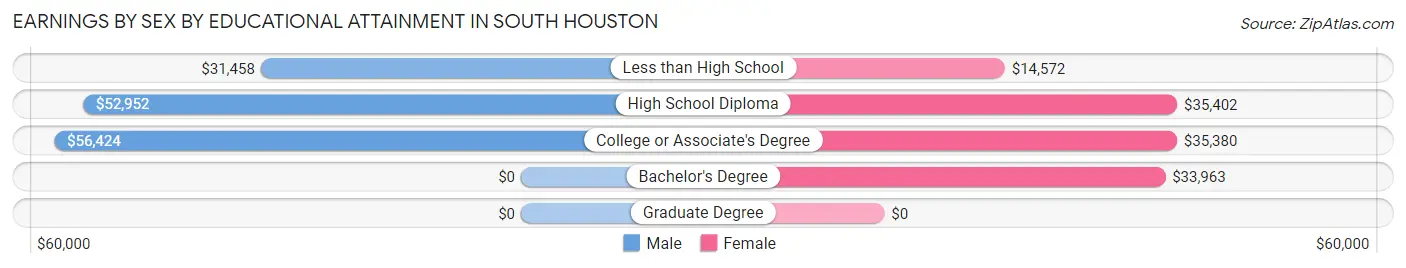
| Educational Attainment | Male Income | Female Income |
| Less than High School | $31,458 | $14,572 |
| High School Diploma | $52,952 | $35,402 |
| College or Associate's Degree | $56,424 | $35,380 |
| Bachelor's Degree | - | - |
| Graduate Degree | - | - |
| Total | $46,107 | $30,649 |
Family Income in South Houston
Family Income Brackets in South Houston
According to the South Houston family income data, there are 669 families falling into the $50,000 to $74,999 income range, which is the most common income bracket and makes up 18.0% of all families. Conversely, the $10,000 to $14,999 income bracket is the least frequent group with only 19 families (0.5%) belonging to this category.
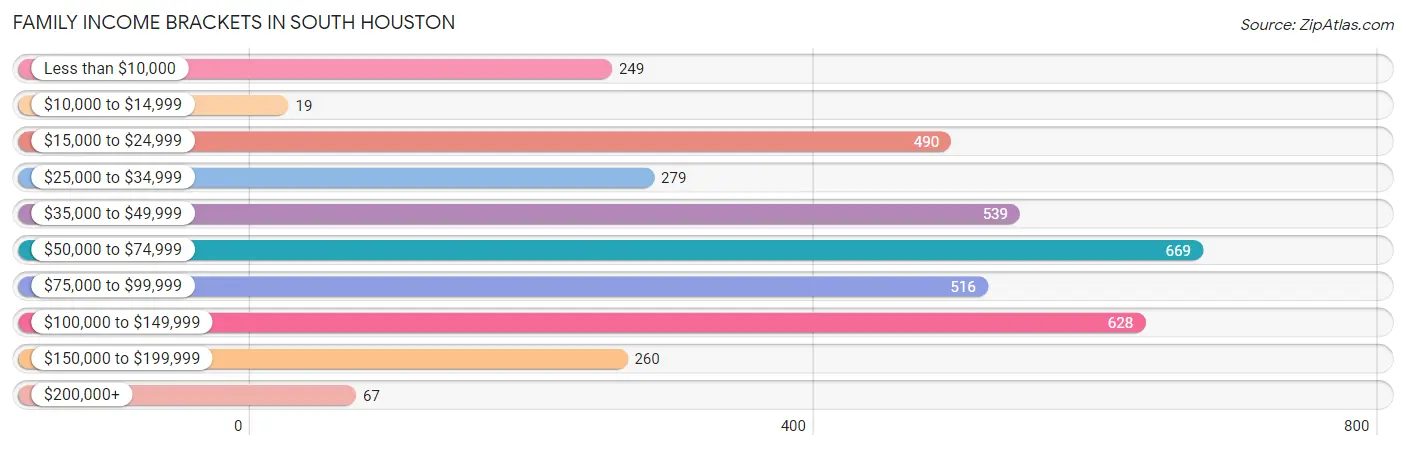
| Income Bracket | # Families | % Families |
| Less than $10,000 | 249 | 6.7% |
| $10,000 to $14,999 | 19 | 0.5% |
| $15,000 to $24,999 | 490 | 13.2% |
| $25,000 to $34,999 | 279 | 7.5% |
| $35,000 to $49,999 | 539 | 14.5% |
| $50,000 to $74,999 | 669 | 18.0% |
| $75,000 to $99,999 | 516 | 13.9% |
| $100,000 to $149,999 | 628 | 16.9% |
| $150,000 to $199,999 | 260 | 7.0% |
| $200,000+ | 67 | 1.8% |
Family Income by Famaliy Size in South Houston
7+ person families (323 | 8.7%) account for the highest median family income in South Houston with $96,408 per family, while 4-person families (611 | 16.5%) have the highest median income of $19,779 per family member.
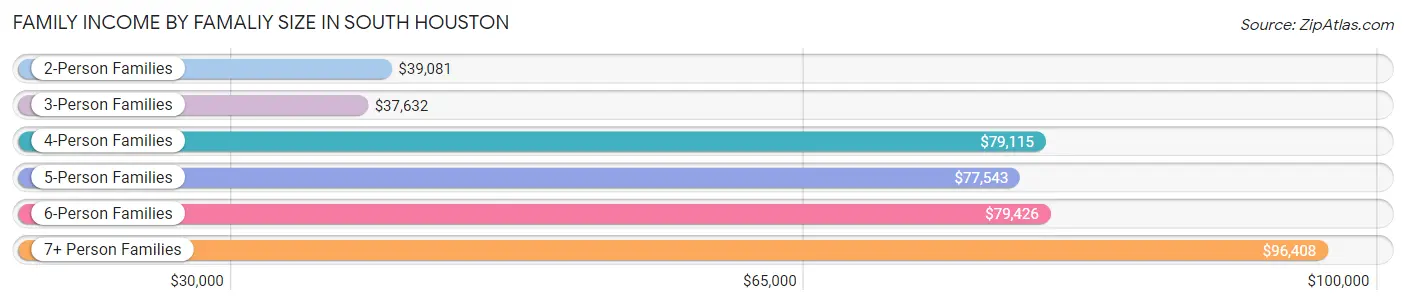
| Income Bracket | # Families | Median Income |
| 2-Person Families | 1,233 (33.2%) | $39,081 |
| 3-Person Families | 730 (19.7%) | $37,632 |
| 4-Person Families | 611 (16.5%) | $79,115 |
| 5-Person Families | 533 (14.3%) | $77,543 |
| 6-Person Families | 285 (7.7%) | $79,426 |
| 7+ Person Families | 323 (8.7%) | $96,408 |
| Total | 3,715 (100.0%) | $58,836 |
Family Income by Number of Earners in South Houston
The median family income in South Houston is $58,836, with families comprising 3+ earners (681) having the highest median family income of $115,850, while families with no earners (315) have the lowest median family income of $20,477, accounting for 18.3% and 8.5% of families, respectively.
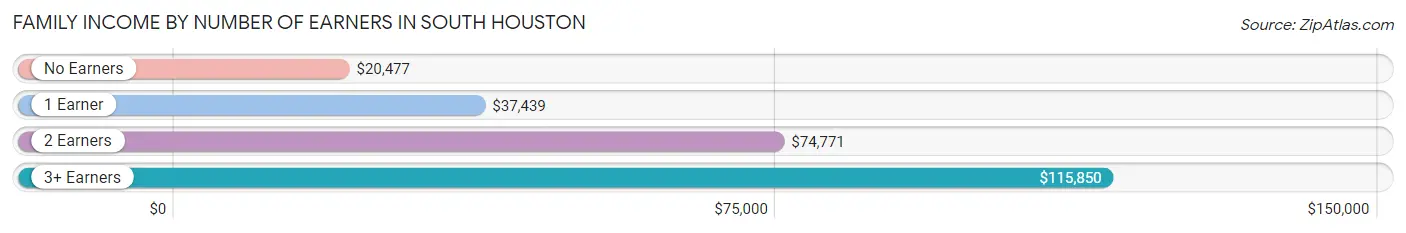
| Number of Earners | # Families | Median Income |
| No Earners | 315 (8.5%) | $20,477 |
| 1 Earner | 1,316 (35.4%) | $37,439 |
| 2 Earners | 1,403 (37.8%) | $74,771 |
| 3+ Earners | 681 (18.3%) | $115,850 |
| Total | 3,715 (100.0%) | $58,836 |
Household Income in South Houston
Household Income Brackets in South Houston
With 757 households falling in the category, the $100,000 to $149,999 income range is the most frequent in South Houston, accounting for 15.7% of all households. In contrast, only 77 households (1.6%) fall into the $200,000+ income bracket, making it the least populous group.
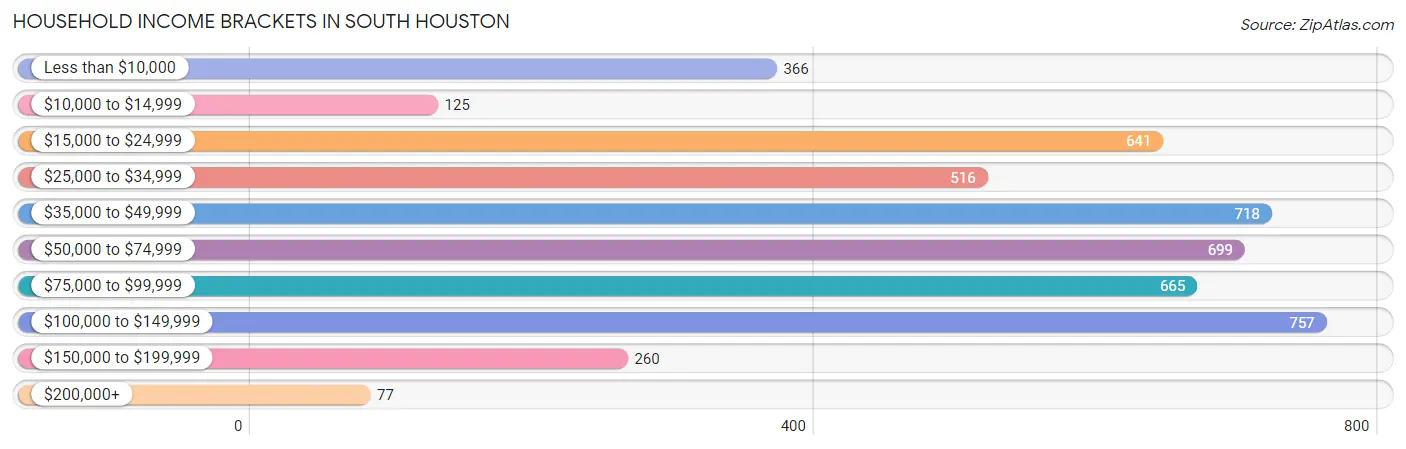
| Income Bracket | # Households | % Households |
| Less than $10,000 | 366 | 7.6% |
| $10,000 to $14,999 | 125 | 2.6% |
| $15,000 to $24,999 | 641 | 13.3% |
| $25,000 to $34,999 | 516 | 10.7% |
| $35,000 to $49,999 | 718 | 14.9% |
| $50,000 to $74,999 | 699 | 14.5% |
| $75,000 to $99,999 | 665 | 13.8% |
| $100,000 to $149,999 | 757 | 15.7% |
| $150,000 to $199,999 | 260 | 5.4% |
| $200,000+ | 77 | 1.6% |
Household Income by Householder Age in South Houston
The median household income in South Houston is $51,006, with the highest median household income of $66,402 found in the 45 to 64 years age bracket for the primary householder. A total of 1,983 households (41.1%) fall into this category. Meanwhile, the 15 to 24 years age bracket for the primary householder has the lowest median household income of $34,038, with 288 households (6.0%) in this group.
| Income Bracket | # Households | Median Income |
| 15 to 24 Years | 288 (6.0%) | $34,038 |
| 25 to 44 Years | 1,729 (35.9%) | $51,143 |
| 45 to 64 Years | 1,983 (41.1%) | $66,402 |
| 65+ Years | 821 (17.0%) | $37,014 |
| Total | 4,821 (100.0%) | $51,006 |
Poverty in South Houston
Income Below Poverty by Sex and Age in South Houston
With 21.0% poverty level for males and 24.9% for females among the residents of South Houston, 5 year old males and under 5 year old females are the most vulnerable to poverty, with 31 males (100.0%) and 338 females (41.1%) in their respective age groups living below the poverty level.
| Age Bracket | Male | Female |
| Under 5 Years | 208 (43.4%) | 338 (41.1%) |
| 5 Years | 31 (100.0%) | 0 (0.0%) |
| 6 to 11 Years | 243 (27.7%) | 165 (19.0%) |
| 12 to 14 Years | 137 (28.2%) | 124 (24.0%) |
| 15 Years | 27 (13.9%) | 0 (0.0%) |
| 16 and 17 Years | 156 (29.3%) | 127 (22.7%) |
| 18 to 24 Years | 143 (16.1%) | 394 (35.6%) |
| 25 to 34 Years | 188 (20.9%) | 293 (32.6%) |
| 35 to 44 Years | 124 (11.9%) | 202 (17.7%) |
| 45 to 54 Years | 219 (22.1%) | 123 (13.3%) |
| 55 to 64 Years | 79 (9.9%) | 183 (26.1%) |
| 65 to 74 Years | 55 (13.3%) | 91 (21.3%) |
| 75 Years and over | 28 (17.0%) | 34 (10.7%) |
| Total | 1,638 (21.0%) | 2,074 (24.9%) |
Income Above Poverty by Sex and Age in South Houston
According to the poverty statistics in South Houston, males aged 55 to 64 years and females aged 5 years are the age groups that are most secure financially, with 90.1% of males and 100.0% of females in these age groups living above the poverty line.
| Age Bracket | Male | Female |
| Under 5 Years | 271 (56.6%) | 485 (58.9%) |
| 5 Years | 0 (0.0%) | 35 (100.0%) |
| 6 to 11 Years | 634 (72.3%) | 704 (81.0%) |
| 12 to 14 Years | 349 (71.8%) | 392 (76.0%) |
| 15 Years | 167 (86.1%) | 22 (100.0%) |
| 16 and 17 Years | 377 (70.7%) | 432 (77.3%) |
| 18 to 24 Years | 747 (83.9%) | 713 (64.4%) |
| 25 to 34 Years | 711 (79.1%) | 606 (67.4%) |
| 35 to 44 Years | 920 (88.1%) | 941 (82.3%) |
| 45 to 54 Years | 772 (77.9%) | 799 (86.7%) |
| 55 to 64 Years | 722 (90.1%) | 518 (73.9%) |
| 65 to 74 Years | 358 (86.7%) | 337 (78.7%) |
| 75 Years and over | 137 (83.0%) | 285 (89.3%) |
| Total | 6,165 (79.0%) | 6,269 (75.1%) |
Income Below Poverty Among Married-Couple Families in South Houston
The poverty statistics for married-couple families in South Houston show that 9.2% or 192 of the total 2,085 families live below the poverty line. Families with 1 or 2 children have the highest poverty rate of 13.3%, comprising of 97 families. On the other hand, families with 5 or more children have the lowest poverty rate of 0.0%, which includes 0 families.
| Children | Above Poverty | Below Poverty |
| No Children | 792 (90.3%) | 85 (9.7%) |
| 1 or 2 Children | 631 (86.7%) | 97 (13.3%) |
| 3 or 4 Children | 382 (97.5%) | 10 (2.5%) |
| 5 or more Children | 88 (100.0%) | 0 (0.0%) |
| Total | 1,893 (90.8%) | 192 (9.2%) |
Income Below Poverty Among Single-Parent Households in South Houston
According to the poverty data in South Houston, 43.2% or 243 single-father households and 32.3% or 345 single-mother households are living below the poverty line. Among single-father households, those with 1 or 2 children have the highest poverty rate, with 225 households (63.0%) experiencing poverty. Likewise, among single-mother households, those with 5 or more children have the highest poverty rate, with 92 households (80.0%) falling below the poverty line.
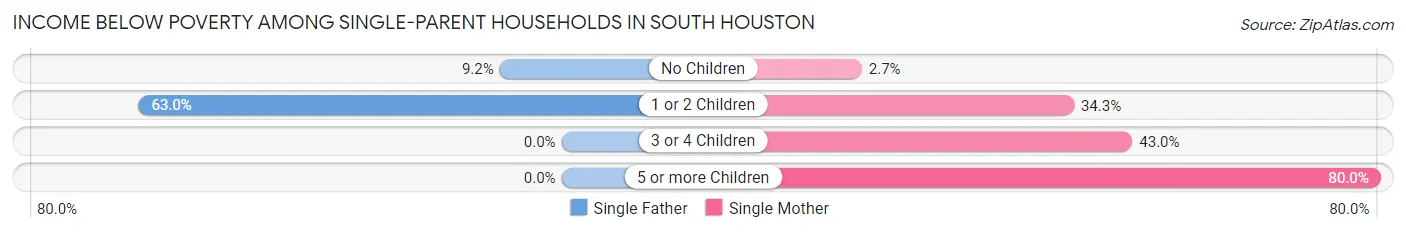
| Children | Single Father | Single Mother |
| No Children | 18 (9.2%) | 7 (2.7%) |
| 1 or 2 Children | 225 (63.0%) | 209 (34.3%) |
| 3 or 4 Children | 0 (0.0%) | 37 (43.0%) |
| 5 or more Children | 0 (0.0%) | 92 (80.0%) |
| Total | 243 (43.2%) | 345 (32.3%) |
Income Below Poverty Among Married-Couple vs Single-Parent Households in South Houston
The poverty data for South Houston shows that 192 of the married-couple family households (9.2%) and 588 of the single-parent households (36.1%) are living below the poverty level. Within the married-couple family households, those with 1 or 2 children have the highest poverty rate, with 97 households (13.3%) falling below the poverty line. Among the single-parent households, those with 5 or more children have the highest poverty rate, with 92 household (80.0%) living below poverty.
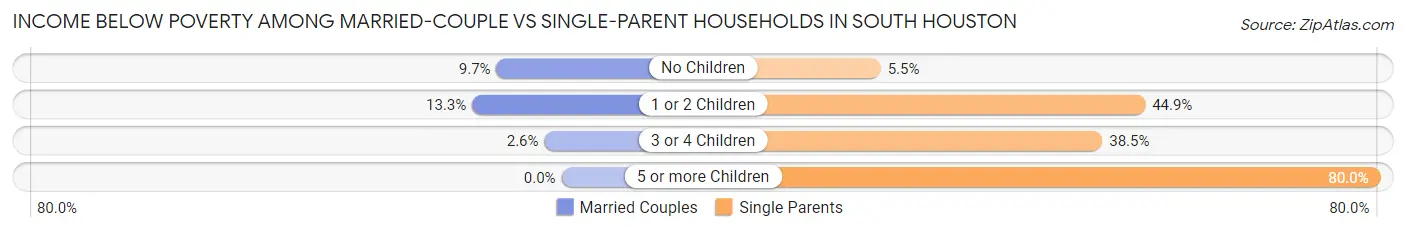
| Children | Married-Couple Families | Single-Parent Households |
| No Children | 85 (9.7%) | 25 (5.5%) |
| 1 or 2 Children | 97 (13.3%) | 434 (44.9%) |
| 3 or 4 Children | 10 (2.5%) | 37 (38.5%) |
| 5 or more Children | 0 (0.0%) | 92 (80.0%) |
| Total | 192 (9.2%) | 588 (36.1%) |
Race in South Houston
The most populous races in South Houston are Hispanic or Latino (14,931 | 92.3%), White / Caucasian (8,140 | 50.3%), and Two or more Races (5,963 | 36.9%).
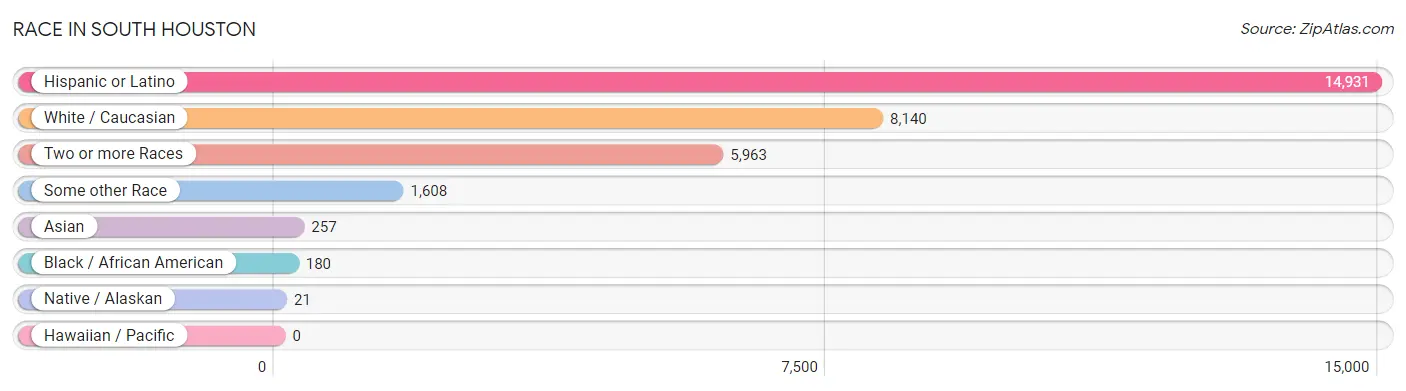
| Race | # Population | % Population |
| Asian | 257 | 1.6% |
| Black / African American | 180 | 1.1% |
| Hawaiian / Pacific | 0 | 0.0% |
| Hispanic or Latino | 14,931 | 92.3% |
| Native / Alaskan | 21 | 0.1% |
| White / Caucasian | 8,140 | 50.3% |
| Two or more Races | 5,963 | 36.9% |
| Some other Race | 1,608 | 9.9% |
| Total | 16,169 | 100.0% |
Ancestry in South Houston
The most populous ancestries reported in South Houston are Mexican (13,600 | 84.1%), Central American (581 | 3.6%), Salvadoran (311 | 1.9%), Cuban (233 | 1.4%), and Honduran (188 | 1.2%), together accounting for 92.2% of all South Houston residents.
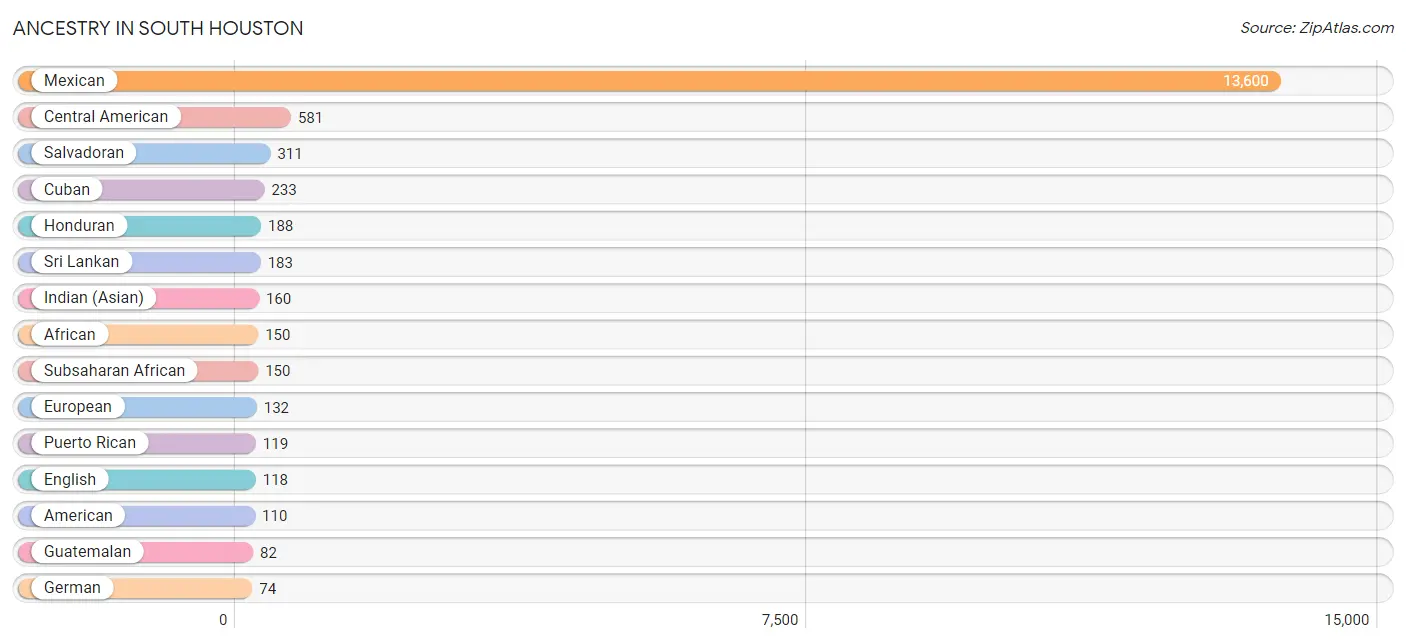
| Ancestry | # Population | % Population |
| African | 150 | 0.9% |
| American | 110 | 0.7% |
| Basque | 3 | 0.0% |
| Cajun | 6 | 0.0% |
| Central American | 581 | 3.6% |
| Colombian | 17 | 0.1% |
| Cuban | 233 | 1.4% |
| Czech | 23 | 0.1% |
| Dominican | 50 | 0.3% |
| English | 118 | 0.7% |
| European | 132 | 0.8% |
| Filipino | 30 | 0.2% |
| French | 4 | 0.0% |
| German | 74 | 0.5% |
| Guatemalan | 82 | 0.5% |
| Honduran | 188 | 1.2% |
| Indian (Asian) | 160 | 1.0% |
| Irish | 64 | 0.4% |
| Italian | 33 | 0.2% |
| Mexican | 13,600 | 84.1% |
| Mexican American Indian | 29 | 0.2% |
| Norwegian | 8 | 0.1% |
| Polish | 14 | 0.1% |
| Puerto Rican | 119 | 0.7% |
| Salvadoran | 311 | 1.9% |
| Scotch-Irish | 42 | 0.3% |
| Scottish | 22 | 0.1% |
| South American | 61 | 0.4% |
| Spaniard | 25 | 0.2% |
| Spanish | 7 | 0.0% |
| Sri Lankan | 183 | 1.1% |
| Subsaharan African | 150 | 0.9% |
| Venezuelan | 44 | 0.3% |
| Vietnamese | 31 | 0.2% |
| Welsh | 11 | 0.1% | View All 35 Rows |
Immigrants in South Houston
The most numerous immigrant groups reported in South Houston came from Latin America (4,375 | 27.1%), Central America (4,274 | 26.4%), Mexico (3,729 | 23.1%), El Salvador (289 | 1.8%), and Honduras (220 | 1.4%), together accounting for 79.7% of all South Houston residents.
| Immigration Origin | # Population | % Population |
| Africa | 42 | 0.3% |
| Asia | 121 | 0.7% |
| Bangladesh | 31 | 0.2% |
| Cambodia | 29 | 0.2% |
| Caribbean | 50 | 0.3% |
| Central America | 4,274 | 26.4% |
| China | 14 | 0.1% |
| Colombia | 7 | 0.0% |
| Cuba | 16 | 0.1% |
| Dominican Republic | 34 | 0.2% |
| Eastern Asia | 14 | 0.1% |
| El Salvador | 289 | 1.8% |
| Guatemala | 36 | 0.2% |
| Honduras | 220 | 1.4% |
| Latin America | 4,375 | 27.1% |
| Mexico | 3,729 | 23.1% |
| Nigeria | 42 | 0.3% |
| South America | 51 | 0.3% |
| South Central Asia | 31 | 0.2% |
| South Eastern Asia | 76 | 0.5% |
| Taiwan | 14 | 0.1% |
| Venezuela | 44 | 0.3% |
| Vietnam | 47 | 0.3% |
| Western Africa | 42 | 0.3% | View All 24 Rows |
Sex and Age in South Houston
Sex and Age in South Houston
The most populous age groups in South Houston are 15 to 19 Years (1,030 | 13.2%) for men and 15 to 19 Years (880 | 10.5%) for women.
| Age Bracket | Male | Female |
| Under 5 Years | 479 (6.1%) | 835 (10.0%) |
| 5 to 9 Years | 602 (7.7%) | 549 (6.6%) |
| 10 to 14 Years | 797 (10.2%) | 871 (10.4%) |
| 15 to 19 Years | 1,030 (13.2%) | 880 (10.5%) |
| 20 to 24 Years | 589 (7.5%) | 809 (9.7%) |
| 25 to 29 Years | 472 (6.0%) | 392 (4.7%) |
| 30 to 34 Years | 427 (5.5%) | 509 (6.1%) |
| 35 to 39 Years | 465 (5.9%) | 496 (5.9%) |
| 40 to 44 Years | 579 (7.4%) | 647 (7.7%) |
| 45 to 49 Years | 598 (7.7%) | 494 (5.9%) |
| 50 to 54 Years | 393 (5.0%) | 428 (5.1%) |
| 55 to 59 Years | 341 (4.4%) | 246 (2.9%) |
| 60 to 64 Years | 461 (5.9%) | 455 (5.4%) |
| 65 to 69 Years | 256 (3.3%) | 227 (2.7%) |
| 70 to 74 Years | 157 (2.0%) | 201 (2.4%) |
| 75 to 79 Years | 65 (0.8%) | 162 (1.9%) |
| 80 to 84 Years | 43 (0.5%) | 95 (1.1%) |
| 85 Years and over | 57 (0.7%) | 62 (0.7%) |
| Total | 7,811 (100.0%) | 8,358 (100.0%) |
Families and Households in South Houston
Median Family Size in South Houston
The median family size in South Houston is 3.89 persons per family, with married-couple families (2,085 | 56.1%) accounting for the largest median family size of 4.22 persons per family. On the other hand, single male/father families (562 | 15.1%) represent the smallest median family size with 2.76 persons per family.
| Family Type | # Families | Family Size |
| Married-Couple | 2,085 (56.1%) | 4.22 |
| Single Male/Father | 562 (15.1%) | 2.76 |
| Single Female/Mother | 1,068 (28.7%) | 3.83 |
| Total Families | 3,715 (100.0%) | 3.89 |
Median Household Size in South Houston
The median household size in South Houston is 3.35 persons per household, with married-couple households (2,085 | 43.2%) accounting for the largest median household size of 4.25 persons per household. non-family households (1,106 | 22.9%) represent the smallest median household size with 1.10 persons per household.
| Household Type | # Households | Household Size |
| Married-Couple | 2,085 (43.2%) | 4.25 |
| Single Male/Father | 562 (11.7%) | 2.99 |
| Single Female/Mother | 1,068 (22.2%) | 4.13 |
| Non-family | 1,106 (22.9%) | 1.10 |
| Total Households | 4,821 (100.0%) | 3.35 |
Household Size by Marriage Status in South Houston
Out of a total of 4,821 households in South Houston, 3,715 (77.1%) are family households, while 1,106 (22.9%) are nonfamily households. The most numerous type of family households are 2-person households, comprising 1,093, and the most common type of nonfamily households are 1-person households, comprising 1,000.
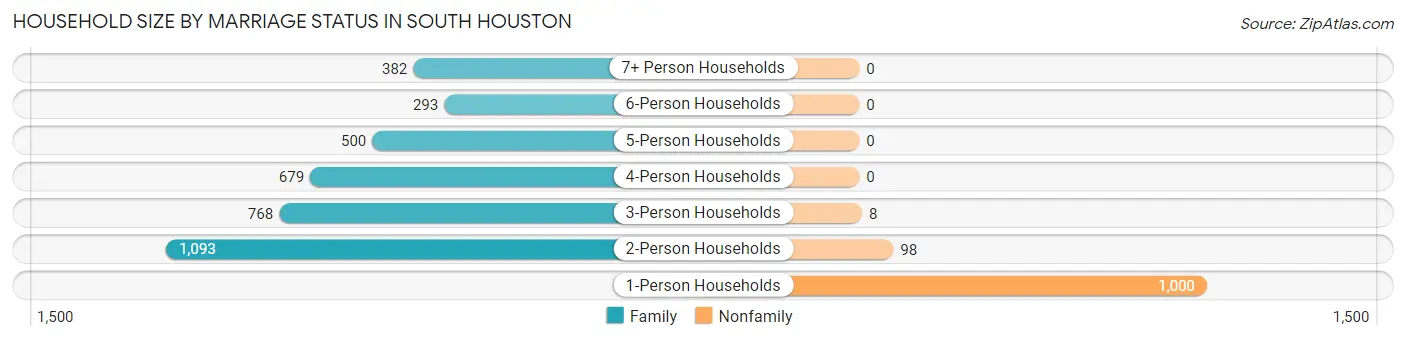
| Household Size | Family Households | Nonfamily Households |
| 1-Person Households | - | 1,000 (20.7%) |
| 2-Person Households | 1,093 (22.7%) | 98 (2.0%) |
| 3-Person Households | 768 (15.9%) | 8 (0.2%) |
| 4-Person Households | 679 (14.1%) | 0 (0.0%) |
| 5-Person Households | 500 (10.4%) | 0 (0.0%) |
| 6-Person Households | 293 (6.1%) | 0 (0.0%) |
| 7+ Person Households | 382 (7.9%) | 0 (0.0%) |
| Total | 3,715 (77.1%) | 1,106 (22.9%) |
Female Fertility in South Houston
Fertility by Age in South Houston
Average fertility rate in South Houston is 55.0 births per 1,000 women. Women in the age bracket of 20 to 34 years have the highest fertility rate with 74.0 births per 1,000 women. Women in the age bracket of 20 to 34 years acount for 53.6% of all women with births.
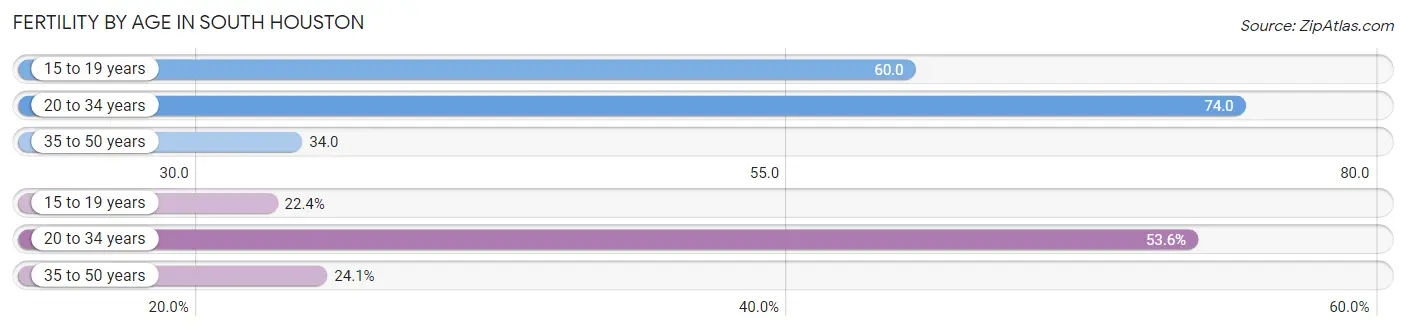
| Age Bracket | Women with Births | Births / 1,000 Women |
| 15 to 19 years | 53 (22.4%) | 60.0 |
| 20 to 34 years | 127 (53.6%) | 74.0 |
| 35 to 50 years | 57 (24.0%) | 34.0 |
| Total | 237 (100.0%) | 55.0 |
Fertility by Age by Marriage Status in South Houston
46.8% of women with births (237) in South Houston are married. The highest percentage of unmarried women with births falls into 15 to 19 years age bracket with 100.0% of them unmarried at the time of birth, while the lowest percentage of unmarried women with births belong to 35 to 50 years age bracket with 0.0% of them unmarried.
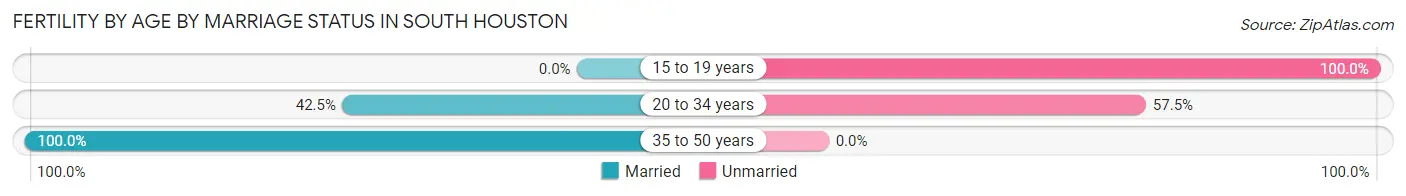
| Age Bracket | Married | Unmarried |
| 15 to 19 years | 0 (0.0%) | 53 (100.0%) |
| 20 to 34 years | 54 (42.5%) | 73 (57.5%) |
| 35 to 50 years | 57 (100.0%) | 0 (0.0%) |
| Total | 111 (46.8%) | 126 (53.2%) |
Fertility by Education in South Houston
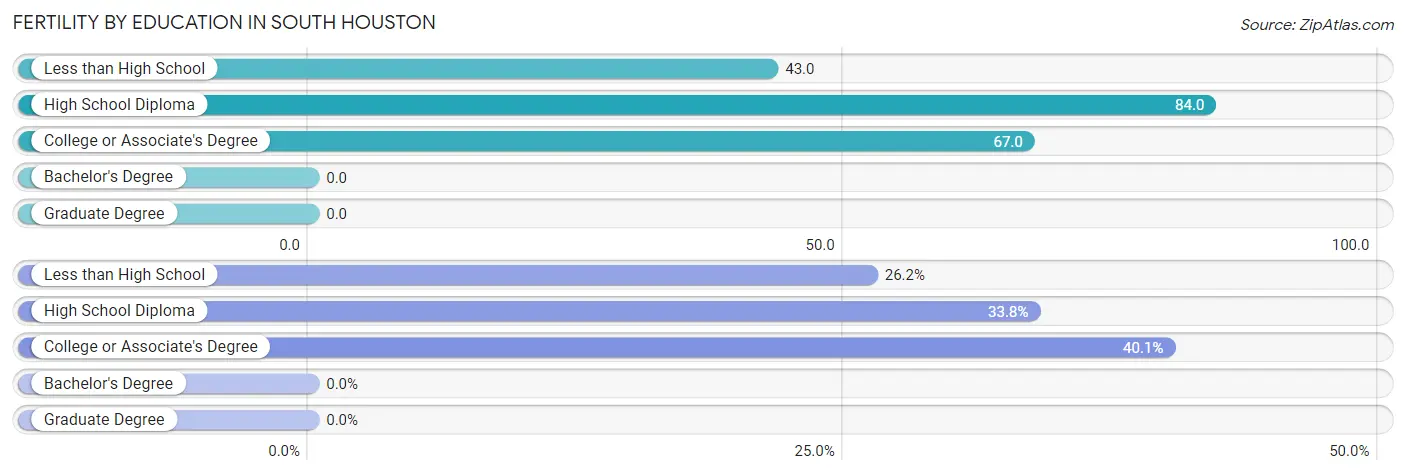
| Educational Attainment | Women with Births | Births / 1,000 Women |
| Less than High School | 62 (26.2%) | 43.0 |
| High School Diploma | 80 (33.8%) | 84.0 |
| College or Associate's Degree | 95 (40.1%) | 67.0 |
| Bachelor's Degree | 0 (0.0%) | 0.0 |
| Graduate Degree | 0 (0.0%) | 0.0 |
| Total | 237 (100.0%) | 55.0 |
Fertility by Education by Marriage Status in South Houston
53.2% of women with births in South Houston are unmarried. Women with the educational attainment of high school diploma are most likely to be married with 83.8% of them married at childbirth, while women with the educational attainment of less than high school are least likely to be married with 87.1% of them unmarried at childbirth.
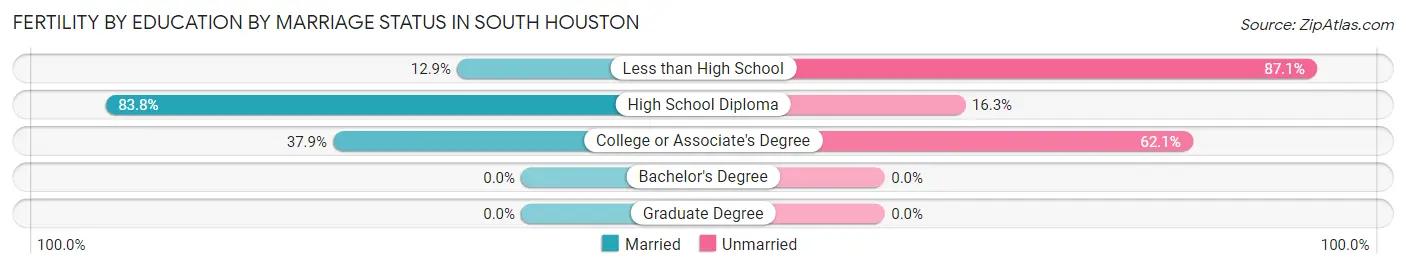
| Educational Attainment | Married | Unmarried |
| Less than High School | 8 (12.9%) | 54 (87.1%) |
| High School Diploma | 67 (83.8%) | 13 (16.3%) |
| College or Associate's Degree | 36 (37.9%) | 59 (62.1%) |
| Bachelor's Degree | 0 (0.0%) | 0 (0.0%) |
| Graduate Degree | 0 (0.0%) | 0 (0.0%) |
| Total | 111 (46.8%) | 126 (53.2%) |
Employment Characteristics in South Houston
Employment by Class of Employer in South Houston
Among the 6,789 employed individuals in South Houston, private company employees (5,365 | 79.0%), self-employed (not incorporated) (578 | 8.5%), and local government employees (374 | 5.5%) make up the most common classes of employment.
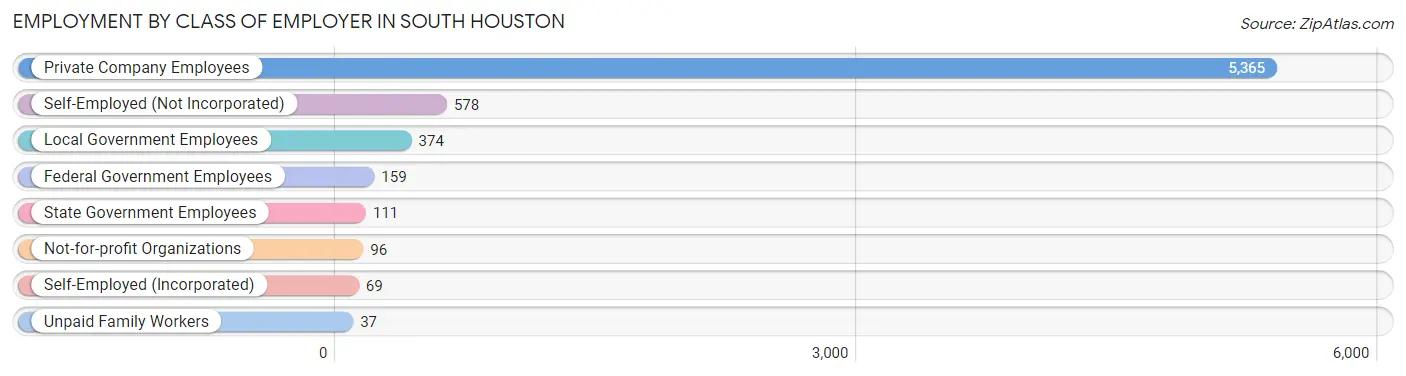
| Employer Class | # Employees | % Employees |
| Private Company Employees | 5,365 | 79.0% |
| Self-Employed (Incorporated) | 69 | 1.0% |
| Self-Employed (Not Incorporated) | 578 | 8.5% |
| Not-for-profit Organizations | 96 | 1.4% |
| Local Government Employees | 374 | 5.5% |
| State Government Employees | 111 | 1.6% |
| Federal Government Employees | 159 | 2.3% |
| Unpaid Family Workers | 37 | 0.5% |
| Total | 6,789 | 100.0% |
Employment Status by Age in South Houston
According to the labor force statistics for South Houston, out of the total population over 16 years of age (11,820), 64.6% or 7,636 individuals are in the labor force, with 9.2% or 703 of them unemployed. The age group with the highest labor force participation rate is 35 to 44 years, with 82.0% or 1,793 individuals in the labor force. Within the labor force, the 16 to 19 years age range has the highest percentage of unemployed individuals, with 37.6% or 279 of them being unemployed.
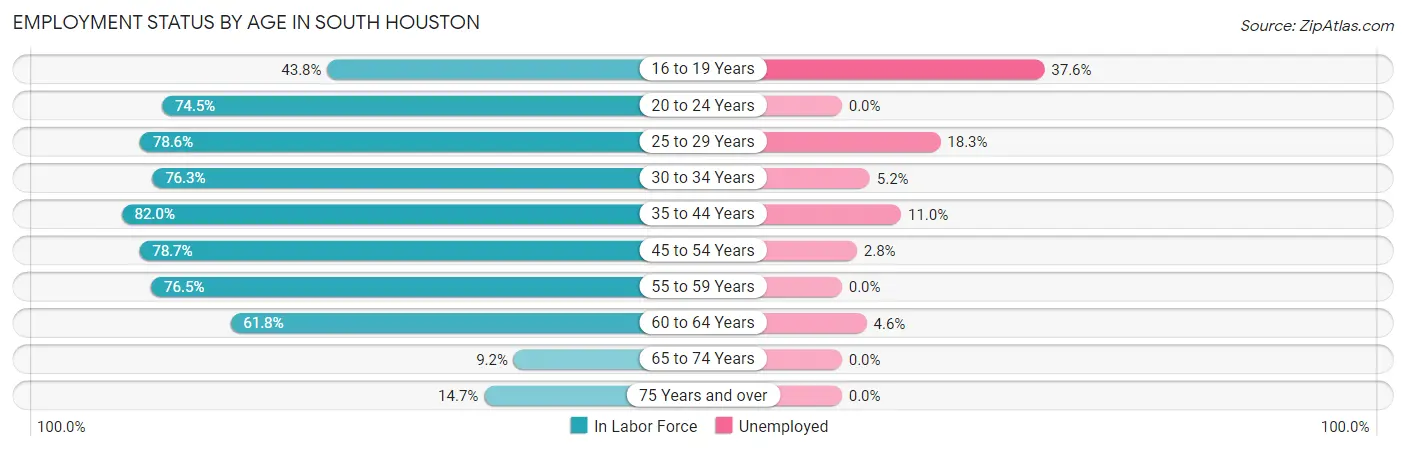
| Age Bracket | In Labor Force | Unemployed |
| 16 to 19 Years | 742 (43.8%) | 279 (37.6%) |
| 20 to 24 Years | 1,042 (74.5%) | 0 (0.0%) |
| 25 to 29 Years | 679 (78.6%) | 124 (18.3%) |
| 30 to 34 Years | 714 (76.3%) | 37 (5.2%) |
| 35 to 44 Years | 1,793 (82.0%) | 197 (11.0%) |
| 45 to 54 Years | 1,506 (78.7%) | 42 (2.8%) |
| 55 to 59 Years | 449 (76.5%) | 0 (0.0%) |
| 60 to 64 Years | 566 (61.8%) | 26 (4.6%) |
| 65 to 74 Years | 77 (9.2%) | 0 (0.0%) |
| 75 Years and over | 71 (14.7%) | 0 (0.0%) |
| Total | 7,636 (64.6%) | 703 (9.2%) |
Employment Status by Educational Attainment in South Houston
According to labor force statistics for South Houston, 77.1% of individuals (5,708) out of the total population between 25 and 64 years of age (7,403) are in the labor force, with 7.5% or 428 of them being unemployed. The group with the highest labor force participation rate are those with the educational attainment of bachelor's degree or higher, with 88.3% or 620 individuals in the labor force. Within the labor force, individuals with college / associate degree education have the highest percentage of unemployment, with 13.1% or 159 of them being unemployed.
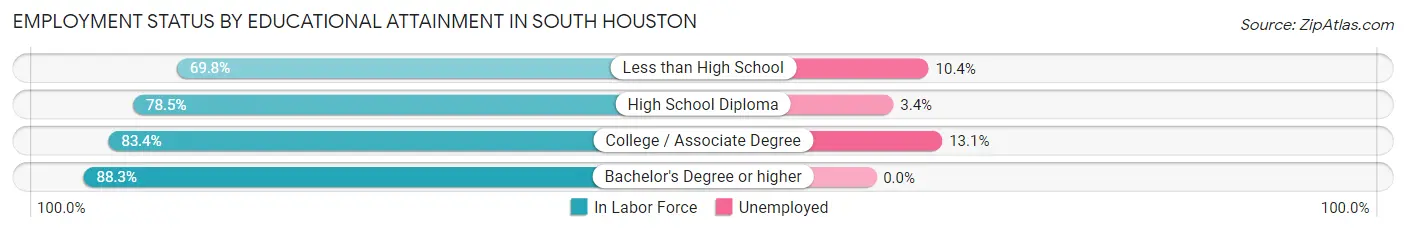
| Educational Attainment | In Labor Force | Unemployed |
| Less than High School | 1,949 (69.8%) | 290 (10.4%) |
| High School Diploma | 1,925 (78.5%) | 83 (3.4%) |
| College / Associate Degree | 1,215 (83.4%) | 191 (13.1%) |
| Bachelor's Degree or higher | 620 (88.3%) | 0 (0.0%) |
| Total | 5,708 (77.1%) | 555 (7.5%) |
Employment Occupations by Sex in South Houston
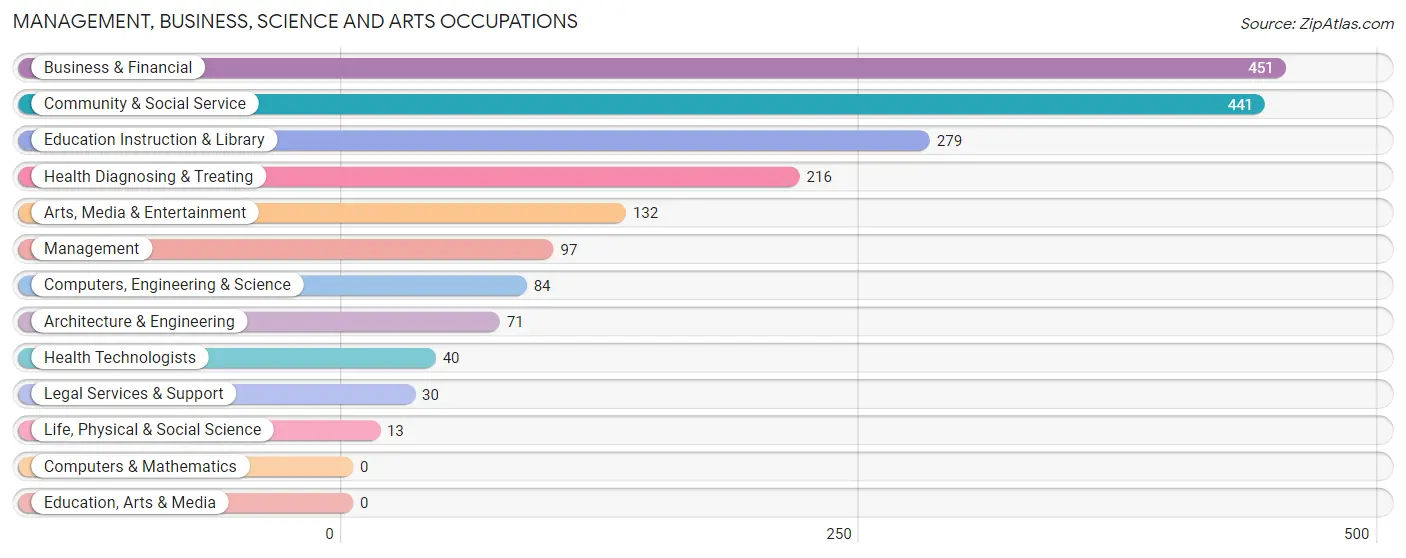
Management, Business, Science and Arts Occupations
The most common Management, Business, Science and Arts occupations in South Houston are Business & Financial (451 | 6.5%), Community & Social Service (441 | 6.4%), Education Instruction & Library (279 | 4.0%), Health Diagnosing & Treating (216 | 3.1%), and Arts, Media & Entertainment (132 | 1.9%).
Management, Business, Science and Arts Occupations by Sex
Within the Management, Business, Science and Arts occupations in South Houston, the most male-oriented occupations are Arts, Media & Entertainment (91.7%), Life, Physical & Social Science (76.9%), and Management (56.7%), while the most female-oriented occupations are Legal Services & Support (100.0%), Health Technologists (100.0%), and Business & Financial (85.6%).
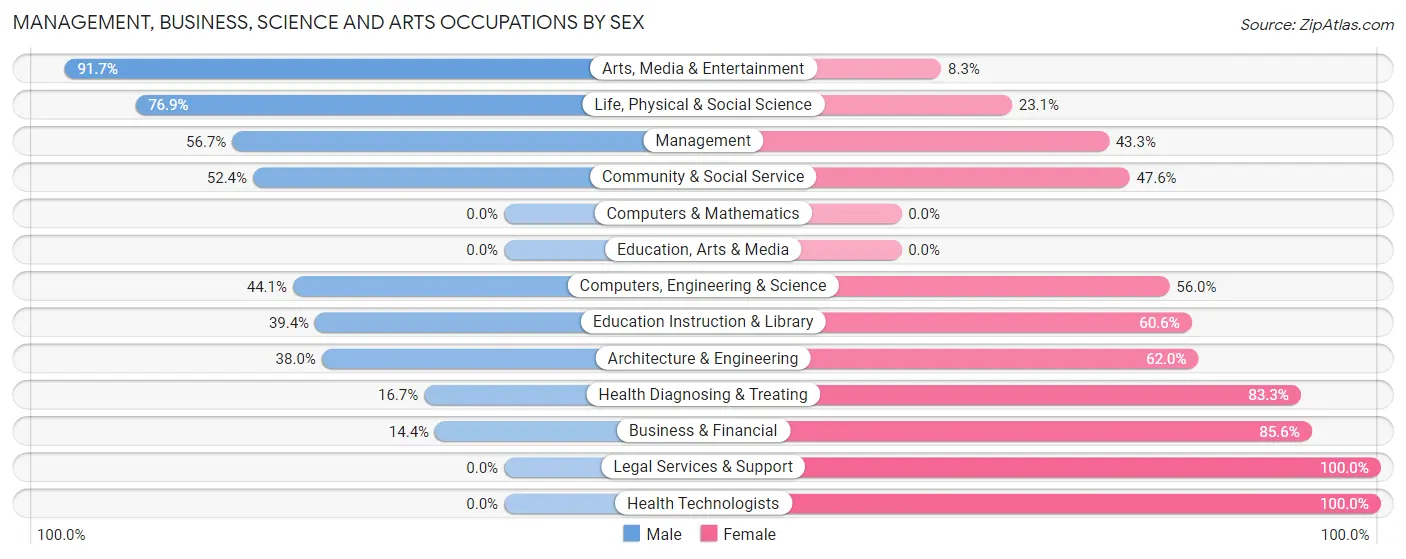
| Occupation | Male | Female |
| Management | 55 (56.7%) | 42 (43.3%) |
| Business & Financial | 65 (14.4%) | 386 (85.6%) |
| Computers, Engineering & Science | 37 (44.1%) | 47 (55.9%) |
| Computers & Mathematics | 0 (0.0%) | 0 (0.0%) |
| Architecture & Engineering | 27 (38.0%) | 44 (62.0%) |
| Life, Physical & Social Science | 10 (76.9%) | 3 (23.1%) |
| Community & Social Service | 231 (52.4%) | 210 (47.6%) |
| Education, Arts & Media | 0 (0.0%) | 0 (0.0%) |
| Legal Services & Support | 0 (0.0%) | 30 (100.0%) |
| Education Instruction & Library | 110 (39.4%) | 169 (60.6%) |
| Arts, Media & Entertainment | 121 (91.7%) | 11 (8.3%) |
| Health Diagnosing & Treating | 36 (16.7%) | 180 (83.3%) |
| Health Technologists | 0 (0.0%) | 40 (100.0%) |
| Total (Category) | 424 (32.9%) | 865 (67.1%) |
| Total (Overall) | 3,775 (54.4%) | 3,160 (45.6%) |
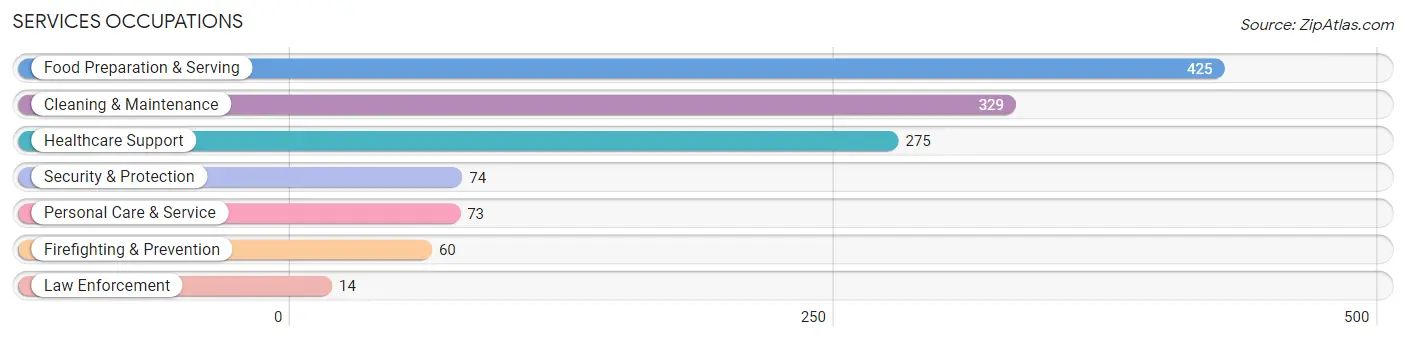
Services Occupations
The most common Services occupations in South Houston are Food Preparation & Serving (425 | 6.1%), Cleaning & Maintenance (329 | 4.7%), Healthcare Support (275 | 4.0%), Security & Protection (74 | 1.1%), and Personal Care & Service (73 | 1.1%).
Services Occupations by Sex
Within the Services occupations in South Houston, the most male-oriented occupations are Cleaning & Maintenance (52.0%), Food Preparation & Serving (26.8%), and Firefighting & Prevention (26.7%), while the most female-oriented occupations are Healthcare Support (100.0%), Law Enforcement (100.0%), and Personal Care & Service (100.0%).
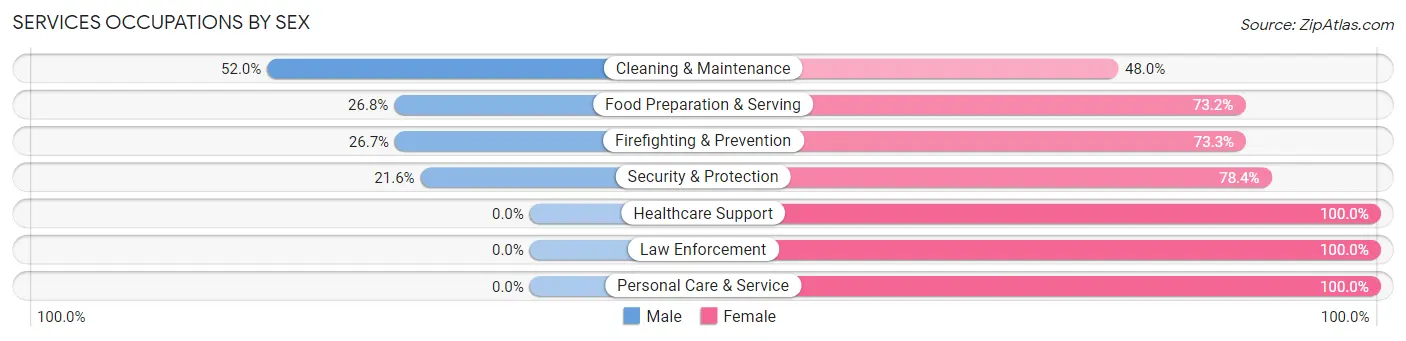
| Occupation | Male | Female |
| Healthcare Support | 0 (0.0%) | 275 (100.0%) |
| Security & Protection | 16 (21.6%) | 58 (78.4%) |
| Firefighting & Prevention | 16 (26.7%) | 44 (73.3%) |
| Law Enforcement | 0 (0.0%) | 14 (100.0%) |
| Food Preparation & Serving | 114 (26.8%) | 311 (73.2%) |
| Cleaning & Maintenance | 171 (52.0%) | 158 (48.0%) |
| Personal Care & Service | 0 (0.0%) | 73 (100.0%) |
| Total (Category) | 301 (25.6%) | 875 (74.4%) |
| Total (Overall) | 3,775 (54.4%) | 3,160 (45.6%) |
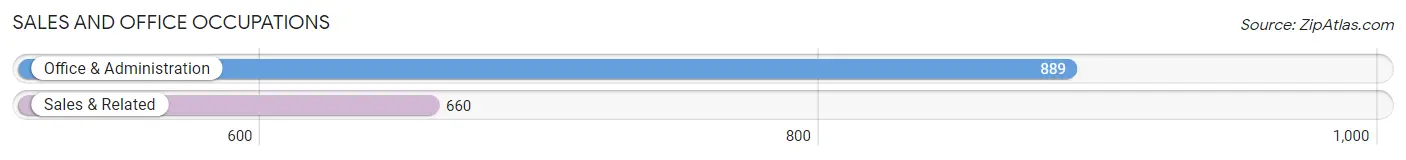
Sales and Office Occupations
The most common Sales and Office occupations in South Houston are Office & Administration (889 | 12.8%), and Sales & Related (660 | 9.5%).
Sales and Office Occupations by Sex
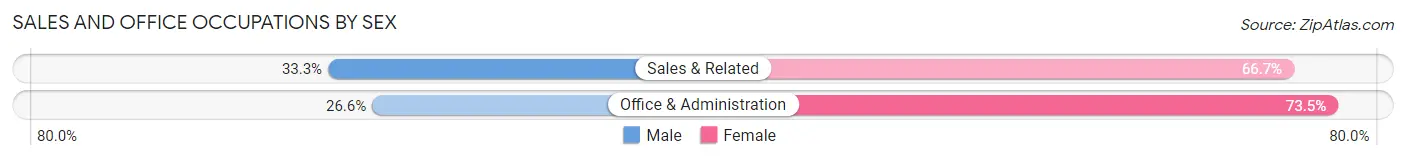
| Occupation | Male | Female |
| Sales & Related | 220 (33.3%) | 440 (66.7%) |
| Office & Administration | 236 (26.6%) | 653 (73.5%) |
| Total (Category) | 456 (29.4%) | 1,093 (70.6%) |
| Total (Overall) | 3,775 (54.4%) | 3,160 (45.6%) |
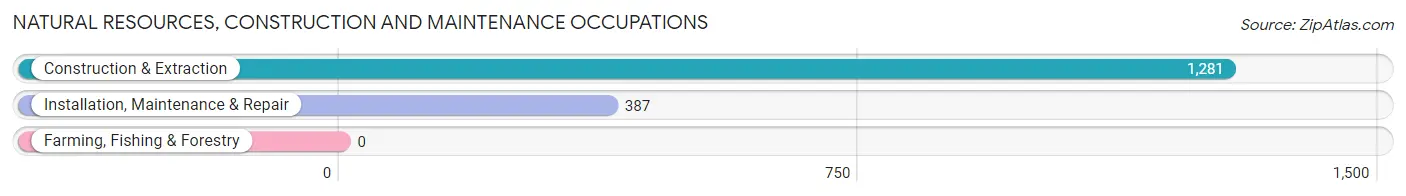
Natural Resources, Construction and Maintenance Occupations
The most common Natural Resources, Construction and Maintenance occupations in South Houston are Construction & Extraction (1,281 | 18.5%), and Installation, Maintenance & Repair (387 | 5.6%).
Natural Resources, Construction and Maintenance Occupations by Sex
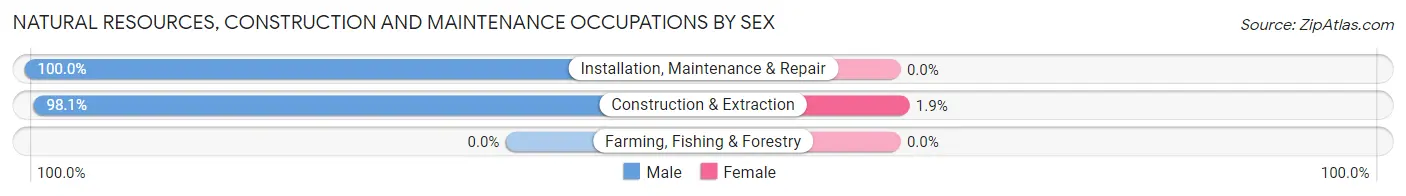
| Occupation | Male | Female |
| Farming, Fishing & Forestry | 0 (0.0%) | 0 (0.0%) |
| Construction & Extraction | 1,257 (98.1%) | 24 (1.9%) |
| Installation, Maintenance & Repair | 387 (100.0%) | 0 (0.0%) |
| Total (Category) | 1,644 (98.6%) | 24 (1.4%) |
| Total (Overall) | 3,775 (54.4%) | 3,160 (45.6%) |
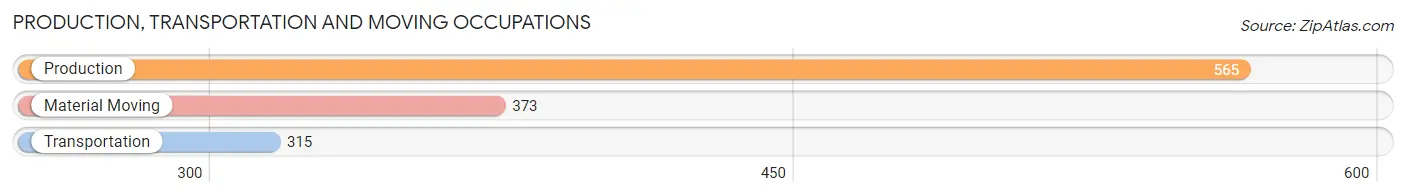
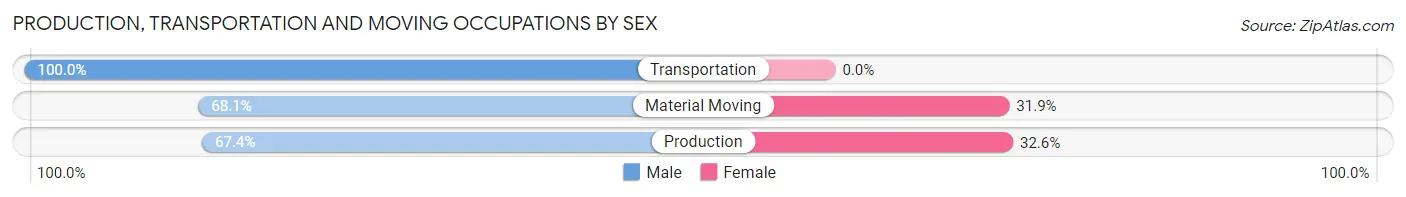
Production, Transportation and Moving Occupations
The most common Production, Transportation and Moving occupations in South Houston are Production (565 | 8.2%), Material Moving (373 | 5.4%), and Transportation (315 | 4.5%).
Production, Transportation and Moving Occupations by Sex
| Occupation | Male | Female |
| Production | 381 (67.4%) | 184 (32.6%) |
| Transportation | 315 (100.0%) | 0 (0.0%) |
| Material Moving | 254 (68.1%) | 119 (31.9%) |
| Total (Category) | 950 (75.8%) | 303 (24.2%) |
| Total (Overall) | 3,775 (54.4%) | 3,160 (45.6%) |
Employment Industries by Sex in South Houston
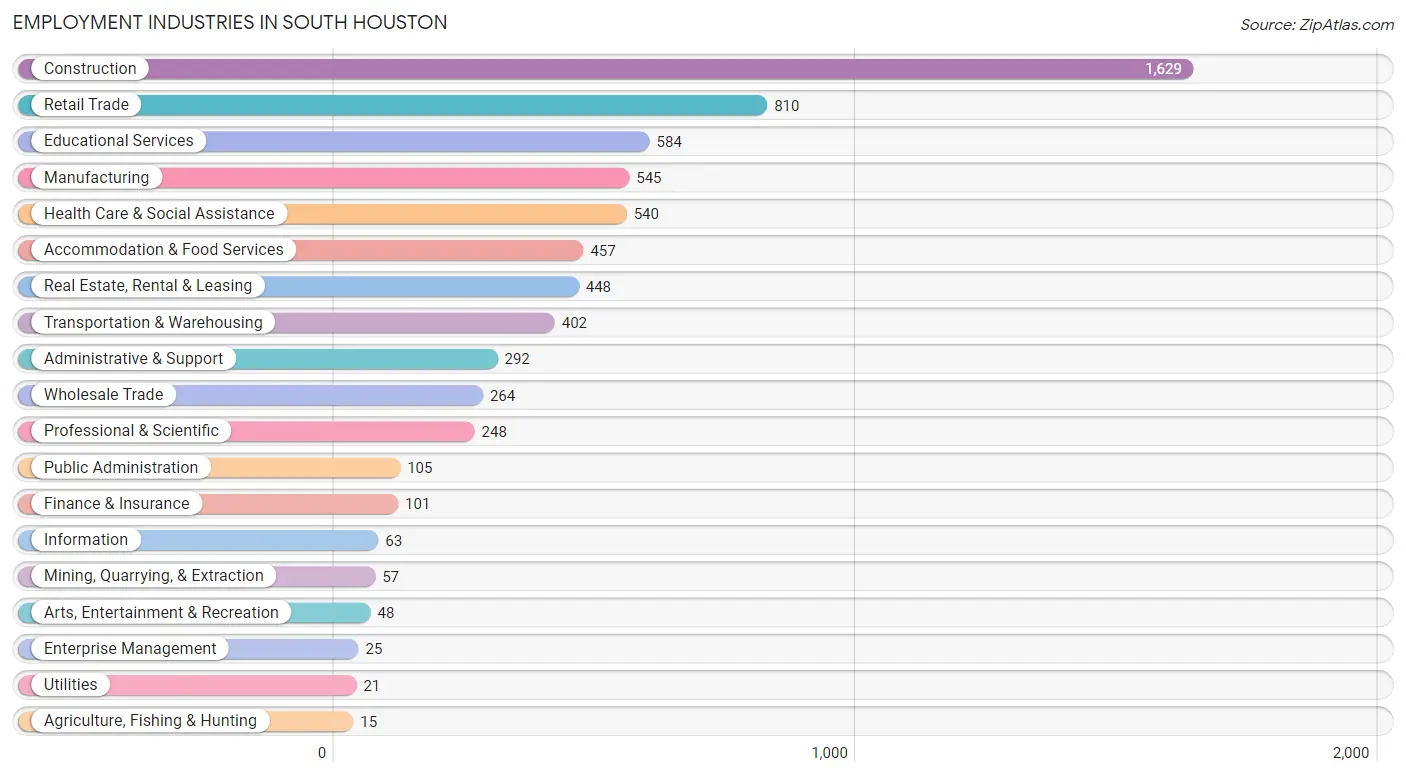
Employment Industries in South Houston
The major employment industries in South Houston include Construction (1,629 | 23.5%), Retail Trade (810 | 11.7%), Educational Services (584 | 8.4%), Manufacturing (545 | 7.9%), and Health Care & Social Assistance (540 | 7.8%).
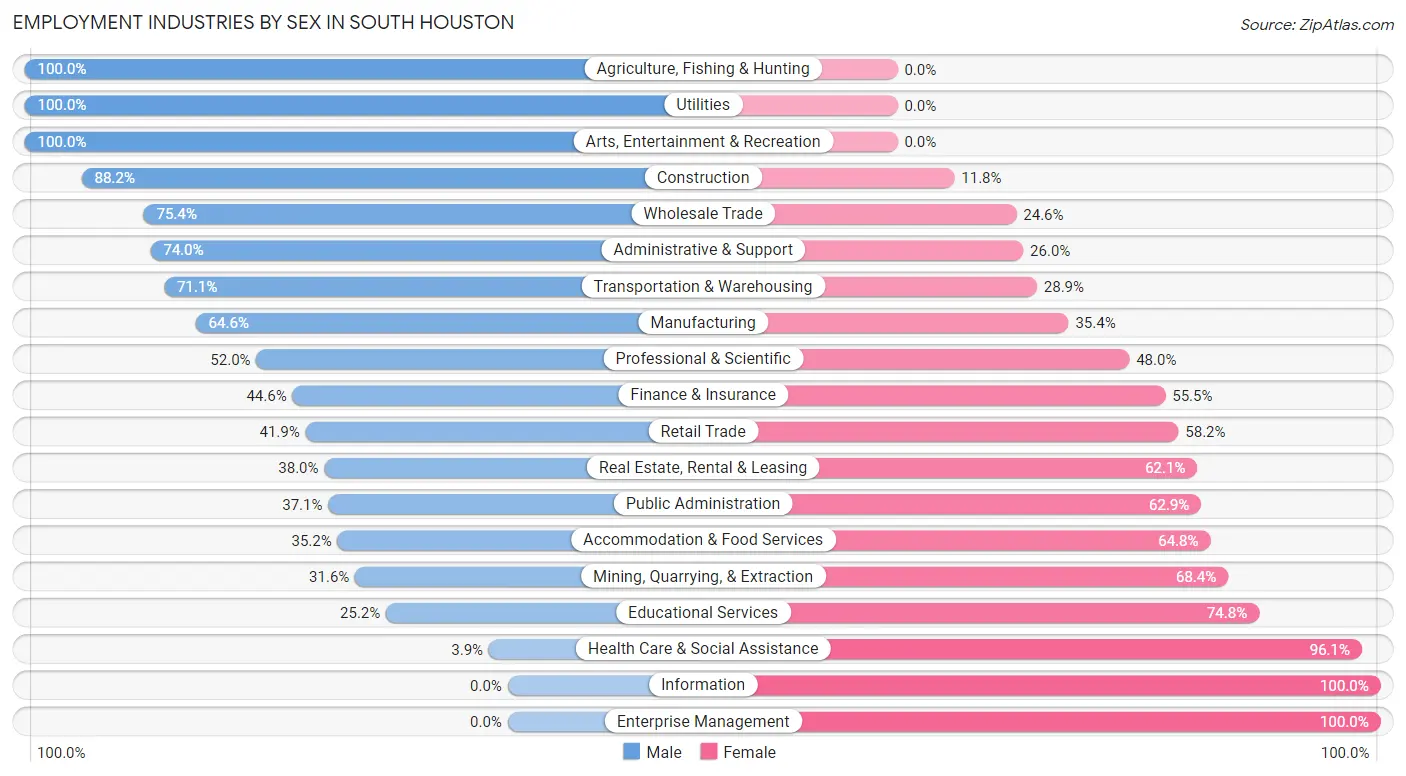
Employment Industries by Sex in South Houston
The South Houston industries that see more men than women are Agriculture, Fishing & Hunting (100.0%), Utilities (100.0%), and Arts, Entertainment & Recreation (100.0%), whereas the industries that tend to have a higher number of women are Information (100.0%), Enterprise Management (100.0%), and Health Care & Social Assistance (96.1%).
| Industry | Male | Female |
| Agriculture, Fishing & Hunting | 15 (100.0%) | 0 (0.0%) |
| Mining, Quarrying, & Extraction | 18 (31.6%) | 39 (68.4%) |
| Construction | 1,437 (88.2%) | 192 (11.8%) |
| Manufacturing | 352 (64.6%) | 193 (35.4%) |
| Wholesale Trade | 199 (75.4%) | 65 (24.6%) |
| Retail Trade | 339 (41.8%) | 471 (58.2%) |
| Transportation & Warehousing | 286 (71.1%) | 116 (28.9%) |
| Utilities | 21 (100.0%) | 0 (0.0%) |
| Information | 0 (0.0%) | 63 (100.0%) |
| Finance & Insurance | 45 (44.6%) | 56 (55.4%) |
| Real Estate, Rental & Leasing | 170 (38.0%) | 278 (62.1%) |
| Professional & Scientific | 129 (52.0%) | 119 (48.0%) |
| Enterprise Management | 0 (0.0%) | 25 (100.0%) |
| Administrative & Support | 216 (74.0%) | 76 (26.0%) |
| Educational Services | 147 (25.2%) | 437 (74.8%) |
| Health Care & Social Assistance | 21 (3.9%) | 519 (96.1%) |
| Arts, Entertainment & Recreation | 48 (100.0%) | 0 (0.0%) |
| Accommodation & Food Services | 161 (35.2%) | 296 (64.8%) |
| Public Administration | 39 (37.1%) | 66 (62.9%) |
| Total | 3,775 (54.4%) | 3,160 (45.6%) |
Education in South Houston
School Enrollment in South Houston
The most common levels of schooling among the 5,380 students in South Houston are high school (1,532 | 28.5%), elementary school (1,224 | 22.8%), and middle school (1,220 | 22.7%).
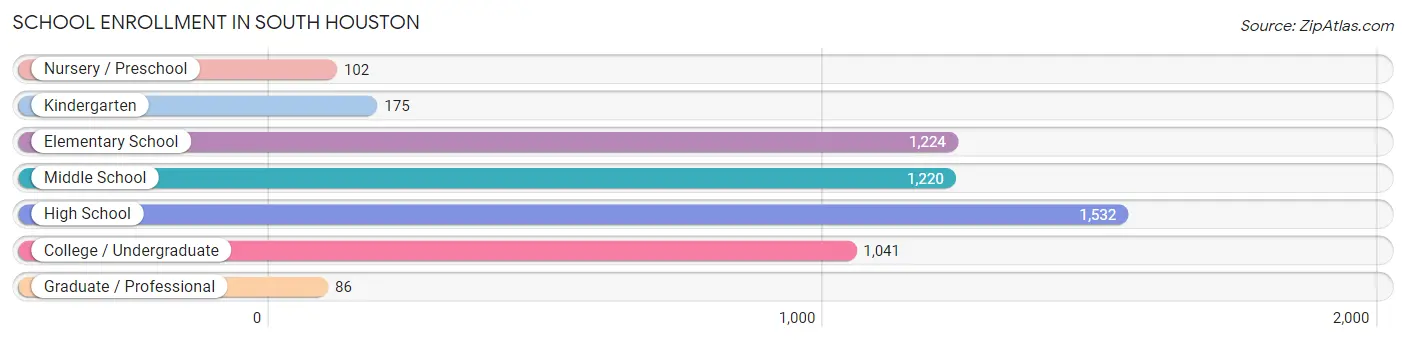
| School Level | # Students | % Students |
| Nursery / Preschool | 102 | 1.9% |
| Kindergarten | 175 | 3.3% |
| Elementary School | 1,224 | 22.8% |
| Middle School | 1,220 | 22.7% |
| High School | 1,532 | 28.5% |
| College / Undergraduate | 1,041 | 19.4% |
| Graduate / Professional | 86 | 1.6% |
| Total | 5,380 | 100.0% |
School Enrollment by Age by Funding Source in South Houston
Out of a total of 5,380 students who are enrolled in schools in South Houston, 441 (8.2%) attend a private institution, while the remaining 4,939 (91.8%) are enrolled in public schools. The age group of 15 to 17 year olds has the highest likelihood of being enrolled in private schools, with 151 (12.5% in the age bracket) enrolled. Conversely, the age group of 3 to 4 year olds has the lowest likelihood of being enrolled in a private school, with 87 (100.0% in the age bracket) attending a public institution.
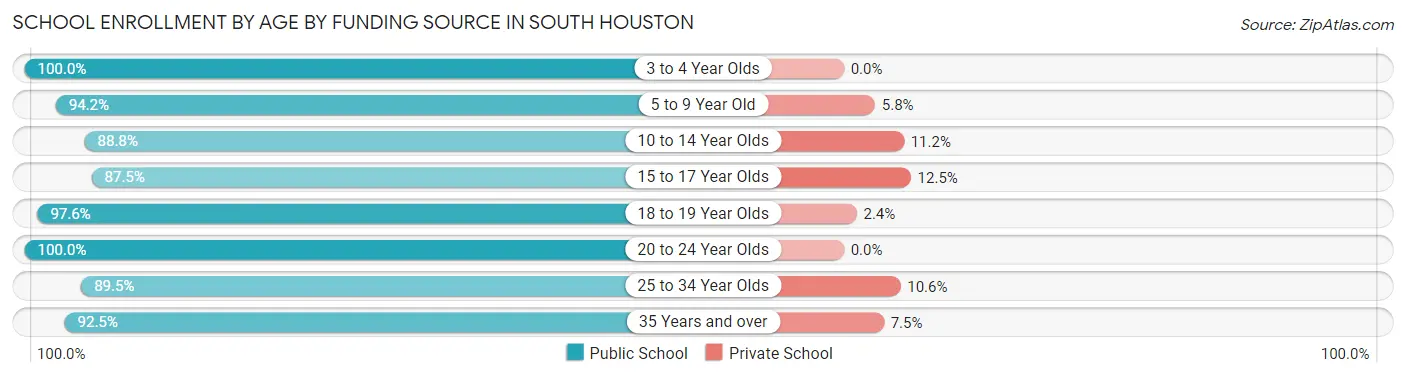
| Age Bracket | Public School | Private School |
| 3 to 4 Year Olds | 87 (100.0%) | 0 (0.0%) |
| 5 to 9 Year Old | 1,054 (94.2%) | 65 (5.8%) |
| 10 to 14 Year Olds | 1,445 (88.8%) | 182 (11.2%) |
| 15 to 17 Year Olds | 1,059 (87.5%) | 151 (12.5%) |
| 18 to 19 Year Olds | 448 (97.6%) | 11 (2.4%) |
| 20 to 24 Year Olds | 526 (100.0%) | 0 (0.0%) |
| 25 to 34 Year Olds | 195 (89.4%) | 23 (10.5%) |
| 35 Years and over | 124 (92.5%) | 10 (7.5%) |
| Total | 4,939 (91.8%) | 441 (8.2%) |
Educational Attainment by Field of Study in South Houston
Business (265 | 32.5%), education (155 | 19.0%), engineering (99 | 12.1%), arts & humanities (75 | 9.2%), and visual & performing arts (64 | 7.9%) are the most common fields of study among 815 individuals in South Houston who have obtained a bachelor's degree or higher.
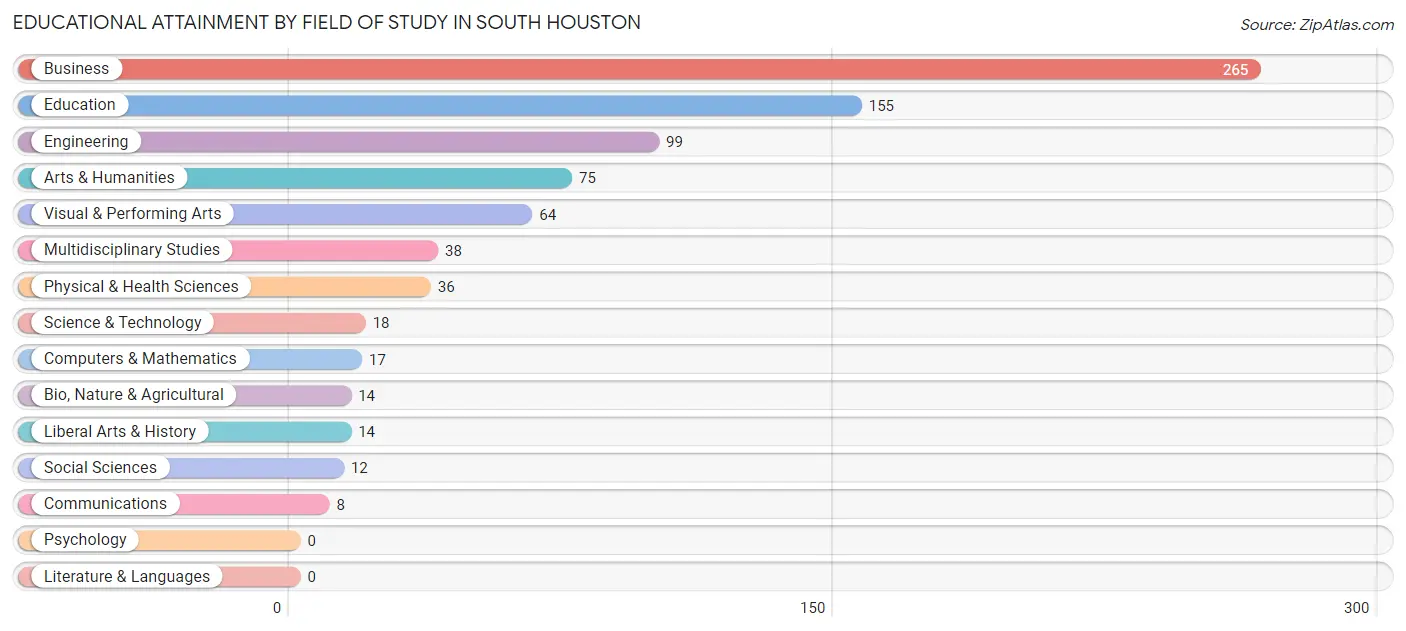
| Field of Study | # Graduates | % Graduates |
| Computers & Mathematics | 17 | 2.1% |
| Bio, Nature & Agricultural | 14 | 1.7% |
| Physical & Health Sciences | 36 | 4.4% |
| Psychology | 0 | 0.0% |
| Social Sciences | 12 | 1.5% |
| Engineering | 99 | 12.1% |
| Multidisciplinary Studies | 38 | 4.7% |
| Science & Technology | 18 | 2.2% |
| Business | 265 | 32.5% |
| Education | 155 | 19.0% |
| Literature & Languages | 0 | 0.0% |
| Liberal Arts & History | 14 | 1.7% |
| Visual & Performing Arts | 64 | 7.9% |
| Communications | 8 | 1.0% |
| Arts & Humanities | 75 | 9.2% |
| Total | 815 | 100.0% |
Transportation & Commute in South Houston
Vehicle Availability by Sex in South Houston
The most prevalent vehicle ownership categories in South Houston are males with 2 vehicles (1,083, accounting for 29.2%) and females with 2 vehicles (1,006, making up 35.2%).
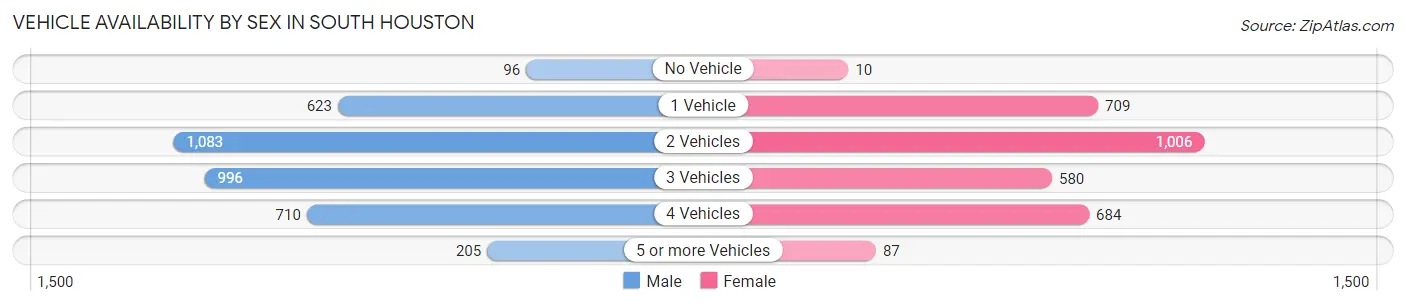
| Vehicles Available | Male | Female |
| No Vehicle | 96 (2.6%) | 10 (0.3%) |
| 1 Vehicle | 623 (16.8%) | 709 (23.1%) |
| 2 Vehicles | 1,083 (29.2%) | 1,006 (32.7%) |
| 3 Vehicles | 996 (26.8%) | 580 (18.9%) |
| 4 Vehicles | 710 (19.1%) | 684 (22.2%) |
| 5 or more Vehicles | 205 (5.5%) | 87 (2.8%) |
| Total | 3,713 (100.0%) | 3,076 (100.0%) |
Commute Time in South Houston
The most frequently occuring commute durations in South Houston are 30 to 34 minutes (994 commuters, 15.1%), 20 to 24 minutes (847 commuters, 12.8%), and 5 to 9 minutes (814 commuters, 12.3%).
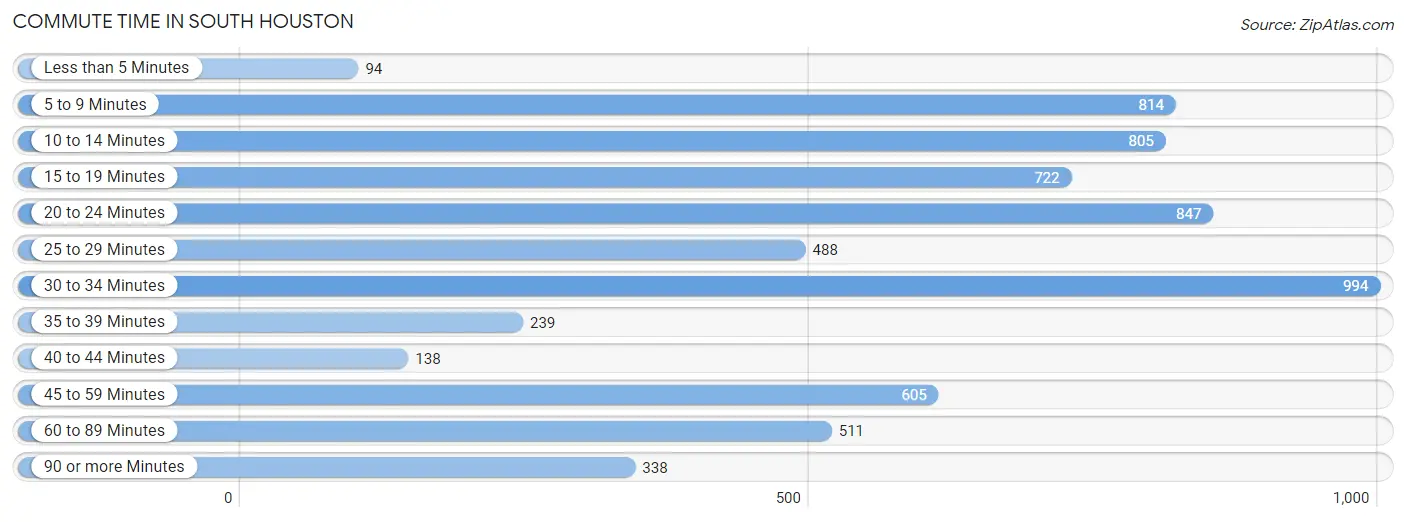
| Commute Time | # Commuters | % Commuters |
| Less than 5 Minutes | 94 | 1.4% |
| 5 to 9 Minutes | 814 | 12.3% |
| 10 to 14 Minutes | 805 | 12.2% |
| 15 to 19 Minutes | 722 | 11.0% |
| 20 to 24 Minutes | 847 | 12.8% |
| 25 to 29 Minutes | 488 | 7.4% |
| 30 to 34 Minutes | 994 | 15.1% |
| 35 to 39 Minutes | 239 | 3.6% |
| 40 to 44 Minutes | 138 | 2.1% |
| 45 to 59 Minutes | 605 | 9.2% |
| 60 to 89 Minutes | 511 | 7.7% |
| 90 or more Minutes | 338 | 5.1% |
Commute Time by Sex in South Houston
The most common commute times in South Houston are 30 to 34 minutes (575 commuters, 16.3%) for males and 15 to 19 minutes (544 commuters, 17.7%) for females.
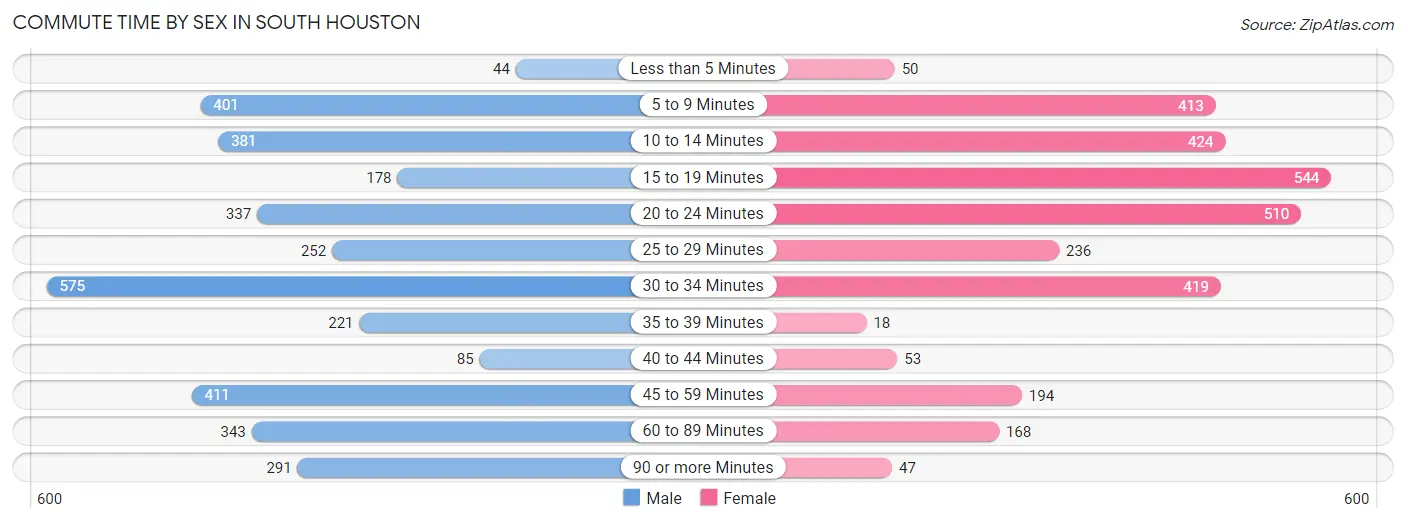
| Commute Time | Male | Female |
| Less than 5 Minutes | 44 (1.3%) | 50 (1.6%) |
| 5 to 9 Minutes | 401 (11.4%) | 413 (13.4%) |
| 10 to 14 Minutes | 381 (10.8%) | 424 (13.8%) |
| 15 to 19 Minutes | 178 (5.1%) | 544 (17.7%) |
| 20 to 24 Minutes | 337 (9.6%) | 510 (16.6%) |
| 25 to 29 Minutes | 252 (7.2%) | 236 (7.7%) |
| 30 to 34 Minutes | 575 (16.3%) | 419 (13.6%) |
| 35 to 39 Minutes | 221 (6.3%) | 18 (0.6%) |
| 40 to 44 Minutes | 85 (2.4%) | 53 (1.7%) |
| 45 to 59 Minutes | 411 (11.7%) | 194 (6.3%) |
| 60 to 89 Minutes | 343 (9.8%) | 168 (5.5%) |
| 90 or more Minutes | 291 (8.3%) | 47 (1.5%) |
Time of Departure to Work by Sex in South Houston
The most frequent times of departure to work in South Houston are 12:00 AM to 4:59 AM (680, 19.3%) for males and 7:00 AM to 7:29 AM (570, 18.5%) for females.
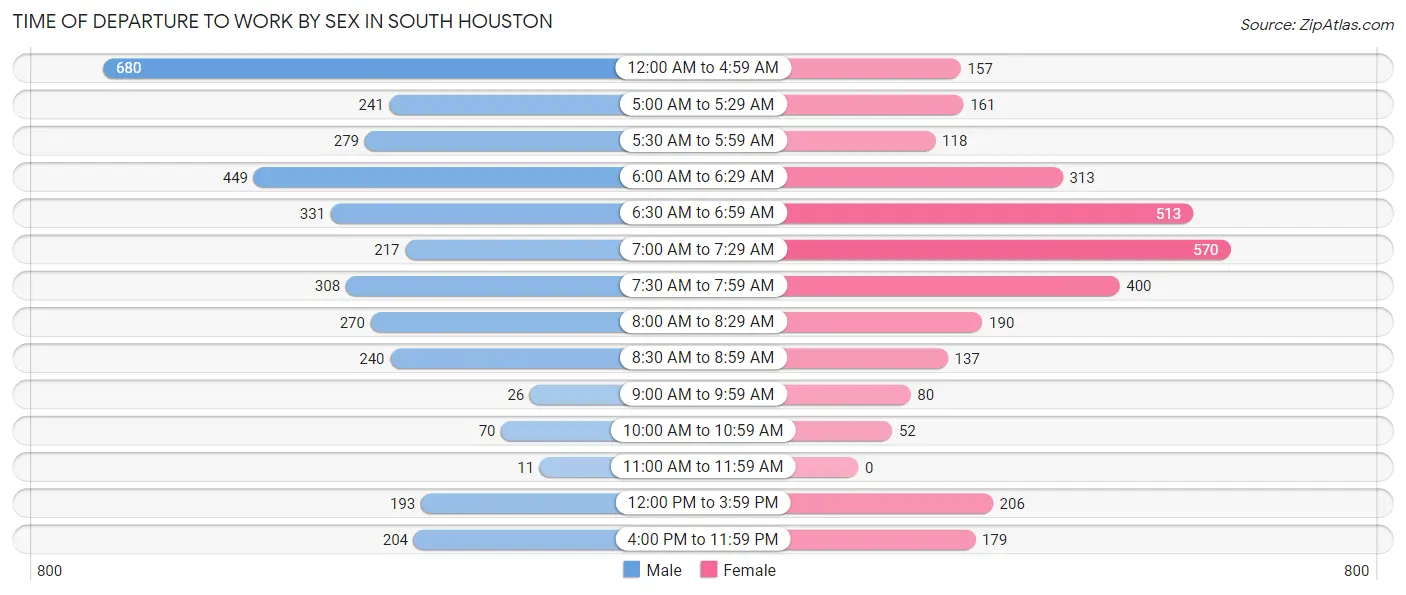
| Time of Departure | Male | Female |
| 12:00 AM to 4:59 AM | 680 (19.3%) | 157 (5.1%) |
| 5:00 AM to 5:29 AM | 241 (6.9%) | 161 (5.2%) |
| 5:30 AM to 5:59 AM | 279 (7.9%) | 118 (3.8%) |
| 6:00 AM to 6:29 AM | 449 (12.8%) | 313 (10.2%) |
| 6:30 AM to 6:59 AM | 331 (9.4%) | 513 (16.7%) |
| 7:00 AM to 7:29 AM | 217 (6.2%) | 570 (18.5%) |
| 7:30 AM to 7:59 AM | 308 (8.7%) | 400 (13.0%) |
| 8:00 AM to 8:29 AM | 270 (7.7%) | 190 (6.2%) |
| 8:30 AM to 8:59 AM | 240 (6.8%) | 137 (4.4%) |
| 9:00 AM to 9:59 AM | 26 (0.7%) | 80 (2.6%) |
| 10:00 AM to 10:59 AM | 70 (2.0%) | 52 (1.7%) |
| 11:00 AM to 11:59 AM | 11 (0.3%) | 0 (0.0%) |
| 12:00 PM to 3:59 PM | 193 (5.5%) | 206 (6.7%) |
| 4:00 PM to 11:59 PM | 204 (5.8%) | 179 (5.8%) |
| Total | 3,519 (100.0%) | 3,076 (100.0%) |
Housing Occupancy in South Houston
Occupancy by Ownership in South Houston
Of the total 4,821 dwellings in South Houston, owner-occupied units account for 2,500 (51.9%), while renter-occupied units make up 2,321 (48.1%).
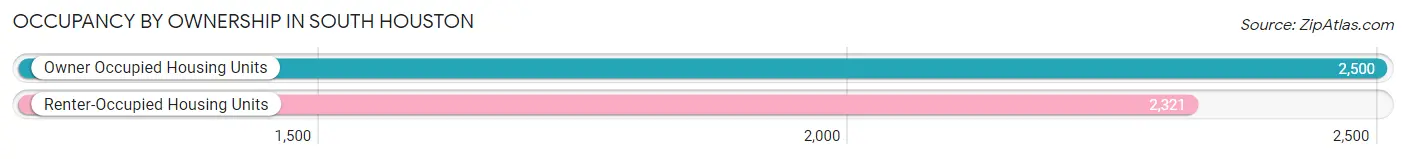
| Occupancy | # Housing Units | % Housing Units |
| Owner Occupied Housing Units | 2,500 | 51.9% |
| Renter-Occupied Housing Units | 2,321 | 48.1% |
| Total Occupied Housing Units | 4,821 | 100.0% |
Occupancy by Household Size in South Houston
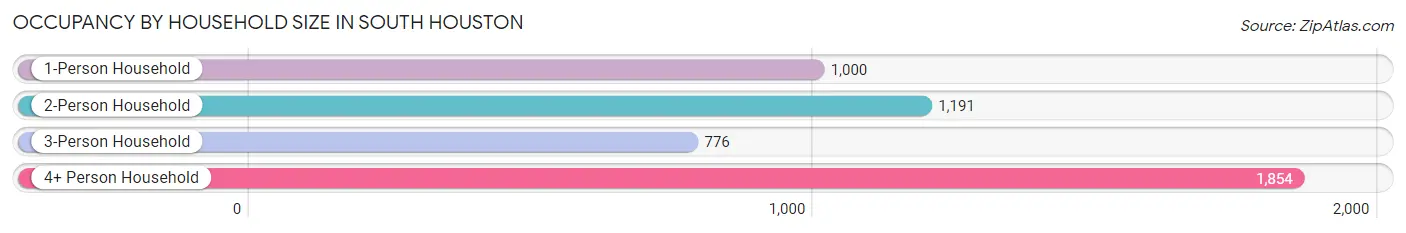
| Household Size | # Housing Units | % Housing Units |
| 1-Person Household | 1,000 | 20.7% |
| 2-Person Household | 1,191 | 24.7% |
| 3-Person Household | 776 | 16.1% |
| 4+ Person Household | 1,854 | 38.5% |
| Total Housing Units | 4,821 | 100.0% |
Occupancy by Ownership by Household Size in South Houston
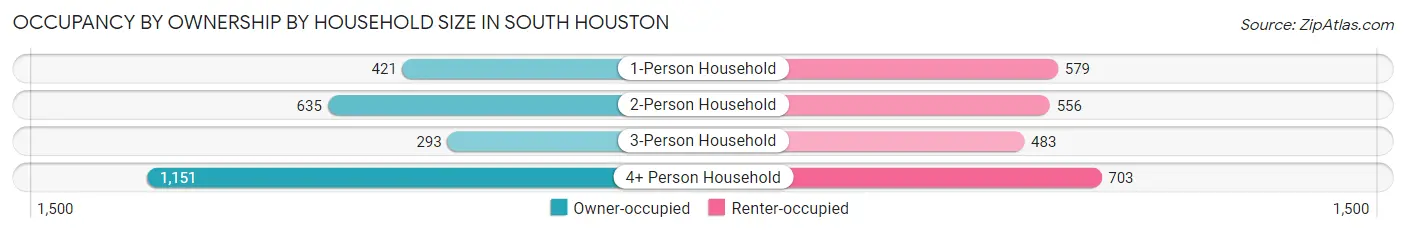
| Household Size | Owner-occupied | Renter-occupied |
| 1-Person Household | 421 (42.1%) | 579 (57.9%) |
| 2-Person Household | 635 (53.3%) | 556 (46.7%) |
| 3-Person Household | 293 (37.8%) | 483 (62.2%) |
| 4+ Person Household | 1,151 (62.1%) | 703 (37.9%) |
| Total Housing Units | 2,500 (51.9%) | 2,321 (48.1%) |
Occupancy by Educational Attainment in South Houston
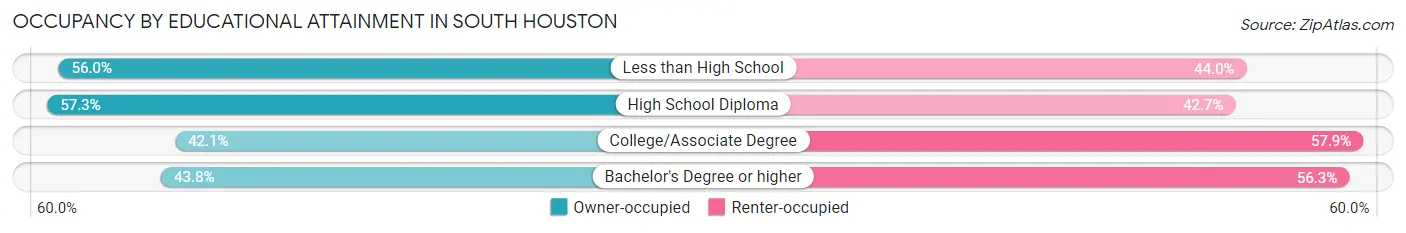
| Household Size | Owner-occupied | Renter-occupied |
| Less than High School | 1,000 (56.0%) | 787 (44.0%) |
| High School Diploma | 817 (57.3%) | 609 (42.7%) |
| College/Associate Degree | 515 (42.1%) | 709 (57.9%) |
| Bachelor's Degree or higher | 168 (43.8%) | 216 (56.2%) |
Occupancy by Age of Householder in South Houston
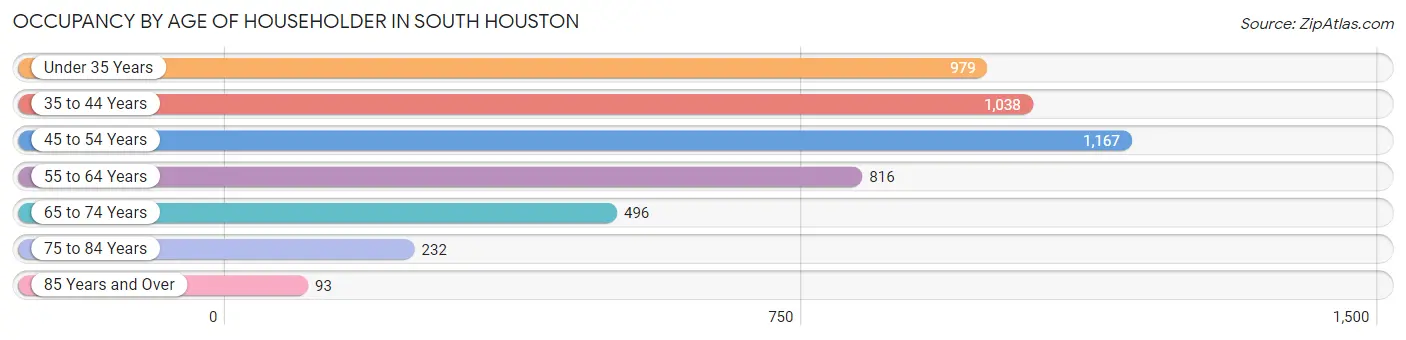
| Age Bracket | # Households | % Households |
| Under 35 Years | 979 | 20.3% |
| 35 to 44 Years | 1,038 | 21.5% |
| 45 to 54 Years | 1,167 | 24.2% |
| 55 to 64 Years | 816 | 16.9% |
| 65 to 74 Years | 496 | 10.3% |
| 75 to 84 Years | 232 | 4.8% |
| 85 Years and Over | 93 | 1.9% |
| Total | 4,821 | 100.0% |
Housing Finances in South Houston
Median Income by Occupancy in South Houston
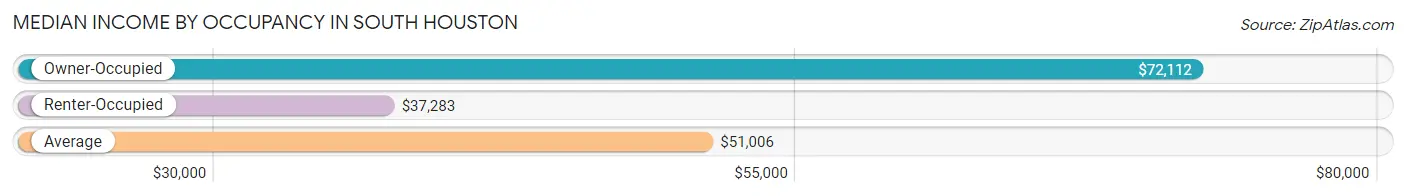
| Occupancy Type | # Households | Median Income |
| Owner-Occupied | 2,500 (51.9%) | $72,112 |
| Renter-Occupied | 2,321 (48.1%) | $37,283 |
| Average | 4,821 (100.0%) | $51,006 |
Occupancy by Householder Income Bracket in South Houston
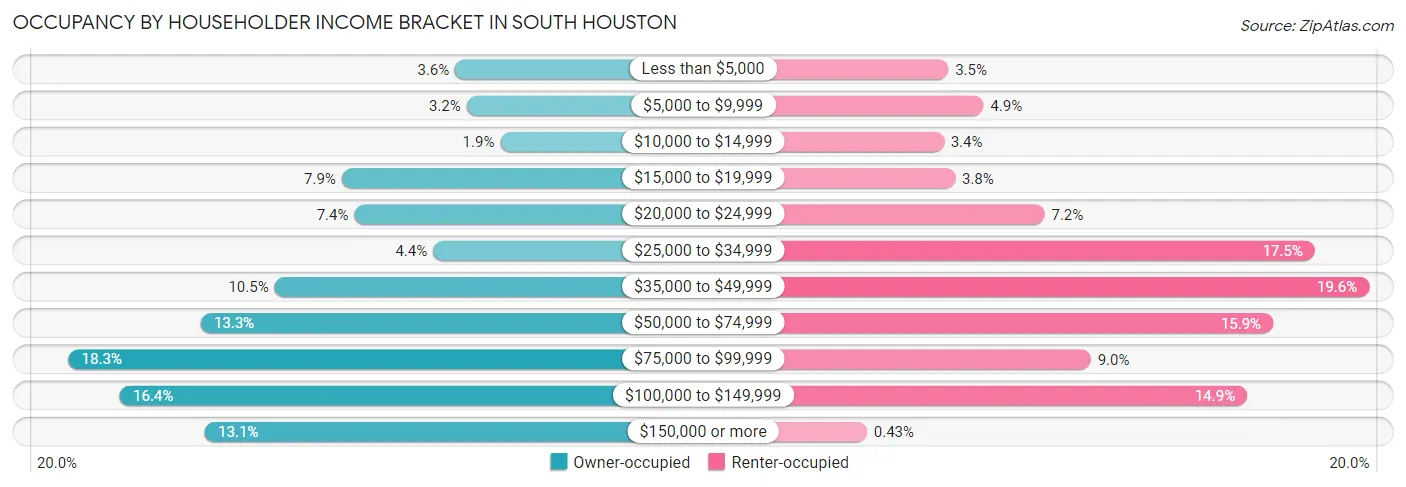
| Income Bracket | Owner-occupied | Renter-occupied |
| Less than $5,000 | 90 (3.6%) | 82 (3.5%) |
| $5,000 to $9,999 | 79 (3.2%) | 113 (4.9%) |
| $10,000 to $14,999 | 47 (1.9%) | 78 (3.4%) |
| $15,000 to $19,999 | 198 (7.9%) | 88 (3.8%) |
| $20,000 to $24,999 | 186 (7.4%) | 167 (7.2%) |
| $25,000 to $34,999 | 111 (4.4%) | 406 (17.5%) |
| $35,000 to $49,999 | 262 (10.5%) | 454 (19.6%) |
| $50,000 to $74,999 | 332 (13.3%) | 369 (15.9%) |
| $75,000 to $99,999 | 458 (18.3%) | 208 (9.0%) |
| $100,000 to $149,999 | 409 (16.4%) | 346 (14.9%) |
| $150,000 or more | 328 (13.1%) | 10 (0.4%) |
| Total | 2,500 (100.0%) | 2,321 (100.0%) |
Monthly Housing Cost Tiers in South Houston
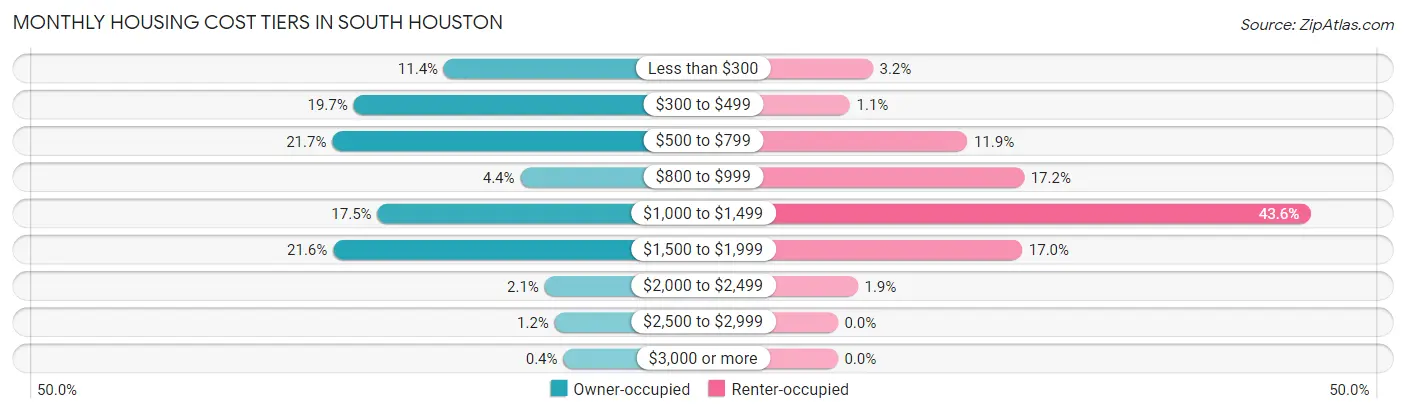
| Monthly Cost | Owner-occupied | Renter-occupied |
| Less than $300 | 285 (11.4%) | 75 (3.2%) |
| $300 to $499 | 493 (19.7%) | 26 (1.1%) |
| $500 to $799 | 542 (21.7%) | 277 (11.9%) |
| $800 to $999 | 109 (4.4%) | 398 (17.2%) |
| $1,000 to $1,499 | 438 (17.5%) | 1,012 (43.6%) |
| $1,500 to $1,999 | 540 (21.6%) | 394 (17.0%) |
| $2,000 to $2,499 | 53 (2.1%) | 43 (1.8%) |
| $2,500 to $2,999 | 30 (1.2%) | 0 (0.0%) |
| $3,000 or more | 10 (0.4%) | 0 (0.0%) |
| Total | 2,500 (100.0%) | 2,321 (100.0%) |
Physical Housing Characteristics in South Houston
Housing Structures in South Houston
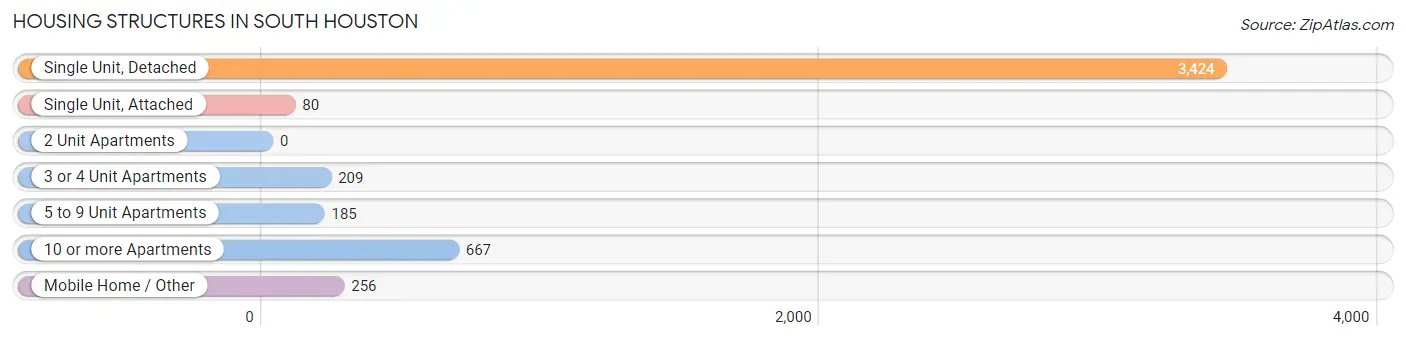
| Structure Type | # Housing Units | % Housing Units |
| Single Unit, Detached | 3,424 | 71.0% |
| Single Unit, Attached | 80 | 1.7% |
| 2 Unit Apartments | 0 | 0.0% |
| 3 or 4 Unit Apartments | 209 | 4.3% |
| 5 to 9 Unit Apartments | 185 | 3.8% |
| 10 or more Apartments | 667 | 13.8% |
| Mobile Home / Other | 256 | 5.3% |
| Total | 4,821 | 100.0% |
Housing Structures by Occupancy in South Houston
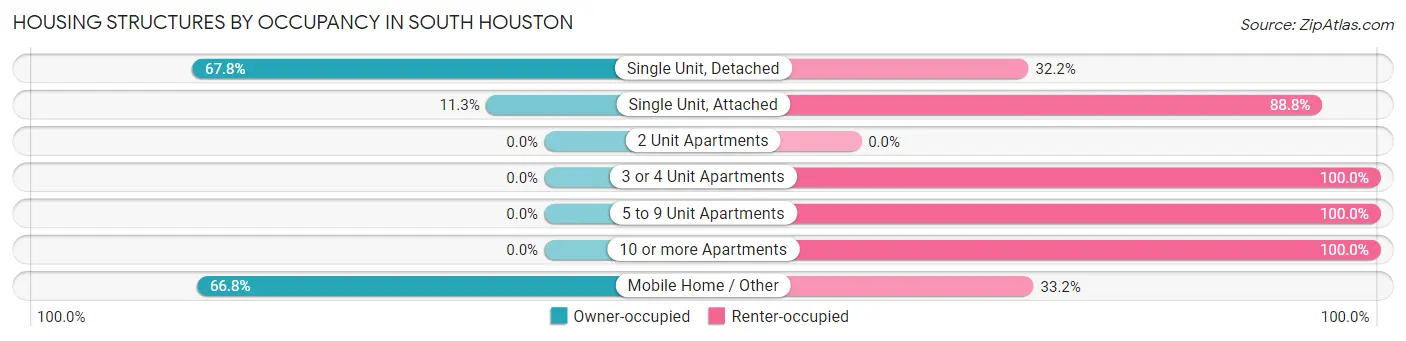
| Structure Type | Owner-occupied | Renter-occupied |
| Single Unit, Detached | 2,320 (67.8%) | 1,104 (32.2%) |
| Single Unit, Attached | 9 (11.3%) | 71 (88.7%) |
| 2 Unit Apartments | 0 (0.0%) | 0 (0.0%) |
| 3 or 4 Unit Apartments | 0 (0.0%) | 209 (100.0%) |
| 5 to 9 Unit Apartments | 0 (0.0%) | 185 (100.0%) |
| 10 or more Apartments | 0 (0.0%) | 667 (100.0%) |
| Mobile Home / Other | 171 (66.8%) | 85 (33.2%) |
| Total | 2,500 (51.9%) | 2,321 (48.1%) |
Housing Structures by Number of Rooms in South Houston
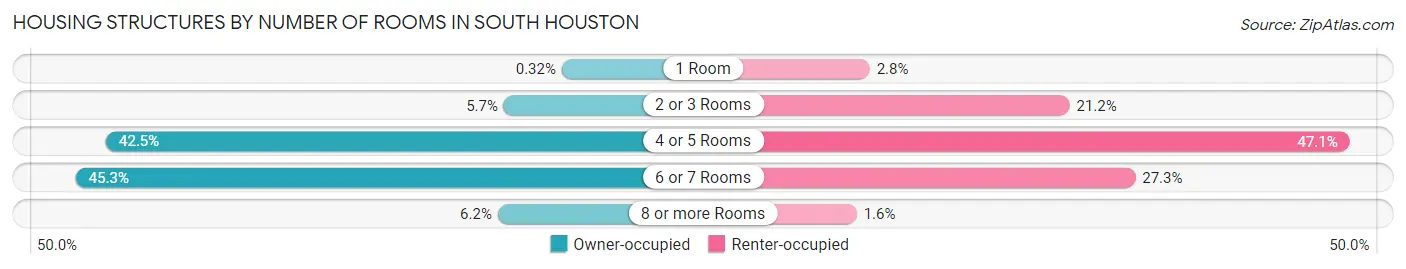
| Number of Rooms | Owner-occupied | Renter-occupied |
| 1 Room | 8 (0.3%) | 64 (2.8%) |
| 2 or 3 Rooms | 142 (5.7%) | 493 (21.2%) |
| 4 or 5 Rooms | 1,062 (42.5%) | 1,094 (47.1%) |
| 6 or 7 Rooms | 1,132 (45.3%) | 634 (27.3%) |
| 8 or more Rooms | 156 (6.2%) | 36 (1.5%) |
| Total | 2,500 (100.0%) | 2,321 (100.0%) |
Housing Structure by Heating Type in South Houston
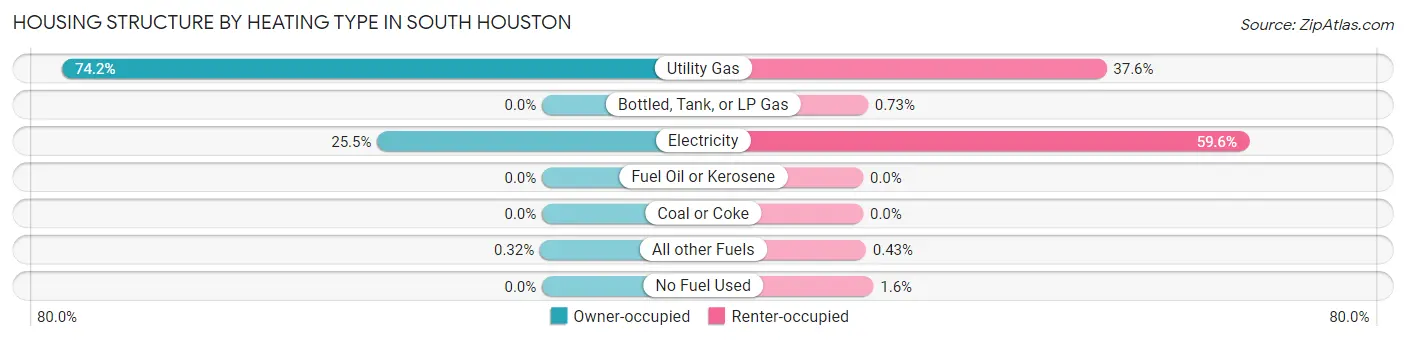
| Heating Type | Owner-occupied | Renter-occupied |
| Utility Gas | 1,855 (74.2%) | 873 (37.6%) |
| Bottled, Tank, or LP Gas | 0 (0.0%) | 17 (0.7%) |
| Electricity | 637 (25.5%) | 1,384 (59.6%) |
| Fuel Oil or Kerosene | 0 (0.0%) | 0 (0.0%) |
| Coal or Coke | 0 (0.0%) | 0 (0.0%) |
| All other Fuels | 8 (0.3%) | 10 (0.4%) |
| No Fuel Used | 0 (0.0%) | 37 (1.6%) |
| Total | 2,500 (100.0%) | 2,321 (100.0%) |
Household Vehicle Usage in South Houston
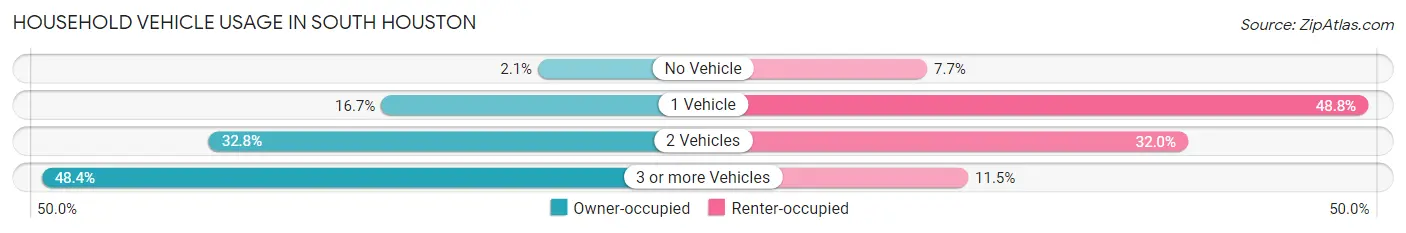
| Vehicles per Household | Owner-occupied | Renter-occupied |
| No Vehicle | 52 (2.1%) | 178 (7.7%) |
| 1 Vehicle | 418 (16.7%) | 1,133 (48.8%) |
| 2 Vehicles | 820 (32.8%) | 743 (32.0%) |
| 3 or more Vehicles | 1,210 (48.4%) | 267 (11.5%) |
| Total | 2,500 (100.0%) | 2,321 (100.0%) |
Real Estate & Mortgages in South Houston
Real Estate and Mortgage Overview in South Houston
| Characteristic | Without Mortgage | With Mortgage |
| Housing Units | 1,441 | 1,059 |
| Median Property Value | $123,600 | $172,800 |
| Median Household Income | $51,650 | $233 |
| Monthly Housing Costs | $486 | $10 |
| Real Estate Taxes | $2,133 | $121 |
Property Value by Mortgage Status in South Houston
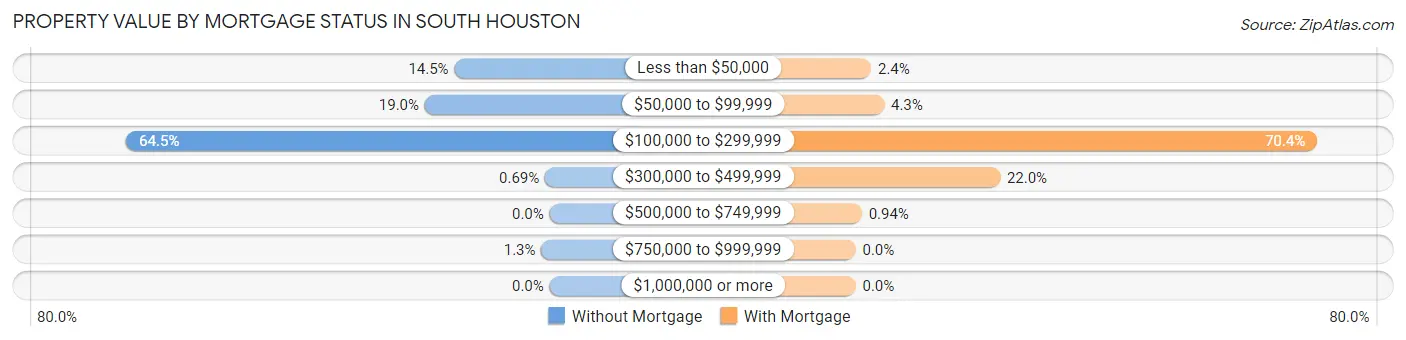
| Property Value | Without Mortgage | With Mortgage |
| Less than $50,000 | 209 (14.5%) | 25 (2.4%) |
| $50,000 to $99,999 | 274 (19.0%) | 46 (4.3%) |
| $100,000 to $299,999 | 930 (64.5%) | 745 (70.4%) |
| $300,000 to $499,999 | 10 (0.7%) | 233 (22.0%) |
| $500,000 to $749,999 | 0 (0.0%) | 10 (0.9%) |
| $750,000 to $999,999 | 18 (1.3%) | 0 (0.0%) |
| $1,000,000 or more | 0 (0.0%) | 0 (0.0%) |
| Total | 1,441 (100.0%) | 1,059 (100.0%) |
Household Income by Mortgage Status in South Houston
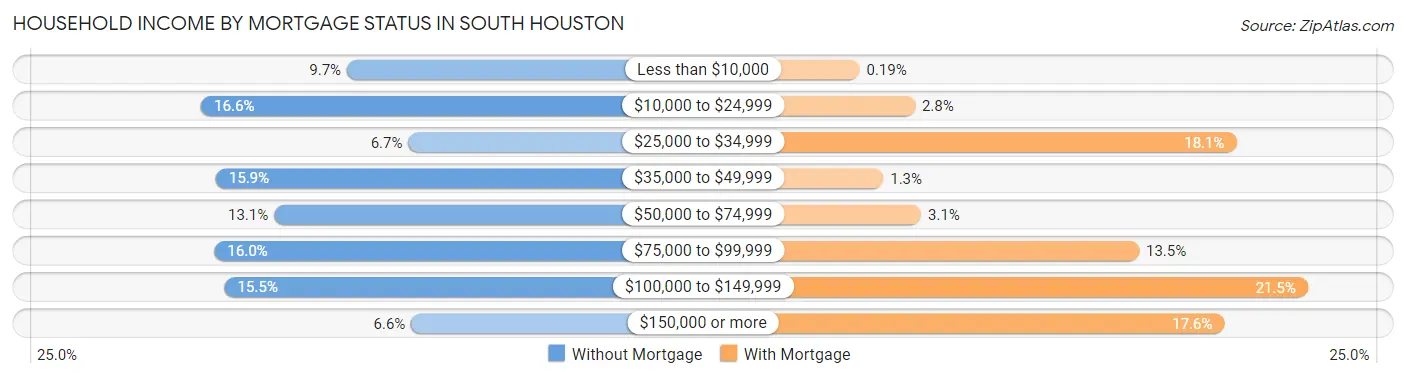
| Household Income | Without Mortgage | With Mortgage |
| Less than $10,000 | 139 (9.7%) | 2 (0.2%) |
| $10,000 to $24,999 | 239 (16.6%) | 30 (2.8%) |
| $25,000 to $34,999 | 97 (6.7%) | 192 (18.1%) |
| $35,000 to $49,999 | 229 (15.9%) | 14 (1.3%) |
| $50,000 to $74,999 | 189 (13.1%) | 33 (3.1%) |
| $75,000 to $99,999 | 230 (16.0%) | 143 (13.5%) |
| $100,000 to $149,999 | 223 (15.5%) | 228 (21.5%) |
| $150,000 or more | 95 (6.6%) | 186 (17.6%) |
| Total | 1,441 (100.0%) | 1,059 (100.0%) |
Property Value to Household Income Ratio in South Houston
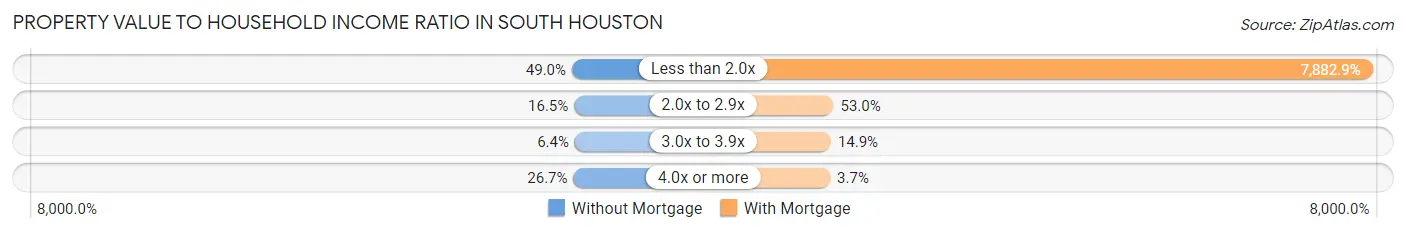
| Value-to-Income Ratio | Without Mortgage | With Mortgage |
| Less than 2.0x | 706 (49.0%) | 83,480 (7,882.9%) |
| 2.0x to 2.9x | 237 (16.5%) | 561 (53.0%) |
| 3.0x to 3.9x | 92 (6.4%) | 158 (14.9%) |
| 4.0x or more | 385 (26.7%) | 39 (3.7%) |
| Total | 1,441 (100.0%) | 1,059 (100.0%) |
Real Estate Taxes by Mortgage Status in South Houston
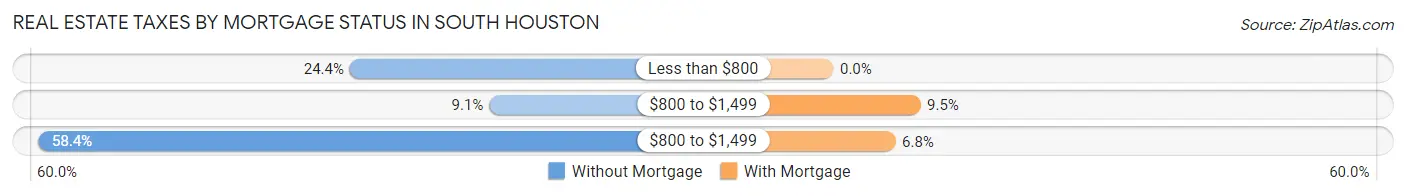
| Property Taxes | Without Mortgage | With Mortgage |
| Less than $800 | 351 (24.4%) | 0 (0.0%) |
| $800 to $1,499 | 131 (9.1%) | 101 (9.5%) |
| $800 to $1,499 | 842 (58.4%) | 72 (6.8%) |
| Total | 1,441 (100.0%) | 1,059 (100.0%) |
Health & Disability in South Houston
Health Insurance Coverage by Age in South Houston
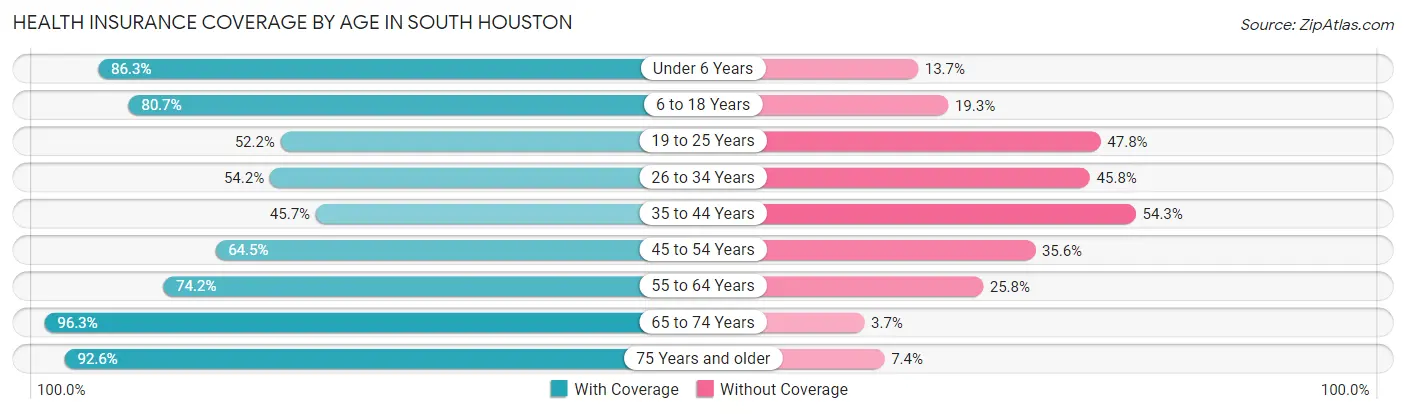
| Age Bracket | With Coverage | Without Coverage |
| Under 6 Years | 1,191 (86.3%) | 189 (13.7%) |
| 6 to 18 Years | 3,570 (80.7%) | 856 (19.3%) |
| 19 to 25 Years | 978 (52.2%) | 894 (47.8%) |
| 26 to 34 Years | 845 (54.2%) | 713 (45.8%) |
| 35 to 44 Years | 999 (45.7%) | 1,188 (54.3%) |
| 45 to 54 Years | 1,233 (64.4%) | 680 (35.5%) |
| 55 to 64 Years | 1,114 (74.2%) | 388 (25.8%) |
| 65 to 74 Years | 810 (96.3%) | 31 (3.7%) |
| 75 Years and older | 448 (92.6%) | 36 (7.4%) |
| Total | 11,188 (69.2%) | 4,975 (30.8%) |
Health Insurance Coverage by Citizenship Status in South Houston
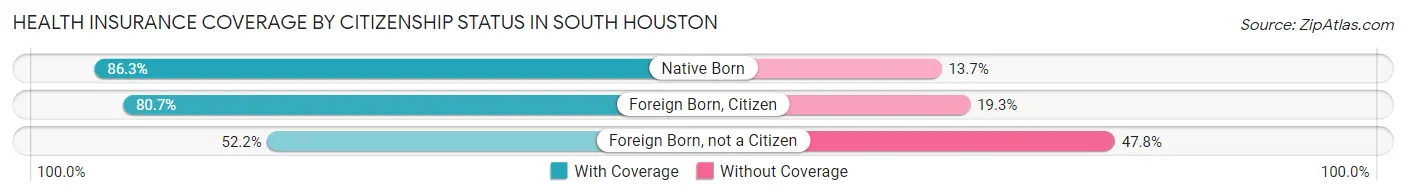
| Citizenship Status | With Coverage | Without Coverage |
| Native Born | 1,191 (86.3%) | 189 (13.7%) |
| Foreign Born, Citizen | 3,570 (80.7%) | 856 (19.3%) |
| Foreign Born, not a Citizen | 978 (52.2%) | 894 (47.8%) |
Health Insurance Coverage by Household Income in South Houston
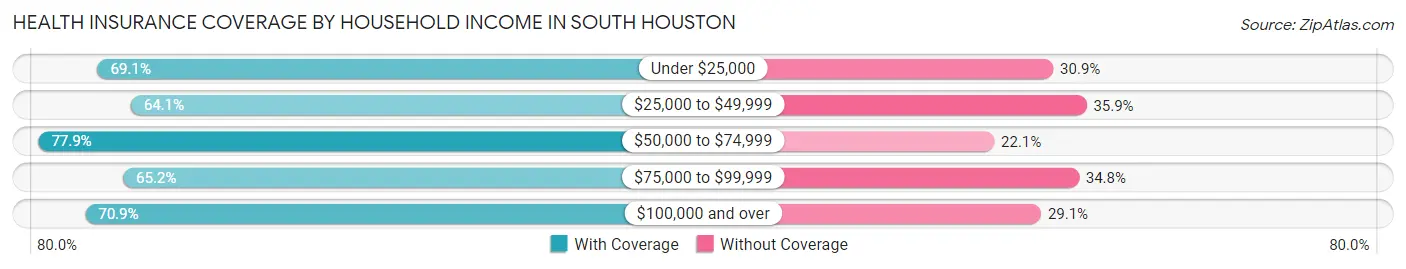
| Household Income | With Coverage | Without Coverage |
| Under $25,000 | 2,012 (69.1%) | 901 (30.9%) |
| $25,000 to $49,999 | 2,114 (64.1%) | 1,185 (35.9%) |
| $50,000 to $74,999 | 1,853 (77.9%) | 525 (22.1%) |
| $75,000 to $99,999 | 1,846 (65.2%) | 984 (34.8%) |
| $100,000 and over | 3,363 (70.9%) | 1,380 (29.1%) |
Public vs Private Health Insurance Coverage by Age in South Houston
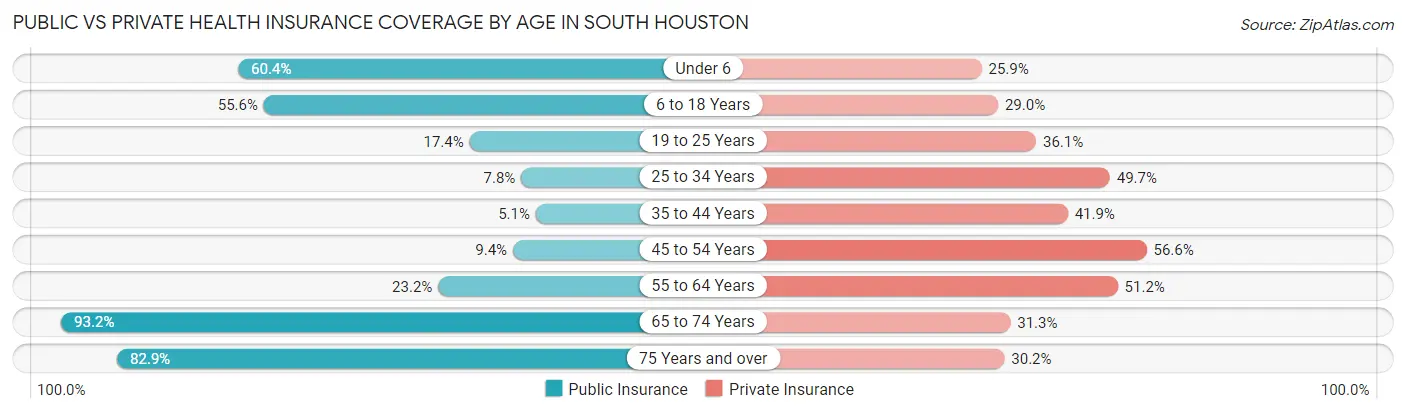
| Age Bracket | Public Insurance | Private Insurance |
| Under 6 | 833 (60.4%) | 358 (25.9%) |
| 6 to 18 Years | 2,461 (55.6%) | 1,283 (29.0%) |
| 19 to 25 Years | 326 (17.4%) | 675 (36.1%) |
| 25 to 34 Years | 122 (7.8%) | 775 (49.7%) |
| 35 to 44 Years | 112 (5.1%) | 917 (41.9%) |
| 45 to 54 Years | 179 (9.4%) | 1,082 (56.6%) |
| 55 to 64 Years | 349 (23.2%) | 769 (51.2%) |
| 65 to 74 Years | 784 (93.2%) | 263 (31.3%) |
| 75 Years and over | 401 (82.9%) | 146 (30.2%) |
| Total | 5,567 (34.4%) | 6,268 (38.8%) |
Disability Status by Sex by Age in South Houston
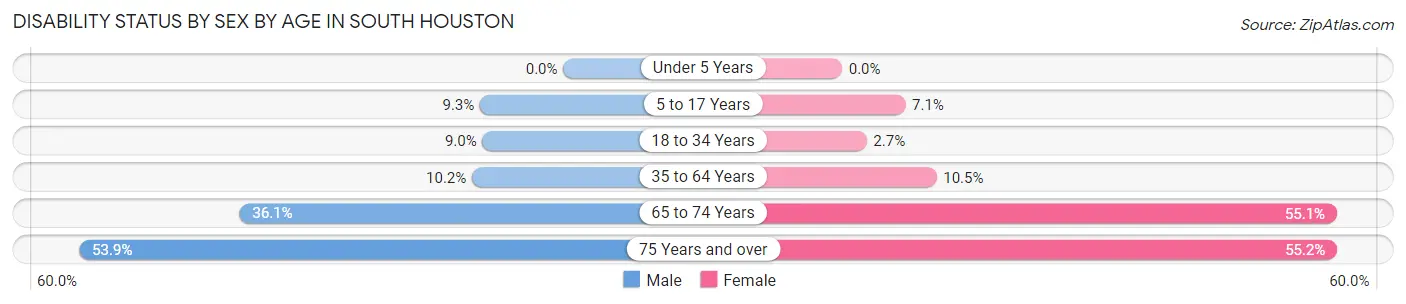
| Age Bracket | Male | Female |
| Under 5 Years | 0 (0.0%) | 0 (0.0%) |
| 5 to 17 Years | 197 (9.3%) | 141 (7.0%) |
| 18 to 34 Years | 161 (9.0%) | 55 (2.7%) |
| 35 to 64 Years | 288 (10.2%) | 291 (10.5%) |
| 65 to 74 Years | 149 (36.1%) | 236 (55.1%) |
| 75 Years and over | 89 (53.9%) | 176 (55.2%) |
Disability Class by Sex by Age in South Houston
Disability Class: Hearing Difficulty
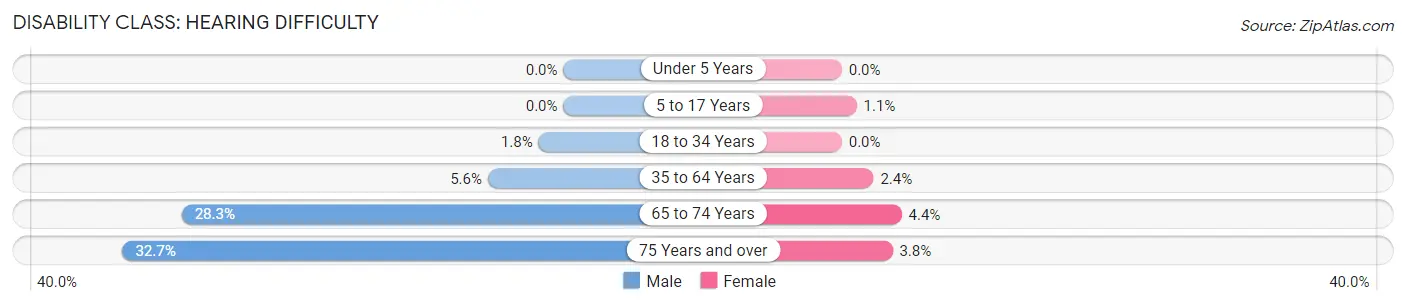
| Age Bracket | Male | Female |
| Under 5 Years | 0 (0.0%) | 0 (0.0%) |
| 5 to 17 Years | 0 (0.0%) | 22 (1.1%) |
| 18 to 34 Years | 33 (1.8%) | 0 (0.0%) |
| 35 to 64 Years | 159 (5.6%) | 65 (2.4%) |
| 65 to 74 Years | 117 (28.3%) | 19 (4.4%) |
| 75 Years and over | 54 (32.7%) | 12 (3.8%) |
Disability Class: Vision Difficulty
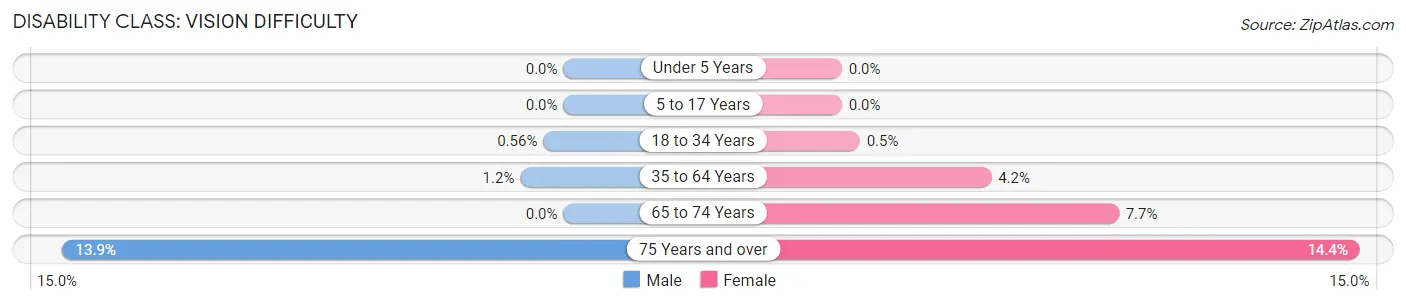
| Age Bracket | Male | Female |
| Under 5 Years | 0 (0.0%) | 0 (0.0%) |
| 5 to 17 Years | 0 (0.0%) | 0 (0.0%) |
| 18 to 34 Years | 10 (0.6%) | 10 (0.5%) |
| 35 to 64 Years | 34 (1.2%) | 115 (4.2%) |
| 65 to 74 Years | 0 (0.0%) | 33 (7.7%) |
| 75 Years and over | 23 (13.9%) | 46 (14.4%) |
Disability Class: Cognitive Difficulty
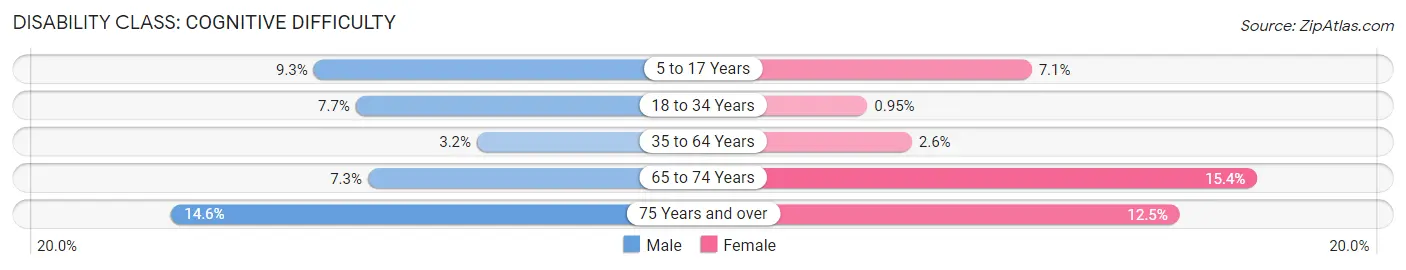
| Age Bracket | Male | Female |
| 5 to 17 Years | 197 (9.3%) | 141 (7.0%) |
| 18 to 34 Years | 138 (7.7%) | 19 (0.9%) |
| 35 to 64 Years | 91 (3.2%) | 72 (2.6%) |
| 65 to 74 Years | 30 (7.3%) | 66 (15.4%) |
| 75 Years and over | 24 (14.5%) | 40 (12.5%) |
Disability Class: Ambulatory Difficulty
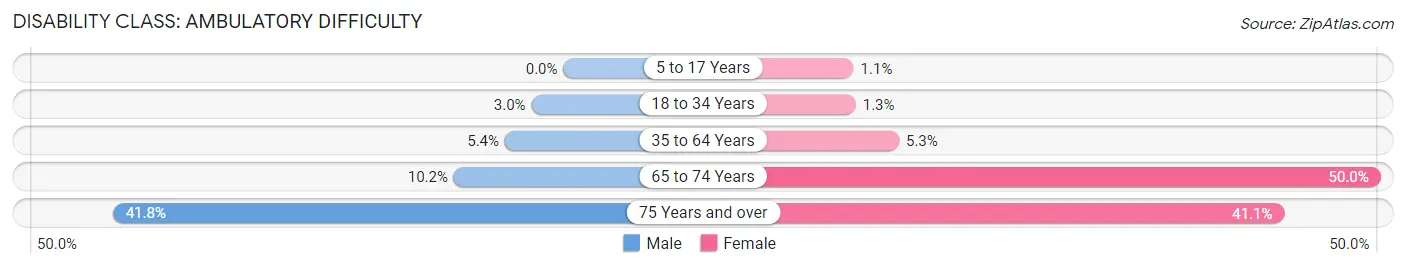
| Age Bracket | Male | Female |
| 5 to 17 Years | 0 (0.0%) | 22 (1.1%) |
| 18 to 34 Years | 53 (3.0%) | 26 (1.3%) |
| 35 to 64 Years | 154 (5.4%) | 147 (5.3%) |
| 65 to 74 Years | 42 (10.2%) | 214 (50.0%) |
| 75 Years and over | 69 (41.8%) | 131 (41.1%) |
Disability Class: Self-Care Difficulty
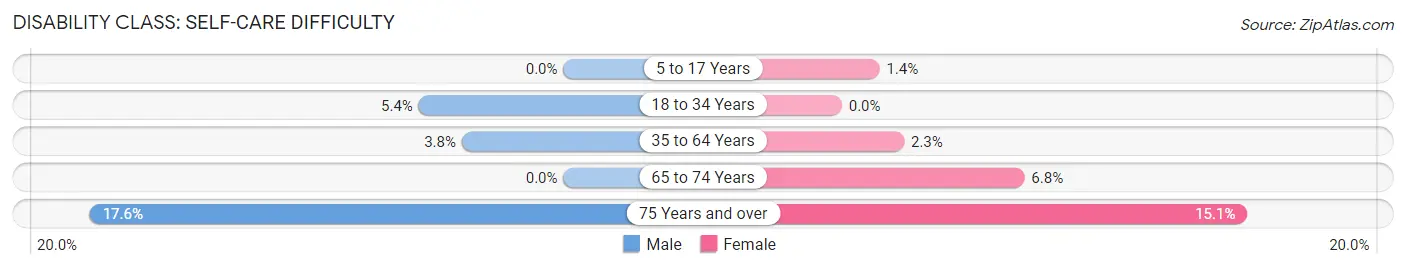
| Age Bracket | Male | Female |
| 5 to 17 Years | 0 (0.0%) | 28 (1.4%) |
| 18 to 34 Years | 96 (5.4%) | 0 (0.0%) |
| 35 to 64 Years | 107 (3.8%) | 64 (2.3%) |
| 65 to 74 Years | 0 (0.0%) | 29 (6.8%) |
| 75 Years and over | 29 (17.6%) | 48 (15.0%) |
Technology Access in South Houston
Computing Device Access in South Houston
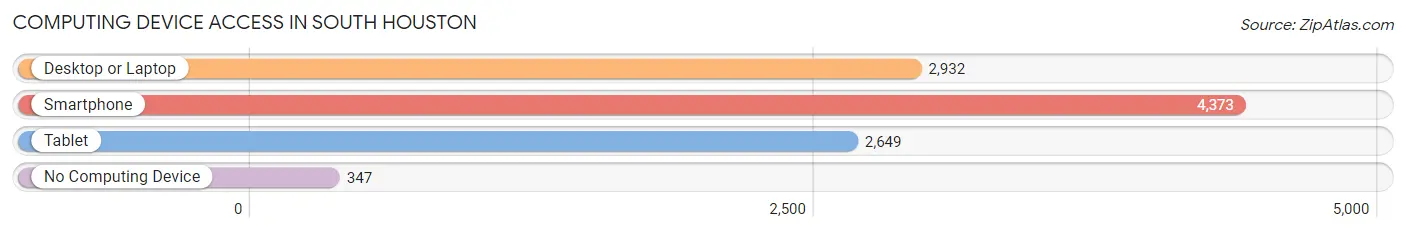
| Device Type | # Households | % Households |
| Desktop or Laptop | 2,932 | 60.8% |
| Smartphone | 4,373 | 90.7% |
| Tablet | 2,649 | 54.9% |
| No Computing Device | 347 | 7.2% |
| Total | 4,821 | 100.0% |
Internet Access in South Houston
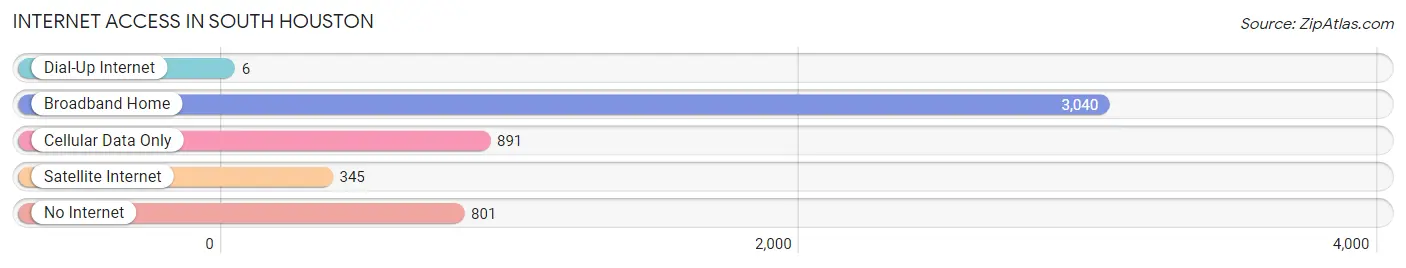
| Internet Type | # Households | % Households |
| Dial-Up Internet | 6 | 0.1% |
| Broadband Home | 3,040 | 63.1% |
| Cellular Data Only | 891 | 18.5% |
| Satellite Internet | 345 | 7.2% |
| No Internet | 801 | 16.6% |
| Total | 4,821 | 100.0% |
South Houston Summary
Houston, Texas is the fourth largest city in the United States and the largest city in the state of Texas. It is located in the southeastern part of the state, along the Gulf Coast. The city is home to over two million people and is the economic and cultural center of the Houston-The Woodlands-Sugar Land metropolitan area, which is the fifth largest metropolitan area in the United States.
Houston is a diverse city with a rich history. It was founded in 1836 by two brothers, Augustus and John Allen, who named the city after the first president of the Republic of Texas, Sam Houston. The city quickly grew and became an important port and trading center. During the Civil War, Houston served as the capital of the Confederate States of America. After the war, the city continued to grow and develop, becoming a major center for the oil and gas industry.
The city of South Houston is located in the southeastern part of Houston. It is bordered by the cities of Pasadena, Pearland, and Galena Park. South Houston is a diverse community with a population of approximately 25,000 people. The city is home to a variety of businesses, including manufacturing, retail, and service industries.
Geographically, South Houston is located in the coastal plain region of Texas. The city is situated on the banks of the Houston Ship Channel, which is a major shipping route for the region. The city is also located near the Houston Ship Channel Bridge, which connects the city to the mainland. The city is also located near the Houston Zoo, the Houston Museum of Natural Science, and the Houston Arboretum and Nature Center.
The economy of South Houston is largely based on the oil and gas industry. The city is home to several major oil and gas companies, including Shell Oil Company, Chevron Corporation, and ExxonMobil. The city is also home to several manufacturing companies, including the Houston Shipbuilding Corporation and the Houston Ship Repair Company. Additionally, the city is home to several retail stores, restaurants, and other businesses.
The demographics of South Houston are diverse. The city is home to a large Hispanic population, as well as African Americans, Asians, and other ethnicities. The median household income in South Houston is $37,000, which is slightly lower than the median household income for the city of Houston. The city also has a higher poverty rate than the city of Houston, with approximately 20% of the population living below the poverty line.
South Houston is a vibrant and diverse city with a rich history and a strong economy. The city is home to a variety of businesses, including oil and gas companies, manufacturing companies, and retail stores. The city is also home to a diverse population, with a large Hispanic population and a variety of other ethnicities. The city has a strong economy and is a great place to live and work.
Common Questions
What is Per Capita Income in South Houston?
Per Capita income in South Houston is $20,716.
What is the Median Family Income in South Houston?
Median Family Income in South Houston is $58,836.
What is the Median Household income in South Houston?
Median Household Income in South Houston is $51,006.
What is Income or Wage Gap in South Houston?
Income or Wage Gap in South Houston is 36.5%.
Women in South Houston earn 63.5 cents for every dollar earned by a man.
What is Family Income Deficit in South Houston?
Family Income Deficit in South Houston is $10,349.
Families that are below poverty line in South Houston earn $10,349 less on average than the poverty threshold level.
What is Inequality or Gini Index in South Houston?
Inequality or Gini Index in South Houston is 0.43.
What is the Total Population of South Houston?
Total Population of South Houston is 16,169.
What is the Total Male Population of South Houston?
Total Male Population of South Houston is 7,811.
What is the Total Female Population of South Houston?
Total Female Population of South Houston is 8,358.
What is the Ratio of Males per 100 Females in South Houston?
There are 93.46 Males per 100 Females in South Houston.
What is the Ratio of Females per 100 Males in South Houston?
There are 107.00 Females per 100 Males in South Houston.
What is the Median Population Age in South Houston?
Median Population Age in South Houston is 28.3 Years.
What is the Average Family Size in South Houston
Average Family Size in South Houston is 3.9 People.
What is the Average Household Size in South Houston
Average Household Size in South Houston is 3.4 People.
How Large is the Labor Force in South Houston?
There are 7,636 People in the Labor Forcein in South Houston.
What is the Percentage of People in the Labor Force in South Houston?
64.6% of People are in the Labor Force in South Houston.
What is the Unemployment Rate in South Houston?
Unemployment Rate in South Houston is 9.2%.