Lake Tanglewood, TX Map & Demographics
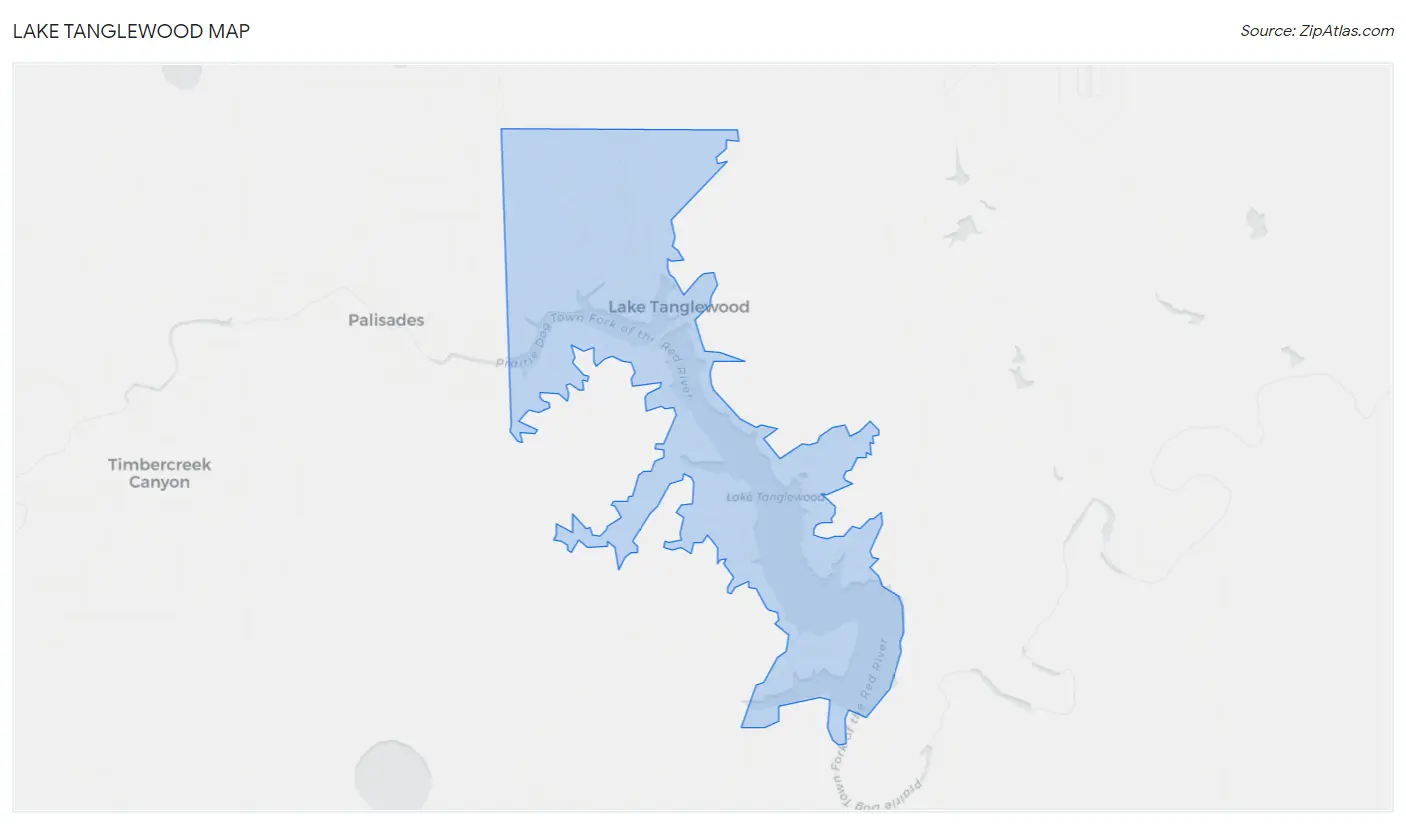
Lake Tanglewood Map
Lake Tanglewood Overview
$83,835
PER CAPITA INCOME
$151,250
AVG FAMILY INCOME
$140,833
AVG HOUSEHOLD INCOME
59.5%
WAGE / INCOME GAP [ % ]
40.5¢/ $1
WAGE / INCOME GAP [ $ ]
0.46
INEQUALITY / GINI INDEX
697
TOTAL POPULATION
339
MALE POPULATION
358
FEMALE POPULATION
94.69
MALES / 100 FEMALES
105.60
FEMALES / 100 MALES
61.1
MEDIAN AGE
2.6
AVG FAMILY SIZE
2.3
AVG HOUSEHOLD SIZE
349
LABOR FORCE [ PEOPLE ]
55.8%
PERCENT IN LABOR FORCE
2.9%
UNEMPLOYMENT RATE
Income in Lake Tanglewood
Income Overview in Lake Tanglewood
Per Capita Income in Lake Tanglewood is $83,835, while median incomes of families and households are $151,250 and $140,833 respectively.
| Characteristic | Number | Measure |
| Per Capita Income | 697 | $83,835 |
| Median Family Income | 246 | $151,250 |
| Mean Family Income | 246 | $206,610 |
| Median Household Income | 308 | $140,833 |
| Mean Household Income | 308 | $191,703 |
| Income Deficit | 246 | $0 |
| Wage / Income Gap (%) | 697 | 59.54% |
| Wage / Income Gap ($) | 697 | 40.46¢ per $1 |
| Gini / Inequality Index | 697 | 0.46 |
Earnings by Sex in Lake Tanglewood
Average Earnings in Lake Tanglewood are $68,906, $108,125 for men and $43,750 for women, a difference of 59.5%.
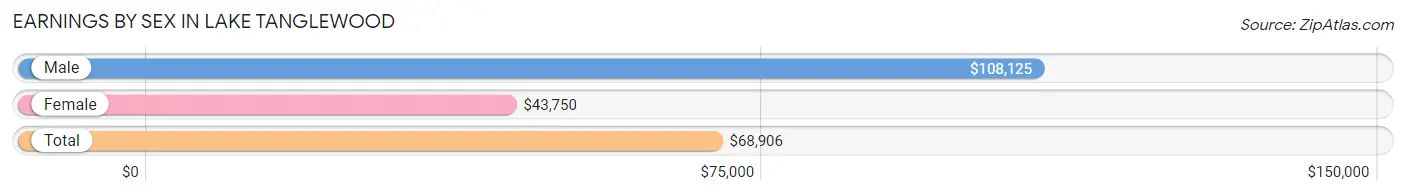
| Sex | Number | Average Earnings |
| Male | 235 (64.4%) | $108,125 |
| Female | 130 (35.6%) | $43,750 |
| Total | 365 (100.0%) | $68,906 |
Earnings by Sex by Income Bracket in Lake Tanglewood
The most common earnings brackets in Lake Tanglewood are $100,000+ for men (124 | 52.8%) and $55,000 to $64,999 for women (25 | 19.2%).
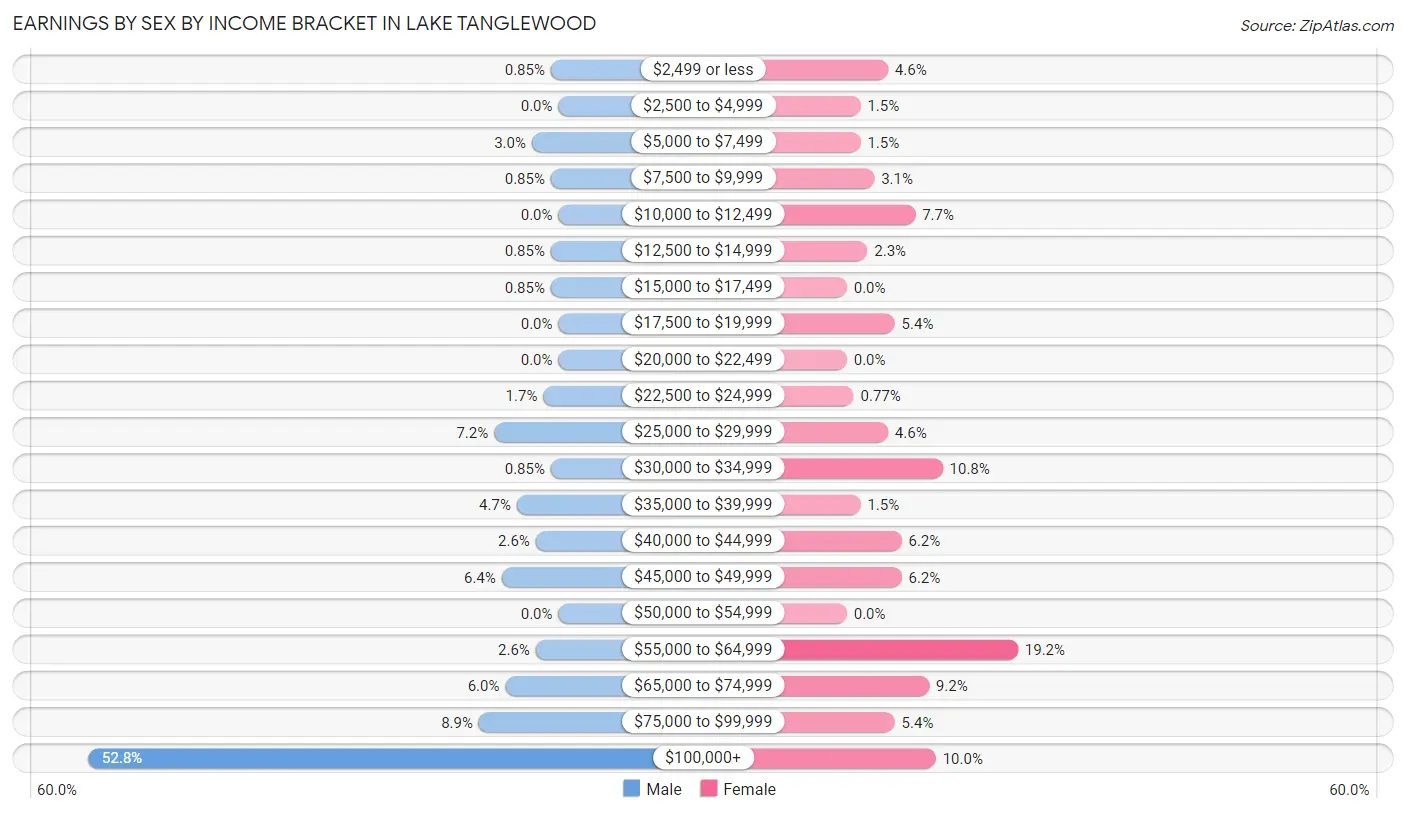
| Income | Male | Female |
| $2,499 or less | 2 (0.9%) | 6 (4.6%) |
| $2,500 to $4,999 | 0 (0.0%) | 2 (1.5%) |
| $5,000 to $7,499 | 7 (3.0%) | 2 (1.5%) |
| $7,500 to $9,999 | 2 (0.9%) | 4 (3.1%) |
| $10,000 to $12,499 | 0 (0.0%) | 10 (7.7%) |
| $12,500 to $14,999 | 2 (0.9%) | 3 (2.3%) |
| $15,000 to $17,499 | 2 (0.9%) | 0 (0.0%) |
| $17,500 to $19,999 | 0 (0.0%) | 7 (5.4%) |
| $20,000 to $22,499 | 0 (0.0%) | 0 (0.0%) |
| $22,500 to $24,999 | 4 (1.7%) | 1 (0.8%) |
| $25,000 to $29,999 | 17 (7.2%) | 6 (4.6%) |
| $30,000 to $34,999 | 2 (0.9%) | 14 (10.8%) |
| $35,000 to $39,999 | 11 (4.7%) | 2 (1.5%) |
| $40,000 to $44,999 | 6 (2.5%) | 8 (6.1%) |
| $45,000 to $49,999 | 15 (6.4%) | 8 (6.1%) |
| $50,000 to $54,999 | 0 (0.0%) | 0 (0.0%) |
| $55,000 to $64,999 | 6 (2.5%) | 25 (19.2%) |
| $65,000 to $74,999 | 14 (6.0%) | 12 (9.2%) |
| $75,000 to $99,999 | 21 (8.9%) | 7 (5.4%) |
| $100,000+ | 124 (52.8%) | 13 (10.0%) |
| Total | 235 (100.0%) | 130 (100.0%) |
Earnings by Sex by Educational Attainment in Lake Tanglewood
Average earnings in Lake Tanglewood are $113,828 for men and $45,625 for women, a difference of 59.9%. Men with an educational attainment of bachelor's degree enjoy the highest average annual earnings of $143,125, while those with college or associate's degree education earn the least with $68,750. Women with an educational attainment of graduate degree earn the most with the average annual earnings of $60,750, while those with high school diploma education have the smallest earnings of $26,875.
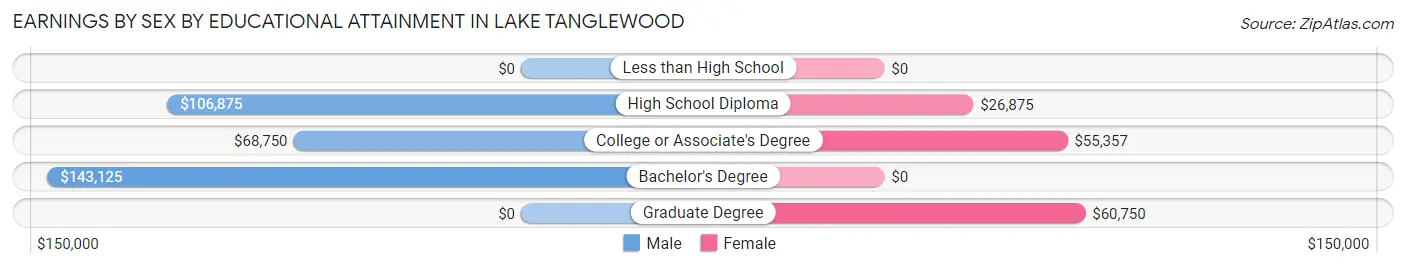
| Educational Attainment | Male Income | Female Income |
| Less than High School | - | - |
| High School Diploma | $106,875 | $26,875 |
| College or Associate's Degree | $68,750 | $55,357 |
| Bachelor's Degree | $143,125 | $0 |
| Graduate Degree | - | - |
| Total | $113,828 | $45,625 |
Family Income in Lake Tanglewood
Family Income Brackets in Lake Tanglewood
According to the Lake Tanglewood family income data, there are 80 families falling into the $200,000+ income range, which is the most common income bracket and makes up 32.5% of all families. Conversely, the less than $10,000 income bracket is the least frequent group with only 2 families (0.8%) belonging to this category.
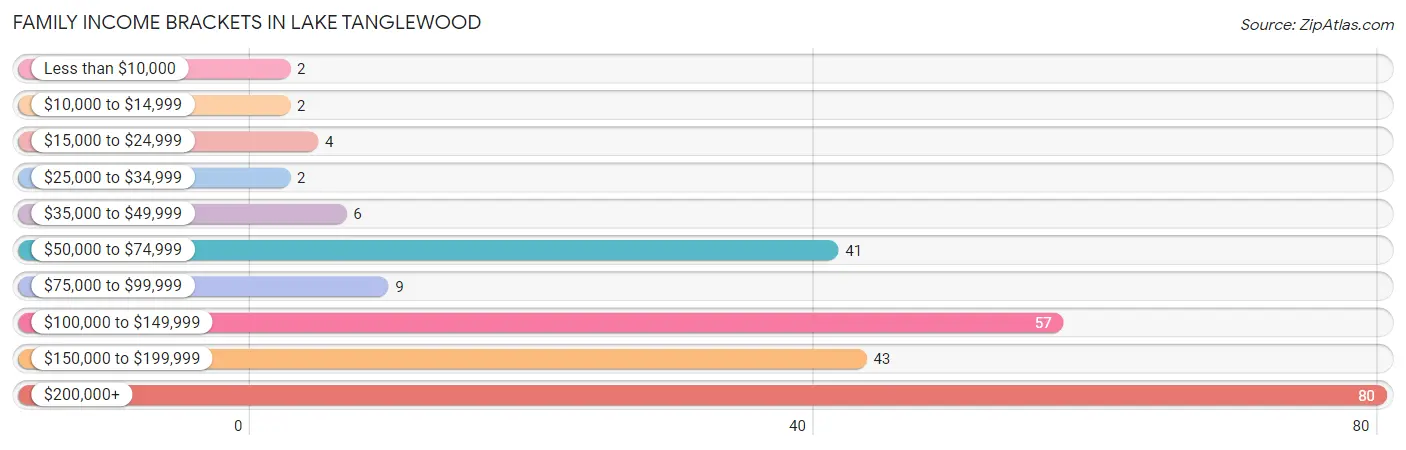
| Income Bracket | # Families | % Families |
| Less than $10,000 | 2 | 0.8% |
| $10,000 to $14,999 | 2 | 0.8% |
| $15,000 to $24,999 | 4 | 1.6% |
| $25,000 to $34,999 | 2 | 0.8% |
| $35,000 to $49,999 | 6 | 2.4% |
| $50,000 to $74,999 | 41 | 16.7% |
| $75,000 to $99,999 | 9 | 3.7% |
| $100,000 to $149,999 | 57 | 23.2% |
| $150,000 to $199,999 | 43 | 17.5% |
| $200,000+ | 80 | 32.5% |
Family Income by Famaliy Size in Lake Tanglewood
3-person families (43 | 17.5%) account for the highest median family income in Lake Tanglewood with $161,875 per family, while 2-person families (178 | 72.4%) have the highest median income of $75,625 per family member.
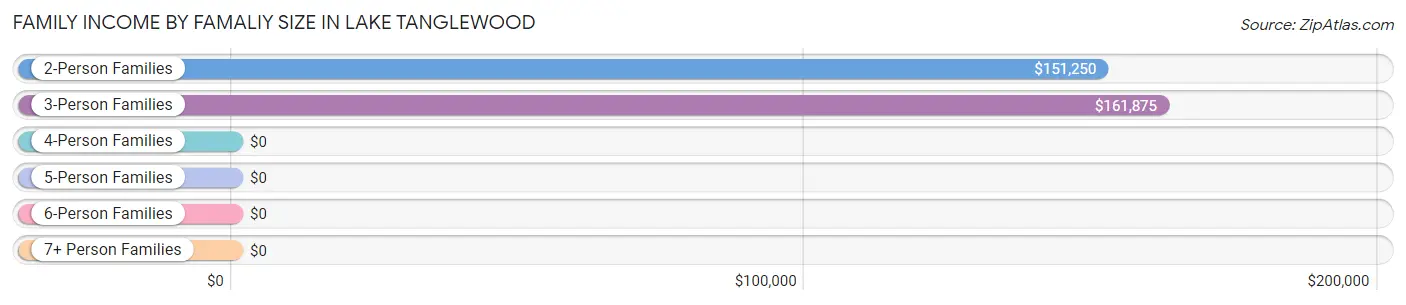
| Income Bracket | # Families | Median Income |
| 2-Person Families | 178 (72.4%) | $151,250 |
| 3-Person Families | 43 (17.5%) | $161,875 |
| 4-Person Families | 8 (3.3%) | $0 |
| 5-Person Families | 9 (3.7%) | $0 |
| 6-Person Families | 3 (1.2%) | $0 |
| 7+ Person Families | 5 (2.0%) | $0 |
| Total | 246 (100.0%) | $151,250 |
Family Income by Number of Earners in Lake Tanglewood
The median family income in Lake Tanglewood is $151,250, with families comprising 2 earners (100) having the highest median family income of $187,500, while families with no earners (55) have the lowest median family income of $73,304, accounting for 40.6% and 22.4% of families, respectively.
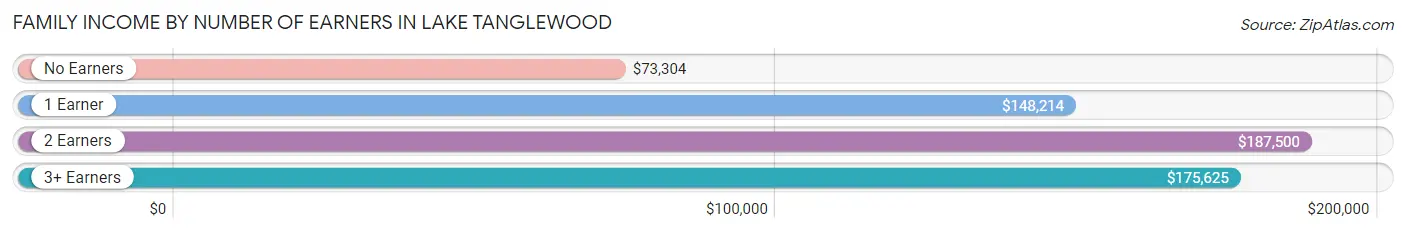
| Number of Earners | # Families | Median Income |
| No Earners | 55 (22.4%) | $73,304 |
| 1 Earner | 70 (28.5%) | $148,214 |
| 2 Earners | 100 (40.6%) | $187,500 |
| 3+ Earners | 21 (8.5%) | $175,625 |
| Total | 246 (100.0%) | $151,250 |
Household Income in Lake Tanglewood
Household Income Brackets in Lake Tanglewood
With 89 households falling in the category, the $200,000+ income range is the most frequent in Lake Tanglewood, accounting for 28.9% of all households. In contrast, only 2 households (0.6%) fall into the $10,000 to $14,999 income bracket, making it the least populous group.
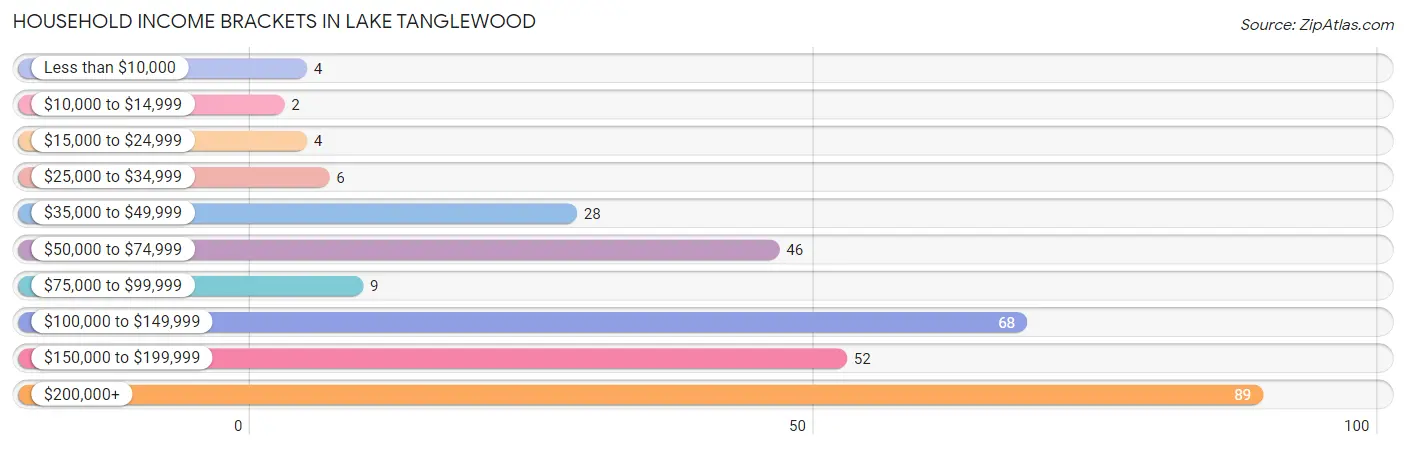
| Income Bracket | # Households | % Households |
| Less than $10,000 | 4 | 1.3% |
| $10,000 to $14,999 | 2 | 0.6% |
| $15,000 to $24,999 | 4 | 1.3% |
| $25,000 to $34,999 | 6 | 1.9% |
| $35,000 to $49,999 | 28 | 9.1% |
| $50,000 to $74,999 | 46 | 14.9% |
| $75,000 to $99,999 | 9 | 2.9% |
| $100,000 to $149,999 | 68 | 22.1% |
| $150,000 to $199,999 | 52 | 16.9% |
| $200,000+ | 89 | 28.9% |
Household Income by Householder Age in Lake Tanglewood
The median household income in Lake Tanglewood is $140,833, with the highest median household income of $197,500 found in the 45 to 64 years age bracket for the primary householder. A total of 118 households (38.3%) fall into this category.
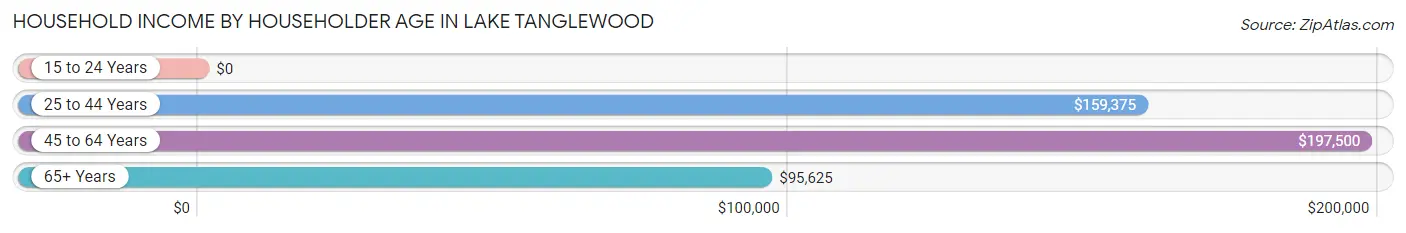
| Income Bracket | # Households | Median Income |
| 15 to 24 Years | 0 (0.0%) | $0 |
| 25 to 44 Years | 21 (6.8%) | $159,375 |
| 45 to 64 Years | 118 (38.3%) | $197,500 |
| 65+ Years | 169 (54.9%) | $95,625 |
| Total | 308 (100.0%) | $140,833 |
Poverty in Lake Tanglewood
Income Below Poverty by Sex and Age in Lake Tanglewood
With 1.2% poverty level for males and 4.5% for females among the residents of Lake Tanglewood, 35 to 44 year old males and 5 year old females are the most vulnerable to poverty, with 2 males (12.5%) and 2 females (100.0%) in their respective age groups living below the poverty level.
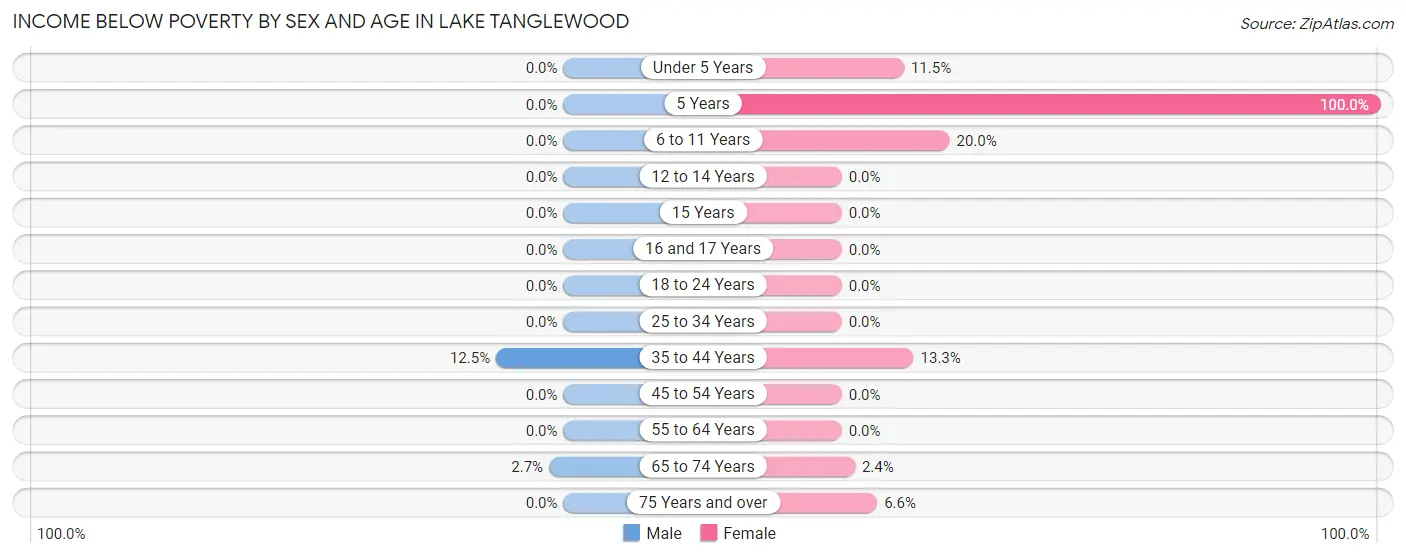
| Age Bracket | Male | Female |
| Under 5 Years | 0 (0.0%) | 3 (11.5%) |
| 5 Years | 0 (0.0%) | 2 (100.0%) |
| 6 to 11 Years | 0 (0.0%) | 2 (20.0%) |
| 12 to 14 Years | 0 (0.0%) | 0 (0.0%) |
| 15 Years | 0 (0.0%) | 0 (0.0%) |
| 16 and 17 Years | 0 (0.0%) | 0 (0.0%) |
| 18 to 24 Years | 0 (0.0%) | 0 (0.0%) |
| 25 to 34 Years | 0 (0.0%) | 0 (0.0%) |
| 35 to 44 Years | 2 (12.5%) | 2 (13.3%) |
| 45 to 54 Years | 0 (0.0%) | 0 (0.0%) |
| 55 to 64 Years | 0 (0.0%) | 0 (0.0%) |
| 65 to 74 Years | 2 (2.7%) | 2 (2.4%) |
| 75 Years and over | 0 (0.0%) | 5 (6.6%) |
| Total | 4 (1.2%) | 16 (4.5%) |
Income Above Poverty by Sex and Age in Lake Tanglewood
According to the poverty statistics in Lake Tanglewood, males aged under 5 years and females aged 12 to 14 years are the age groups that are most secure financially, with 100.0% of males and 100.0% of females in these age groups living above the poverty line.
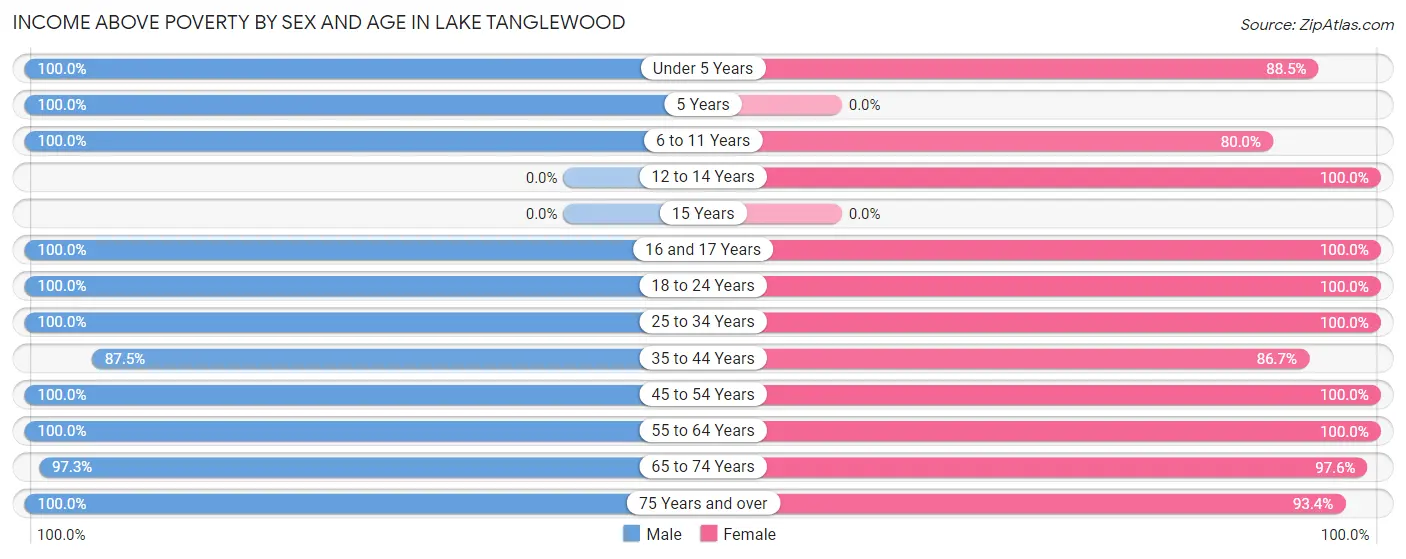
| Age Bracket | Male | Female |
| Under 5 Years | 16 (100.0%) | 23 (88.5%) |
| 5 Years | 5 (100.0%) | 0 (0.0%) |
| 6 to 11 Years | 6 (100.0%) | 8 (80.0%) |
| 12 to 14 Years | 0 (0.0%) | 6 (100.0%) |
| 15 Years | 0 (0.0%) | 0 (0.0%) |
| 16 and 17 Years | 9 (100.0%) | 11 (100.0%) |
| 18 to 24 Years | 19 (100.0%) | 4 (100.0%) |
| 25 to 34 Years | 12 (100.0%) | 7 (100.0%) |
| 35 to 44 Years | 14 (87.5%) | 13 (86.7%) |
| 45 to 54 Years | 44 (100.0%) | 36 (100.0%) |
| 55 to 64 Years | 80 (100.0%) | 83 (100.0%) |
| 65 to 74 Years | 73 (97.3%) | 80 (97.6%) |
| 75 Years and over | 57 (100.0%) | 71 (93.4%) |
| Total | 335 (98.8%) | 342 (95.5%) |
Income Below Poverty Among Married-Couple Families in Lake Tanglewood
The poverty statistics for married-couple families in Lake Tanglewood show that 1.7% or 4 of the total 241 families live below the poverty line. Families with 3 or 4 children have the highest poverty rate of 16.7%, comprising of 2 families. On the other hand, families with 1 or 2 children have the lowest poverty rate of 0.0%, which includes 0 families.
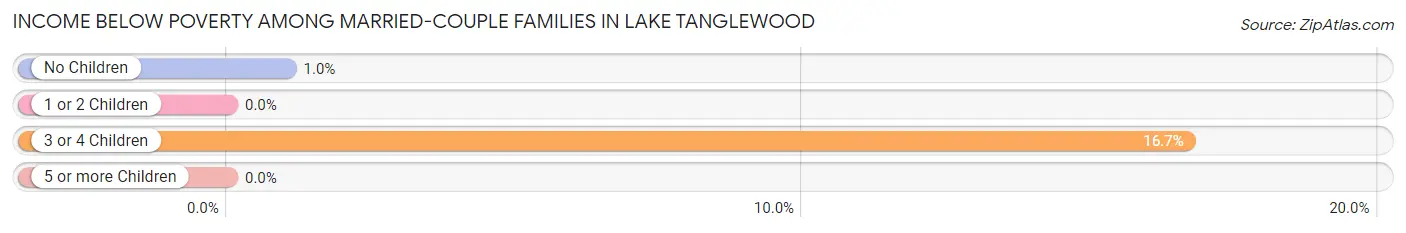
| Children | Above Poverty | Below Poverty |
| No Children | 195 (99.0%) | 2 (1.0%) |
| 1 or 2 Children | 32 (100.0%) | 0 (0.0%) |
| 3 or 4 Children | 10 (83.3%) | 2 (16.7%) |
| 5 or more Children | 0 (0.0%) | 0 (0.0%) |
| Total | 237 (98.3%) | 4 (1.7%) |
Income Below Poverty Among Single-Parent Households in Lake Tanglewood
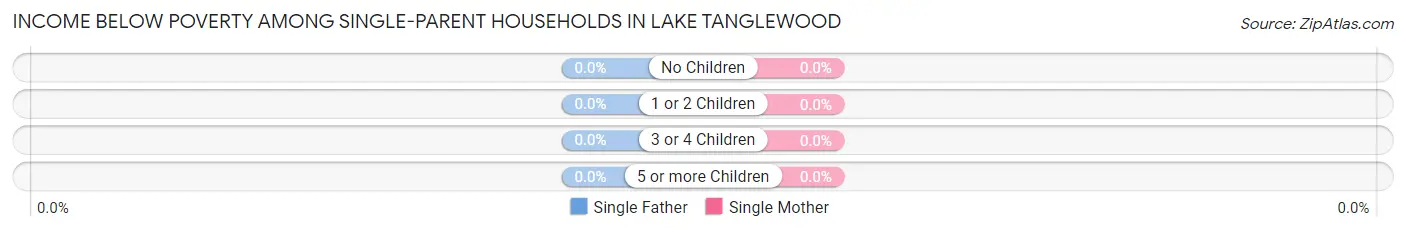
| Children | Single Father | Single Mother |
| No Children | 0 (0.0%) | 0 (0.0%) |
| 1 or 2 Children | 0 (0.0%) | 0 (0.0%) |
| 3 or 4 Children | 0 (0.0%) | 0 (0.0%) |
| 5 or more Children | 0 (0.0%) | 0 (0.0%) |
| Total | 0 (0.0%) | 0 (0.0%) |
Income Below Poverty Among Married-Couple vs Single-Parent Households in Lake Tanglewood
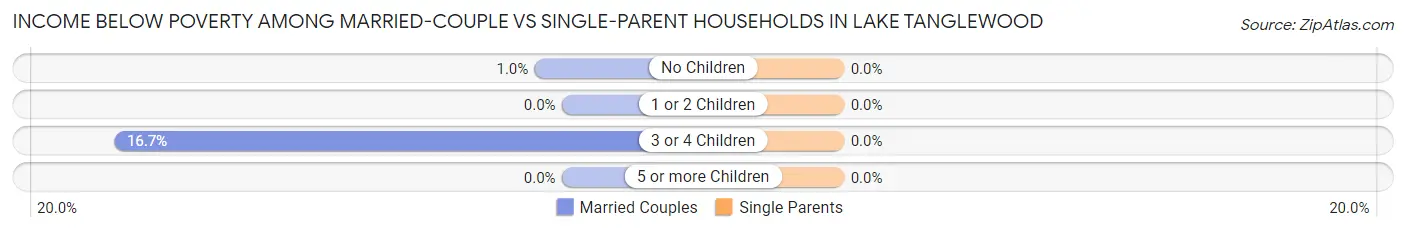
| Children | Married-Couple Families | Single-Parent Households |
| No Children | 2 (1.0%) | 0 (0.0%) |
| 1 or 2 Children | 0 (0.0%) | 0 (0.0%) |
| 3 or 4 Children | 2 (16.7%) | 0 (0.0%) |
| 5 or more Children | 0 (0.0%) | 0 (0.0%) |
| Total | 4 (1.7%) | 0 (0.0%) |
Race in Lake Tanglewood
The most populous races in Lake Tanglewood are White / Caucasian (609 | 87.4%), Two or more Races (69 | 9.9%), and Hispanic or Latino (67 | 9.6%).
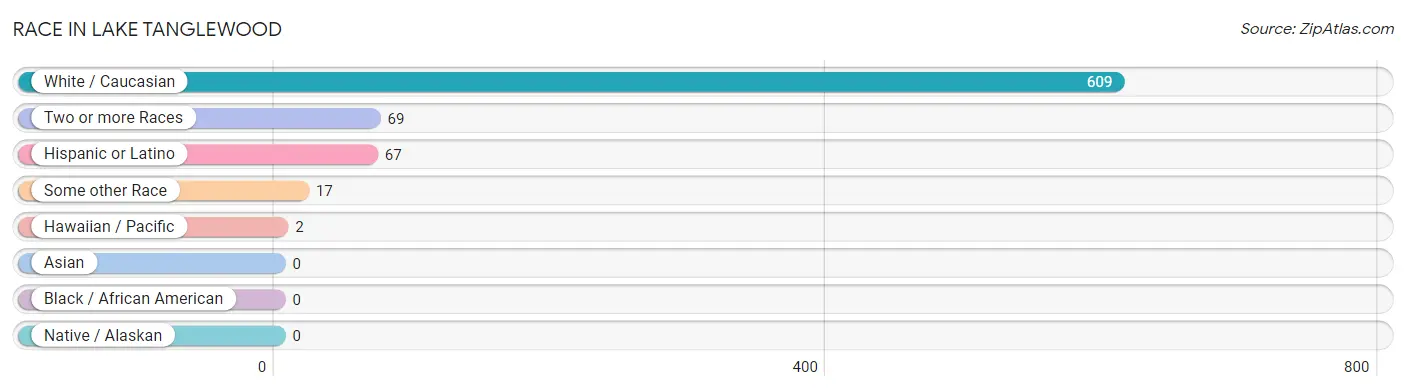
| Race | # Population | % Population |
| Asian | 0 | 0.0% |
| Black / African American | 0 | 0.0% |
| Hawaiian / Pacific | 2 | 0.3% |
| Hispanic or Latino | 67 | 9.6% |
| Native / Alaskan | 0 | 0.0% |
| White / Caucasian | 609 | 87.4% |
| Two or more Races | 69 | 9.9% |
| Some other Race | 17 | 2.4% |
| Total | 697 | 100.0% |
Ancestry in Lake Tanglewood
The most populous ancestries reported in Lake Tanglewood are German (119 | 17.1%), Irish (105 | 15.1%), American (82 | 11.8%), English (72 | 10.3%), and Mexican (57 | 8.2%), together accounting for 62.4% of all Lake Tanglewood residents.
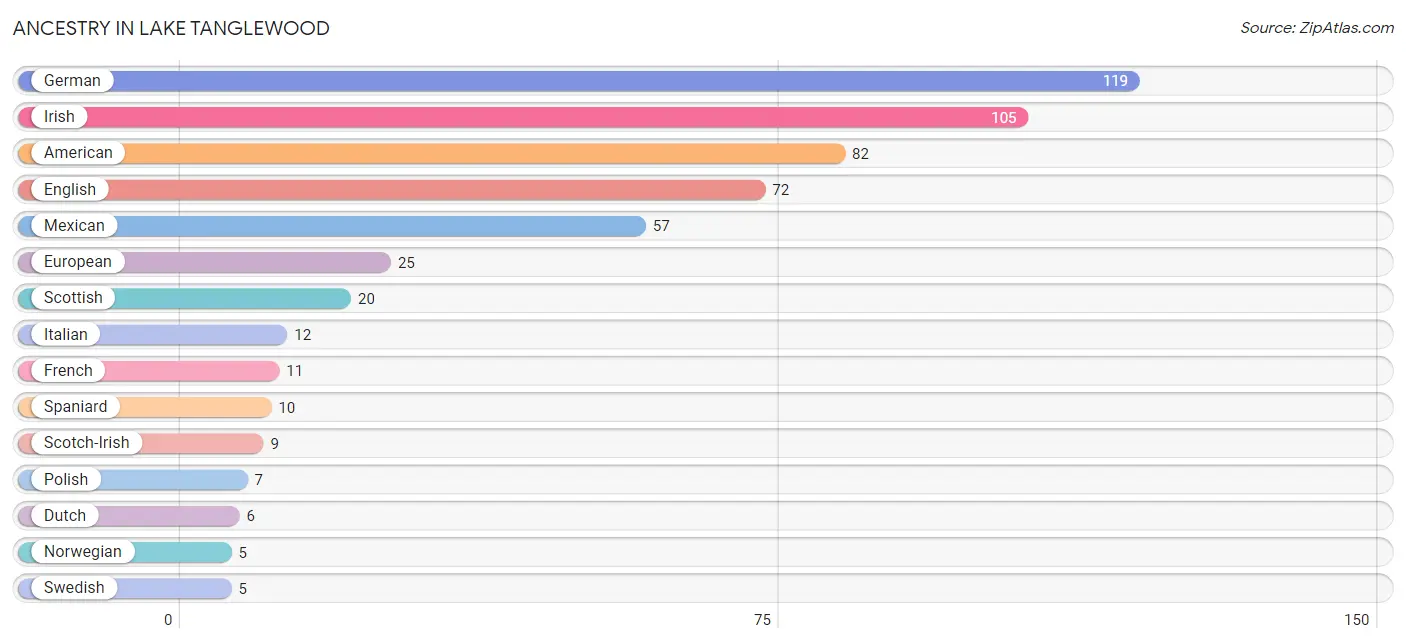
| Ancestry | # Population | % Population |
| American | 82 | 11.8% |
| Belgian | 2 | 0.3% |
| British | 2 | 0.3% |
| Cherokee | 1 | 0.1% |
| Dutch | 6 | 0.9% |
| English | 72 | 10.3% |
| European | 25 | 3.6% |
| French | 11 | 1.6% |
| French American Indian | 2 | 0.3% |
| German | 119 | 17.1% |
| Irish | 105 | 15.1% |
| Italian | 12 | 1.7% |
| Mexican | 57 | 8.2% |
| Norwegian | 5 | 0.7% |
| Polish | 7 | 1.0% |
| Samoan | 2 | 0.3% |
| Scotch-Irish | 9 | 1.3% |
| Scottish | 20 | 2.9% |
| Spaniard | 10 | 1.4% |
| Swedish | 5 | 0.7% | View All 20 Rows |
Immigrants in Lake Tanglewood
The most numerous immigrant groups reported in Lake Tanglewood came from Central America (2 | 0.3%), Latin America (2 | 0.3%), and Mexico (2 | 0.3%), together accounting for 0.9% of all Lake Tanglewood residents.
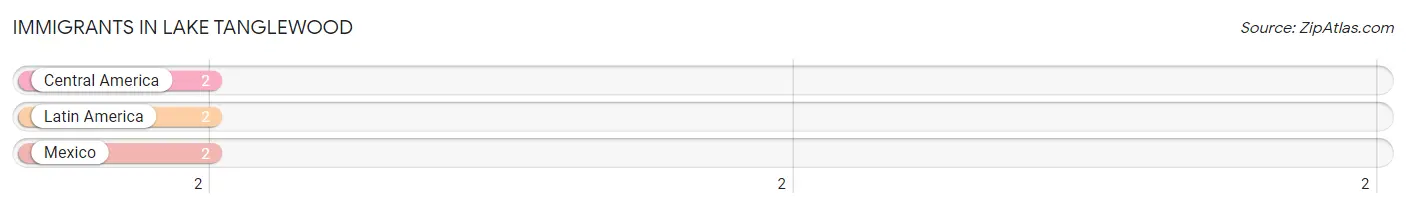
| Immigration Origin | # Population | % Population |
| Central America | 2 | 0.3% |
| Latin America | 2 | 0.3% |
| Mexico | 2 | 0.3% | View All 3 Rows |
Sex and Age in Lake Tanglewood
Sex and Age in Lake Tanglewood
The most populous age groups in Lake Tanglewood are 65 to 69 Years (52 | 15.3%) for men and 65 to 69 Years (52 | 14.5%) for women.
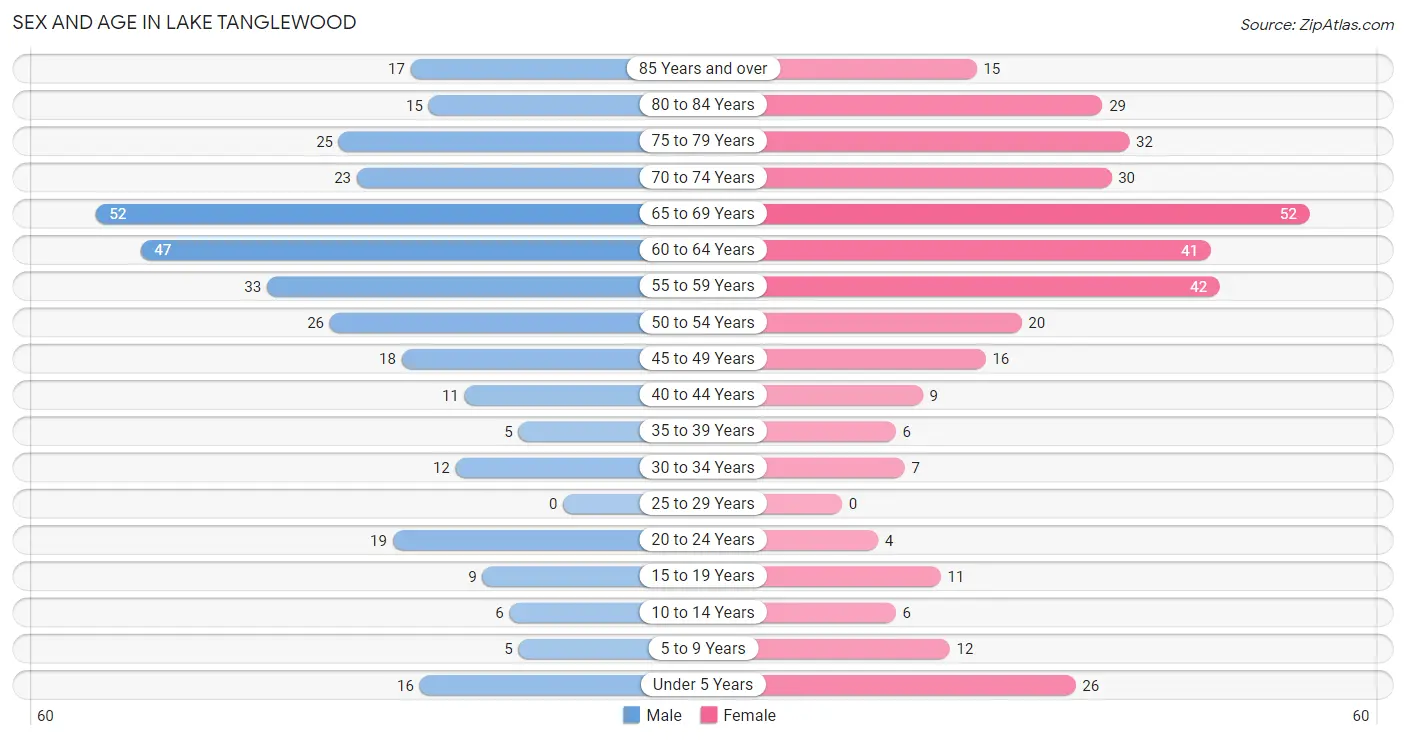
| Age Bracket | Male | Female |
| Under 5 Years | 16 (4.7%) | 26 (7.3%) |
| 5 to 9 Years | 5 (1.5%) | 12 (3.4%) |
| 10 to 14 Years | 6 (1.8%) | 6 (1.7%) |
| 15 to 19 Years | 9 (2.6%) | 11 (3.1%) |
| 20 to 24 Years | 19 (5.6%) | 4 (1.1%) |
| 25 to 29 Years | 0 (0.0%) | 0 (0.0%) |
| 30 to 34 Years | 12 (3.5%) | 7 (2.0%) |
| 35 to 39 Years | 5 (1.5%) | 6 (1.7%) |
| 40 to 44 Years | 11 (3.2%) | 9 (2.5%) |
| 45 to 49 Years | 18 (5.3%) | 16 (4.5%) |
| 50 to 54 Years | 26 (7.7%) | 20 (5.6%) |
| 55 to 59 Years | 33 (9.7%) | 42 (11.7%) |
| 60 to 64 Years | 47 (13.9%) | 41 (11.5%) |
| 65 to 69 Years | 52 (15.3%) | 52 (14.5%) |
| 70 to 74 Years | 23 (6.8%) | 30 (8.4%) |
| 75 to 79 Years | 25 (7.4%) | 32 (8.9%) |
| 80 to 84 Years | 15 (4.4%) | 29 (8.1%) |
| 85 Years and over | 17 (5.0%) | 15 (4.2%) |
| Total | 339 (100.0%) | 358 (100.0%) |
Families and Households in Lake Tanglewood
Median Family Size in Lake Tanglewood
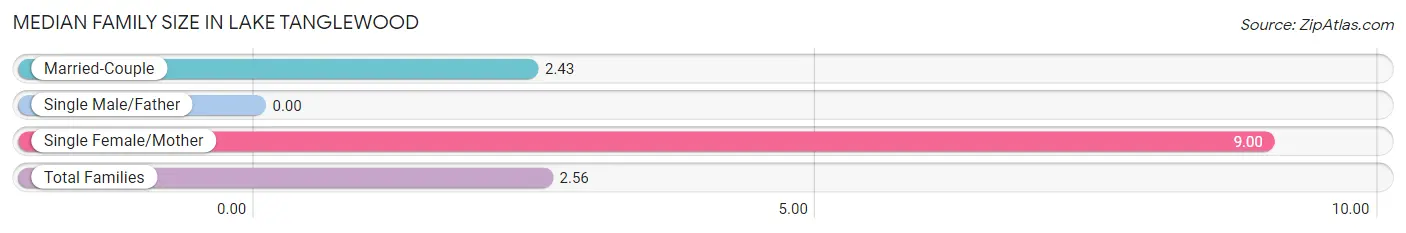
| Family Type | # Families | Family Size |
| Married-Couple | 241 (98.0%) | 2.43 |
| Single Male/Father | 0 (0.0%) | - |
| Single Female/Mother | 5 (2.0%) | 9.00 |
| Total Families | 246 (100.0%) | 2.56 |
Median Household Size in Lake Tanglewood
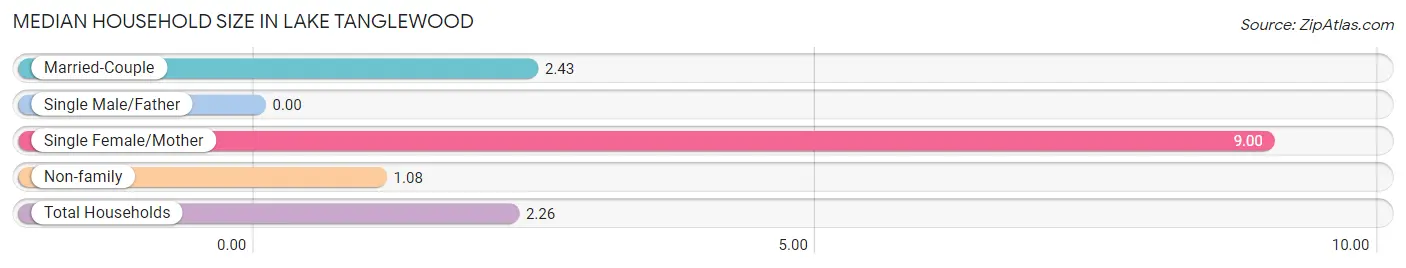
| Household Type | # Households | Household Size |
| Married-Couple | 241 (78.2%) | 2.43 |
| Single Male/Father | 0 (0.0%) | - |
| Single Female/Mother | 5 (1.6%) | 9.00 |
| Non-family | 62 (20.1%) | 1.08 |
| Total Households | 308 (100.0%) | 2.26 |
Household Size by Marriage Status in Lake Tanglewood
Out of a total of 308 households in Lake Tanglewood, 246 (79.9%) are family households, while 62 (20.1%) are nonfamily households. The most numerous type of family households are 2-person households, comprising 178, and the most common type of nonfamily households are 1-person households, comprising 57.
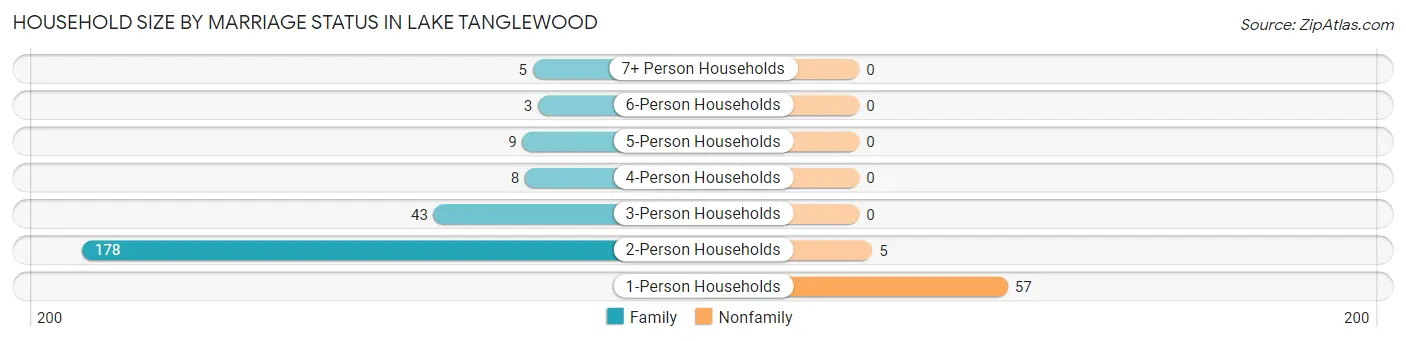
| Household Size | Family Households | Nonfamily Households |
| 1-Person Households | - | 57 (18.5%) |
| 2-Person Households | 178 (57.8%) | 5 (1.6%) |
| 3-Person Households | 43 (14.0%) | 0 (0.0%) |
| 4-Person Households | 8 (2.6%) | 0 (0.0%) |
| 5-Person Households | 9 (2.9%) | 0 (0.0%) |
| 6-Person Households | 3 (1.0%) | 0 (0.0%) |
| 7+ Person Households | 5 (1.6%) | 0 (0.0%) |
| Total | 246 (79.9%) | 62 (20.1%) |
Female Fertility in Lake Tanglewood
Fertility by Age in Lake Tanglewood
Average fertility rate in Lake Tanglewood is 113.0 births per 1,000 women. Women in the age bracket of 20 to 34 years have the highest fertility rate with 182.0 births per 1,000 women. Women in the age bracket of 35 to 50 years acount for 66.7% of all women with births.
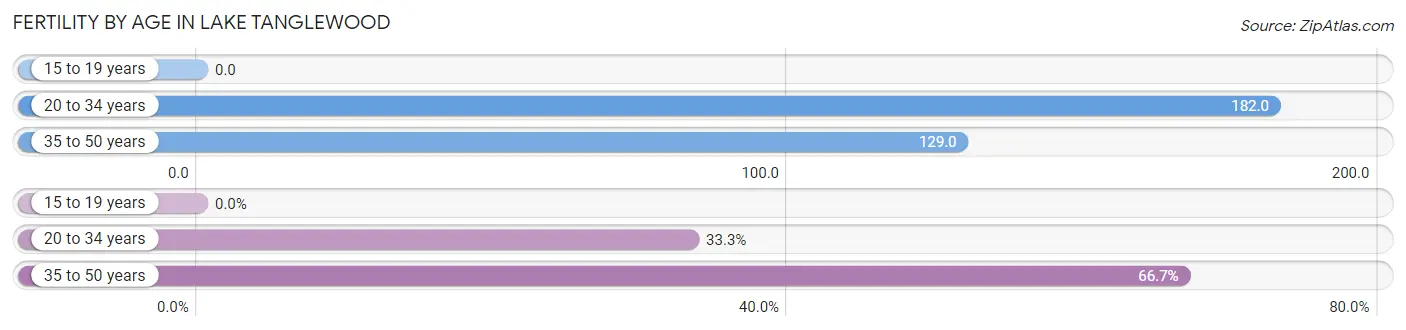
| Age Bracket | Women with Births | Births / 1,000 Women |
| 15 to 19 years | 0 (0.0%) | 0.0 |
| 20 to 34 years | 2 (33.3%) | 182.0 |
| 35 to 50 years | 4 (66.7%) | 129.0 |
| Total | 6 (100.0%) | 113.0 |
Fertility by Age by Marriage Status in Lake Tanglewood
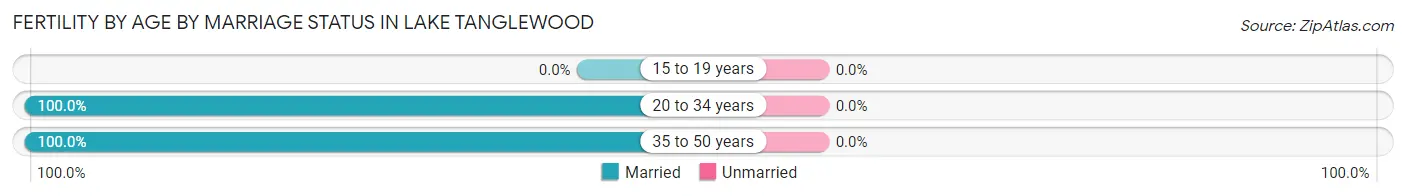
| Age Bracket | Married | Unmarried |
| 15 to 19 years | 0 (0.0%) | 0 (0.0%) |
| 20 to 34 years | 2 (100.0%) | 0 (0.0%) |
| 35 to 50 years | 4 (100.0%) | 0 (0.0%) |
| Total | 6 (100.0%) | 0 (0.0%) |
Fertility by Education in Lake Tanglewood
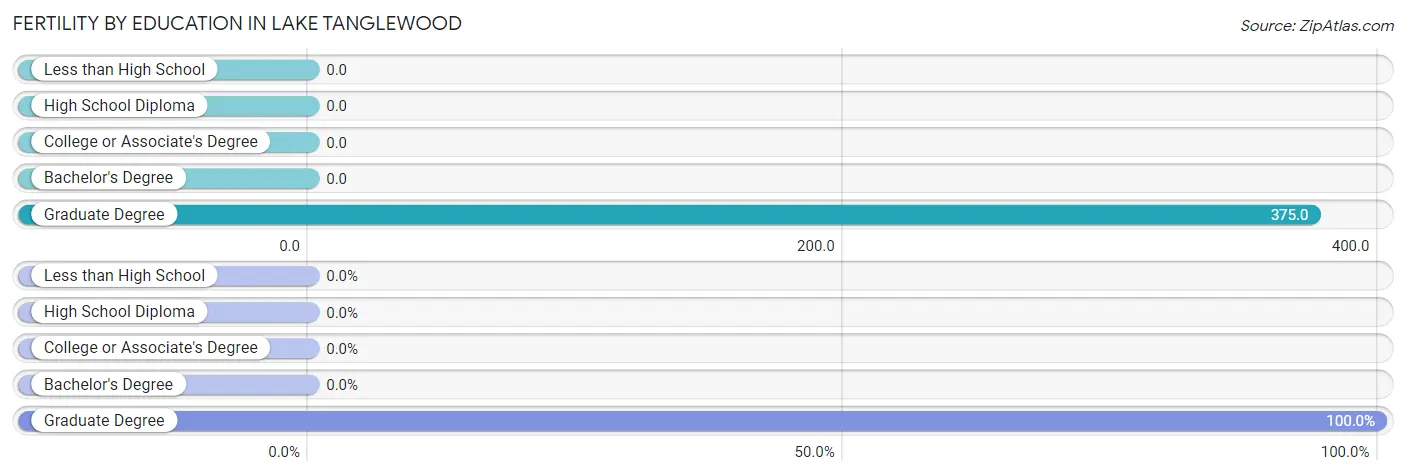
| Educational Attainment | Women with Births | Births / 1,000 Women |
| Less than High School | 0 (0.0%) | 0.0 |
| High School Diploma | 0 (0.0%) | 0.0 |
| College or Associate's Degree | 0 (0.0%) | 0.0 |
| Bachelor's Degree | 0 (0.0%) | 0.0 |
| Graduate Degree | 6 (100.0%) | 375.0 |
| Total | 6 (100.0%) | 113.0 |
Fertility by Education by Marriage Status in Lake Tanglewood
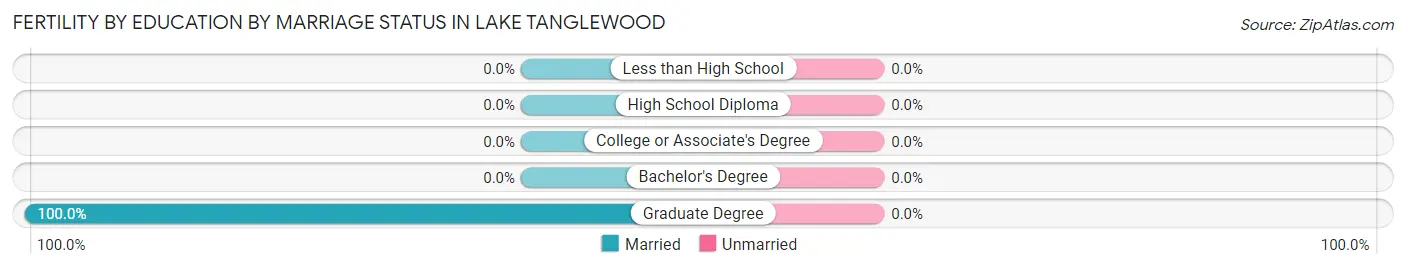
| Educational Attainment | Married | Unmarried |
| Less than High School | 0 (0.0%) | 0 (0.0%) |
| High School Diploma | 0 (0.0%) | 0 (0.0%) |
| College or Associate's Degree | 0 (0.0%) | 0 (0.0%) |
| Bachelor's Degree | 0 (0.0%) | 0 (0.0%) |
| Graduate Degree | 6 (100.0%) | 0 (0.0%) |
| Total | 6 (100.0%) | 0 (0.0%) |
Employment Characteristics in Lake Tanglewood
Employment by Class of Employer in Lake Tanglewood
Among the 334 employed individuals in Lake Tanglewood, private company employees (135 | 40.4%), self-employed (incorporated) (71 | 21.3%), and self-employed (not incorporated) (42 | 12.6%) make up the most common classes of employment.
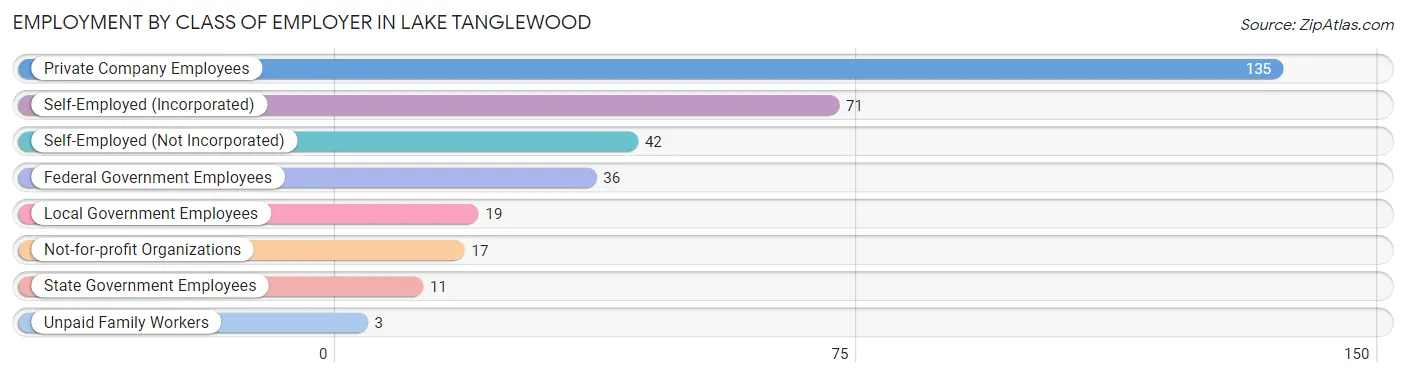
| Employer Class | # Employees | % Employees |
| Private Company Employees | 135 | 40.4% |
| Self-Employed (Incorporated) | 71 | 21.3% |
| Self-Employed (Not Incorporated) | 42 | 12.6% |
| Not-for-profit Organizations | 17 | 5.1% |
| Local Government Employees | 19 | 5.7% |
| State Government Employees | 11 | 3.3% |
| Federal Government Employees | 36 | 10.8% |
| Unpaid Family Workers | 3 | 0.9% |
| Total | 334 | 100.0% |
Employment Status by Age in Lake Tanglewood
According to the labor force statistics for Lake Tanglewood, out of the total population over 16 years of age (626), 55.8% or 349 individuals are in the labor force, with 2.9% or 10 of them unemployed. The age group with the highest labor force participation rate is 20 to 24 years, with 91.3% or 21 individuals in the labor force. Within the labor force, the 35 to 44 years age range has the highest percentage of unemployed individuals, with 12.0% or 3 of them being unemployed.
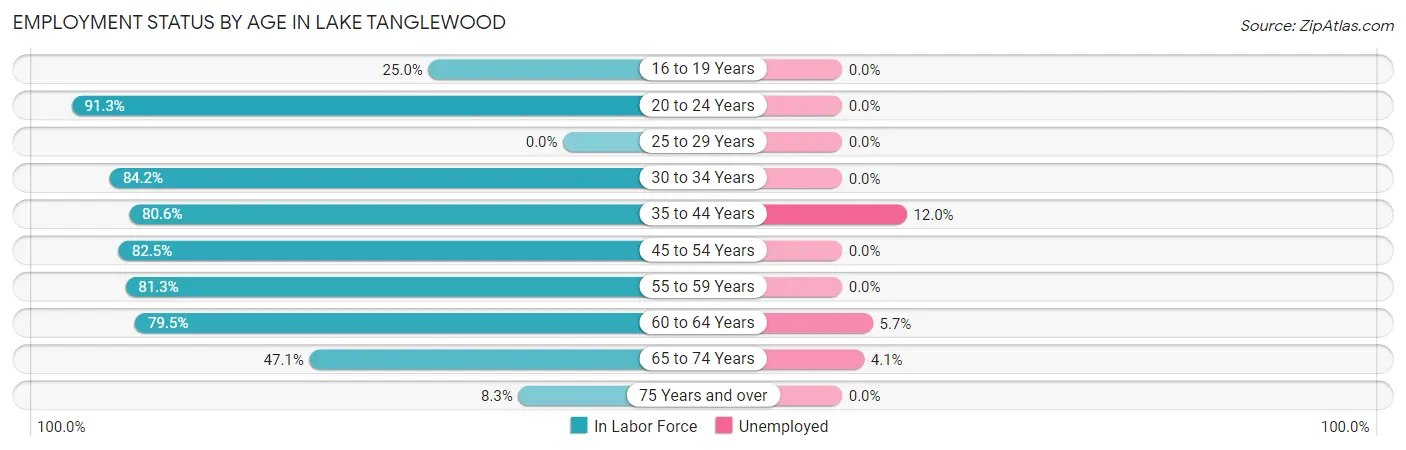
| Age Bracket | In Labor Force | Unemployed |
| 16 to 19 Years | 5 (25.0%) | 0 (0.0%) |
| 20 to 24 Years | 21 (91.3%) | 0 (0.0%) |
| 25 to 29 Years | 0 (0.0%) | 0 (0.0%) |
| 30 to 34 Years | 16 (84.2%) | 0 (0.0%) |
| 35 to 44 Years | 25 (80.6%) | 3 (12.0%) |
| 45 to 54 Years | 66 (82.5%) | 0 (0.0%) |
| 55 to 59 Years | 61 (81.3%) | 0 (0.0%) |
| 60 to 64 Years | 70 (79.5%) | 4 (5.7%) |
| 65 to 74 Years | 74 (47.1%) | 3 (4.1%) |
| 75 Years and over | 11 (8.3%) | 0 (0.0%) |
| Total | 349 (55.8%) | 10 (2.9%) |
Employment Status by Educational Attainment in Lake Tanglewood
According to labor force statistics for Lake Tanglewood, 81.2% of individuals (238) out of the total population between 25 and 64 years of age (293) are in the labor force, with 2.9% or 7 of them being unemployed. The group with the highest labor force participation rate are those with the educational attainment of high school diploma, with 89.5% or 34 individuals in the labor force. Within the labor force, individuals with bachelor's degree or higher education have the highest percentage of unemployment, with 4.2% or 5 of them being unemployed.
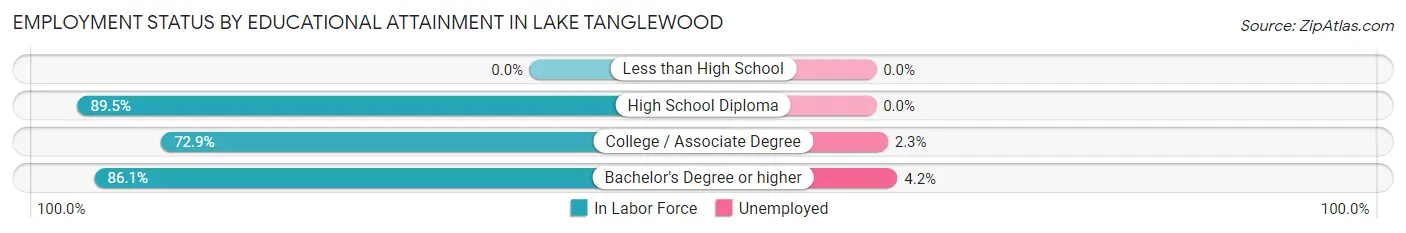
| Educational Attainment | In Labor Force | Unemployed |
| Less than High School | 0 (0.0%) | 0 (0.0%) |
| High School Diploma | 34 (89.5%) | 0 (0.0%) |
| College / Associate Degree | 86 (72.9%) | 3 (2.3%) |
| Bachelor's Degree or higher | 118 (86.1%) | 6 (4.2%) |
| Total | 238 (81.2%) | 8 (2.9%) |
Employment Occupations by Sex in Lake Tanglewood
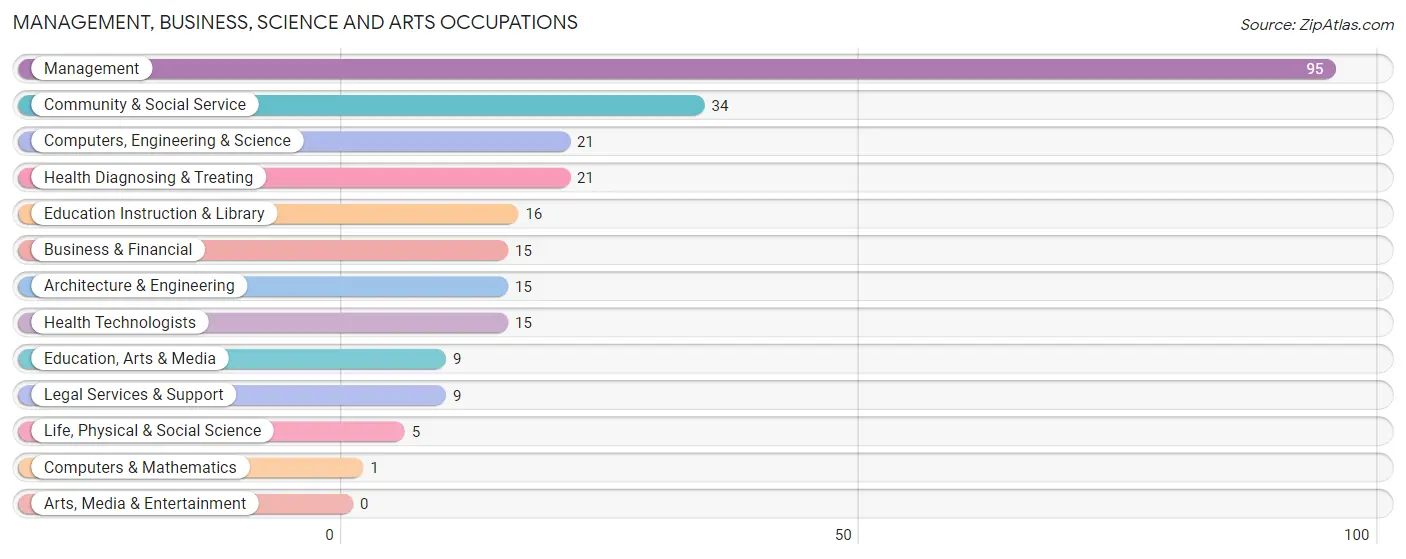
Management, Business, Science and Arts Occupations
The most common Management, Business, Science and Arts occupations in Lake Tanglewood are Management (95 | 28.0%), Community & Social Service (34 | 10.0%), Computers, Engineering & Science (21 | 6.2%), Health Diagnosing & Treating (21 | 6.2%), and Education Instruction & Library (16 | 4.7%).
Management, Business, Science and Arts Occupations by Sex
Within the Management, Business, Science and Arts occupations in Lake Tanglewood, the most male-oriented occupations are Computers & Mathematics (100.0%), Architecture & Engineering (100.0%), and Education, Arts & Media (100.0%), while the most female-oriented occupations are Education Instruction & Library (87.5%), Legal Services & Support (77.8%), and Health Diagnosing & Treating (61.9%).
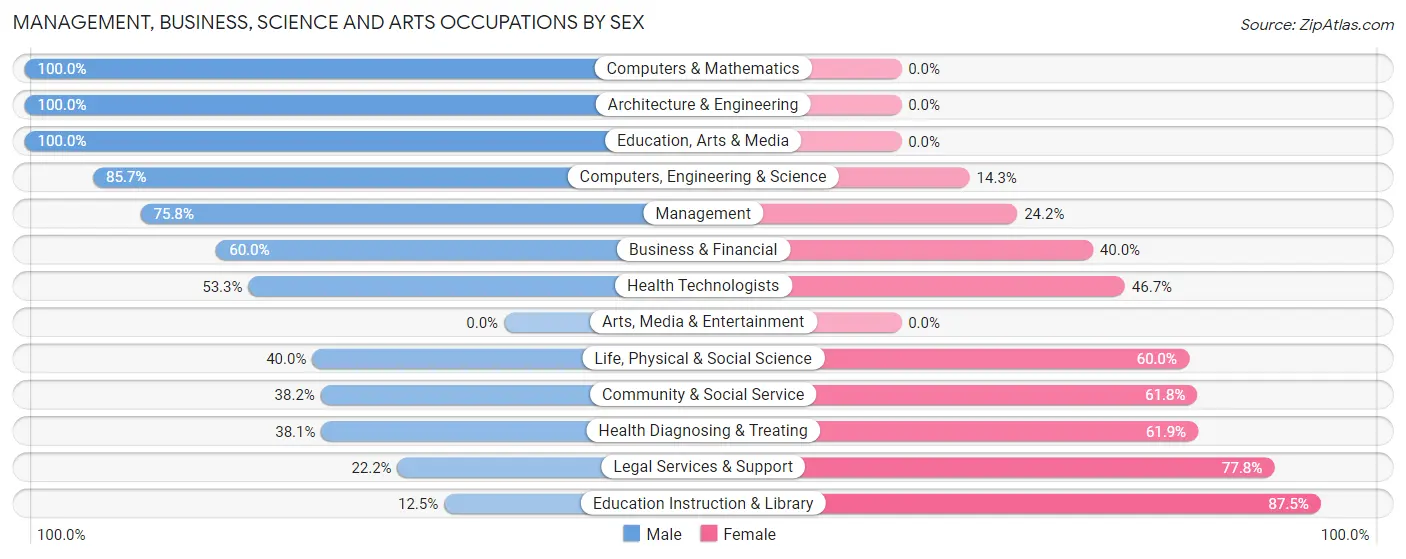
| Occupation | Male | Female |
| Management | 72 (75.8%) | 23 (24.2%) |
| Business & Financial | 9 (60.0%) | 6 (40.0%) |
| Computers, Engineering & Science | 18 (85.7%) | 3 (14.3%) |
| Computers & Mathematics | 1 (100.0%) | 0 (0.0%) |
| Architecture & Engineering | 15 (100.0%) | 0 (0.0%) |
| Life, Physical & Social Science | 2 (40.0%) | 3 (60.0%) |
| Community & Social Service | 13 (38.2%) | 21 (61.8%) |
| Education, Arts & Media | 9 (100.0%) | 0 (0.0%) |
| Legal Services & Support | 2 (22.2%) | 7 (77.8%) |
| Education Instruction & Library | 2 (12.5%) | 14 (87.5%) |
| Arts, Media & Entertainment | 0 (0.0%) | 0 (0.0%) |
| Health Diagnosing & Treating | 8 (38.1%) | 13 (61.9%) |
| Health Technologists | 8 (53.3%) | 7 (46.7%) |
| Total (Category) | 120 (64.5%) | 66 (35.5%) |
| Total (Overall) | 226 (66.7%) | 113 (33.3%) |
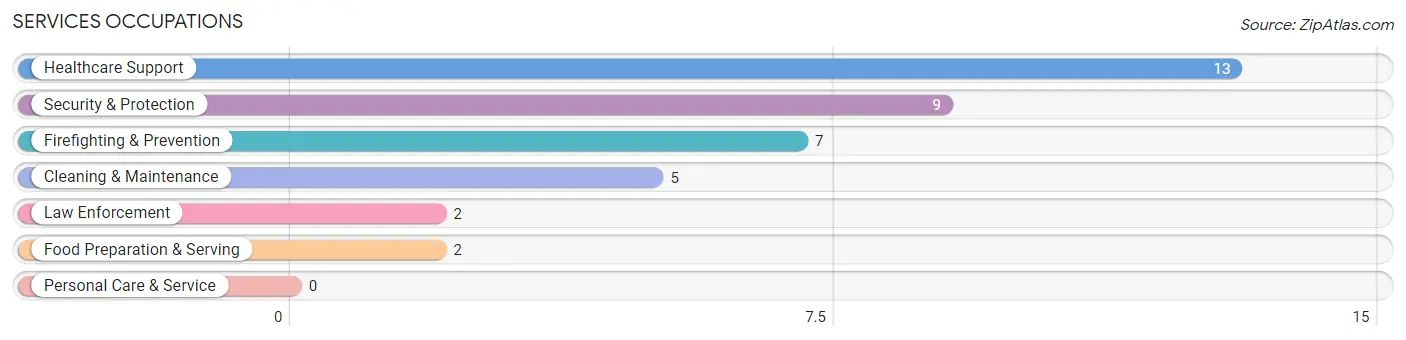
Services Occupations
The most common Services occupations in Lake Tanglewood are Healthcare Support (13 | 3.8%), Security & Protection (9 | 2.6%), Firefighting & Prevention (7 | 2.1%), Cleaning & Maintenance (5 | 1.5%), and Law Enforcement (2 | 0.6%).
Services Occupations by Sex
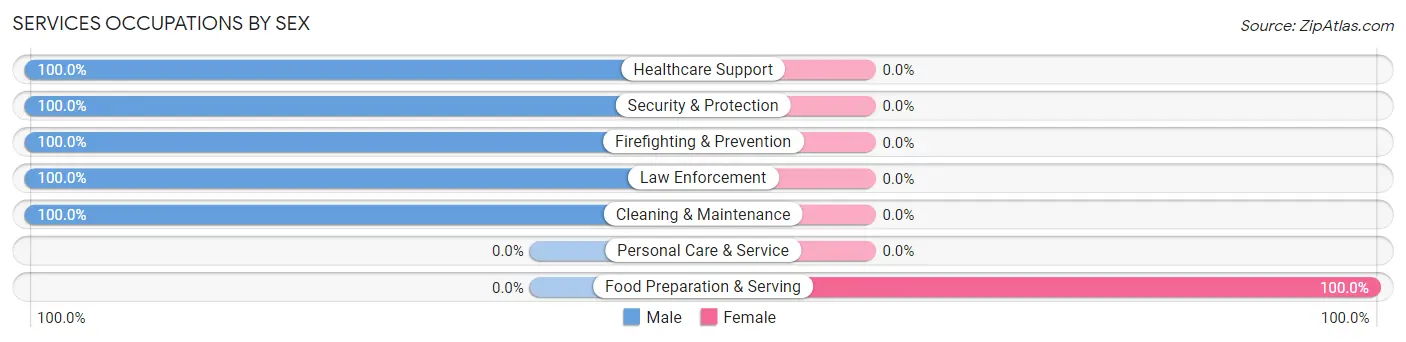
| Occupation | Male | Female |
| Healthcare Support | 13 (100.0%) | 0 (0.0%) |
| Security & Protection | 9 (100.0%) | 0 (0.0%) |
| Firefighting & Prevention | 7 (100.0%) | 0 (0.0%) |
| Law Enforcement | 2 (100.0%) | 0 (0.0%) |
| Food Preparation & Serving | 0 (0.0%) | 2 (100.0%) |
| Cleaning & Maintenance | 5 (100.0%) | 0 (0.0%) |
| Personal Care & Service | 0 (0.0%) | 0 (0.0%) |
| Total (Category) | 27 (93.1%) | 2 (6.9%) |
| Total (Overall) | 226 (66.7%) | 113 (33.3%) |
Sales and Office Occupations
The most common Sales and Office occupations in Lake Tanglewood are Sales & Related (59 | 17.4%), and Office & Administration (39 | 11.5%).
Sales and Office Occupations by Sex
| Occupation | Male | Female |
| Sales & Related | 51 (86.4%) | 8 (13.6%) |
| Office & Administration | 2 (5.1%) | 37 (94.9%) |
| Total (Category) | 53 (54.1%) | 45 (45.9%) |
| Total (Overall) | 226 (66.7%) | 113 (33.3%) |
Natural Resources, Construction and Maintenance Occupations
The most common Natural Resources, Construction and Maintenance occupations in Lake Tanglewood are Installation, Maintenance & Repair (7 | 2.1%), and Construction & Extraction (5 | 1.5%).
Natural Resources, Construction and Maintenance Occupations by Sex
| Occupation | Male | Female |
| Farming, Fishing & Forestry | 0 (0.0%) | 0 (0.0%) |
| Construction & Extraction | 5 (100.0%) | 0 (0.0%) |
| Installation, Maintenance & Repair | 7 (100.0%) | 0 (0.0%) |
| Total (Category) | 12 (100.0%) | 0 (0.0%) |
| Total (Overall) | 226 (66.7%) | 113 (33.3%) |
Production, Transportation and Moving Occupations
The most common Production, Transportation and Moving occupations in Lake Tanglewood are Transportation (8 | 2.4%), Material Moving (4 | 1.2%), and Production (2 | 0.6%).
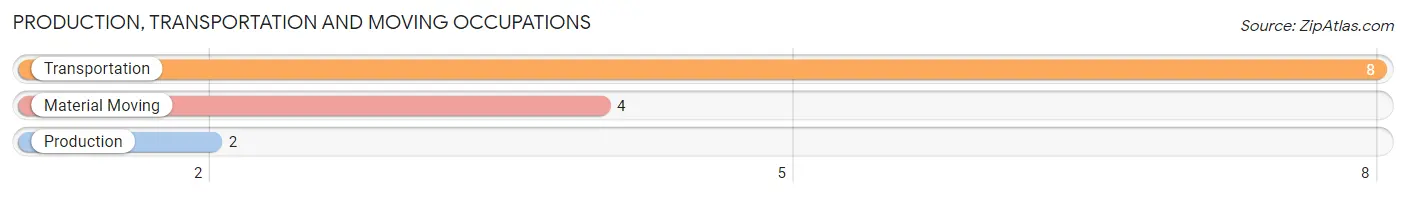
Production, Transportation and Moving Occupations by Sex
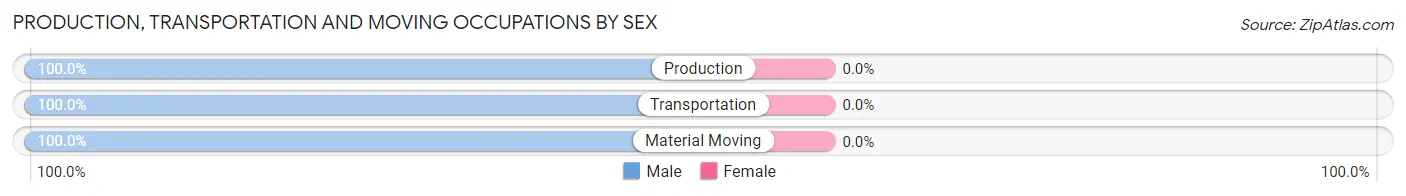
| Occupation | Male | Female |
| Production | 2 (100.0%) | 0 (0.0%) |
| Transportation | 8 (100.0%) | 0 (0.0%) |
| Material Moving | 4 (100.0%) | 0 (0.0%) |
| Total (Category) | 14 (100.0%) | 0 (0.0%) |
| Total (Overall) | 226 (66.7%) | 113 (33.3%) |
Employment Industries by Sex in Lake Tanglewood
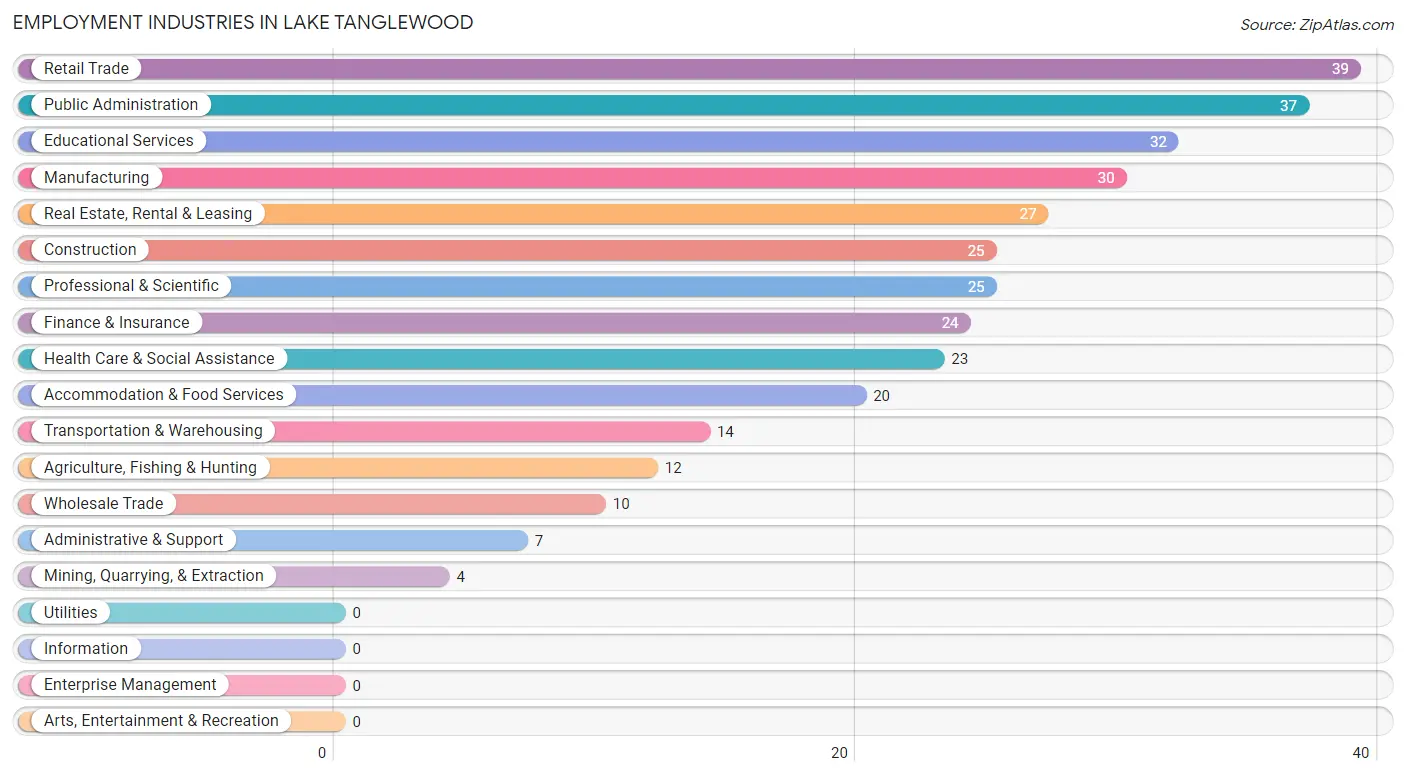
Employment Industries in Lake Tanglewood
The major employment industries in Lake Tanglewood include Retail Trade (39 | 11.5%), Public Administration (37 | 10.9%), Educational Services (32 | 9.4%), Manufacturing (30 | 8.8%), and Real Estate, Rental & Leasing (27 | 8.0%).
Employment Industries by Sex in Lake Tanglewood
The Lake Tanglewood industries that see more men than women are Wholesale Trade (100.0%), Administrative & Support (100.0%), and Finance & Insurance (91.7%), whereas the industries that tend to have a higher number of women are Educational Services (93.8%), Health Care & Social Assistance (60.9%), and Agriculture, Fishing & Hunting (50.0%).
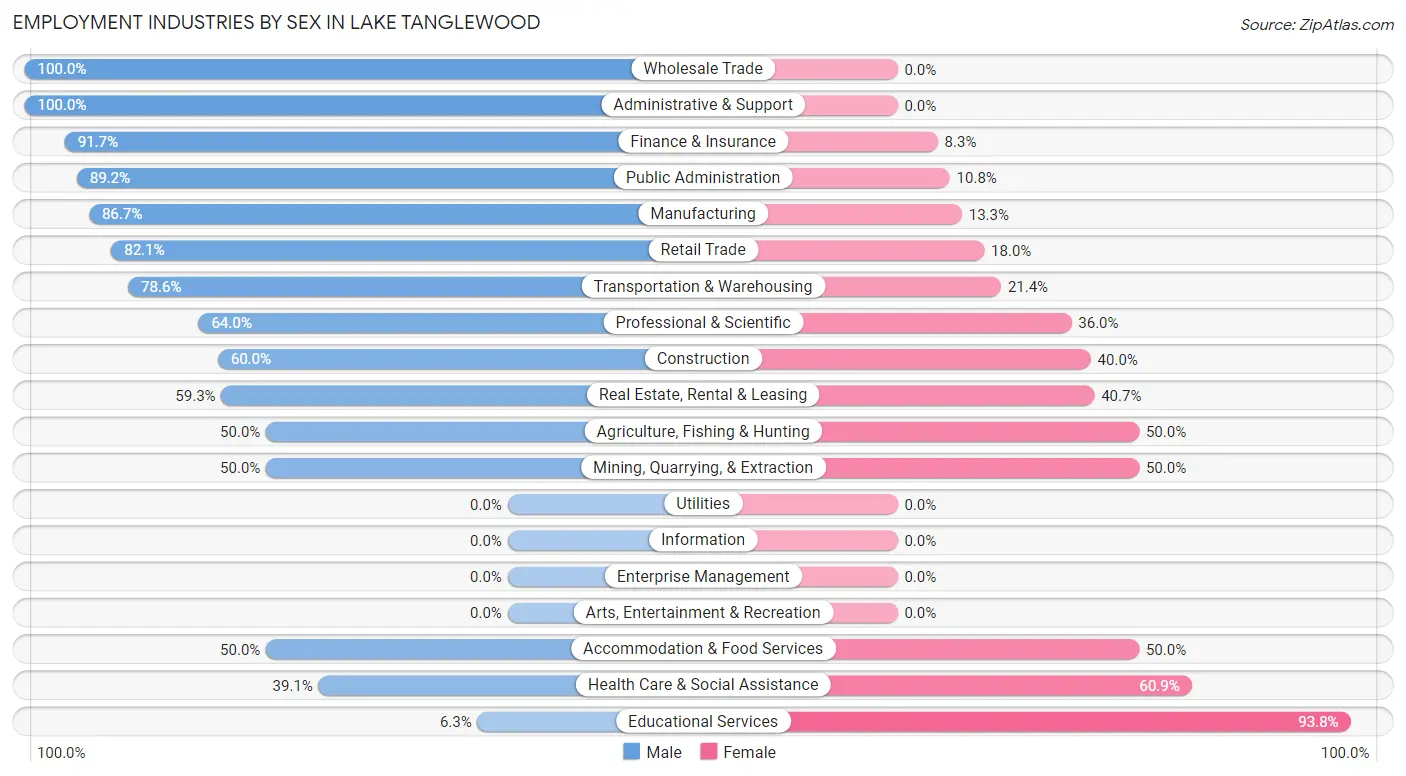
| Industry | Male | Female |
| Agriculture, Fishing & Hunting | 6 (50.0%) | 6 (50.0%) |
| Mining, Quarrying, & Extraction | 2 (50.0%) | 2 (50.0%) |
| Construction | 15 (60.0%) | 10 (40.0%) |
| Manufacturing | 26 (86.7%) | 4 (13.3%) |
| Wholesale Trade | 10 (100.0%) | 0 (0.0%) |
| Retail Trade | 32 (82.1%) | 7 (17.9%) |
| Transportation & Warehousing | 11 (78.6%) | 3 (21.4%) |
| Utilities | 0 (0.0%) | 0 (0.0%) |
| Information | 0 (0.0%) | 0 (0.0%) |
| Finance & Insurance | 22 (91.7%) | 2 (8.3%) |
| Real Estate, Rental & Leasing | 16 (59.3%) | 11 (40.7%) |
| Professional & Scientific | 16 (64.0%) | 9 (36.0%) |
| Enterprise Management | 0 (0.0%) | 0 (0.0%) |
| Administrative & Support | 7 (100.0%) | 0 (0.0%) |
| Educational Services | 2 (6.2%) | 30 (93.8%) |
| Health Care & Social Assistance | 9 (39.1%) | 14 (60.9%) |
| Arts, Entertainment & Recreation | 0 (0.0%) | 0 (0.0%) |
| Accommodation & Food Services | 10 (50.0%) | 10 (50.0%) |
| Public Administration | 33 (89.2%) | 4 (10.8%) |
| Total | 226 (66.7%) | 113 (33.3%) |
Education in Lake Tanglewood
School Enrollment in Lake Tanglewood
The most common levels of schooling among the 58 students in Lake Tanglewood are high school (20 | 34.5%), middle school (12 | 20.7%), and elementary school (10 | 17.2%).
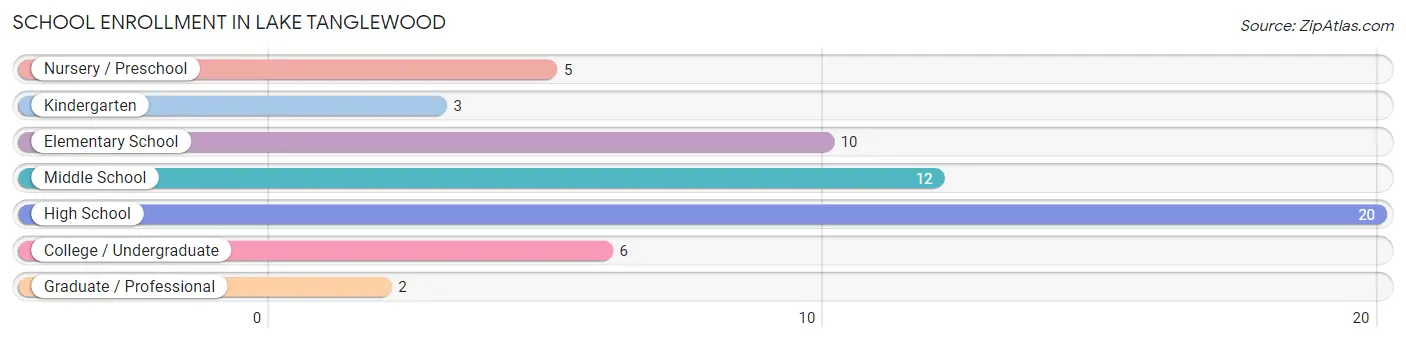
| School Level | # Students | % Students |
| Nursery / Preschool | 5 | 8.6% |
| Kindergarten | 3 | 5.2% |
| Elementary School | 10 | 17.2% |
| Middle School | 12 | 20.7% |
| High School | 20 | 34.5% |
| College / Undergraduate | 6 | 10.3% |
| Graduate / Professional | 2 | 3.5% |
| Total | 58 | 100.0% |
School Enrollment by Age by Funding Source in Lake Tanglewood
Out of a total of 58 students who are enrolled in schools in Lake Tanglewood, 20 (34.5%) attend a private institution, while the remaining 38 (65.5%) are enrolled in public schools. The age group of 3 to 4 year olds has the highest likelihood of being enrolled in private schools, with 3 (100.0% in the age bracket) enrolled. Conversely, the age group of 10 to 14 year olds has the lowest likelihood of being enrolled in a private school, with 12 (100.0% in the age bracket) attending a public institution.
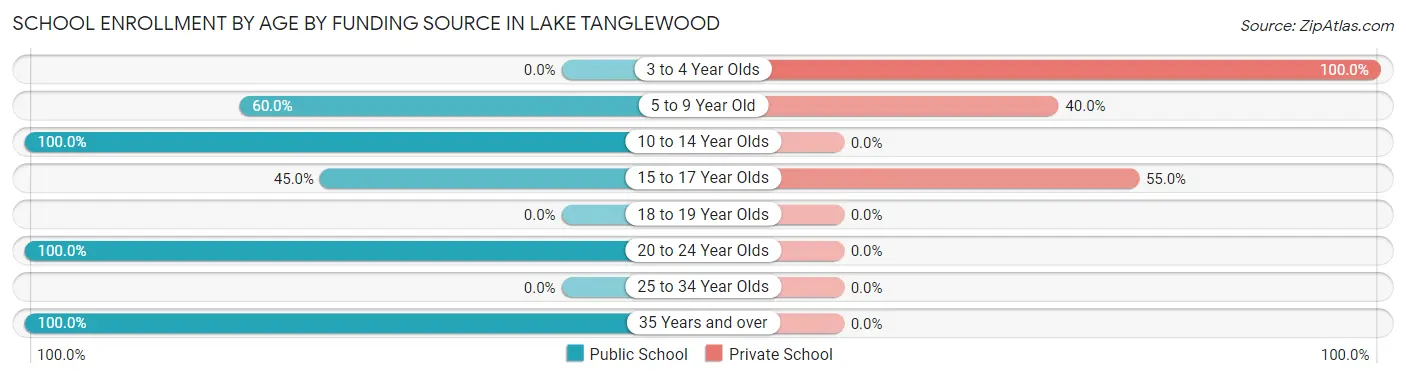
| Age Bracket | Public School | Private School |
| 3 to 4 Year Olds | 0 (0.0%) | 3 (100.0%) |
| 5 to 9 Year Old | 9 (60.0%) | 6 (40.0%) |
| 10 to 14 Year Olds | 12 (100.0%) | 0 (0.0%) |
| 15 to 17 Year Olds | 9 (45.0%) | 11 (55.0%) |
| 18 to 19 Year Olds | 0 (0.0%) | 0 (0.0%) |
| 20 to 24 Year Olds | 6 (100.0%) | 0 (0.0%) |
| 25 to 34 Year Olds | 0 (0.0%) | 0 (0.0%) |
| 35 Years and over | 2 (100.0%) | 0 (0.0%) |
| Total | 38 (65.5%) | 20 (34.5%) |
Educational Attainment by Field of Study in Lake Tanglewood
Business (144 | 46.8%), education (35 | 11.4%), bio, nature & agricultural (24 | 7.8%), engineering (20 | 6.5%), and arts & humanities (17 | 5.5%) are the most common fields of study among 308 individuals in Lake Tanglewood who have obtained a bachelor's degree or higher.
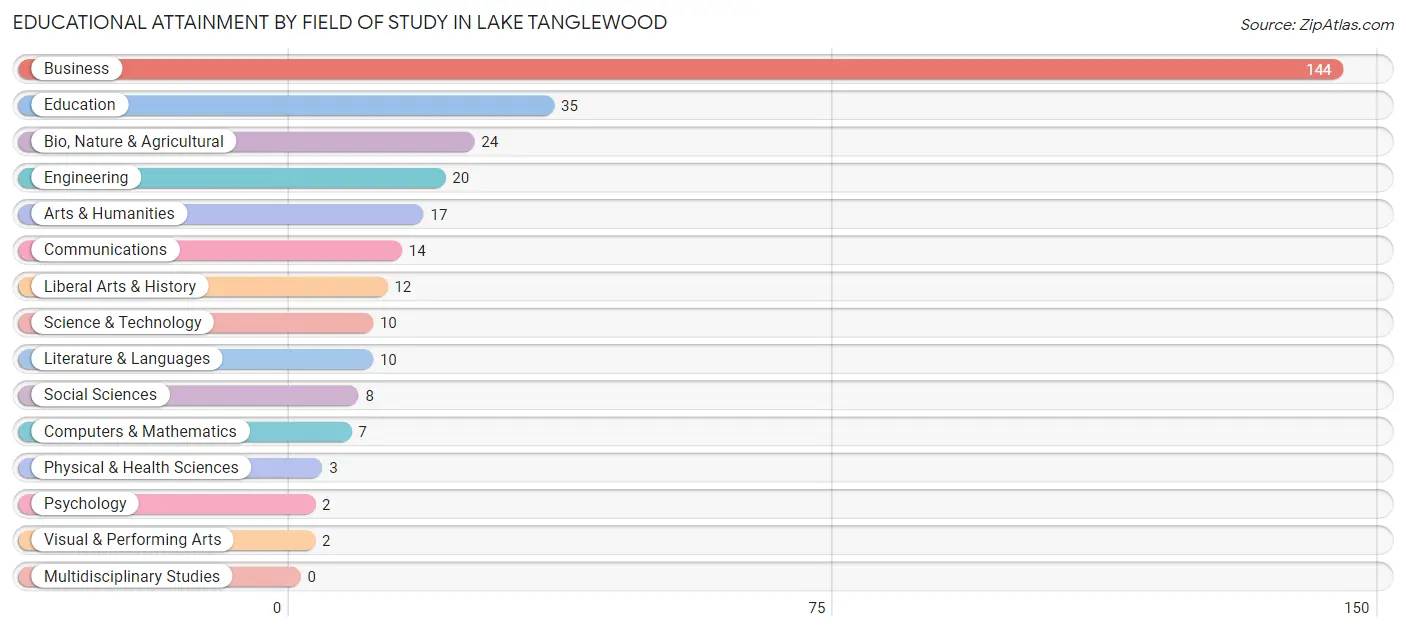
| Field of Study | # Graduates | % Graduates |
| Computers & Mathematics | 7 | 2.3% |
| Bio, Nature & Agricultural | 24 | 7.8% |
| Physical & Health Sciences | 3 | 1.0% |
| Psychology | 2 | 0.6% |
| Social Sciences | 8 | 2.6% |
| Engineering | 20 | 6.5% |
| Multidisciplinary Studies | 0 | 0.0% |
| Science & Technology | 10 | 3.3% |
| Business | 144 | 46.8% |
| Education | 35 | 11.4% |
| Literature & Languages | 10 | 3.3% |
| Liberal Arts & History | 12 | 3.9% |
| Visual & Performing Arts | 2 | 0.6% |
| Communications | 14 | 4.5% |
| Arts & Humanities | 17 | 5.5% |
| Total | 308 | 100.0% |
Transportation & Commute in Lake Tanglewood
Vehicle Availability by Sex in Lake Tanglewood
The most prevalent vehicle ownership categories in Lake Tanglewood are males with 2 vehicles (102, accounting for 45.1%) and females with 2 vehicles (53, making up 94.4%).
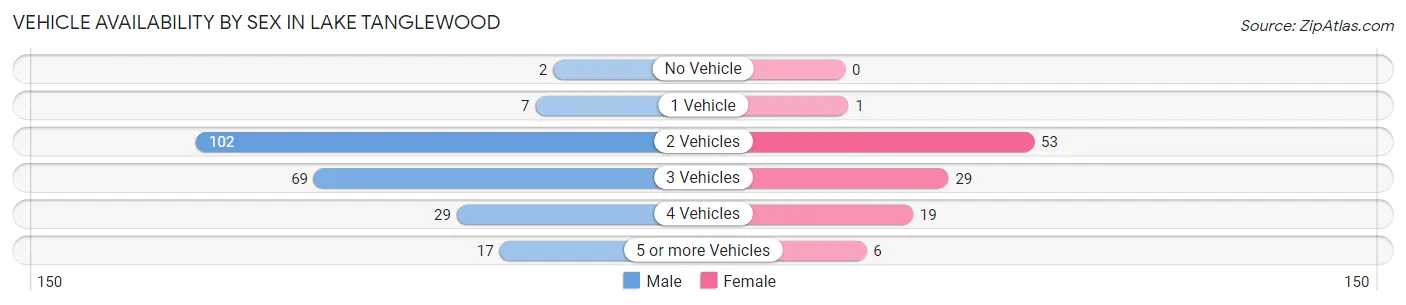
| Vehicles Available | Male | Female |
| No Vehicle | 2 (0.9%) | 0 (0.0%) |
| 1 Vehicle | 7 (3.1%) | 1 (0.9%) |
| 2 Vehicles | 102 (45.1%) | 53 (49.1%) |
| 3 Vehicles | 69 (30.5%) | 29 (26.9%) |
| 4 Vehicles | 29 (12.8%) | 19 (17.6%) |
| 5 or more Vehicles | 17 (7.5%) | 6 (5.6%) |
| Total | 226 (100.0%) | 108 (100.0%) |
Commute Time in Lake Tanglewood
The most frequently occuring commute durations in Lake Tanglewood are 20 to 24 minutes (124 commuters, 40.5%), 30 to 34 minutes (46 commuters, 15.0%), and 15 to 19 minutes (42 commuters, 13.7%).
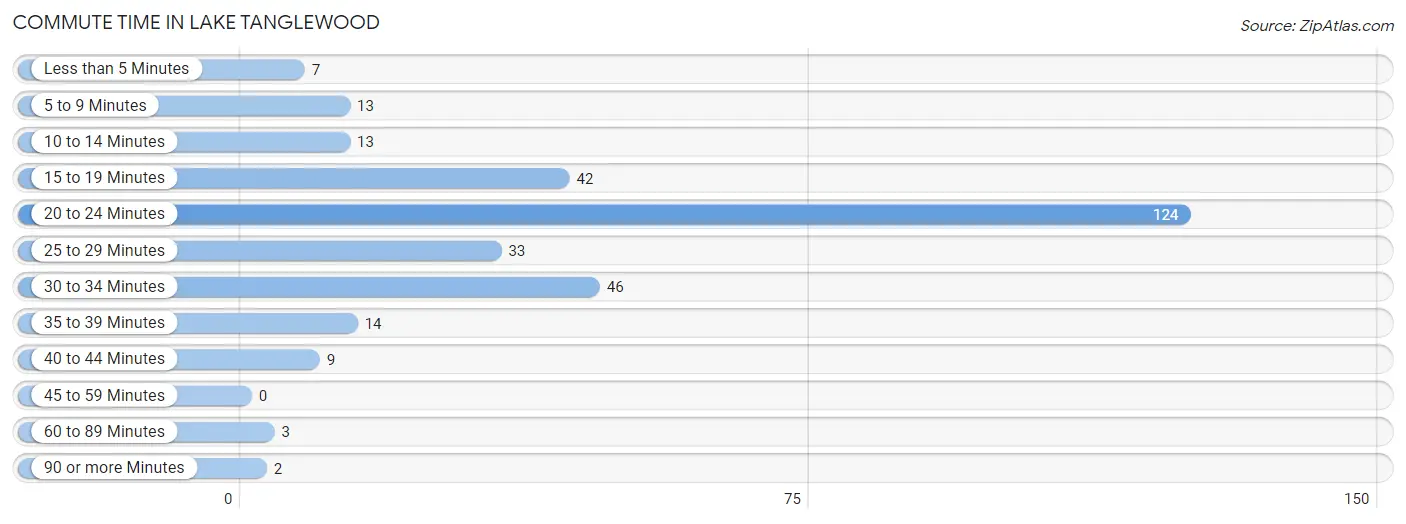
| Commute Time | # Commuters | % Commuters |
| Less than 5 Minutes | 7 | 2.3% |
| 5 to 9 Minutes | 13 | 4.3% |
| 10 to 14 Minutes | 13 | 4.3% |
| 15 to 19 Minutes | 42 | 13.7% |
| 20 to 24 Minutes | 124 | 40.5% |
| 25 to 29 Minutes | 33 | 10.8% |
| 30 to 34 Minutes | 46 | 15.0% |
| 35 to 39 Minutes | 14 | 4.6% |
| 40 to 44 Minutes | 9 | 2.9% |
| 45 to 59 Minutes | 0 | 0.0% |
| 60 to 89 Minutes | 3 | 1.0% |
| 90 or more Minutes | 2 | 0.6% |
Commute Time by Sex in Lake Tanglewood
The most common commute times in Lake Tanglewood are 20 to 24 minutes (80 commuters, 38.1%) for males and 20 to 24 minutes (44 commuters, 45.8%) for females.
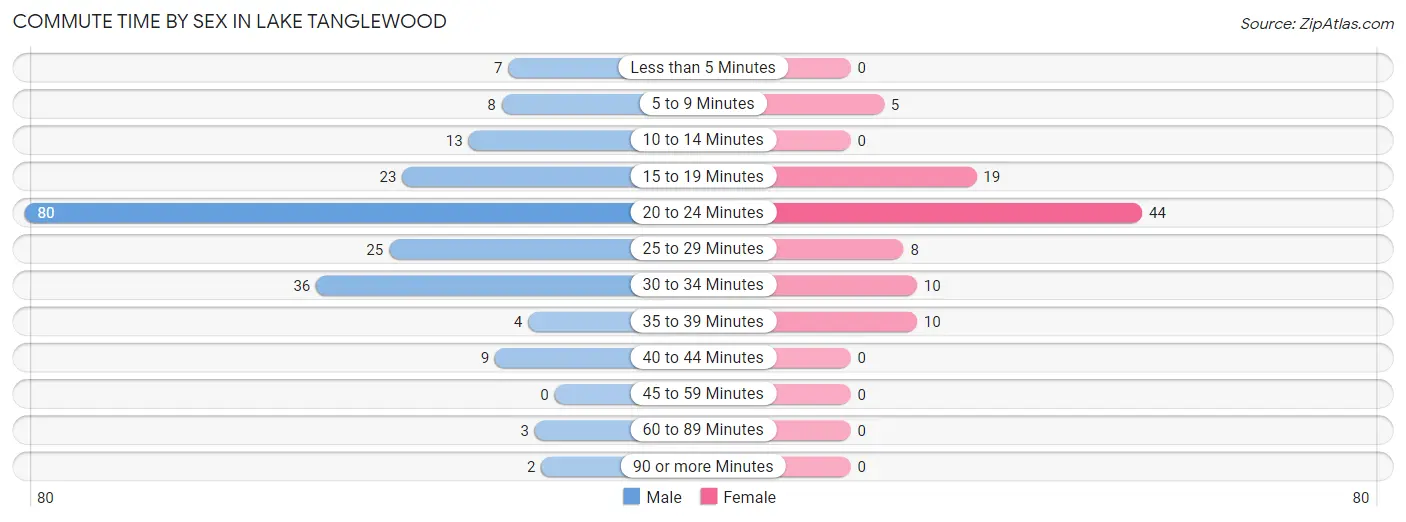
| Commute Time | Male | Female |
| Less than 5 Minutes | 7 (3.3%) | 0 (0.0%) |
| 5 to 9 Minutes | 8 (3.8%) | 5 (5.2%) |
| 10 to 14 Minutes | 13 (6.2%) | 0 (0.0%) |
| 15 to 19 Minutes | 23 (11.0%) | 19 (19.8%) |
| 20 to 24 Minutes | 80 (38.1%) | 44 (45.8%) |
| 25 to 29 Minutes | 25 (11.9%) | 8 (8.3%) |
| 30 to 34 Minutes | 36 (17.1%) | 10 (10.4%) |
| 35 to 39 Minutes | 4 (1.9%) | 10 (10.4%) |
| 40 to 44 Minutes | 9 (4.3%) | 0 (0.0%) |
| 45 to 59 Minutes | 0 (0.0%) | 0 (0.0%) |
| 60 to 89 Minutes | 3 (1.4%) | 0 (0.0%) |
| 90 or more Minutes | 2 (0.9%) | 0 (0.0%) |
Time of Departure to Work by Sex in Lake Tanglewood
The most frequent times of departure to work in Lake Tanglewood are 8:00 AM to 8:29 AM (41, 19.5%) for males and 7:00 AM to 7:29 AM (20, 20.8%) for females.
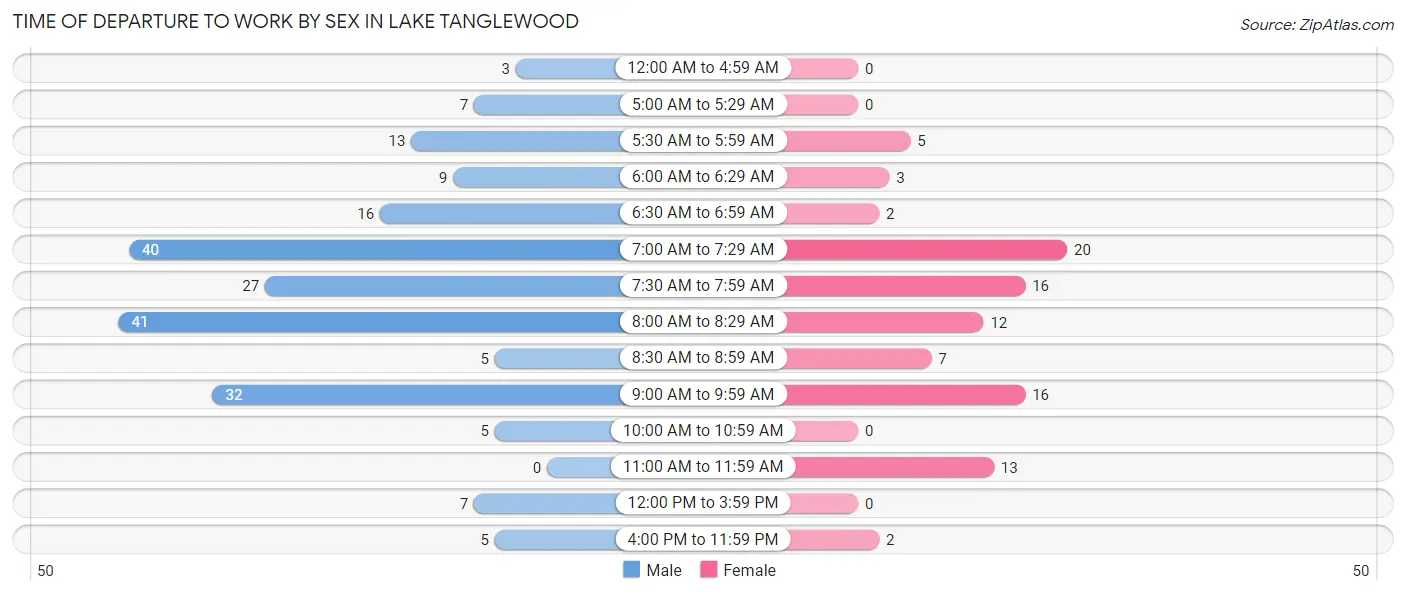
| Time of Departure | Male | Female |
| 12:00 AM to 4:59 AM | 3 (1.4%) | 0 (0.0%) |
| 5:00 AM to 5:29 AM | 7 (3.3%) | 0 (0.0%) |
| 5:30 AM to 5:59 AM | 13 (6.2%) | 5 (5.2%) |
| 6:00 AM to 6:29 AM | 9 (4.3%) | 3 (3.1%) |
| 6:30 AM to 6:59 AM | 16 (7.6%) | 2 (2.1%) |
| 7:00 AM to 7:29 AM | 40 (19.1%) | 20 (20.8%) |
| 7:30 AM to 7:59 AM | 27 (12.9%) | 16 (16.7%) |
| 8:00 AM to 8:29 AM | 41 (19.5%) | 12 (12.5%) |
| 8:30 AM to 8:59 AM | 5 (2.4%) | 7 (7.3%) |
| 9:00 AM to 9:59 AM | 32 (15.2%) | 16 (16.7%) |
| 10:00 AM to 10:59 AM | 5 (2.4%) | 0 (0.0%) |
| 11:00 AM to 11:59 AM | 0 (0.0%) | 13 (13.5%) |
| 12:00 PM to 3:59 PM | 7 (3.3%) | 0 (0.0%) |
| 4:00 PM to 11:59 PM | 5 (2.4%) | 2 (2.1%) |
| Total | 210 (100.0%) | 96 (100.0%) |
Housing Occupancy in Lake Tanglewood
Occupancy by Ownership in Lake Tanglewood
Of the total 308 dwellings in Lake Tanglewood, owner-occupied units account for 304 (98.7%), while renter-occupied units make up 4 (1.3%).
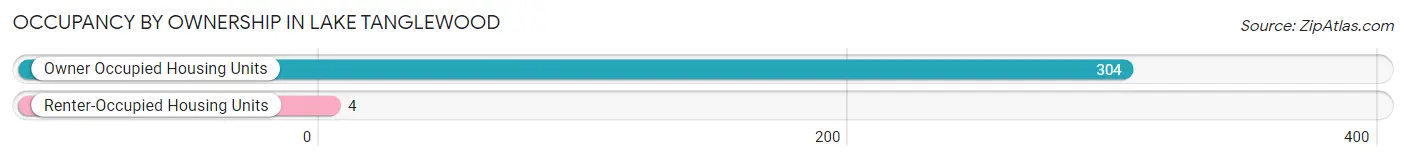
| Occupancy | # Housing Units | % Housing Units |
| Owner Occupied Housing Units | 304 | 98.7% |
| Renter-Occupied Housing Units | 4 | 1.3% |
| Total Occupied Housing Units | 308 | 100.0% |
Occupancy by Household Size in Lake Tanglewood
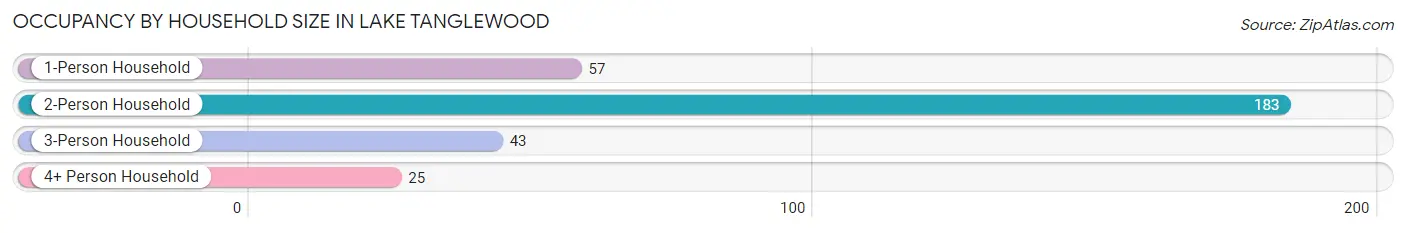
| Household Size | # Housing Units | % Housing Units |
| 1-Person Household | 57 | 18.5% |
| 2-Person Household | 183 | 59.4% |
| 3-Person Household | 43 | 14.0% |
| 4+ Person Household | 25 | 8.1% |
| Total Housing Units | 308 | 100.0% |
Occupancy by Ownership by Household Size in Lake Tanglewood
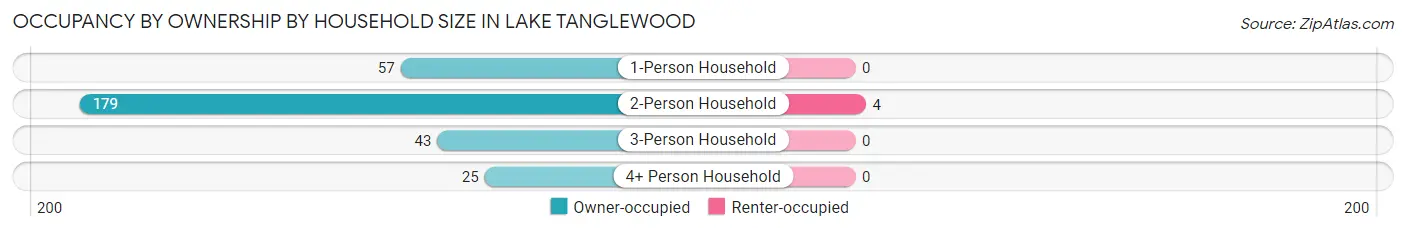
| Household Size | Owner-occupied | Renter-occupied |
| 1-Person Household | 57 (100.0%) | 0 (0.0%) |
| 2-Person Household | 179 (97.8%) | 4 (2.2%) |
| 3-Person Household | 43 (100.0%) | 0 (0.0%) |
| 4+ Person Household | 25 (100.0%) | 0 (0.0%) |
| Total Housing Units | 304 (98.7%) | 4 (1.3%) |
Occupancy by Educational Attainment in Lake Tanglewood
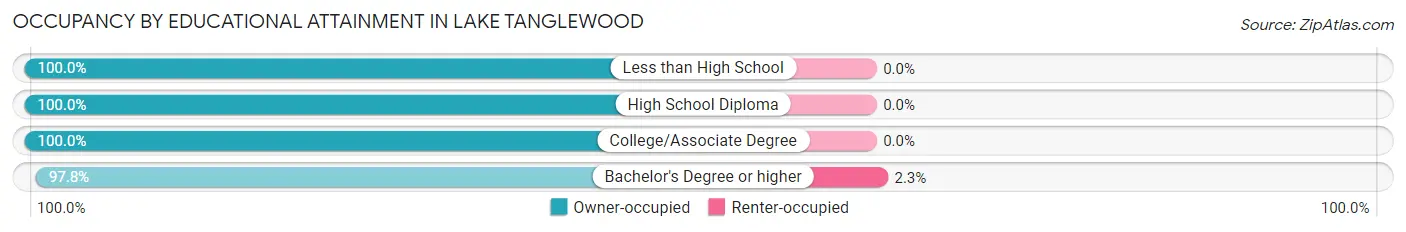
| Household Size | Owner-occupied | Renter-occupied |
| Less than High School | 7 (100.0%) | 0 (0.0%) |
| High School Diploma | 51 (100.0%) | 0 (0.0%) |
| College/Associate Degree | 72 (100.0%) | 0 (0.0%) |
| Bachelor's Degree or higher | 174 (97.8%) | 4 (2.2%) |
Occupancy by Age of Householder in Lake Tanglewood
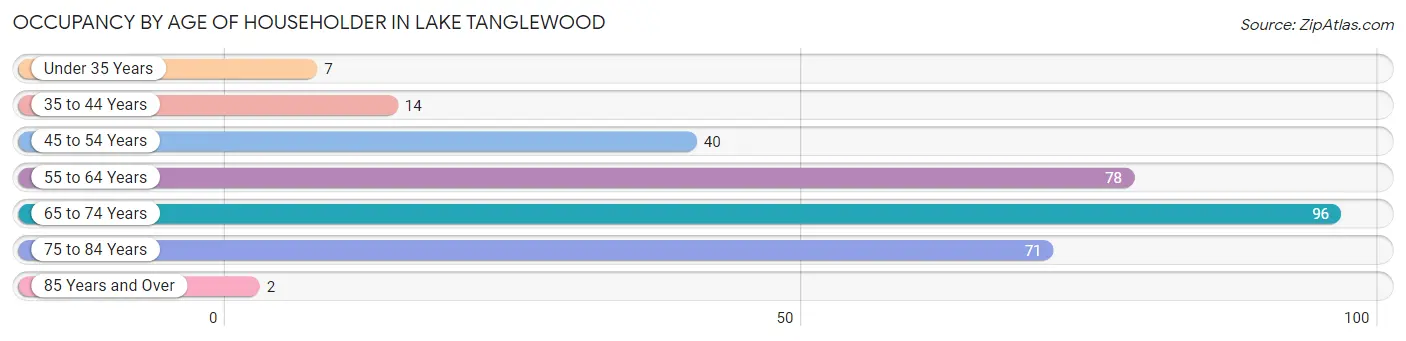
| Age Bracket | # Households | % Households |
| Under 35 Years | 7 | 2.3% |
| 35 to 44 Years | 14 | 4.5% |
| 45 to 54 Years | 40 | 13.0% |
| 55 to 64 Years | 78 | 25.3% |
| 65 to 74 Years | 96 | 31.2% |
| 75 to 84 Years | 71 | 23.1% |
| 85 Years and Over | 2 | 0.6% |
| Total | 308 | 100.0% |
Housing Finances in Lake Tanglewood
Median Income by Occupancy in Lake Tanglewood
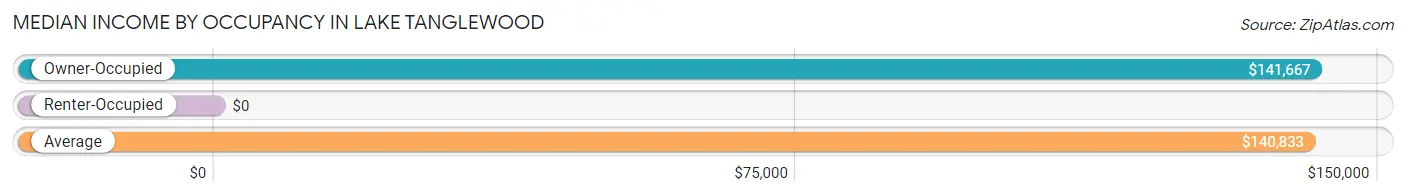
| Occupancy Type | # Households | Median Income |
| Owner-Occupied | 304 (98.7%) | $141,667 |
| Renter-Occupied | 4 (1.3%) | $0 |
| Average | 308 (100.0%) | $140,833 |
Occupancy by Householder Income Bracket in Lake Tanglewood
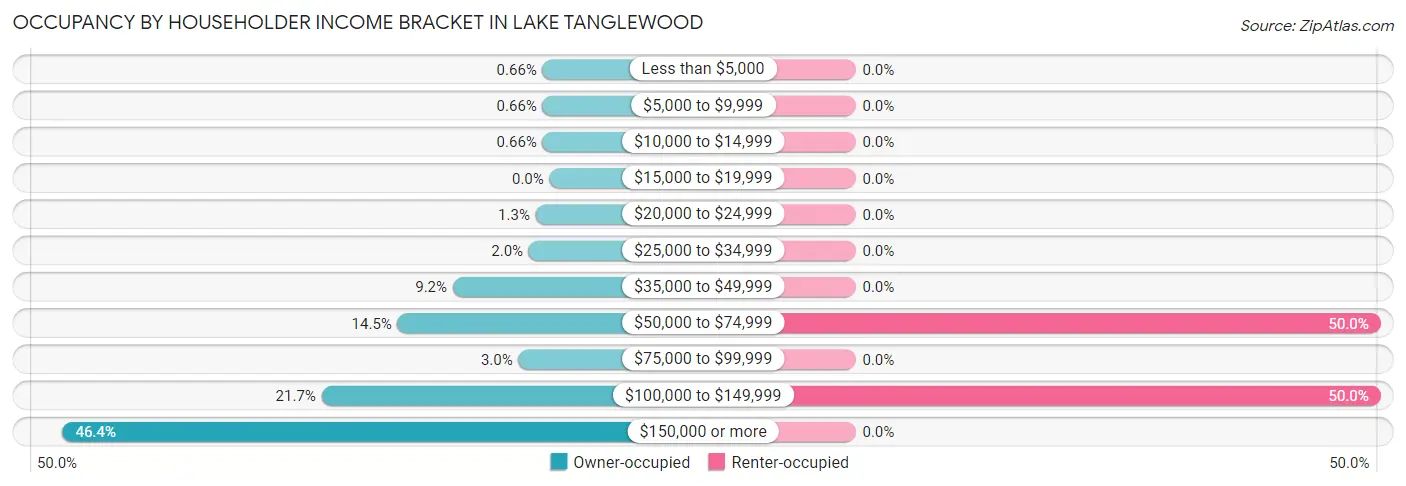
| Income Bracket | Owner-occupied | Renter-occupied |
| Less than $5,000 | 2 (0.7%) | 0 (0.0%) |
| $5,000 to $9,999 | 2 (0.7%) | 0 (0.0%) |
| $10,000 to $14,999 | 2 (0.7%) | 0 (0.0%) |
| $15,000 to $19,999 | 0 (0.0%) | 0 (0.0%) |
| $20,000 to $24,999 | 4 (1.3%) | 0 (0.0%) |
| $25,000 to $34,999 | 6 (2.0%) | 0 (0.0%) |
| $35,000 to $49,999 | 28 (9.2%) | 0 (0.0%) |
| $50,000 to $74,999 | 44 (14.5%) | 2 (50.0%) |
| $75,000 to $99,999 | 9 (3.0%) | 0 (0.0%) |
| $100,000 to $149,999 | 66 (21.7%) | 2 (50.0%) |
| $150,000 or more | 141 (46.4%) | 0 (0.0%) |
| Total | 304 (100.0%) | 4 (100.0%) |
Monthly Housing Cost Tiers in Lake Tanglewood
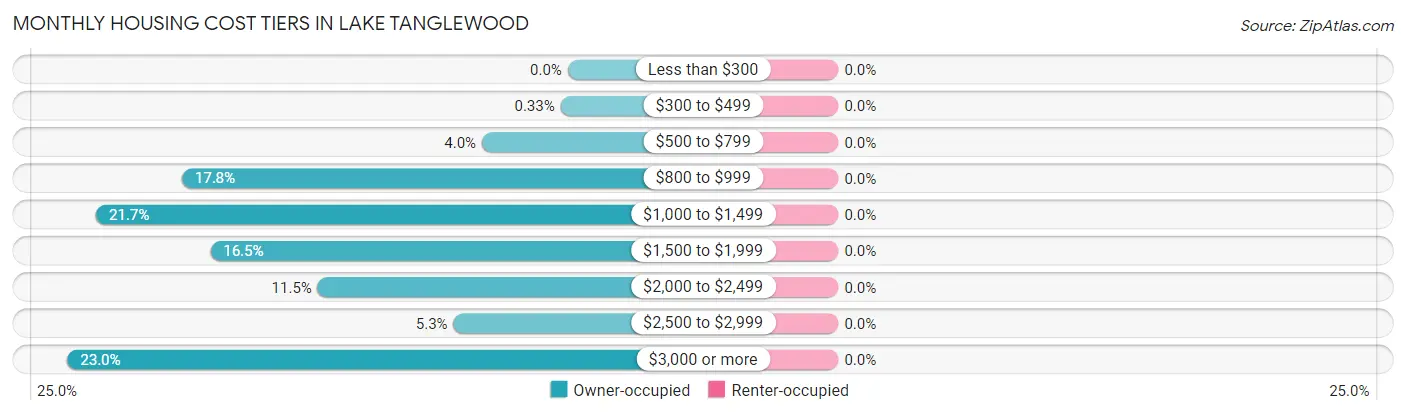
| Monthly Cost | Owner-occupied | Renter-occupied |
| Less than $300 | 0 (0.0%) | 0 (0.0%) |
| $300 to $499 | 1 (0.3%) | 0 (0.0%) |
| $500 to $799 | 12 (4.0%) | 0 (0.0%) |
| $800 to $999 | 54 (17.8%) | 0 (0.0%) |
| $1,000 to $1,499 | 66 (21.7%) | 0 (0.0%) |
| $1,500 to $1,999 | 50 (16.5%) | 0 (0.0%) |
| $2,000 to $2,499 | 35 (11.5%) | 0 (0.0%) |
| $2,500 to $2,999 | 16 (5.3%) | 0 (0.0%) |
| $3,000 or more | 70 (23.0%) | 0 (0.0%) |
| Total | 304 (100.0%) | 4 (100.0%) |
Physical Housing Characteristics in Lake Tanglewood
Housing Structures in Lake Tanglewood
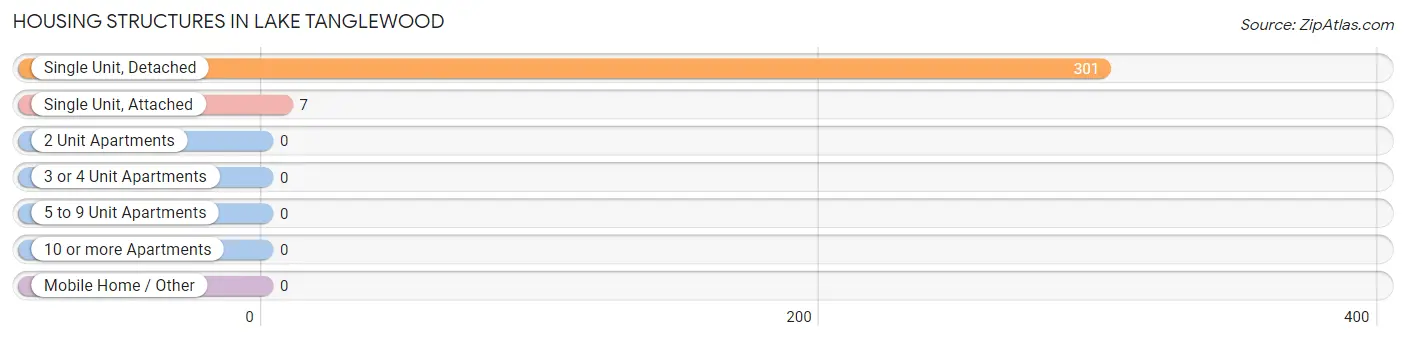
| Structure Type | # Housing Units | % Housing Units |
| Single Unit, Detached | 301 | 97.7% |
| Single Unit, Attached | 7 | 2.3% |
| 2 Unit Apartments | 0 | 0.0% |
| 3 or 4 Unit Apartments | 0 | 0.0% |
| 5 to 9 Unit Apartments | 0 | 0.0% |
| 10 or more Apartments | 0 | 0.0% |
| Mobile Home / Other | 0 | 0.0% |
| Total | 308 | 100.0% |
Housing Structures by Occupancy in Lake Tanglewood
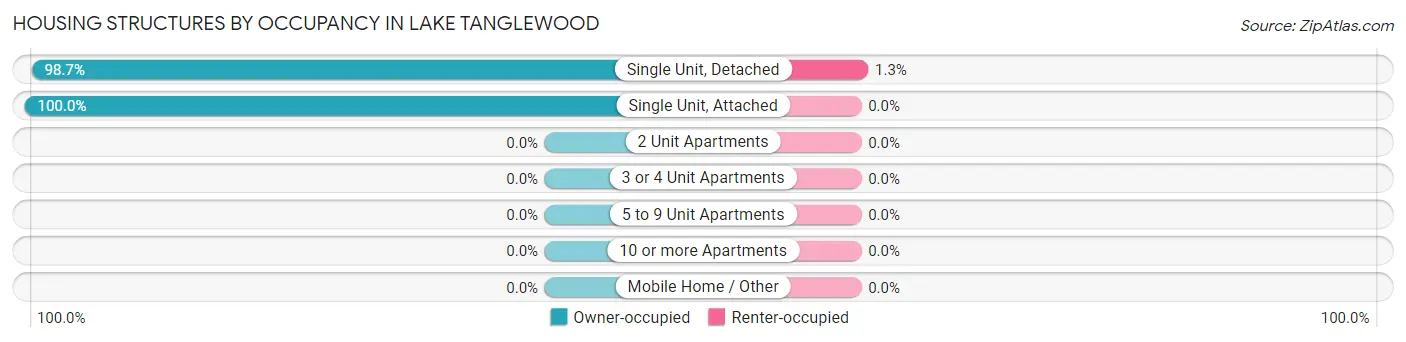
| Structure Type | Owner-occupied | Renter-occupied |
| Single Unit, Detached | 297 (98.7%) | 4 (1.3%) |
| Single Unit, Attached | 7 (100.0%) | 0 (0.0%) |
| 2 Unit Apartments | 0 (0.0%) | 0 (0.0%) |
| 3 or 4 Unit Apartments | 0 (0.0%) | 0 (0.0%) |
| 5 to 9 Unit Apartments | 0 (0.0%) | 0 (0.0%) |
| 10 or more Apartments | 0 (0.0%) | 0 (0.0%) |
| Mobile Home / Other | 0 (0.0%) | 0 (0.0%) |
| Total | 304 (98.7%) | 4 (1.3%) |
Housing Structures by Number of Rooms in Lake Tanglewood
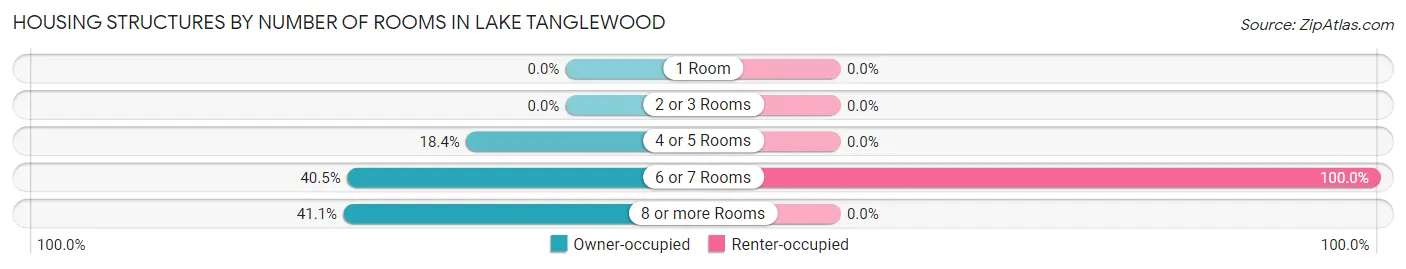
| Number of Rooms | Owner-occupied | Renter-occupied |
| 1 Room | 0 (0.0%) | 0 (0.0%) |
| 2 or 3 Rooms | 0 (0.0%) | 0 (0.0%) |
| 4 or 5 Rooms | 56 (18.4%) | 0 (0.0%) |
| 6 or 7 Rooms | 123 (40.5%) | 4 (100.0%) |
| 8 or more Rooms | 125 (41.1%) | 0 (0.0%) |
| Total | 304 (100.0%) | 4 (100.0%) |
Housing Structure by Heating Type in Lake Tanglewood
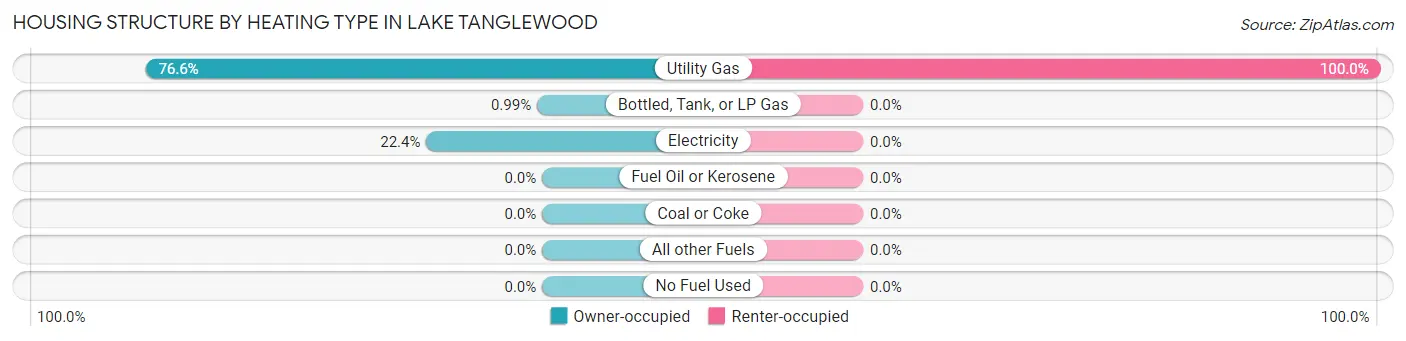
| Heating Type | Owner-occupied | Renter-occupied |
| Utility Gas | 233 (76.6%) | 4 (100.0%) |
| Bottled, Tank, or LP Gas | 3 (1.0%) | 0 (0.0%) |
| Electricity | 68 (22.4%) | 0 (0.0%) |
| Fuel Oil or Kerosene | 0 (0.0%) | 0 (0.0%) |
| Coal or Coke | 0 (0.0%) | 0 (0.0%) |
| All other Fuels | 0 (0.0%) | 0 (0.0%) |
| No Fuel Used | 0 (0.0%) | 0 (0.0%) |
| Total | 304 (100.0%) | 4 (100.0%) |
Household Vehicle Usage in Lake Tanglewood
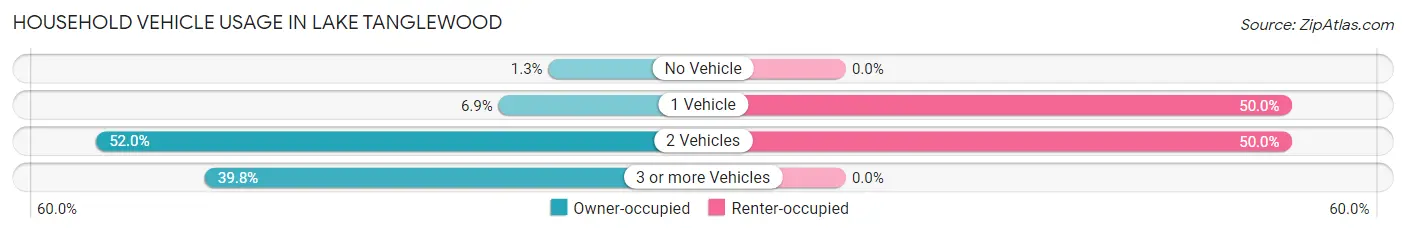
| Vehicles per Household | Owner-occupied | Renter-occupied |
| No Vehicle | 4 (1.3%) | 0 (0.0%) |
| 1 Vehicle | 21 (6.9%) | 2 (50.0%) |
| 2 Vehicles | 158 (52.0%) | 2 (50.0%) |
| 3 or more Vehicles | 121 (39.8%) | 0 (0.0%) |
| Total | 304 (100.0%) | 4 (100.0%) |
Real Estate & Mortgages in Lake Tanglewood
Real Estate and Mortgage Overview in Lake Tanglewood
| Characteristic | Without Mortgage | With Mortgage |
| Housing Units | 154 | 150 |
| Median Property Value | $600,800 | $678,600 |
| Median Household Income | $91,250 | $102 |
| Monthly Housing Costs | $1,052 | $70 |
| Real Estate Taxes | $6,154 | $4 |
Property Value by Mortgage Status in Lake Tanglewood
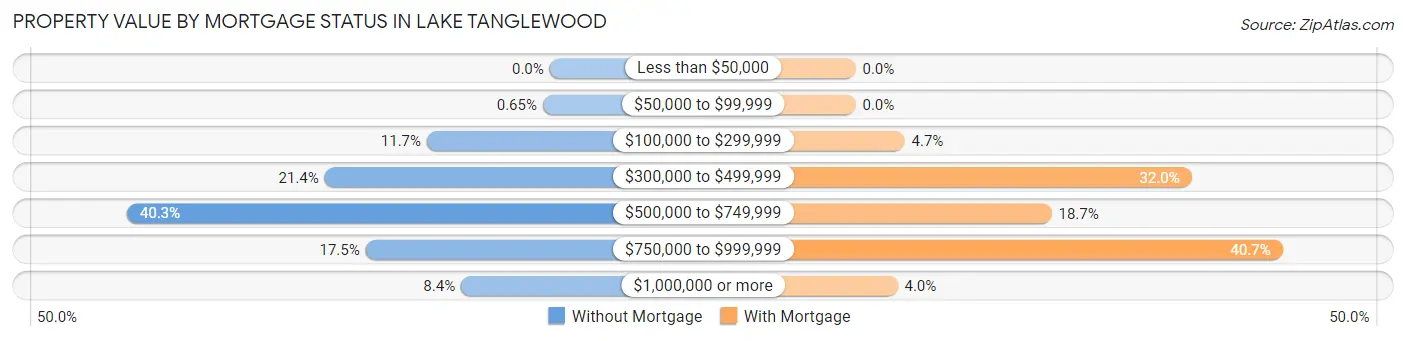
| Property Value | Without Mortgage | With Mortgage |
| Less than $50,000 | 0 (0.0%) | 0 (0.0%) |
| $50,000 to $99,999 | 1 (0.6%) | 0 (0.0%) |
| $100,000 to $299,999 | 18 (11.7%) | 7 (4.7%) |
| $300,000 to $499,999 | 33 (21.4%) | 48 (32.0%) |
| $500,000 to $749,999 | 62 (40.3%) | 28 (18.7%) |
| $750,000 to $999,999 | 27 (17.5%) | 61 (40.7%) |
| $1,000,000 or more | 13 (8.4%) | 6 (4.0%) |
| Total | 154 (100.0%) | 150 (100.0%) |
Household Income by Mortgage Status in Lake Tanglewood
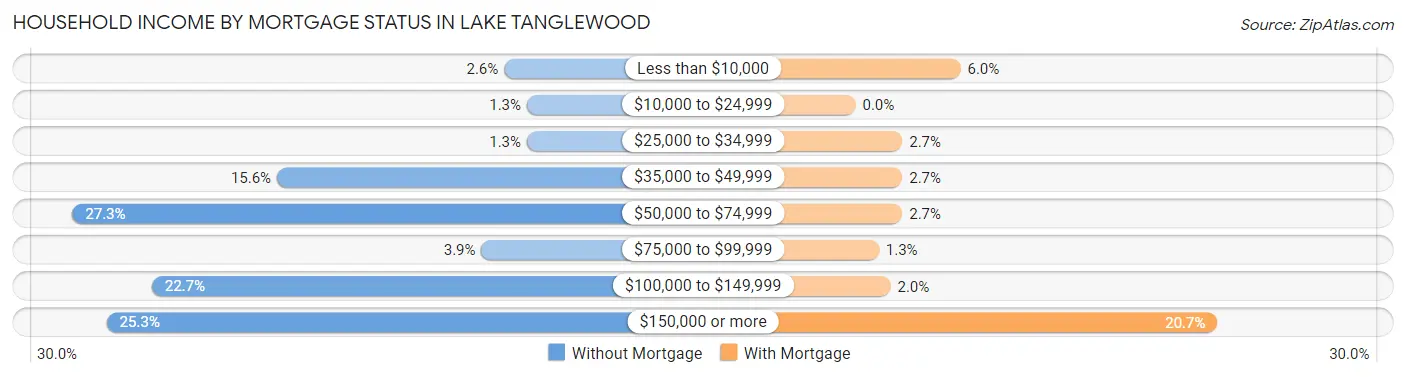
| Household Income | Without Mortgage | With Mortgage |
| Less than $10,000 | 4 (2.6%) | 9 (6.0%) |
| $10,000 to $24,999 | 2 (1.3%) | 0 (0.0%) |
| $25,000 to $34,999 | 2 (1.3%) | 4 (2.7%) |
| $35,000 to $49,999 | 24 (15.6%) | 4 (2.7%) |
| $50,000 to $74,999 | 42 (27.3%) | 4 (2.7%) |
| $75,000 to $99,999 | 6 (3.9%) | 2 (1.3%) |
| $100,000 to $149,999 | 35 (22.7%) | 3 (2.0%) |
| $150,000 or more | 39 (25.3%) | 31 (20.7%) |
| Total | 154 (100.0%) | 150 (100.0%) |
Property Value to Household Income Ratio in Lake Tanglewood
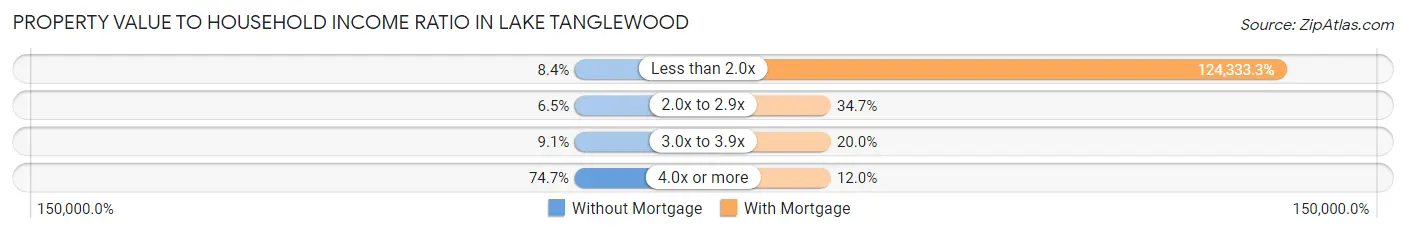
| Value-to-Income Ratio | Without Mortgage | With Mortgage |
| Less than 2.0x | 13 (8.4%) | 186,500 (124,333.3%) |
| 2.0x to 2.9x | 10 (6.5%) | 52 (34.7%) |
| 3.0x to 3.9x | 14 (9.1%) | 30 (20.0%) |
| 4.0x or more | 115 (74.7%) | 18 (12.0%) |
| Total | 154 (100.0%) | 150 (100.0%) |
Real Estate Taxes by Mortgage Status in Lake Tanglewood
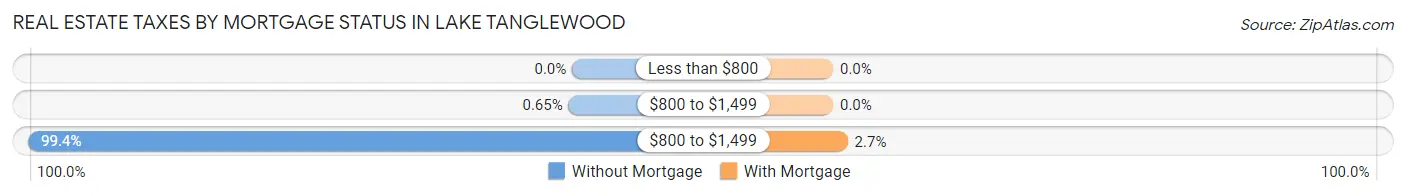
| Property Taxes | Without Mortgage | With Mortgage |
| Less than $800 | 0 (0.0%) | 0 (0.0%) |
| $800 to $1,499 | 1 (0.6%) | 0 (0.0%) |
| $800 to $1,499 | 153 (99.4%) | 4 (2.7%) |
| Total | 154 (100.0%) | 150 (100.0%) |
Health & Disability in Lake Tanglewood
Health Insurance Coverage by Age in Lake Tanglewood
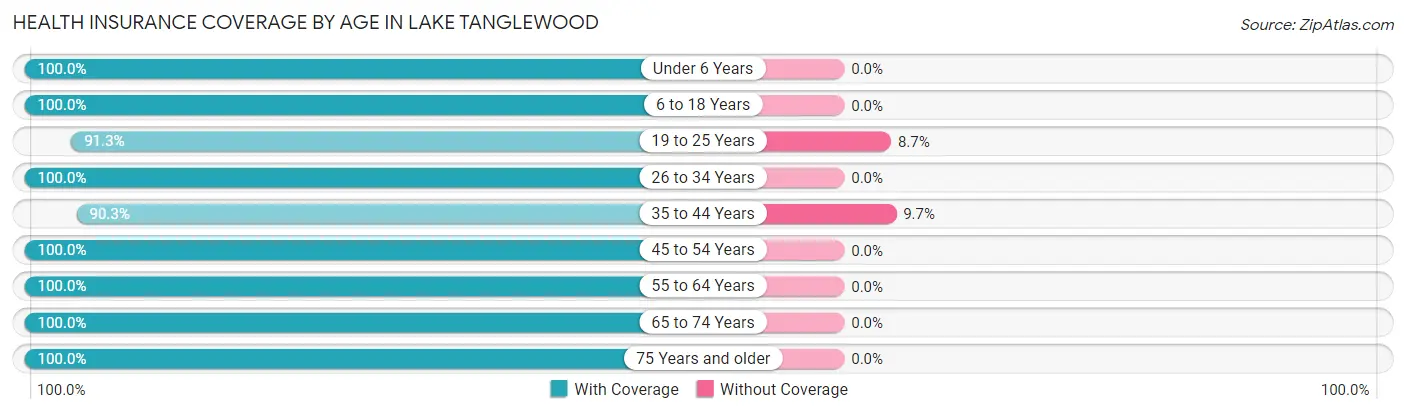
| Age Bracket | With Coverage | Without Coverage |
| Under 6 Years | 49 (100.0%) | 0 (0.0%) |
| 6 to 18 Years | 42 (100.0%) | 0 (0.0%) |
| 19 to 25 Years | 21 (91.3%) | 2 (8.7%) |
| 26 to 34 Years | 19 (100.0%) | 0 (0.0%) |
| 35 to 44 Years | 28 (90.3%) | 3 (9.7%) |
| 45 to 54 Years | 80 (100.0%) | 0 (0.0%) |
| 55 to 64 Years | 163 (100.0%) | 0 (0.0%) |
| 65 to 74 Years | 157 (100.0%) | 0 (0.0%) |
| 75 Years and older | 133 (100.0%) | 0 (0.0%) |
| Total | 692 (99.3%) | 5 (0.7%) |
Health Insurance Coverage by Citizenship Status in Lake Tanglewood
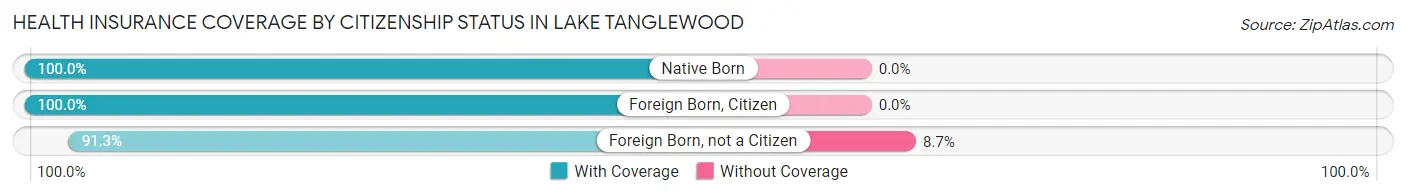
| Citizenship Status | With Coverage | Without Coverage |
| Native Born | 49 (100.0%) | 0 (0.0%) |
| Foreign Born, Citizen | 42 (100.0%) | 0 (0.0%) |
| Foreign Born, not a Citizen | 21 (91.3%) | 2 (8.7%) |
Health Insurance Coverage by Household Income in Lake Tanglewood
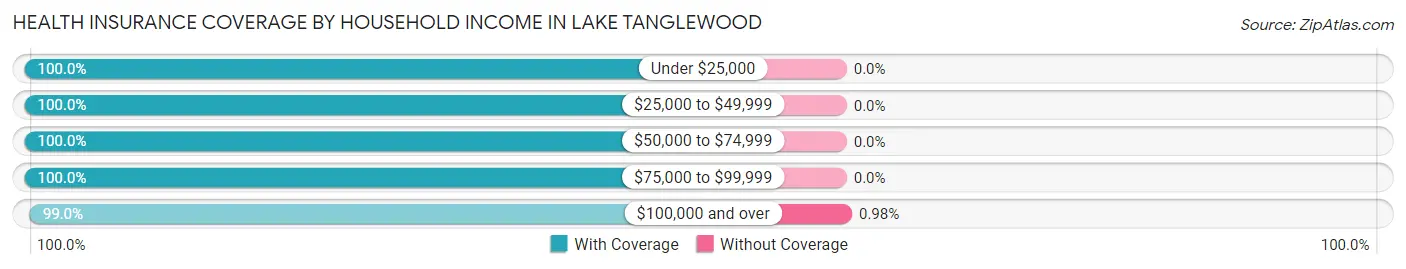
| Household Income | With Coverage | Without Coverage |
| Under $25,000 | 27 (100.0%) | 0 (0.0%) |
| $25,000 to $49,999 | 44 (100.0%) | 0 (0.0%) |
| $50,000 to $74,999 | 92 (100.0%) | 0 (0.0%) |
| $75,000 to $99,999 | 23 (100.0%) | 0 (0.0%) |
| $100,000 and over | 506 (99.0%) | 5 (1.0%) |
Public vs Private Health Insurance Coverage by Age in Lake Tanglewood
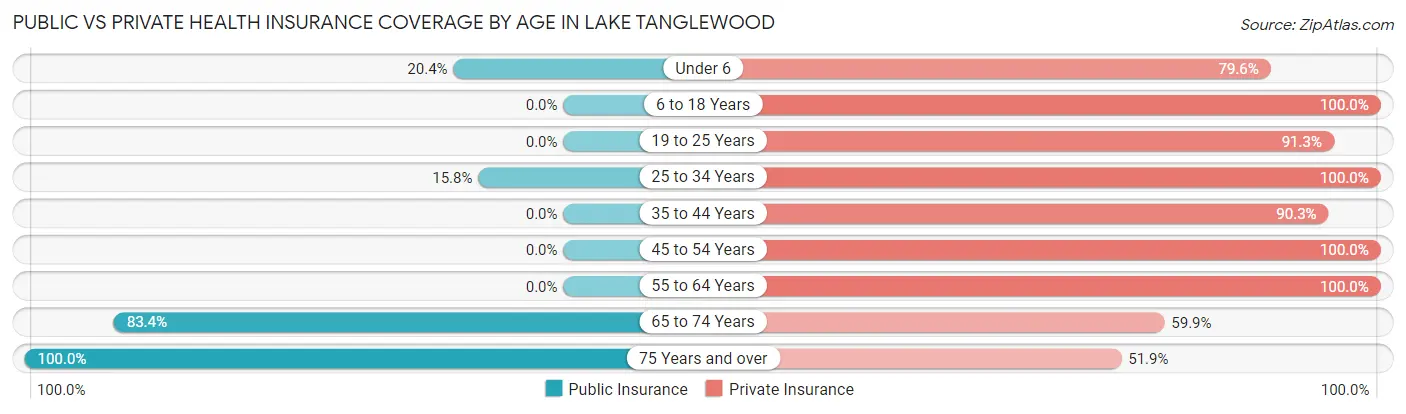
| Age Bracket | Public Insurance | Private Insurance |
| Under 6 | 10 (20.4%) | 39 (79.6%) |
| 6 to 18 Years | 0 (0.0%) | 42 (100.0%) |
| 19 to 25 Years | 0 (0.0%) | 21 (91.3%) |
| 25 to 34 Years | 3 (15.8%) | 19 (100.0%) |
| 35 to 44 Years | 0 (0.0%) | 28 (90.3%) |
| 45 to 54 Years | 0 (0.0%) | 80 (100.0%) |
| 55 to 64 Years | 0 (0.0%) | 163 (100.0%) |
| 65 to 74 Years | 131 (83.4%) | 94 (59.9%) |
| 75 Years and over | 133 (100.0%) | 69 (51.9%) |
| Total | 277 (39.7%) | 555 (79.6%) |
Disability Status by Sex by Age in Lake Tanglewood
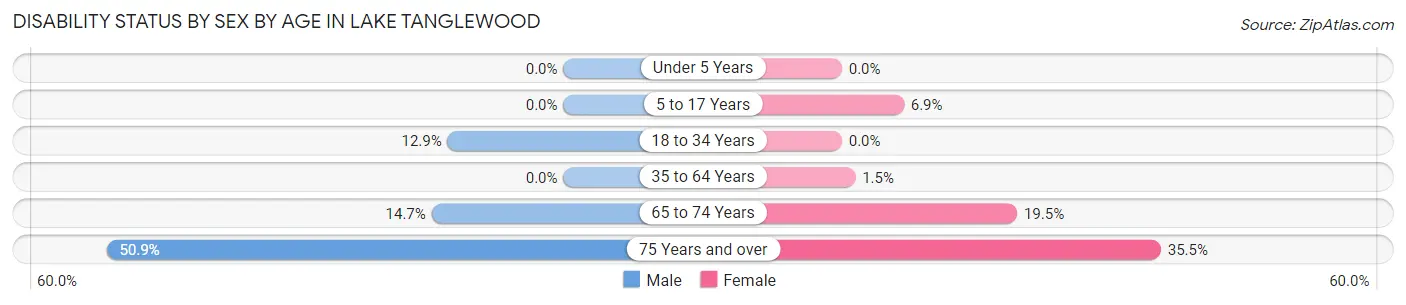
| Age Bracket | Male | Female |
| Under 5 Years | 0 (0.0%) | 0 (0.0%) |
| 5 to 17 Years | 0 (0.0%) | 2 (6.9%) |
| 18 to 34 Years | 4 (12.9%) | 0 (0.0%) |
| 35 to 64 Years | 0 (0.0%) | 2 (1.5%) |
| 65 to 74 Years | 11 (14.7%) | 16 (19.5%) |
| 75 Years and over | 29 (50.9%) | 27 (35.5%) |
Disability Class by Sex by Age in Lake Tanglewood
Disability Class: Hearing Difficulty
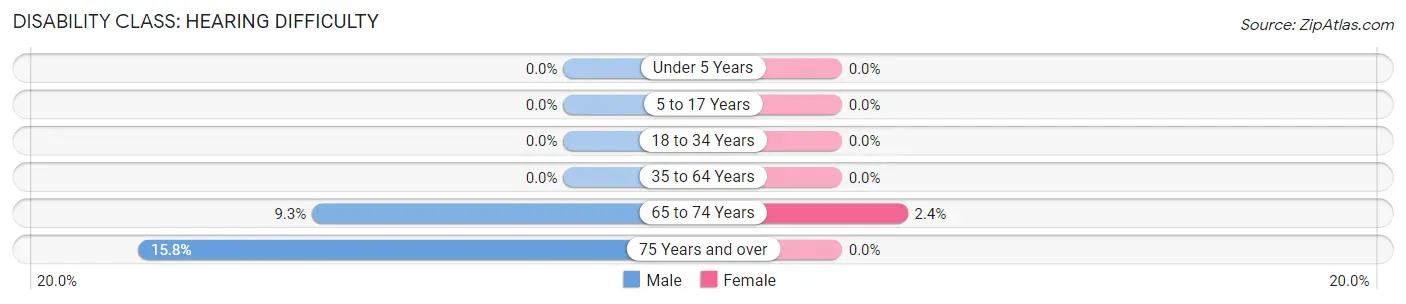
| Age Bracket | Male | Female |
| Under 5 Years | 0 (0.0%) | 0 (0.0%) |
| 5 to 17 Years | 0 (0.0%) | 0 (0.0%) |
| 18 to 34 Years | 0 (0.0%) | 0 (0.0%) |
| 35 to 64 Years | 0 (0.0%) | 0 (0.0%) |
| 65 to 74 Years | 7 (9.3%) | 2 (2.4%) |
| 75 Years and over | 9 (15.8%) | 0 (0.0%) |
Disability Class: Vision Difficulty
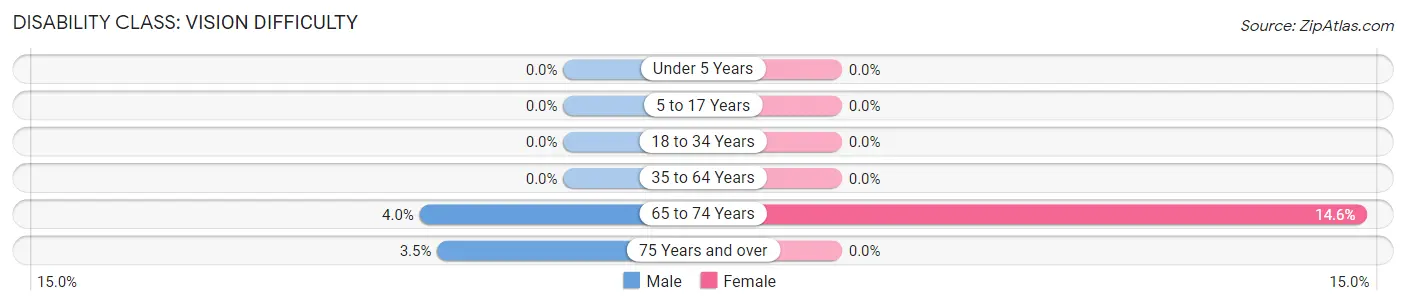
| Age Bracket | Male | Female |
| Under 5 Years | 0 (0.0%) | 0 (0.0%) |
| 5 to 17 Years | 0 (0.0%) | 0 (0.0%) |
| 18 to 34 Years | 0 (0.0%) | 0 (0.0%) |
| 35 to 64 Years | 0 (0.0%) | 0 (0.0%) |
| 65 to 74 Years | 3 (4.0%) | 12 (14.6%) |
| 75 Years and over | 2 (3.5%) | 0 (0.0%) |
Disability Class: Cognitive Difficulty
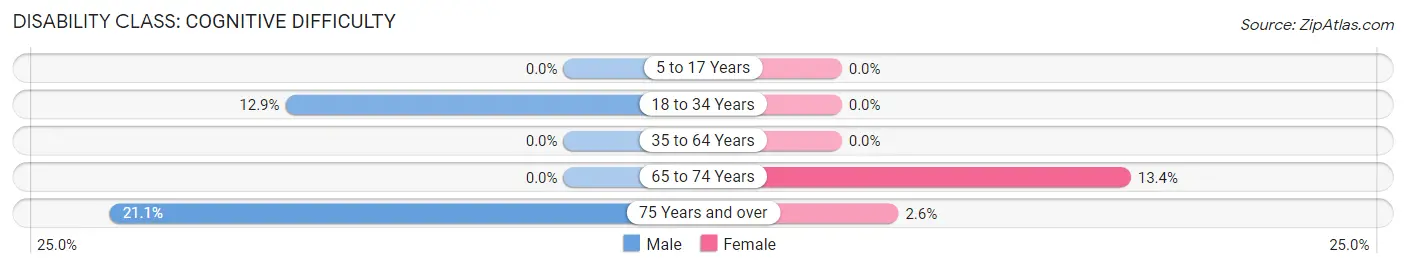
| Age Bracket | Male | Female |
| 5 to 17 Years | 0 (0.0%) | 0 (0.0%) |
| 18 to 34 Years | 4 (12.9%) | 0 (0.0%) |
| 35 to 64 Years | 0 (0.0%) | 0 (0.0%) |
| 65 to 74 Years | 0 (0.0%) | 11 (13.4%) |
| 75 Years and over | 12 (21.0%) | 2 (2.6%) |
Disability Class: Ambulatory Difficulty
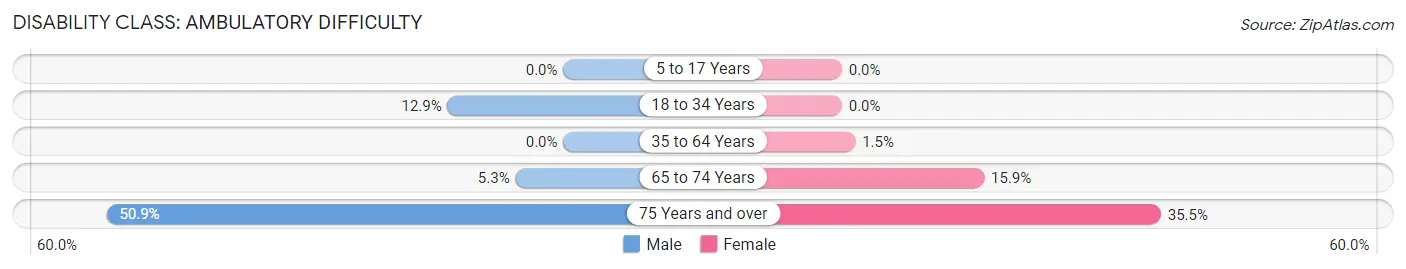
| Age Bracket | Male | Female |
| 5 to 17 Years | 0 (0.0%) | 0 (0.0%) |
| 18 to 34 Years | 4 (12.9%) | 0 (0.0%) |
| 35 to 64 Years | 0 (0.0%) | 2 (1.5%) |
| 65 to 74 Years | 4 (5.3%) | 13 (15.9%) |
| 75 Years and over | 29 (50.9%) | 27 (35.5%) |
Disability Class: Self-Care Difficulty
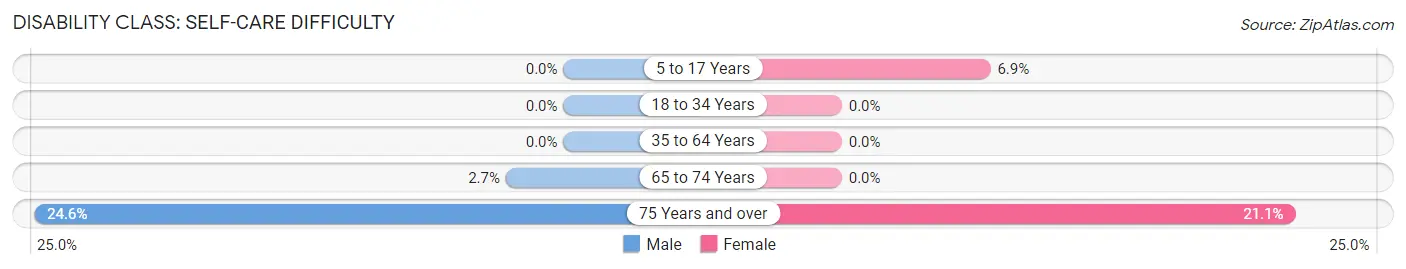
| Age Bracket | Male | Female |
| 5 to 17 Years | 0 (0.0%) | 2 (6.9%) |
| 18 to 34 Years | 0 (0.0%) | 0 (0.0%) |
| 35 to 64 Years | 0 (0.0%) | 0 (0.0%) |
| 65 to 74 Years | 2 (2.7%) | 0 (0.0%) |
| 75 Years and over | 14 (24.6%) | 16 (21.0%) |
Technology Access in Lake Tanglewood
Computing Device Access in Lake Tanglewood
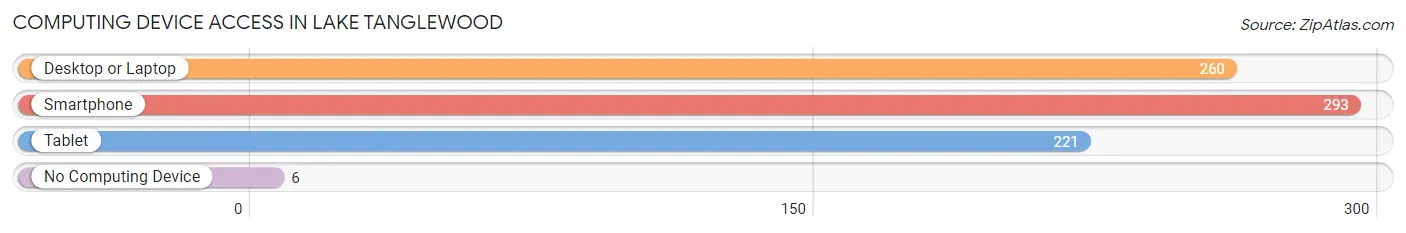
| Device Type | # Households | % Households |
| Desktop or Laptop | 260 | 84.4% |
| Smartphone | 293 | 95.1% |
| Tablet | 221 | 71.8% |
| No Computing Device | 6 | 1.9% |
| Total | 308 | 100.0% |
Internet Access in Lake Tanglewood
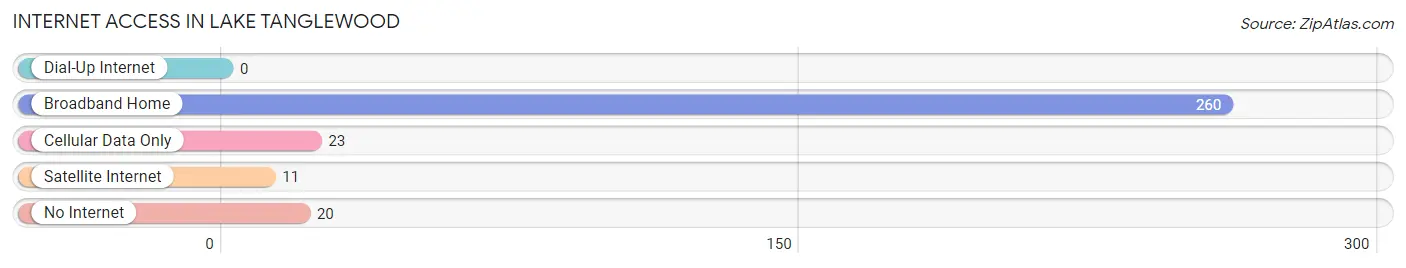
| Internet Type | # Households | % Households |
| Dial-Up Internet | 0 | 0.0% |
| Broadband Home | 260 | 84.4% |
| Cellular Data Only | 23 | 7.5% |
| Satellite Internet | 11 | 3.6% |
| No Internet | 20 | 6.5% |
| Total | 308 | 100.0% |
Lake Tanglewood Summary
Lake Tanglewood, TX is a small unincorporated community located in Potter County, Texas. It is situated on the western edge of the Texas Panhandle, approximately 25 miles northeast of Amarillo. The community is named after the nearby Lake Tanglewood, a man-made lake created in the 1950s.
History
The area around Lake Tanglewood was first settled in the late 1800s by ranchers and farmers. The first post office was established in the area in 1891. The community was officially established in the 1950s when the Lake Tanglewood Dam was built to create the lake. The dam was built by the U.S. Army Corps of Engineers and was completed in 1954. The lake was created to provide water for the surrounding area and to provide recreational opportunities.
Geography
Lake Tanglewood is located in Potter County, Texas, approximately 25 miles northeast of Amarillo. The community is situated on the western edge of the Texas Panhandle, near the border with New Mexico. The area is mostly flat, with some rolling hills. The lake is the centerpiece of the community, and is surrounded by residential neighborhoods and recreational areas.
Economy
The economy of Lake Tanglewood is largely based on tourism and recreation. The lake is a popular destination for fishing, boating, and other outdoor activities. There are several marinas and boat rental businesses in the area. The community also has several restaurants, bars, and other businesses catering to tourists.
Demographics
As of the 2010 census, the population of Lake Tanglewood was 1,845. The racial makeup of the community was 94.3% White, 0.7% African American, 0.3% Native American, 0.2% Asian, and 4.5% from other races. The median household income was $45,000, and the median age was 44.
Conclusion
Lake Tanglewood, TX is a small unincorporated community located in Potter County, Texas. It is situated on the western edge of the Texas Panhandle, approximately 25 miles northeast of Amarillo. The community was established in the 1950s when the Lake Tanglewood Dam was built to create the lake. The economy of Lake Tanglewood is largely based on tourism and recreation, and the population of the community was 1,845 as of the 2010 census.
Common Questions
What is Per Capita Income in Lake Tanglewood?
Per Capita income in Lake Tanglewood is $83,835.
What is the Median Family Income in Lake Tanglewood?
Median Family Income in Lake Tanglewood is $151,250.
What is the Median Household income in Lake Tanglewood?
Median Household Income in Lake Tanglewood is $140,833.
What is Income or Wage Gap in Lake Tanglewood?
Income or Wage Gap in Lake Tanglewood is 59.5%.
Women in Lake Tanglewood earn 40.5 cents for every dollar earned by a man.
What is Inequality or Gini Index in Lake Tanglewood?
Inequality or Gini Index in Lake Tanglewood is 0.46.
What is the Total Population of Lake Tanglewood?
Total Population of Lake Tanglewood is 697.
What is the Total Male Population of Lake Tanglewood?
Total Male Population of Lake Tanglewood is 339.
What is the Total Female Population of Lake Tanglewood?
Total Female Population of Lake Tanglewood is 358.
What is the Ratio of Males per 100 Females in Lake Tanglewood?
There are 94.69 Males per 100 Females in Lake Tanglewood.
What is the Ratio of Females per 100 Males in Lake Tanglewood?
There are 105.60 Females per 100 Males in Lake Tanglewood.
What is the Median Population Age in Lake Tanglewood?
Median Population Age in Lake Tanglewood is 61.1 Years.
What is the Average Family Size in Lake Tanglewood
Average Family Size in Lake Tanglewood is 2.6 People.
What is the Average Household Size in Lake Tanglewood
Average Household Size in Lake Tanglewood is 2.3 People.
How Large is the Labor Force in Lake Tanglewood?
There are 349 People in the Labor Forcein in Lake Tanglewood.
What is the Percentage of People in the Labor Force in Lake Tanglewood?
55.8% of People are in the Labor Force in Lake Tanglewood.
What is the Unemployment Rate in Lake Tanglewood?
Unemployment Rate in Lake Tanglewood is 2.9%.