Star Harbor, TX Map & Demographics
Star Harbor Map
Star Harbor Overview
$47,566
PER CAPITA INCOME
$106,250
AVG FAMILY INCOME
$108,500
AVG HOUSEHOLD INCOME
30.1%
WAGE / INCOME GAP [ % ]
69.9¢/ $1
WAGE / INCOME GAP [ $ ]
0.36
INEQUALITY / GINI INDEX
508
TOTAL POPULATION
287
MALE POPULATION
221
FEMALE POPULATION
129.86
MALES / 100 FEMALES
77.00
FEMALES / 100 MALES
55.4
MEDIAN AGE
2.5
AVG FAMILY SIZE
2.3
AVG HOUSEHOLD SIZE
242
LABOR FORCE [ PEOPLE ]
55.8%
PERCENT IN LABOR FORCE
1.7%
UNEMPLOYMENT RATE
Income in Star Harbor
Income Overview in Star Harbor
Per Capita Income in Star Harbor is $47,566, while median incomes of families and households are $106,250 and $108,500 respectively.
| Characteristic | Number | Measure |
| Per Capita Income | 508 | $47,566 |
| Median Family Income | 160 | $106,250 |
| Mean Family Income | 160 | $110,130 |
| Median Household Income | 224 | $108,500 |
| Mean Household Income | 224 | $111,900 |
| Income Deficit | 160 | $0 |
| Wage / Income Gap (%) | 508 | 30.13% |
| Wage / Income Gap ($) | 508 | 69.87¢ per $1 |
| Gini / Inequality Index | 508 | 0.36 |
Earnings by Sex in Star Harbor
Average Earnings in Star Harbor are $62,857, $67,865 for men and $47,417 for women, a difference of 30.1%.
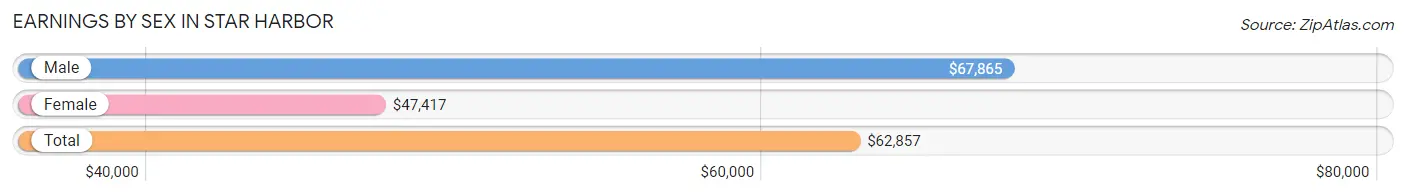
| Sex | Number | Average Earnings |
| Male | 151 (58.5%) | $67,865 |
| Female | 107 (41.5%) | $47,417 |
| Total | 258 (100.0%) | $62,857 |
Earnings by Sex by Income Bracket in Star Harbor
The most common earnings brackets in Star Harbor are $100,000+ for men (38 | 25.2%) and $65,000 to $74,999 for women (32 | 29.9%).
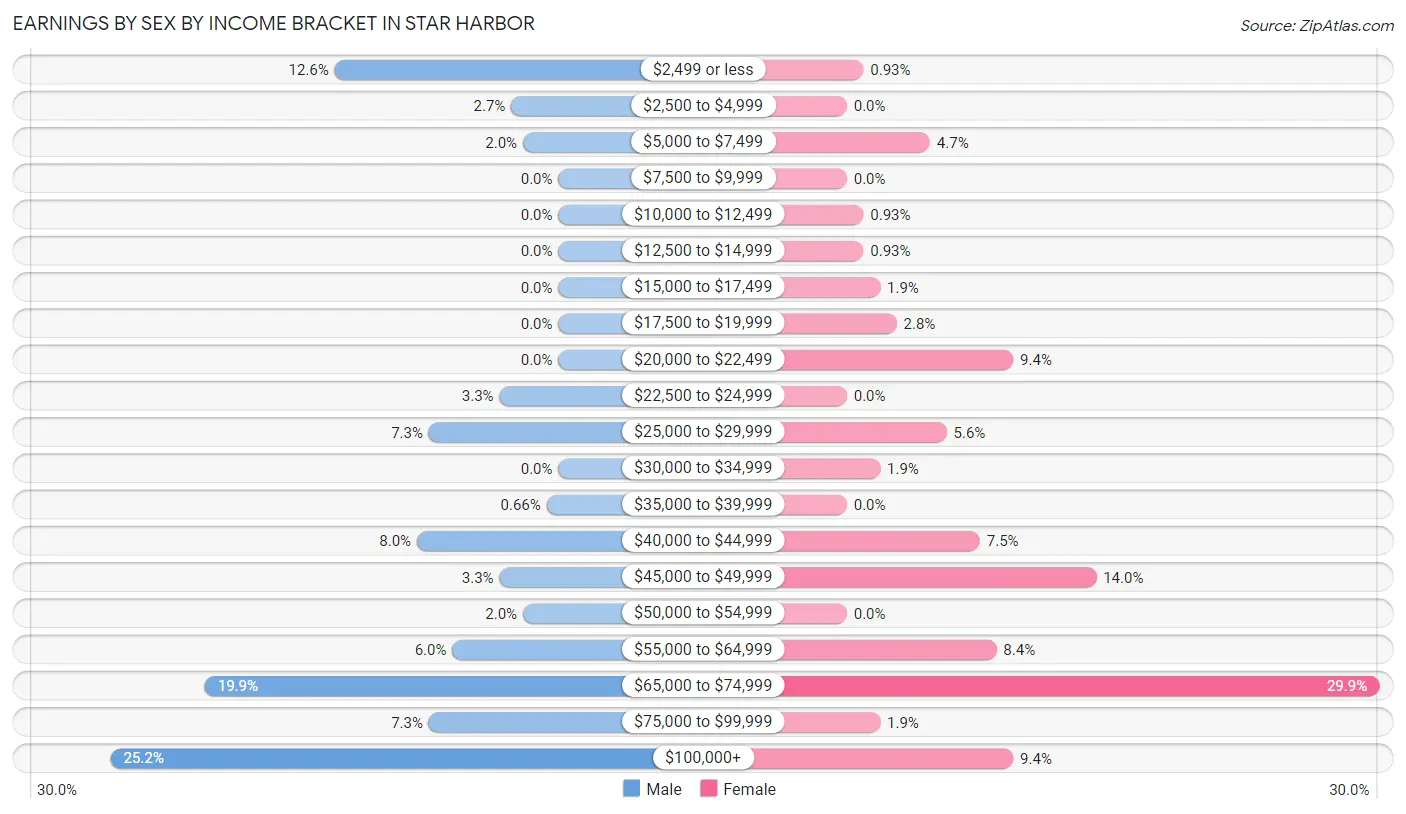
| Income | Male | Female |
| $2,499 or less | 19 (12.6%) | 1 (0.9%) |
| $2,500 to $4,999 | 4 (2.6%) | 0 (0.0%) |
| $5,000 to $7,499 | 3 (2.0%) | 5 (4.7%) |
| $7,500 to $9,999 | 0 (0.0%) | 0 (0.0%) |
| $10,000 to $12,499 | 0 (0.0%) | 1 (0.9%) |
| $12,500 to $14,999 | 0 (0.0%) | 1 (0.9%) |
| $15,000 to $17,499 | 0 (0.0%) | 2 (1.9%) |
| $17,500 to $19,999 | 0 (0.0%) | 3 (2.8%) |
| $20,000 to $22,499 | 0 (0.0%) | 10 (9.3%) |
| $22,500 to $24,999 | 5 (3.3%) | 0 (0.0%) |
| $25,000 to $29,999 | 11 (7.3%) | 6 (5.6%) |
| $30,000 to $34,999 | 0 (0.0%) | 2 (1.9%) |
| $35,000 to $39,999 | 1 (0.7%) | 0 (0.0%) |
| $40,000 to $44,999 | 12 (8.0%) | 8 (7.5%) |
| $45,000 to $49,999 | 5 (3.3%) | 15 (14.0%) |
| $50,000 to $54,999 | 3 (2.0%) | 0 (0.0%) |
| $55,000 to $64,999 | 9 (6.0%) | 9 (8.4%) |
| $65,000 to $74,999 | 30 (19.9%) | 32 (29.9%) |
| $75,000 to $99,999 | 11 (7.3%) | 2 (1.9%) |
| $100,000+ | 38 (25.2%) | 10 (9.3%) |
| Total | 151 (100.0%) | 107 (100.0%) |
Earnings by Sex by Educational Attainment in Star Harbor
Average earnings in Star Harbor are $69,688 for men and $61,250 for women, a difference of 12.1%. Men with an educational attainment of college or associate's degree enjoy the highest average annual earnings of $83,438, while those with high school diploma education earn the least with $45,750. Women with an educational attainment of college or associate's degree earn the most with the average annual earnings of $67,500, while those with high school diploma education have the smallest earnings of $19,583.
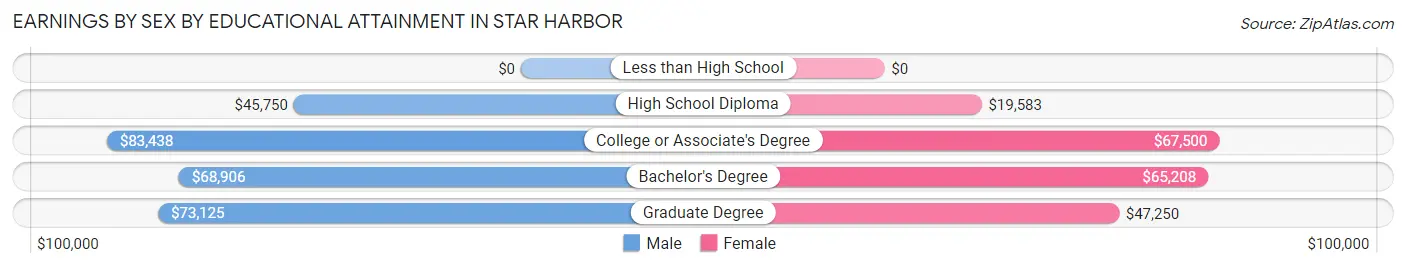
| Educational Attainment | Male Income | Female Income |
| Less than High School | - | - |
| High School Diploma | $45,750 | $19,583 |
| College or Associate's Degree | $83,438 | $67,500 |
| Bachelor's Degree | $68,906 | $65,208 |
| Graduate Degree | $73,125 | $47,250 |
| Total | $69,688 | $61,250 |
Family Income in Star Harbor
Family Income Brackets in Star Harbor
According to the Star Harbor family income data, there are 54 families falling into the $100,000 to $149,999 income range, which is the most common income bracket and makes up 33.8% of all families.
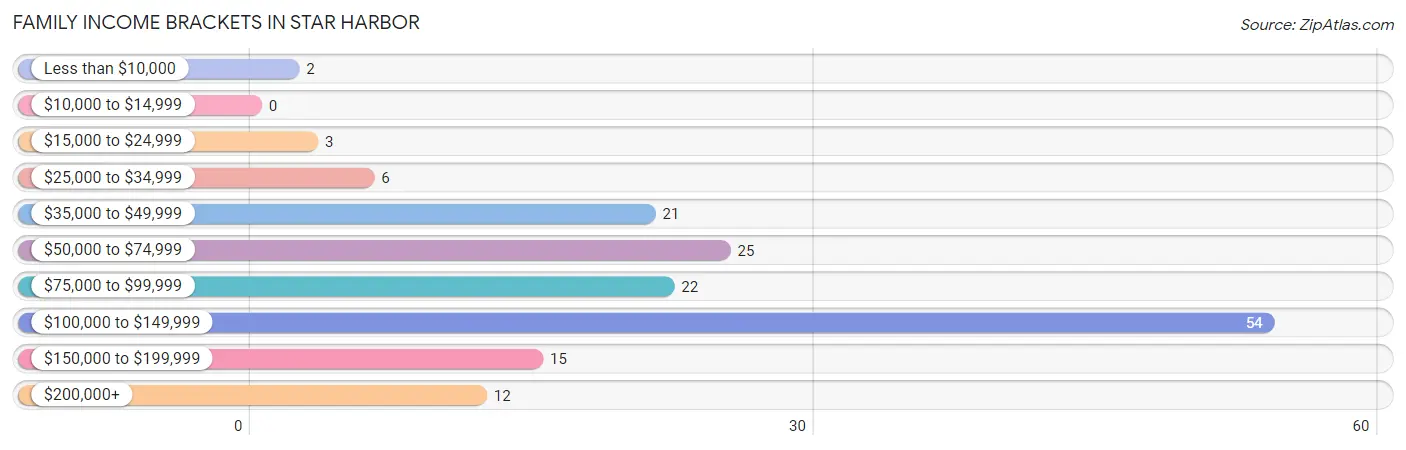
| Income Bracket | # Families | % Families |
| Less than $10,000 | 2 | 1.3% |
| $10,000 to $14,999 | 0 | 0.0% |
| $15,000 to $24,999 | 3 | 1.9% |
| $25,000 to $34,999 | 6 | 3.8% |
| $35,000 to $49,999 | 21 | 13.1% |
| $50,000 to $74,999 | 25 | 15.6% |
| $75,000 to $99,999 | 22 | 13.8% |
| $100,000 to $149,999 | 54 | 33.8% |
| $150,000 to $199,999 | 15 | 9.4% |
| $200,000+ | 12 | 7.5% |
Family Income by Famaliy Size in Star Harbor
2-person families (110 | 68.8%) account for the highest median family income in Star Harbor with $92,500 per family, while 2-person families (110 | 68.8%) have the highest median income of $46,250 per family member.
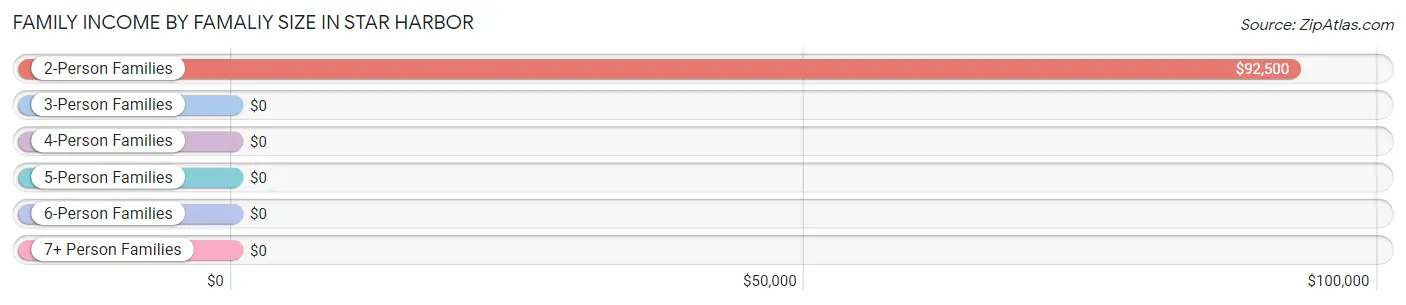
| Income Bracket | # Families | Median Income |
| 2-Person Families | 110 (68.8%) | $92,500 |
| 3-Person Families | 25 (15.6%) | $0 |
| 4-Person Families | 18 (11.3%) | $0 |
| 5-Person Families | 1 (0.6%) | $0 |
| 6-Person Families | 6 (3.7%) | $0 |
| 7+ Person Families | 0 (0.0%) | $0 |
| Total | 160 (100.0%) | $106,250 |
Family Income by Number of Earners in Star Harbor
The median family income in Star Harbor is $106,250, with families comprising 3+ earners (27) having the highest median family income of $116,302, while families with no earners (37) have the lowest median family income of $76,875, accounting for 16.9% and 23.1% of families, respectively.
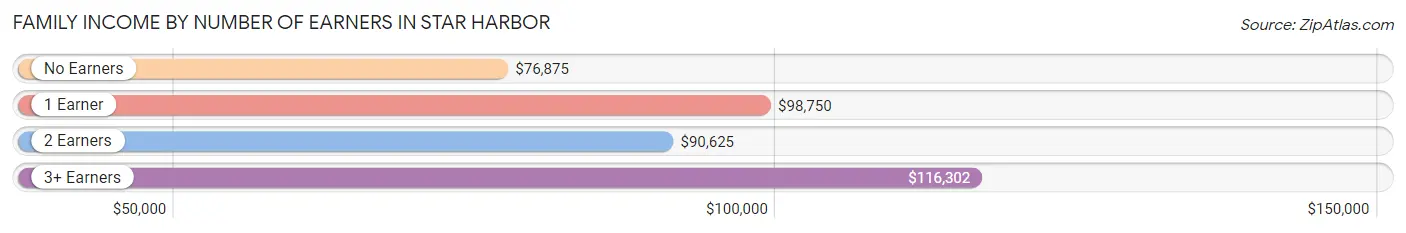
| Number of Earners | # Families | Median Income |
| No Earners | 37 (23.1%) | $76,875 |
| 1 Earner | 40 (25.0%) | $98,750 |
| 2 Earners | 56 (35.0%) | $90,625 |
| 3+ Earners | 27 (16.9%) | $116,302 |
| Total | 160 (100.0%) | $106,250 |
Household Income in Star Harbor
Household Income Brackets in Star Harbor
With 72 households falling in the category, the $100,000 to $149,999 income range is the most frequent in Star Harbor, accounting for 32.1% of all households. In contrast, only 3 households (1.3%) fall into the $15,000 to $24,999 income bracket, making it the least populous group.
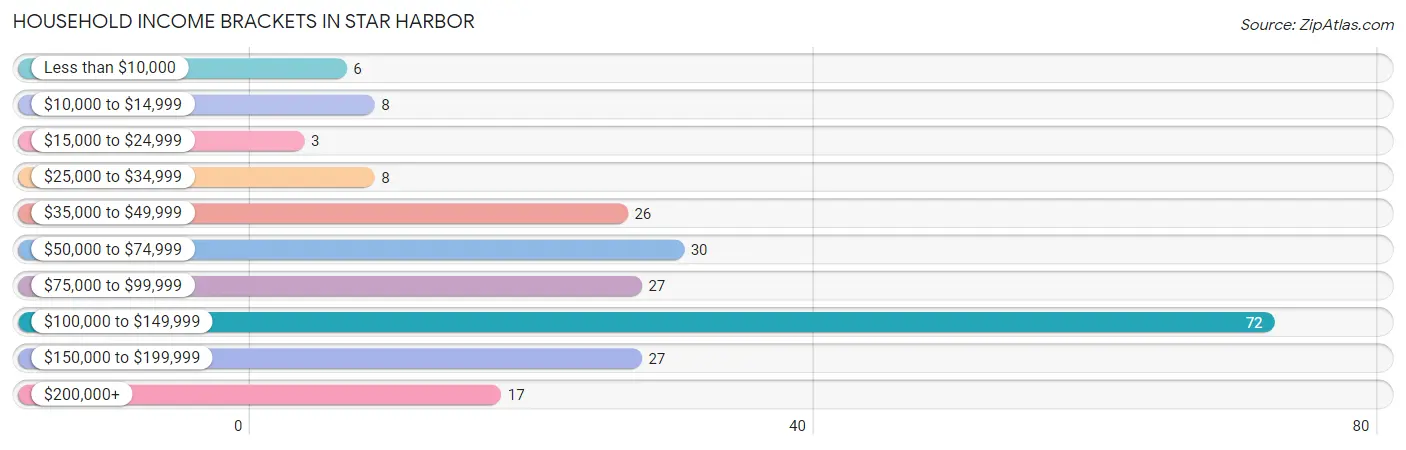
| Income Bracket | # Households | % Households |
| Less than $10,000 | 6 | 2.7% |
| $10,000 to $14,999 | 8 | 3.6% |
| $15,000 to $24,999 | 3 | 1.3% |
| $25,000 to $34,999 | 8 | 3.6% |
| $35,000 to $49,999 | 26 | 11.6% |
| $50,000 to $74,999 | 30 | 13.4% |
| $75,000 to $99,999 | 27 | 12.1% |
| $100,000 to $149,999 | 72 | 32.1% |
| $150,000 to $199,999 | 27 | 12.1% |
| $200,000+ | 17 | 7.6% |
Household Income by Householder Age in Star Harbor
The median household income in Star Harbor is $108,500, with the highest median household income of $119,688 found in the 25 to 44 years age bracket for the primary householder. A total of 39 households (17.4%) fall into this category. Meanwhile, the 15 to 24 years age bracket for the primary householder has the lowest median household income of $0, with 8 households (3.6%) in this group.
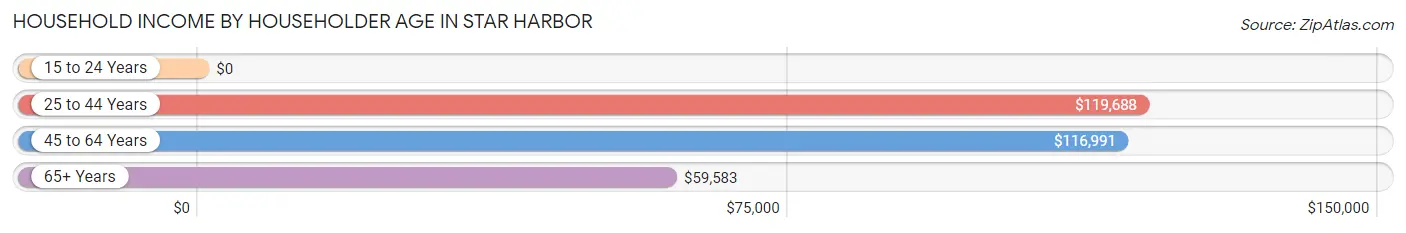
| Income Bracket | # Households | Median Income |
| 15 to 24 Years | 8 (3.6%) | $0 |
| 25 to 44 Years | 39 (17.4%) | $119,688 |
| 45 to 64 Years | 95 (42.4%) | $116,991 |
| 65+ Years | 82 (36.6%) | $59,583 |
| Total | 224 (100.0%) | $108,500 |
Poverty in Star Harbor
Income Below Poverty by Sex and Age in Star Harbor
With 9.0% poverty level for males and 9.5% for females among the residents of Star Harbor, 16 and 17 year old males and 75 year old and over females are the most vulnerable to poverty, with 12 males (54.5%) and 10 females (23.8%) in their respective age groups living below the poverty level.
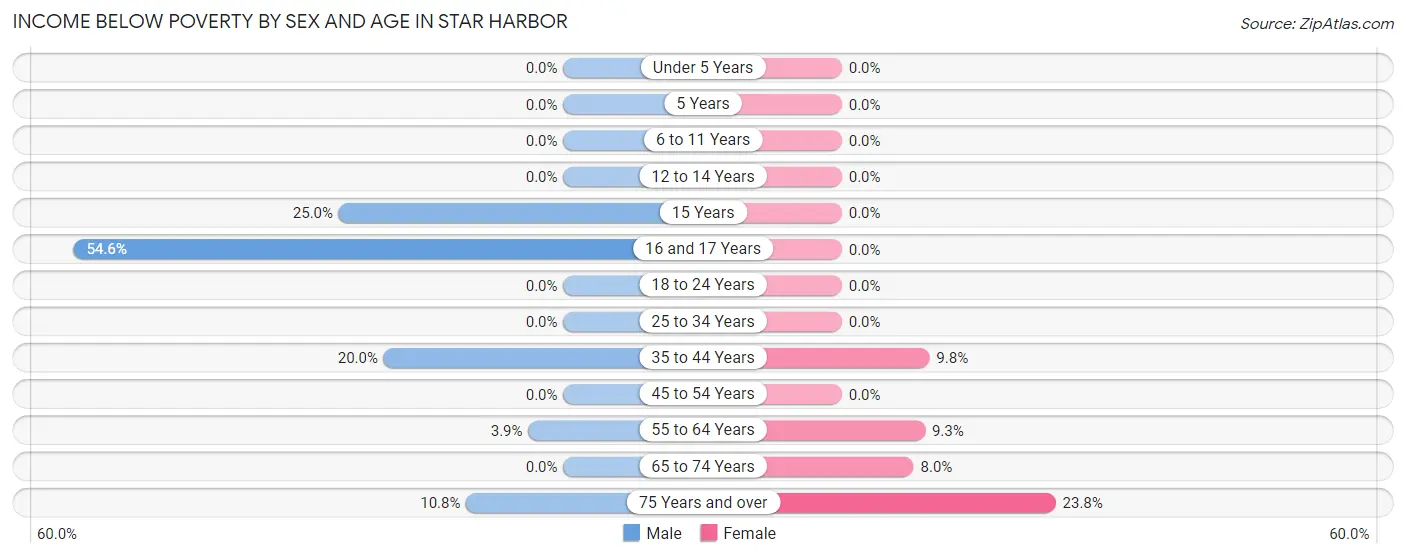
| Age Bracket | Male | Female |
| Under 5 Years | 0 (0.0%) | 0 (0.0%) |
| 5 Years | 0 (0.0%) | 0 (0.0%) |
| 6 to 11 Years | 0 (0.0%) | 0 (0.0%) |
| 12 to 14 Years | 0 (0.0%) | 0 (0.0%) |
| 15 Years | 3 (25.0%) | 0 (0.0%) |
| 16 and 17 Years | 12 (54.5%) | 0 (0.0%) |
| 18 to 24 Years | 0 (0.0%) | 0 (0.0%) |
| 25 to 34 Years | 0 (0.0%) | 0 (0.0%) |
| 35 to 44 Years | 3 (20.0%) | 4 (9.8%) |
| 45 to 54 Years | 0 (0.0%) | 0 (0.0%) |
| 55 to 64 Years | 3 (3.9%) | 5 (9.3%) |
| 65 to 74 Years | 0 (0.0%) | 2 (8.0%) |
| 75 Years and over | 4 (10.8%) | 10 (23.8%) |
| Total | 25 (9.0%) | 21 (9.5%) |
Income Above Poverty by Sex and Age in Star Harbor
According to the poverty statistics in Star Harbor, males aged 5 years and females aged 5 years are the age groups that are most secure financially, with 100.0% of males and 100.0% of females in these age groups living above the poverty line.
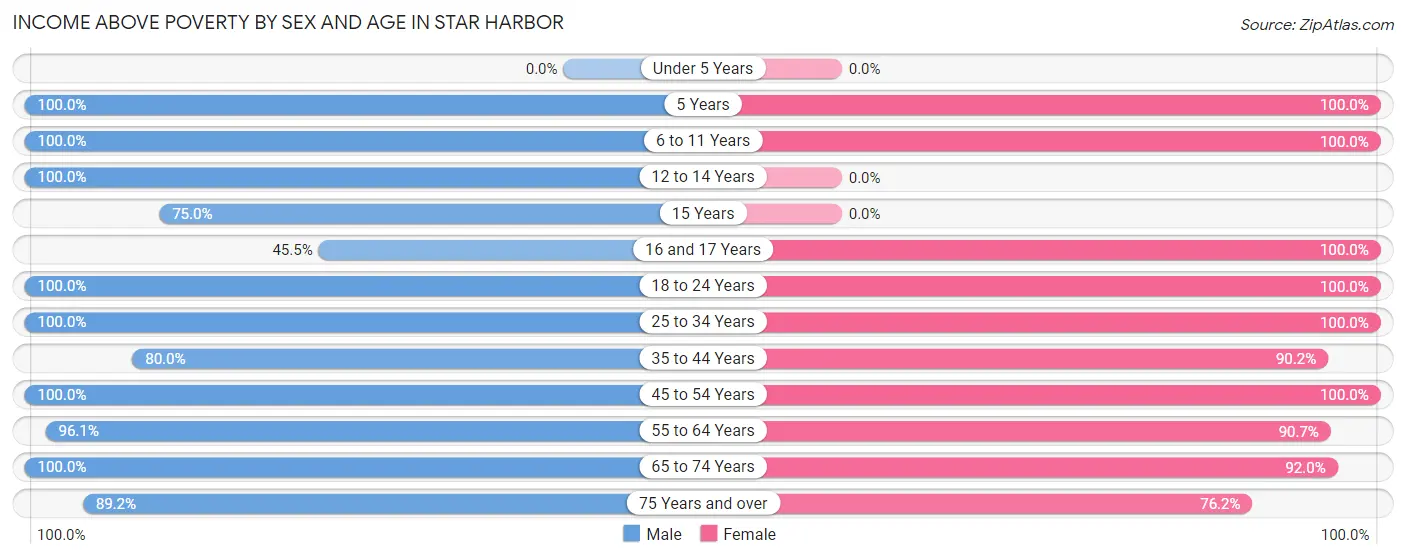
| Age Bracket | Male | Female |
| Under 5 Years | 0 (0.0%) | 0 (0.0%) |
| 5 Years | 6 (100.0%) | 2 (100.0%) |
| 6 to 11 Years | 31 (100.0%) | 8 (100.0%) |
| 12 to 14 Years | 7 (100.0%) | 0 (0.0%) |
| 15 Years | 9 (75.0%) | 0 (0.0%) |
| 16 and 17 Years | 10 (45.5%) | 2 (100.0%) |
| 18 to 24 Years | 23 (100.0%) | 15 (100.0%) |
| 25 to 34 Years | 5 (100.0%) | 8 (100.0%) |
| 35 to 44 Years | 12 (80.0%) | 37 (90.2%) |
| 45 to 54 Years | 19 (100.0%) | 24 (100.0%) |
| 55 to 64 Years | 74 (96.1%) | 49 (90.7%) |
| 65 to 74 Years | 25 (100.0%) | 23 (92.0%) |
| 75 Years and over | 33 (89.2%) | 32 (76.2%) |
| Total | 254 (91.0%) | 200 (90.5%) |
Income Below Poverty Among Married-Couple Families in Star Harbor
The poverty statistics for married-couple families in Star Harbor show that 3.4% or 5 of the total 149 families live below the poverty line. Families with 1 or 2 children have the highest poverty rate of 16.7%, comprising of 3 families. On the other hand, families with 3 or 4 children have the lowest poverty rate of 0.0%, which includes 0 families.
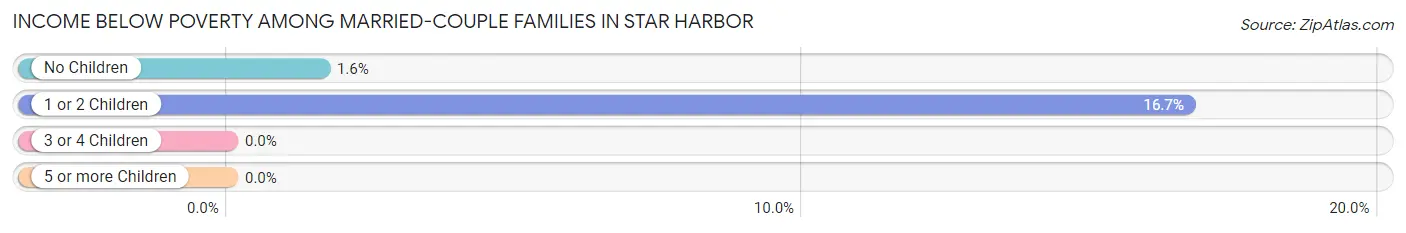
| Children | Above Poverty | Below Poverty |
| No Children | 123 (98.4%) | 2 (1.6%) |
| 1 or 2 Children | 15 (83.3%) | 3 (16.7%) |
| 3 or 4 Children | 6 (100.0%) | 0 (0.0%) |
| 5 or more Children | 0 (0.0%) | 0 (0.0%) |
| Total | 144 (96.6%) | 5 (3.4%) |
Income Below Poverty Among Single-Parent Households in Star Harbor
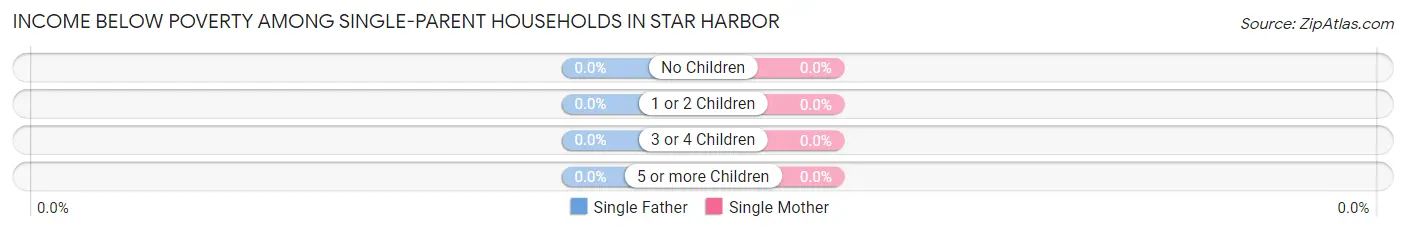
| Children | Single Father | Single Mother |
| No Children | 0 (0.0%) | 0 (0.0%) |
| 1 or 2 Children | 0 (0.0%) | 0 (0.0%) |
| 3 or 4 Children | 0 (0.0%) | 0 (0.0%) |
| 5 or more Children | 0 (0.0%) | 0 (0.0%) |
| Total | 0 (0.0%) | 0 (0.0%) |
Income Below Poverty Among Married-Couple vs Single-Parent Households in Star Harbor
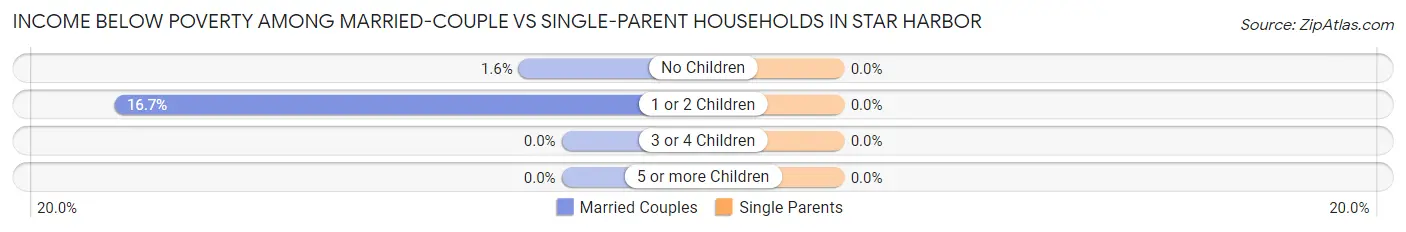
| Children | Married-Couple Families | Single-Parent Households |
| No Children | 2 (1.6%) | 0 (0.0%) |
| 1 or 2 Children | 3 (16.7%) | 0 (0.0%) |
| 3 or 4 Children | 0 (0.0%) | 0 (0.0%) |
| 5 or more Children | 0 (0.0%) | 0 (0.0%) |
| Total | 5 (3.4%) | 0 (0.0%) |
Race in Star Harbor
The most populous races in Star Harbor are White / Caucasian (445 | 87.6%), Two or more Races (47 | 9.2%), and Hispanic or Latino (27 | 5.3%).
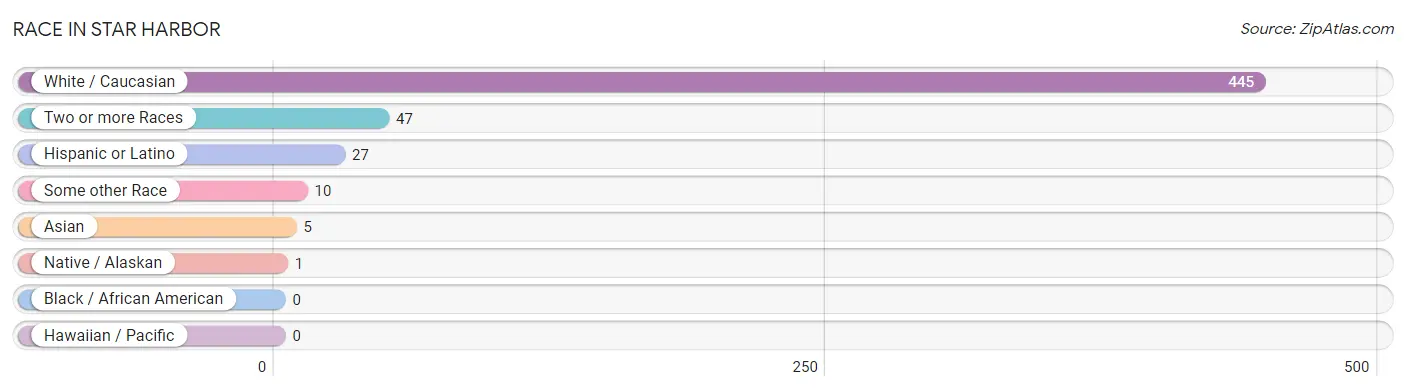
| Race | # Population | % Population |
| Asian | 5 | 1.0% |
| Black / African American | 0 | 0.0% |
| Hawaiian / Pacific | 0 | 0.0% |
| Hispanic or Latino | 27 | 5.3% |
| Native / Alaskan | 1 | 0.2% |
| White / Caucasian | 445 | 87.6% |
| Two or more Races | 47 | 9.2% |
| Some other Race | 10 | 2.0% |
| Total | 508 | 100.0% |
Ancestry in Star Harbor
The most populous ancestries reported in Star Harbor are English (87 | 17.1%), American (42 | 8.3%), Irish (42 | 8.3%), European (32 | 6.3%), and German (31 | 6.1%), together accounting for 46.1% of all Star Harbor residents.
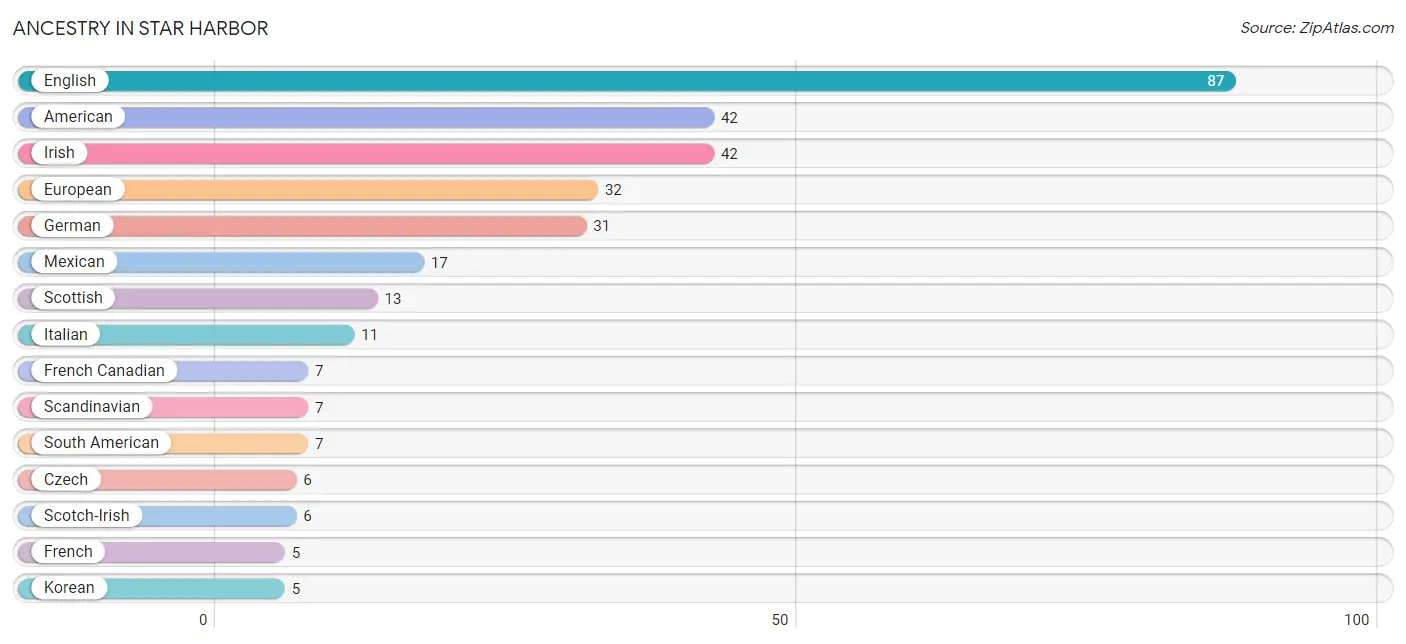
| Ancestry | # Population | % Population |
| American | 42 | 8.3% |
| Bolivian | 3 | 0.6% |
| Canadian | 2 | 0.4% |
| Czech | 6 | 1.2% |
| Czechoslovakian | 1 | 0.2% |
| Eastern European | 2 | 0.4% |
| English | 87 | 17.1% |
| European | 32 | 6.3% |
| French | 5 | 1.0% |
| French Canadian | 7 | 1.4% |
| German | 31 | 6.1% |
| Irish | 42 | 8.3% |
| Italian | 11 | 2.2% |
| Korean | 5 | 1.0% |
| Mexican | 17 | 3.4% |
| Norwegian | 2 | 0.4% |
| Paiute | 4 | 0.8% |
| Peruvian | 2 | 0.4% |
| Potawatomi | 1 | 0.2% |
| Scandinavian | 7 | 1.4% |
| Scotch-Irish | 6 | 1.2% |
| Scottish | 13 | 2.6% |
| South American | 7 | 1.4% |
| Spanish | 3 | 0.6% |
| Venezuelan | 2 | 0.4% |
| Welsh | 2 | 0.4% | View All 26 Rows |
Immigrants in Star Harbor
The most numerous immigrant groups reported in Star Harbor came from Latin America (2 | 0.4%), Peru (2 | 0.4%), and South America (2 | 0.4%), together accounting for 1.2% of all Star Harbor residents.
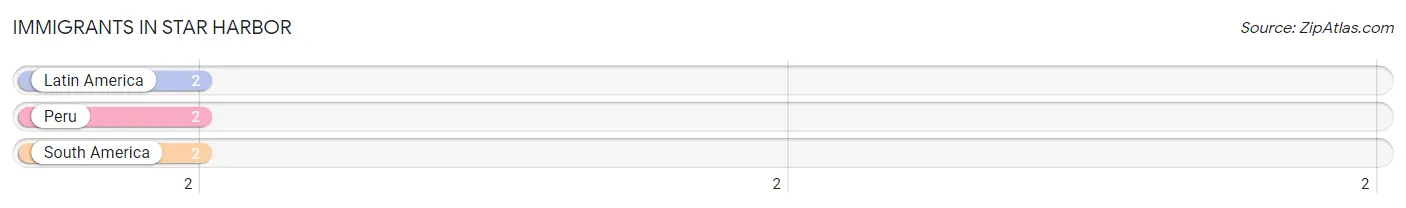
| Immigration Origin | # Population | % Population |
| Latin America | 2 | 0.4% |
| Peru | 2 | 0.4% |
| South America | 2 | 0.4% | View All 3 Rows |
Sex and Age in Star Harbor
Sex and Age in Star Harbor
The most populous age groups in Star Harbor are 55 to 59 Years (50 | 17.4%) for men and 55 to 59 Years (39 | 17.6%) for women.
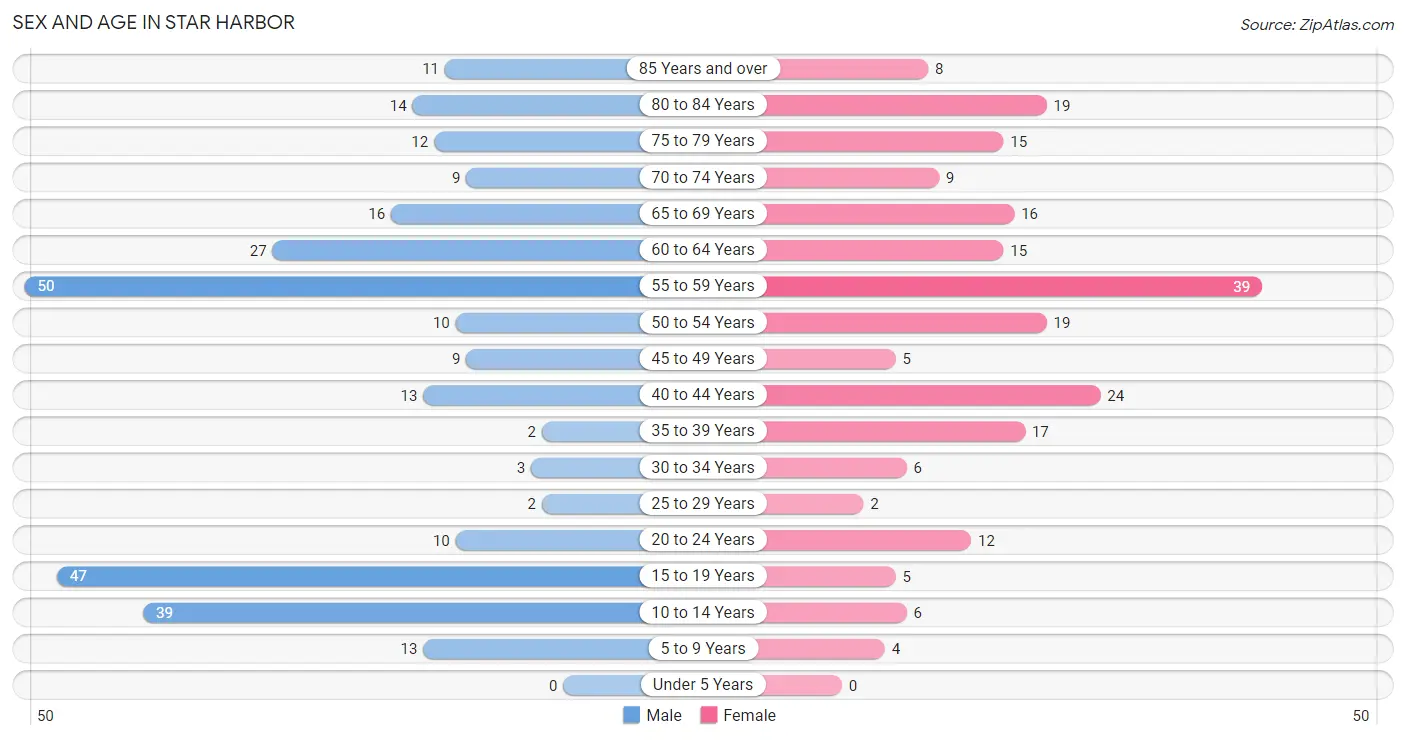
| Age Bracket | Male | Female |
| Under 5 Years | 0 (0.0%) | 0 (0.0%) |
| 5 to 9 Years | 13 (4.5%) | 4 (1.8%) |
| 10 to 14 Years | 39 (13.6%) | 6 (2.7%) |
| 15 to 19 Years | 47 (16.4%) | 5 (2.3%) |
| 20 to 24 Years | 10 (3.5%) | 12 (5.4%) |
| 25 to 29 Years | 2 (0.7%) | 2 (0.9%) |
| 30 to 34 Years | 3 (1.1%) | 6 (2.7%) |
| 35 to 39 Years | 2 (0.7%) | 17 (7.7%) |
| 40 to 44 Years | 13 (4.5%) | 24 (10.9%) |
| 45 to 49 Years | 9 (3.1%) | 5 (2.3%) |
| 50 to 54 Years | 10 (3.5%) | 19 (8.6%) |
| 55 to 59 Years | 50 (17.4%) | 39 (17.6%) |
| 60 to 64 Years | 27 (9.4%) | 15 (6.8%) |
| 65 to 69 Years | 16 (5.6%) | 16 (7.2%) |
| 70 to 74 Years | 9 (3.1%) | 9 (4.1%) |
| 75 to 79 Years | 12 (4.2%) | 15 (6.8%) |
| 80 to 84 Years | 14 (4.9%) | 19 (8.6%) |
| 85 Years and over | 11 (3.8%) | 8 (3.6%) |
| Total | 287 (100.0%) | 221 (100.0%) |
Families and Households in Star Harbor
Median Family Size in Star Harbor
The median family size in Star Harbor is 2.53 persons per family, with single female/mother families (9 | 5.6%) accounting for the largest median family size of 3.11 persons per family. On the other hand, married-couple families (149 | 93.1%) represent the smallest median family size with 2.49 persons per family.
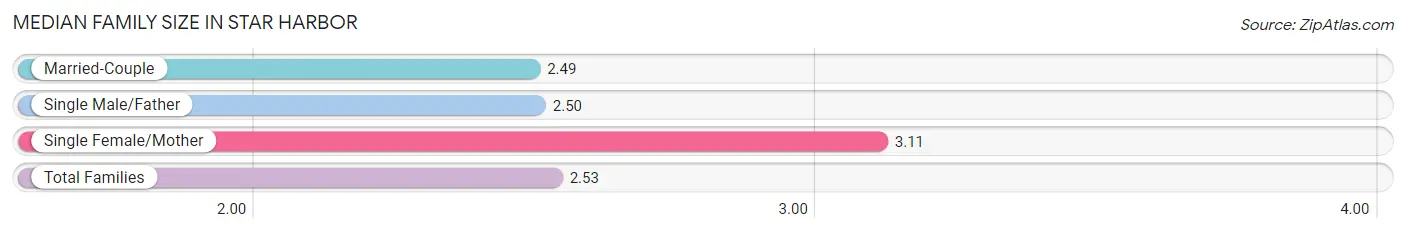
| Family Type | # Families | Family Size |
| Married-Couple | 149 (93.1%) | 2.49 |
| Single Male/Father | 2 (1.3%) | 2.50 |
| Single Female/Mother | 9 (5.6%) | 3.11 |
| Total Families | 160 (100.0%) | 2.53 |
Median Household Size in Star Harbor
The median household size in Star Harbor is 2.27 persons per household, with single female/mother households (9 | 4.0%) accounting for the largest median household size of 3.11 persons per household. non-family households (64 | 28.6%) represent the smallest median household size with 1.63 persons per household.
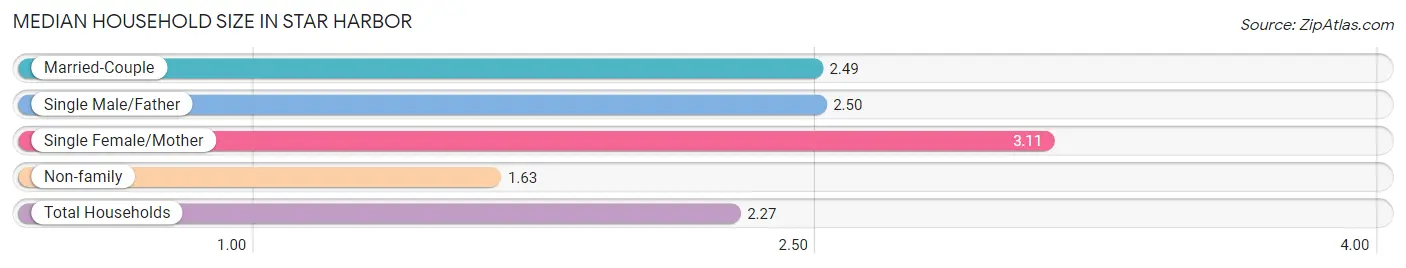
| Household Type | # Households | Household Size |
| Married-Couple | 149 (66.5%) | 2.49 |
| Single Male/Father | 2 (0.9%) | 2.50 |
| Single Female/Mother | 9 (4.0%) | 3.11 |
| Non-family | 64 (28.6%) | 1.63 |
| Total Households | 224 (100.0%) | 2.27 |
Household Size by Marriage Status in Star Harbor
Out of a total of 224 households in Star Harbor, 160 (71.4%) are family households, while 64 (28.6%) are nonfamily households. The most numerous type of family households are 2-person households, comprising 110, and the most common type of nonfamily households are 1-person households, comprising 39.
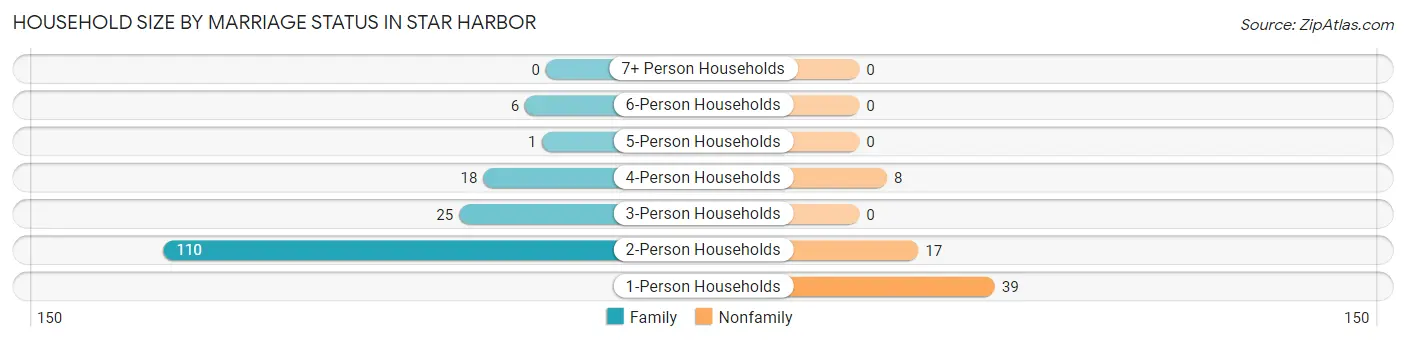
| Household Size | Family Households | Nonfamily Households |
| 1-Person Households | - | 39 (17.4%) |
| 2-Person Households | 110 (49.1%) | 17 (7.6%) |
| 3-Person Households | 25 (11.2%) | 0 (0.0%) |
| 4-Person Households | 18 (8.0%) | 8 (3.6%) |
| 5-Person Households | 1 (0.4%) | 0 (0.0%) |
| 6-Person Households | 6 (2.7%) | 0 (0.0%) |
| 7+ Person Households | 0 (0.0%) | 0 (0.0%) |
| Total | 160 (71.4%) | 64 (28.6%) |
Female Fertility in Star Harbor
Fertility by Age in Star Harbor
| Age Bracket | Women with Births | Births / 1,000 Women |
| 15 to 19 years | 0 (0.0%) | 0.0 |
| 20 to 34 years | 0 (0.0%) | 0.0 |
| 35 to 50 years | 0 (0.0%) | 0.0 |
| Total | 0 (0.0%) | 0.0 |
Fertility by Age by Marriage Status in Star Harbor
| Age Bracket | Married | Unmarried |
| 15 to 19 years | 0 (0.0%) | 0 (0.0%) |
| 20 to 34 years | 0 (0.0%) | 0 (0.0%) |
| 35 to 50 years | 0 (0.0%) | 0 (0.0%) |
| Total | 0 (0.0%) | 0 (0.0%) |
Fertility by Education in Star Harbor
| Educational Attainment | Women with Births | Births / 1,000 Women |
| Less than High School | 0 (0.0%) | 0.0 |
| High School Diploma | 0 (0.0%) | 0.0 |
| College or Associate's Degree | 0 (0.0%) | 0.0 |
| Bachelor's Degree | 0 (0.0%) | 0.0 |
| Graduate Degree | 0 (0.0%) | 0.0 |
| Total | 0 (0.0%) | 0.0 |
Fertility by Education by Marriage Status in Star Harbor
| Educational Attainment | Married | Unmarried |
| Less than High School | 0 (0.0%) | 0 (0.0%) |
| High School Diploma | 0 (0.0%) | 0 (0.0%) |
| College or Associate's Degree | 0 (0.0%) | 0 (0.0%) |
| Bachelor's Degree | 0 (0.0%) | 0 (0.0%) |
| Graduate Degree | 0 (0.0%) | 0 (0.0%) |
| Total | 0 (0.0%) | 0 (0.0%) |
Employment Characteristics in Star Harbor
Employment by Class of Employer in Star Harbor
Among the 234 employed individuals in Star Harbor, private company employees (103 | 44.0%), state government employees (45 | 19.2%), and self-employed (incorporated) (32 | 13.7%) make up the most common classes of employment.
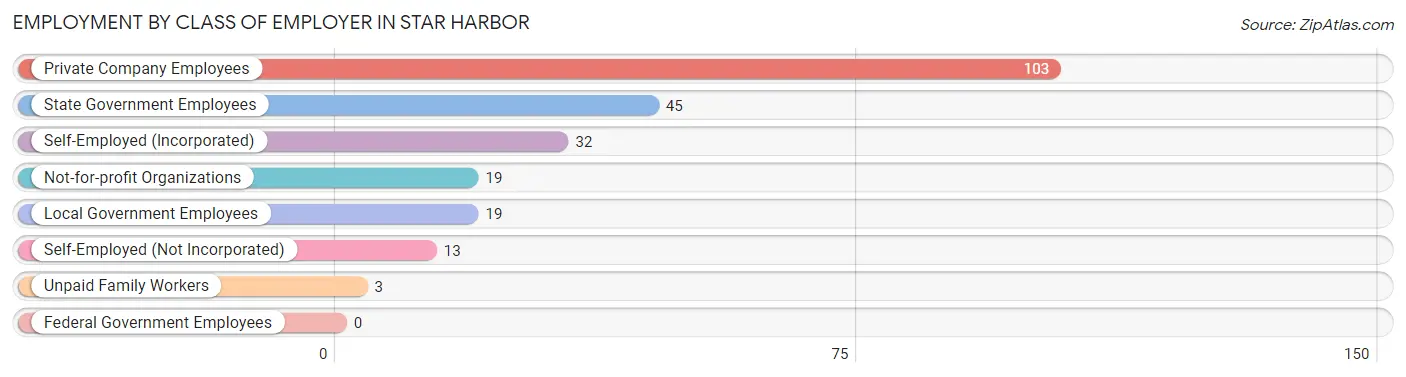
| Employer Class | # Employees | % Employees |
| Private Company Employees | 103 | 44.0% |
| Self-Employed (Incorporated) | 32 | 13.7% |
| Self-Employed (Not Incorporated) | 13 | 5.6% |
| Not-for-profit Organizations | 19 | 8.1% |
| Local Government Employees | 19 | 8.1% |
| State Government Employees | 45 | 19.2% |
| Federal Government Employees | 0 | 0.0% |
| Unpaid Family Workers | 3 | 1.3% |
| Total | 234 | 100.0% |
Employment Status by Age in Star Harbor
According to the labor force statistics for Star Harbor, out of the total population over 16 years of age (434), 55.8% or 242 individuals are in the labor force, with 1.7% or 4 of them unemployed. The age group with the highest labor force participation rate is 25 to 29 years, with 100.0% or 4 individuals in the labor force. Within the labor force, the 55 to 59 years age range has the highest percentage of unemployed individuals, with 6.0% or 4 of them being unemployed.
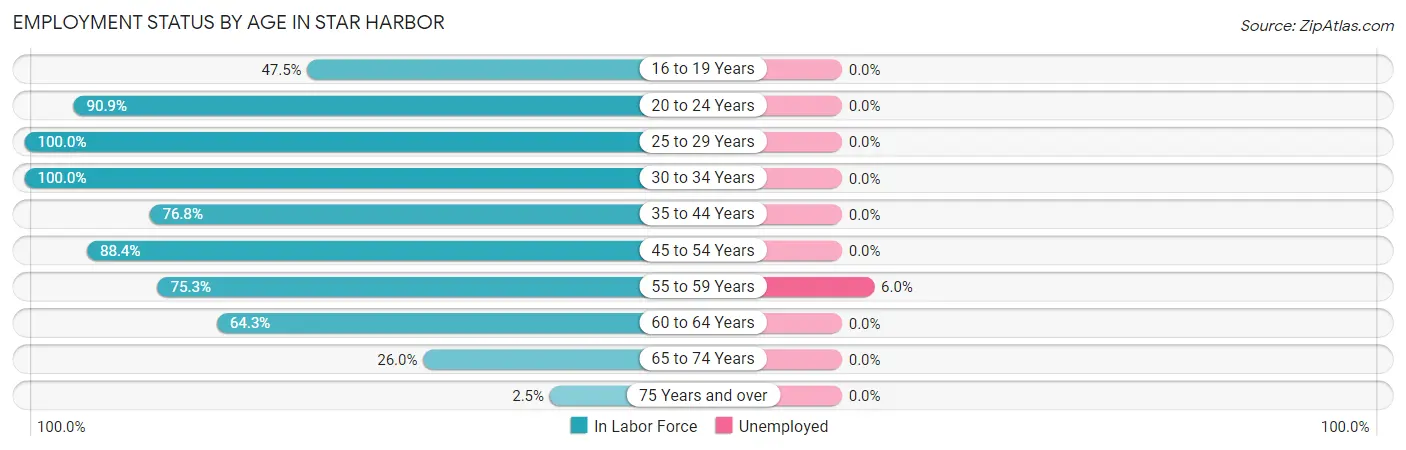
| Age Bracket | In Labor Force | Unemployed |
| 16 to 19 Years | 19 (47.5%) | 0 (0.0%) |
| 20 to 24 Years | 20 (90.9%) | 0 (0.0%) |
| 25 to 29 Years | 4 (100.0%) | 0 (0.0%) |
| 30 to 34 Years | 9 (100.0%) | 0 (0.0%) |
| 35 to 44 Years | 43 (76.8%) | 0 (0.0%) |
| 45 to 54 Years | 38 (88.4%) | 0 (0.0%) |
| 55 to 59 Years | 67 (75.3%) | 4 (6.0%) |
| 60 to 64 Years | 27 (64.3%) | 0 (0.0%) |
| 65 to 74 Years | 13 (26.0%) | 0 (0.0%) |
| 75 Years and over | 2 (2.5%) | 0 (0.0%) |
| Total | 242 (55.8%) | 4 (1.7%) |
Employment Status by Educational Attainment in Star Harbor
According to labor force statistics for Star Harbor, 77.4% of individuals (188) out of the total population between 25 and 64 years of age (243) are in the labor force, with 2.1% or 4 of them being unemployed. The group with the highest labor force participation rate are those with the educational attainment of bachelor's degree or higher, with 85.0% or 108 individuals in the labor force. Within the labor force, individuals with bachelor's degree or higher education have the highest percentage of unemployment, with 3.7% or 4 of them being unemployed.
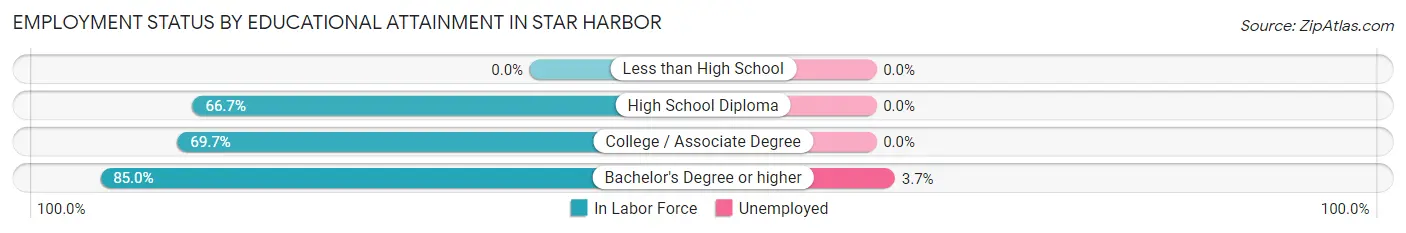
| Educational Attainment | In Labor Force | Unemployed |
| Less than High School | 0 (0.0%) | 0 (0.0%) |
| High School Diploma | 18 (66.7%) | 0 (0.0%) |
| College / Associate Degree | 62 (69.7%) | 0 (0.0%) |
| Bachelor's Degree or higher | 108 (85.0%) | 5 (3.7%) |
| Total | 188 (77.4%) | 5 (2.1%) |
Employment Occupations by Sex in Star Harbor
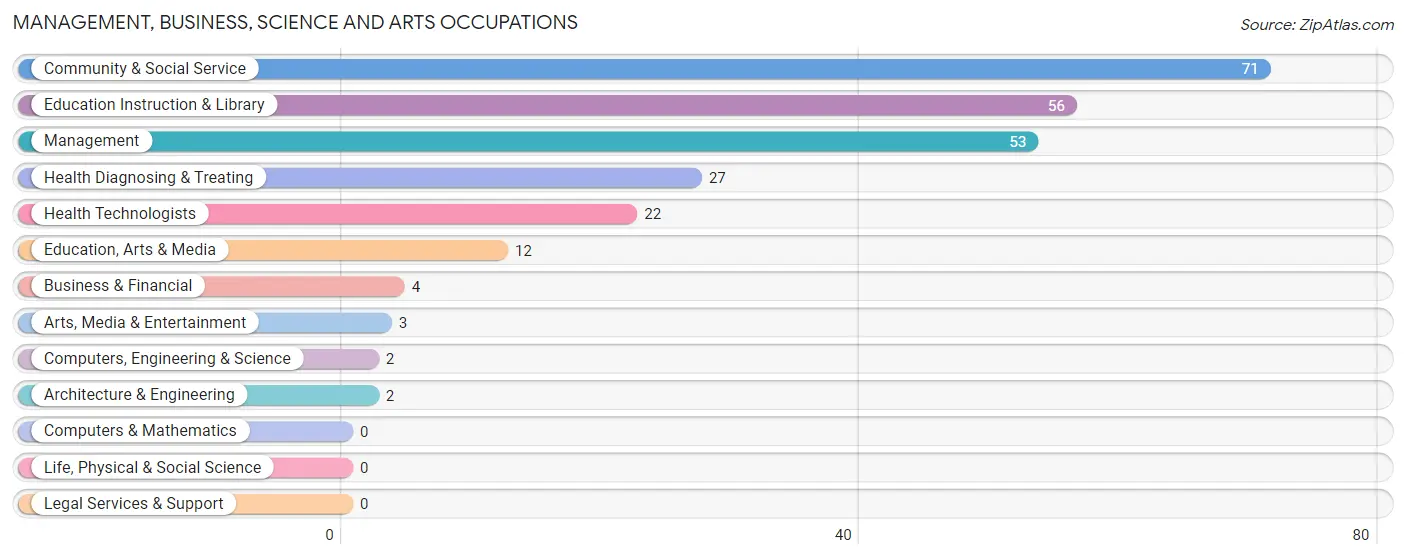
Management, Business, Science and Arts Occupations
The most common Management, Business, Science and Arts occupations in Star Harbor are Community & Social Service (71 | 29.8%), Education Instruction & Library (56 | 23.5%), Management (53 | 22.3%), Health Diagnosing & Treating (27 | 11.3%), and Health Technologists (22 | 9.2%).
Management, Business, Science and Arts Occupations by Sex
Within the Management, Business, Science and Arts occupations in Star Harbor, the most male-oriented occupations are Business & Financial (100.0%), Computers, Engineering & Science (100.0%), and Architecture & Engineering (100.0%), while the most female-oriented occupations are Health Technologists (100.0%), Health Diagnosing & Treating (96.3%), and Education Instruction & Library (89.3%).
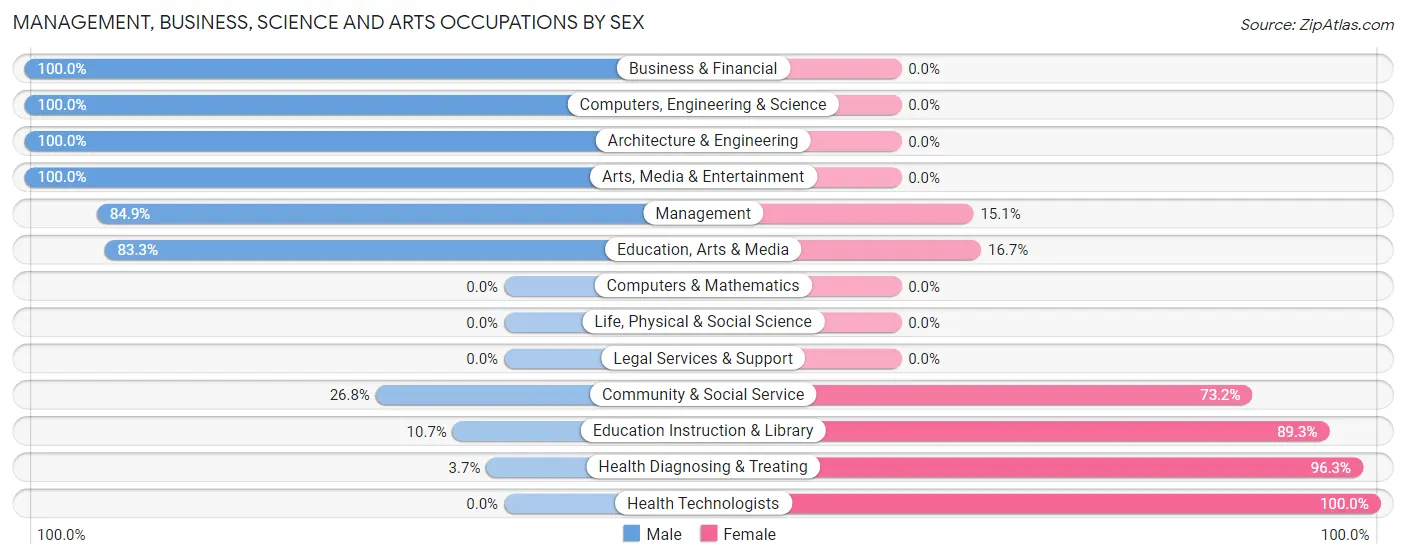
| Occupation | Male | Female |
| Management | 45 (84.9%) | 8 (15.1%) |
| Business & Financial | 4 (100.0%) | 0 (0.0%) |
| Computers, Engineering & Science | 2 (100.0%) | 0 (0.0%) |
| Computers & Mathematics | 0 (0.0%) | 0 (0.0%) |
| Architecture & Engineering | 2 (100.0%) | 0 (0.0%) |
| Life, Physical & Social Science | 0 (0.0%) | 0 (0.0%) |
| Community & Social Service | 19 (26.8%) | 52 (73.2%) |
| Education, Arts & Media | 10 (83.3%) | 2 (16.7%) |
| Legal Services & Support | 0 (0.0%) | 0 (0.0%) |
| Education Instruction & Library | 6 (10.7%) | 50 (89.3%) |
| Arts, Media & Entertainment | 3 (100.0%) | 0 (0.0%) |
| Health Diagnosing & Treating | 1 (3.7%) | 26 (96.3%) |
| Health Technologists | 0 (0.0%) | 22 (100.0%) |
| Total (Category) | 71 (45.2%) | 86 (54.8%) |
| Total (Overall) | 132 (55.5%) | 106 (44.5%) |
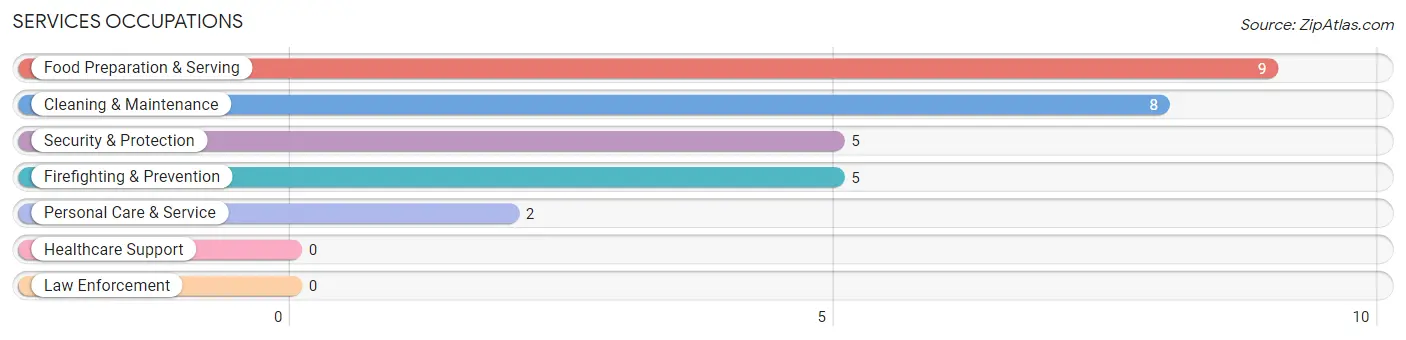
Services Occupations
The most common Services occupations in Star Harbor are Food Preparation & Serving (9 | 3.8%), Cleaning & Maintenance (8 | 3.4%), Security & Protection (5 | 2.1%), Firefighting & Prevention (5 | 2.1%), and Personal Care & Service (2 | 0.8%).
Services Occupations by Sex
Within the Services occupations in Star Harbor, the most male-oriented occupations are Security & Protection (100.0%), Firefighting & Prevention (100.0%), and Cleaning & Maintenance (100.0%), while the most female-oriented occupations are Food Preparation & Serving (100.0%), and Personal Care & Service (100.0%).
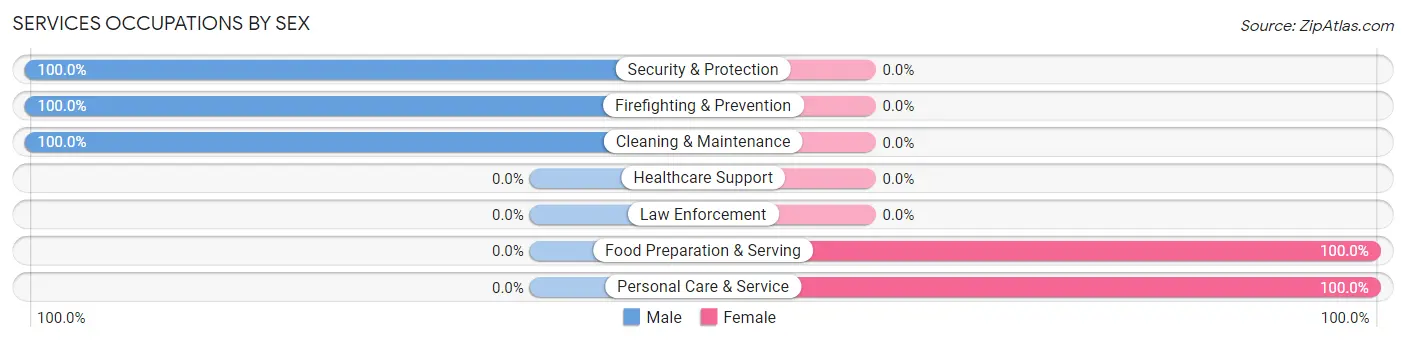
| Occupation | Male | Female |
| Healthcare Support | 0 (0.0%) | 0 (0.0%) |
| Security & Protection | 5 (100.0%) | 0 (0.0%) |
| Firefighting & Prevention | 5 (100.0%) | 0 (0.0%) |
| Law Enforcement | 0 (0.0%) | 0 (0.0%) |
| Food Preparation & Serving | 0 (0.0%) | 9 (100.0%) |
| Cleaning & Maintenance | 8 (100.0%) | 0 (0.0%) |
| Personal Care & Service | 0 (0.0%) | 2 (100.0%) |
| Total (Category) | 13 (54.2%) | 11 (45.8%) |
| Total (Overall) | 132 (55.5%) | 106 (44.5%) |
Sales and Office Occupations
The most common Sales and Office occupations in Star Harbor are Sales & Related (12 | 5.0%), and Office & Administration (4 | 1.7%).
Sales and Office Occupations by Sex
| Occupation | Male | Female |
| Sales & Related | 7 (58.3%) | 5 (41.7%) |
| Office & Administration | 0 (0.0%) | 4 (100.0%) |
| Total (Category) | 7 (43.8%) | 9 (56.2%) |
| Total (Overall) | 132 (55.5%) | 106 (44.5%) |
Natural Resources, Construction and Maintenance Occupations
The most common Natural Resources, Construction and Maintenance occupations in Star Harbor are Construction & Extraction (13 | 5.5%), and Installation, Maintenance & Repair (7 | 2.9%).
Natural Resources, Construction and Maintenance Occupations by Sex
| Occupation | Male | Female |
| Farming, Fishing & Forestry | 0 (0.0%) | 0 (0.0%) |
| Construction & Extraction | 13 (100.0%) | 0 (0.0%) |
| Installation, Maintenance & Repair | 7 (100.0%) | 0 (0.0%) |
| Total (Category) | 20 (100.0%) | 0 (0.0%) |
| Total (Overall) | 132 (55.5%) | 106 (44.5%) |
Production, Transportation and Moving Occupations
The most common Production, Transportation and Moving occupations in Star Harbor are Material Moving (11 | 4.6%), Production (8 | 3.4%), and Transportation (2 | 0.8%).
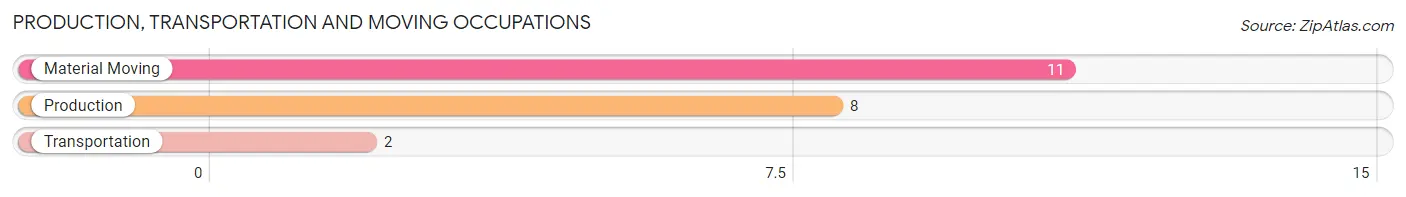
Production, Transportation and Moving Occupations by Sex
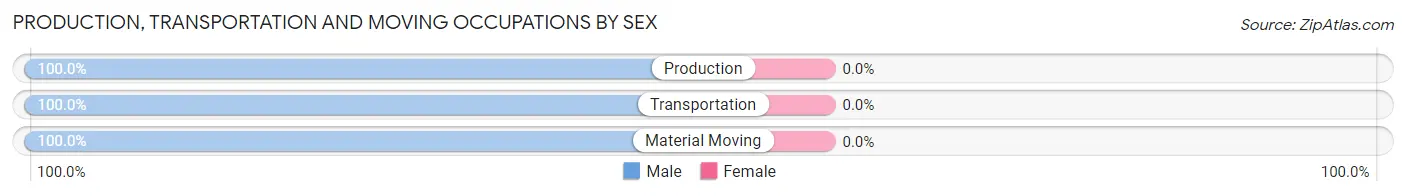
| Occupation | Male | Female |
| Production | 8 (100.0%) | 0 (0.0%) |
| Transportation | 2 (100.0%) | 0 (0.0%) |
| Material Moving | 11 (100.0%) | 0 (0.0%) |
| Total (Category) | 21 (100.0%) | 0 (0.0%) |
| Total (Overall) | 132 (55.5%) | 106 (44.5%) |
Employment Industries by Sex in Star Harbor
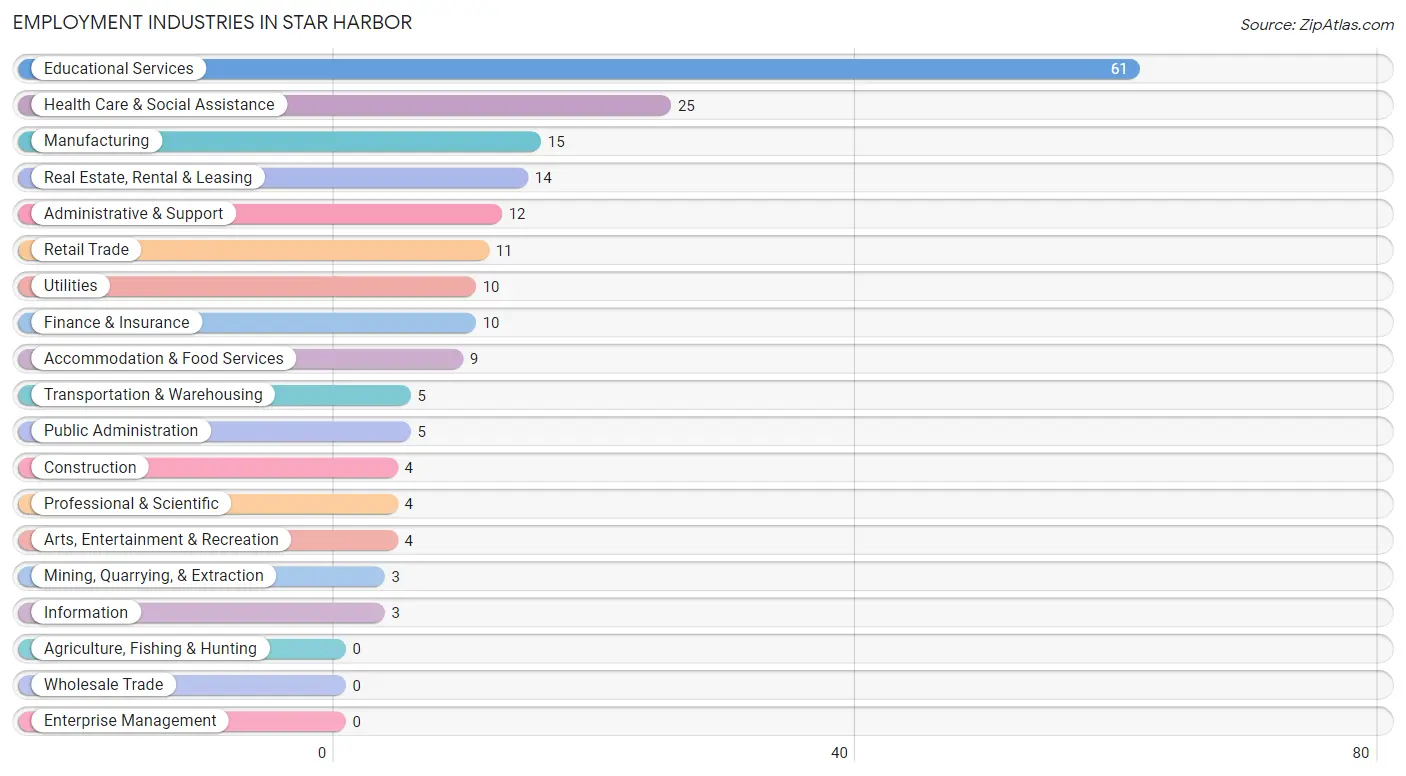
Employment Industries in Star Harbor
The major employment industries in Star Harbor include Educational Services (61 | 25.6%), Health Care & Social Assistance (25 | 10.5%), Manufacturing (15 | 6.3%), Real Estate, Rental & Leasing (14 | 5.9%), and Administrative & Support (12 | 5.0%).
Employment Industries by Sex in Star Harbor
The Star Harbor industries that see more men than women are Mining, Quarrying, & Extraction (100.0%), Construction (100.0%), and Manufacturing (100.0%), whereas the industries that tend to have a higher number of women are Accommodation & Food Services (100.0%), Health Care & Social Assistance (96.0%), and Educational Services (85.3%).
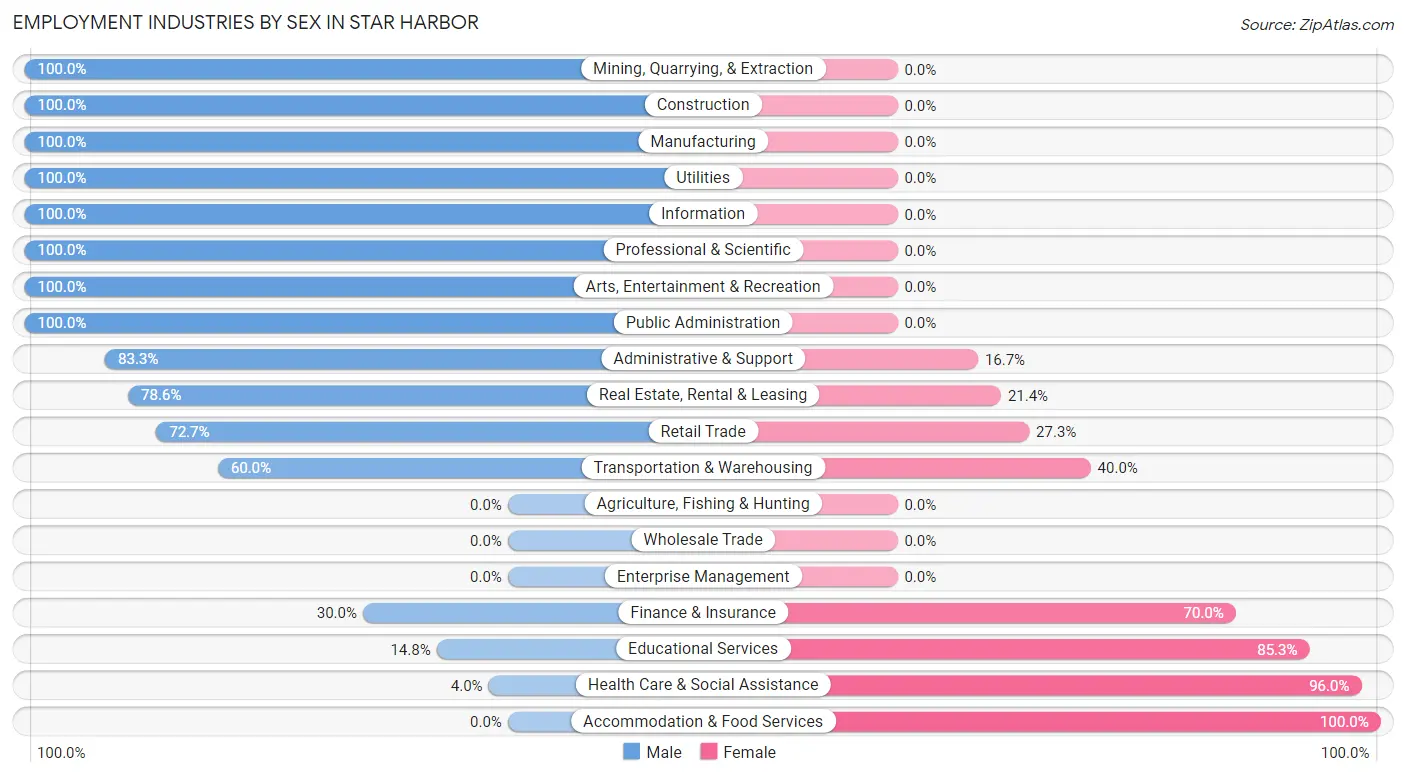
| Industry | Male | Female |
| Agriculture, Fishing & Hunting | 0 (0.0%) | 0 (0.0%) |
| Mining, Quarrying, & Extraction | 3 (100.0%) | 0 (0.0%) |
| Construction | 4 (100.0%) | 0 (0.0%) |
| Manufacturing | 15 (100.0%) | 0 (0.0%) |
| Wholesale Trade | 0 (0.0%) | 0 (0.0%) |
| Retail Trade | 8 (72.7%) | 3 (27.3%) |
| Transportation & Warehousing | 3 (60.0%) | 2 (40.0%) |
| Utilities | 10 (100.0%) | 0 (0.0%) |
| Information | 3 (100.0%) | 0 (0.0%) |
| Finance & Insurance | 3 (30.0%) | 7 (70.0%) |
| Real Estate, Rental & Leasing | 11 (78.6%) | 3 (21.4%) |
| Professional & Scientific | 4 (100.0%) | 0 (0.0%) |
| Enterprise Management | 0 (0.0%) | 0 (0.0%) |
| Administrative & Support | 10 (83.3%) | 2 (16.7%) |
| Educational Services | 9 (14.7%) | 52 (85.3%) |
| Health Care & Social Assistance | 1 (4.0%) | 24 (96.0%) |
| Arts, Entertainment & Recreation | 4 (100.0%) | 0 (0.0%) |
| Accommodation & Food Services | 0 (0.0%) | 9 (100.0%) |
| Public Administration | 5 (100.0%) | 0 (0.0%) |
| Total | 132 (55.5%) | 106 (44.5%) |
Education in Star Harbor
School Enrollment in Star Harbor
The most common levels of schooling among the 132 students in Star Harbor are middle school (45 | 34.1%), high school (45 | 34.1%), and college / undergraduate (14 | 10.6%).
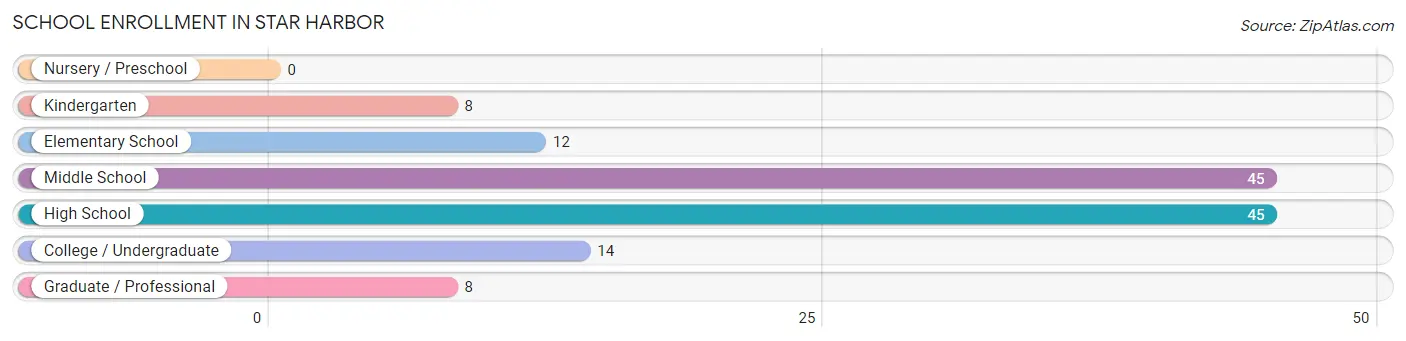
| School Level | # Students | % Students |
| Nursery / Preschool | 0 | 0.0% |
| Kindergarten | 8 | 6.1% |
| Elementary School | 12 | 9.1% |
| Middle School | 45 | 34.1% |
| High School | 45 | 34.1% |
| College / Undergraduate | 14 | 10.6% |
| Graduate / Professional | 8 | 6.1% |
| Total | 132 | 100.0% |
School Enrollment by Age by Funding Source in Star Harbor
Out of a total of 132 students who are enrolled in schools in Star Harbor, 19 (14.4%) attend a private institution, while the remaining 113 (85.6%) are enrolled in public schools. The age group of 5 to 9 year old has the highest likelihood of being enrolled in private schools, with 13 (76.5% in the age bracket) enrolled. Conversely, the age group of 15 to 17 year olds has the lowest likelihood of being enrolled in a private school, with 36 (100.0% in the age bracket) attending a public institution.
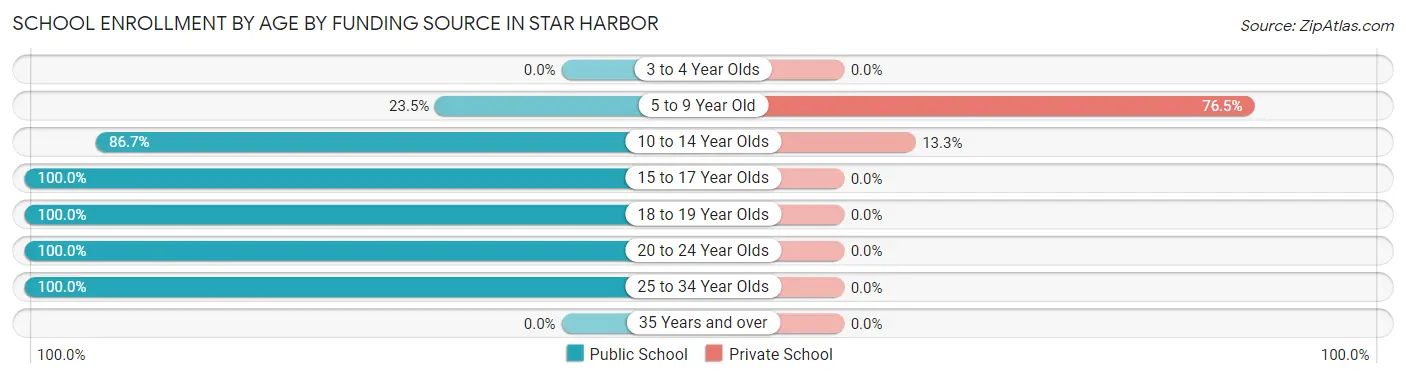
| Age Bracket | Public School | Private School |
| 3 to 4 Year Olds | 0 (0.0%) | 0 (0.0%) |
| 5 to 9 Year Old | 4 (23.5%) | 13 (76.5%) |
| 10 to 14 Year Olds | 39 (86.7%) | 6 (13.3%) |
| 15 to 17 Year Olds | 36 (100.0%) | 0 (0.0%) |
| 18 to 19 Year Olds | 15 (100.0%) | 0 (0.0%) |
| 20 to 24 Year Olds | 17 (100.0%) | 0 (0.0%) |
| 25 to 34 Year Olds | 2 (100.0%) | 0 (0.0%) |
| 35 Years and over | 0 (0.0%) | 0 (0.0%) |
| Total | 113 (85.6%) | 19 (14.4%) |
Educational Attainment by Field of Study in Star Harbor
Business (55 | 26.6%), education (54 | 26.1%), psychology (18 | 8.7%), science & technology (18 | 8.7%), and arts & humanities (14 | 6.8%) are the most common fields of study among 207 individuals in Star Harbor who have obtained a bachelor's degree or higher.
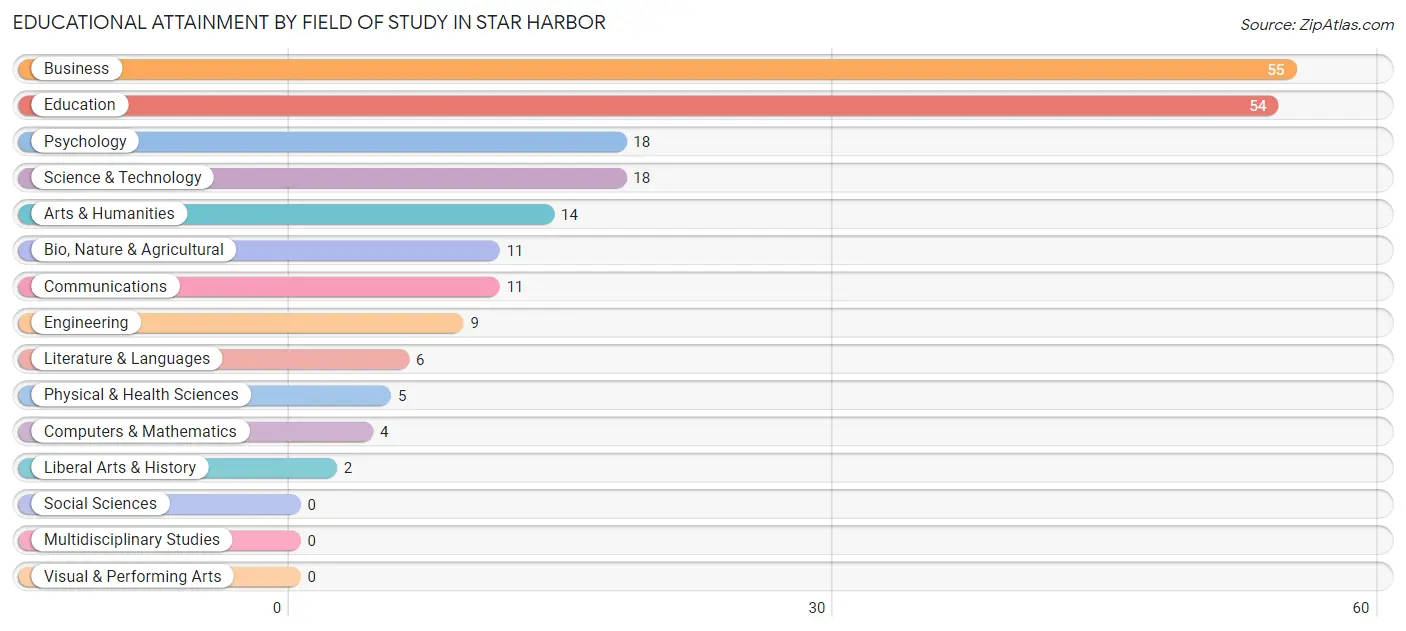
| Field of Study | # Graduates | % Graduates |
| Computers & Mathematics | 4 | 1.9% |
| Bio, Nature & Agricultural | 11 | 5.3% |
| Physical & Health Sciences | 5 | 2.4% |
| Psychology | 18 | 8.7% |
| Social Sciences | 0 | 0.0% |
| Engineering | 9 | 4.3% |
| Multidisciplinary Studies | 0 | 0.0% |
| Science & Technology | 18 | 8.7% |
| Business | 55 | 26.6% |
| Education | 54 | 26.1% |
| Literature & Languages | 6 | 2.9% |
| Liberal Arts & History | 2 | 1.0% |
| Visual & Performing Arts | 0 | 0.0% |
| Communications | 11 | 5.3% |
| Arts & Humanities | 14 | 6.8% |
| Total | 207 | 100.0% |
Transportation & Commute in Star Harbor
Vehicle Availability by Sex in Star Harbor
The most prevalent vehicle ownership categories in Star Harbor are males with 2 vehicles (64, accounting for 48.5%) and females with 2 vehicles (42, making up 62.7%).
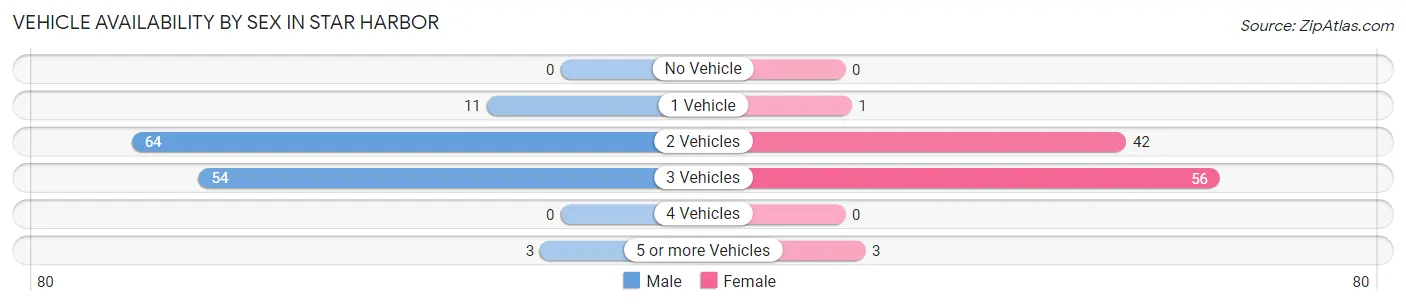
| Vehicles Available | Male | Female |
| No Vehicle | 0 (0.0%) | 0 (0.0%) |
| 1 Vehicle | 11 (8.3%) | 1 (1.0%) |
| 2 Vehicles | 64 (48.5%) | 42 (41.2%) |
| 3 Vehicles | 54 (40.9%) | 56 (54.9%) |
| 4 Vehicles | 0 (0.0%) | 0 (0.0%) |
| 5 or more Vehicles | 3 (2.3%) | 3 (2.9%) |
| Total | 132 (100.0%) | 102 (100.0%) |
Commute Time in Star Harbor
The most frequently occuring commute durations in Star Harbor are 90 or more minutes (40 commuters, 17.5%), 20 to 24 minutes (37 commuters, 16.2%), and 10 to 14 minutes (31 commuters, 13.6%).
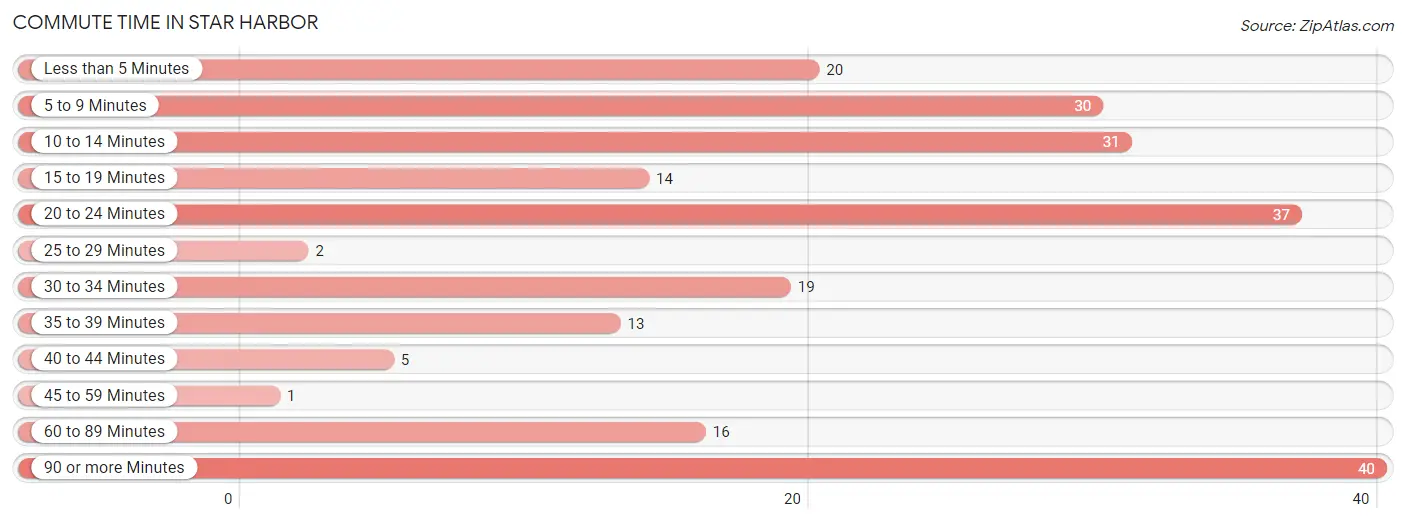
| Commute Time | # Commuters | % Commuters |
| Less than 5 Minutes | 20 | 8.8% |
| 5 to 9 Minutes | 30 | 13.2% |
| 10 to 14 Minutes | 31 | 13.6% |
| 15 to 19 Minutes | 14 | 6.1% |
| 20 to 24 Minutes | 37 | 16.2% |
| 25 to 29 Minutes | 2 | 0.9% |
| 30 to 34 Minutes | 19 | 8.3% |
| 35 to 39 Minutes | 13 | 5.7% |
| 40 to 44 Minutes | 5 | 2.2% |
| 45 to 59 Minutes | 1 | 0.4% |
| 60 to 89 Minutes | 16 | 7.0% |
| 90 or more Minutes | 40 | 17.5% |
Commute Time by Sex in Star Harbor
The most common commute times in Star Harbor are 90 or more minutes (39 commuters, 30.9%) for males and 20 to 24 minutes (30 commuters, 29.4%) for females.
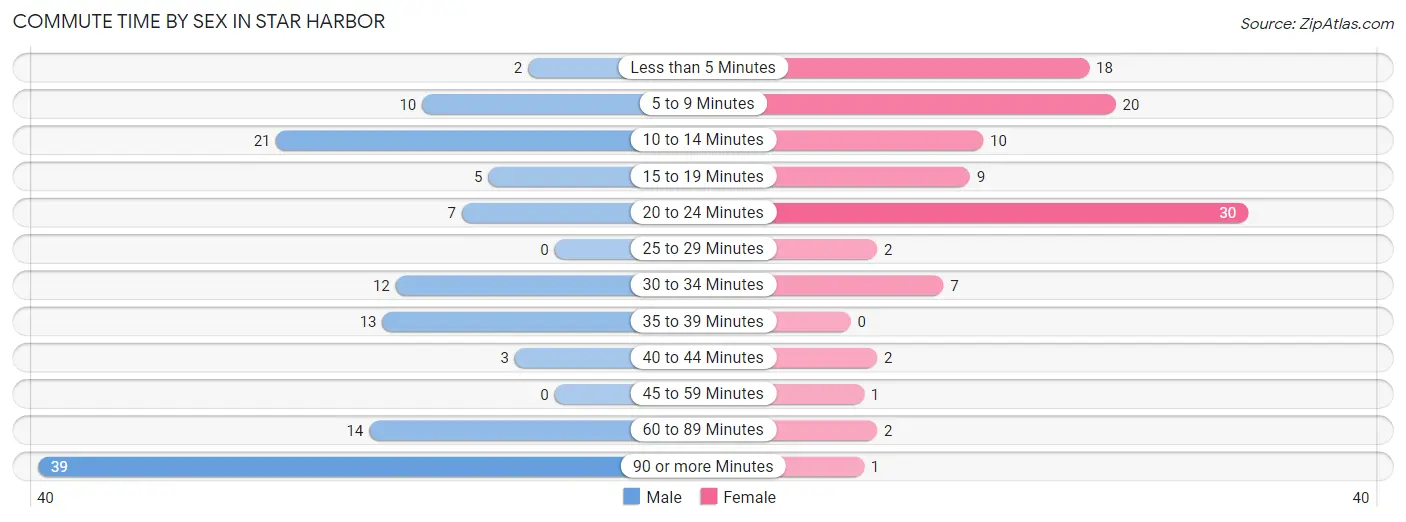
| Commute Time | Male | Female |
| Less than 5 Minutes | 2 (1.6%) | 18 (17.6%) |
| 5 to 9 Minutes | 10 (7.9%) | 20 (19.6%) |
| 10 to 14 Minutes | 21 (16.7%) | 10 (9.8%) |
| 15 to 19 Minutes | 5 (4.0%) | 9 (8.8%) |
| 20 to 24 Minutes | 7 (5.6%) | 30 (29.4%) |
| 25 to 29 Minutes | 0 (0.0%) | 2 (2.0%) |
| 30 to 34 Minutes | 12 (9.5%) | 7 (6.9%) |
| 35 to 39 Minutes | 13 (10.3%) | 0 (0.0%) |
| 40 to 44 Minutes | 3 (2.4%) | 2 (2.0%) |
| 45 to 59 Minutes | 0 (0.0%) | 1 (1.0%) |
| 60 to 89 Minutes | 14 (11.1%) | 2 (2.0%) |
| 90 or more Minutes | 39 (30.9%) | 1 (1.0%) |
Time of Departure to Work by Sex in Star Harbor
The most frequent times of departure to work in Star Harbor are 7:00 AM to 7:29 AM (57, 45.2%) for males and 7:00 AM to 7:29 AM (32, 31.4%) for females.
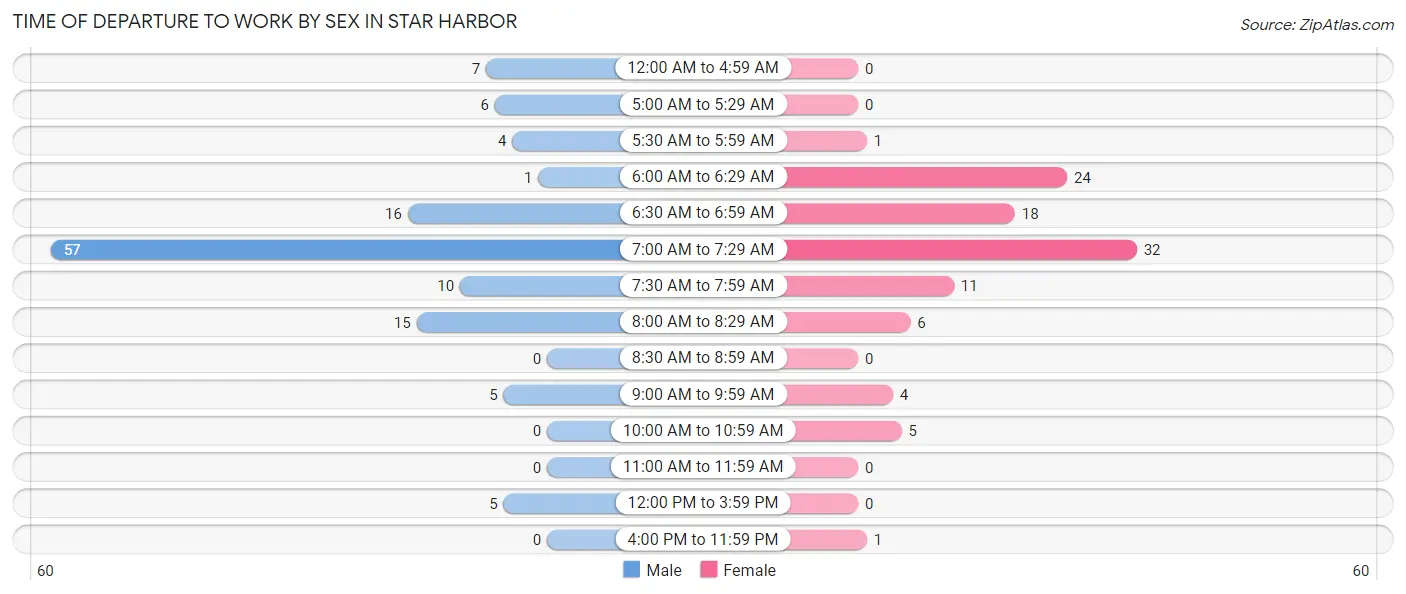
| Time of Departure | Male | Female |
| 12:00 AM to 4:59 AM | 7 (5.6%) | 0 (0.0%) |
| 5:00 AM to 5:29 AM | 6 (4.8%) | 0 (0.0%) |
| 5:30 AM to 5:59 AM | 4 (3.2%) | 1 (1.0%) |
| 6:00 AM to 6:29 AM | 1 (0.8%) | 24 (23.5%) |
| 6:30 AM to 6:59 AM | 16 (12.7%) | 18 (17.6%) |
| 7:00 AM to 7:29 AM | 57 (45.2%) | 32 (31.4%) |
| 7:30 AM to 7:59 AM | 10 (7.9%) | 11 (10.8%) |
| 8:00 AM to 8:29 AM | 15 (11.9%) | 6 (5.9%) |
| 8:30 AM to 8:59 AM | 0 (0.0%) | 0 (0.0%) |
| 9:00 AM to 9:59 AM | 5 (4.0%) | 4 (3.9%) |
| 10:00 AM to 10:59 AM | 0 (0.0%) | 5 (4.9%) |
| 11:00 AM to 11:59 AM | 0 (0.0%) | 0 (0.0%) |
| 12:00 PM to 3:59 PM | 5 (4.0%) | 0 (0.0%) |
| 4:00 PM to 11:59 PM | 0 (0.0%) | 1 (1.0%) |
| Total | 126 (100.0%) | 102 (100.0%) |
Housing Occupancy in Star Harbor
Occupancy by Ownership in Star Harbor
Of the total 224 dwellings in Star Harbor, owner-occupied units account for 212 (94.6%), while renter-occupied units make up 12 (5.4%).
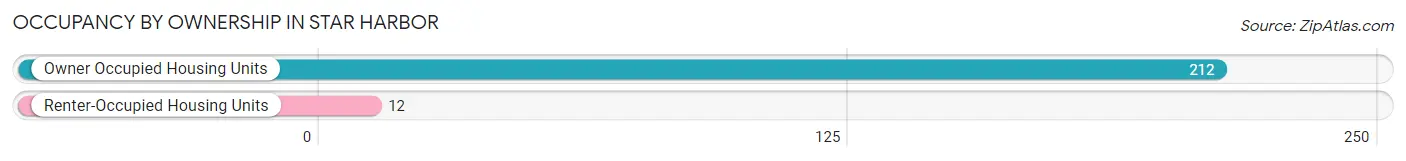
| Occupancy | # Housing Units | % Housing Units |
| Owner Occupied Housing Units | 212 | 94.6% |
| Renter-Occupied Housing Units | 12 | 5.4% |
| Total Occupied Housing Units | 224 | 100.0% |
Occupancy by Household Size in Star Harbor
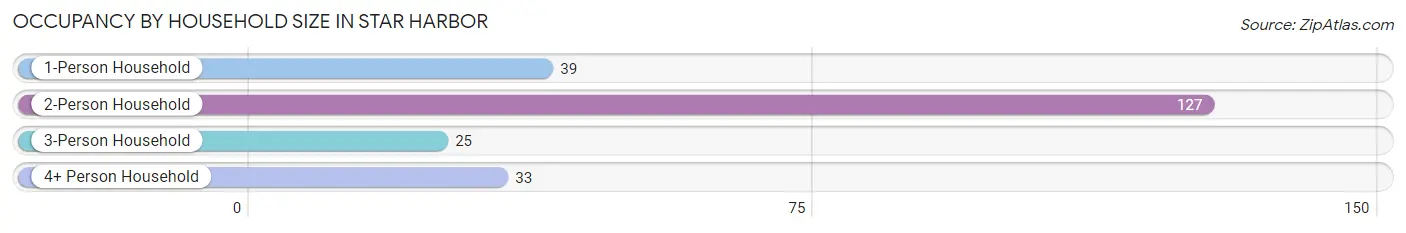
| Household Size | # Housing Units | % Housing Units |
| 1-Person Household | 39 | 17.4% |
| 2-Person Household | 127 | 56.7% |
| 3-Person Household | 25 | 11.2% |
| 4+ Person Household | 33 | 14.7% |
| Total Housing Units | 224 | 100.0% |
Occupancy by Ownership by Household Size in Star Harbor
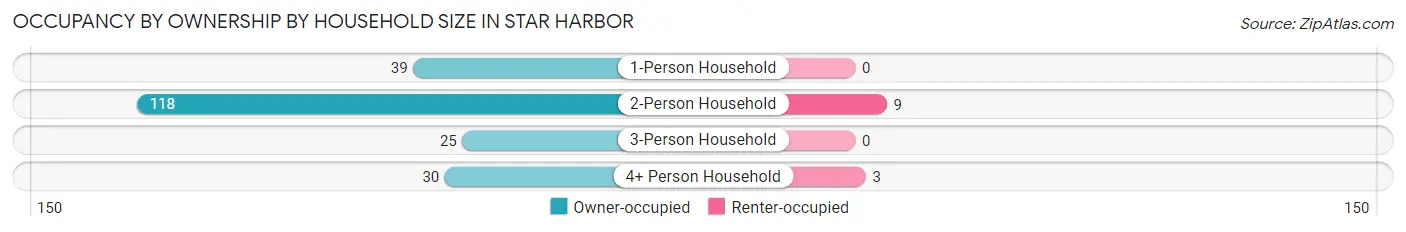
| Household Size | Owner-occupied | Renter-occupied |
| 1-Person Household | 39 (100.0%) | 0 (0.0%) |
| 2-Person Household | 118 (92.9%) | 9 (7.1%) |
| 3-Person Household | 25 (100.0%) | 0 (0.0%) |
| 4+ Person Household | 30 (90.9%) | 3 (9.1%) |
| Total Housing Units | 212 (94.6%) | 12 (5.4%) |
Occupancy by Educational Attainment in Star Harbor
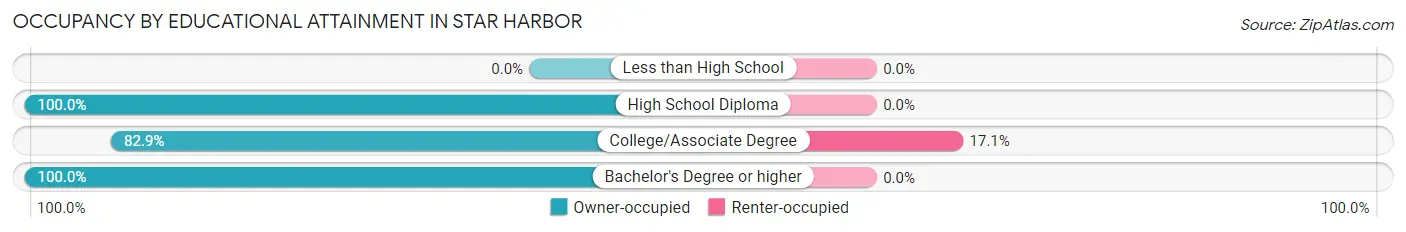
| Household Size | Owner-occupied | Renter-occupied |
| Less than High School | 0 (0.0%) | 0 (0.0%) |
| High School Diploma | 23 (100.0%) | 0 (0.0%) |
| College/Associate Degree | 58 (82.9%) | 12 (17.1%) |
| Bachelor's Degree or higher | 131 (100.0%) | 0 (0.0%) |
Occupancy by Age of Householder in Star Harbor
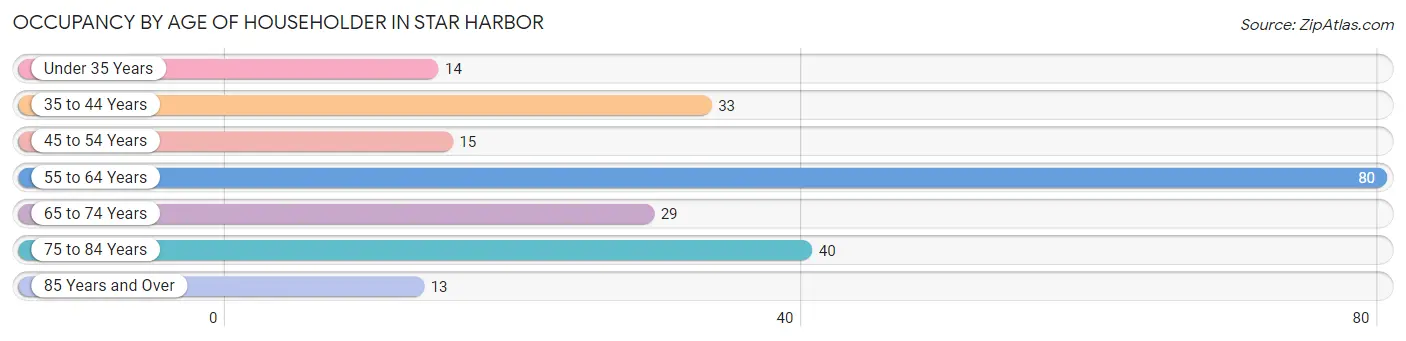
| Age Bracket | # Households | % Households |
| Under 35 Years | 14 | 6.2% |
| 35 to 44 Years | 33 | 14.7% |
| 45 to 54 Years | 15 | 6.7% |
| 55 to 64 Years | 80 | 35.7% |
| 65 to 74 Years | 29 | 13.0% |
| 75 to 84 Years | 40 | 17.9% |
| 85 Years and Over | 13 | 5.8% |
| Total | 224 | 100.0% |
Housing Finances in Star Harbor
Median Income by Occupancy in Star Harbor
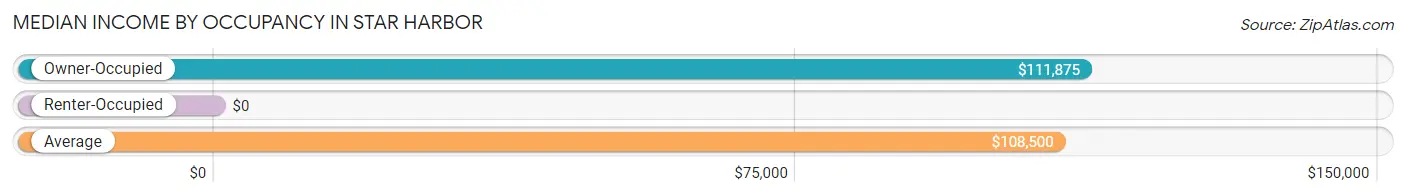
| Occupancy Type | # Households | Median Income |
| Owner-Occupied | 212 (94.6%) | $111,875 |
| Renter-Occupied | 12 (5.4%) | $0 |
| Average | 224 (100.0%) | $108,500 |
Occupancy by Householder Income Bracket in Star Harbor
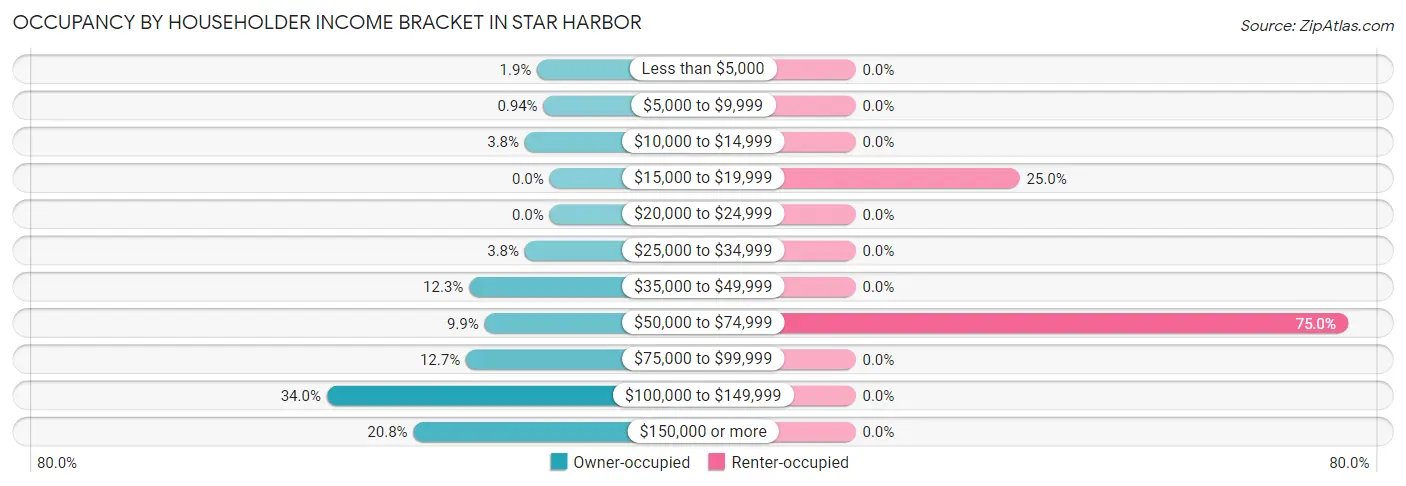
| Income Bracket | Owner-occupied | Renter-occupied |
| Less than $5,000 | 4 (1.9%) | 0 (0.0%) |
| $5,000 to $9,999 | 2 (0.9%) | 0 (0.0%) |
| $10,000 to $14,999 | 8 (3.8%) | 0 (0.0%) |
| $15,000 to $19,999 | 0 (0.0%) | 3 (25.0%) |
| $20,000 to $24,999 | 0 (0.0%) | 0 (0.0%) |
| $25,000 to $34,999 | 8 (3.8%) | 0 (0.0%) |
| $35,000 to $49,999 | 26 (12.3%) | 0 (0.0%) |
| $50,000 to $74,999 | 21 (9.9%) | 9 (75.0%) |
| $75,000 to $99,999 | 27 (12.7%) | 0 (0.0%) |
| $100,000 to $149,999 | 72 (34.0%) | 0 (0.0%) |
| $150,000 or more | 44 (20.7%) | 0 (0.0%) |
| Total | 212 (100.0%) | 12 (100.0%) |
Monthly Housing Cost Tiers in Star Harbor
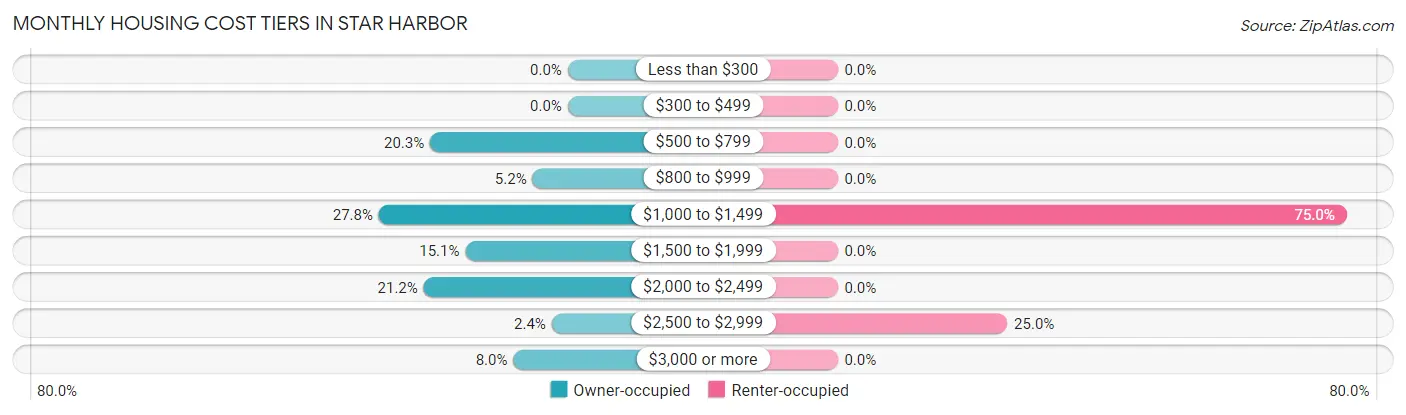
| Monthly Cost | Owner-occupied | Renter-occupied |
| Less than $300 | 0 (0.0%) | 0 (0.0%) |
| $300 to $499 | 0 (0.0%) | 0 (0.0%) |
| $500 to $799 | 43 (20.3%) | 0 (0.0%) |
| $800 to $999 | 11 (5.2%) | 0 (0.0%) |
| $1,000 to $1,499 | 59 (27.8%) | 9 (75.0%) |
| $1,500 to $1,999 | 32 (15.1%) | 0 (0.0%) |
| $2,000 to $2,499 | 45 (21.2%) | 0 (0.0%) |
| $2,500 to $2,999 | 5 (2.4%) | 3 (25.0%) |
| $3,000 or more | 17 (8.0%) | 0 (0.0%) |
| Total | 212 (100.0%) | 12 (100.0%) |
Physical Housing Characteristics in Star Harbor
Housing Structures in Star Harbor
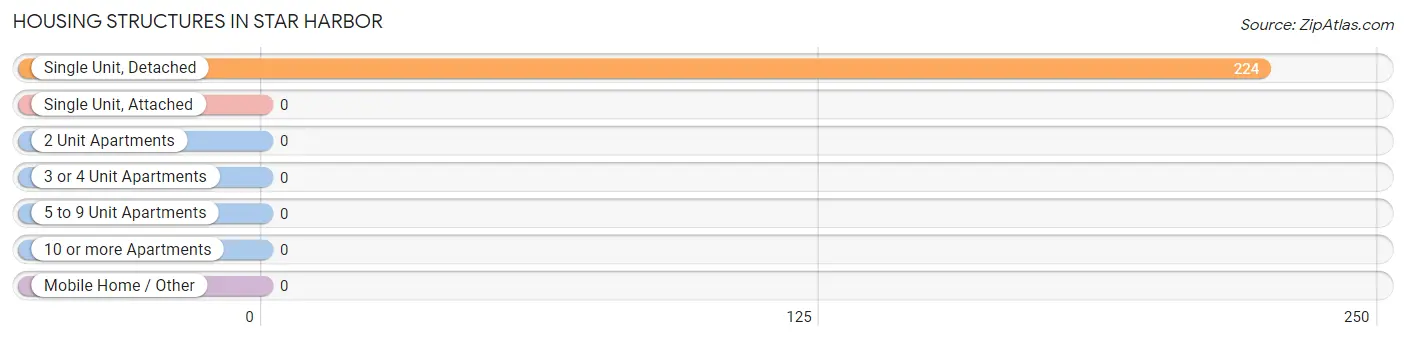
| Structure Type | # Housing Units | % Housing Units |
| Single Unit, Detached | 224 | 100.0% |
| Single Unit, Attached | 0 | 0.0% |
| 2 Unit Apartments | 0 | 0.0% |
| 3 or 4 Unit Apartments | 0 | 0.0% |
| 5 to 9 Unit Apartments | 0 | 0.0% |
| 10 or more Apartments | 0 | 0.0% |
| Mobile Home / Other | 0 | 0.0% |
| Total | 224 | 100.0% |
Housing Structures by Occupancy in Star Harbor
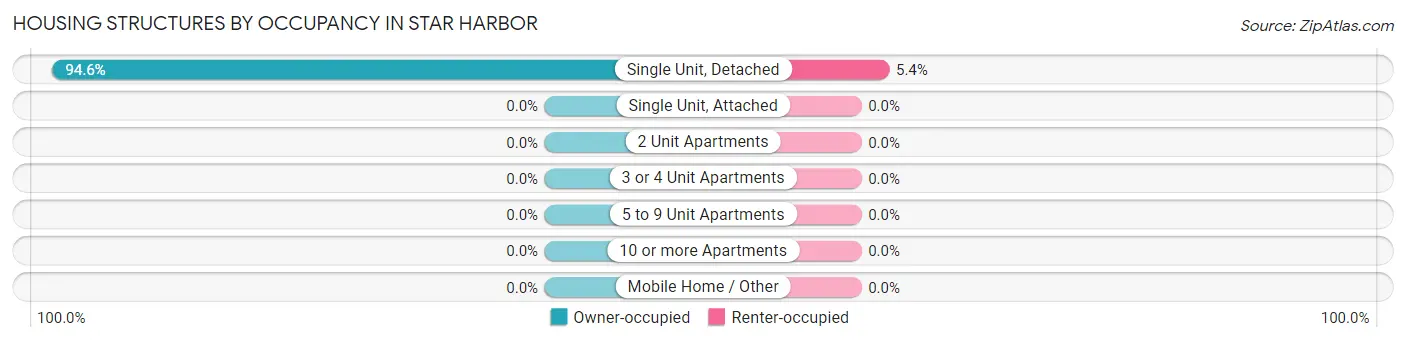
| Structure Type | Owner-occupied | Renter-occupied |
| Single Unit, Detached | 212 (94.6%) | 12 (5.4%) |
| Single Unit, Attached | 0 (0.0%) | 0 (0.0%) |
| 2 Unit Apartments | 0 (0.0%) | 0 (0.0%) |
| 3 or 4 Unit Apartments | 0 (0.0%) | 0 (0.0%) |
| 5 to 9 Unit Apartments | 0 (0.0%) | 0 (0.0%) |
| 10 or more Apartments | 0 (0.0%) | 0 (0.0%) |
| Mobile Home / Other | 0 (0.0%) | 0 (0.0%) |
| Total | 212 (94.6%) | 12 (5.4%) |
Housing Structures by Number of Rooms in Star Harbor
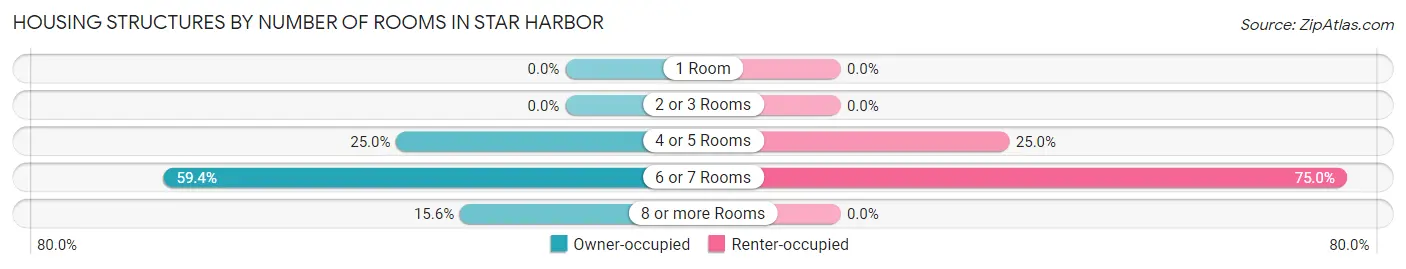
| Number of Rooms | Owner-occupied | Renter-occupied |
| 1 Room | 0 (0.0%) | 0 (0.0%) |
| 2 or 3 Rooms | 0 (0.0%) | 0 (0.0%) |
| 4 or 5 Rooms | 53 (25.0%) | 3 (25.0%) |
| 6 or 7 Rooms | 126 (59.4%) | 9 (75.0%) |
| 8 or more Rooms | 33 (15.6%) | 0 (0.0%) |
| Total | 212 (100.0%) | 12 (100.0%) |
Housing Structure by Heating Type in Star Harbor
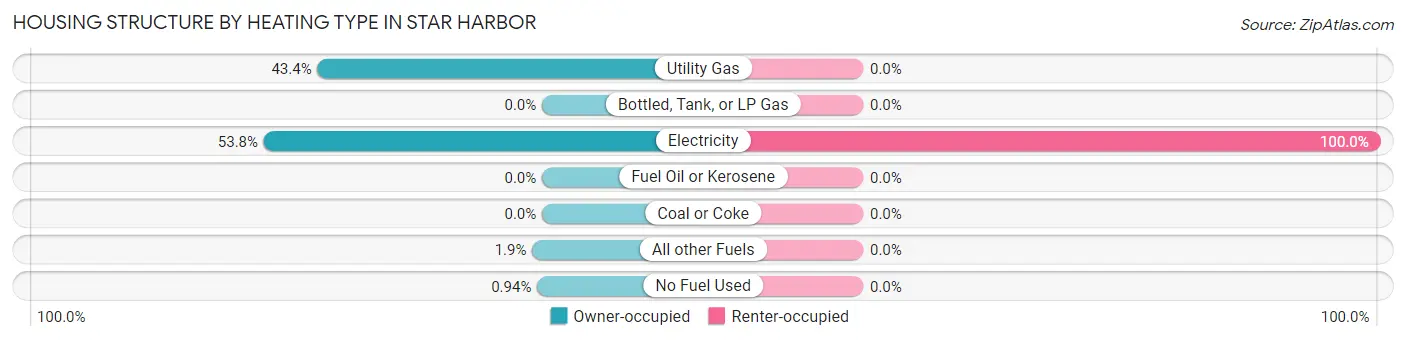
| Heating Type | Owner-occupied | Renter-occupied |
| Utility Gas | 92 (43.4%) | 0 (0.0%) |
| Bottled, Tank, or LP Gas | 0 (0.0%) | 0 (0.0%) |
| Electricity | 114 (53.8%) | 12 (100.0%) |
| Fuel Oil or Kerosene | 0 (0.0%) | 0 (0.0%) |
| Coal or Coke | 0 (0.0%) | 0 (0.0%) |
| All other Fuels | 4 (1.9%) | 0 (0.0%) |
| No Fuel Used | 2 (0.9%) | 0 (0.0%) |
| Total | 212 (100.0%) | 12 (100.0%) |
Household Vehicle Usage in Star Harbor
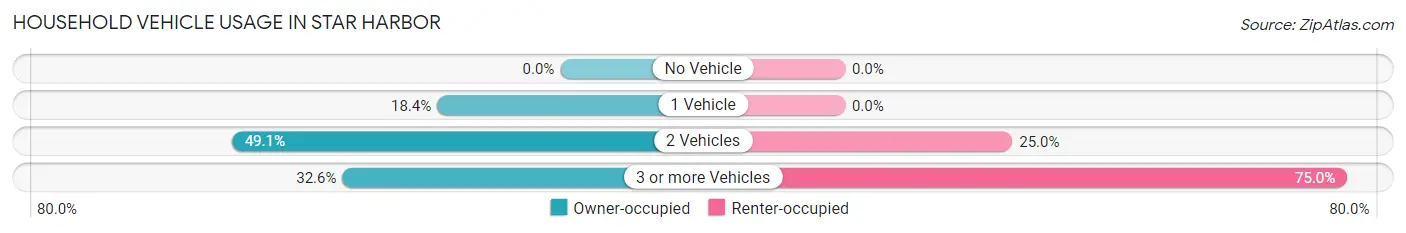
| Vehicles per Household | Owner-occupied | Renter-occupied |
| No Vehicle | 0 (0.0%) | 0 (0.0%) |
| 1 Vehicle | 39 (18.4%) | 0 (0.0%) |
| 2 Vehicles | 104 (49.1%) | 3 (25.0%) |
| 3 or more Vehicles | 69 (32.6%) | 9 (75.0%) |
| Total | 212 (100.0%) | 12 (100.0%) |
Real Estate & Mortgages in Star Harbor
Real Estate and Mortgage Overview in Star Harbor
| Characteristic | Without Mortgage | With Mortgage |
| Housing Units | 92 | 120 |
| Median Property Value | $335,500 | $289,000 |
| Median Household Income | $82,500 | $23 |
| Monthly Housing Costs | $844 | $17 |
| Real Estate Taxes | $4,500 | $0 |
Property Value by Mortgage Status in Star Harbor
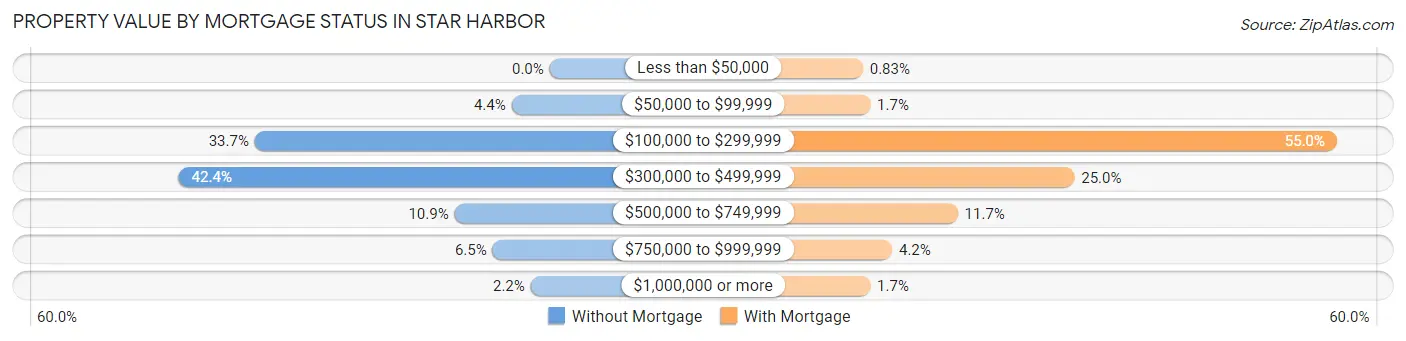
| Property Value | Without Mortgage | With Mortgage |
| Less than $50,000 | 0 (0.0%) | 1 (0.8%) |
| $50,000 to $99,999 | 4 (4.3%) | 2 (1.7%) |
| $100,000 to $299,999 | 31 (33.7%) | 66 (55.0%) |
| $300,000 to $499,999 | 39 (42.4%) | 30 (25.0%) |
| $500,000 to $749,999 | 10 (10.9%) | 14 (11.7%) |
| $750,000 to $999,999 | 6 (6.5%) | 5 (4.2%) |
| $1,000,000 or more | 2 (2.2%) | 2 (1.7%) |
| Total | 92 (100.0%) | 120 (100.0%) |
Household Income by Mortgage Status in Star Harbor
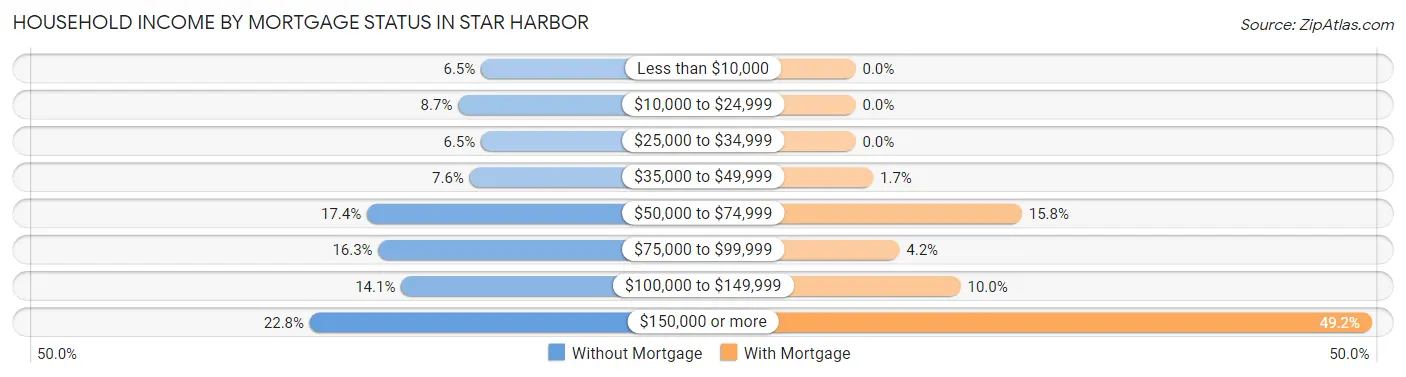
| Household Income | Without Mortgage | With Mortgage |
| Less than $10,000 | 6 (6.5%) | 0 (0.0%) |
| $10,000 to $24,999 | 8 (8.7%) | 0 (0.0%) |
| $25,000 to $34,999 | 6 (6.5%) | 0 (0.0%) |
| $35,000 to $49,999 | 7 (7.6%) | 2 (1.7%) |
| $50,000 to $74,999 | 16 (17.4%) | 19 (15.8%) |
| $75,000 to $99,999 | 15 (16.3%) | 5 (4.2%) |
| $100,000 to $149,999 | 13 (14.1%) | 12 (10.0%) |
| $150,000 or more | 21 (22.8%) | 59 (49.2%) |
| Total | 92 (100.0%) | 120 (100.0%) |
Property Value to Household Income Ratio in Star Harbor

| Value-to-Income Ratio | Without Mortgage | With Mortgage |
| Less than 2.0x | 15 (16.3%) | 116,500 (97,083.3%) |
| 2.0x to 2.9x | 22 (23.9%) | 25 (20.8%) |
| 3.0x to 3.9x | 13 (14.1%) | 67 (55.8%) |
| 4.0x or more | 40 (43.5%) | 0 (0.0%) |
| Total | 92 (100.0%) | 120 (100.0%) |
Real Estate Taxes by Mortgage Status in Star Harbor
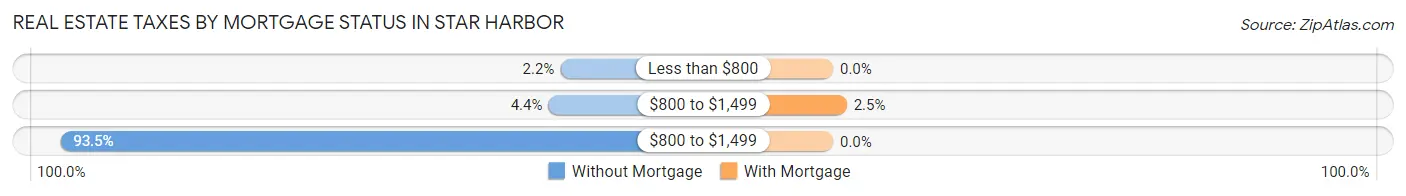
| Property Taxes | Without Mortgage | With Mortgage |
| Less than $800 | 2 (2.2%) | 0 (0.0%) |
| $800 to $1,499 | 4 (4.3%) | 3 (2.5%) |
| $800 to $1,499 | 86 (93.5%) | 0 (0.0%) |
| Total | 92 (100.0%) | 120 (100.0%) |
Health & Disability in Star Harbor
Health Insurance Coverage by Age in Star Harbor
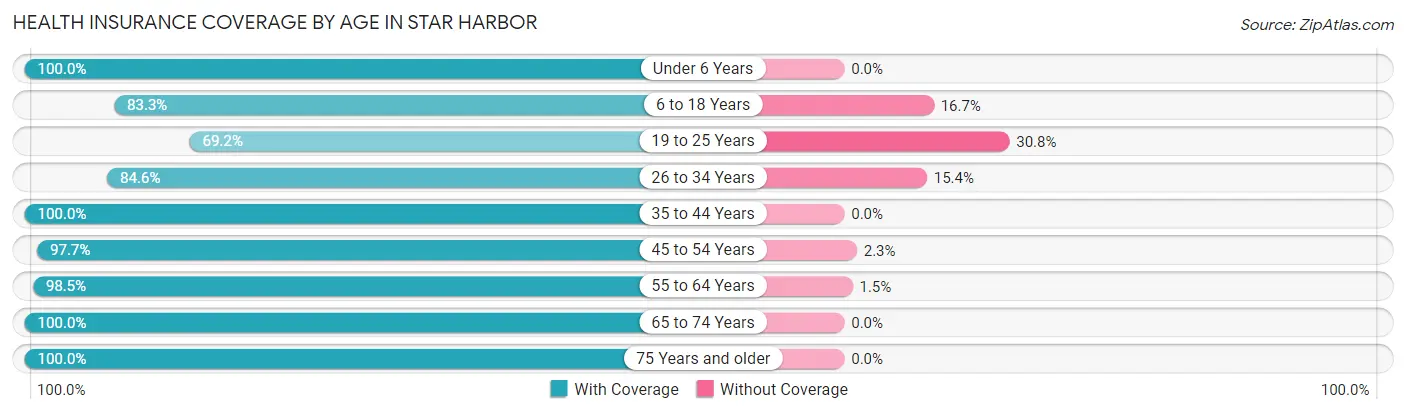
| Age Bracket | With Coverage | Without Coverage |
| Under 6 Years | 8 (100.0%) | 0 (0.0%) |
| 6 to 18 Years | 85 (83.3%) | 17 (16.7%) |
| 19 to 25 Years | 18 (69.2%) | 8 (30.8%) |
| 26 to 34 Years | 11 (84.6%) | 2 (15.4%) |
| 35 to 44 Years | 56 (100.0%) | 0 (0.0%) |
| 45 to 54 Years | 42 (97.7%) | 1 (2.3%) |
| 55 to 64 Years | 129 (98.5%) | 2 (1.5%) |
| 65 to 74 Years | 50 (100.0%) | 0 (0.0%) |
| 75 Years and older | 79 (100.0%) | 0 (0.0%) |
| Total | 478 (94.1%) | 30 (5.9%) |
Health Insurance Coverage by Citizenship Status in Star Harbor
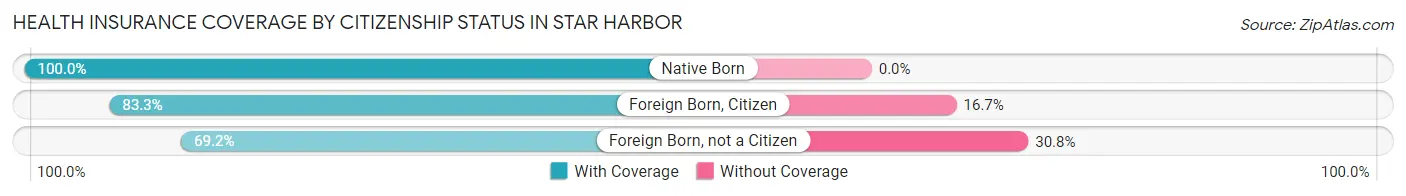
| Citizenship Status | With Coverage | Without Coverage |
| Native Born | 8 (100.0%) | 0 (0.0%) |
| Foreign Born, Citizen | 85 (83.3%) | 17 (16.7%) |
| Foreign Born, not a Citizen | 18 (69.2%) | 8 (30.8%) |
Health Insurance Coverage by Household Income in Star Harbor
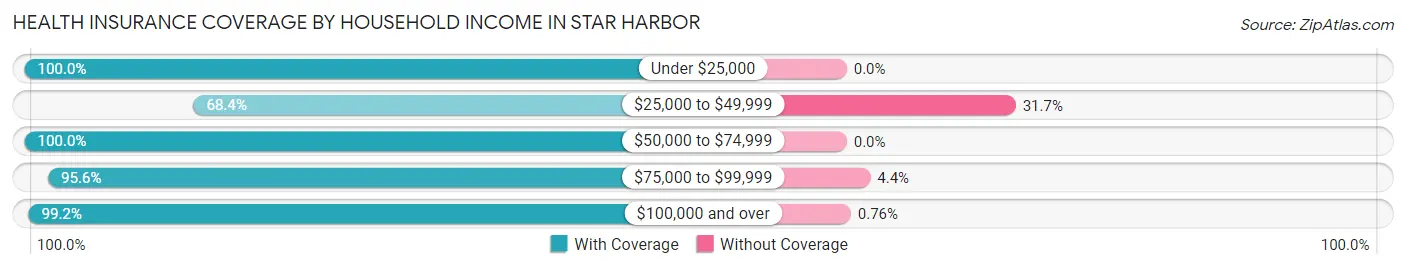
| Household Income | With Coverage | Without Coverage |
| Under $25,000 | 30 (100.0%) | 0 (0.0%) |
| $25,000 to $49,999 | 54 (68.3%) | 25 (31.7%) |
| $50,000 to $74,999 | 69 (100.0%) | 0 (0.0%) |
| $75,000 to $99,999 | 65 (95.6%) | 3 (4.4%) |
| $100,000 and over | 260 (99.2%) | 2 (0.8%) |
Public vs Private Health Insurance Coverage by Age in Star Harbor
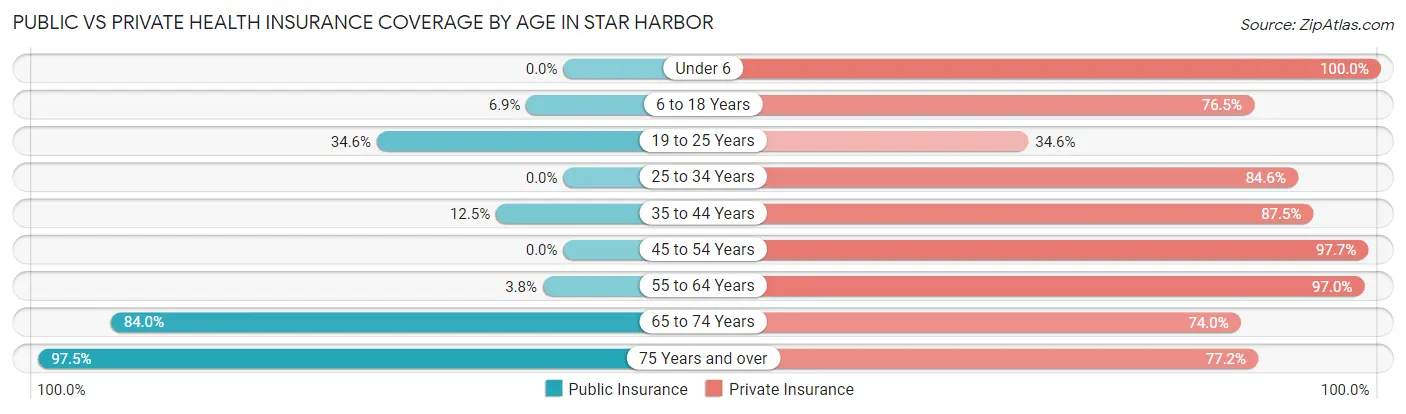
| Age Bracket | Public Insurance | Private Insurance |
| Under 6 | 0 (0.0%) | 8 (100.0%) |
| 6 to 18 Years | 7 (6.9%) | 78 (76.5%) |
| 19 to 25 Years | 9 (34.6%) | 9 (34.6%) |
| 25 to 34 Years | 0 (0.0%) | 11 (84.6%) |
| 35 to 44 Years | 7 (12.5%) | 49 (87.5%) |
| 45 to 54 Years | 0 (0.0%) | 42 (97.7%) |
| 55 to 64 Years | 5 (3.8%) | 127 (97.0%) |
| 65 to 74 Years | 42 (84.0%) | 37 (74.0%) |
| 75 Years and over | 77 (97.5%) | 61 (77.2%) |
| Total | 147 (28.9%) | 422 (83.1%) |
Disability Status by Sex by Age in Star Harbor
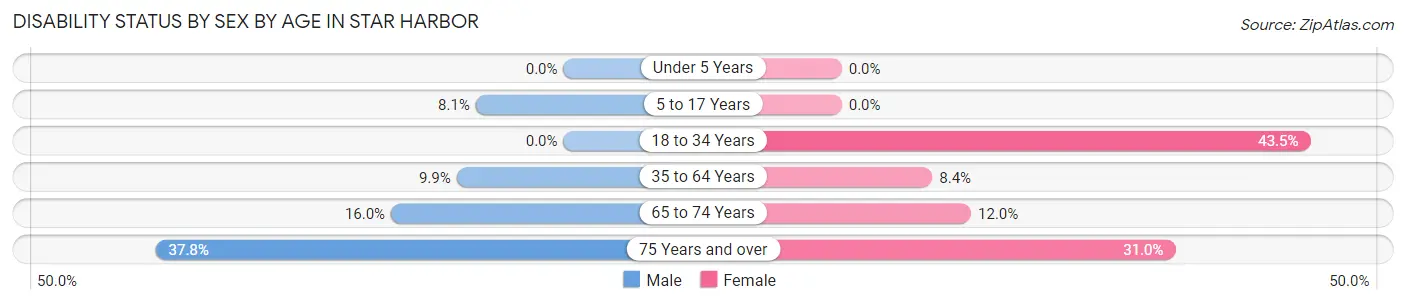
| Age Bracket | Male | Female |
| Under 5 Years | 0 (0.0%) | 0 (0.0%) |
| 5 to 17 Years | 7 (8.1%) | 0 (0.0%) |
| 18 to 34 Years | 0 (0.0%) | 10 (43.5%) |
| 35 to 64 Years | 11 (9.9%) | 10 (8.4%) |
| 65 to 74 Years | 4 (16.0%) | 3 (12.0%) |
| 75 Years and over | 14 (37.8%) | 13 (30.9%) |
Disability Class by Sex by Age in Star Harbor
Disability Class: Hearing Difficulty
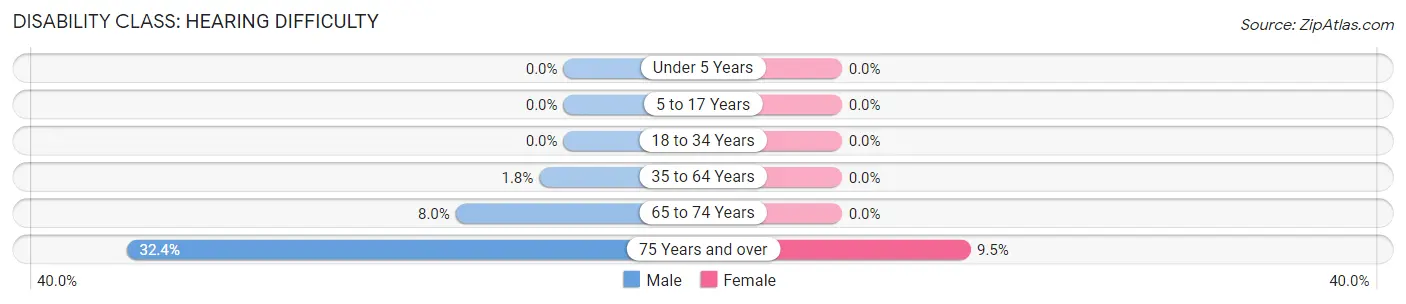
| Age Bracket | Male | Female |
| Under 5 Years | 0 (0.0%) | 0 (0.0%) |
| 5 to 17 Years | 0 (0.0%) | 0 (0.0%) |
| 18 to 34 Years | 0 (0.0%) | 0 (0.0%) |
| 35 to 64 Years | 2 (1.8%) | 0 (0.0%) |
| 65 to 74 Years | 2 (8.0%) | 0 (0.0%) |
| 75 Years and over | 12 (32.4%) | 4 (9.5%) |
Disability Class: Vision Difficulty
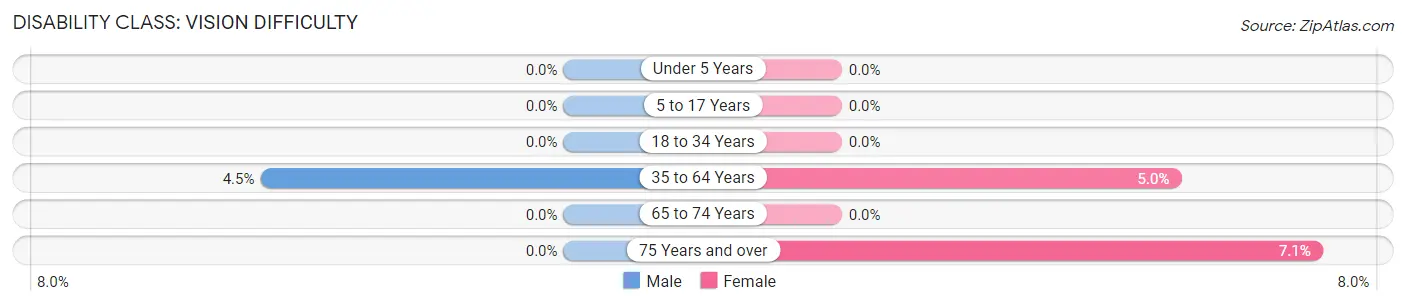
| Age Bracket | Male | Female |
| Under 5 Years | 0 (0.0%) | 0 (0.0%) |
| 5 to 17 Years | 0 (0.0%) | 0 (0.0%) |
| 18 to 34 Years | 0 (0.0%) | 0 (0.0%) |
| 35 to 64 Years | 5 (4.5%) | 6 (5.0%) |
| 65 to 74 Years | 0 (0.0%) | 0 (0.0%) |
| 75 Years and over | 0 (0.0%) | 3 (7.1%) |
Disability Class: Cognitive Difficulty
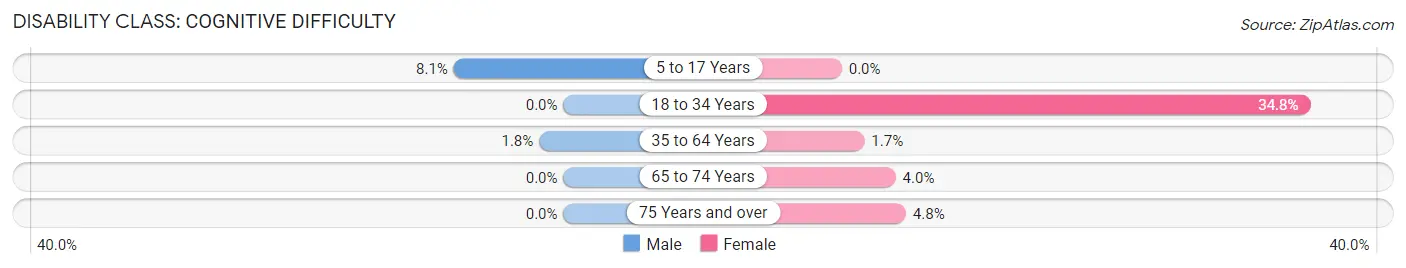
| Age Bracket | Male | Female |
| 5 to 17 Years | 7 (8.1%) | 0 (0.0%) |
| 18 to 34 Years | 0 (0.0%) | 8 (34.8%) |
| 35 to 64 Years | 2 (1.8%) | 2 (1.7%) |
| 65 to 74 Years | 0 (0.0%) | 1 (4.0%) |
| 75 Years and over | 0 (0.0%) | 2 (4.8%) |
Disability Class: Ambulatory Difficulty
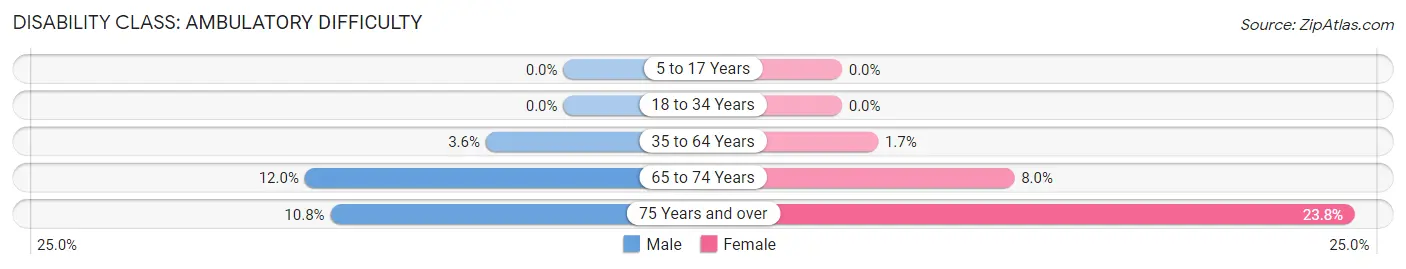
| Age Bracket | Male | Female |
| 5 to 17 Years | 0 (0.0%) | 0 (0.0%) |
| 18 to 34 Years | 0 (0.0%) | 0 (0.0%) |
| 35 to 64 Years | 4 (3.6%) | 2 (1.7%) |
| 65 to 74 Years | 3 (12.0%) | 2 (8.0%) |
| 75 Years and over | 4 (10.8%) | 10 (23.8%) |
Disability Class: Self-Care Difficulty
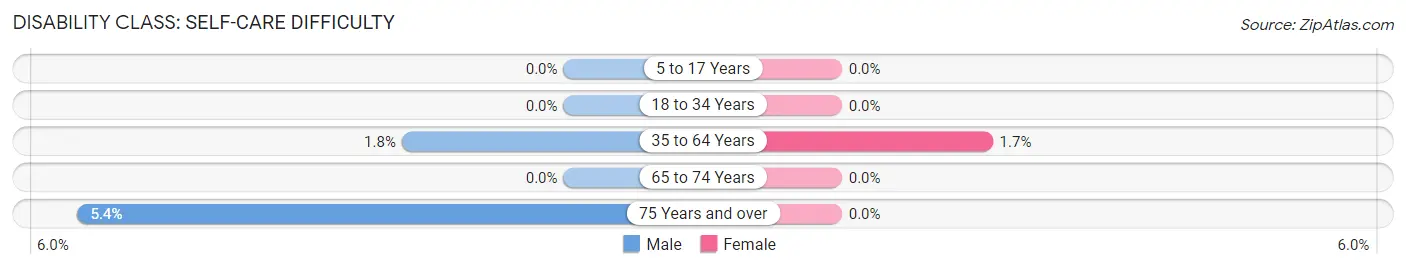
| Age Bracket | Male | Female |
| 5 to 17 Years | 0 (0.0%) | 0 (0.0%) |
| 18 to 34 Years | 0 (0.0%) | 0 (0.0%) |
| 35 to 64 Years | 2 (1.8%) | 2 (1.7%) |
| 65 to 74 Years | 0 (0.0%) | 0 (0.0%) |
| 75 Years and over | 2 (5.4%) | 0 (0.0%) |
Technology Access in Star Harbor
Computing Device Access in Star Harbor
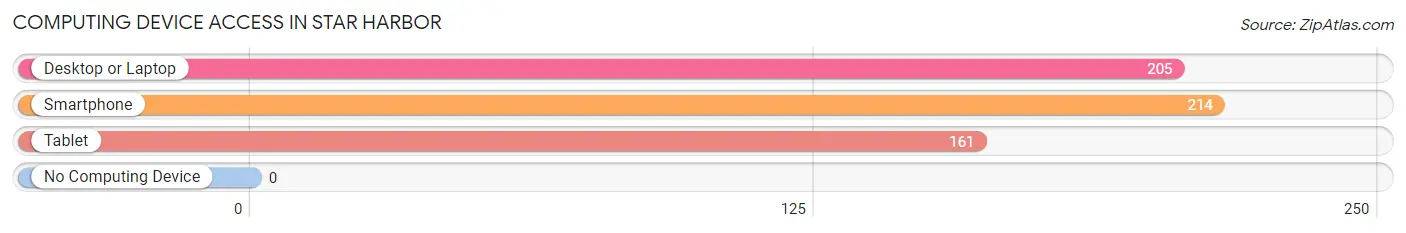
| Device Type | # Households | % Households |
| Desktop or Laptop | 205 | 91.5% |
| Smartphone | 214 | 95.5% |
| Tablet | 161 | 71.9% |
| No Computing Device | 0 | 0.0% |
| Total | 224 | 100.0% |
Internet Access in Star Harbor
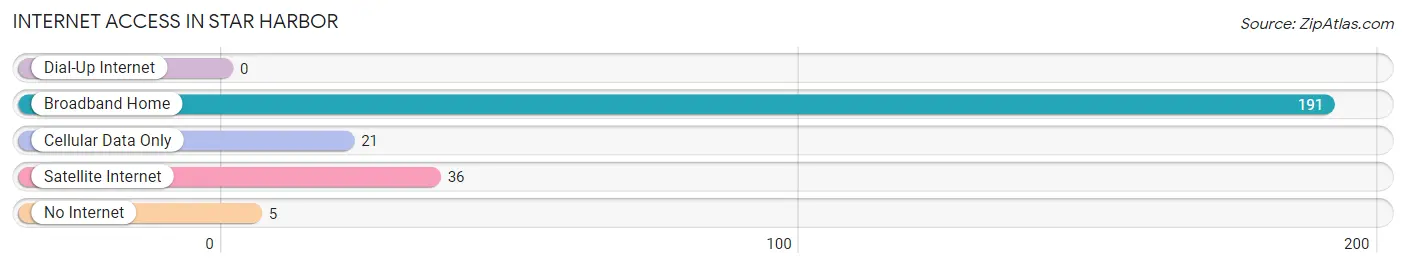
| Internet Type | # Households | % Households |
| Dial-Up Internet | 0 | 0.0% |
| Broadband Home | 191 | 85.3% |
| Cellular Data Only | 21 | 9.4% |
| Satellite Internet | 36 | 16.1% |
| No Internet | 5 | 2.2% |
| Total | 224 | 100.0% |
Star Harbor Summary
Harbor, Texas is a small city located in Nueces County, Texas. It is situated on the Gulf of Mexico, just south of Corpus Christi. The city is known for its beautiful beaches, fishing, and recreational activities.
History
The area that is now Harbor, Texas was first settled in the late 1800s by a group of fishermen from the nearby town of Port Aransas. The fishermen were attracted to the area due to its abundance of fish and other marine life. The first settlers built a small fishing village, which they named Star Harbor.
In the early 1900s, the town began to grow as more people moved to the area. The town was incorporated in 1911 and was named after the nearby Star Harbor. The town was a popular destination for tourists and fishermen, and it soon became a popular spot for vacationers.
In the 1950s, the town began to experience a population boom as more people moved to the area. The population grew from just over 1,000 in 1950 to over 5,000 in 1960. The town was also home to a number of businesses, including a hotel, a movie theater, and a number of restaurants.
Geography
Harbor, Texas is located in Nueces County, Texas. It is situated on the Gulf of Mexico, just south of Corpus Christi. The city is bordered by the Nueces River to the north and the Corpus Christi Bay to the south. The city is located on a peninsula, which is surrounded by the Gulf of Mexico on three sides.
The city has a total area of 4.3 square miles, all of which is land. The city has a humid subtropical climate, with hot summers and mild winters. The average temperature in the summer is around 90 degrees Fahrenheit, while the average temperature in the winter is around 60 degrees Fahrenheit.
Economy
The economy of Harbor, Texas is largely based on tourism and fishing. The city is home to a number of hotels, restaurants, and other businesses that cater to tourists and fishermen. The city is also home to a number of marinas, which provide access to the Gulf of Mexico for fishing and recreational activities.
The city is also home to a number of manufacturing and industrial businesses. These businesses include a number of chemical plants, a paper mill, and a number of other businesses.
Demographics
As of the 2010 census, the population of Harbor, Texas was 5,945. The population is made up of a diverse mix of people, with the majority of the population being of Hispanic or Latino origin. The median household income in the city is $37,945, and the median age is 37.
Conclusion
Harbor, Texas is a small city located in Nueces County, Texas. It is situated on the Gulf of Mexico, just south of Corpus Christi. The city is known for its beautiful beaches, fishing, and recreational activities. The economy of the city is largely based on tourism and fishing, and the city is home to a number of hotels, restaurants, and other businesses that cater to tourists and fishermen. The population of the city is made up of a diverse mix of people, with the majority of the population being of Hispanic or Latino origin.
Common Questions
What is Per Capita Income in Star Harbor?
Per Capita income in Star Harbor is $47,566.
What is the Median Family Income in Star Harbor?
Median Family Income in Star Harbor is $106,250.
What is the Median Household income in Star Harbor?
Median Household Income in Star Harbor is $108,500.
What is Income or Wage Gap in Star Harbor?
Income or Wage Gap in Star Harbor is 30.1%.
Women in Star Harbor earn 69.9 cents for every dollar earned by a man.
What is Inequality or Gini Index in Star Harbor?
Inequality or Gini Index in Star Harbor is 0.36.
What is the Total Population of Star Harbor?
Total Population of Star Harbor is 508.
What is the Total Male Population of Star Harbor?
Total Male Population of Star Harbor is 287.
What is the Total Female Population of Star Harbor?
Total Female Population of Star Harbor is 221.
What is the Ratio of Males per 100 Females in Star Harbor?
There are 129.86 Males per 100 Females in Star Harbor.
What is the Ratio of Females per 100 Males in Star Harbor?
There are 77.00 Females per 100 Males in Star Harbor.
What is the Median Population Age in Star Harbor?
Median Population Age in Star Harbor is 55.4 Years.
What is the Average Family Size in Star Harbor
Average Family Size in Star Harbor is 2.5 People.
What is the Average Household Size in Star Harbor
Average Household Size in Star Harbor is 2.3 People.
How Large is the Labor Force in Star Harbor?
There are 242 People in the Labor Forcein in Star Harbor.
What is the Percentage of People in the Labor Force in Star Harbor?
55.8% of People are in the Labor Force in Star Harbor.
What is the Unemployment Rate in Star Harbor?
Unemployment Rate in Star Harbor is 1.7%.