Pinewood Estates, TX Map & Demographics
Pinewood Estates Map
Pinewood Estates Overview
$43,244
PER CAPITA INCOME
$136,538
AVG FAMILY INCOME
$135,144
AVG HOUSEHOLD INCOME
67.3%
WAGE / INCOME GAP [ % ]
32.7¢/ $1
WAGE / INCOME GAP [ $ ]
0.31
INEQUALITY / GINI INDEX
1,533
TOTAL POPULATION
792
MALE POPULATION
741
FEMALE POPULATION
106.88
MALES / 100 FEMALES
93.56
FEMALES / 100 MALES
36.8
MEDIAN AGE
3.7
AVG FAMILY SIZE
3.5
AVG HOUSEHOLD SIZE
671
LABOR FORCE [ PEOPLE ]
66.4%
PERCENT IN LABOR FORCE
1.6%
UNEMPLOYMENT RATE
Income in Pinewood Estates
Income Overview in Pinewood Estates
Per Capita Income in Pinewood Estates is $43,244, while median incomes of families and households are $136,538 and $135,144 respectively.
| Characteristic | Number | Measure |
| Per Capita Income | 1,533 | $43,244 |
| Median Family Income | 404 | $136,538 |
| Mean Family Income | 404 | $157,255 |
| Median Household Income | 433 | $135,144 |
| Mean Household Income | 433 | $149,415 |
| Income Deficit | 404 | $0 |
| Wage / Income Gap (%) | 1,533 | 67.29% |
| Wage / Income Gap ($) | 1,533 | 32.71¢ per $1 |
| Gini / Inequality Index | 1,533 | 0.31 |
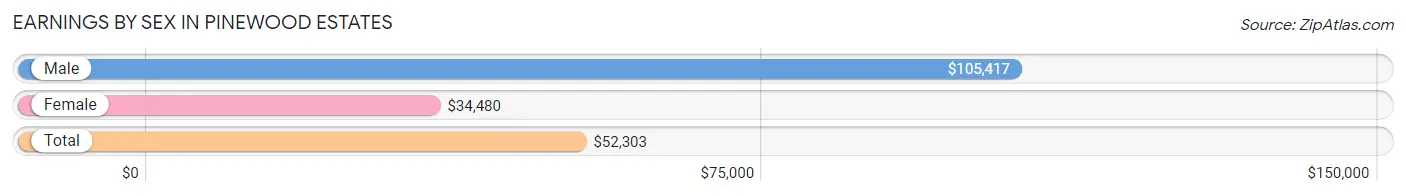
Earnings by Sex in Pinewood Estates
Average Earnings in Pinewood Estates are $52,303, $105,417 for men and $34,480 for women, a difference of 67.3%.
| Sex | Number | Average Earnings |
| Male | 359 (50.6%) | $105,417 |
| Female | 350 (49.4%) | $34,480 |
| Total | 709 (100.0%) | $52,303 |
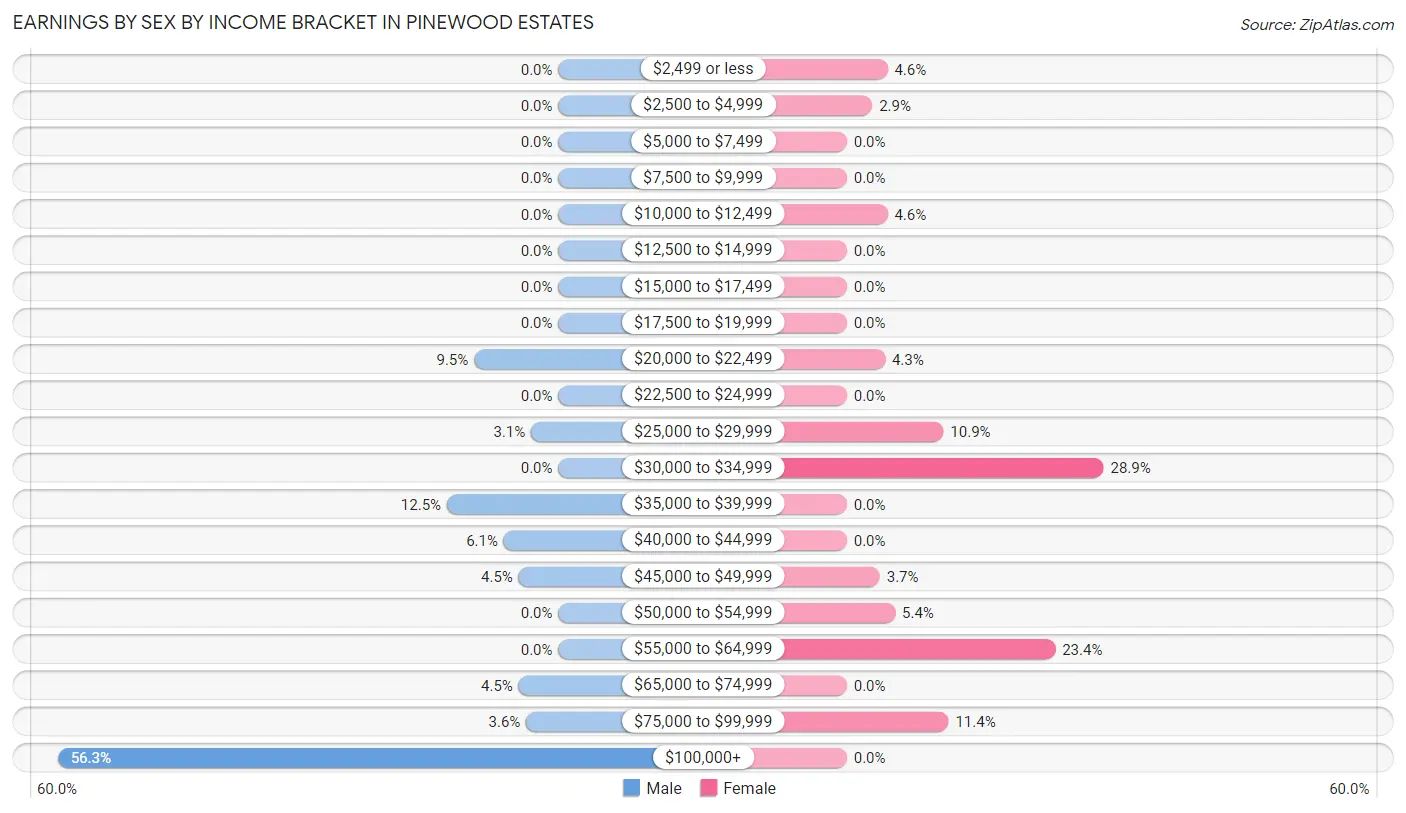
Earnings by Sex by Income Bracket in Pinewood Estates
The most common earnings brackets in Pinewood Estates are $100,000+ for men (202 | 56.3%) and $30,000 to $34,999 for women (101 | 28.9%).
| Income | Male | Female |
| $2,499 or less | 0 (0.0%) | 16 (4.6%) |
| $2,500 to $4,999 | 0 (0.0%) | 10 (2.9%) |
| $5,000 to $7,499 | 0 (0.0%) | 0 (0.0%) |
| $7,500 to $9,999 | 0 (0.0%) | 0 (0.0%) |
| $10,000 to $12,499 | 0 (0.0%) | 16 (4.6%) |
| $12,500 to $14,999 | 0 (0.0%) | 0 (0.0%) |
| $15,000 to $17,499 | 0 (0.0%) | 0 (0.0%) |
| $17,500 to $19,999 | 0 (0.0%) | 0 (0.0%) |
| $20,000 to $22,499 | 34 (9.5%) | 15 (4.3%) |
| $22,500 to $24,999 | 0 (0.0%) | 0 (0.0%) |
| $25,000 to $29,999 | 11 (3.1%) | 38 (10.9%) |
| $30,000 to $34,999 | 0 (0.0%) | 101 (28.9%) |
| $35,000 to $39,999 | 45 (12.5%) | 0 (0.0%) |
| $40,000 to $44,999 | 22 (6.1%) | 0 (0.0%) |
| $45,000 to $49,999 | 16 (4.5%) | 13 (3.7%) |
| $50,000 to $54,999 | 0 (0.0%) | 19 (5.4%) |
| $55,000 to $64,999 | 0 (0.0%) | 82 (23.4%) |
| $65,000 to $74,999 | 16 (4.5%) | 0 (0.0%) |
| $75,000 to $99,999 | 13 (3.6%) | 40 (11.4%) |
| $100,000+ | 202 (56.3%) | 0 (0.0%) |
| Total | 359 (100.0%) | 350 (100.0%) |
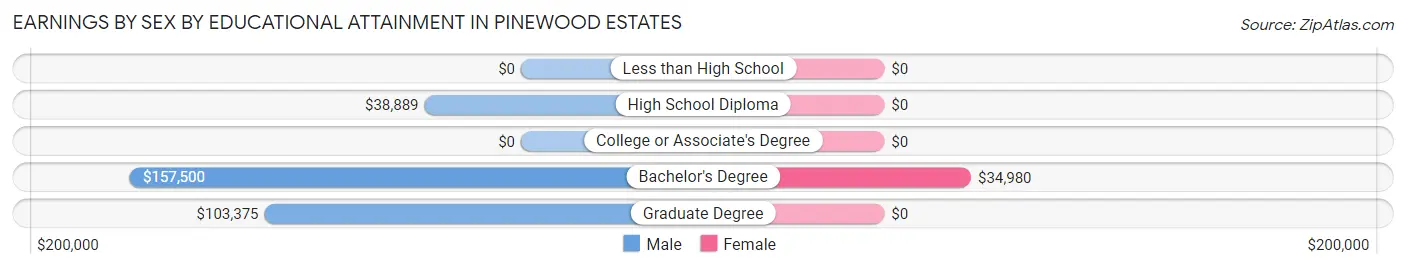
Earnings by Sex by Educational Attainment in Pinewood Estates
Average earnings in Pinewood Estates are $110,321 for men and $34,480 for women, a difference of 68.8%. Men with an educational attainment of bachelor's degree enjoy the highest average annual earnings of $157,500, while those with high school diploma education earn the least with $38,889. Women with an educational attainment of bachelor's degree earn the most with the average annual earnings of $34,980, while those with bachelor's degree education have the smallest earnings of $34,980.
| Educational Attainment | Male Income | Female Income |
| Less than High School | - | - |
| High School Diploma | $38,889 | $0 |
| College or Associate's Degree | - | - |
| Bachelor's Degree | $157,500 | $34,980 |
| Graduate Degree | $103,375 | $0 |
| Total | $110,321 | $34,480 |
Family Income in Pinewood Estates
Family Income Brackets in Pinewood Estates
According to the Pinewood Estates family income data, there are 146 families falling into the $150,000 to $199,999 income range, which is the most common income bracket and makes up 36.1% of all families.
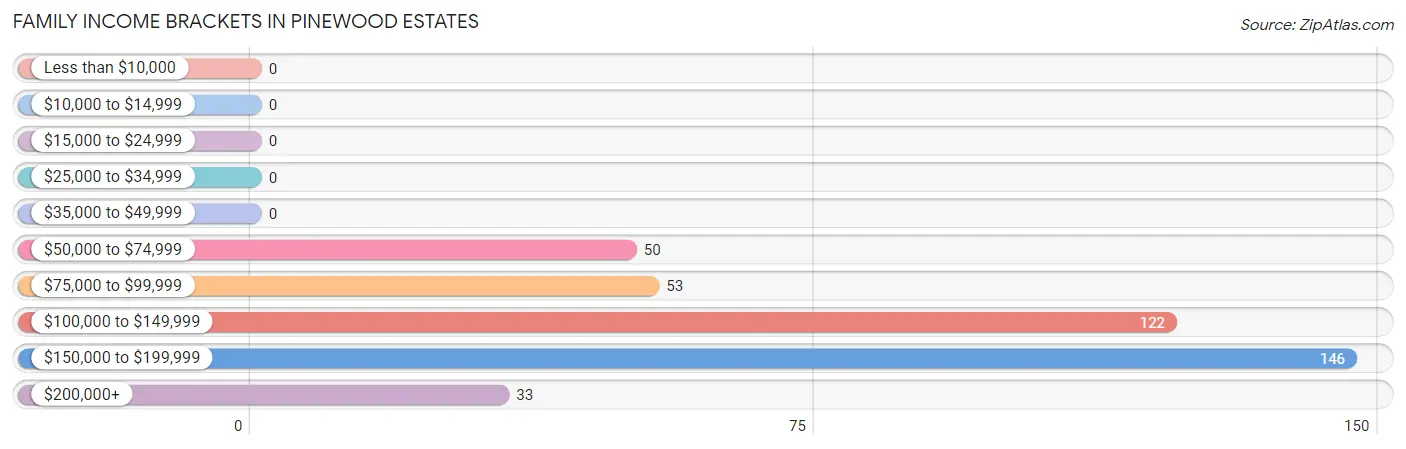
| Income Bracket | # Families | % Families |
| Less than $10,000 | 0 | 0.0% |
| $10,000 to $14,999 | 0 | 0.0% |
| $15,000 to $24,999 | 0 | 0.0% |
| $25,000 to $34,999 | 0 | 0.0% |
| $35,000 to $49,999 | 0 | 0.0% |
| $50,000 to $74,999 | 50 | 12.4% |
| $75,000 to $99,999 | 53 | 13.1% |
| $100,000 to $149,999 | 122 | 30.2% |
| $150,000 to $199,999 | 146 | 36.1% |
| $200,000+ | 33 | 8.2% |
Family Income by Famaliy Size in Pinewood Estates
5-person families (81 | 20.1%) account for the highest median family income in Pinewood Estates with $176,139 per family, while 2-person families (105 | 26.0%) have the highest median income of $84,042 per family member.
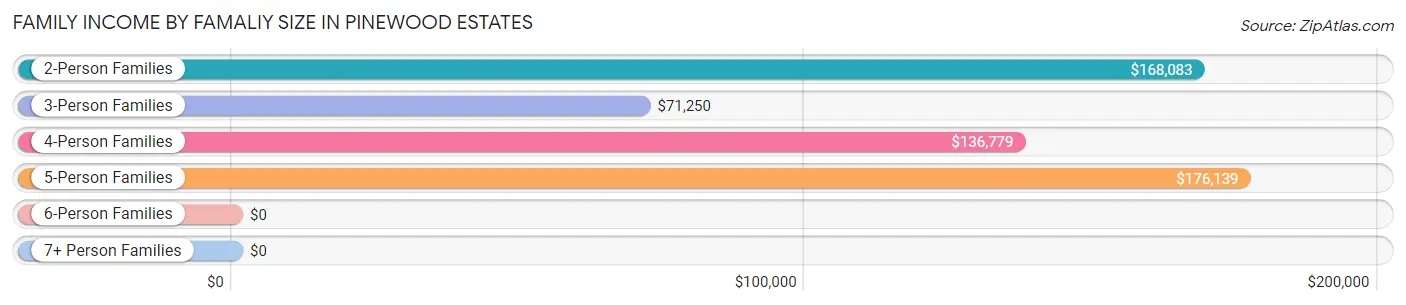
| Income Bracket | # Families | Median Income |
| 2-Person Families | 105 (26.0%) | $168,083 |
| 3-Person Families | 66 (16.3%) | $71,250 |
| 4-Person Families | 139 (34.4%) | $136,779 |
| 5-Person Families | 81 (20.1%) | $176,139 |
| 6-Person Families | 13 (3.2%) | $0 |
| 7+ Person Families | 0 (0.0%) | $0 |
| Total | 404 (100.0%) | $136,538 |
Family Income by Number of Earners in Pinewood Estates
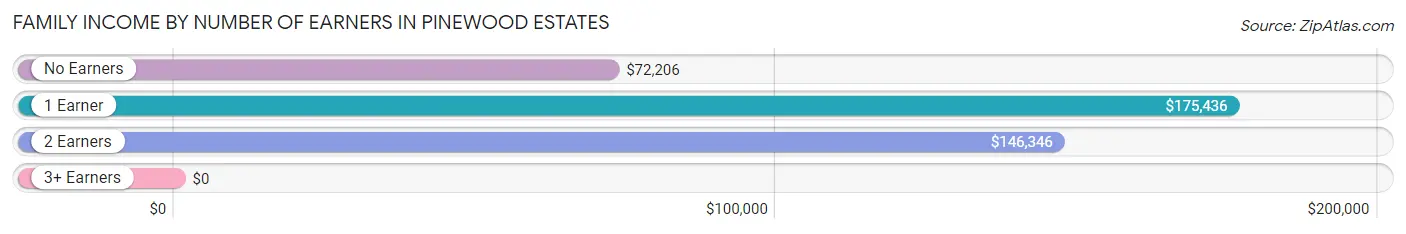
| Number of Earners | # Families | Median Income |
| No Earners | 60 (14.8%) | $72,206 |
| 1 Earner | 71 (17.6%) | $175,436 |
| 2 Earners | 216 (53.5%) | $146,346 |
| 3+ Earners | 57 (14.1%) | $0 |
| Total | 404 (100.0%) | $136,538 |
Household Income in Pinewood Estates
Household Income Brackets in Pinewood Estates
With 146 households falling in the category, the $150,000 to $199,999 income range is the most frequent in Pinewood Estates, accounting for 33.7% of all households.
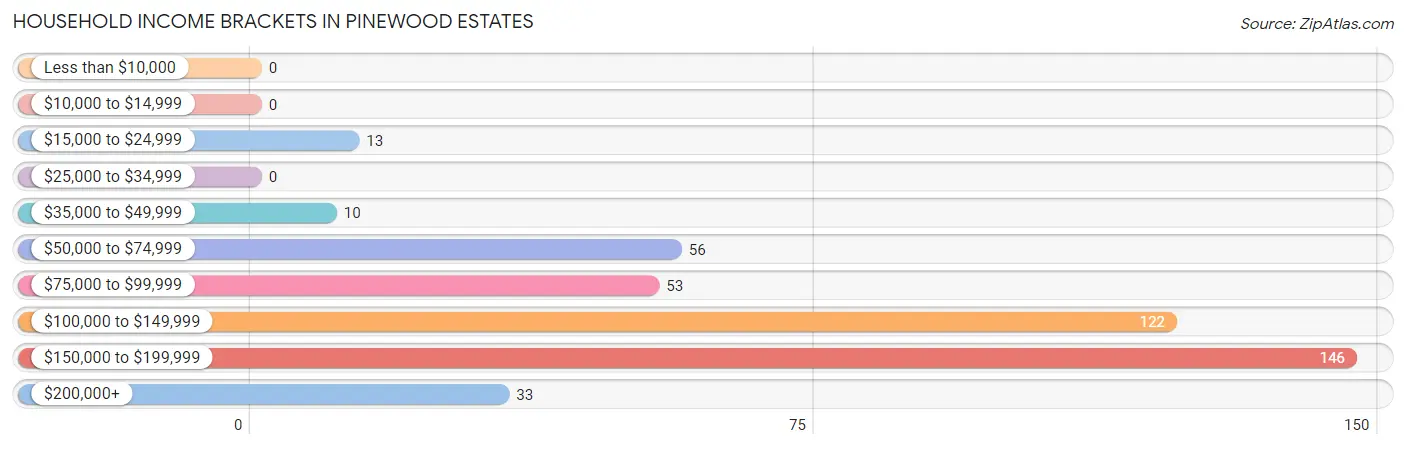
| Income Bracket | # Households | % Households |
| Less than $10,000 | 0 | 0.0% |
| $10,000 to $14,999 | 0 | 0.0% |
| $15,000 to $24,999 | 13 | 3.0% |
| $25,000 to $34,999 | 0 | 0.0% |
| $35,000 to $49,999 | 10 | 2.3% |
| $50,000 to $74,999 | 56 | 12.9% |
| $75,000 to $99,999 | 53 | 12.2% |
| $100,000 to $149,999 | 122 | 28.2% |
| $150,000 to $199,999 | 146 | 33.7% |
| $200,000+ | 33 | 7.6% |
Household Income by Householder Age in Pinewood Estates
The median household income in Pinewood Estates is $135,144, with the highest median household income of $175,781 found in the 25 to 44 years age bracket for the primary householder. A total of 153 households (35.3%) fall into this category.
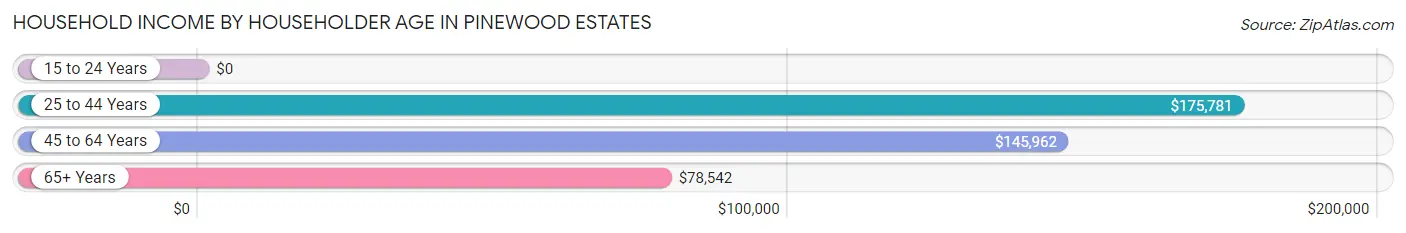
| Income Bracket | # Households | Median Income |
| 15 to 24 Years | 0 (0.0%) | $0 |
| 25 to 44 Years | 153 (35.3%) | $175,781 |
| 45 to 64 Years | 136 (31.4%) | $145,962 |
| 65+ Years | 144 (33.3%) | $78,542 |
| Total | 433 (100.0%) | $135,144 |
Poverty in Pinewood Estates
Income Below Poverty by Sex and Age in Pinewood Estates
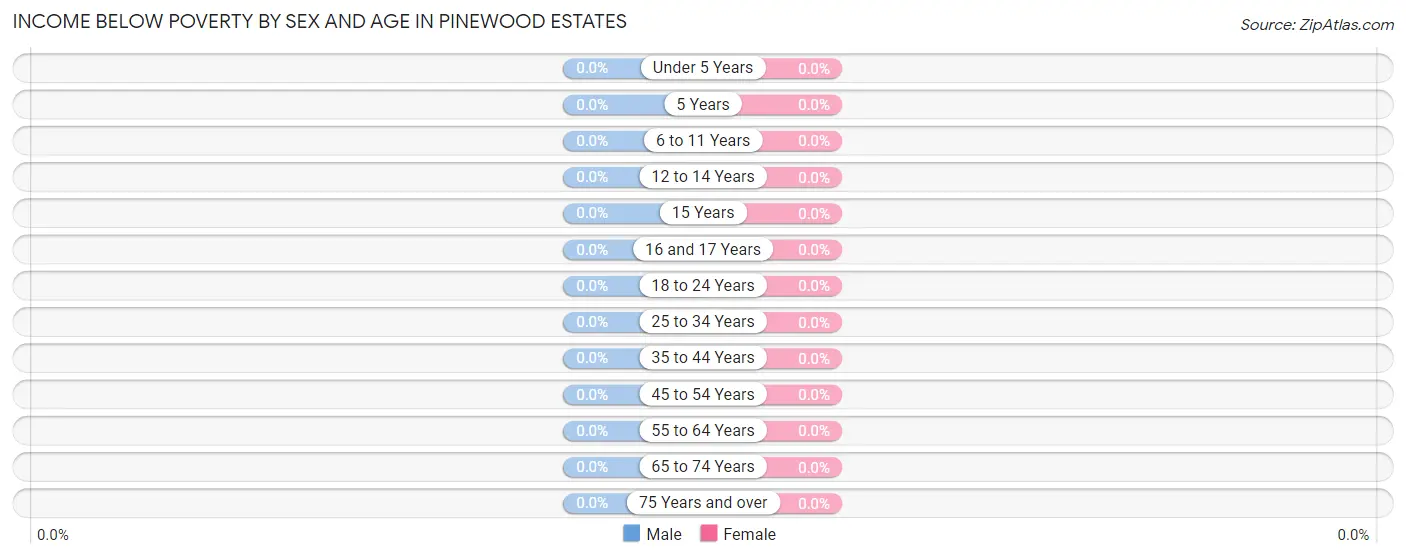
| Age Bracket | Male | Female |
| Under 5 Years | 0 (0.0%) | 0 (0.0%) |
| 5 Years | 0 (0.0%) | 0 (0.0%) |
| 6 to 11 Years | 0 (0.0%) | 0 (0.0%) |
| 12 to 14 Years | 0 (0.0%) | 0 (0.0%) |
| 15 Years | 0 (0.0%) | 0 (0.0%) |
| 16 and 17 Years | 0 (0.0%) | 0 (0.0%) |
| 18 to 24 Years | 0 (0.0%) | 0 (0.0%) |
| 25 to 34 Years | 0 (0.0%) | 0 (0.0%) |
| 35 to 44 Years | 0 (0.0%) | 0 (0.0%) |
| 45 to 54 Years | 0 (0.0%) | 0 (0.0%) |
| 55 to 64 Years | 0 (0.0%) | 0 (0.0%) |
| 65 to 74 Years | 0 (0.0%) | 0 (0.0%) |
| 75 Years and over | 0 (0.0%) | 0 (0.0%) |
| Total | 0 (0.0%) | 0 (0.0%) |
Income Above Poverty by Sex and Age in Pinewood Estates
According to the poverty statistics in Pinewood Estates, males aged under 5 years and females aged under 5 years are the age groups that are most secure financially, with 100.0% of males and 100.0% of females in these age groups living above the poverty line.
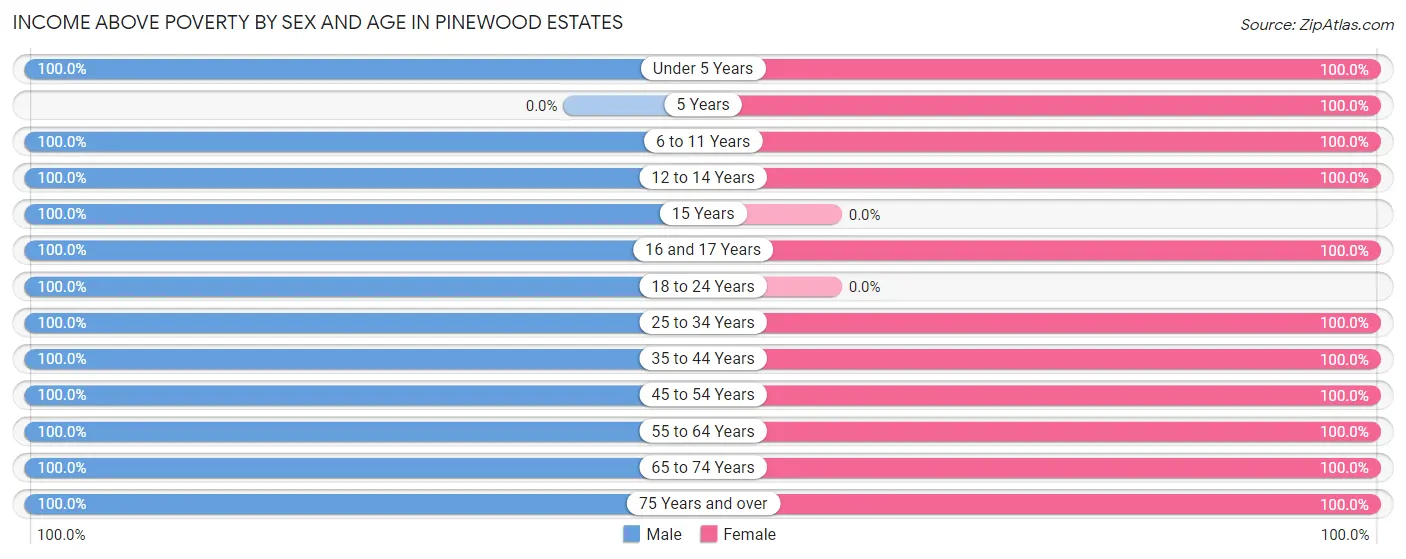
| Age Bracket | Male | Female |
| Under 5 Years | 37 (100.0%) | 47 (100.0%) |
| 5 Years | 0 (0.0%) | 72 (100.0%) |
| 6 to 11 Years | 168 (100.0%) | 66 (100.0%) |
| 12 to 14 Years | 89 (100.0%) | 32 (100.0%) |
| 15 Years | 11 (100.0%) | 0 (0.0%) |
| 16 and 17 Years | 61 (100.0%) | 14 (100.0%) |
| 18 to 24 Years | 34 (100.0%) | 0 (0.0%) |
| 25 to 34 Years | 32 (100.0%) | 47 (100.0%) |
| 35 to 44 Years | 129 (100.0%) | 203 (100.0%) |
| 45 to 54 Years | 13 (100.0%) | 41 (100.0%) |
| 55 to 64 Years | 71 (100.0%) | 64 (100.0%) |
| 65 to 74 Years | 83 (100.0%) | 90 (100.0%) |
| 75 Years and over | 64 (100.0%) | 65 (100.0%) |
| Total | 792 (100.0%) | 741 (100.0%) |
Income Below Poverty Among Married-Couple Families in Pinewood Estates
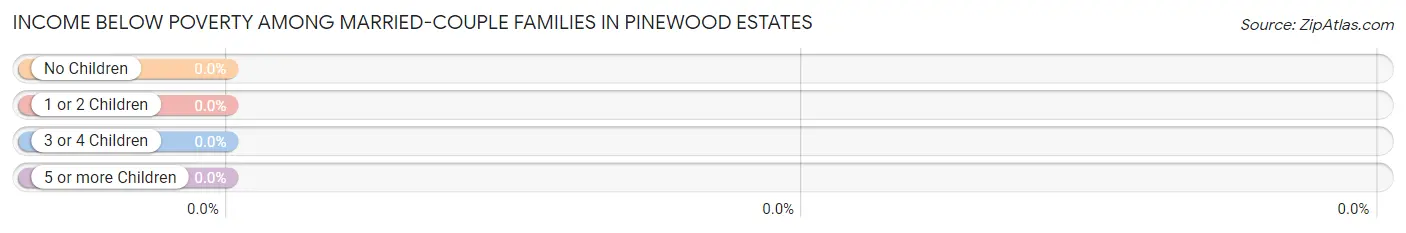
| Children | Above Poverty | Below Poverty |
| No Children | 121 (100.0%) | 0 (0.0%) |
| 1 or 2 Children | 189 (100.0%) | 0 (0.0%) |
| 3 or 4 Children | 94 (100.0%) | 0 (0.0%) |
| 5 or more Children | 0 (0.0%) | 0 (0.0%) |
| Total | 404 (100.0%) | 0 (0.0%) |
Income Below Poverty Among Single-Parent Households in Pinewood Estates
| Children | Single Father | Single Mother |
| No Children | 0 (0.0%) | 0 (0.0%) |
| 1 or 2 Children | 0 (0.0%) | 0 (0.0%) |
| 3 or 4 Children | 0 (0.0%) | 0 (0.0%) |
| 5 or more Children | 0 (0.0%) | 0 (0.0%) |
| Total | 0 (0.0%) | 0 (0.0%) |
Income Below Poverty Among Married-Couple vs Single-Parent Households in Pinewood Estates
| Children | Married-Couple Families | Single-Parent Households |
| No Children | 0 (0.0%) | 0 (0.0%) |
| 1 or 2 Children | 0 (0.0%) | 0 (0.0%) |
| 3 or 4 Children | 0 (0.0%) | 0 (0.0%) |
| 5 or more Children | 0 (0.0%) | 0 (0.0%) |
| Total | 0 (0.0%) | 0 (0.0%) |
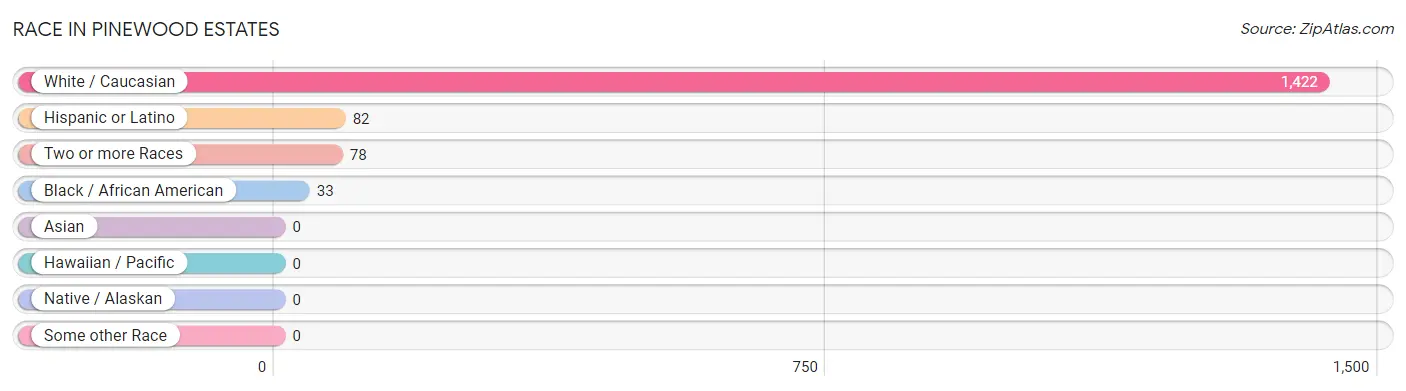
Race in Pinewood Estates
The most populous races in Pinewood Estates are White / Caucasian (1,422 | 92.8%), Hispanic or Latino (82 | 5.3%), and Two or more Races (78 | 5.1%).
| Race | # Population | % Population |
| Asian | 0 | 0.0% |
| Black / African American | 33 | 2.1% |
| Hawaiian / Pacific | 0 | 0.0% |
| Hispanic or Latino | 82 | 5.3% |
| Native / Alaskan | 0 | 0.0% |
| White / Caucasian | 1,422 | 92.8% |
| Two or more Races | 78 | 5.1% |
| Some other Race | 0 | 0.0% |
| Total | 1,533 | 100.0% |
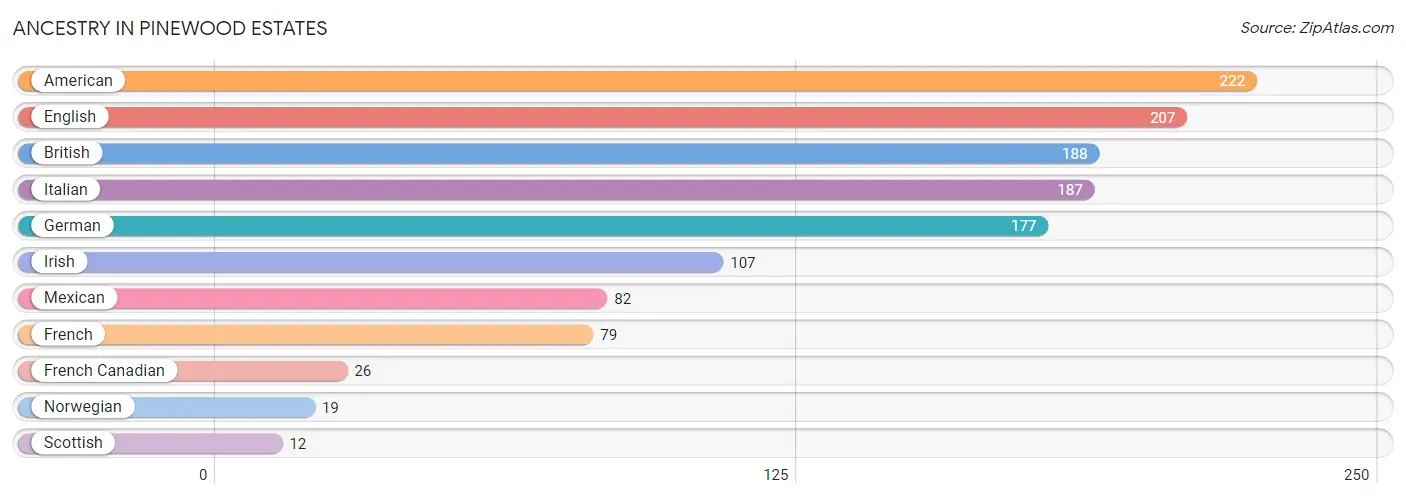
Ancestry in Pinewood Estates
The most populous ancestries reported in Pinewood Estates are American (222 | 14.5%), English (207 | 13.5%), British (188 | 12.3%), Italian (187 | 12.2%), and German (177 | 11.6%), together accounting for 64.0% of all Pinewood Estates residents.
| Ancestry | # Population | % Population |
| American | 222 | 14.5% |
| British | 188 | 12.3% |
| English | 207 | 13.5% |
| French | 79 | 5.1% |
| French Canadian | 26 | 1.7% |
| German | 177 | 11.6% |
| Irish | 107 | 7.0% |
| Italian | 187 | 12.2% |
| Mexican | 82 | 5.3% |
| Norwegian | 19 | 1.2% |
| Scottish | 12 | 0.8% | View All 11 Rows |
Immigrants in Pinewood Estates

| Immigration Origin | # Population | % Population | View All 0 Rows |
Sex and Age in Pinewood Estates
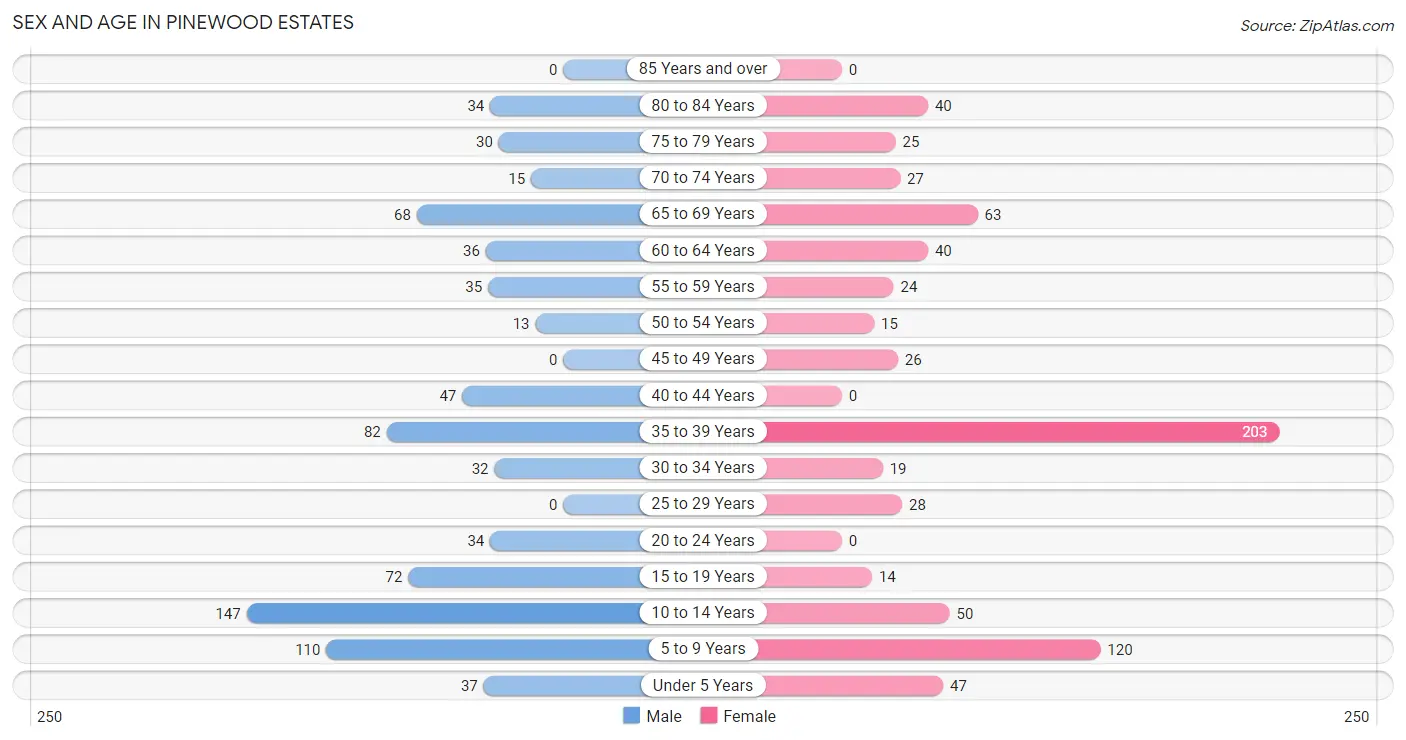
Sex and Age in Pinewood Estates
The most populous age groups in Pinewood Estates are 10 to 14 Years (147 | 18.6%) for men and 35 to 39 Years (203 | 27.4%) for women.
| Age Bracket | Male | Female |
| Under 5 Years | 37 (4.7%) | 47 (6.3%) |
| 5 to 9 Years | 110 (13.9%) | 120 (16.2%) |
| 10 to 14 Years | 147 (18.6%) | 50 (6.8%) |
| 15 to 19 Years | 72 (9.1%) | 14 (1.9%) |
| 20 to 24 Years | 34 (4.3%) | 0 (0.0%) |
| 25 to 29 Years | 0 (0.0%) | 28 (3.8%) |
| 30 to 34 Years | 32 (4.0%) | 19 (2.6%) |
| 35 to 39 Years | 82 (10.3%) | 203 (27.4%) |
| 40 to 44 Years | 47 (5.9%) | 0 (0.0%) |
| 45 to 49 Years | 0 (0.0%) | 26 (3.5%) |
| 50 to 54 Years | 13 (1.6%) | 15 (2.0%) |
| 55 to 59 Years | 35 (4.4%) | 24 (3.2%) |
| 60 to 64 Years | 36 (4.5%) | 40 (5.4%) |
| 65 to 69 Years | 68 (8.6%) | 63 (8.5%) |
| 70 to 74 Years | 15 (1.9%) | 27 (3.6%) |
| 75 to 79 Years | 30 (3.8%) | 25 (3.4%) |
| 80 to 84 Years | 34 (4.3%) | 40 (5.4%) |
| 85 Years and over | 0 (0.0%) | 0 (0.0%) |
| Total | 792 (100.0%) | 741 (100.0%) |
Families and Households in Pinewood Estates
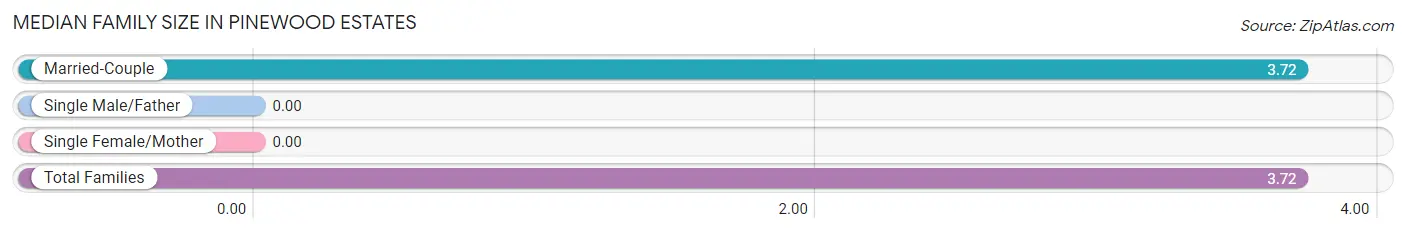
Median Family Size in Pinewood Estates
| Family Type | # Families | Family Size |
| Married-Couple | 404 (100.0%) | 3.72 |
| Single Male/Father | 0 (0.0%) | - |
| Single Female/Mother | 0 (0.0%) | - |
| Total Families | 404 (100.0%) | 3.72 |
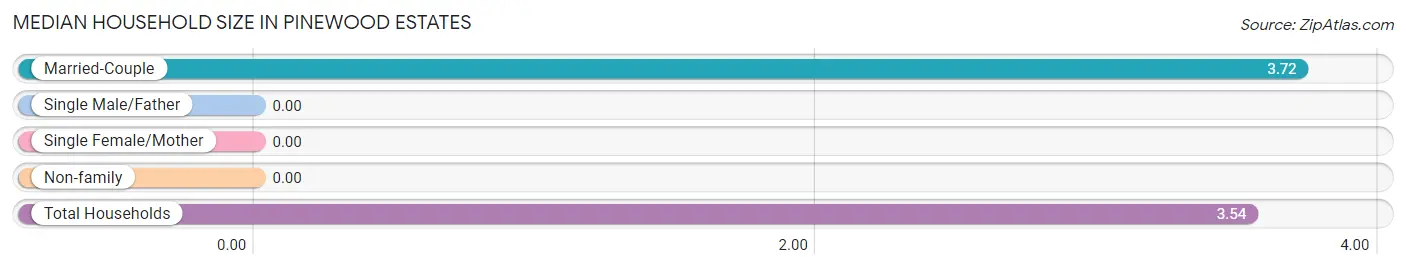
Median Household Size in Pinewood Estates
| Household Type | # Households | Household Size |
| Married-Couple | 404 (93.3%) | 3.72 |
| Single Male/Father | 0 (0.0%) | - |
| Single Female/Mother | 0 (0.0%) | - |
| Non-family | 29 (6.7%) | - |
| Total Households | 433 (100.0%) | 3.54 |
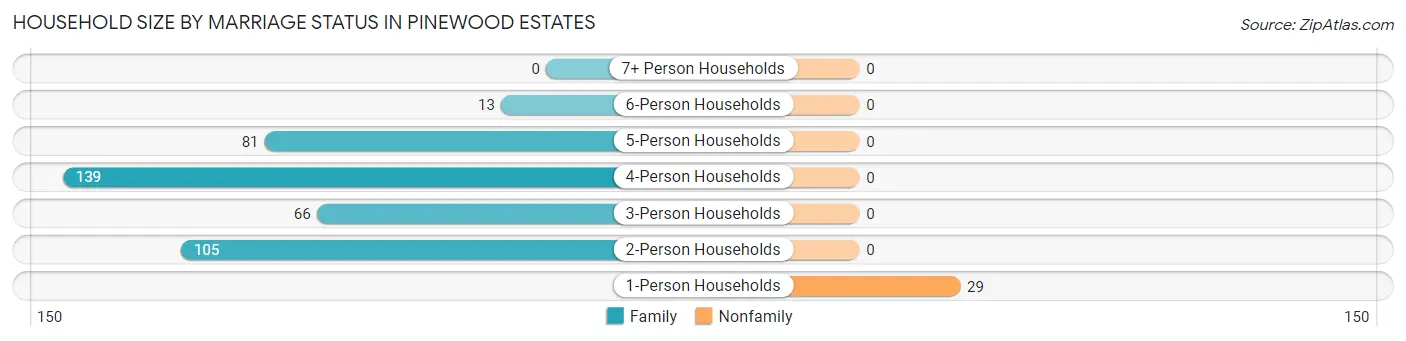
Household Size by Marriage Status in Pinewood Estates
Out of a total of 433 households in Pinewood Estates, 404 (93.3%) are family households, while 29 (6.7%) are nonfamily households. The most numerous type of family households are 4-person households, comprising 139, and the most common type of nonfamily households are 1-person households, comprising 29.
| Household Size | Family Households | Nonfamily Households |
| 1-Person Households | - | 29 (6.7%) |
| 2-Person Households | 105 (24.2%) | 0 (0.0%) |
| 3-Person Households | 66 (15.2%) | 0 (0.0%) |
| 4-Person Households | 139 (32.1%) | 0 (0.0%) |
| 5-Person Households | 81 (18.7%) | 0 (0.0%) |
| 6-Person Households | 13 (3.0%) | 0 (0.0%) |
| 7+ Person Households | 0 (0.0%) | 0 (0.0%) |
| Total | 404 (93.3%) | 29 (6.7%) |
Female Fertility in Pinewood Estates
Fertility by Age in Pinewood Estates
| Age Bracket | Women with Births | Births / 1,000 Women |
| 15 to 19 years | 0 (0.0%) | 0.0 |
| 20 to 34 years | 0 (0.0%) | 0.0 |
| 35 to 50 years | 0 (0.0%) | 0.0 |
| Total | 0 (0.0%) | 0.0 |
Fertility by Age by Marriage Status in Pinewood Estates
| Age Bracket | Married | Unmarried |
| 15 to 19 years | 0 (0.0%) | 0 (0.0%) |
| 20 to 34 years | 0 (0.0%) | 0 (0.0%) |
| 35 to 50 years | 0 (0.0%) | 0 (0.0%) |
| Total | 0 (0.0%) | 0 (0.0%) |
Fertility by Education in Pinewood Estates
| Educational Attainment | Women with Births | Births / 1,000 Women |
| Less than High School | 0 (0.0%) | 0.0 |
| High School Diploma | 0 (0.0%) | 0.0 |
| College or Associate's Degree | 0 (0.0%) | 0.0 |
| Bachelor's Degree | 0 (0.0%) | 0.0 |
| Graduate Degree | 0 (0.0%) | 0.0 |
| Total | 0 (0.0%) | 0.0 |
Fertility by Education by Marriage Status in Pinewood Estates
| Educational Attainment | Married | Unmarried |
| Less than High School | 0 (0.0%) | 0 (0.0%) |
| High School Diploma | 0 (0.0%) | 0 (0.0%) |
| College or Associate's Degree | 0 (0.0%) | 0 (0.0%) |
| Bachelor's Degree | 0 (0.0%) | 0 (0.0%) |
| Graduate Degree | 0 (0.0%) | 0 (0.0%) |
| Total | 0 (0.0%) | 0 (0.0%) |
Employment Characteristics in Pinewood Estates
Employment by Class of Employer in Pinewood Estates
Among the 660 employed individuals in Pinewood Estates, private company employees (460 | 69.7%), local government employees (120 | 18.2%), and state government employees (57 | 8.6%) make up the most common classes of employment.
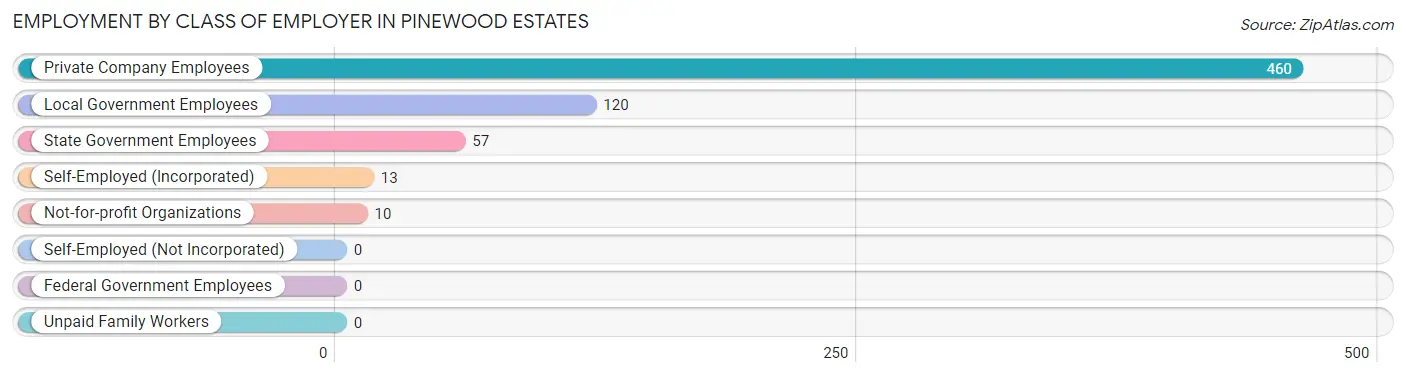
| Employer Class | # Employees | % Employees |
| Private Company Employees | 460 | 69.7% |
| Self-Employed (Incorporated) | 13 | 2.0% |
| Self-Employed (Not Incorporated) | 0 | 0.0% |
| Not-for-profit Organizations | 10 | 1.5% |
| Local Government Employees | 120 | 18.2% |
| State Government Employees | 57 | 8.6% |
| Federal Government Employees | 0 | 0.0% |
| Unpaid Family Workers | 0 | 0.0% |
| Total | 660 | 100.0% |
Employment Status by Age in Pinewood Estates
According to the labor force statistics for Pinewood Estates, out of the total population over 16 years of age (1,011), 66.4% or 671 individuals are in the labor force, with 1.6% or 11 of them unemployed. The age group with the highest labor force participation rate is 20 to 24 years, with 100.0% or 34 individuals in the labor force. Within the labor force, the 60 to 64 years age range has the highest percentage of unemployed individuals, with 18.0% or 11 of them being unemployed.
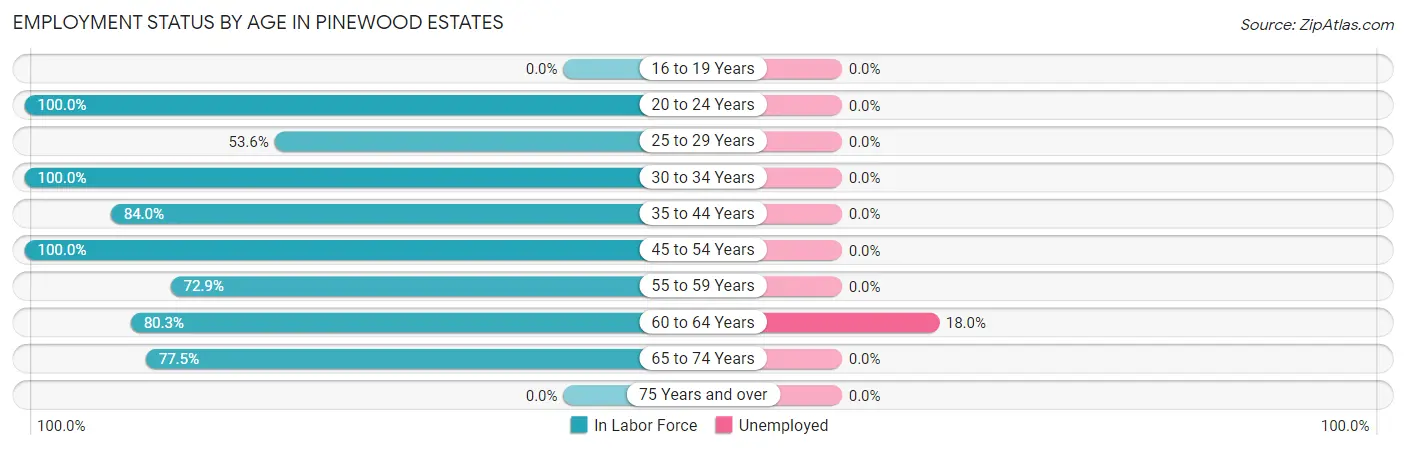
| Age Bracket | In Labor Force | Unemployed |
| 16 to 19 Years | 0 (0.0%) | 0 (0.0%) |
| 20 to 24 Years | 34 (100.0%) | 0 (0.0%) |
| 25 to 29 Years | 15 (53.6%) | 0 (0.0%) |
| 30 to 34 Years | 51 (100.0%) | 0 (0.0%) |
| 35 to 44 Years | 279 (84.0%) | 0 (0.0%) |
| 45 to 54 Years | 54 (100.0%) | 0 (0.0%) |
| 55 to 59 Years | 43 (72.9%) | 0 (0.0%) |
| 60 to 64 Years | 61 (80.3%) | 11 (18.0%) |
| 65 to 74 Years | 134 (77.5%) | 0 (0.0%) |
| 75 Years and over | 0 (0.0%) | 0 (0.0%) |
| Total | 671 (66.4%) | 11 (1.6%) |
Employment Status by Educational Attainment in Pinewood Estates
According to labor force statistics for Pinewood Estates, 83.8% of individuals (503) out of the total population between 25 and 64 years of age (600) are in the labor force, with 2.2% or 11 of them being unemployed. The group with the highest labor force participation rate are those with the educational attainment of less than high school, with 100.0% or 16 individuals in the labor force. Within the labor force, individuals with high school diploma education have the highest percentage of unemployment, with 30.6% or 11 of them being unemployed.
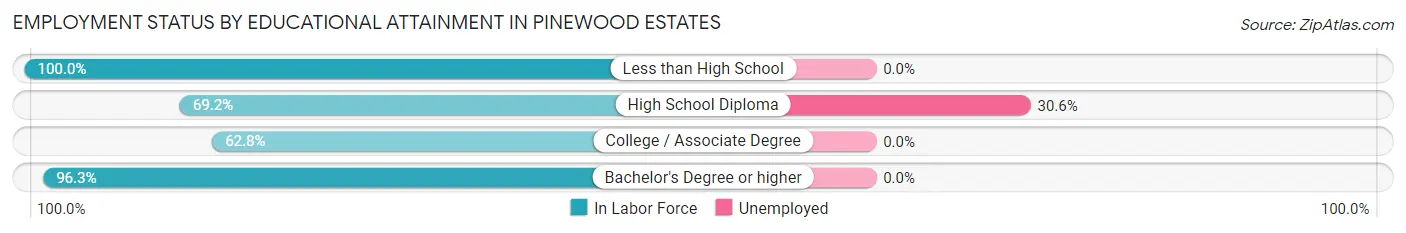
| Educational Attainment | In Labor Force | Unemployed |
| Less than High School | 16 (100.0%) | 0 (0.0%) |
| High School Diploma | 36 (69.2%) | 16 (30.6%) |
| College / Associate Degree | 115 (62.8%) | 0 (0.0%) |
| Bachelor's Degree or higher | 336 (96.3%) | 0 (0.0%) |
| Total | 503 (83.8%) | 13 (2.2%) |
Employment Occupations by Sex in Pinewood Estates
Management, Business, Science and Arts Occupations
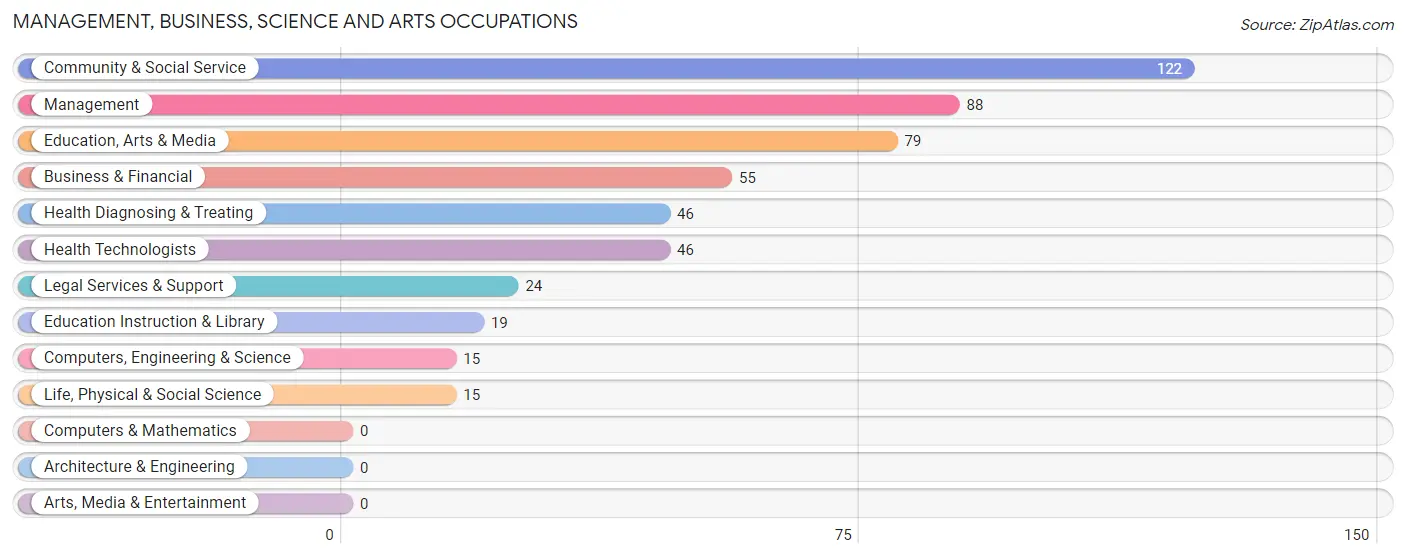
The most common Management, Business, Science and Arts occupations in Pinewood Estates are Community & Social Service (122 | 18.5%), Management (88 | 13.3%), Education, Arts & Media (79 | 12.0%), Business & Financial (55 | 8.3%), and Health Diagnosing & Treating (46 | 7.0%).
Management, Business, Science and Arts Occupations by Sex
Within the Management, Business, Science and Arts occupations in Pinewood Estates, the most male-oriented occupations are Management (100.0%), Computers, Engineering & Science (100.0%), and Life, Physical & Social Science (100.0%), while the most female-oriented occupations are Community & Social Service (100.0%), Education, Arts & Media (100.0%), and Legal Services & Support (100.0%).
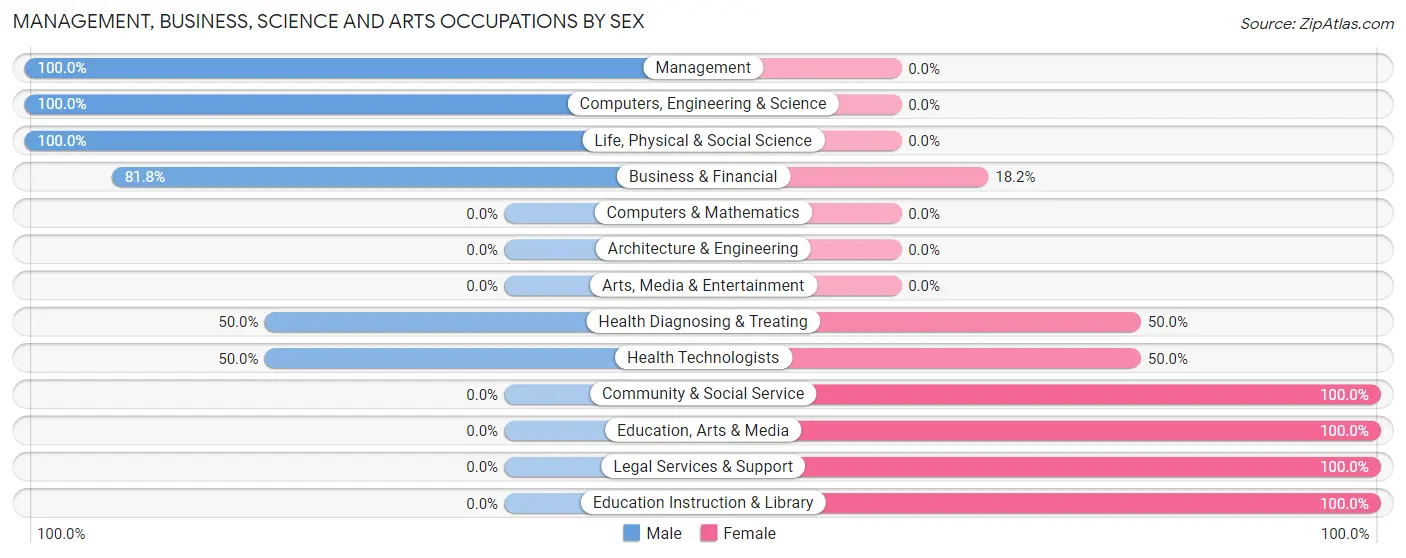
| Occupation | Male | Female |
| Management | 88 (100.0%) | 0 (0.0%) |
| Business & Financial | 45 (81.8%) | 10 (18.2%) |
| Computers, Engineering & Science | 15 (100.0%) | 0 (0.0%) |
| Computers & Mathematics | 0 (0.0%) | 0 (0.0%) |
| Architecture & Engineering | 0 (0.0%) | 0 (0.0%) |
| Life, Physical & Social Science | 15 (100.0%) | 0 (0.0%) |
| Community & Social Service | 0 (0.0%) | 122 (100.0%) |
| Education, Arts & Media | 0 (0.0%) | 79 (100.0%) |
| Legal Services & Support | 0 (0.0%) | 24 (100.0%) |
| Education Instruction & Library | 0 (0.0%) | 19 (100.0%) |
| Arts, Media & Entertainment | 0 (0.0%) | 0 (0.0%) |
| Health Diagnosing & Treating | 23 (50.0%) | 23 (50.0%) |
| Health Technologists | 23 (50.0%) | 23 (50.0%) |
| Total (Category) | 171 (52.4%) | 155 (47.5%) |
| Total (Overall) | 320 (48.5%) | 340 (51.5%) |
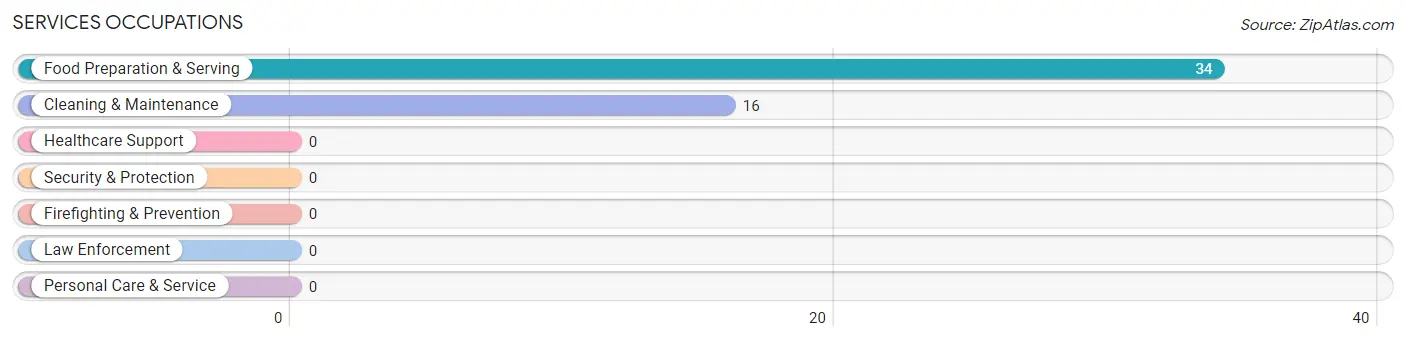
Services Occupations
The most common Services occupations in Pinewood Estates are Food Preparation & Serving (34 | 5.1%), and Cleaning & Maintenance (16 | 2.4%).
Services Occupations by Sex
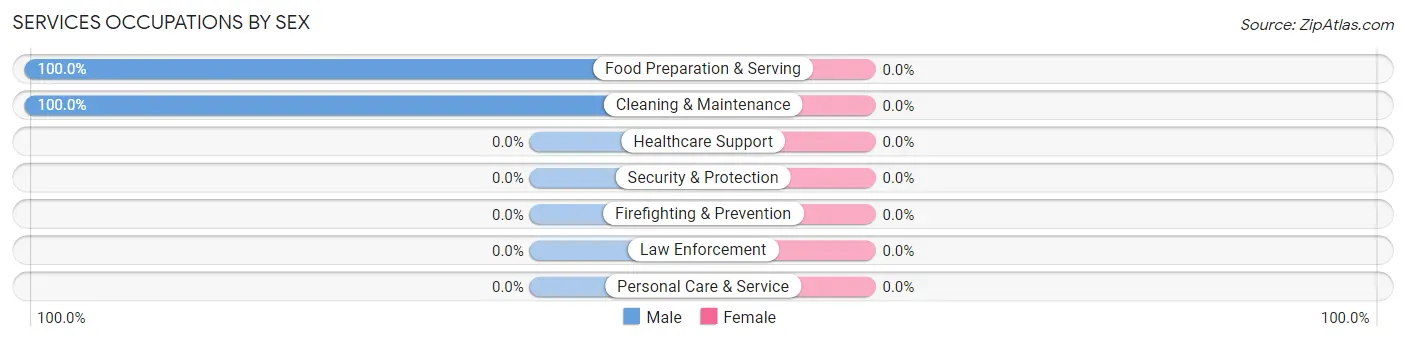
| Occupation | Male | Female |
| Healthcare Support | 0 (0.0%) | 0 (0.0%) |
| Security & Protection | 0 (0.0%) | 0 (0.0%) |
| Firefighting & Prevention | 0 (0.0%) | 0 (0.0%) |
| Law Enforcement | 0 (0.0%) | 0 (0.0%) |
| Food Preparation & Serving | 34 (100.0%) | 0 (0.0%) |
| Cleaning & Maintenance | 16 (100.0%) | 0 (0.0%) |
| Personal Care & Service | 0 (0.0%) | 0 (0.0%) |
| Total (Category) | 50 (100.0%) | 0 (0.0%) |
| Total (Overall) | 320 (48.5%) | 340 (51.5%) |
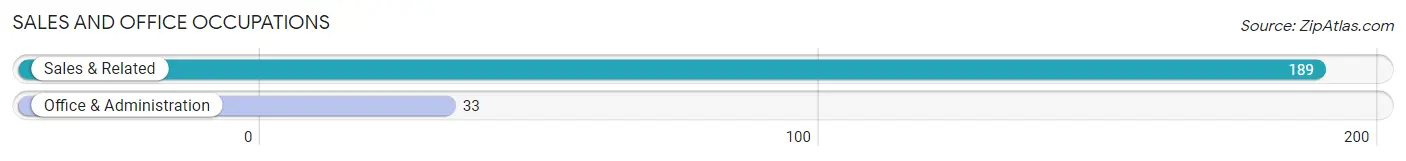
Sales and Office Occupations
The most common Sales and Office occupations in Pinewood Estates are Sales & Related (189 | 28.6%), and Office & Administration (33 | 5.0%).
Sales and Office Occupations by Sex

| Occupation | Male | Female |
| Sales & Related | 52 (27.5%) | 137 (72.5%) |
| Office & Administration | 0 (0.0%) | 33 (100.0%) |
| Total (Category) | 52 (23.4%) | 170 (76.6%) |
| Total (Overall) | 320 (48.5%) | 340 (51.5%) |
Natural Resources, Construction and Maintenance Occupations
The most common Natural Resources, Construction and Maintenance occupations in Pinewood Estates are , and Construction & Extraction (47 | 7.1%).
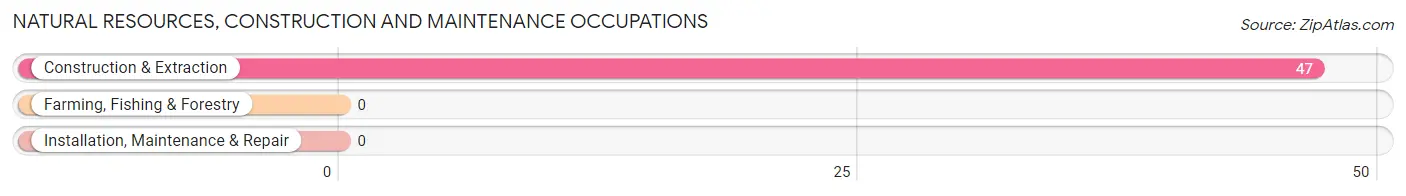
Natural Resources, Construction and Maintenance Occupations by Sex

| Occupation | Male | Female |
| Farming, Fishing & Forestry | 0 (0.0%) | 0 (0.0%) |
| Construction & Extraction | 47 (100.0%) | 0 (0.0%) |
| Installation, Maintenance & Repair | 0 (0.0%) | 0 (0.0%) |
| Total (Category) | 47 (100.0%) | 0 (0.0%) |
| Total (Overall) | 320 (48.5%) | 340 (51.5%) |
Production, Transportation and Moving Occupations
The most common Production, Transportation and Moving occupations in Pinewood Estates are , and Transportation (15 | 2.3%).
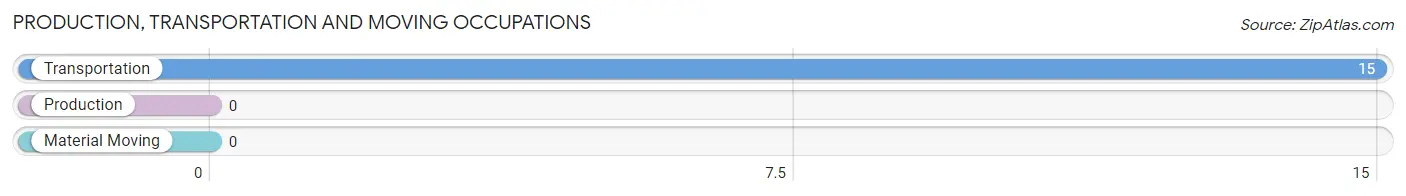
Production, Transportation and Moving Occupations by Sex
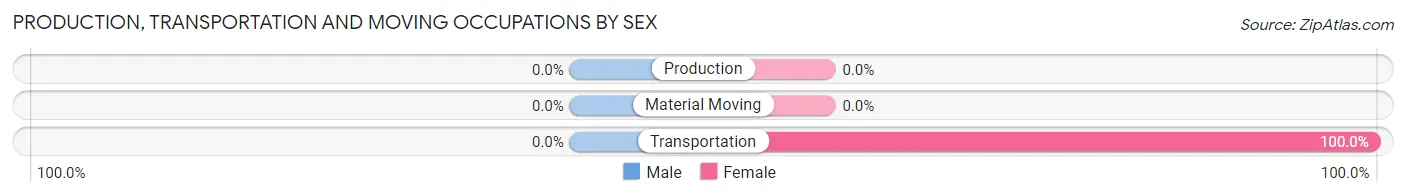
| Occupation | Male | Female |
| Production | 0 (0.0%) | 0 (0.0%) |
| Transportation | 0 (0.0%) | 15 (100.0%) |
| Material Moving | 0 (0.0%) | 0 (0.0%) |
| Total (Category) | 0 (0.0%) | 15 (100.0%) |
| Total (Overall) | 320 (48.5%) | 340 (51.5%) |
Employment Industries by Sex in Pinewood Estates
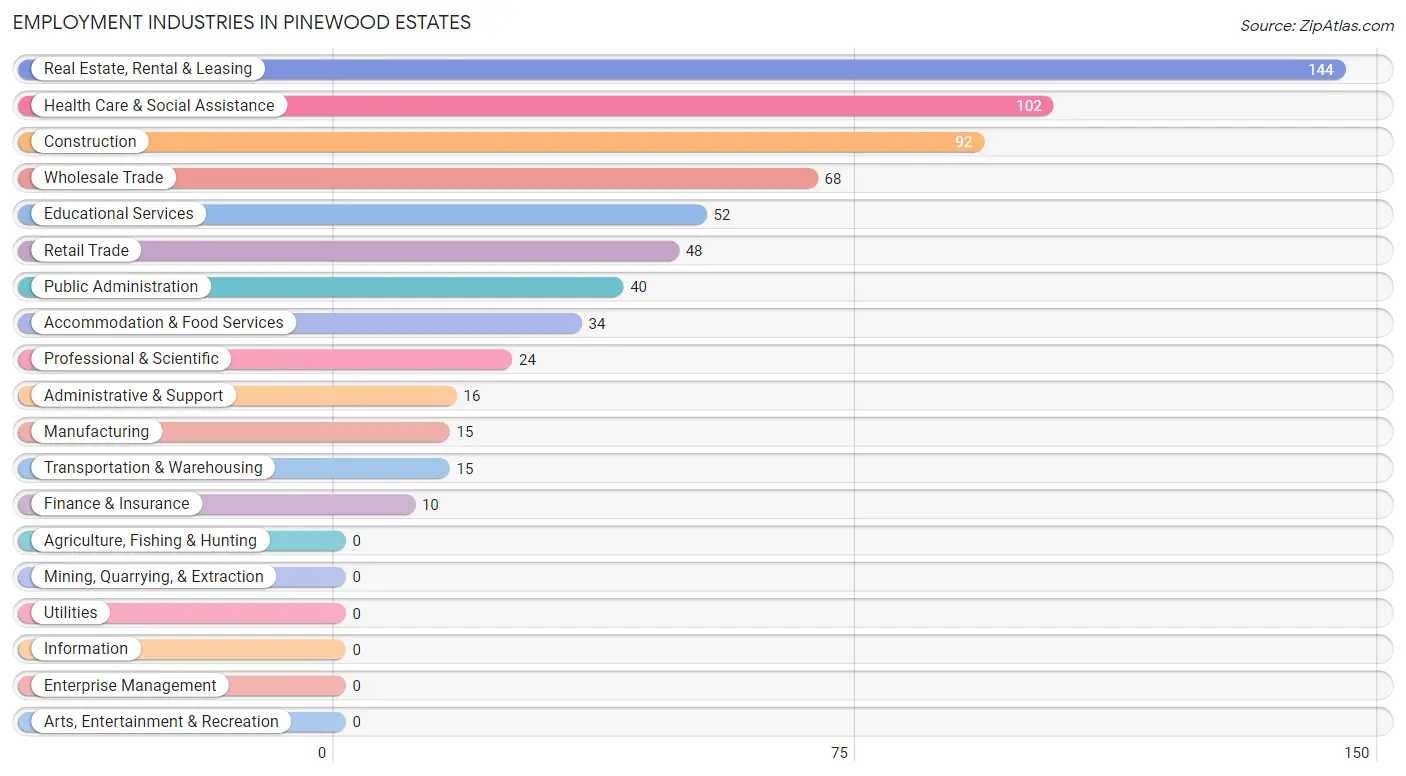
Employment Industries in Pinewood Estates
The major employment industries in Pinewood Estates include Real Estate, Rental & Leasing (144 | 21.8%), Health Care & Social Assistance (102 | 15.4%), Construction (92 | 13.9%), Wholesale Trade (68 | 10.3%), and Educational Services (52 | 7.9%).
Employment Industries by Sex in Pinewood Estates
The Pinewood Estates industries that see more men than women are Construction (100.0%), Manufacturing (100.0%), and Administrative & Support (100.0%), whereas the industries that tend to have a higher number of women are Transportation & Warehousing (100.0%), Finance & Insurance (100.0%), and Professional & Scientific (100.0%).
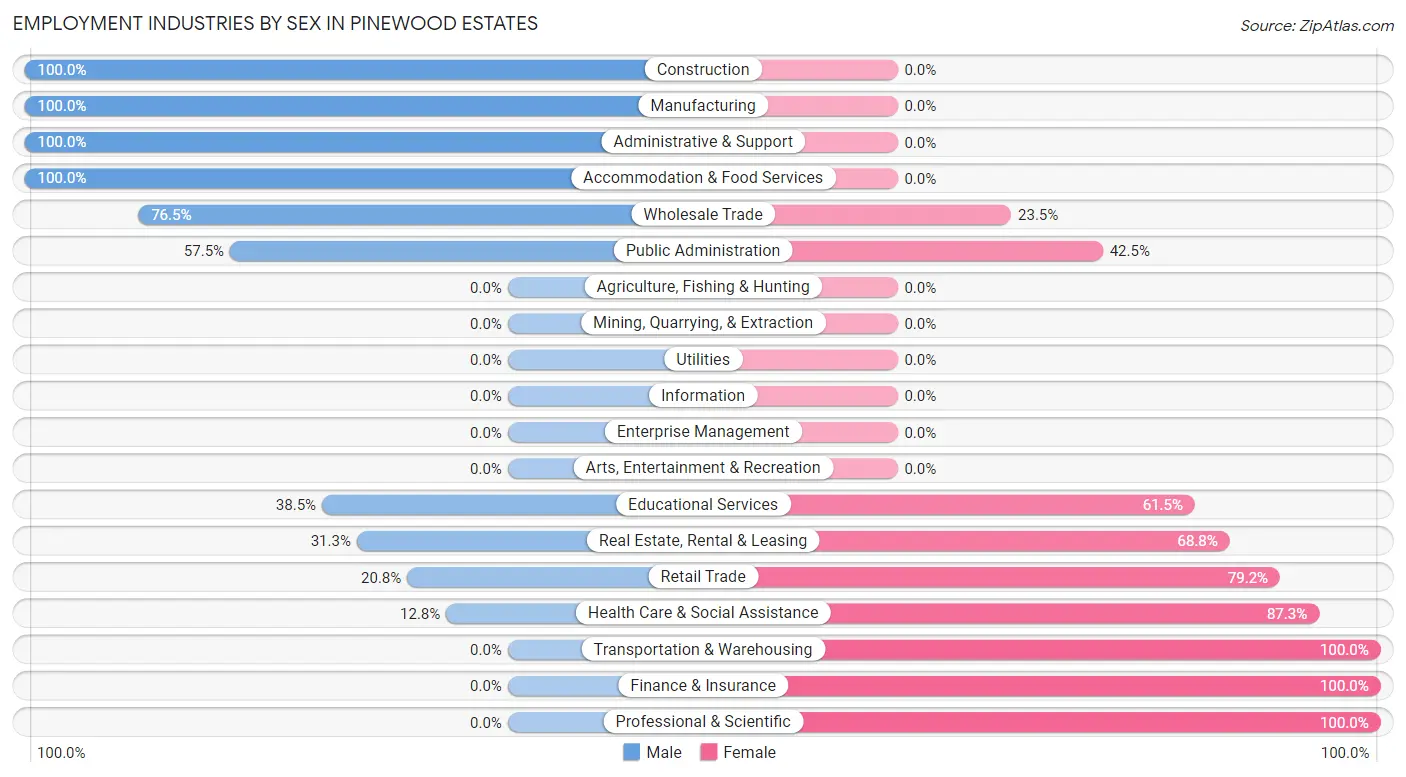
| Industry | Male | Female |
| Agriculture, Fishing & Hunting | 0 (0.0%) | 0 (0.0%) |
| Mining, Quarrying, & Extraction | 0 (0.0%) | 0 (0.0%) |
| Construction | 92 (100.0%) | 0 (0.0%) |
| Manufacturing | 15 (100.0%) | 0 (0.0%) |
| Wholesale Trade | 52 (76.5%) | 16 (23.5%) |
| Retail Trade | 10 (20.8%) | 38 (79.2%) |
| Transportation & Warehousing | 0 (0.0%) | 15 (100.0%) |
| Utilities | 0 (0.0%) | 0 (0.0%) |
| Information | 0 (0.0%) | 0 (0.0%) |
| Finance & Insurance | 0 (0.0%) | 10 (100.0%) |
| Real Estate, Rental & Leasing | 45 (31.2%) | 99 (68.8%) |
| Professional & Scientific | 0 (0.0%) | 24 (100.0%) |
| Enterprise Management | 0 (0.0%) | 0 (0.0%) |
| Administrative & Support | 16 (100.0%) | 0 (0.0%) |
| Educational Services | 20 (38.5%) | 32 (61.5%) |
| Health Care & Social Assistance | 13 (12.8%) | 89 (87.3%) |
| Arts, Entertainment & Recreation | 0 (0.0%) | 0 (0.0%) |
| Accommodation & Food Services | 34 (100.0%) | 0 (0.0%) |
| Public Administration | 23 (57.5%) | 17 (42.5%) |
| Total | 320 (48.5%) | 340 (51.5%) |
Education in Pinewood Estates
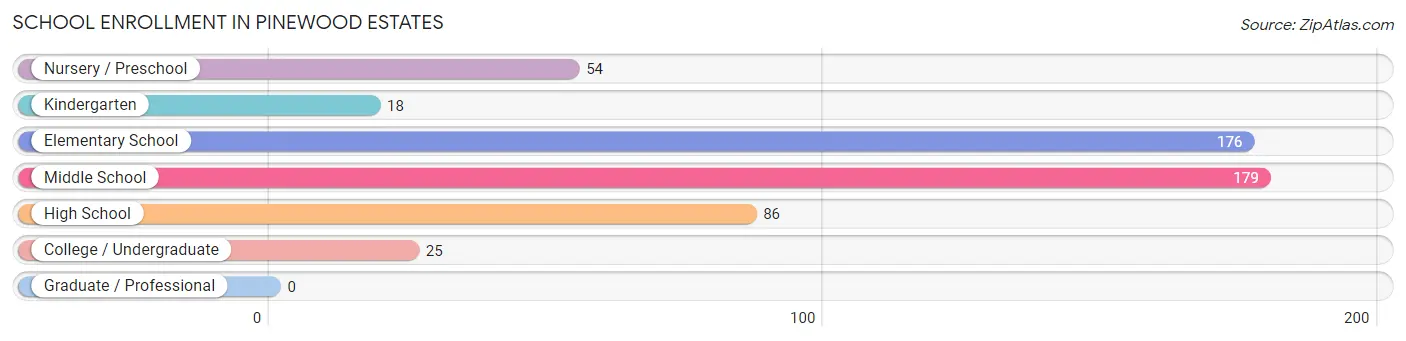
School Enrollment in Pinewood Estates
The most common levels of schooling among the 538 students in Pinewood Estates are middle school (179 | 33.3%), elementary school (176 | 32.7%), and high school (86 | 16.0%).
| School Level | # Students | % Students |
| Nursery / Preschool | 54 | 10.0% |
| Kindergarten | 18 | 3.4% |
| Elementary School | 176 | 32.7% |
| Middle School | 179 | 33.3% |
| High School | 86 | 16.0% |
| College / Undergraduate | 25 | 4.6% |
| Graduate / Professional | 0 | 0.0% |
| Total | 538 | 100.0% |
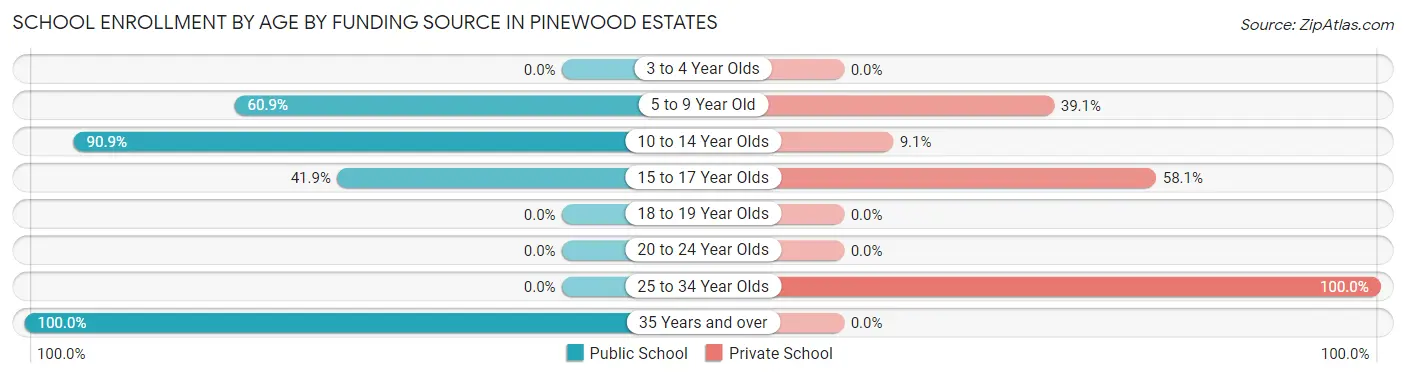
School Enrollment by Age by Funding Source in Pinewood Estates
Out of a total of 538 students who are enrolled in schools in Pinewood Estates, 173 (32.2%) attend a private institution, while the remaining 365 (67.8%) are enrolled in public schools. The age group of 25 to 34 year olds has the highest likelihood of being enrolled in private schools, with 15 (100.0% in the age bracket) enrolled. Conversely, the age group of 35 years and over has the lowest likelihood of being enrolled in a private school, with 10 (100.0% in the age bracket) attending a public institution.
| Age Bracket | Public School | Private School |
| 3 to 4 Year Olds | 0 (0.0%) | 0 (0.0%) |
| 5 to 9 Year Old | 140 (60.9%) | 90 (39.1%) |
| 10 to 14 Year Olds | 179 (90.9%) | 18 (9.1%) |
| 15 to 17 Year Olds | 36 (41.9%) | 50 (58.1%) |
| 18 to 19 Year Olds | 0 (0.0%) | 0 (0.0%) |
| 20 to 24 Year Olds | 0 (0.0%) | 0 (0.0%) |
| 25 to 34 Year Olds | 0 (0.0%) | 15 (100.0%) |
| 35 Years and over | 10 (100.0%) | 0 (0.0%) |
| Total | 365 (67.8%) | 173 (32.2%) |
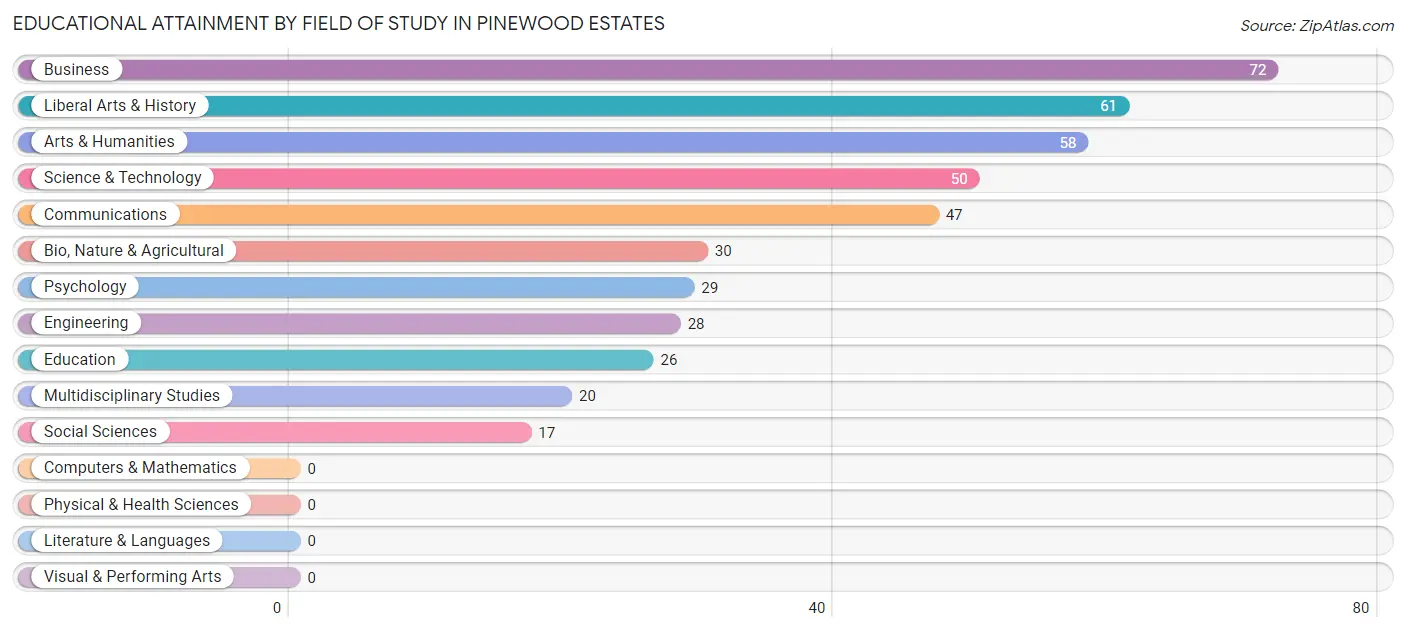
Educational Attainment by Field of Study in Pinewood Estates
Business (72 | 16.4%), liberal arts & history (61 | 13.9%), arts & humanities (58 | 13.2%), science & technology (50 | 11.4%), and communications (47 | 10.7%) are the most common fields of study among 438 individuals in Pinewood Estates who have obtained a bachelor's degree or higher.
| Field of Study | # Graduates | % Graduates |
| Computers & Mathematics | 0 | 0.0% |
| Bio, Nature & Agricultural | 30 | 6.9% |
| Physical & Health Sciences | 0 | 0.0% |
| Psychology | 29 | 6.6% |
| Social Sciences | 17 | 3.9% |
| Engineering | 28 | 6.4% |
| Multidisciplinary Studies | 20 | 4.6% |
| Science & Technology | 50 | 11.4% |
| Business | 72 | 16.4% |
| Education | 26 | 5.9% |
| Literature & Languages | 0 | 0.0% |
| Liberal Arts & History | 61 | 13.9% |
| Visual & Performing Arts | 0 | 0.0% |
| Communications | 47 | 10.7% |
| Arts & Humanities | 58 | 13.2% |
| Total | 438 | 100.0% |
Transportation & Commute in Pinewood Estates
Vehicle Availability by Sex in Pinewood Estates
The most prevalent vehicle ownership categories in Pinewood Estates are males with 2 vehicles (154, accounting for 48.1%) and females with 2 vehicles (156, making up 45.3%).
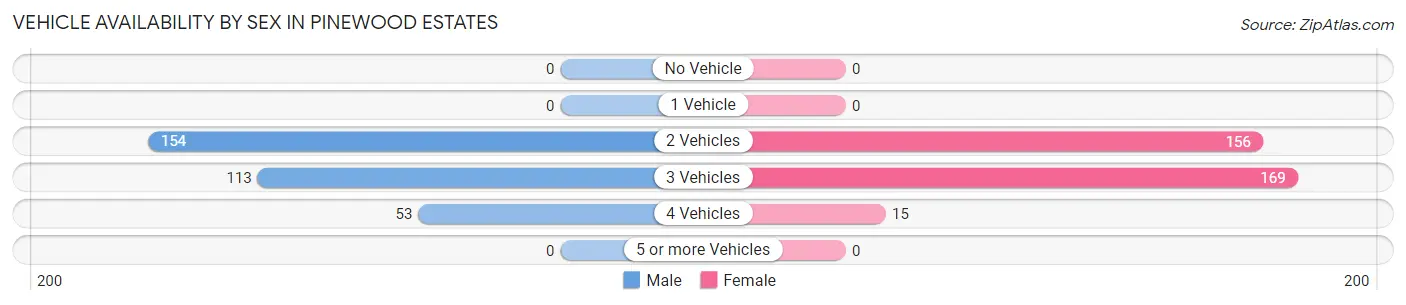
| Vehicles Available | Male | Female |
| No Vehicle | 0 (0.0%) | 0 (0.0%) |
| 1 Vehicle | 0 (0.0%) | 0 (0.0%) |
| 2 Vehicles | 154 (48.1%) | 156 (45.9%) |
| 3 Vehicles | 113 (35.3%) | 169 (49.7%) |
| 4 Vehicles | 53 (16.6%) | 15 (4.4%) |
| 5 or more Vehicles | 0 (0.0%) | 0 (0.0%) |
| Total | 320 (100.0%) | 340 (100.0%) |
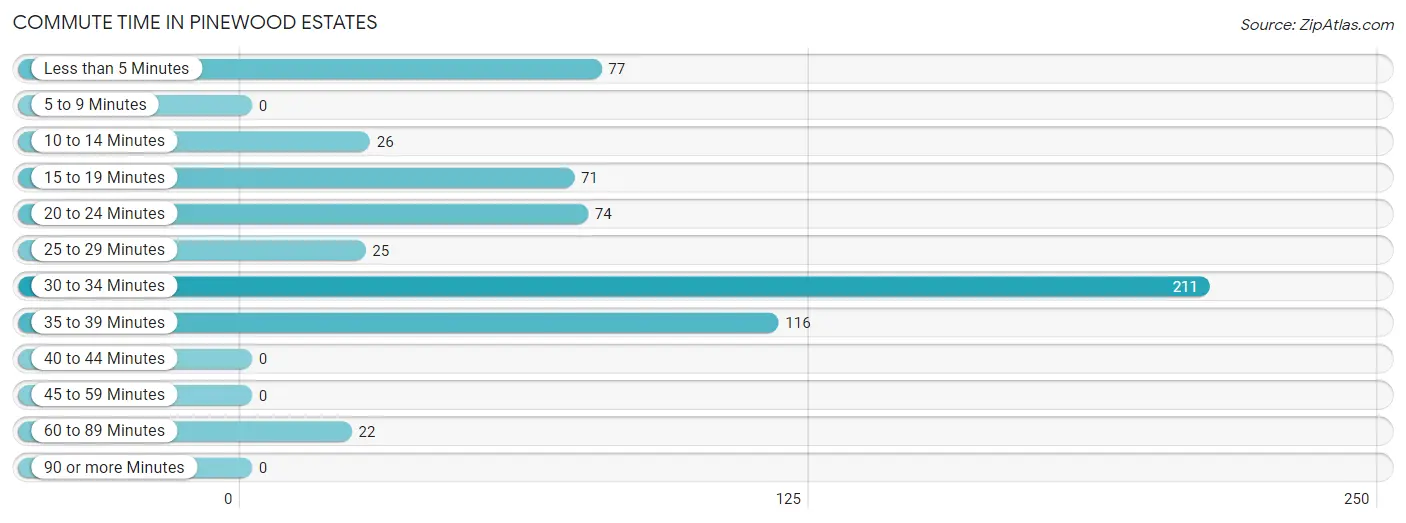
Commute Time in Pinewood Estates
The most frequently occuring commute durations in Pinewood Estates are 30 to 34 minutes (211 commuters, 33.9%), 35 to 39 minutes (116 commuters, 18.6%), and less than 5 minutes (77 commuters, 12.4%).
| Commute Time | # Commuters | % Commuters |
| Less than 5 Minutes | 77 | 12.4% |
| 5 to 9 Minutes | 0 | 0.0% |
| 10 to 14 Minutes | 26 | 4.2% |
| 15 to 19 Minutes | 71 | 11.4% |
| 20 to 24 Minutes | 74 | 11.9% |
| 25 to 29 Minutes | 25 | 4.0% |
| 30 to 34 Minutes | 211 | 33.9% |
| 35 to 39 Minutes | 116 | 18.6% |
| 40 to 44 Minutes | 0 | 0.0% |
| 45 to 59 Minutes | 0 | 0.0% |
| 60 to 89 Minutes | 22 | 3.5% |
| 90 or more Minutes | 0 | 0.0% |
Commute Time by Sex in Pinewood Estates
The most common commute times in Pinewood Estates are 30 to 34 minutes (125 commuters, 39.1%) for males and 30 to 34 minutes (86 commuters, 28.5%) for females.
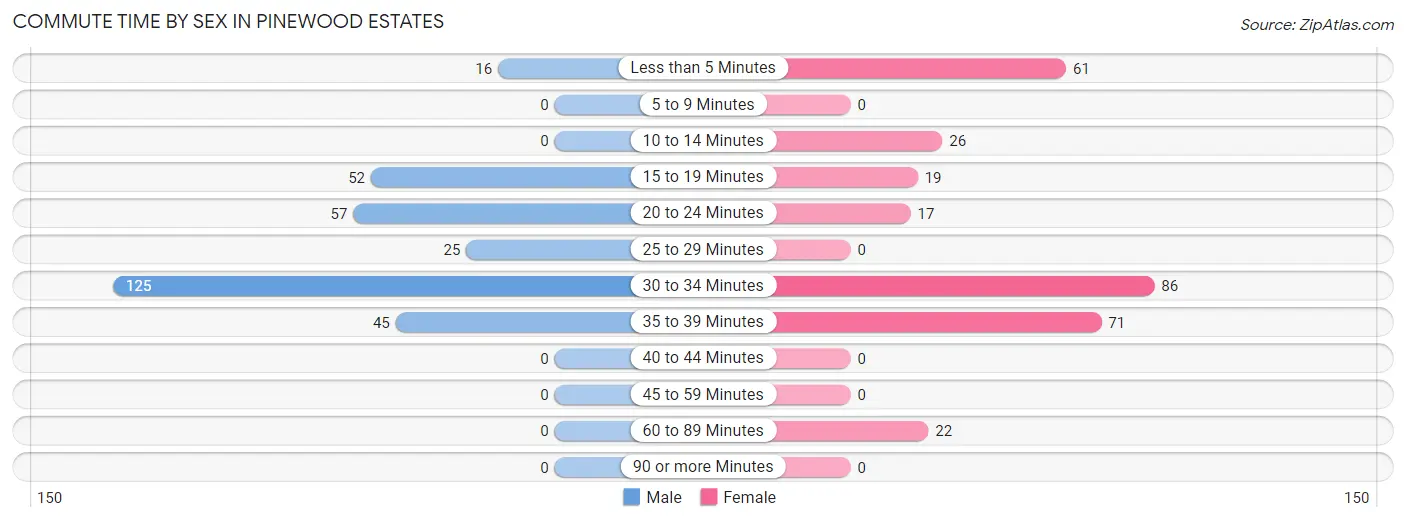
| Commute Time | Male | Female |
| Less than 5 Minutes | 16 (5.0%) | 61 (20.2%) |
| 5 to 9 Minutes | 0 (0.0%) | 0 (0.0%) |
| 10 to 14 Minutes | 0 (0.0%) | 26 (8.6%) |
| 15 to 19 Minutes | 52 (16.3%) | 19 (6.3%) |
| 20 to 24 Minutes | 57 (17.8%) | 17 (5.6%) |
| 25 to 29 Minutes | 25 (7.8%) | 0 (0.0%) |
| 30 to 34 Minutes | 125 (39.1%) | 86 (28.5%) |
| 35 to 39 Minutes | 45 (14.1%) | 71 (23.5%) |
| 40 to 44 Minutes | 0 (0.0%) | 0 (0.0%) |
| 45 to 59 Minutes | 0 (0.0%) | 0 (0.0%) |
| 60 to 89 Minutes | 0 (0.0%) | 22 (7.3%) |
| 90 or more Minutes | 0 (0.0%) | 0 (0.0%) |
Time of Departure to Work by Sex in Pinewood Estates
The most frequent times of departure to work in Pinewood Estates are 7:00 AM to 7:29 AM (128, 40.0%) for males and 7:00 AM to 7:29 AM (77, 25.5%) for females.
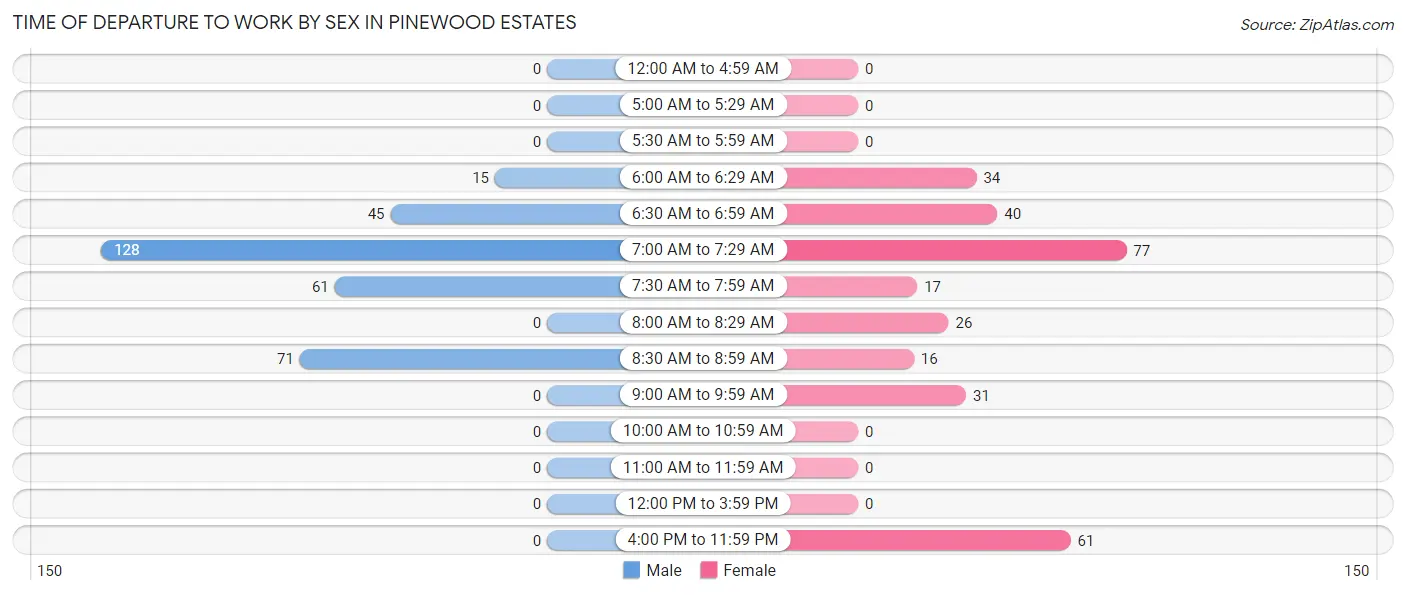
| Time of Departure | Male | Female |
| 12:00 AM to 4:59 AM | 0 (0.0%) | 0 (0.0%) |
| 5:00 AM to 5:29 AM | 0 (0.0%) | 0 (0.0%) |
| 5:30 AM to 5:59 AM | 0 (0.0%) | 0 (0.0%) |
| 6:00 AM to 6:29 AM | 15 (4.7%) | 34 (11.3%) |
| 6:30 AM to 6:59 AM | 45 (14.1%) | 40 (13.3%) |
| 7:00 AM to 7:29 AM | 128 (40.0%) | 77 (25.5%) |
| 7:30 AM to 7:59 AM | 61 (19.1%) | 17 (5.6%) |
| 8:00 AM to 8:29 AM | 0 (0.0%) | 26 (8.6%) |
| 8:30 AM to 8:59 AM | 71 (22.2%) | 16 (5.3%) |
| 9:00 AM to 9:59 AM | 0 (0.0%) | 31 (10.3%) |
| 10:00 AM to 10:59 AM | 0 (0.0%) | 0 (0.0%) |
| 11:00 AM to 11:59 AM | 0 (0.0%) | 0 (0.0%) |
| 12:00 PM to 3:59 PM | 0 (0.0%) | 0 (0.0%) |
| 4:00 PM to 11:59 PM | 0 (0.0%) | 61 (20.2%) |
| Total | 320 (100.0%) | 302 (100.0%) |
Housing Occupancy in Pinewood Estates
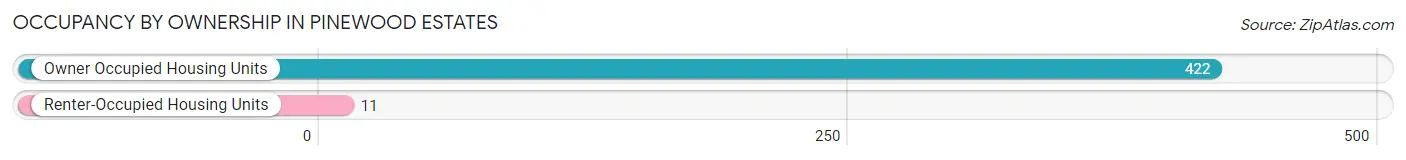
Occupancy by Ownership in Pinewood Estates
Of the total 433 dwellings in Pinewood Estates, owner-occupied units account for 422 (97.5%), while renter-occupied units make up 11 (2.5%).
| Occupancy | # Housing Units | % Housing Units |
| Owner Occupied Housing Units | 422 | 97.5% |
| Renter-Occupied Housing Units | 11 | 2.5% |
| Total Occupied Housing Units | 433 | 100.0% |
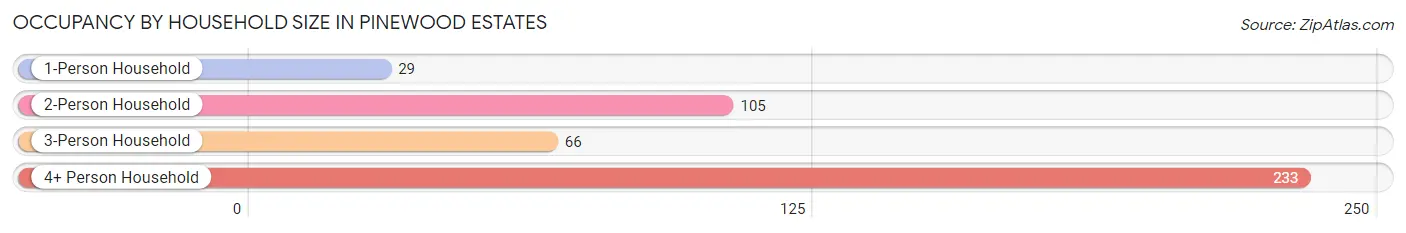
Occupancy by Household Size in Pinewood Estates
| Household Size | # Housing Units | % Housing Units |
| 1-Person Household | 29 | 6.7% |
| 2-Person Household | 105 | 24.2% |
| 3-Person Household | 66 | 15.2% |
| 4+ Person Household | 233 | 53.8% |
| Total Housing Units | 433 | 100.0% |
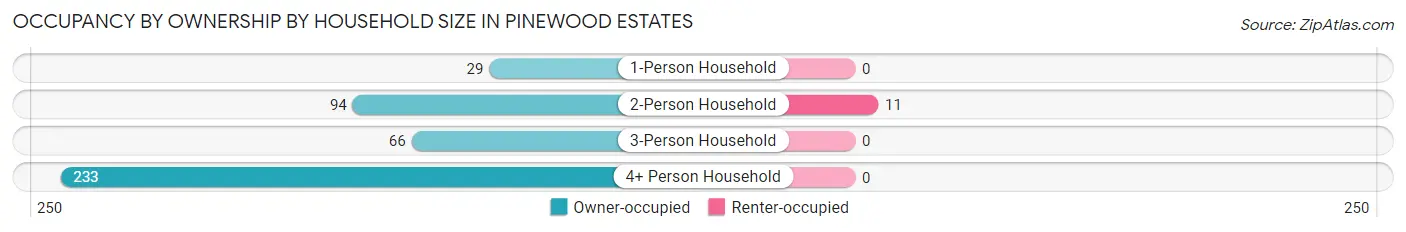
Occupancy by Ownership by Household Size in Pinewood Estates
| Household Size | Owner-occupied | Renter-occupied |
| 1-Person Household | 29 (100.0%) | 0 (0.0%) |
| 2-Person Household | 94 (89.5%) | 11 (10.5%) |
| 3-Person Household | 66 (100.0%) | 0 (0.0%) |
| 4+ Person Household | 233 (100.0%) | 0 (0.0%) |
| Total Housing Units | 422 (97.5%) | 11 (2.5%) |
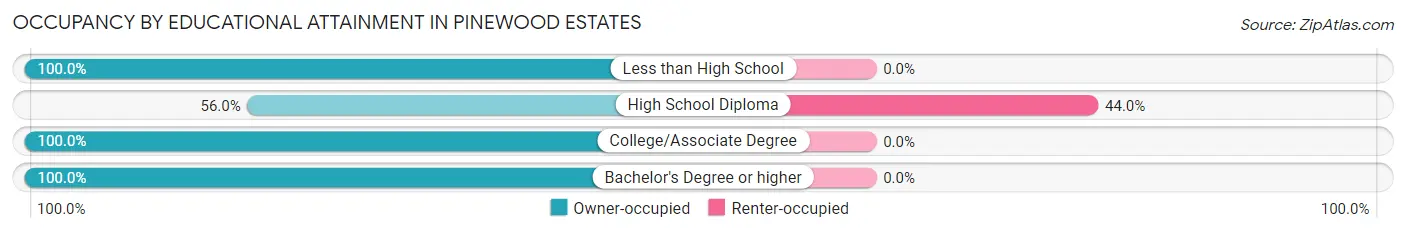
Occupancy by Educational Attainment in Pinewood Estates
| Household Size | Owner-occupied | Renter-occupied |
| Less than High School | 16 (100.0%) | 0 (0.0%) |
| High School Diploma | 14 (56.0%) | 11 (44.0%) |
| College/Associate Degree | 218 (100.0%) | 0 (0.0%) |
| Bachelor's Degree or higher | 174 (100.0%) | 0 (0.0%) |
Occupancy by Age of Householder in Pinewood Estates
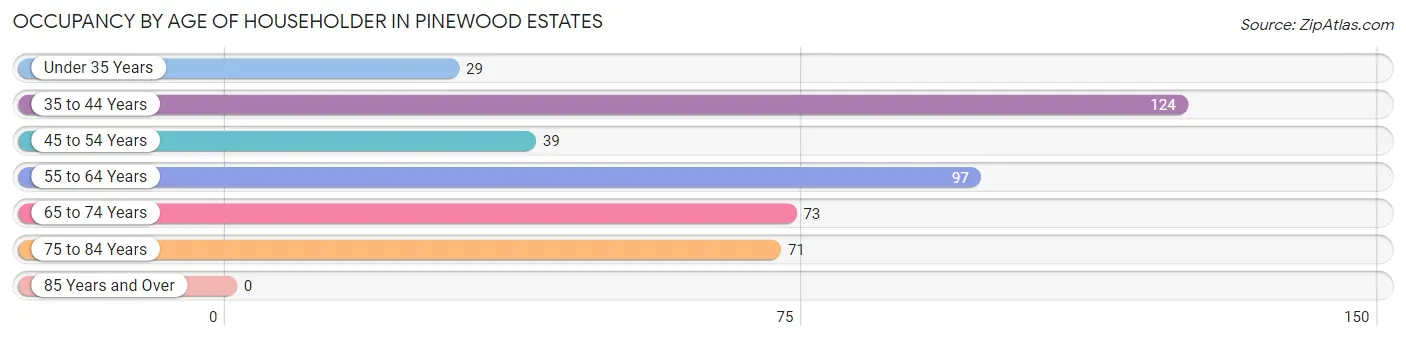
| Age Bracket | # Households | % Households |
| Under 35 Years | 29 | 6.7% |
| 35 to 44 Years | 124 | 28.6% |
| 45 to 54 Years | 39 | 9.0% |
| 55 to 64 Years | 97 | 22.4% |
| 65 to 74 Years | 73 | 16.9% |
| 75 to 84 Years | 71 | 16.4% |
| 85 Years and Over | 0 | 0.0% |
| Total | 433 | 100.0% |
Housing Finances in Pinewood Estates
Median Income by Occupancy in Pinewood Estates
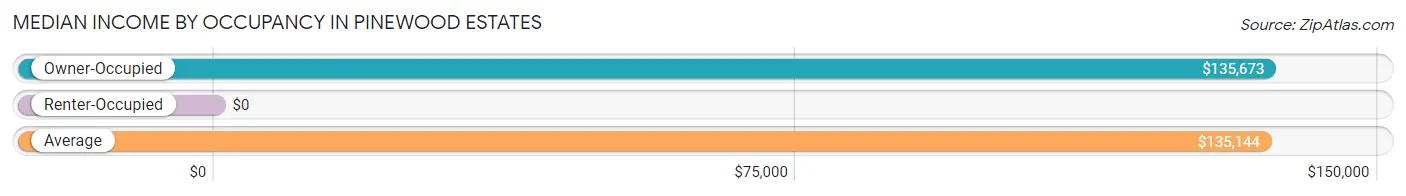
| Occupancy Type | # Households | Median Income |
| Owner-Occupied | 422 (97.5%) | $135,673 |
| Renter-Occupied | 11 (2.5%) | $0 |
| Average | 433 (100.0%) | $135,144 |
Occupancy by Householder Income Bracket in Pinewood Estates
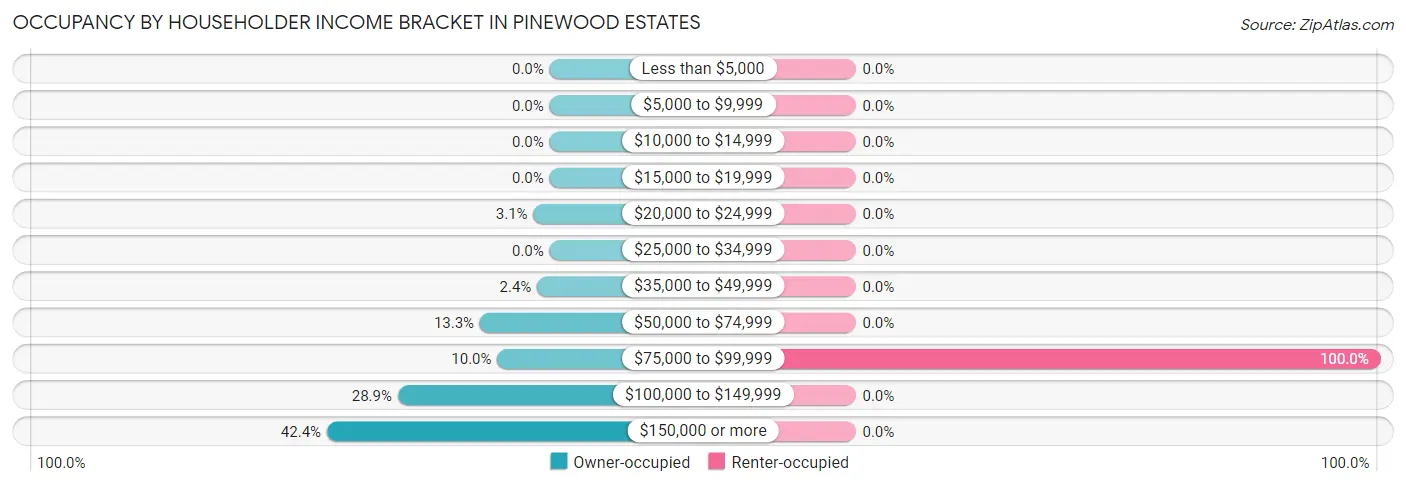
| Income Bracket | Owner-occupied | Renter-occupied |
| Less than $5,000 | 0 (0.0%) | 0 (0.0%) |
| $5,000 to $9,999 | 0 (0.0%) | 0 (0.0%) |
| $10,000 to $14,999 | 0 (0.0%) | 0 (0.0%) |
| $15,000 to $19,999 | 0 (0.0%) | 0 (0.0%) |
| $20,000 to $24,999 | 13 (3.1%) | 0 (0.0%) |
| $25,000 to $34,999 | 0 (0.0%) | 0 (0.0%) |
| $35,000 to $49,999 | 10 (2.4%) | 0 (0.0%) |
| $50,000 to $74,999 | 56 (13.3%) | 0 (0.0%) |
| $75,000 to $99,999 | 42 (10.0%) | 11 (100.0%) |
| $100,000 to $149,999 | 122 (28.9%) | 0 (0.0%) |
| $150,000 or more | 179 (42.4%) | 0 (0.0%) |
| Total | 422 (100.0%) | 11 (100.0%) |
Monthly Housing Cost Tiers in Pinewood Estates
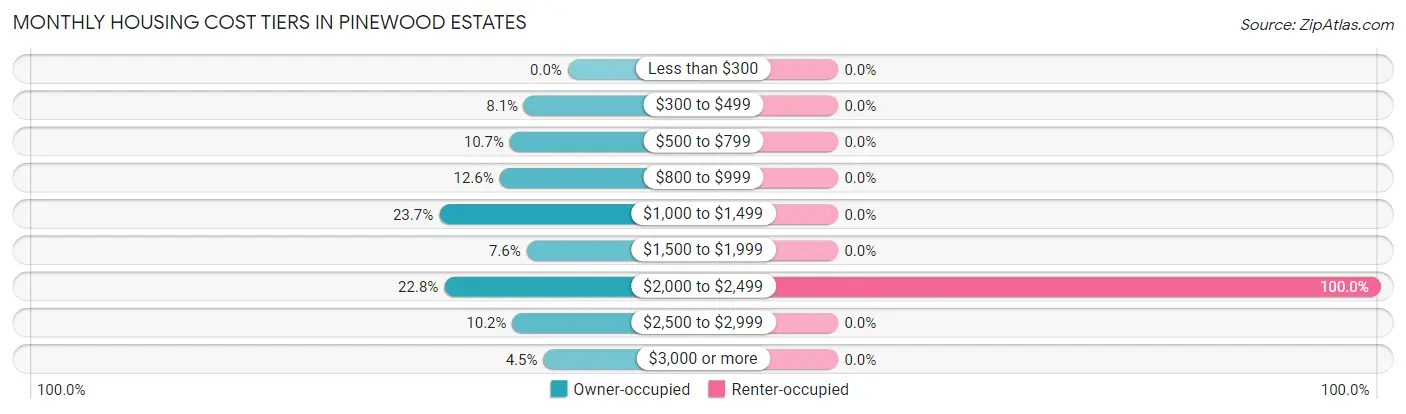
| Monthly Cost | Owner-occupied | Renter-occupied |
| Less than $300 | 0 (0.0%) | 0 (0.0%) |
| $300 to $499 | 34 (8.1%) | 0 (0.0%) |
| $500 to $799 | 45 (10.7%) | 0 (0.0%) |
| $800 to $999 | 53 (12.6%) | 0 (0.0%) |
| $1,000 to $1,499 | 100 (23.7%) | 0 (0.0%) |
| $1,500 to $1,999 | 32 (7.6%) | 0 (0.0%) |
| $2,000 to $2,499 | 96 (22.8%) | 11 (100.0%) |
| $2,500 to $2,999 | 43 (10.2%) | 0 (0.0%) |
| $3,000 or more | 19 (4.5%) | 0 (0.0%) |
| Total | 422 (100.0%) | 11 (100.0%) |
Physical Housing Characteristics in Pinewood Estates
Housing Structures in Pinewood Estates
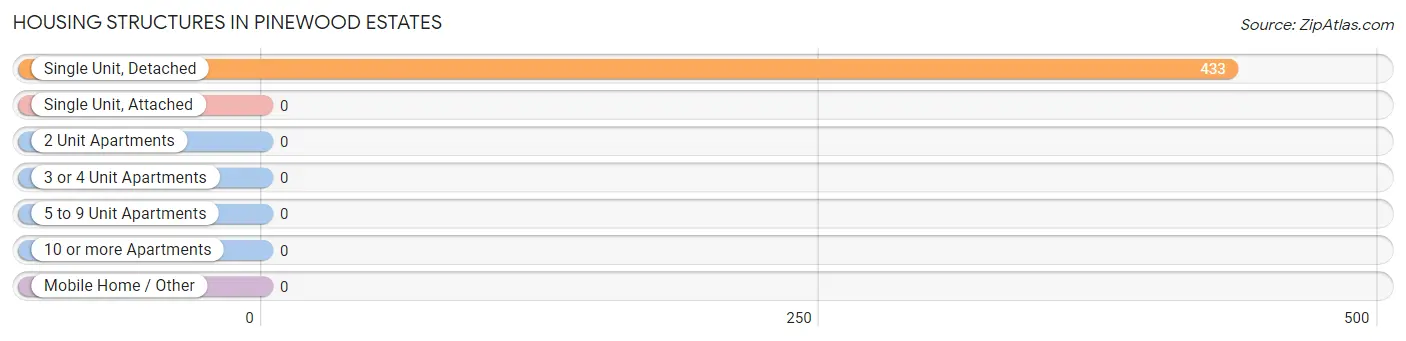
| Structure Type | # Housing Units | % Housing Units |
| Single Unit, Detached | 433 | 100.0% |
| Single Unit, Attached | 0 | 0.0% |
| 2 Unit Apartments | 0 | 0.0% |
| 3 or 4 Unit Apartments | 0 | 0.0% |
| 5 to 9 Unit Apartments | 0 | 0.0% |
| 10 or more Apartments | 0 | 0.0% |
| Mobile Home / Other | 0 | 0.0% |
| Total | 433 | 100.0% |
Housing Structures by Occupancy in Pinewood Estates
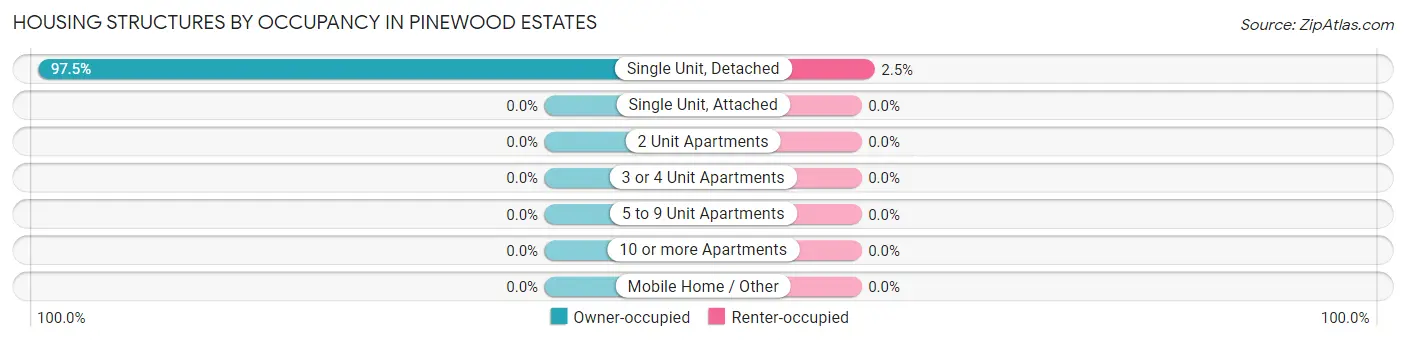
| Structure Type | Owner-occupied | Renter-occupied |
| Single Unit, Detached | 422 (97.5%) | 11 (2.5%) |
| Single Unit, Attached | 0 (0.0%) | 0 (0.0%) |
| 2 Unit Apartments | 0 (0.0%) | 0 (0.0%) |
| 3 or 4 Unit Apartments | 0 (0.0%) | 0 (0.0%) |
| 5 to 9 Unit Apartments | 0 (0.0%) | 0 (0.0%) |
| 10 or more Apartments | 0 (0.0%) | 0 (0.0%) |
| Mobile Home / Other | 0 (0.0%) | 0 (0.0%) |
| Total | 422 (97.5%) | 11 (2.5%) |
Housing Structures by Number of Rooms in Pinewood Estates
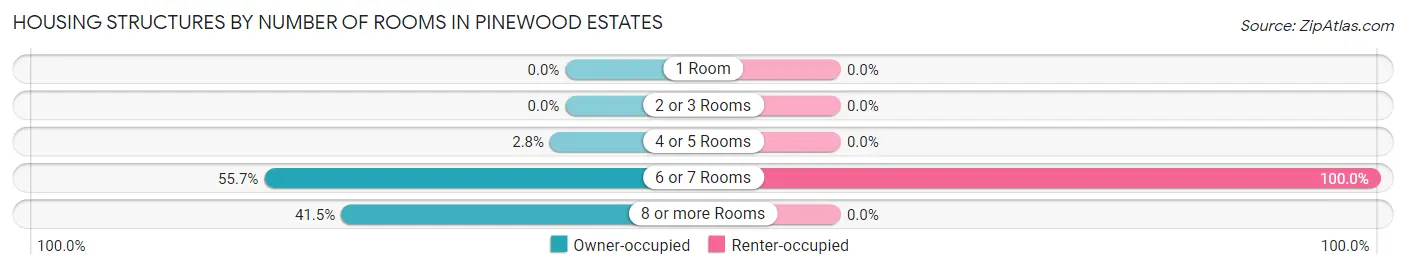
| Number of Rooms | Owner-occupied | Renter-occupied |
| 1 Room | 0 (0.0%) | 0 (0.0%) |
| 2 or 3 Rooms | 0 (0.0%) | 0 (0.0%) |
| 4 or 5 Rooms | 12 (2.8%) | 0 (0.0%) |
| 6 or 7 Rooms | 235 (55.7%) | 11 (100.0%) |
| 8 or more Rooms | 175 (41.5%) | 0 (0.0%) |
| Total | 422 (100.0%) | 11 (100.0%) |
Housing Structure by Heating Type in Pinewood Estates
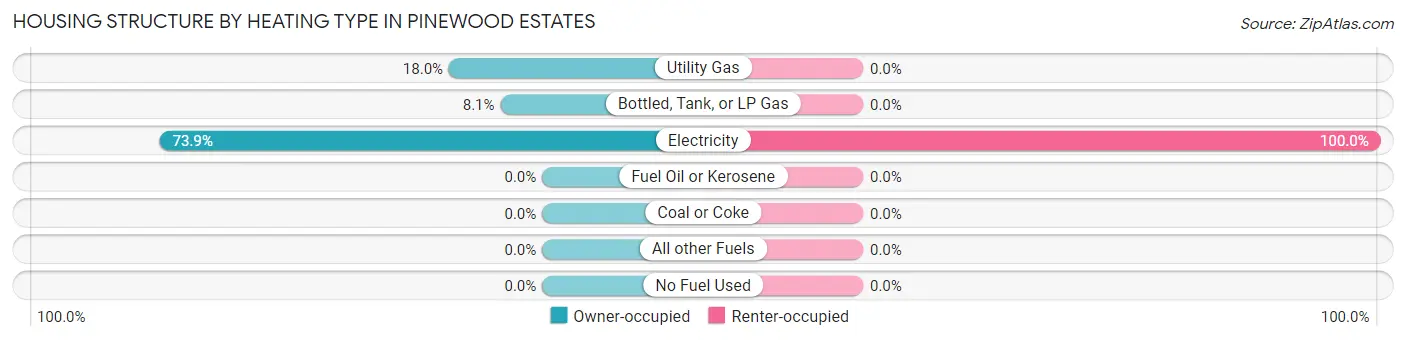
| Heating Type | Owner-occupied | Renter-occupied |
| Utility Gas | 76 (18.0%) | 0 (0.0%) |
| Bottled, Tank, or LP Gas | 34 (8.1%) | 0 (0.0%) |
| Electricity | 312 (73.9%) | 11 (100.0%) |
| Fuel Oil or Kerosene | 0 (0.0%) | 0 (0.0%) |
| Coal or Coke | 0 (0.0%) | 0 (0.0%) |
| All other Fuels | 0 (0.0%) | 0 (0.0%) |
| No Fuel Used | 0 (0.0%) | 0 (0.0%) |
| Total | 422 (100.0%) | 11 (100.0%) |
Household Vehicle Usage in Pinewood Estates
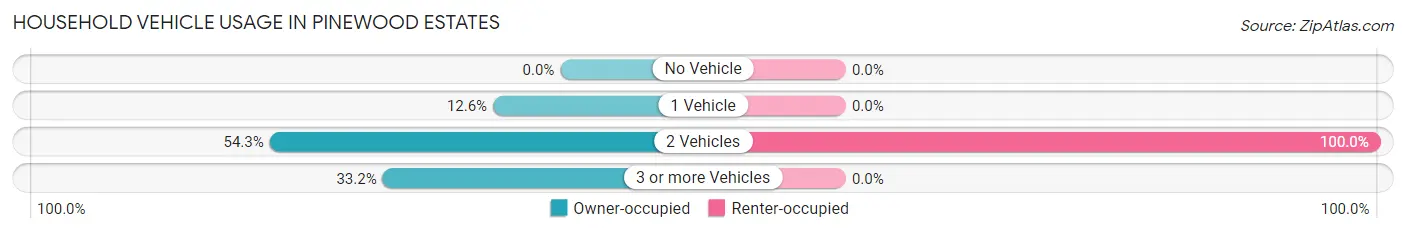
| Vehicles per Household | Owner-occupied | Renter-occupied |
| No Vehicle | 0 (0.0%) | 0 (0.0%) |
| 1 Vehicle | 53 (12.6%) | 0 (0.0%) |
| 2 Vehicles | 229 (54.3%) | 11 (100.0%) |
| 3 or more Vehicles | 140 (33.2%) | 0 (0.0%) |
| Total | 422 (100.0%) | 11 (100.0%) |
Real Estate & Mortgages in Pinewood Estates
Real Estate and Mortgage Overview in Pinewood Estates
| Characteristic | Without Mortgage | With Mortgage |
| Housing Units | 189 | 233 |
| Median Property Value | $294,300 | $285,000 |
| Median Household Income | $103,520 | $107 |
| Monthly Housing Costs | $902 | $19 |
| Real Estate Taxes | - | - |
Property Value by Mortgage Status in Pinewood Estates
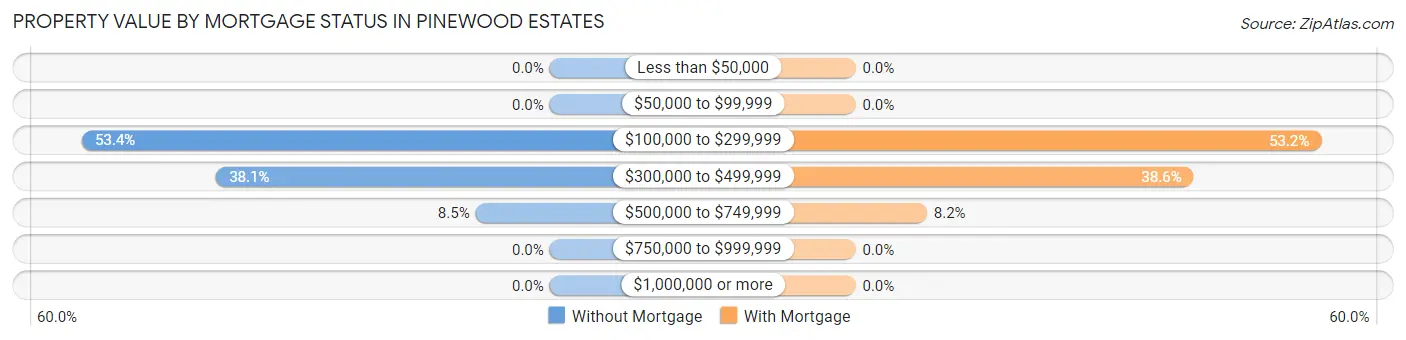
| Property Value | Without Mortgage | With Mortgage |
| Less than $50,000 | 0 (0.0%) | 0 (0.0%) |
| $50,000 to $99,999 | 0 (0.0%) | 0 (0.0%) |
| $100,000 to $299,999 | 101 (53.4%) | 124 (53.2%) |
| $300,000 to $499,999 | 72 (38.1%) | 90 (38.6%) |
| $500,000 to $749,999 | 16 (8.5%) | 19 (8.2%) |
| $750,000 to $999,999 | 0 (0.0%) | 0 (0.0%) |
| $1,000,000 or more | 0 (0.0%) | 0 (0.0%) |
| Total | 189 (100.0%) | 233 (100.0%) |
Household Income by Mortgage Status in Pinewood Estates
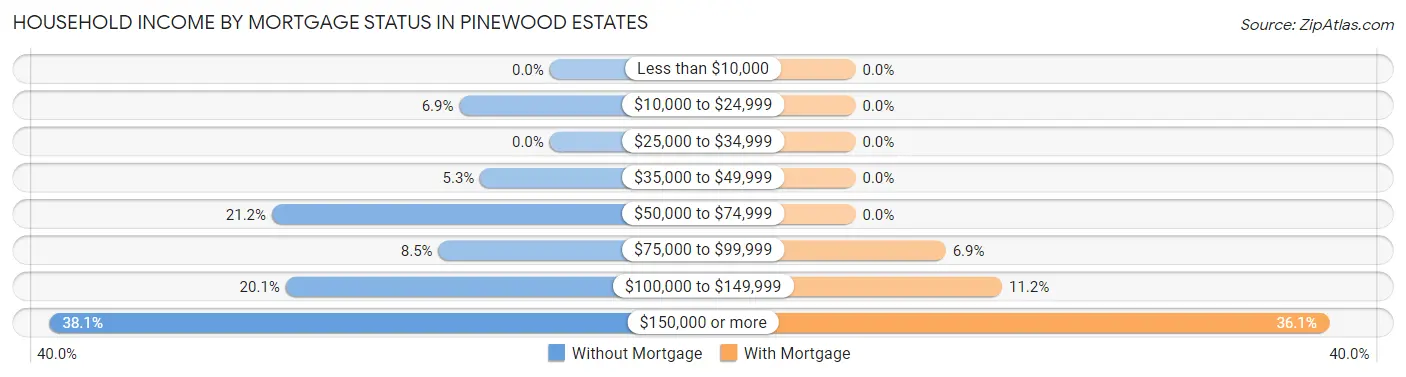
| Household Income | Without Mortgage | With Mortgage |
| Less than $10,000 | 0 (0.0%) | 0 (0.0%) |
| $10,000 to $24,999 | 13 (6.9%) | 0 (0.0%) |
| $25,000 to $34,999 | 0 (0.0%) | 0 (0.0%) |
| $35,000 to $49,999 | 10 (5.3%) | 0 (0.0%) |
| $50,000 to $74,999 | 40 (21.2%) | 0 (0.0%) |
| $75,000 to $99,999 | 16 (8.5%) | 16 (6.9%) |
| $100,000 to $149,999 | 38 (20.1%) | 26 (11.2%) |
| $150,000 or more | 72 (38.1%) | 84 (36.0%) |
| Total | 189 (100.0%) | 233 (100.0%) |
Property Value to Household Income Ratio in Pinewood Estates
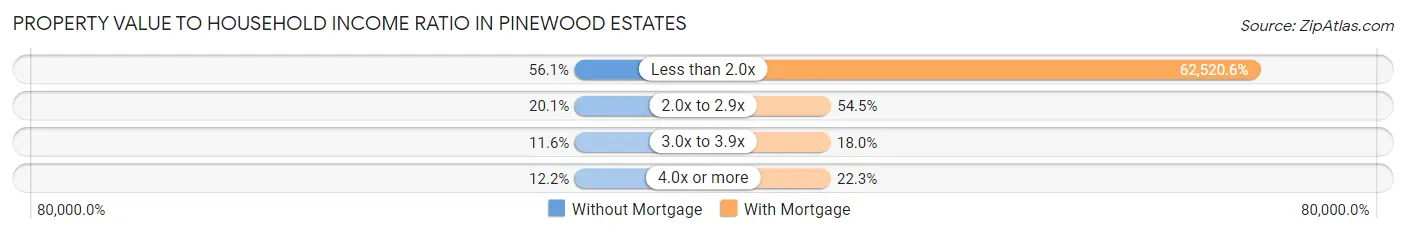
| Value-to-Income Ratio | Without Mortgage | With Mortgage |
| Less than 2.0x | 106 (56.1%) | 145,673 (62,520.6%) |
| 2.0x to 2.9x | 38 (20.1%) | 127 (54.5%) |
| 3.0x to 3.9x | 22 (11.6%) | 42 (18.0%) |
| 4.0x or more | 23 (12.2%) | 52 (22.3%) |
| Total | 189 (100.0%) | 233 (100.0%) |
Real Estate Taxes by Mortgage Status in Pinewood Estates
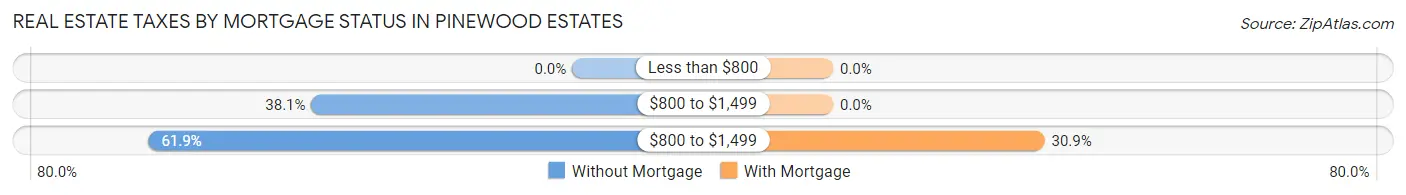
| Property Taxes | Without Mortgage | With Mortgage |
| Less than $800 | 0 (0.0%) | 0 (0.0%) |
| $800 to $1,499 | 72 (38.1%) | 0 (0.0%) |
| $800 to $1,499 | 117 (61.9%) | 72 (30.9%) |
| Total | 189 (100.0%) | 233 (100.0%) |
Health & Disability in Pinewood Estates
Health Insurance Coverage by Age in Pinewood Estates
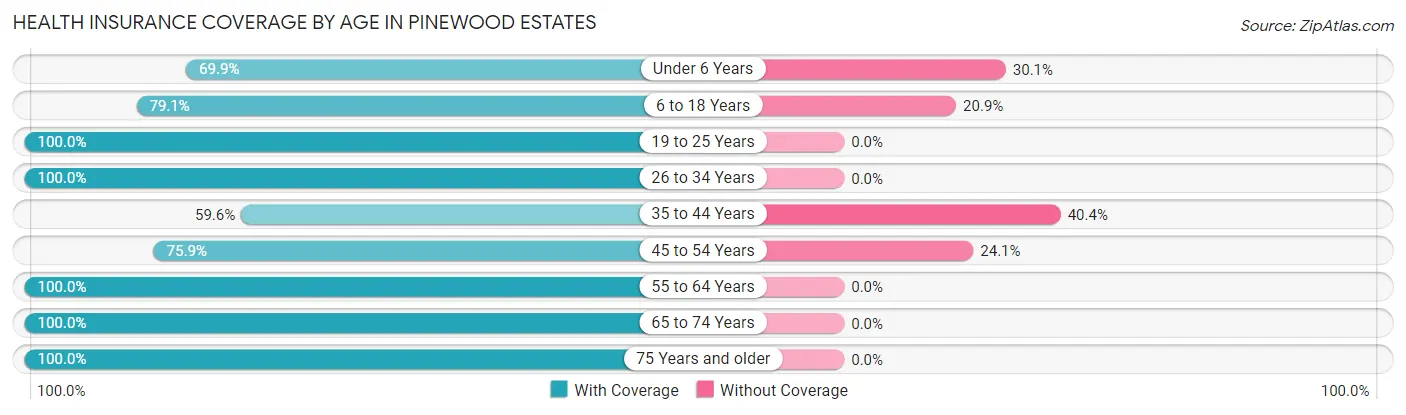
| Age Bracket | With Coverage | Without Coverage |
| Under 6 Years | 109 (69.9%) | 47 (30.1%) |
| 6 to 18 Years | 349 (79.1%) | 92 (20.9%) |
| 19 to 25 Years | 49 (100.0%) | 0 (0.0%) |
| 26 to 34 Years | 64 (100.0%) | 0 (0.0%) |
| 35 to 44 Years | 198 (59.6%) | 134 (40.4%) |
| 45 to 54 Years | 41 (75.9%) | 13 (24.1%) |
| 55 to 64 Years | 135 (100.0%) | 0 (0.0%) |
| 65 to 74 Years | 173 (100.0%) | 0 (0.0%) |
| 75 Years and older | 129 (100.0%) | 0 (0.0%) |
| Total | 1,247 (81.3%) | 286 (18.7%) |
Health Insurance Coverage by Citizenship Status in Pinewood Estates
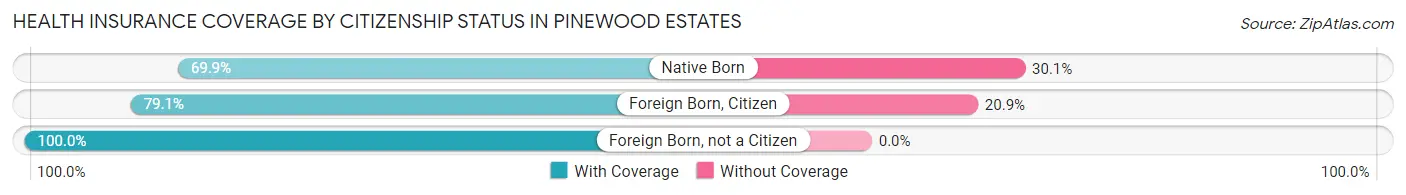
| Citizenship Status | With Coverage | Without Coverage |
| Native Born | 109 (69.9%) | 47 (30.1%) |
| Foreign Born, Citizen | 349 (79.1%) | 92 (20.9%) |
| Foreign Born, not a Citizen | 49 (100.0%) | 0 (0.0%) |
Health Insurance Coverage by Household Income in Pinewood Estates
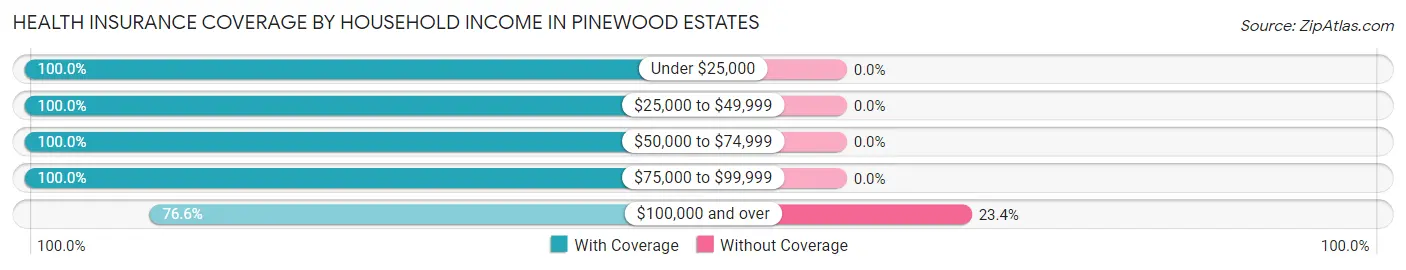
| Household Income | With Coverage | Without Coverage |
| Under $25,000 | 13 (100.0%) | 0 (0.0%) |
| $25,000 to $49,999 | 10 (100.0%) | 0 (0.0%) |
| $50,000 to $74,999 | 174 (100.0%) | 0 (0.0%) |
| $75,000 to $99,999 | 114 (100.0%) | 0 (0.0%) |
| $100,000 and over | 936 (76.6%) | 286 (23.4%) |
Public vs Private Health Insurance Coverage by Age in Pinewood Estates
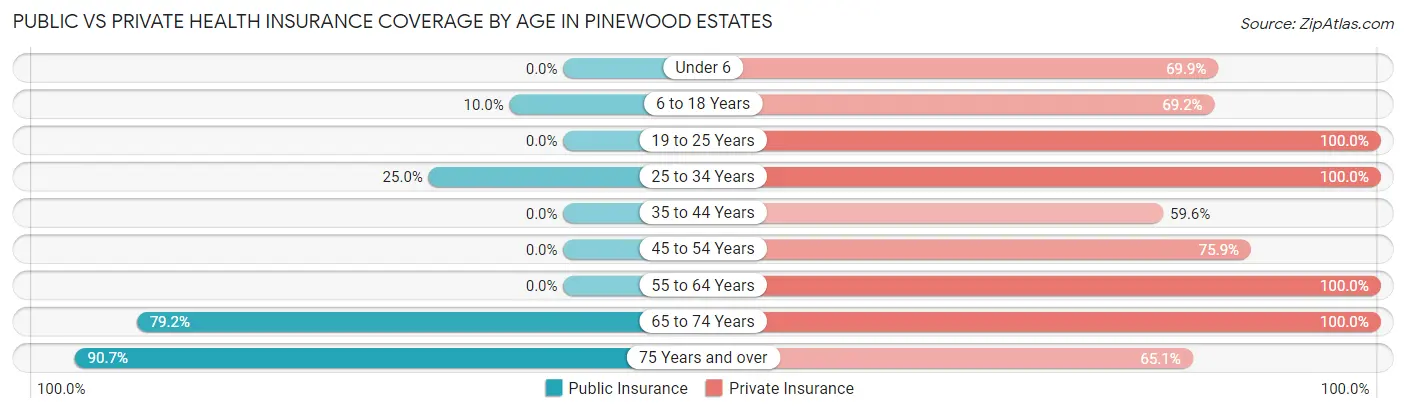
| Age Bracket | Public Insurance | Private Insurance |
| Under 6 | 0 (0.0%) | 109 (69.9%) |
| 6 to 18 Years | 44 (10.0%) | 305 (69.2%) |
| 19 to 25 Years | 0 (0.0%) | 49 (100.0%) |
| 25 to 34 Years | 16 (25.0%) | 64 (100.0%) |
| 35 to 44 Years | 0 (0.0%) | 198 (59.6%) |
| 45 to 54 Years | 0 (0.0%) | 41 (75.9%) |
| 55 to 64 Years | 0 (0.0%) | 135 (100.0%) |
| 65 to 74 Years | 137 (79.2%) | 173 (100.0%) |
| 75 Years and over | 117 (90.7%) | 84 (65.1%) |
| Total | 314 (20.5%) | 1,158 (75.5%) |
Disability Status by Sex by Age in Pinewood Estates
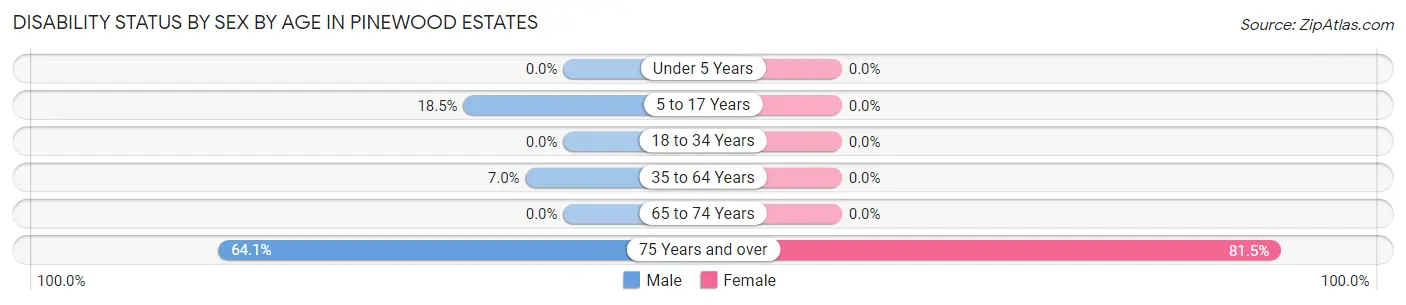
| Age Bracket | Male | Female |
| Under 5 Years | 0 (0.0%) | 0 (0.0%) |
| 5 to 17 Years | 61 (18.5%) | 0 (0.0%) |
| 18 to 34 Years | 0 (0.0%) | 0 (0.0%) |
| 35 to 64 Years | 15 (7.0%) | 0 (0.0%) |
| 65 to 74 Years | 0 (0.0%) | 0 (0.0%) |
| 75 Years and over | 41 (64.1%) | 53 (81.5%) |
Disability Class by Sex by Age in Pinewood Estates
Disability Class: Hearing Difficulty
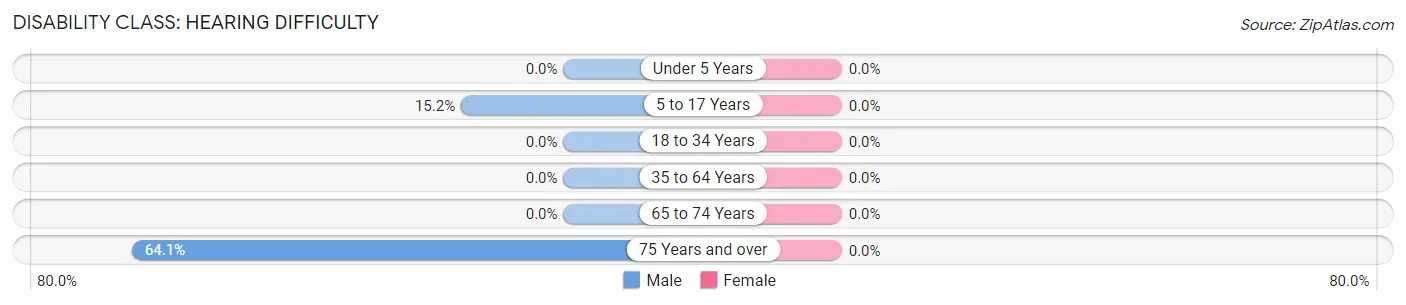
| Age Bracket | Male | Female |
| Under 5 Years | 0 (0.0%) | 0 (0.0%) |
| 5 to 17 Years | 50 (15.2%) | 0 (0.0%) |
| 18 to 34 Years | 0 (0.0%) | 0 (0.0%) |
| 35 to 64 Years | 0 (0.0%) | 0 (0.0%) |
| 65 to 74 Years | 0 (0.0%) | 0 (0.0%) |
| 75 Years and over | 41 (64.1%) | 0 (0.0%) |
Disability Class: Vision Difficulty
| Age Bracket | Male | Female |
| Under 5 Years | 0 (0.0%) | 0 (0.0%) |
| 5 to 17 Years | 0 (0.0%) | 0 (0.0%) |
| 18 to 34 Years | 0 (0.0%) | 0 (0.0%) |
| 35 to 64 Years | 0 (0.0%) | 0 (0.0%) |
| 65 to 74 Years | 0 (0.0%) | 0 (0.0%) |
| 75 Years and over | 0 (0.0%) | 0 (0.0%) |
Disability Class: Cognitive Difficulty
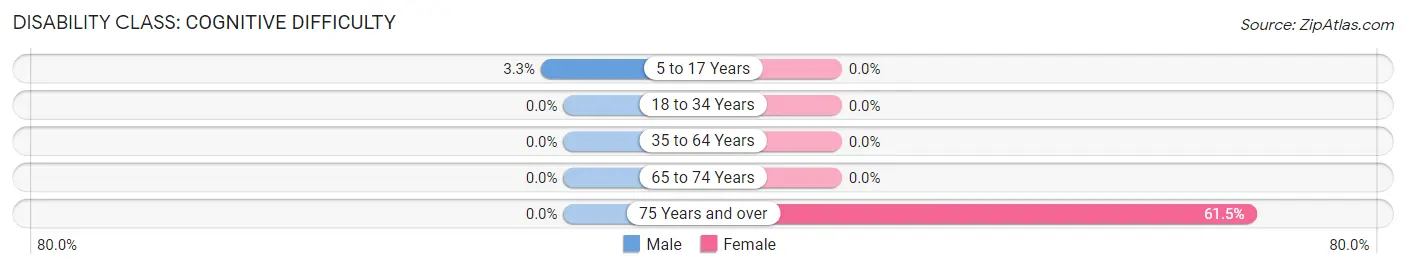
| Age Bracket | Male | Female |
| 5 to 17 Years | 11 (3.3%) | 0 (0.0%) |
| 18 to 34 Years | 0 (0.0%) | 0 (0.0%) |
| 35 to 64 Years | 0 (0.0%) | 0 (0.0%) |
| 65 to 74 Years | 0 (0.0%) | 0 (0.0%) |
| 75 Years and over | 0 (0.0%) | 40 (61.5%) |
Disability Class: Ambulatory Difficulty
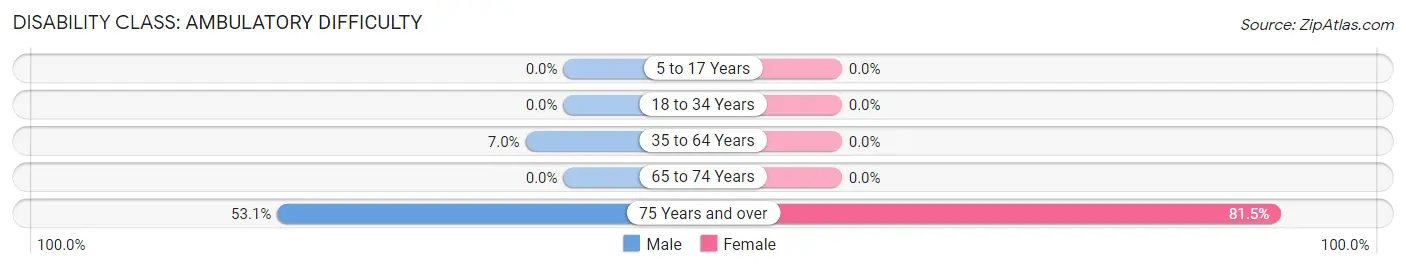
| Age Bracket | Male | Female |
| 5 to 17 Years | 0 (0.0%) | 0 (0.0%) |
| 18 to 34 Years | 0 (0.0%) | 0 (0.0%) |
| 35 to 64 Years | 15 (7.0%) | 0 (0.0%) |
| 65 to 74 Years | 0 (0.0%) | 0 (0.0%) |
| 75 Years and over | 34 (53.1%) | 53 (81.5%) |
Disability Class: Self-Care Difficulty
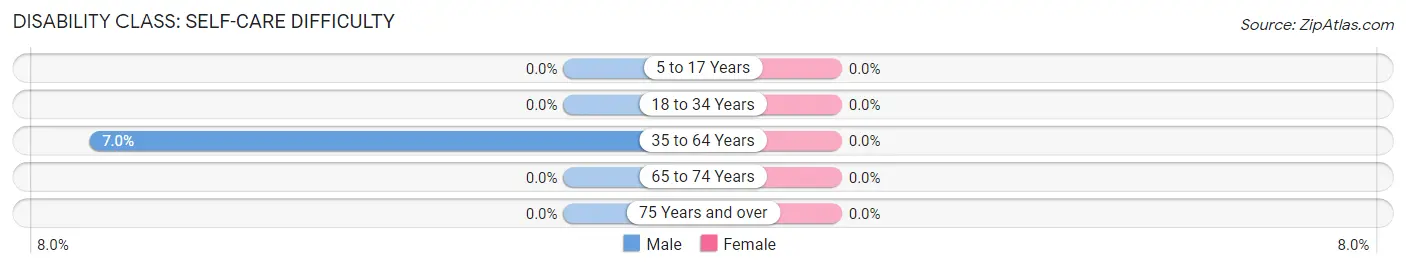
| Age Bracket | Male | Female |
| 5 to 17 Years | 0 (0.0%) | 0 (0.0%) |
| 18 to 34 Years | 0 (0.0%) | 0 (0.0%) |
| 35 to 64 Years | 15 (7.0%) | 0 (0.0%) |
| 65 to 74 Years | 0 (0.0%) | 0 (0.0%) |
| 75 Years and over | 0 (0.0%) | 0 (0.0%) |
Technology Access in Pinewood Estates
Computing Device Access in Pinewood Estates
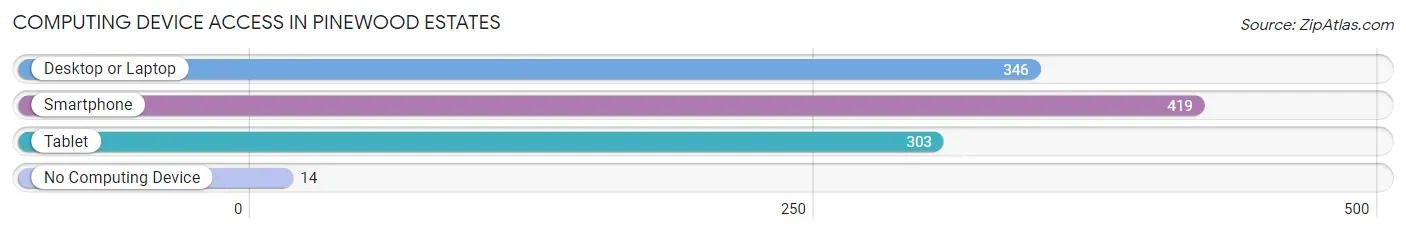
| Device Type | # Households | % Households |
| Desktop or Laptop | 346 | 79.9% |
| Smartphone | 419 | 96.8% |
| Tablet | 303 | 70.0% |
| No Computing Device | 14 | 3.2% |
| Total | 433 | 100.0% |
Internet Access in Pinewood Estates
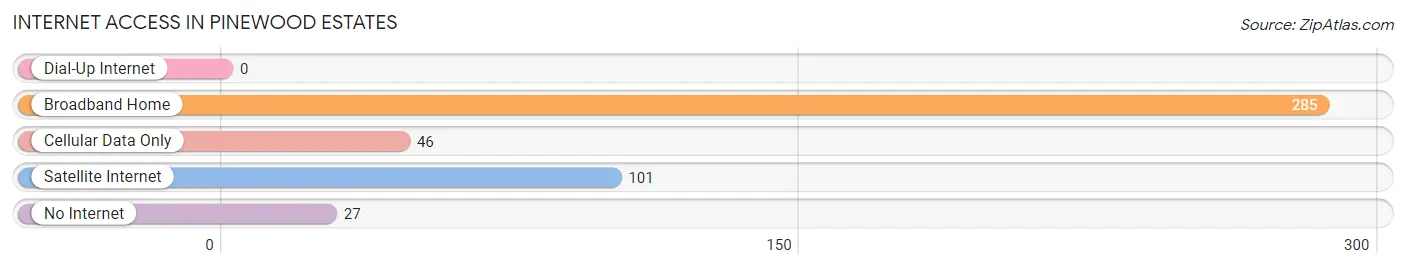
| Internet Type | # Households | % Households |
| Dial-Up Internet | 0 | 0.0% |
| Broadband Home | 285 | 65.8% |
| Cellular Data Only | 46 | 10.6% |
| Satellite Internet | 101 | 23.3% |
| No Internet | 27 | 6.2% |
| Total | 433 | 100.0% |
Pinewood Estates Summary
Pinewood Estates is a small, unincorporated community located in the state of Texas. It is situated in the southeastern corner of the state, just north of the city of Houston. The community is part of Harris County and is located within the Houston–The Woodlands–Sugar Land metropolitan area. Pinewood Estates is a relatively new community, having been established in the late 1990s.
History
Pinewood Estates was established in the late 1990s as a residential development. The community was developed by a group of investors who saw potential in the area due to its proximity to Houston. The development was designed to be a quiet, family-oriented community with a focus on providing quality housing and amenities. The community was designed to be a safe and secure place to live, with a focus on providing a high quality of life for its residents.
Geography
Pinewood Estates is located in the southeastern corner of the state of Texas, just north of the city of Houston. The community is situated in Harris County and is part of the Houston–The Woodlands–Sugar Land metropolitan area. The community is located in a rural area, with the nearest major city being Houston. The community is located in a flat, low-lying area, with the elevation ranging from about 30 to 40 feet above sea level.
Economy
Pinewood Estates is a primarily residential community, with most of the residents employed in the nearby city of Houston. The community does not have any major employers, but there are several small businesses located in the area. These businesses include a grocery store, a gas station, a restaurant, and a few other small businesses. The community also has a few small industrial parks, which provide employment opportunities for some of the residents.
Demographics
As of the 2010 census, the population of Pinewood Estates was 1,845. The population is primarily white, with about 75% of the population being white and the remaining 25% being of other races. The median household income in the community is $50,000, which is slightly higher than the national average. The median age of the population is 37, which is slightly lower than the national average. The community is also home to a large number of families, with about 60% of the population being married couples.
Conclusion
Pinewood Estates is a small, unincorporated community located in the southeastern corner of the state of Texas. The community was established in the late 1990s as a residential development and has since grown to become a safe and secure place to live. The population of the community is primarily white, with a median household income of $50,000 and a median age of 37. The community is primarily residential, with most of the residents employed in the nearby city of Houston. Pinewood Estates is a great place to live, with a focus on providing quality housing and amenities for its residents.
Common Questions
What is Per Capita Income in Pinewood Estates?
Per Capita income in Pinewood Estates is $43,244.
What is the Median Family Income in Pinewood Estates?
Median Family Income in Pinewood Estates is $136,538.
What is the Median Household income in Pinewood Estates?
Median Household Income in Pinewood Estates is $135,144.
What is Income or Wage Gap in Pinewood Estates?
Income or Wage Gap in Pinewood Estates is 67.3%.
Women in Pinewood Estates earn 32.7 cents for every dollar earned by a man.
What is Inequality or Gini Index in Pinewood Estates?
Inequality or Gini Index in Pinewood Estates is 0.31.
What is the Total Population of Pinewood Estates?
Total Population of Pinewood Estates is 1,533.
What is the Total Male Population of Pinewood Estates?
Total Male Population of Pinewood Estates is 792.
What is the Total Female Population of Pinewood Estates?
Total Female Population of Pinewood Estates is 741.
What is the Ratio of Males per 100 Females in Pinewood Estates?
There are 106.88 Males per 100 Females in Pinewood Estates.
What is the Ratio of Females per 100 Males in Pinewood Estates?
There are 93.56 Females per 100 Males in Pinewood Estates.
What is the Median Population Age in Pinewood Estates?
Median Population Age in Pinewood Estates is 36.8 Years.
What is the Average Family Size in Pinewood Estates
Average Family Size in Pinewood Estates is 3.7 People.
What is the Average Household Size in Pinewood Estates
Average Household Size in Pinewood Estates is 3.5 People.
How Large is the Labor Force in Pinewood Estates?
There are 671 People in the Labor Forcein in Pinewood Estates.
What is the Percentage of People in the Labor Force in Pinewood Estates?
66.4% of People are in the Labor Force in Pinewood Estates.
What is the Unemployment Rate in Pinewood Estates?
Unemployment Rate in Pinewood Estates is 1.6%.