Dripping Springs, TX Map & Demographics
Dripping Springs Map
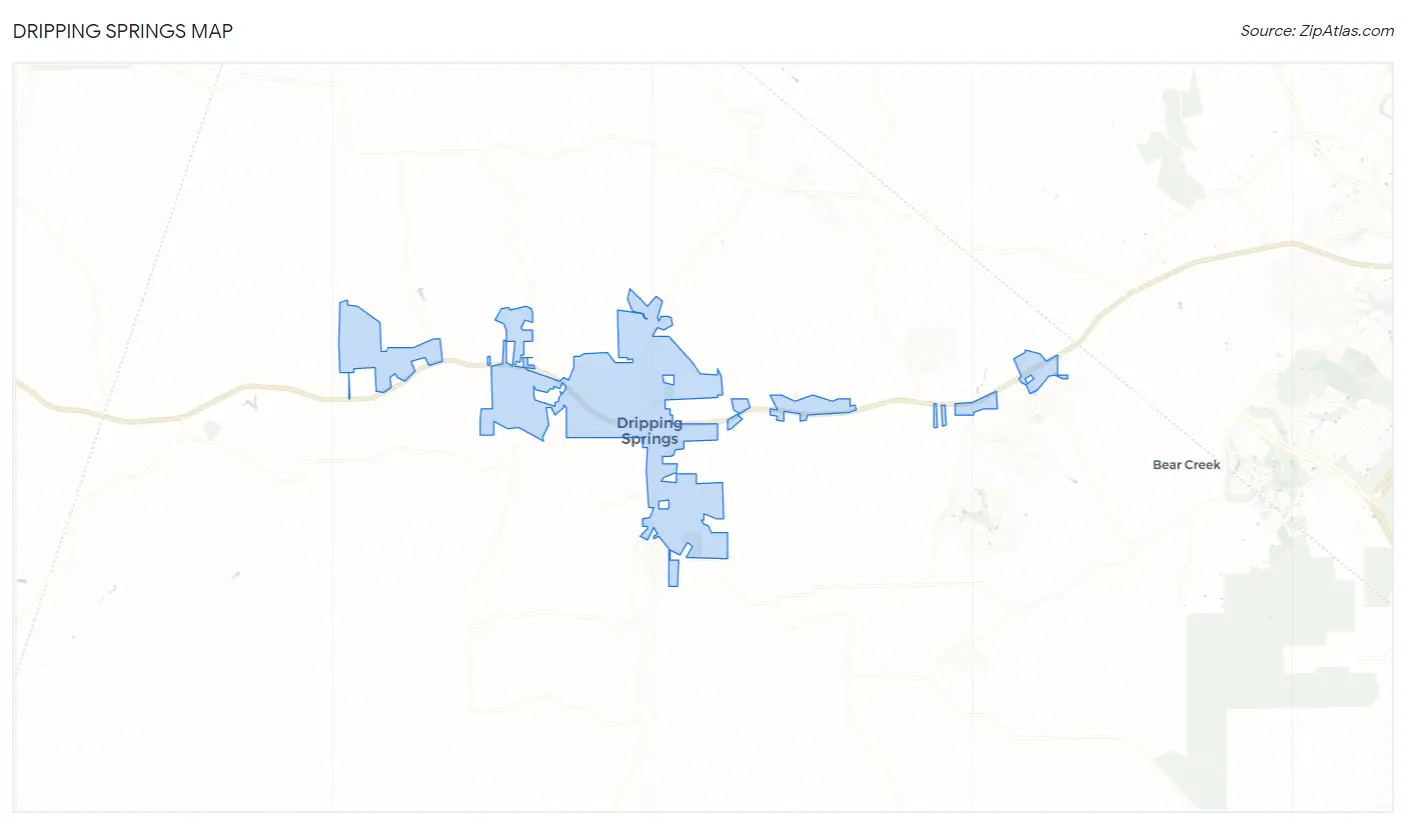
Dripping Springs Overview
$53,697
PER CAPITA INCOME
$121,985
AVG FAMILY INCOME
$104,141
AVG HOUSEHOLD INCOME
47.3%
WAGE / INCOME GAP [ % ]
52.7¢/ $1
WAGE / INCOME GAP [ $ ]
0.44
INEQUALITY / GINI INDEX
5,495
TOTAL POPULATION
2,817
MALE POPULATION
2,678
FEMALE POPULATION
105.19
MALES / 100 FEMALES
95.07
FEMALES / 100 MALES
36.6
MEDIAN AGE
3.2
AVG FAMILY SIZE
2.6
AVG HOUSEHOLD SIZE
2,547
LABOR FORCE [ PEOPLE ]
64.4%
PERCENT IN LABOR FORCE
3.3%
UNEMPLOYMENT RATE
Dripping Springs Zip Codes
Dripping Springs Area Codes
Income in Dripping Springs
Income Overview in Dripping Springs
Per Capita Income in Dripping Springs is $53,697, while median incomes of families and households are $121,985 and $104,141 respectively.
| Characteristic | Number | Measure |
| Per Capita Income | 5,495 | $53,697 |
| Median Family Income | 1,465 | $121,985 |
| Mean Family Income | 1,465 | $170,466 |
| Median Household Income | 2,044 | $104,141 |
| Mean Household Income | 2,044 | $144,835 |
| Income Deficit | 1,465 | $0 |
| Wage / Income Gap (%) | 5,495 | 47.31% |
| Wage / Income Gap ($) | 5,495 | 52.69¢ per $1 |
| Gini / Inequality Index | 5,495 | 0.44 |
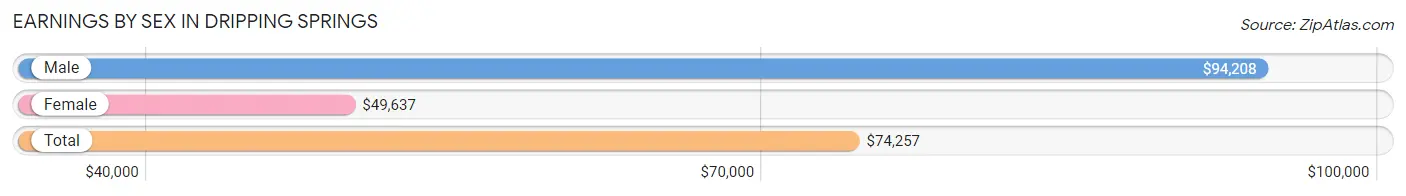
Earnings by Sex in Dripping Springs
Average Earnings in Dripping Springs are $74,257, $94,208 for men and $49,637 for women, a difference of 47.3%.
| Sex | Number | Average Earnings |
| Male | 1,643 (62.0%) | $94,208 |
| Female | 1,007 (38.0%) | $49,637 |
| Total | 2,650 (100.0%) | $74,257 |
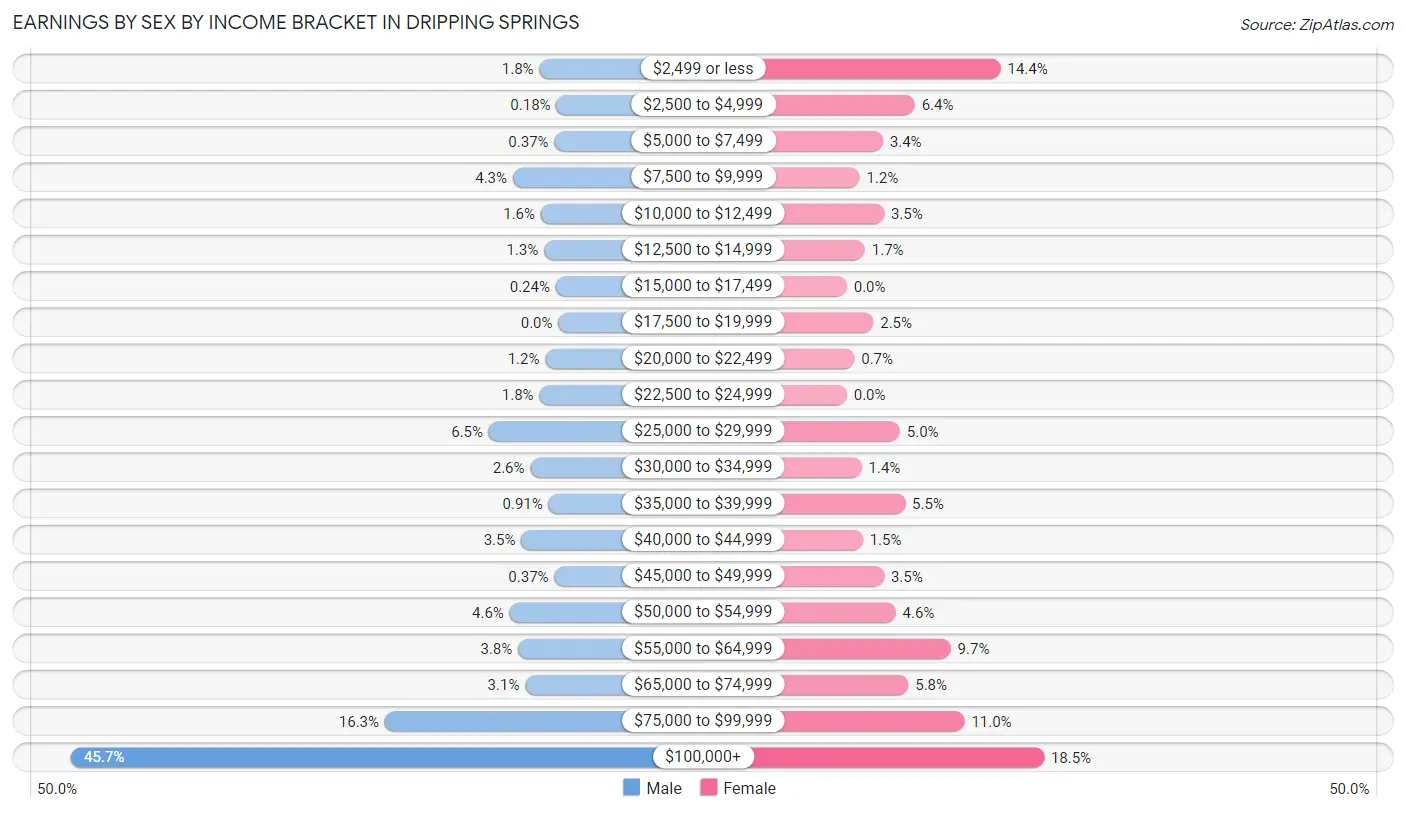
Earnings by Sex by Income Bracket in Dripping Springs
The most common earnings brackets in Dripping Springs are $100,000+ for men (750 | 45.7%) and $100,000+ for women (186 | 18.5%).
| Income | Male | Female |
| $2,499 or less | 29 (1.8%) | 145 (14.4%) |
| $2,500 to $4,999 | 3 (0.2%) | 64 (6.4%) |
| $5,000 to $7,499 | 6 (0.4%) | 34 (3.4%) |
| $7,500 to $9,999 | 70 (4.3%) | 12 (1.2%) |
| $10,000 to $12,499 | 27 (1.6%) | 35 (3.5%) |
| $12,500 to $14,999 | 22 (1.3%) | 17 (1.7%) |
| $15,000 to $17,499 | 4 (0.2%) | 0 (0.0%) |
| $17,500 to $19,999 | 0 (0.0%) | 25 (2.5%) |
| $20,000 to $22,499 | 20 (1.2%) | 7 (0.7%) |
| $22,500 to $24,999 | 29 (1.8%) | 0 (0.0%) |
| $25,000 to $29,999 | 107 (6.5%) | 50 (5.0%) |
| $30,000 to $34,999 | 43 (2.6%) | 14 (1.4%) |
| $35,000 to $39,999 | 15 (0.9%) | 55 (5.5%) |
| $40,000 to $44,999 | 57 (3.5%) | 15 (1.5%) |
| $45,000 to $49,999 | 6 (0.4%) | 35 (3.5%) |
| $50,000 to $54,999 | 75 (4.6%) | 46 (4.6%) |
| $55,000 to $64,999 | 62 (3.8%) | 98 (9.7%) |
| $65,000 to $74,999 | 51 (3.1%) | 58 (5.8%) |
| $75,000 to $99,999 | 267 (16.3%) | 111 (11.0%) |
| $100,000+ | 750 (45.7%) | 186 (18.5%) |
| Total | 1,643 (100.0%) | 1,007 (100.0%) |
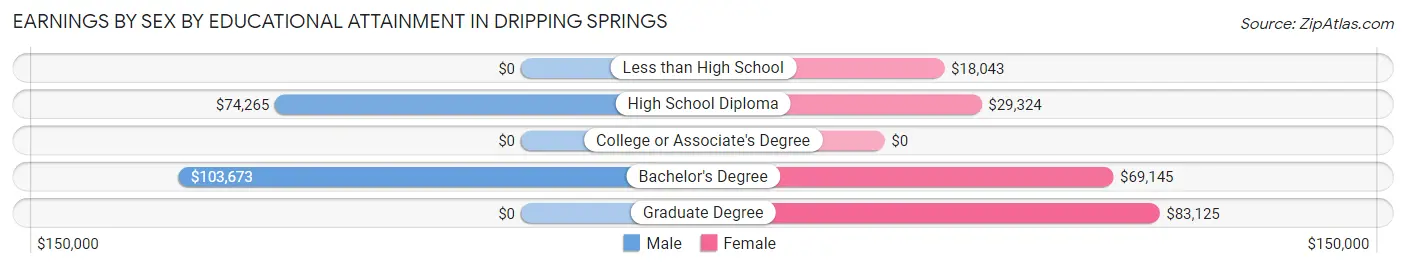
Earnings by Sex by Educational Attainment in Dripping Springs
Average earnings in Dripping Springs are $102,737 for men and $54,663 for women, a difference of 46.8%. Men with an educational attainment of bachelor's degree enjoy the highest average annual earnings of $103,673, while those with high school diploma education earn the least with $74,265. Women with an educational attainment of graduate degree earn the most with the average annual earnings of $83,125, while those with less than high school education have the smallest earnings of $18,043.
| Educational Attainment | Male Income | Female Income |
| Less than High School | - | - |
| High School Diploma | $74,265 | $29,324 |
| College or Associate's Degree | - | - |
| Bachelor's Degree | $103,673 | $69,145 |
| Graduate Degree | - | - |
| Total | $102,737 | $54,663 |
Family Income in Dripping Springs
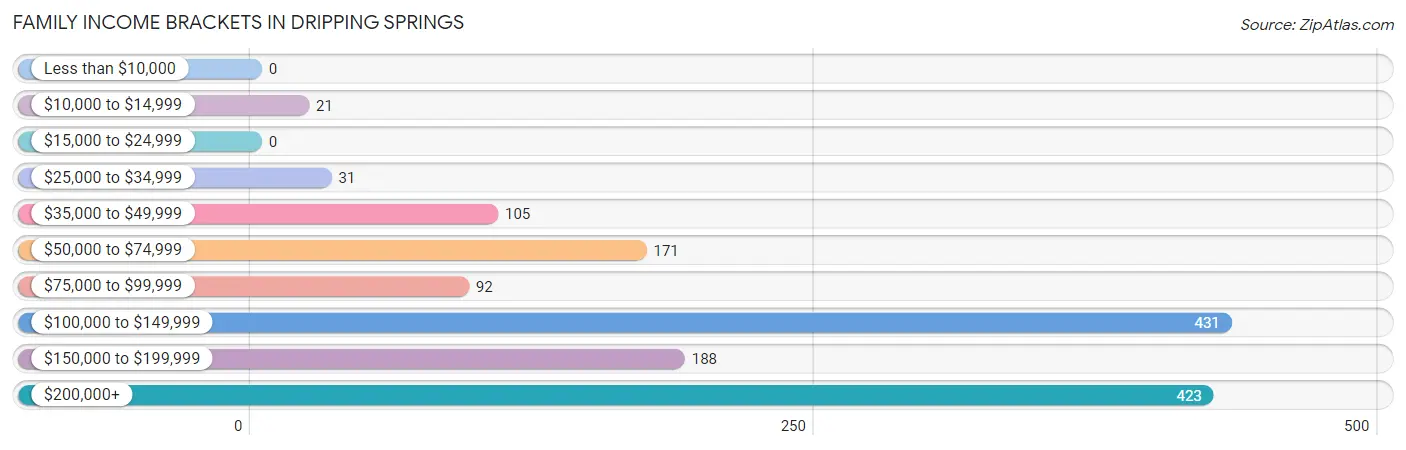
Family Income Brackets in Dripping Springs
According to the Dripping Springs family income data, there are 431 families falling into the $100,000 to $149,999 income range, which is the most common income bracket and makes up 29.4% of all families.
| Income Bracket | # Families | % Families |
| Less than $10,000 | 0 | 0.0% |
| $10,000 to $14,999 | 21 | 1.4% |
| $15,000 to $24,999 | 0 | 0.0% |
| $25,000 to $34,999 | 31 | 2.1% |
| $35,000 to $49,999 | 105 | 7.2% |
| $50,000 to $74,999 | 171 | 11.7% |
| $75,000 to $99,999 | 92 | 6.3% |
| $100,000 to $149,999 | 431 | 29.4% |
| $150,000 to $199,999 | 188 | 12.8% |
| $200,000+ | 423 | 28.9% |
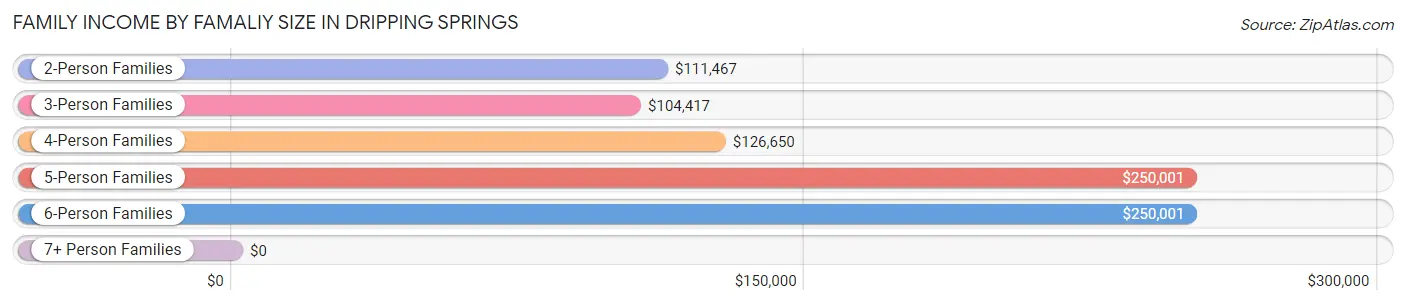
Family Income by Famaliy Size in Dripping Springs
5-person families (158 | 10.8%) account for the highest median family income in Dripping Springs with $250,001 per family, while 2-person families (515 | 35.1%) have the highest median income of $55,734 per family member.
| Income Bracket | # Families | Median Income |
| 2-Person Families | 515 (35.1%) | $111,467 |
| 3-Person Families | 479 (32.7%) | $104,417 |
| 4-Person Families | 263 (17.9%) | $126,650 |
| 5-Person Families | 158 (10.8%) | $250,001 |
| 6-Person Families | 50 (3.4%) | $250,001 |
| 7+ Person Families | 0 (0.0%) | $0 |
| Total | 1,465 (100.0%) | $121,985 |
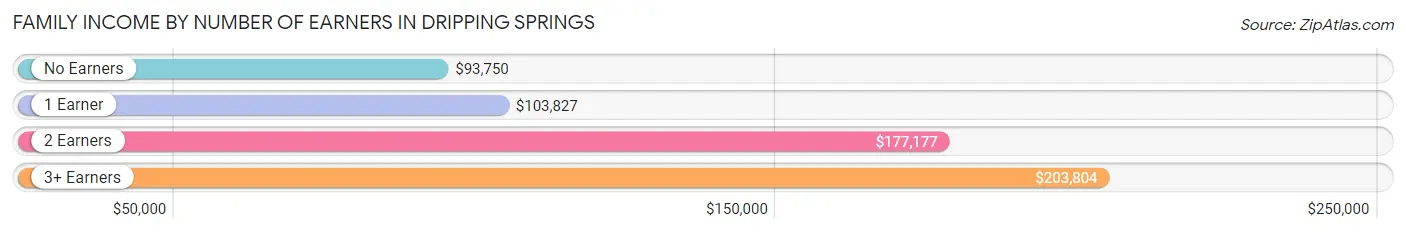
Family Income by Number of Earners in Dripping Springs
The median family income in Dripping Springs is $121,985, with families comprising 3+ earners (76) having the highest median family income of $203,804, while families with no earners (120) have the lowest median family income of $93,750, accounting for 5.2% and 8.2% of families, respectively.
| Number of Earners | # Families | Median Income |
| No Earners | 120 (8.2%) | $93,750 |
| 1 Earner | 659 (45.0%) | $103,827 |
| 2 Earners | 610 (41.6%) | $177,177 |
| 3+ Earners | 76 (5.2%) | $203,804 |
| Total | 1,465 (100.0%) | $121,985 |
Household Income in Dripping Springs
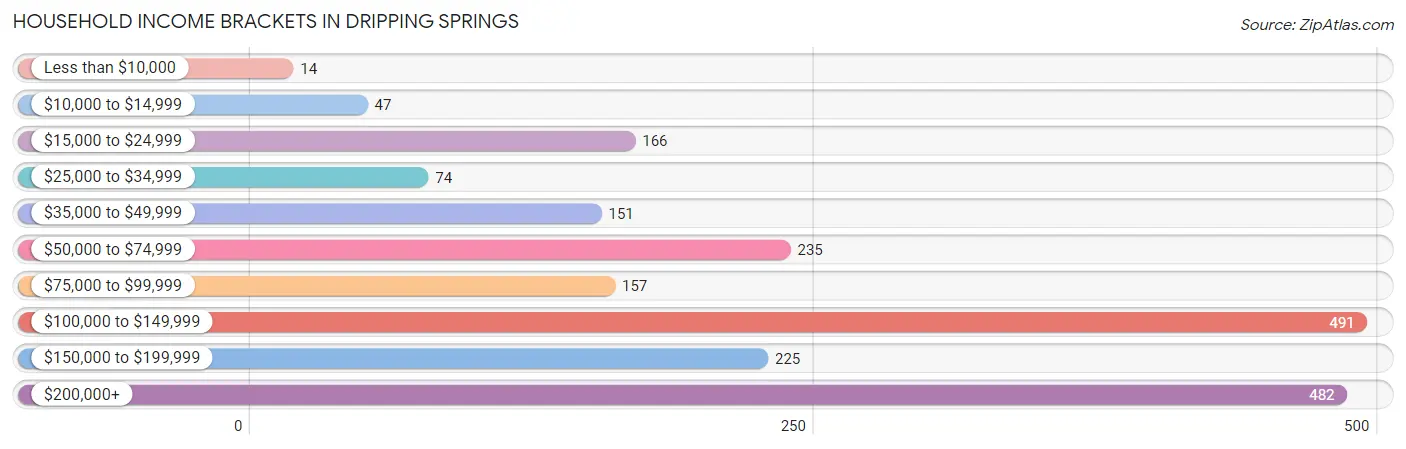
Household Income Brackets in Dripping Springs
With 491 households falling in the category, the $100,000 to $149,999 income range is the most frequent in Dripping Springs, accounting for 24.0% of all households. In contrast, only 14 households (0.7%) fall into the less than $10,000 income bracket, making it the least populous group.
| Income Bracket | # Households | % Households |
| Less than $10,000 | 14 | 0.7% |
| $10,000 to $14,999 | 47 | 2.3% |
| $15,000 to $24,999 | 166 | 8.1% |
| $25,000 to $34,999 | 74 | 3.6% |
| $35,000 to $49,999 | 151 | 7.4% |
| $50,000 to $74,999 | 235 | 11.5% |
| $75,000 to $99,999 | 157 | 7.7% |
| $100,000 to $149,999 | 491 | 24.0% |
| $150,000 to $199,999 | 225 | 11.0% |
| $200,000+ | 482 | 23.6% |
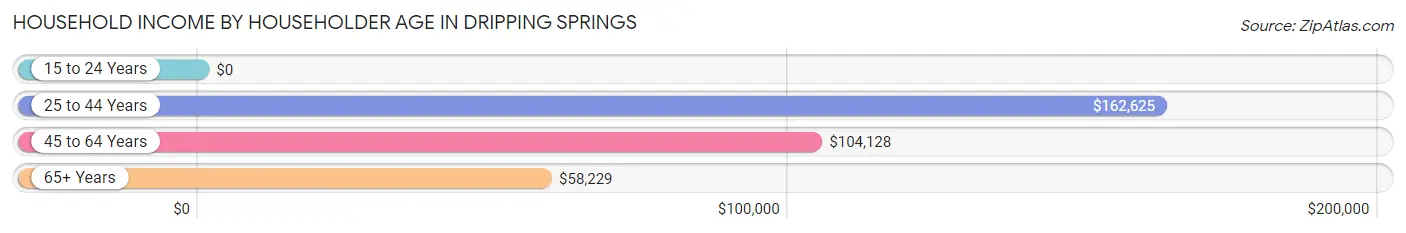
Household Income by Householder Age in Dripping Springs
The median household income in Dripping Springs is $104,141, with the highest median household income of $162,625 found in the 25 to 44 years age bracket for the primary householder. A total of 726 households (35.5%) fall into this category. Meanwhile, the 15 to 24 years age bracket for the primary householder has the lowest median household income of $0, with 79 households (3.9%) in this group.
| Income Bracket | # Households | Median Income |
| 15 to 24 Years | 79 (3.9%) | $0 |
| 25 to 44 Years | 726 (35.5%) | $162,625 |
| 45 to 64 Years | 654 (32.0%) | $104,128 |
| 65+ Years | 585 (28.6%) | $58,229 |
| Total | 2,044 (100.0%) | $104,141 |
Poverty in Dripping Springs
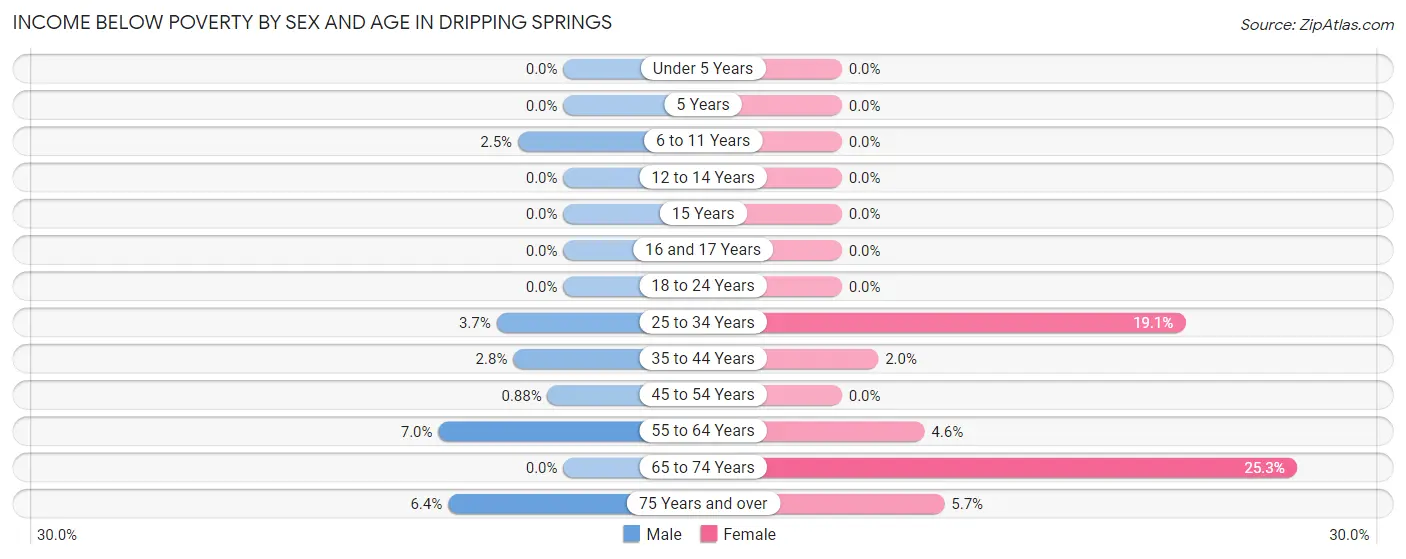
Income Below Poverty by Sex and Age in Dripping Springs
With 2.1% poverty level for males and 4.2% for females among the residents of Dripping Springs, 55 to 64 year old males and 65 to 74 year old females are the most vulnerable to poverty, with 8 males (7.0%) and 20 females (25.3%) in their respective age groups living below the poverty level.
| Age Bracket | Male | Female |
| Under 5 Years | 0 (0.0%) | 0 (0.0%) |
| 5 Years | 0 (0.0%) | 0 (0.0%) |
| 6 to 11 Years | 9 (2.5%) | 0 (0.0%) |
| 12 to 14 Years | 0 (0.0%) | 0 (0.0%) |
| 15 Years | 0 (0.0%) | 0 (0.0%) |
| 16 and 17 Years | 0 (0.0%) | 0 (0.0%) |
| 18 to 24 Years | 0 (0.0%) | 0 (0.0%) |
| 25 to 34 Years | 9 (3.7%) | 52 (19.1%) |
| 35 to 44 Years | 15 (2.8%) | 8 (2.0%) |
| 45 to 54 Years | 3 (0.9%) | 0 (0.0%) |
| 55 to 64 Years | 8 (7.0%) | 8 (4.6%) |
| 65 to 74 Years | 0 (0.0%) | 20 (25.3%) |
| 75 Years and over | 14 (6.4%) | 22 (5.7%) |
| Total | 58 (2.1%) | 110 (4.2%) |
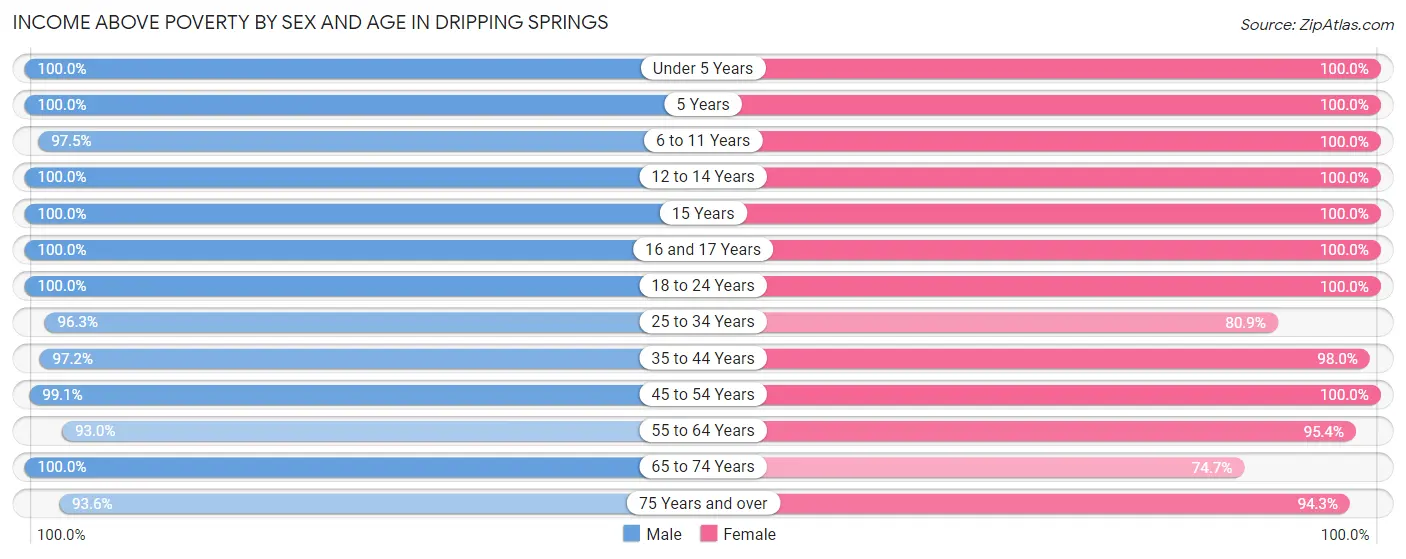
Income Above Poverty by Sex and Age in Dripping Springs
According to the poverty statistics in Dripping Springs, males aged under 5 years and females aged under 5 years are the age groups that are most secure financially, with 100.0% of males and 100.0% of females in these age groups living above the poverty line.
| Age Bracket | Male | Female |
| Under 5 Years | 109 (100.0%) | 204 (100.0%) |
| 5 Years | 44 (100.0%) | 58 (100.0%) |
| 6 to 11 Years | 347 (97.5%) | 319 (100.0%) |
| 12 to 14 Years | 195 (100.0%) | 203 (100.0%) |
| 15 Years | 38 (100.0%) | 5 (100.0%) |
| 16 and 17 Years | 93 (100.0%) | 90 (100.0%) |
| 18 to 24 Years | 302 (100.0%) | 139 (100.0%) |
| 25 to 34 Years | 233 (96.3%) | 220 (80.9%) |
| 35 to 44 Years | 522 (97.2%) | 387 (98.0%) |
| 45 to 54 Years | 338 (99.1%) | 304 (100.0%) |
| 55 to 64 Years | 107 (93.0%) | 166 (95.4%) |
| 65 to 74 Years | 214 (100.0%) | 59 (74.7%) |
| 75 Years and over | 204 (93.6%) | 363 (94.3%) |
| Total | 2,746 (97.9%) | 2,517 (95.8%) |
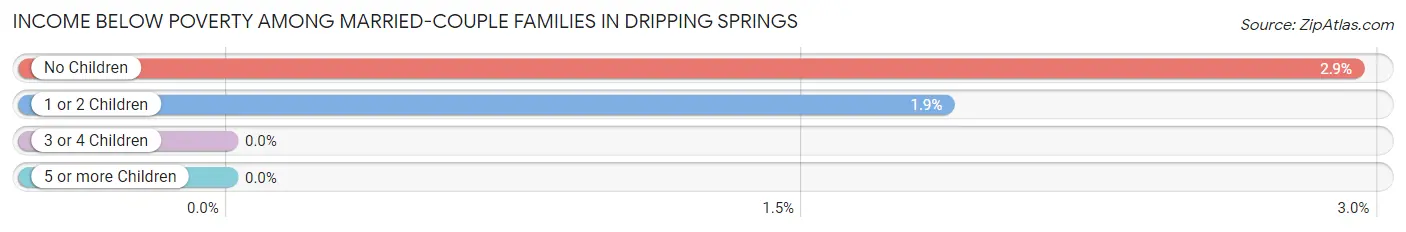
Income Below Poverty Among Married-Couple Families in Dripping Springs
The poverty statistics for married-couple families in Dripping Springs show that 2.1% or 21 of the total 984 families live below the poverty line. Families with no children have the highest poverty rate of 2.9%, comprising of 13 families. On the other hand, families with 3 or 4 children have the lowest poverty rate of 0.0%, which includes 0 families.
| Children | Above Poverty | Below Poverty |
| No Children | 429 (97.1%) | 13 (2.9%) |
| 1 or 2 Children | 419 (98.1%) | 8 (1.9%) |
| 3 or 4 Children | 115 (100.0%) | 0 (0.0%) |
| 5 or more Children | 0 (0.0%) | 0 (0.0%) |
| Total | 963 (97.9%) | 21 (2.1%) |
Income Below Poverty Among Single-Parent Households in Dripping Springs
| Children | Single Father | Single Mother |
| No Children | 0 (0.0%) | 0 (0.0%) |
| 1 or 2 Children | 0 (0.0%) | 0 (0.0%) |
| 3 or 4 Children | 0 (0.0%) | 0 (0.0%) |
| 5 or more Children | 0 (0.0%) | 0 (0.0%) |
| Total | 0 (0.0%) | 0 (0.0%) |
Income Below Poverty Among Married-Couple vs Single-Parent Households in Dripping Springs
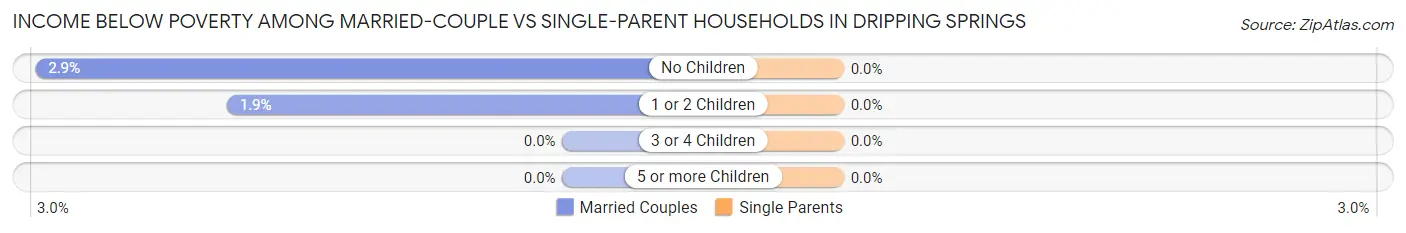
| Children | Married-Couple Families | Single-Parent Households |
| No Children | 13 (2.9%) | 0 (0.0%) |
| 1 or 2 Children | 8 (1.9%) | 0 (0.0%) |
| 3 or 4 Children | 0 (0.0%) | 0 (0.0%) |
| 5 or more Children | 0 (0.0%) | 0 (0.0%) |
| Total | 21 (2.1%) | 0 (0.0%) |
Race in Dripping Springs
The most populous races in Dripping Springs are White / Caucasian (4,837 | 88.0%), Hispanic or Latino (552 | 10.1%), and Two or more Races (273 | 5.0%).
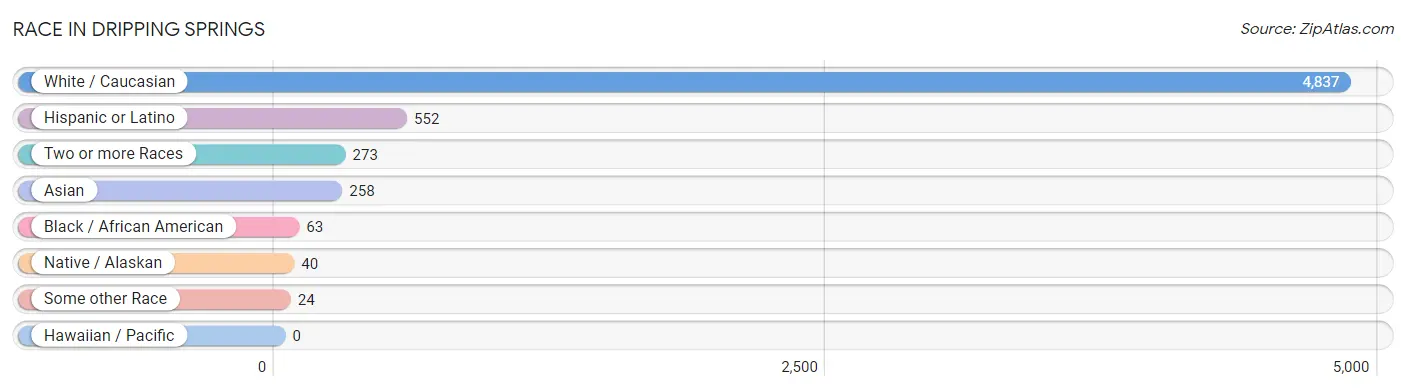
| Race | # Population | % Population |
| Asian | 258 | 4.7% |
| Black / African American | 63 | 1.1% |
| Hawaiian / Pacific | 0 | 0.0% |
| Hispanic or Latino | 552 | 10.1% |
| Native / Alaskan | 40 | 0.7% |
| White / Caucasian | 4,837 | 88.0% |
| Two or more Races | 273 | 5.0% |
| Some other Race | 24 | 0.4% |
| Total | 5,495 | 100.0% |
Ancestry in Dripping Springs
The most populous ancestries reported in Dripping Springs are English (769 | 14.0%), German (759 | 13.8%), Irish (426 | 7.7%), Mexican (402 | 7.3%), and American (388 | 7.1%), together accounting for 49.9% of all Dripping Springs residents.
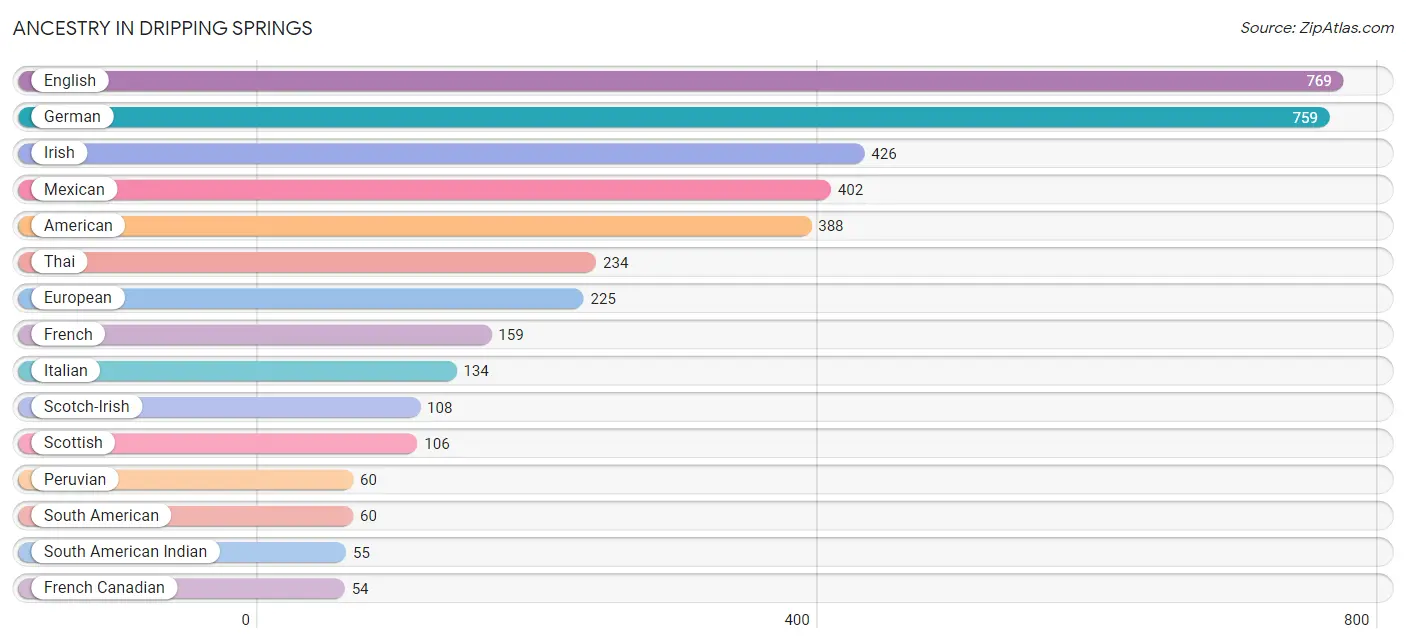
| Ancestry | # Population | % Population |
| American | 388 | 7.1% |
| Arab | 3 | 0.1% |
| Armenian | 21 | 0.4% |
| British | 48 | 0.9% |
| Burmese | 30 | 0.5% |
| Cajun | 18 | 0.3% |
| Canadian | 27 | 0.5% |
| Central American | 9 | 0.2% |
| Cuban | 48 | 0.9% |
| Czech | 17 | 0.3% |
| Dutch | 11 | 0.2% |
| English | 769 | 14.0% |
| European | 225 | 4.1% |
| French | 159 | 2.9% |
| French Canadian | 54 | 1.0% |
| German | 759 | 13.8% |
| Greek | 4 | 0.1% |
| Guatemalan | 9 | 0.2% |
| Indian (Asian) | 6 | 0.1% |
| Irish | 426 | 7.7% |
| Italian | 134 | 2.4% |
| Laotian | 24 | 0.4% |
| Mexican | 402 | 7.3% |
| Mexican American Indian | 11 | 0.2% |
| Nigerian | 16 | 0.3% |
| Norwegian | 36 | 0.7% |
| Peruvian | 60 | 1.1% |
| Polish | 51 | 0.9% |
| Portuguese | 40 | 0.7% |
| Puerto Rican | 24 | 0.4% |
| Russian | 32 | 0.6% |
| Scandinavian | 18 | 0.3% |
| Scotch-Irish | 108 | 2.0% |
| Scottish | 106 | 1.9% |
| Slovak | 10 | 0.2% |
| South African | 10 | 0.2% |
| South American | 60 | 1.1% |
| South American Indian | 55 | 1.0% |
| Sri Lankan | 7 | 0.1% |
| Subsaharan African | 26 | 0.5% |
| Swedish | 40 | 0.7% |
| Swiss | 33 | 0.6% |
| Syrian | 3 | 0.1% |
| Thai | 234 | 4.3% |
| Welsh | 28 | 0.5% | View All 45 Rows |
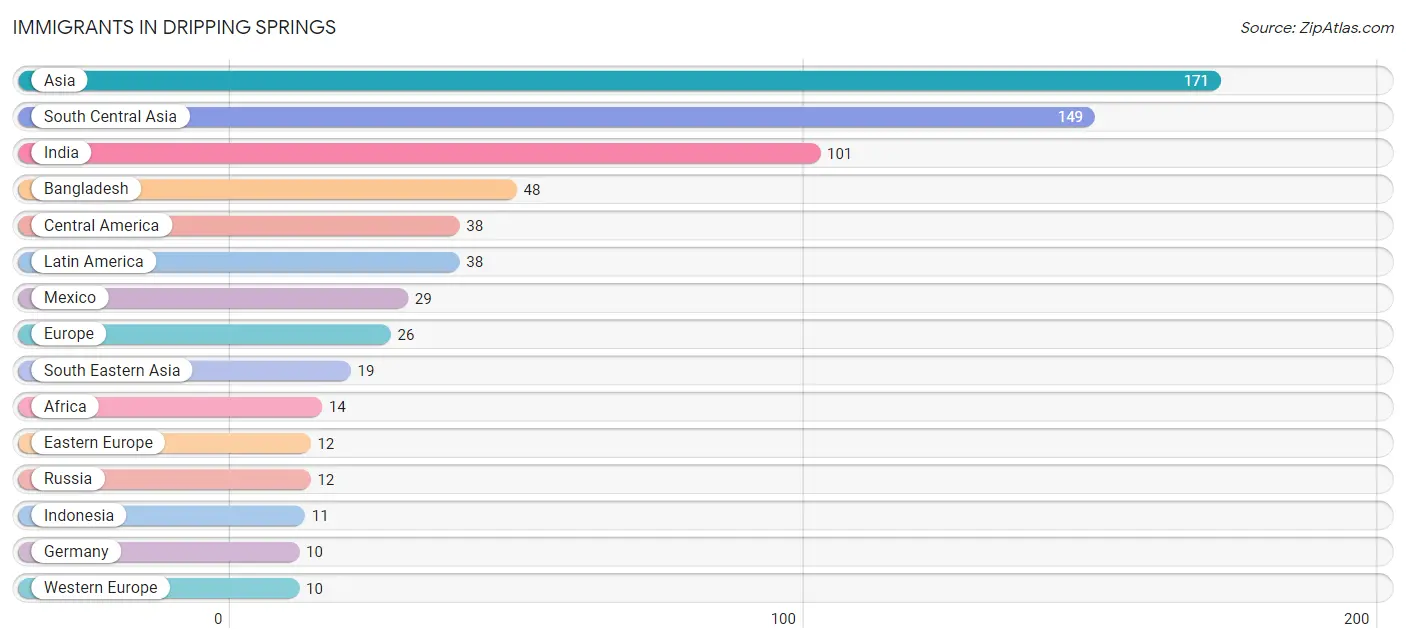
Immigrants in Dripping Springs
The most numerous immigrant groups reported in Dripping Springs came from Asia (171 | 3.1%), South Central Asia (149 | 2.7%), India (101 | 1.8%), Bangladesh (48 | 0.9%), and Central America (38 | 0.7%), together accounting for 9.2% of all Dripping Springs residents.
| Immigration Origin | # Population | % Population |
| Africa | 14 | 0.3% |
| Asia | 171 | 3.1% |
| Bangladesh | 48 | 0.9% |
| Canada | 8 | 0.2% |
| Central America | 38 | 0.7% |
| China | 3 | 0.1% |
| Eastern Asia | 3 | 0.1% |
| Eastern Europe | 12 | 0.2% |
| Europe | 26 | 0.5% |
| Germany | 10 | 0.2% |
| Guatemala | 9 | 0.2% |
| Hong Kong | 3 | 0.1% |
| India | 101 | 1.8% |
| Indonesia | 11 | 0.2% |
| Latin America | 38 | 0.7% |
| Mexico | 29 | 0.5% |
| Northern Europe | 4 | 0.1% |
| Philippines | 8 | 0.2% |
| Russia | 12 | 0.2% |
| South Africa | 4 | 0.1% |
| South Central Asia | 149 | 2.7% |
| South Eastern Asia | 19 | 0.4% |
| Western Europe | 10 | 0.2% | View All 23 Rows |
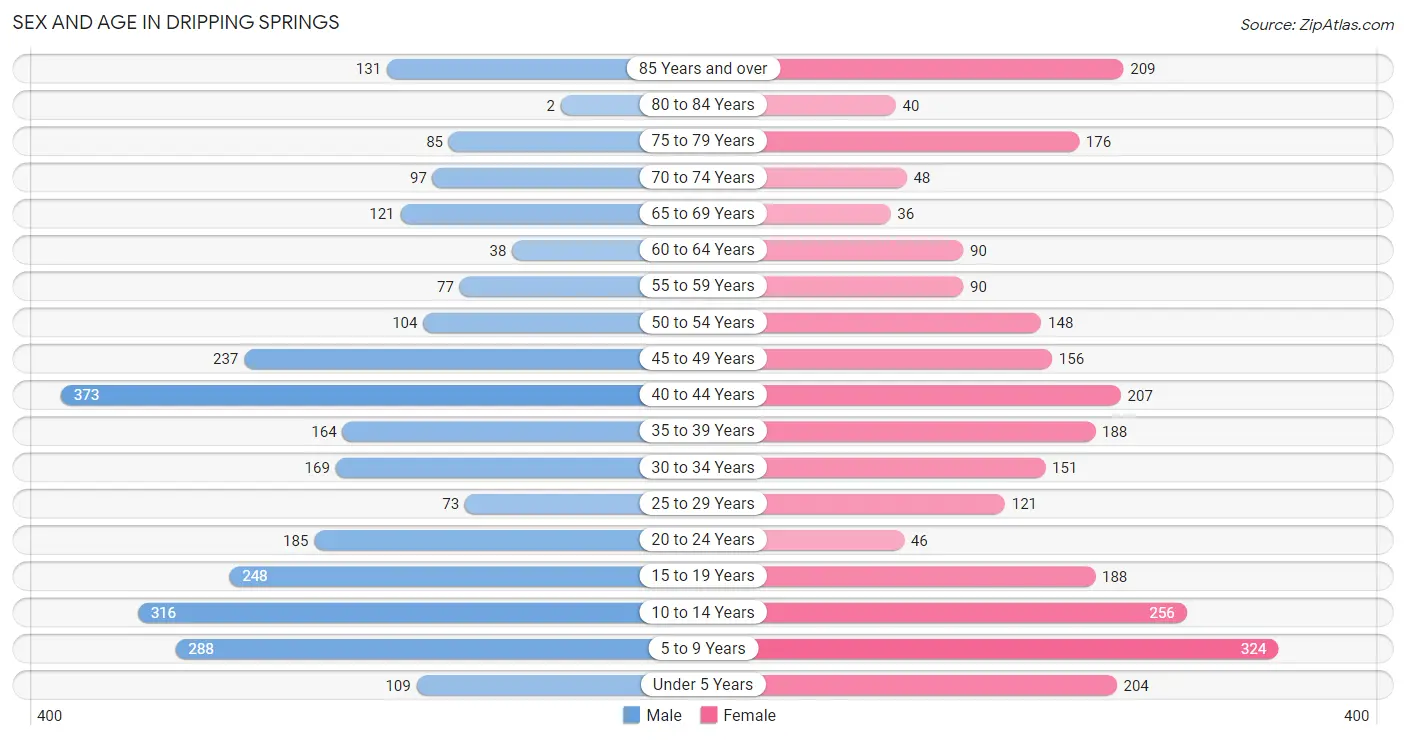
Sex and Age in Dripping Springs
Sex and Age in Dripping Springs
The most populous age groups in Dripping Springs are 40 to 44 Years (373 | 13.2%) for men and 5 to 9 Years (324 | 12.1%) for women.
| Age Bracket | Male | Female |
| Under 5 Years | 109 (3.9%) | 204 (7.6%) |
| 5 to 9 Years | 288 (10.2%) | 324 (12.1%) |
| 10 to 14 Years | 316 (11.2%) | 256 (9.6%) |
| 15 to 19 Years | 248 (8.8%) | 188 (7.0%) |
| 20 to 24 Years | 185 (6.6%) | 46 (1.7%) |
| 25 to 29 Years | 73 (2.6%) | 121 (4.5%) |
| 30 to 34 Years | 169 (6.0%) | 151 (5.6%) |
| 35 to 39 Years | 164 (5.8%) | 188 (7.0%) |
| 40 to 44 Years | 373 (13.2%) | 207 (7.7%) |
| 45 to 49 Years | 237 (8.4%) | 156 (5.8%) |
| 50 to 54 Years | 104 (3.7%) | 148 (5.5%) |
| 55 to 59 Years | 77 (2.7%) | 90 (3.4%) |
| 60 to 64 Years | 38 (1.3%) | 90 (3.4%) |
| 65 to 69 Years | 121 (4.3%) | 36 (1.3%) |
| 70 to 74 Years | 97 (3.4%) | 48 (1.8%) |
| 75 to 79 Years | 85 (3.0%) | 176 (6.6%) |
| 80 to 84 Years | 2 (0.1%) | 40 (1.5%) |
| 85 Years and over | 131 (4.6%) | 209 (7.8%) |
| Total | 2,817 (100.0%) | 2,678 (100.0%) |
Families and Households in Dripping Springs
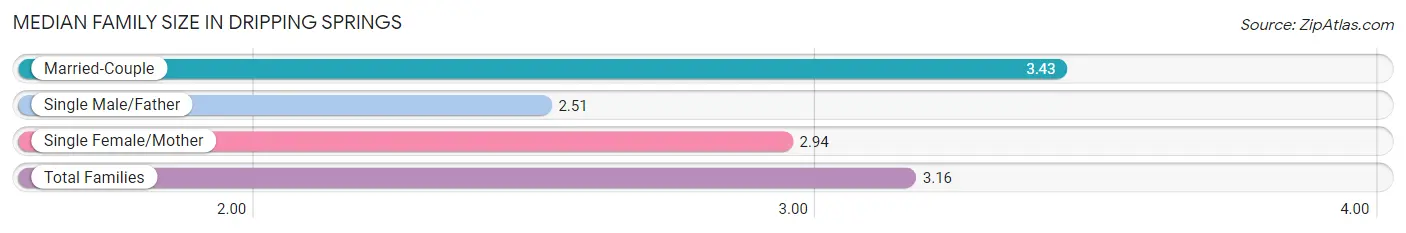
Median Family Size in Dripping Springs
The median family size in Dripping Springs is 3.16 persons per family, with married-couple families (984 | 67.2%) accounting for the largest median family size of 3.43 persons per family. On the other hand, single male/father families (362 | 24.7%) represent the smallest median family size with 2.51 persons per family.
| Family Type | # Families | Family Size |
| Married-Couple | 984 (67.2%) | 3.43 |
| Single Male/Father | 362 (24.7%) | 2.51 |
| Single Female/Mother | 119 (8.1%) | 2.94 |
| Total Families | 1,465 (100.0%) | 3.16 |
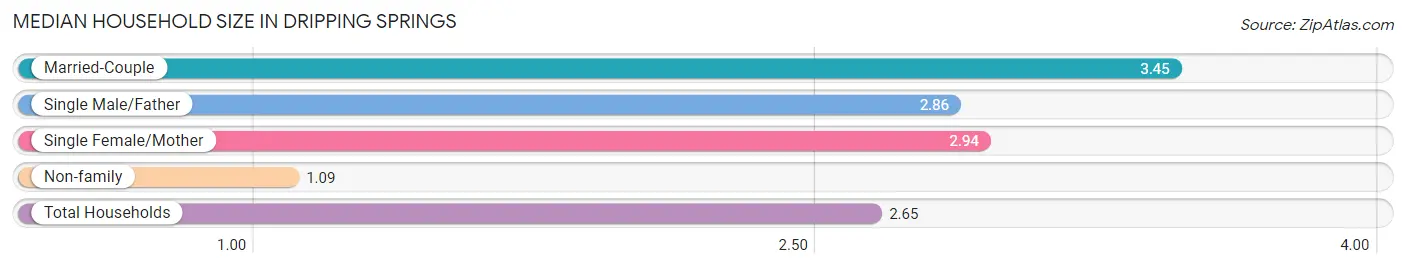
Median Household Size in Dripping Springs
The median household size in Dripping Springs is 2.65 persons per household, with married-couple households (984 | 48.1%) accounting for the largest median household size of 3.45 persons per household. non-family households (579 | 28.3%) represent the smallest median household size with 1.09 persons per household.
| Household Type | # Households | Household Size |
| Married-Couple | 984 (48.1%) | 3.45 |
| Single Male/Father | 362 (17.7%) | 2.86 |
| Single Female/Mother | 119 (5.8%) | 2.94 |
| Non-family | 579 (28.3%) | 1.09 |
| Total Households | 2,044 (100.0%) | 2.65 |
Household Size by Marriage Status in Dripping Springs
Out of a total of 2,044 households in Dripping Springs, 1,465 (71.7%) are family households, while 579 (28.3%) are nonfamily households. The most numerous type of family households are 3-person households, comprising 528, and the most common type of nonfamily households are 1-person households, comprising 536.
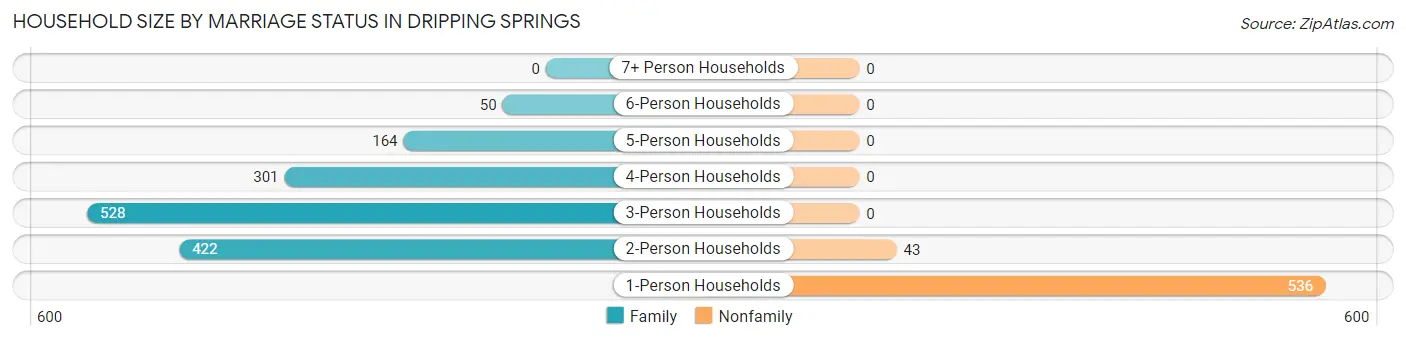
| Household Size | Family Households | Nonfamily Households |
| 1-Person Households | - | 536 (26.2%) |
| 2-Person Households | 422 (20.6%) | 43 (2.1%) |
| 3-Person Households | 528 (25.8%) | 0 (0.0%) |
| 4-Person Households | 301 (14.7%) | 0 (0.0%) |
| 5-Person Households | 164 (8.0%) | 0 (0.0%) |
| 6-Person Households | 50 (2.5%) | 0 (0.0%) |
| 7+ Person Households | 0 (0.0%) | 0 (0.0%) |
| Total | 1,465 (71.7%) | 579 (28.3%) |
Female Fertility in Dripping Springs
Fertility by Age in Dripping Springs
Average fertility rate in Dripping Springs is 102.0 births per 1,000 women. Women in the age bracket of 20 to 34 years have the highest fertility rate with 280.0 births per 1,000 women. Women in the age bracket of 20 to 34 years acount for 78.8% of all women with births.
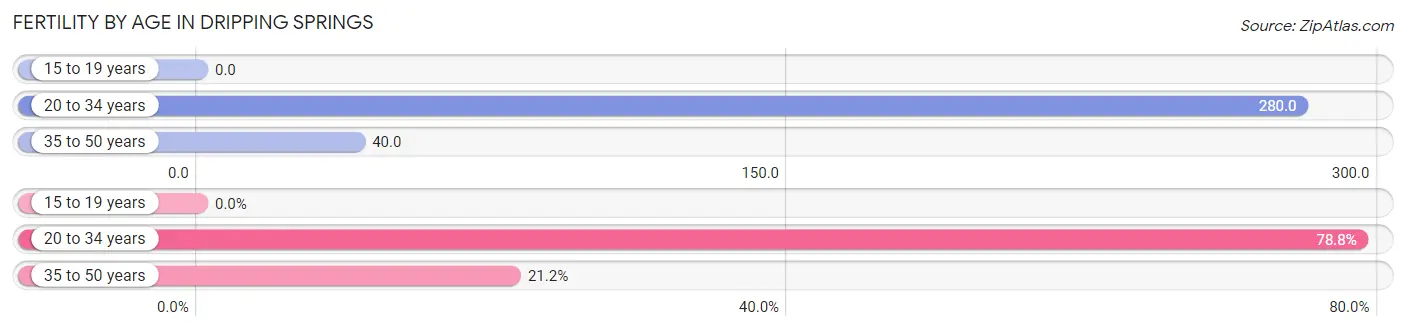
| Age Bracket | Women with Births | Births / 1,000 Women |
| 15 to 19 years | 0 (0.0%) | 0.0 |
| 20 to 34 years | 89 (78.8%) | 280.0 |
| 35 to 50 years | 24 (21.2%) | 40.0 |
| Total | 113 (100.0%) | 102.0 |
Fertility by Age by Marriage Status in Dripping Springs
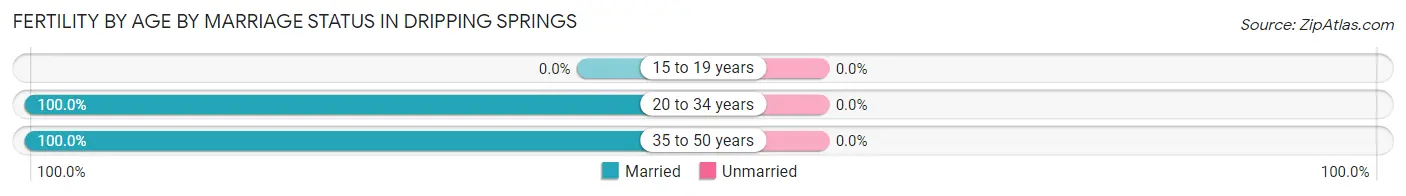
| Age Bracket | Married | Unmarried |
| 15 to 19 years | 0 (0.0%) | 0 (0.0%) |
| 20 to 34 years | 89 (100.0%) | 0 (0.0%) |
| 35 to 50 years | 24 (100.0%) | 0 (0.0%) |
| Total | 113 (100.0%) | 0 (0.0%) |
Fertility by Education in Dripping Springs
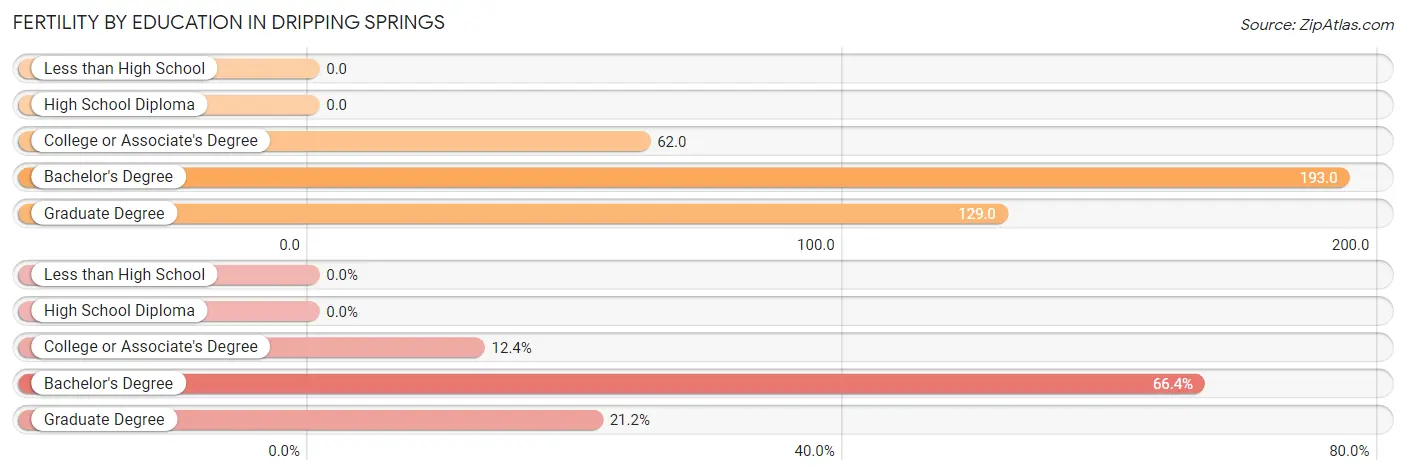
| Educational Attainment | Women with Births | Births / 1,000 Women |
| Less than High School | 0 (0.0%) | 0.0 |
| High School Diploma | 0 (0.0%) | 0.0 |
| College or Associate's Degree | 14 (12.4%) | 62.0 |
| Bachelor's Degree | 75 (66.4%) | 193.0 |
| Graduate Degree | 24 (21.2%) | 129.0 |
| Total | 113 (100.0%) | 102.0 |
Fertility by Education by Marriage Status in Dripping Springs
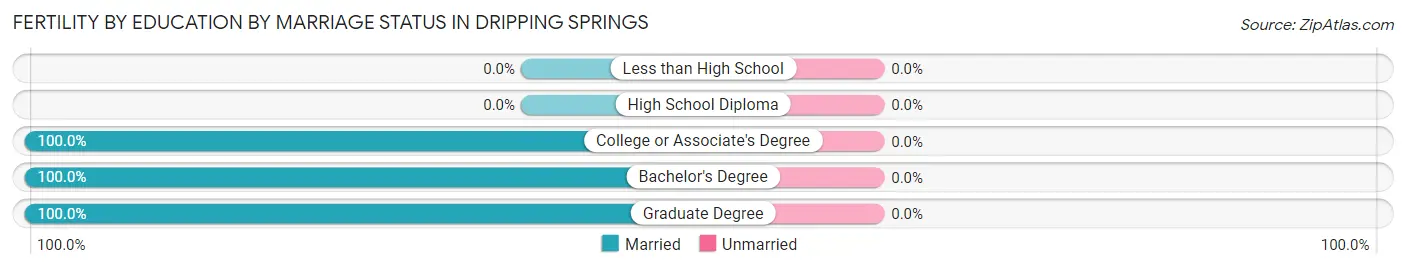
| Educational Attainment | Married | Unmarried |
| Less than High School | 0 (0.0%) | 0 (0.0%) |
| High School Diploma | 0 (0.0%) | 0 (0.0%) |
| College or Associate's Degree | 14 (100.0%) | 0 (0.0%) |
| Bachelor's Degree | 75 (100.0%) | 0 (0.0%) |
| Graduate Degree | 24 (100.0%) | 0 (0.0%) |
| Total | 113 (100.0%) | 0 (0.0%) |
Employment Characteristics in Dripping Springs
Employment by Class of Employer in Dripping Springs
Among the 2,452 employed individuals in Dripping Springs, private company employees (1,678 | 68.4%), local government employees (249 | 10.2%), and self-employed (not incorporated) (189 | 7.7%) make up the most common classes of employment.
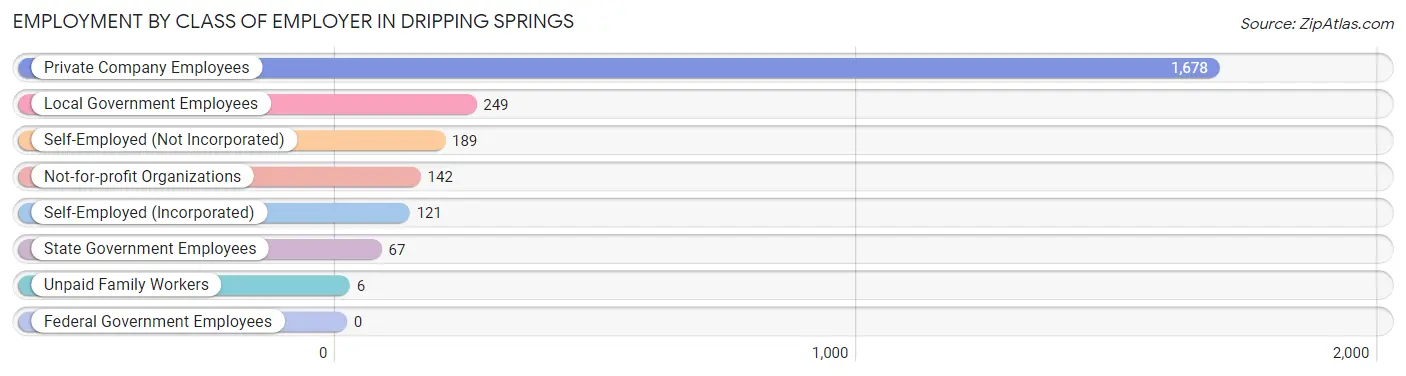
| Employer Class | # Employees | % Employees |
| Private Company Employees | 1,678 | 68.4% |
| Self-Employed (Incorporated) | 121 | 4.9% |
| Self-Employed (Not Incorporated) | 189 | 7.7% |
| Not-for-profit Organizations | 142 | 5.8% |
| Local Government Employees | 249 | 10.2% |
| State Government Employees | 67 | 2.7% |
| Federal Government Employees | 0 | 0.0% |
| Unpaid Family Workers | 6 | 0.2% |
| Total | 2,452 | 100.0% |
Employment Status by Age in Dripping Springs
According to the labor force statistics for Dripping Springs, out of the total population over 16 years of age (3,955), 64.4% or 2,547 individuals are in the labor force, with 3.3% or 84 of them unemployed. The age group with the highest labor force participation rate is 25 to 29 years, with 100.0% or 194 individuals in the labor force. Within the labor force, the 30 to 34 years age range has the highest percentage of unemployed individuals, with 17.9% or 52 of them being unemployed.
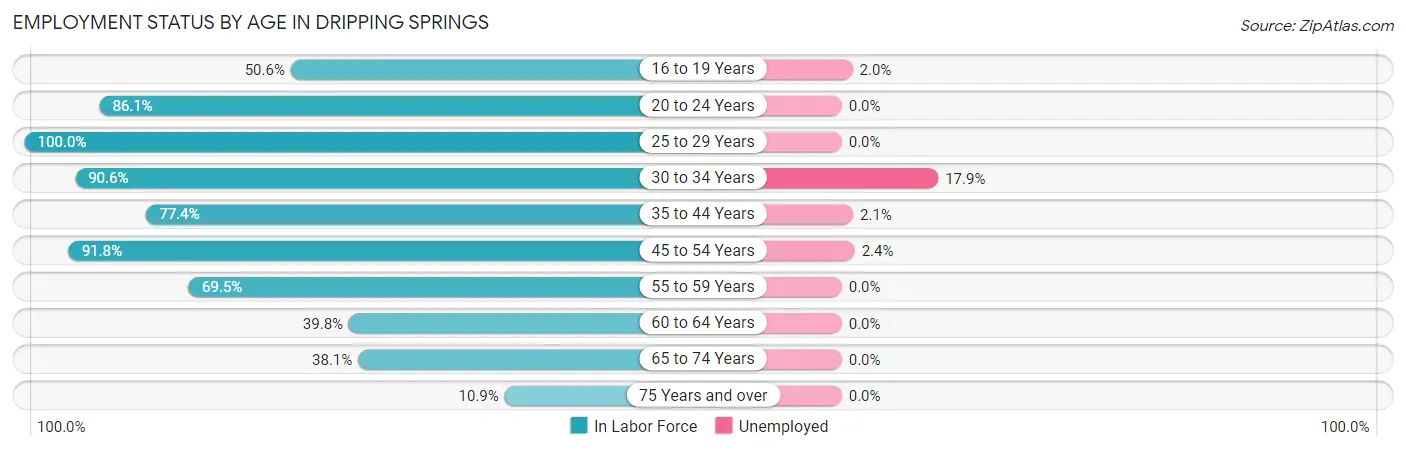
| Age Bracket | In Labor Force | Unemployed |
| 16 to 19 Years | 199 (50.6%) | 4 (2.0%) |
| 20 to 24 Years | 199 (86.1%) | 0 (0.0%) |
| 25 to 29 Years | 194 (100.0%) | 0 (0.0%) |
| 30 to 34 Years | 290 (90.6%) | 52 (17.9%) |
| 35 to 44 Years | 721 (77.4%) | 15 (2.1%) |
| 45 to 54 Years | 592 (91.8%) | 14 (2.4%) |
| 55 to 59 Years | 116 (69.5%) | 0 (0.0%) |
| 60 to 64 Years | 51 (39.8%) | 0 (0.0%) |
| 65 to 74 Years | 115 (38.1%) | 0 (0.0%) |
| 75 Years and over | 70 (10.9%) | 0 (0.0%) |
| Total | 2,547 (64.4%) | 84 (3.3%) |
Employment Status by Educational Attainment in Dripping Springs
According to labor force statistics for Dripping Springs, 82.3% of individuals (1,964) out of the total population between 25 and 64 years of age (2,386) are in the labor force, with 4.1% or 81 of them being unemployed. The group with the highest labor force participation rate are those with the educational attainment of college / associate degree, with 89.8% or 492 individuals in the labor force. Within the labor force, individuals with college / associate degree education have the highest percentage of unemployment, with 13.6% or 67 of them being unemployed.
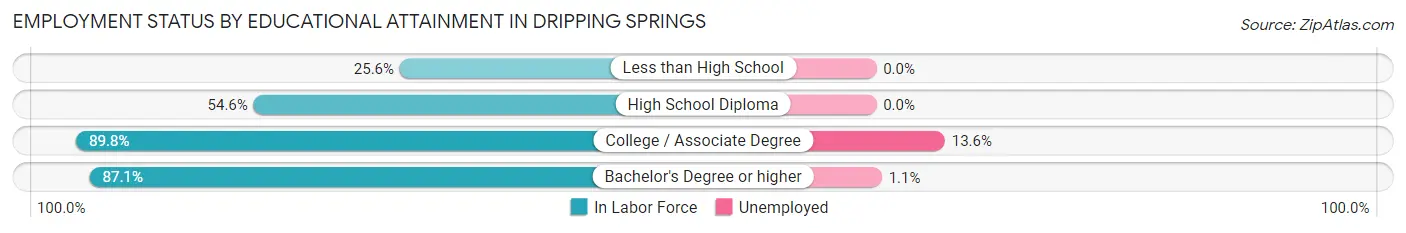
| Educational Attainment | In Labor Force | Unemployed |
| Less than High School | 23 (25.6%) | 0 (0.0%) |
| High School Diploma | 124 (54.6%) | 0 (0.0%) |
| College / Associate Degree | 492 (89.8%) | 75 (13.6%) |
| Bachelor's Degree or higher | 1,325 (87.1%) | 17 (1.1%) |
| Total | 1,964 (82.3%) | 98 (4.1%) |
Employment Occupations by Sex in Dripping Springs
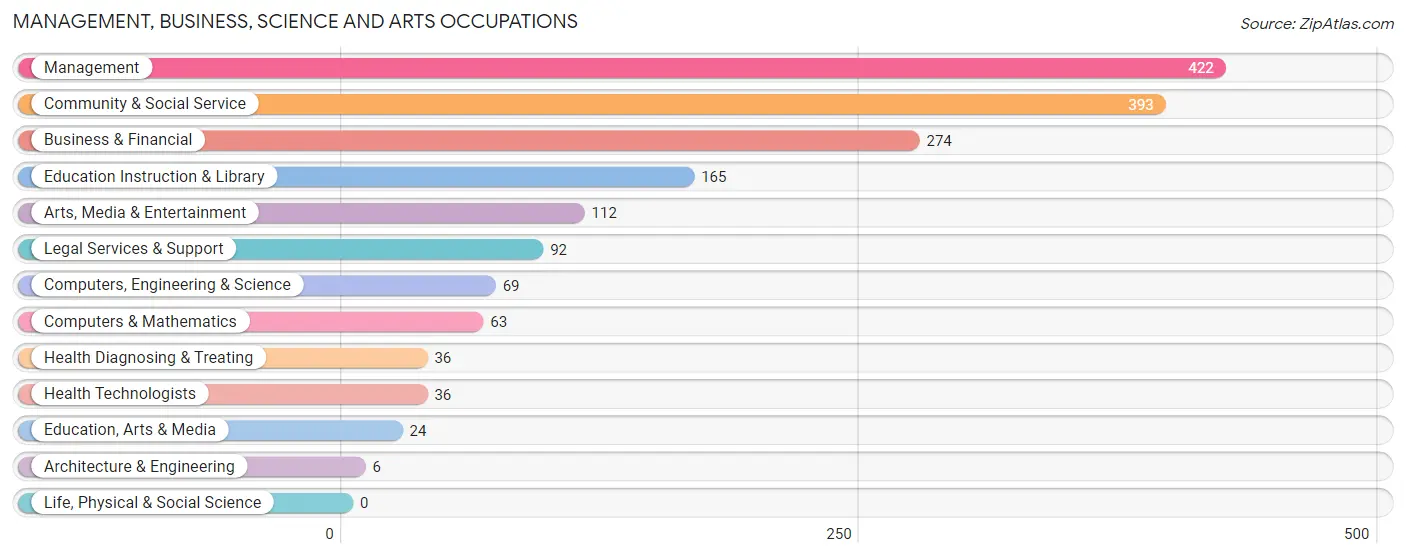
Management, Business, Science and Arts Occupations
The most common Management, Business, Science and Arts occupations in Dripping Springs are Management (422 | 17.1%), Community & Social Service (393 | 16.0%), Business & Financial (274 | 11.1%), Education Instruction & Library (165 | 6.7%), and Arts, Media & Entertainment (112 | 4.5%).
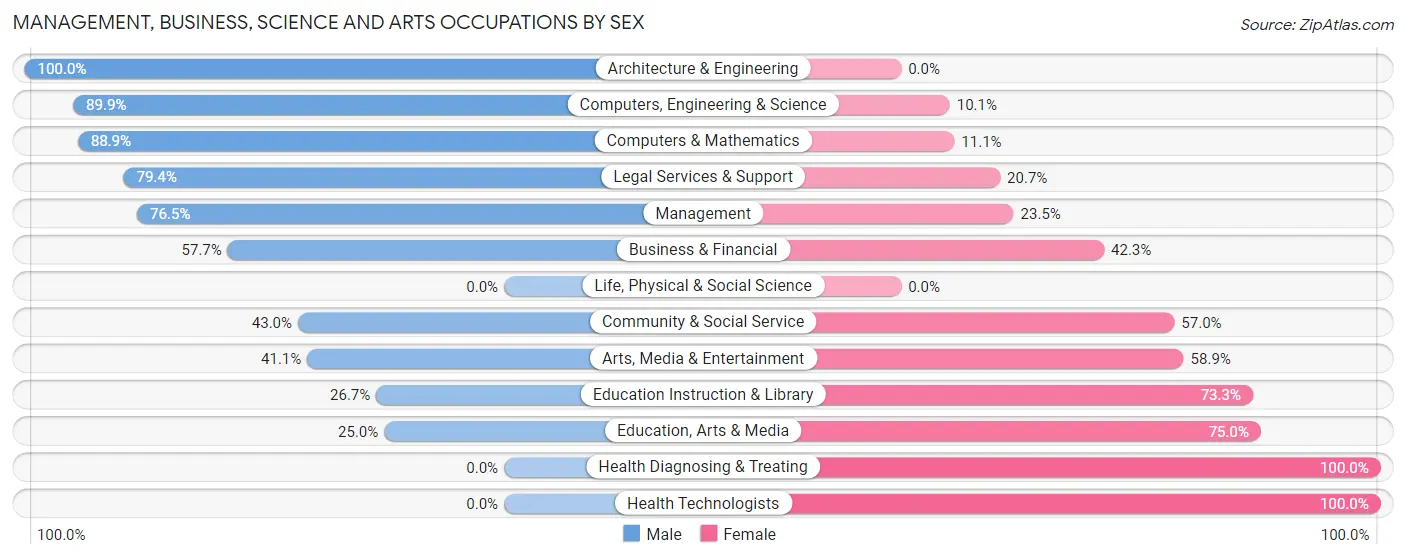
Management, Business, Science and Arts Occupations by Sex
Within the Management, Business, Science and Arts occupations in Dripping Springs, the most male-oriented occupations are Architecture & Engineering (100.0%), Computers, Engineering & Science (89.9%), and Computers & Mathematics (88.9%), while the most female-oriented occupations are Health Diagnosing & Treating (100.0%), Health Technologists (100.0%), and Education, Arts & Media (75.0%).
| Occupation | Male | Female |
| Management | 323 (76.5%) | 99 (23.5%) |
| Business & Financial | 158 (57.7%) | 116 (42.3%) |
| Computers, Engineering & Science | 62 (89.9%) | 7 (10.1%) |
| Computers & Mathematics | 56 (88.9%) | 7 (11.1%) |
| Architecture & Engineering | 6 (100.0%) | 0 (0.0%) |
| Life, Physical & Social Science | 0 (0.0%) | 0 (0.0%) |
| Community & Social Service | 169 (43.0%) | 224 (57.0%) |
| Education, Arts & Media | 6 (25.0%) | 18 (75.0%) |
| Legal Services & Support | 73 (79.3%) | 19 (20.6%) |
| Education Instruction & Library | 44 (26.7%) | 121 (73.3%) |
| Arts, Media & Entertainment | 46 (41.1%) | 66 (58.9%) |
| Health Diagnosing & Treating | 0 (0.0%) | 36 (100.0%) |
| Health Technologists | 0 (0.0%) | 36 (100.0%) |
| Total (Category) | 712 (59.6%) | 482 (40.4%) |
| Total (Overall) | 1,586 (64.4%) | 876 (35.6%) |
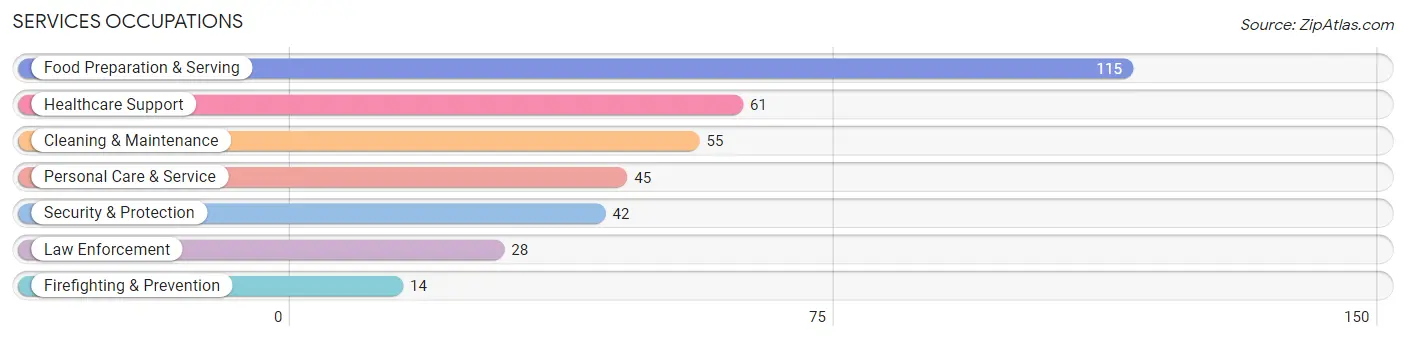
Services Occupations
The most common Services occupations in Dripping Springs are Food Preparation & Serving (115 | 4.7%), Healthcare Support (61 | 2.5%), Cleaning & Maintenance (55 | 2.2%), Personal Care & Service (45 | 1.8%), and Security & Protection (42 | 1.7%).
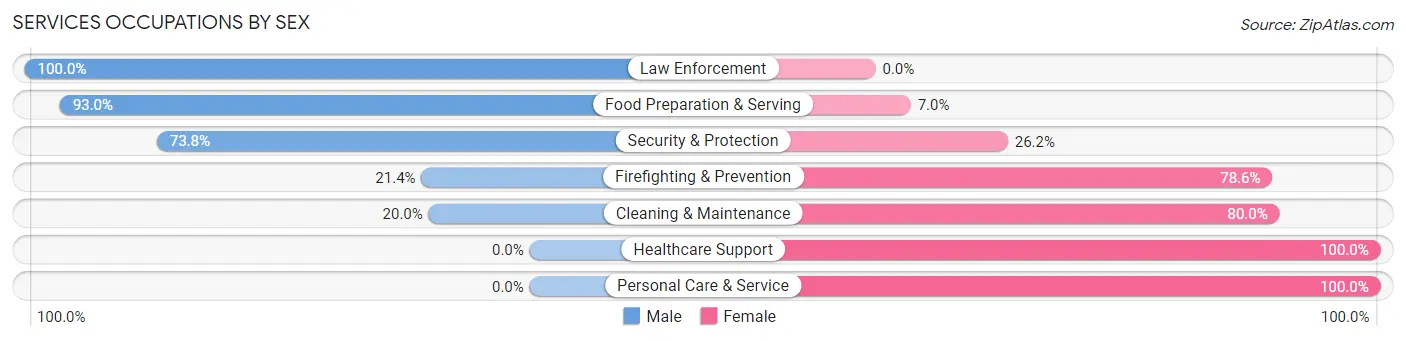
Services Occupations by Sex
Within the Services occupations in Dripping Springs, the most male-oriented occupations are Law Enforcement (100.0%), Food Preparation & Serving (93.0%), and Security & Protection (73.8%), while the most female-oriented occupations are Healthcare Support (100.0%), Personal Care & Service (100.0%), and Cleaning & Maintenance (80.0%).
| Occupation | Male | Female |
| Healthcare Support | 0 (0.0%) | 61 (100.0%) |
| Security & Protection | 31 (73.8%) | 11 (26.2%) |
| Firefighting & Prevention | 3 (21.4%) | 11 (78.6%) |
| Law Enforcement | 28 (100.0%) | 0 (0.0%) |
| Food Preparation & Serving | 107 (93.0%) | 8 (7.0%) |
| Cleaning & Maintenance | 11 (20.0%) | 44 (80.0%) |
| Personal Care & Service | 0 (0.0%) | 45 (100.0%) |
| Total (Category) | 149 (46.9%) | 169 (53.1%) |
| Total (Overall) | 1,586 (64.4%) | 876 (35.6%) |
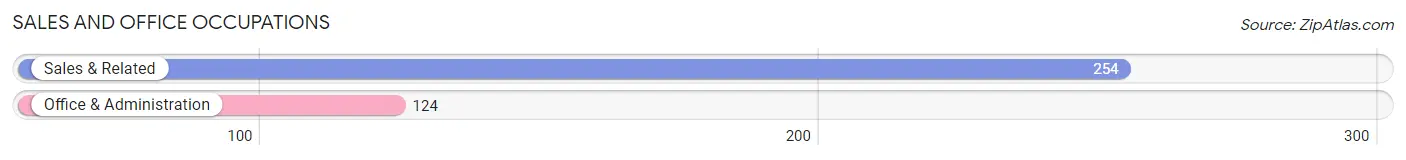
Sales and Office Occupations
The most common Sales and Office occupations in Dripping Springs are Sales & Related (254 | 10.3%), and Office & Administration (124 | 5.0%).
Sales and Office Occupations by Sex
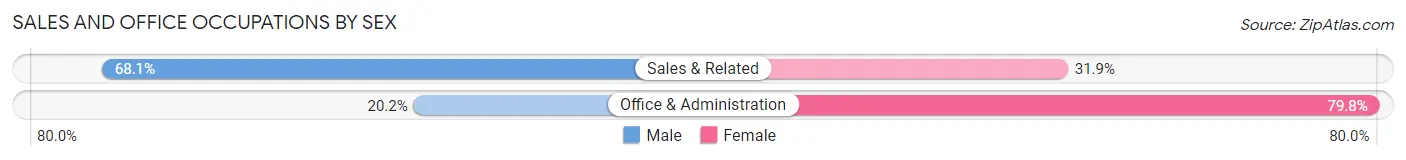
| Occupation | Male | Female |
| Sales & Related | 173 (68.1%) | 81 (31.9%) |
| Office & Administration | 25 (20.2%) | 99 (79.8%) |
| Total (Category) | 198 (52.4%) | 180 (47.6%) |
| Total (Overall) | 1,586 (64.4%) | 876 (35.6%) |
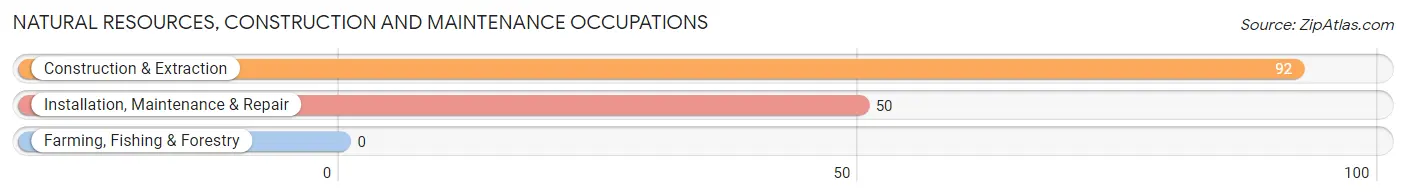
Natural Resources, Construction and Maintenance Occupations
The most common Natural Resources, Construction and Maintenance occupations in Dripping Springs are Construction & Extraction (92 | 3.7%), and Installation, Maintenance & Repair (50 | 2.0%).
Natural Resources, Construction and Maintenance Occupations by Sex
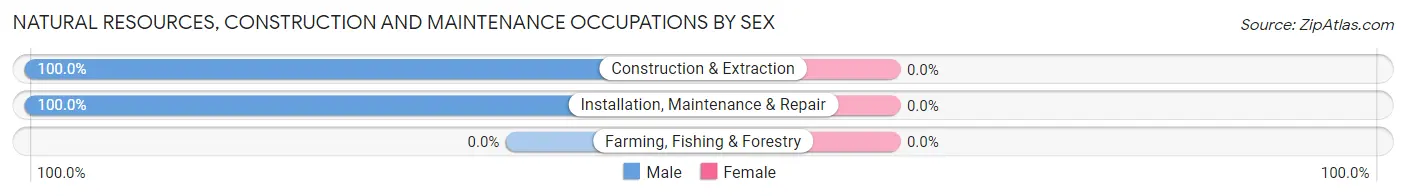
| Occupation | Male | Female |
| Farming, Fishing & Forestry | 0 (0.0%) | 0 (0.0%) |
| Construction & Extraction | 92 (100.0%) | 0 (0.0%) |
| Installation, Maintenance & Repair | 50 (100.0%) | 0 (0.0%) |
| Total (Category) | 142 (100.0%) | 0 (0.0%) |
| Total (Overall) | 1,586 (64.4%) | 876 (35.6%) |
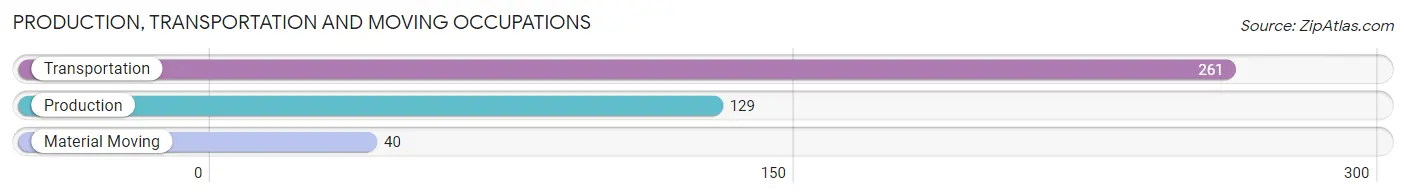
Production, Transportation and Moving Occupations
The most common Production, Transportation and Moving occupations in Dripping Springs are Transportation (261 | 10.6%), Production (129 | 5.2%), and Material Moving (40 | 1.6%).
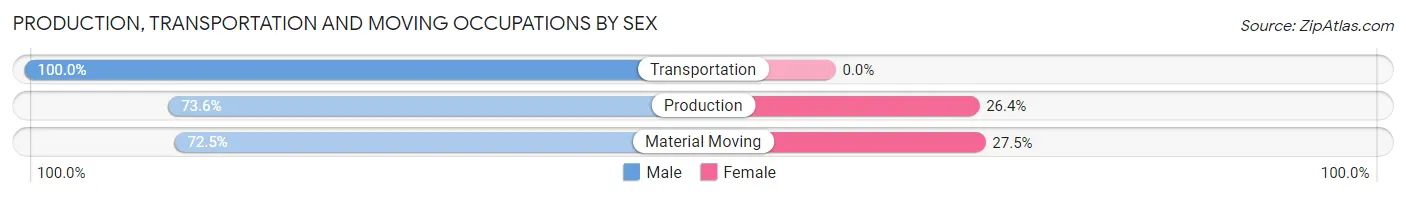
Production, Transportation and Moving Occupations by Sex
| Occupation | Male | Female |
| Production | 95 (73.6%) | 34 (26.4%) |
| Transportation | 261 (100.0%) | 0 (0.0%) |
| Material Moving | 29 (72.5%) | 11 (27.5%) |
| Total (Category) | 385 (89.5%) | 45 (10.5%) |
| Total (Overall) | 1,586 (64.4%) | 876 (35.6%) |
Employment Industries by Sex in Dripping Springs
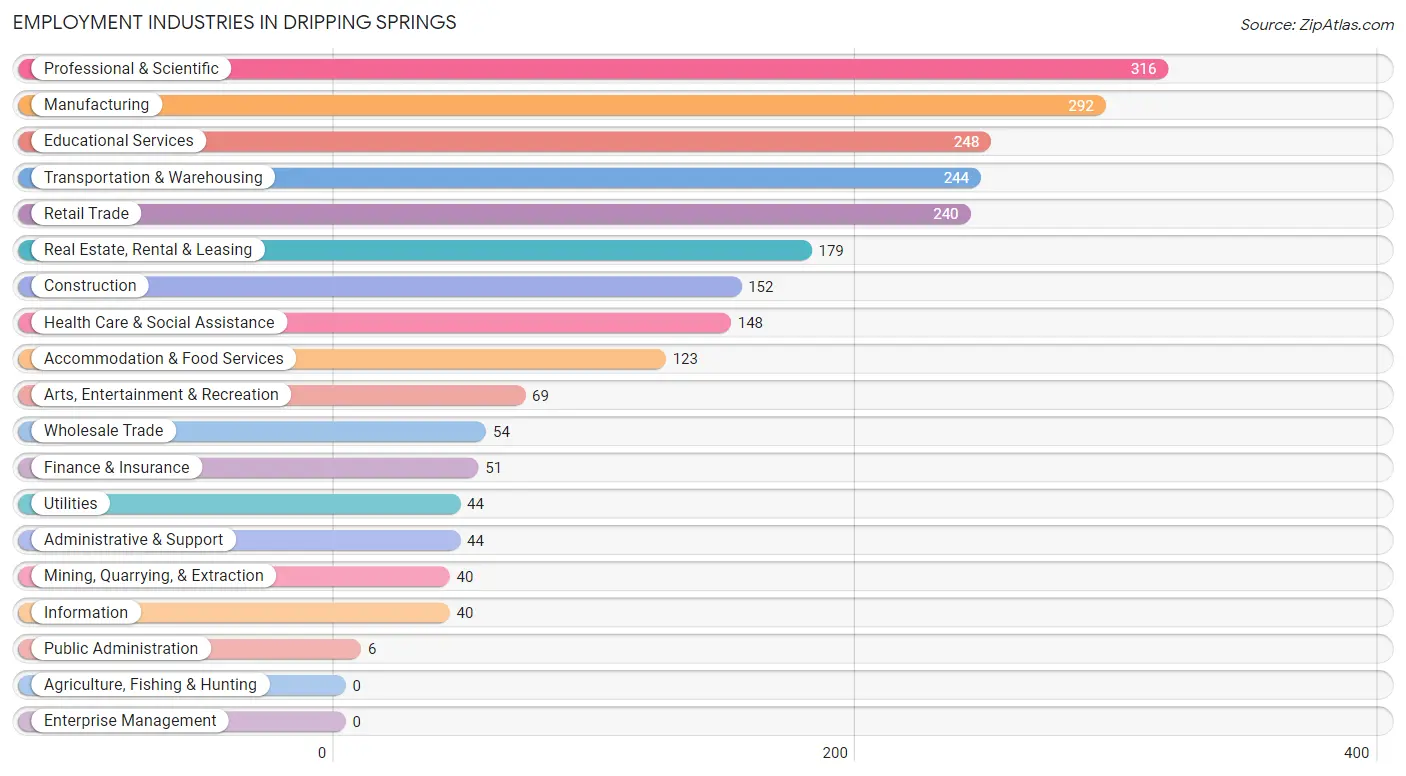
Employment Industries in Dripping Springs
The major employment industries in Dripping Springs include Professional & Scientific (316 | 12.8%), Manufacturing (292 | 11.9%), Educational Services (248 | 10.1%), Transportation & Warehousing (244 | 9.9%), and Retail Trade (240 | 9.8%).
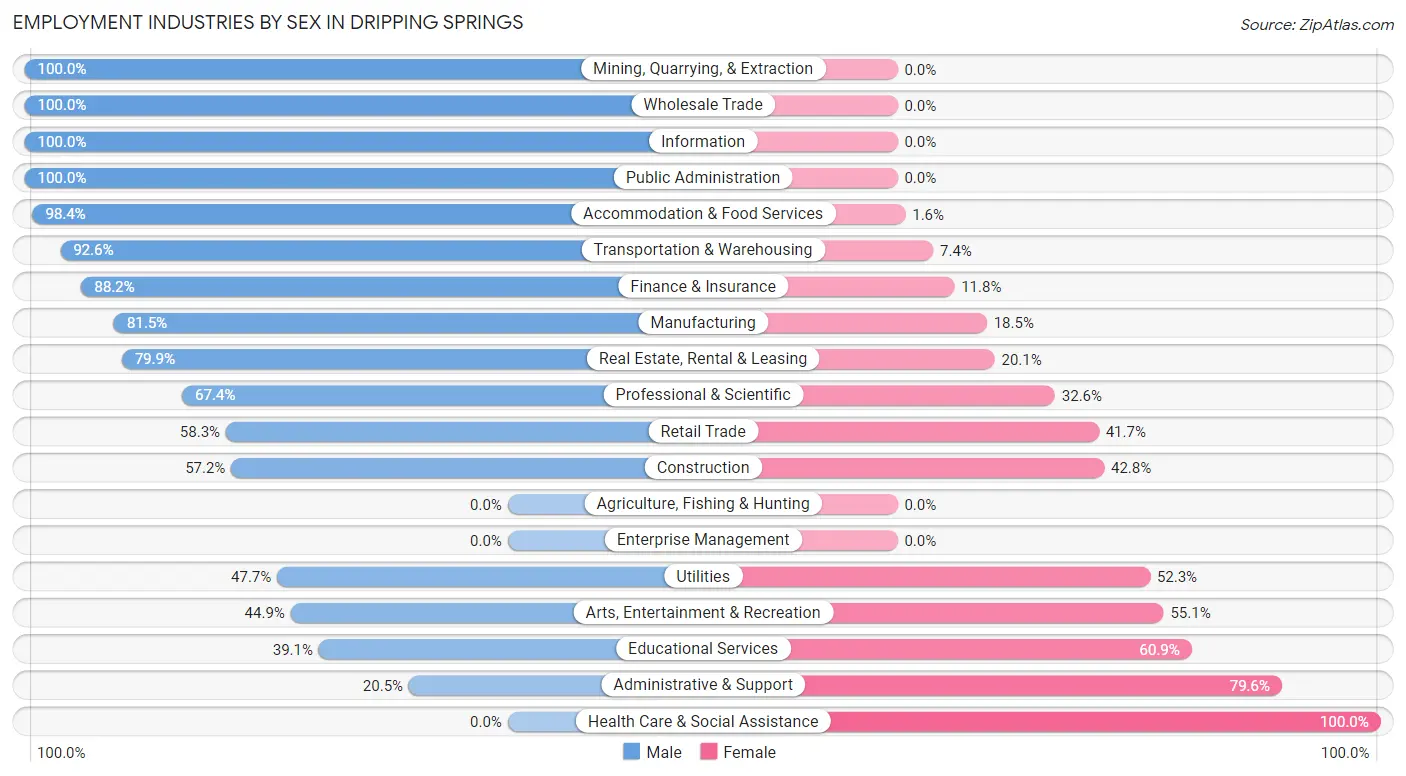
Employment Industries by Sex in Dripping Springs
The Dripping Springs industries that see more men than women are Mining, Quarrying, & Extraction (100.0%), Wholesale Trade (100.0%), and Information (100.0%), whereas the industries that tend to have a higher number of women are Health Care & Social Assistance (100.0%), Administrative & Support (79.5%), and Educational Services (60.9%).
| Industry | Male | Female |
| Agriculture, Fishing & Hunting | 0 (0.0%) | 0 (0.0%) |
| Mining, Quarrying, & Extraction | 40 (100.0%) | 0 (0.0%) |
| Construction | 87 (57.2%) | 65 (42.8%) |
| Manufacturing | 238 (81.5%) | 54 (18.5%) |
| Wholesale Trade | 54 (100.0%) | 0 (0.0%) |
| Retail Trade | 140 (58.3%) | 100 (41.7%) |
| Transportation & Warehousing | 226 (92.6%) | 18 (7.4%) |
| Utilities | 21 (47.7%) | 23 (52.3%) |
| Information | 40 (100.0%) | 0 (0.0%) |
| Finance & Insurance | 45 (88.2%) | 6 (11.8%) |
| Real Estate, Rental & Leasing | 143 (79.9%) | 36 (20.1%) |
| Professional & Scientific | 213 (67.4%) | 103 (32.6%) |
| Enterprise Management | 0 (0.0%) | 0 (0.0%) |
| Administrative & Support | 9 (20.4%) | 35 (79.5%) |
| Educational Services | 97 (39.1%) | 151 (60.9%) |
| Health Care & Social Assistance | 0 (0.0%) | 148 (100.0%) |
| Arts, Entertainment & Recreation | 31 (44.9%) | 38 (55.1%) |
| Accommodation & Food Services | 121 (98.4%) | 2 (1.6%) |
| Public Administration | 6 (100.0%) | 0 (0.0%) |
| Total | 1,586 (64.4%) | 876 (35.6%) |
Education in Dripping Springs
School Enrollment in Dripping Springs
The most common levels of schooling among the 1,629 students in Dripping Springs are elementary school (555 | 34.1%), high school (376 | 23.1%), and middle school (298 | 18.3%).
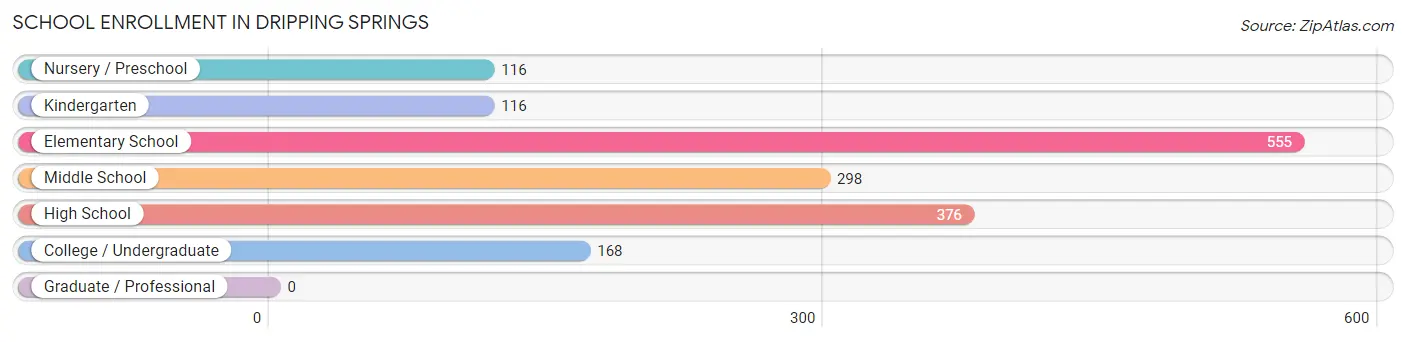
| School Level | # Students | % Students |
| Nursery / Preschool | 116 | 7.1% |
| Kindergarten | 116 | 7.1% |
| Elementary School | 555 | 34.1% |
| Middle School | 298 | 18.3% |
| High School | 376 | 23.1% |
| College / Undergraduate | 168 | 10.3% |
| Graduate / Professional | 0 | 0.0% |
| Total | 1,629 | 100.0% |
School Enrollment by Age by Funding Source in Dripping Springs
Out of a total of 1,629 students who are enrolled in schools in Dripping Springs, 112 (6.9%) attend a private institution, while the remaining 1,517 (93.1%) are enrolled in public schools. The age group of 20 to 24 year olds has the highest likelihood of being enrolled in private schools, with 29 (53.7% in the age bracket) enrolled. Conversely, the age group of 18 to 19 year olds has the lowest likelihood of being enrolled in a private school, with 155 (100.0% in the age bracket) attending a public institution.
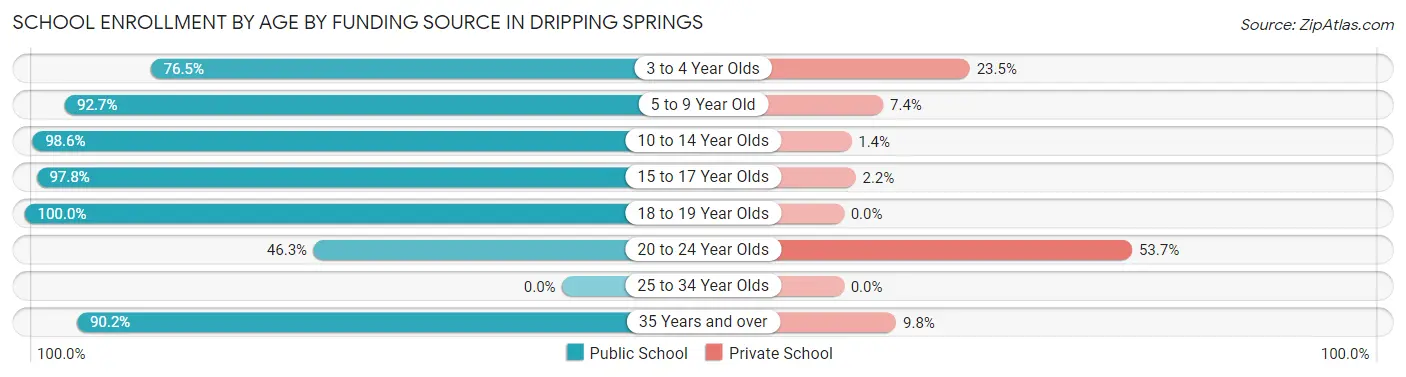
| Age Bracket | Public School | Private School |
| 3 to 4 Year Olds | 88 (76.5%) | 27 (23.5%) |
| 5 to 9 Year Old | 504 (92.6%) | 40 (7.3%) |
| 10 to 14 Year Olds | 487 (98.6%) | 7 (1.4%) |
| 15 to 17 Year Olds | 221 (97.8%) | 5 (2.2%) |
| 18 to 19 Year Olds | 155 (100.0%) | 0 (0.0%) |
| 20 to 24 Year Olds | 25 (46.3%) | 29 (53.7%) |
| 25 to 34 Year Olds | 0 (0.0%) | 0 (0.0%) |
| 35 Years and over | 37 (90.2%) | 4 (9.8%) |
| Total | 1,517 (93.1%) | 112 (6.9%) |
Educational Attainment by Field of Study in Dripping Springs
Business (346 | 16.0%), computers & mathematics (238 | 11.0%), communications (207 | 9.5%), education (195 | 9.0%), and arts & humanities (188 | 8.7%) are the most common fields of study among 2,169 individuals in Dripping Springs who have obtained a bachelor's degree or higher.
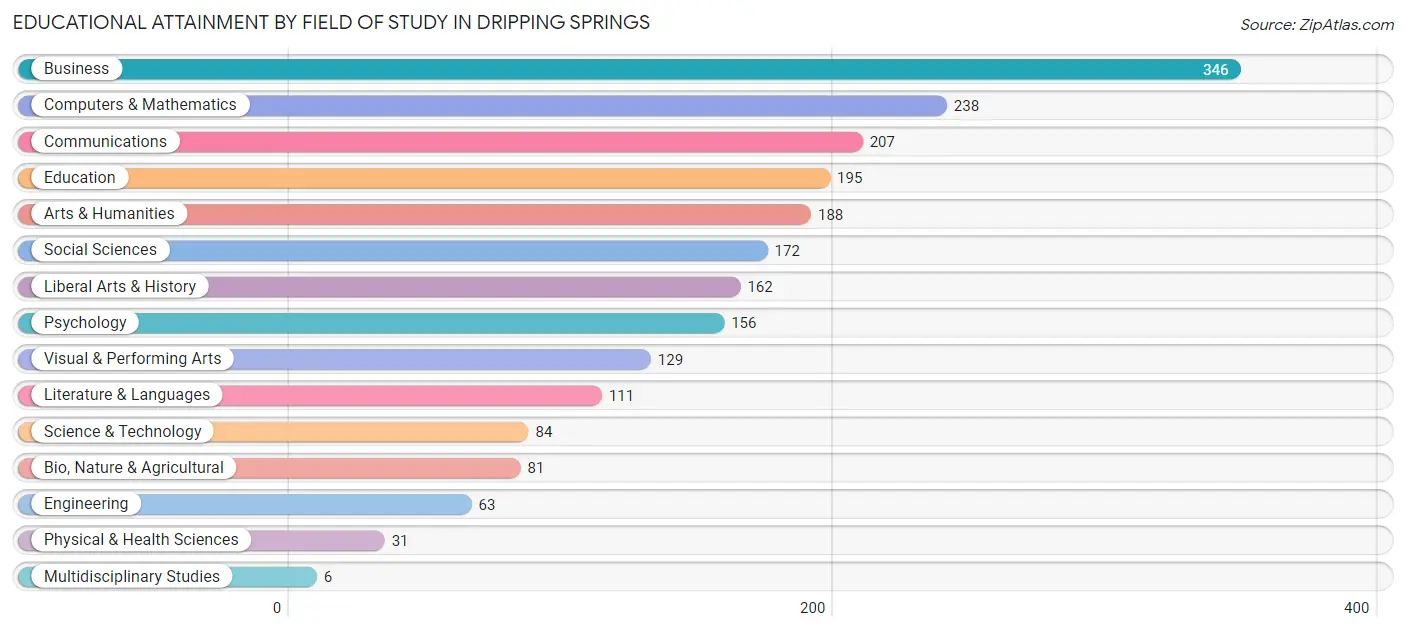
| Field of Study | # Graduates | % Graduates |
| Computers & Mathematics | 238 | 11.0% |
| Bio, Nature & Agricultural | 81 | 3.7% |
| Physical & Health Sciences | 31 | 1.4% |
| Psychology | 156 | 7.2% |
| Social Sciences | 172 | 7.9% |
| Engineering | 63 | 2.9% |
| Multidisciplinary Studies | 6 | 0.3% |
| Science & Technology | 84 | 3.9% |
| Business | 346 | 16.0% |
| Education | 195 | 9.0% |
| Literature & Languages | 111 | 5.1% |
| Liberal Arts & History | 162 | 7.5% |
| Visual & Performing Arts | 129 | 5.9% |
| Communications | 207 | 9.5% |
| Arts & Humanities | 188 | 8.7% |
| Total | 2,169 | 100.0% |
Transportation & Commute in Dripping Springs
Vehicle Availability by Sex in Dripping Springs
The most prevalent vehicle ownership categories in Dripping Springs are males with 2 vehicles (827, accounting for 52.1%) and females with 2 vehicles (486, making up 95.5%).
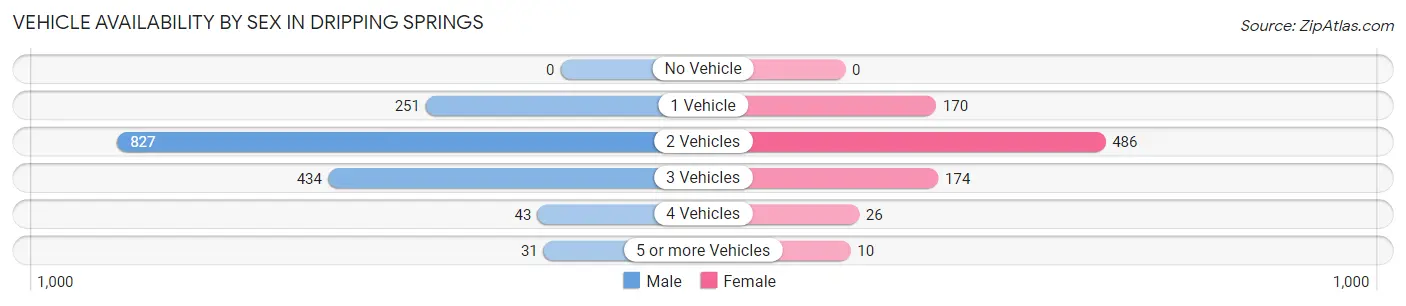
| Vehicles Available | Male | Female |
| No Vehicle | 0 (0.0%) | 0 (0.0%) |
| 1 Vehicle | 251 (15.8%) | 170 (19.6%) |
| 2 Vehicles | 827 (52.1%) | 486 (56.1%) |
| 3 Vehicles | 434 (27.4%) | 174 (20.1%) |
| 4 Vehicles | 43 (2.7%) | 26 (3.0%) |
| 5 or more Vehicles | 31 (1.9%) | 10 (1.1%) |
| Total | 1,586 (100.0%) | 866 (100.0%) |
Commute Time in Dripping Springs
The most frequently occuring commute durations in Dripping Springs are 15 to 19 minutes (477 commuters, 27.2%), 5 to 9 minutes (333 commuters, 19.0%), and 10 to 14 minutes (232 commuters, 13.2%).
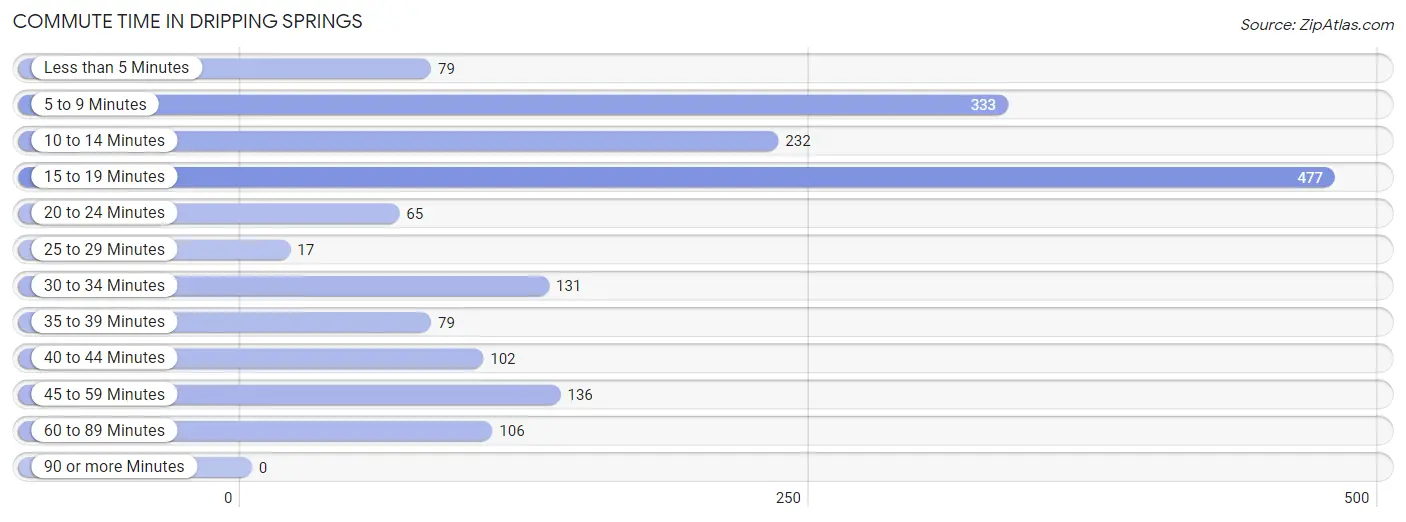
| Commute Time | # Commuters | % Commuters |
| Less than 5 Minutes | 79 | 4.5% |
| 5 to 9 Minutes | 333 | 19.0% |
| 10 to 14 Minutes | 232 | 13.2% |
| 15 to 19 Minutes | 477 | 27.2% |
| 20 to 24 Minutes | 65 | 3.7% |
| 25 to 29 Minutes | 17 | 1.0% |
| 30 to 34 Minutes | 131 | 7.5% |
| 35 to 39 Minutes | 79 | 4.5% |
| 40 to 44 Minutes | 102 | 5.8% |
| 45 to 59 Minutes | 136 | 7.7% |
| 60 to 89 Minutes | 106 | 6.0% |
| 90 or more Minutes | 0 | 0.0% |
Commute Time by Sex in Dripping Springs
The most common commute times in Dripping Springs are 15 to 19 minutes (374 commuters, 32.8%) for males and 5 to 9 minutes (162 commuters, 26.3%) for females.
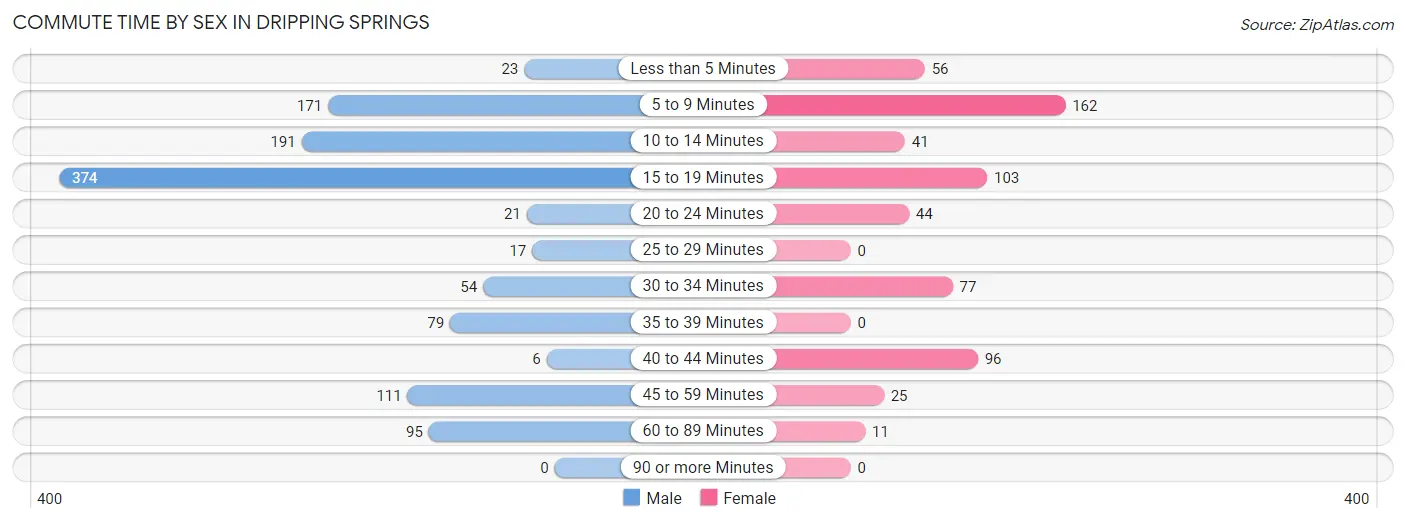
| Commute Time | Male | Female |
| Less than 5 Minutes | 23 (2.0%) | 56 (9.1%) |
| 5 to 9 Minutes | 171 (15.0%) | 162 (26.3%) |
| 10 to 14 Minutes | 191 (16.7%) | 41 (6.7%) |
| 15 to 19 Minutes | 374 (32.8%) | 103 (16.8%) |
| 20 to 24 Minutes | 21 (1.8%) | 44 (7.1%) |
| 25 to 29 Minutes | 17 (1.5%) | 0 (0.0%) |
| 30 to 34 Minutes | 54 (4.7%) | 77 (12.5%) |
| 35 to 39 Minutes | 79 (6.9%) | 0 (0.0%) |
| 40 to 44 Minutes | 6 (0.5%) | 96 (15.6%) |
| 45 to 59 Minutes | 111 (9.7%) | 25 (4.1%) |
| 60 to 89 Minutes | 95 (8.3%) | 11 (1.8%) |
| 90 or more Minutes | 0 (0.0%) | 0 (0.0%) |
Time of Departure to Work by Sex in Dripping Springs
The most frequent times of departure to work in Dripping Springs are 7:00 AM to 7:29 AM (416, 36.4%) for males and 7:00 AM to 7:29 AM (132, 21.5%) for females.
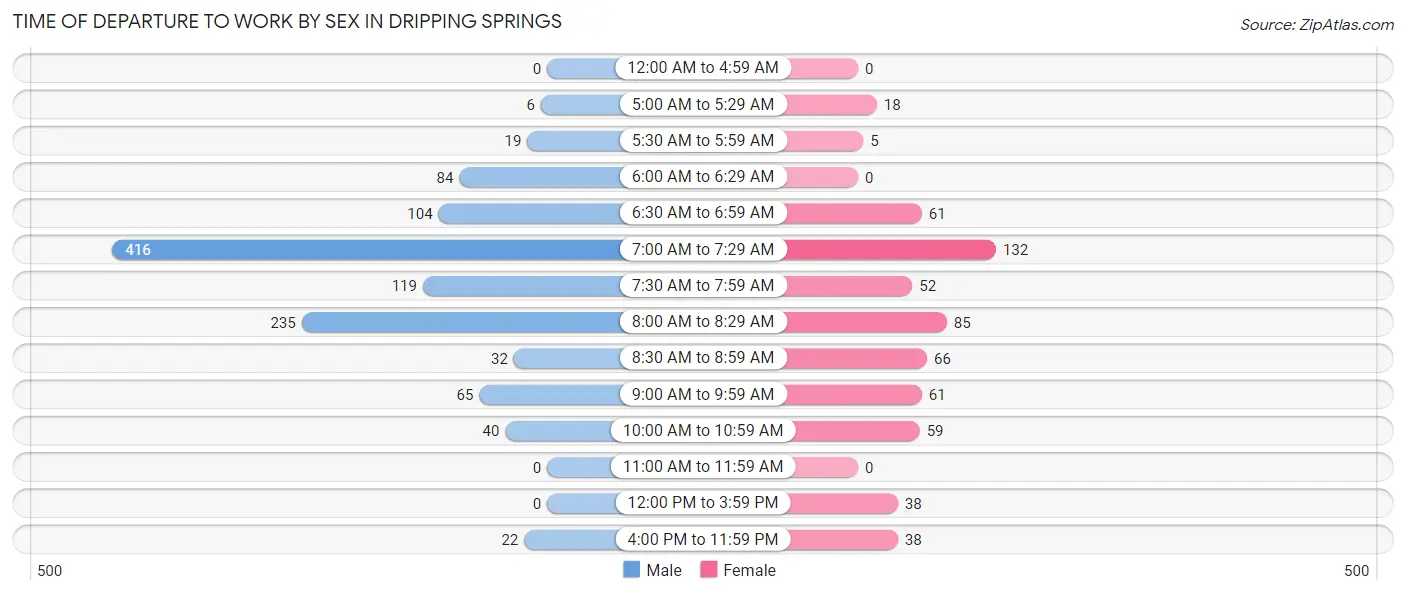
| Time of Departure | Male | Female |
| 12:00 AM to 4:59 AM | 0 (0.0%) | 0 (0.0%) |
| 5:00 AM to 5:29 AM | 6 (0.5%) | 18 (2.9%) |
| 5:30 AM to 5:59 AM | 19 (1.7%) | 5 (0.8%) |
| 6:00 AM to 6:29 AM | 84 (7.4%) | 0 (0.0%) |
| 6:30 AM to 6:59 AM | 104 (9.1%) | 61 (9.9%) |
| 7:00 AM to 7:29 AM | 416 (36.4%) | 132 (21.5%) |
| 7:30 AM to 7:59 AM | 119 (10.4%) | 52 (8.5%) |
| 8:00 AM to 8:29 AM | 235 (20.6%) | 85 (13.8%) |
| 8:30 AM to 8:59 AM | 32 (2.8%) | 66 (10.7%) |
| 9:00 AM to 9:59 AM | 65 (5.7%) | 61 (9.9%) |
| 10:00 AM to 10:59 AM | 40 (3.5%) | 59 (9.6%) |
| 11:00 AM to 11:59 AM | 0 (0.0%) | 0 (0.0%) |
| 12:00 PM to 3:59 PM | 0 (0.0%) | 38 (6.2%) |
| 4:00 PM to 11:59 PM | 22 (1.9%) | 38 (6.2%) |
| Total | 1,142 (100.0%) | 615 (100.0%) |
Housing Occupancy in Dripping Springs
Occupancy by Ownership in Dripping Springs
Of the total 2,044 dwellings in Dripping Springs, owner-occupied units account for 1,132 (55.4%), while renter-occupied units make up 912 (44.6%).
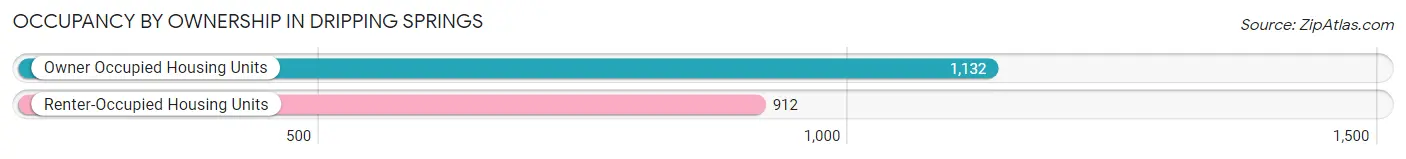
| Occupancy | # Housing Units | % Housing Units |
| Owner Occupied Housing Units | 1,132 | 55.4% |
| Renter-Occupied Housing Units | 912 | 44.6% |
| Total Occupied Housing Units | 2,044 | 100.0% |
Occupancy by Household Size in Dripping Springs
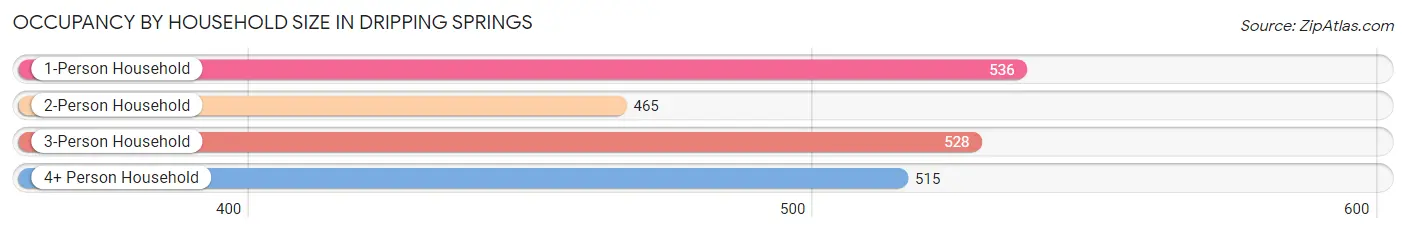
| Household Size | # Housing Units | % Housing Units |
| 1-Person Household | 536 | 26.2% |
| 2-Person Household | 465 | 22.8% |
| 3-Person Household | 528 | 25.8% |
| 4+ Person Household | 515 | 25.2% |
| Total Housing Units | 2,044 | 100.0% |
Occupancy by Ownership by Household Size in Dripping Springs
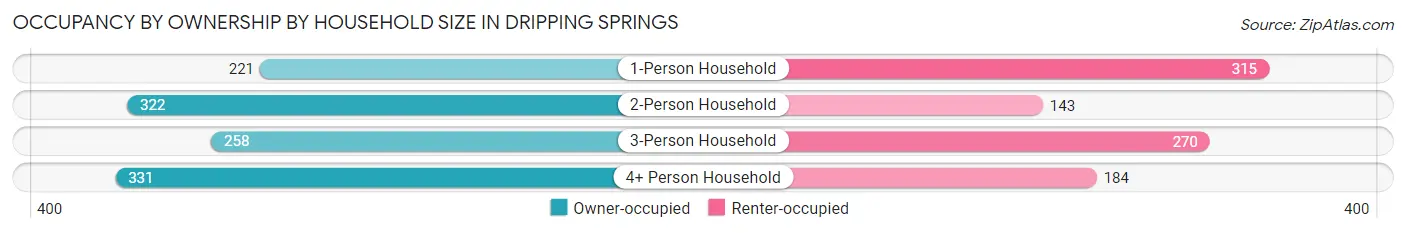
| Household Size | Owner-occupied | Renter-occupied |
| 1-Person Household | 221 (41.2%) | 315 (58.8%) |
| 2-Person Household | 322 (69.3%) | 143 (30.7%) |
| 3-Person Household | 258 (48.9%) | 270 (51.1%) |
| 4+ Person Household | 331 (64.3%) | 184 (35.7%) |
| Total Housing Units | 1,132 (55.4%) | 912 (44.6%) |
Occupancy by Educational Attainment in Dripping Springs
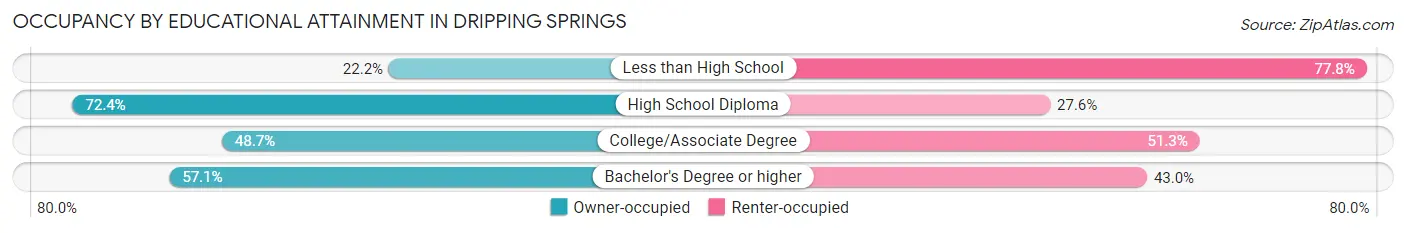
| Household Size | Owner-occupied | Renter-occupied |
| Less than High School | 8 (22.2%) | 28 (77.8%) |
| High School Diploma | 126 (72.4%) | 48 (27.6%) |
| College/Associate Degree | 282 (48.7%) | 297 (51.3%) |
| Bachelor's Degree or higher | 716 (57.1%) | 539 (42.9%) |
Occupancy by Age of Householder in Dripping Springs
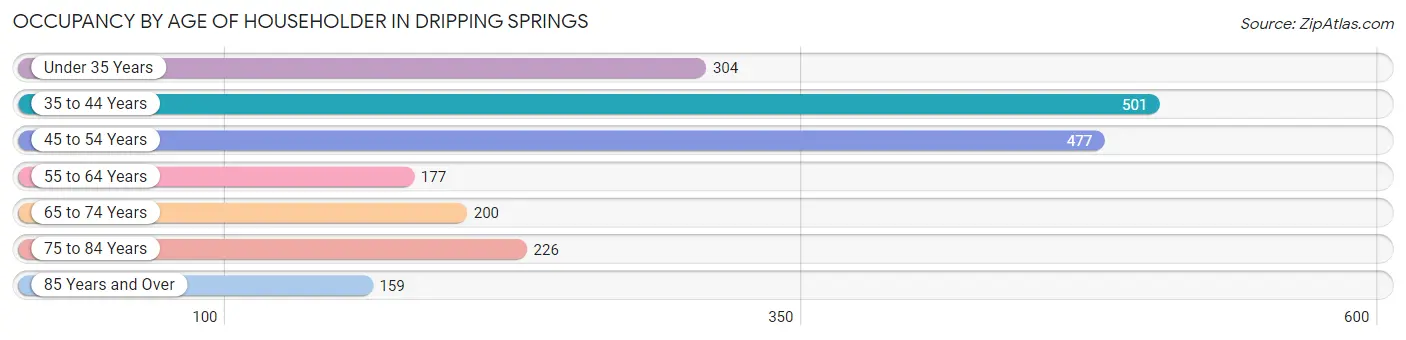
| Age Bracket | # Households | % Households |
| Under 35 Years | 304 | 14.9% |
| 35 to 44 Years | 501 | 24.5% |
| 45 to 54 Years | 477 | 23.3% |
| 55 to 64 Years | 177 | 8.7% |
| 65 to 74 Years | 200 | 9.8% |
| 75 to 84 Years | 226 | 11.1% |
| 85 Years and Over | 159 | 7.8% |
| Total | 2,044 | 100.0% |
Housing Finances in Dripping Springs
Median Income by Occupancy in Dripping Springs
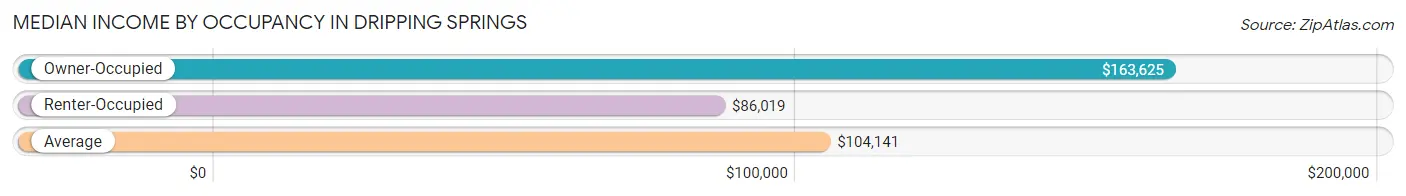
| Occupancy Type | # Households | Median Income |
| Owner-Occupied | 1,132 (55.4%) | $163,625 |
| Renter-Occupied | 912 (44.6%) | $86,019 |
| Average | 2,044 (100.0%) | $104,141 |
Occupancy by Householder Income Bracket in Dripping Springs
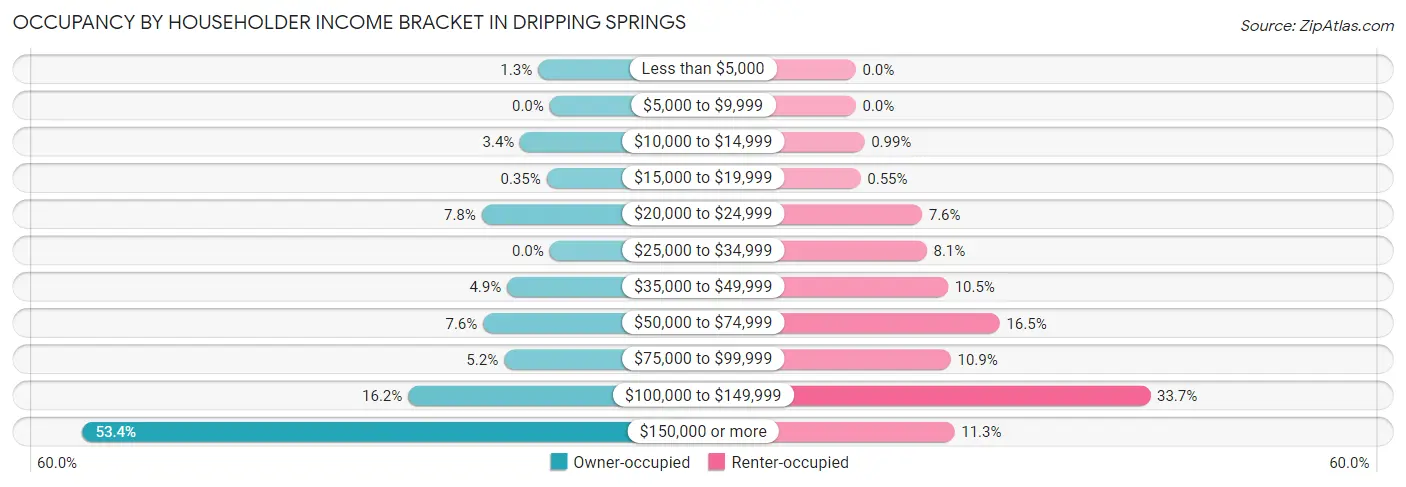
| Income Bracket | Owner-occupied | Renter-occupied |
| Less than $5,000 | 15 (1.3%) | 0 (0.0%) |
| $5,000 to $9,999 | 0 (0.0%) | 0 (0.0%) |
| $10,000 to $14,999 | 38 (3.4%) | 9 (1.0%) |
| $15,000 to $19,999 | 4 (0.4%) | 5 (0.5%) |
| $20,000 to $24,999 | 88 (7.8%) | 69 (7.6%) |
| $25,000 to $34,999 | 0 (0.0%) | 74 (8.1%) |
| $35,000 to $49,999 | 55 (4.9%) | 96 (10.5%) |
| $50,000 to $74,999 | 86 (7.6%) | 150 (16.5%) |
| $75,000 to $99,999 | 59 (5.2%) | 99 (10.9%) |
| $100,000 to $149,999 | 183 (16.2%) | 307 (33.7%) |
| $150,000 or more | 604 (53.4%) | 103 (11.3%) |
| Total | 1,132 (100.0%) | 912 (100.0%) |
Monthly Housing Cost Tiers in Dripping Springs
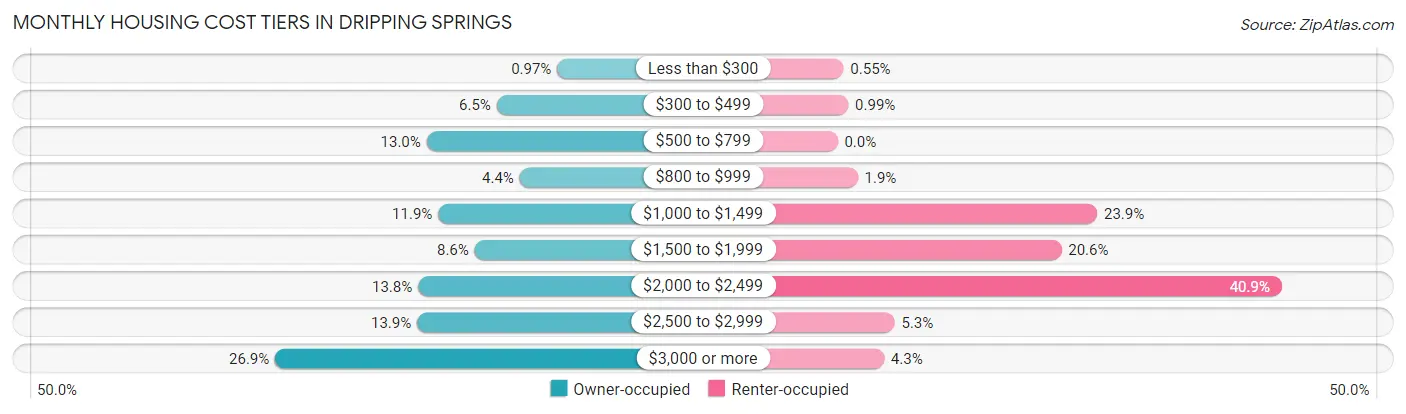
| Monthly Cost | Owner-occupied | Renter-occupied |
| Less than $300 | 11 (1.0%) | 5 (0.5%) |
| $300 to $499 | 74 (6.5%) | 9 (1.0%) |
| $500 to $799 | 147 (13.0%) | 0 (0.0%) |
| $800 to $999 | 50 (4.4%) | 17 (1.9%) |
| $1,000 to $1,499 | 135 (11.9%) | 218 (23.9%) |
| $1,500 to $1,999 | 97 (8.6%) | 188 (20.6%) |
| $2,000 to $2,499 | 156 (13.8%) | 373 (40.9%) |
| $2,500 to $2,999 | 157 (13.9%) | 48 (5.3%) |
| $3,000 or more | 305 (26.9%) | 39 (4.3%) |
| Total | 1,132 (100.0%) | 912 (100.0%) |
Physical Housing Characteristics in Dripping Springs
Housing Structures in Dripping Springs
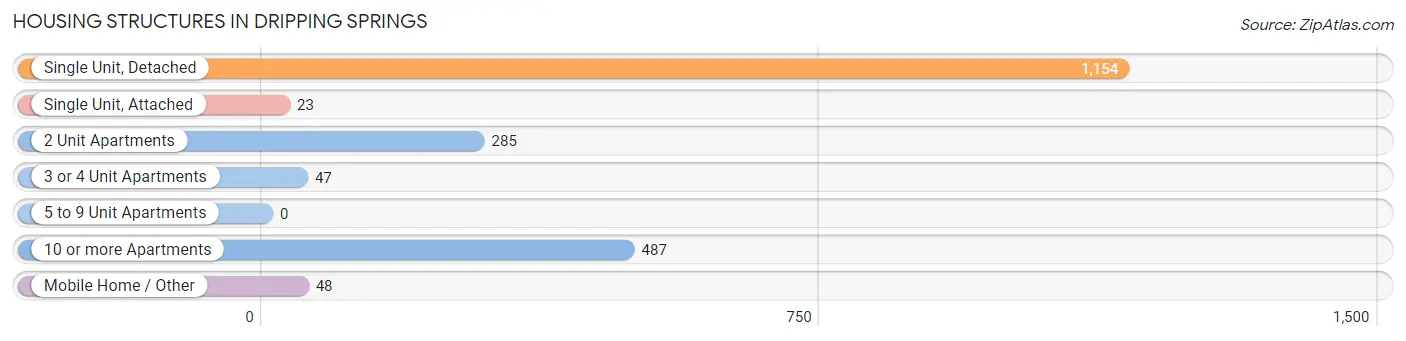
| Structure Type | # Housing Units | % Housing Units |
| Single Unit, Detached | 1,154 | 56.5% |
| Single Unit, Attached | 23 | 1.1% |
| 2 Unit Apartments | 285 | 13.9% |
| 3 or 4 Unit Apartments | 47 | 2.3% |
| 5 to 9 Unit Apartments | 0 | 0.0% |
| 10 or more Apartments | 487 | 23.8% |
| Mobile Home / Other | 48 | 2.4% |
| Total | 2,044 | 100.0% |
Housing Structures by Occupancy in Dripping Springs
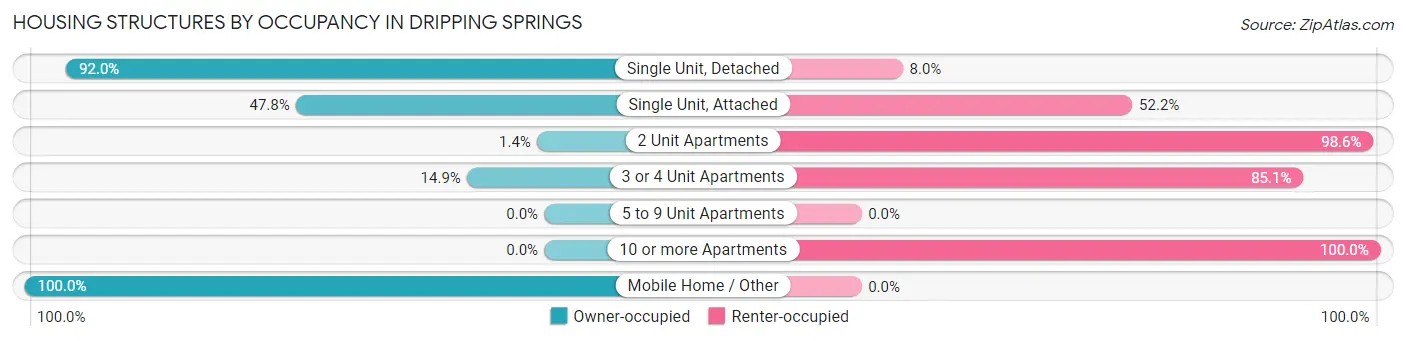
| Structure Type | Owner-occupied | Renter-occupied |
| Single Unit, Detached | 1,062 (92.0%) | 92 (8.0%) |
| Single Unit, Attached | 11 (47.8%) | 12 (52.2%) |
| 2 Unit Apartments | 4 (1.4%) | 281 (98.6%) |
| 3 or 4 Unit Apartments | 7 (14.9%) | 40 (85.1%) |
| 5 to 9 Unit Apartments | 0 (0.0%) | 0 (0.0%) |
| 10 or more Apartments | 0 (0.0%) | 487 (100.0%) |
| Mobile Home / Other | 48 (100.0%) | 0 (0.0%) |
| Total | 1,132 (55.4%) | 912 (44.6%) |
Housing Structures by Number of Rooms in Dripping Springs
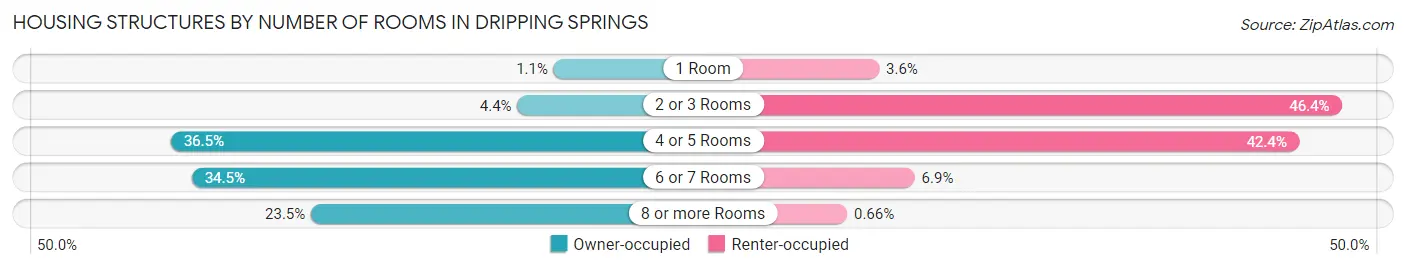
| Number of Rooms | Owner-occupied | Renter-occupied |
| 1 Room | 12 (1.1%) | 33 (3.6%) |
| 2 or 3 Rooms | 50 (4.4%) | 423 (46.4%) |
| 4 or 5 Rooms | 413 (36.5%) | 387 (42.4%) |
| 6 or 7 Rooms | 391 (34.5%) | 63 (6.9%) |
| 8 or more Rooms | 266 (23.5%) | 6 (0.7%) |
| Total | 1,132 (100.0%) | 912 (100.0%) |
Housing Structure by Heating Type in Dripping Springs
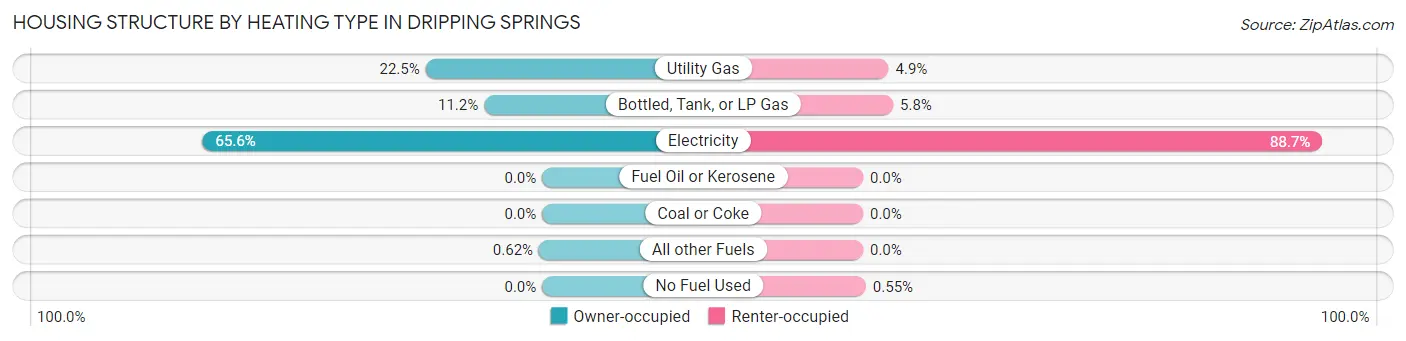
| Heating Type | Owner-occupied | Renter-occupied |
| Utility Gas | 255 (22.5%) | 45 (4.9%) |
| Bottled, Tank, or LP Gas | 127 (11.2%) | 53 (5.8%) |
| Electricity | 743 (65.6%) | 809 (88.7%) |
| Fuel Oil or Kerosene | 0 (0.0%) | 0 (0.0%) |
| Coal or Coke | 0 (0.0%) | 0 (0.0%) |
| All other Fuels | 7 (0.6%) | 0 (0.0%) |
| No Fuel Used | 0 (0.0%) | 5 (0.5%) |
| Total | 1,132 (100.0%) | 912 (100.0%) |
Household Vehicle Usage in Dripping Springs
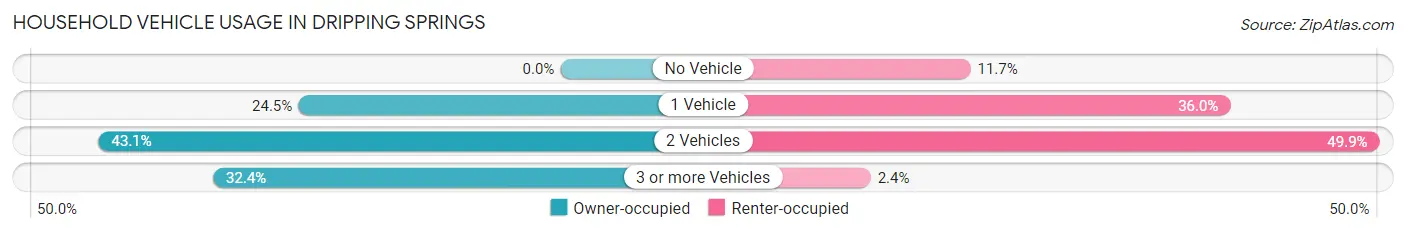
| Vehicles per Household | Owner-occupied | Renter-occupied |
| No Vehicle | 0 (0.0%) | 107 (11.7%) |
| 1 Vehicle | 277 (24.5%) | 328 (36.0%) |
| 2 Vehicles | 488 (43.1%) | 455 (49.9%) |
| 3 or more Vehicles | 367 (32.4%) | 22 (2.4%) |
| Total | 1,132 (100.0%) | 912 (100.0%) |
Real Estate & Mortgages in Dripping Springs
Real Estate and Mortgage Overview in Dripping Springs
| Characteristic | Without Mortgage | With Mortgage |
| Housing Units | 403 | 729 |
| Median Property Value | $485,300 | $537,900 |
| Median Household Income | $96,375 | $476 |
| Monthly Housing Costs | $693 | $305 |
| Real Estate Taxes | $5,958 | $14 |
Property Value by Mortgage Status in Dripping Springs
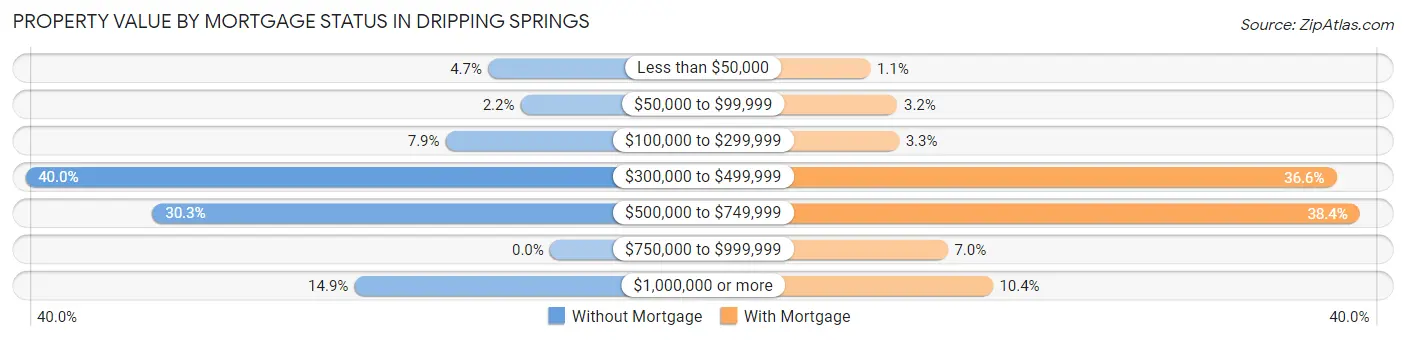
| Property Value | Without Mortgage | With Mortgage |
| Less than $50,000 | 19 (4.7%) | 8 (1.1%) |
| $50,000 to $99,999 | 9 (2.2%) | 23 (3.2%) |
| $100,000 to $299,999 | 32 (7.9%) | 24 (3.3%) |
| $300,000 to $499,999 | 161 (40.0%) | 267 (36.6%) |
| $500,000 to $749,999 | 122 (30.3%) | 280 (38.4%) |
| $750,000 to $999,999 | 0 (0.0%) | 51 (7.0%) |
| $1,000,000 or more | 60 (14.9%) | 76 (10.4%) |
| Total | 403 (100.0%) | 729 (100.0%) |
Household Income by Mortgage Status in Dripping Springs
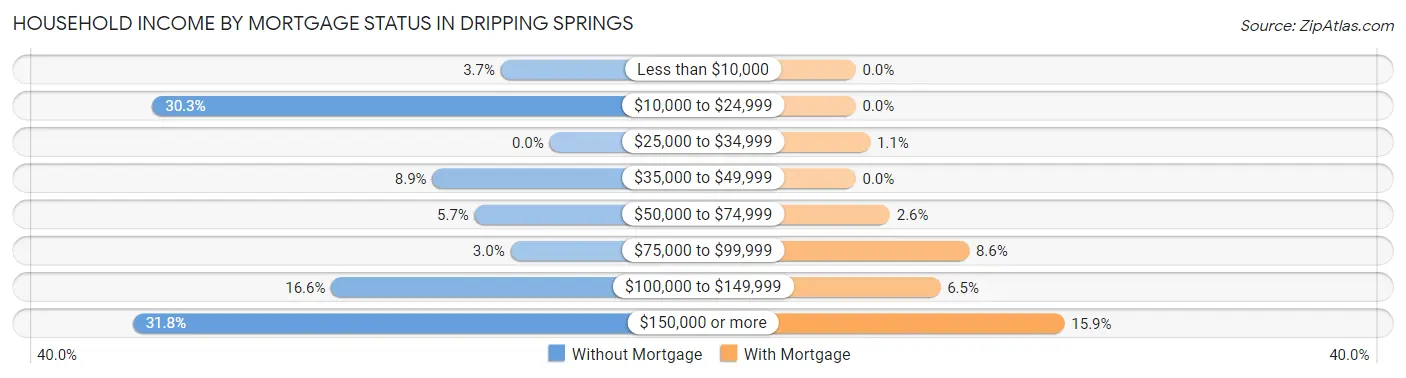
| Household Income | Without Mortgage | With Mortgage |
| Less than $10,000 | 15 (3.7%) | 0 (0.0%) |
| $10,000 to $24,999 | 122 (30.3%) | 0 (0.0%) |
| $25,000 to $34,999 | 0 (0.0%) | 8 (1.1%) |
| $35,000 to $49,999 | 36 (8.9%) | 0 (0.0%) |
| $50,000 to $74,999 | 23 (5.7%) | 19 (2.6%) |
| $75,000 to $99,999 | 12 (3.0%) | 63 (8.6%) |
| $100,000 to $149,999 | 67 (16.6%) | 47 (6.5%) |
| $150,000 or more | 128 (31.8%) | 116 (15.9%) |
| Total | 403 (100.0%) | 729 (100.0%) |
Property Value to Household Income Ratio in Dripping Springs
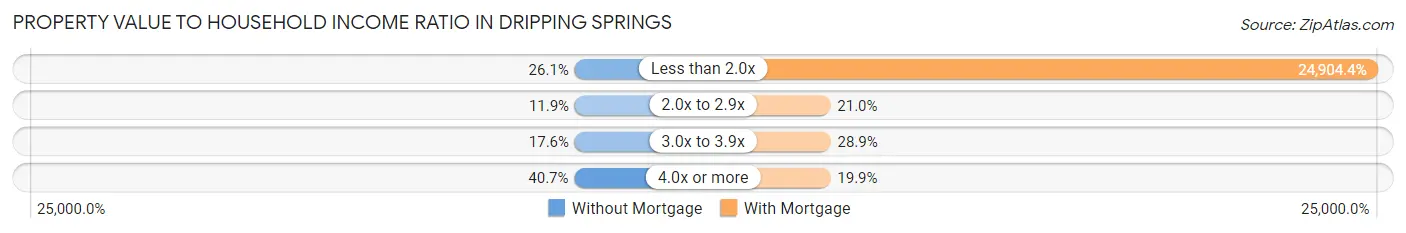
| Value-to-Income Ratio | Without Mortgage | With Mortgage |
| Less than 2.0x | 105 (26.1%) | 181,553 (24,904.4%) |
| 2.0x to 2.9x | 48 (11.9%) | 153 (21.0%) |
| 3.0x to 3.9x | 71 (17.6%) | 211 (28.9%) |
| 4.0x or more | 164 (40.7%) | 145 (19.9%) |
| Total | 403 (100.0%) | 729 (100.0%) |
Real Estate Taxes by Mortgage Status in Dripping Springs
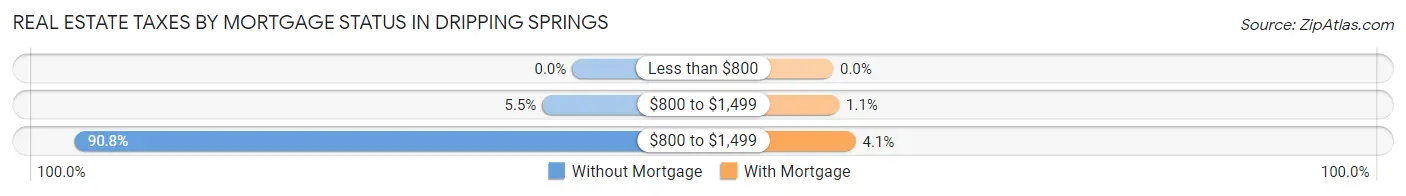
| Property Taxes | Without Mortgage | With Mortgage |
| Less than $800 | 0 (0.0%) | 0 (0.0%) |
| $800 to $1,499 | 22 (5.5%) | 8 (1.1%) |
| $800 to $1,499 | 366 (90.8%) | 30 (4.1%) |
| Total | 403 (100.0%) | 729 (100.0%) |
Health & Disability in Dripping Springs
Health Insurance Coverage by Age in Dripping Springs
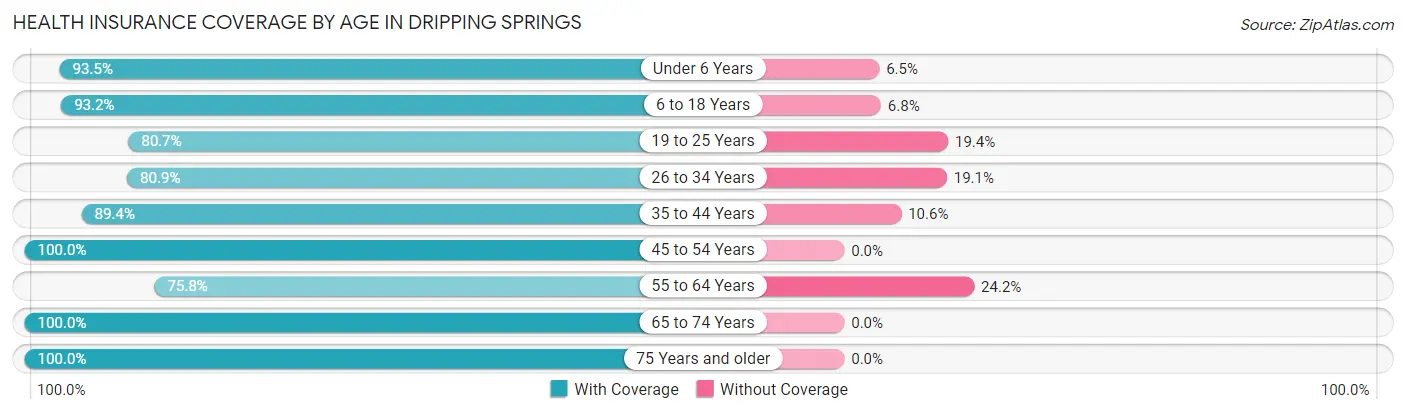
| Age Bracket | With Coverage | Without Coverage |
| Under 6 Years | 388 (93.5%) | 27 (6.5%) |
| 6 to 18 Years | 1,309 (93.2%) | 96 (6.8%) |
| 19 to 25 Years | 325 (80.6%) | 78 (19.4%) |
| 26 to 34 Years | 368 (80.9%) | 87 (19.1%) |
| 35 to 44 Years | 833 (89.4%) | 99 (10.6%) |
| 45 to 54 Years | 645 (100.0%) | 0 (0.0%) |
| 55 to 64 Years | 219 (75.8%) | 70 (24.2%) |
| 65 to 74 Years | 293 (100.0%) | 0 (0.0%) |
| 75 Years and older | 603 (100.0%) | 0 (0.0%) |
| Total | 4,983 (91.6%) | 457 (8.4%) |
Health Insurance Coverage by Citizenship Status in Dripping Springs
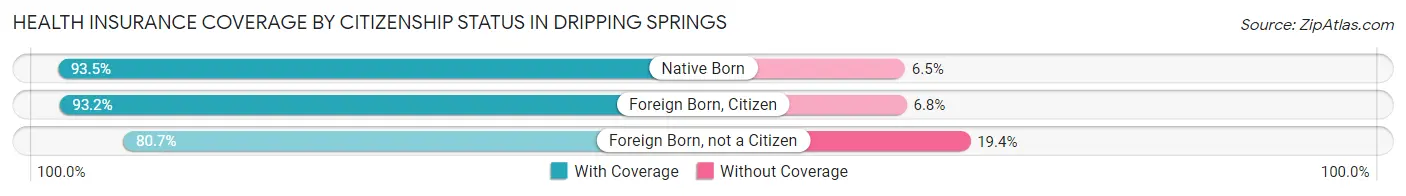
| Citizenship Status | With Coverage | Without Coverage |
| Native Born | 388 (93.5%) | 27 (6.5%) |
| Foreign Born, Citizen | 1,309 (93.2%) | 96 (6.8%) |
| Foreign Born, not a Citizen | 325 (80.6%) | 78 (19.4%) |
Health Insurance Coverage by Household Income in Dripping Springs
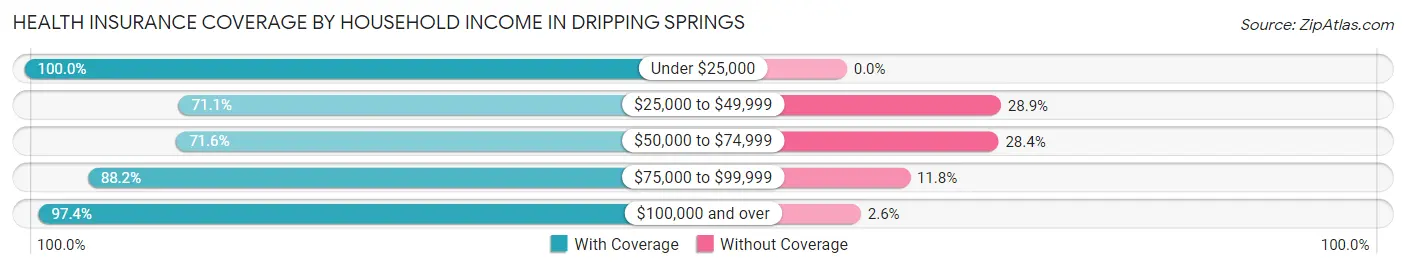
| Household Income | With Coverage | Without Coverage |
| Under $25,000 | 267 (100.0%) | 0 (0.0%) |
| $25,000 to $49,999 | 340 (71.1%) | 138 (28.9%) |
| $50,000 to $74,999 | 403 (71.6%) | 160 (28.4%) |
| $75,000 to $99,999 | 402 (88.2%) | 54 (11.8%) |
| $100,000 and over | 3,552 (97.4%) | 96 (2.6%) |
Public vs Private Health Insurance Coverage by Age in Dripping Springs
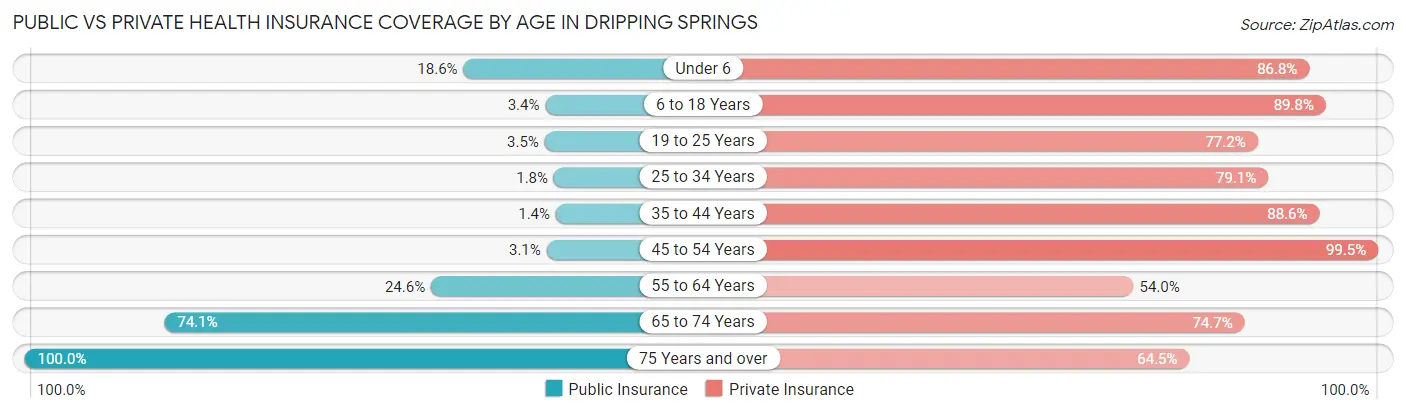
| Age Bracket | Public Insurance | Private Insurance |
| Under 6 | 77 (18.5%) | 360 (86.8%) |
| 6 to 18 Years | 47 (3.4%) | 1,262 (89.8%) |
| 19 to 25 Years | 14 (3.5%) | 311 (77.2%) |
| 25 to 34 Years | 8 (1.8%) | 360 (79.1%) |
| 35 to 44 Years | 13 (1.4%) | 826 (88.6%) |
| 45 to 54 Years | 20 (3.1%) | 642 (99.5%) |
| 55 to 64 Years | 71 (24.6%) | 156 (54.0%) |
| 65 to 74 Years | 217 (74.1%) | 219 (74.7%) |
| 75 Years and over | 603 (100.0%) | 389 (64.5%) |
| Total | 1,070 (19.7%) | 4,525 (83.2%) |
Disability Status by Sex by Age in Dripping Springs
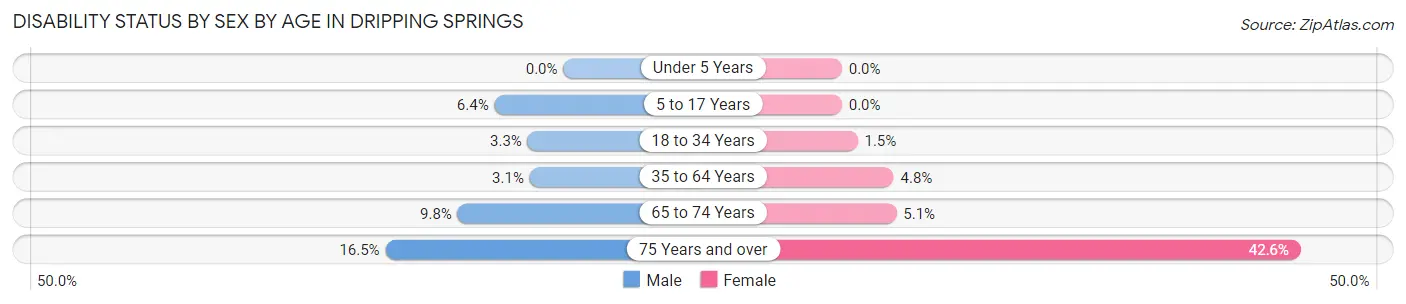
| Age Bracket | Male | Female |
| Under 5 Years | 0 (0.0%) | 0 (0.0%) |
| 5 to 17 Years | 47 (6.4%) | 0 (0.0%) |
| 18 to 34 Years | 18 (3.3%) | 6 (1.5%) |
| 35 to 64 Years | 31 (3.1%) | 42 (4.8%) |
| 65 to 74 Years | 21 (9.8%) | 4 (5.1%) |
| 75 Years and over | 36 (16.5%) | 164 (42.6%) |
Disability Class by Sex by Age in Dripping Springs
Disability Class: Hearing Difficulty
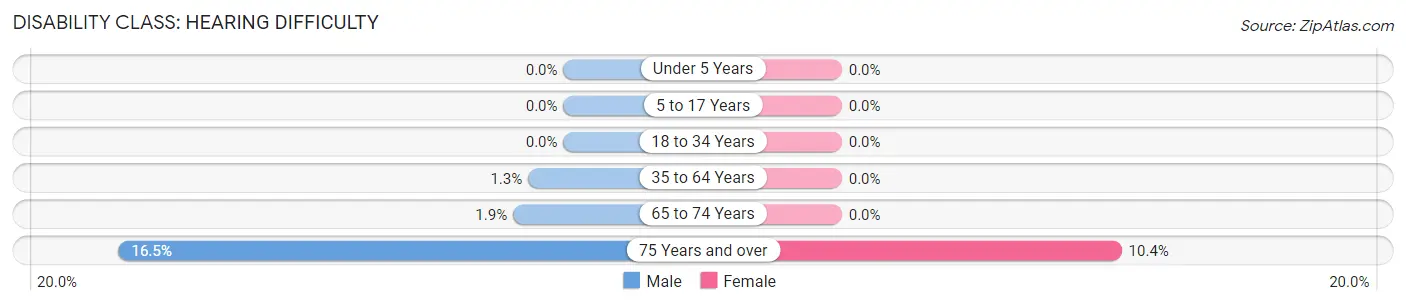
| Age Bracket | Male | Female |
| Under 5 Years | 0 (0.0%) | 0 (0.0%) |
| 5 to 17 Years | 0 (0.0%) | 0 (0.0%) |
| 18 to 34 Years | 0 (0.0%) | 0 (0.0%) |
| 35 to 64 Years | 13 (1.3%) | 0 (0.0%) |
| 65 to 74 Years | 4 (1.9%) | 0 (0.0%) |
| 75 Years and over | 36 (16.5%) | 40 (10.4%) |
Disability Class: Vision Difficulty
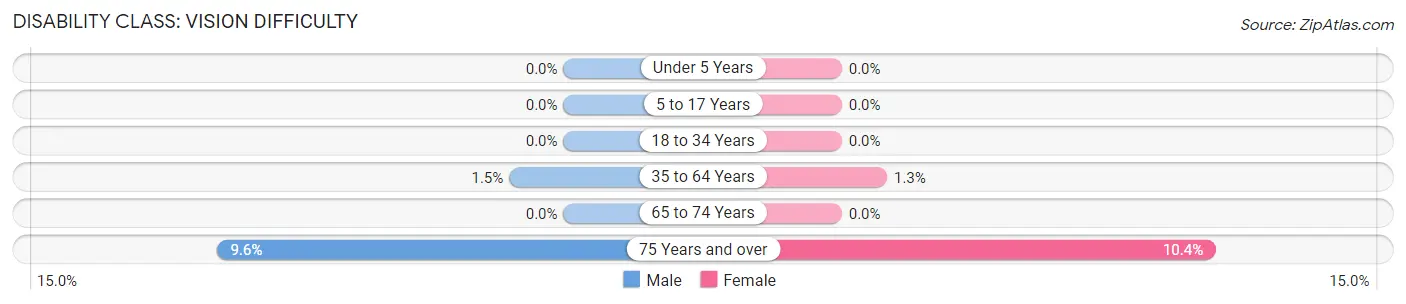
| Age Bracket | Male | Female |
| Under 5 Years | 0 (0.0%) | 0 (0.0%) |
| 5 to 17 Years | 0 (0.0%) | 0 (0.0%) |
| 18 to 34 Years | 0 (0.0%) | 0 (0.0%) |
| 35 to 64 Years | 15 (1.5%) | 11 (1.3%) |
| 65 to 74 Years | 0 (0.0%) | 0 (0.0%) |
| 75 Years and over | 21 (9.6%) | 40 (10.4%) |
Disability Class: Cognitive Difficulty
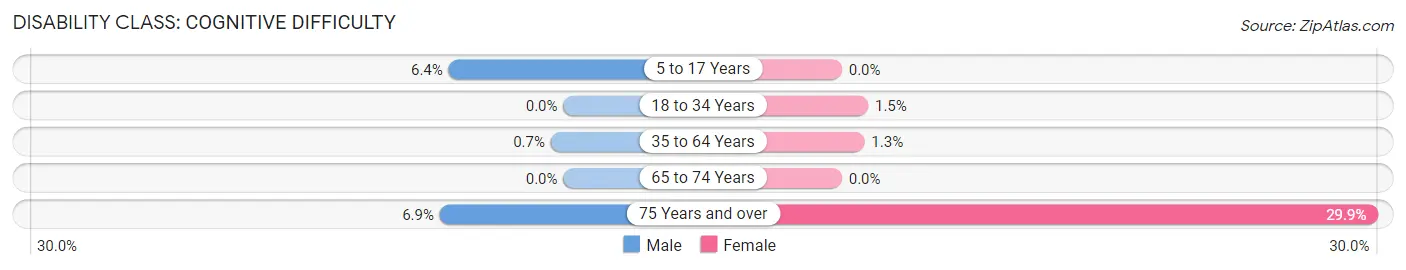
| Age Bracket | Male | Female |
| 5 to 17 Years | 47 (6.4%) | 0 (0.0%) |
| 18 to 34 Years | 0 (0.0%) | 6 (1.5%) |
| 35 to 64 Years | 7 (0.7%) | 11 (1.3%) |
| 65 to 74 Years | 0 (0.0%) | 0 (0.0%) |
| 75 Years and over | 15 (6.9%) | 115 (29.9%) |
Disability Class: Ambulatory Difficulty
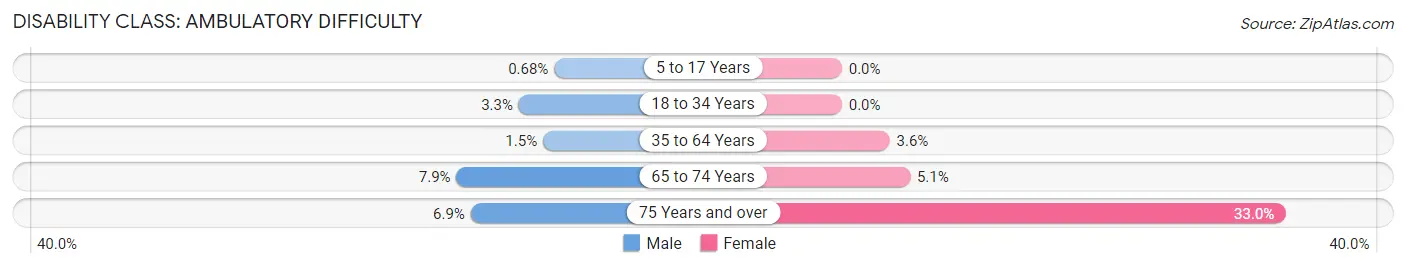
| Age Bracket | Male | Female |
| 5 to 17 Years | 5 (0.7%) | 0 (0.0%) |
| 18 to 34 Years | 18 (3.3%) | 0 (0.0%) |
| 35 to 64 Years | 15 (1.5%) | 31 (3.5%) |
| 65 to 74 Years | 17 (7.9%) | 4 (5.1%) |
| 75 Years and over | 15 (6.9%) | 127 (33.0%) |
Disability Class: Self-Care Difficulty
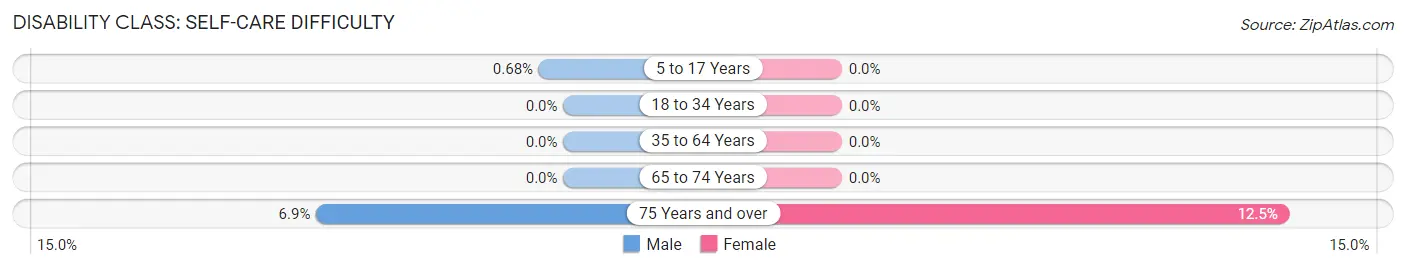
| Age Bracket | Male | Female |
| 5 to 17 Years | 5 (0.7%) | 0 (0.0%) |
| 18 to 34 Years | 0 (0.0%) | 0 (0.0%) |
| 35 to 64 Years | 0 (0.0%) | 0 (0.0%) |
| 65 to 74 Years | 0 (0.0%) | 0 (0.0%) |
| 75 Years and over | 15 (6.9%) | 48 (12.5%) |
Technology Access in Dripping Springs
Computing Device Access in Dripping Springs
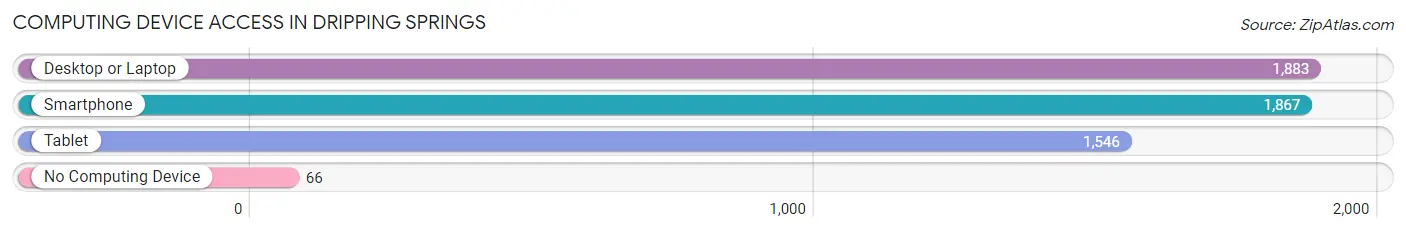
| Device Type | # Households | % Households |
| Desktop or Laptop | 1,883 | 92.1% |
| Smartphone | 1,867 | 91.3% |
| Tablet | 1,546 | 75.6% |
| No Computing Device | 66 | 3.2% |
| Total | 2,044 | 100.0% |
Internet Access in Dripping Springs
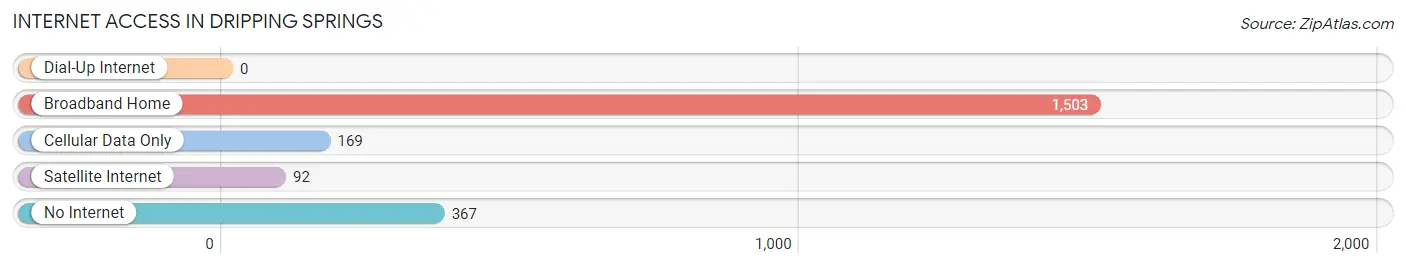
| Internet Type | # Households | % Households |
| Dial-Up Internet | 0 | 0.0% |
| Broadband Home | 1,503 | 73.5% |
| Cellular Data Only | 169 | 8.3% |
| Satellite Internet | 92 | 4.5% |
| No Internet | 367 | 17.9% |
| Total | 2,044 | 100.0% |
Dripping Springs Summary
Dripping Springs is a city located in Hays County, Texas, United States. It is located about 25 miles west of Austin and is part of the Austin–Round Rock–San Marcos metropolitan area. The population was 1,788 at the 2010 census.
History
The area around Dripping Springs was first settled in the 1850s by German and Anglo settlers. The town was named for a spring that dripped water from a limestone outcropping. The spring was used by Native Americans and early settlers for its healing properties.
The first post office was established in 1854, and the town was officially incorporated in 1950. The city was known for its many saloons and dance halls, which were popular with cowboys and ranchers.
Geography
Dripping Springs is located at 30°10'25" North, 98°05'17" West (30.173611, -98.088194). According to the United States Census Bureau, the city has a total area of 2.2 square miles, all of it land.
Economy
Dripping Springs is a small town with a population of just over 1,700 people. The economy is largely based on tourism, with many visitors coming to the area to enjoy the natural beauty of the Hill Country. The city is also home to several wineries, breweries, and distilleries, as well as a number of restaurants and shops.
Demographics
As of the census of 2000, there were 1,788 people, 645 households, and 486 families residing in the city. The population density was 809.3 people per square mile (312.7/km2). There were 690 housing units at an average density of 311.7 per square mile (120.3/km2). The racial makeup of the city was 87.9% White, 0.7% African American, 0.3% Native American, 0.3% Asian, 0.1% Pacific Islander, 8.9% from other races, and 2.0% from two or more races. Hispanic or Latino of any race were 18.2% of the population.
There were 645 households, out of which 37.2% had children under the age of 18 living with them, 58.2% were married couples living together, 10.2% had a female householder with no husband present, and 27.2% were non-families. 22.2% of all households were made up of individuals, and 8.2% had someone living alone who was 65 years of age or older. The average household size was 2.77 and the average family size was 3.27.
In the city, the population was spread out, with 28.7% under the age of 18, 7.2% from 18 to 24, 30.2% from 25 to 44, 22.7% from 45 to 64, and 11.2% who were 65 years of age or older. The median age was 36 years. For every 100 females, there were 97.2 males. For every 100 females age 18 and over, there were 94.2 males.
The median income for a household in the city was $45,000, and the median income for a family was $50,000. Males had a median income of $35,000 versus $25,000 for females. The per capita income for the city was $20,000. About 6.2% of families and 8.2% of the population were below the poverty line, including 10.2% of those under age 18 and 6.2% of those age 65 or over.
Common Questions
What is Per Capita Income in Dripping Springs?
Per Capita income in Dripping Springs is $53,697.
What is the Median Family Income in Dripping Springs?
Median Family Income in Dripping Springs is $121,985.
What is the Median Household income in Dripping Springs?
Median Household Income in Dripping Springs is $104,141.
What is Income or Wage Gap in Dripping Springs?
Income or Wage Gap in Dripping Springs is 47.3%.
Women in Dripping Springs earn 52.7 cents for every dollar earned by a man.
What is Inequality or Gini Index in Dripping Springs?
Inequality or Gini Index in Dripping Springs is 0.44.
What is the Total Population of Dripping Springs?
Total Population of Dripping Springs is 5,495.
What is the Total Male Population of Dripping Springs?
Total Male Population of Dripping Springs is 2,817.
What is the Total Female Population of Dripping Springs?
Total Female Population of Dripping Springs is 2,678.
What is the Ratio of Males per 100 Females in Dripping Springs?
There are 105.19 Males per 100 Females in Dripping Springs.
What is the Ratio of Females per 100 Males in Dripping Springs?
There are 95.07 Females per 100 Males in Dripping Springs.
What is the Median Population Age in Dripping Springs?
Median Population Age in Dripping Springs is 36.6 Years.
What is the Average Family Size in Dripping Springs
Average Family Size in Dripping Springs is 3.2 People.
What is the Average Household Size in Dripping Springs
Average Household Size in Dripping Springs is 2.6 People.
How Large is the Labor Force in Dripping Springs?
There are 2,547 People in the Labor Forcein in Dripping Springs.
What is the Percentage of People in the Labor Force in Dripping Springs?
64.4% of People are in the Labor Force in Dripping Springs.
What is the Unemployment Rate in Dripping Springs?
Unemployment Rate in Dripping Springs is 3.3%.