Pecan Hill, TX Map & Demographics
Pecan Hill Map
Pecan Hill Overview
$38,940
PER CAPITA INCOME
$101,989
AVG FAMILY INCOME
$101,705
AVG HOUSEHOLD INCOME
9.5%
WAGE / INCOME GAP [ % ]
90.5¢/ $1
WAGE / INCOME GAP [ $ ]
0.34
INEQUALITY / GINI INDEX
684
TOTAL POPULATION
378
MALE POPULATION
306
FEMALE POPULATION
123.53
MALES / 100 FEMALES
80.95
FEMALES / 100 MALES
48.5
MEDIAN AGE
3.1
AVG FAMILY SIZE
3.0
AVG HOUSEHOLD SIZE
374
LABOR FORCE [ PEOPLE ]
63.1%
PERCENT IN LABOR FORCE
3.2%
UNEMPLOYMENT RATE
Income in Pecan Hill
Income Overview in Pecan Hill
Per Capita Income in Pecan Hill is $38,940, while median incomes of families and households are $101,989 and $101,705 respectively.
| Characteristic | Number | Measure |
| Per Capita Income | 684 | $38,940 |
| Median Family Income | 201 | $101,989 |
| Mean Family Income | 201 | $121,294 |
| Median Household Income | 232 | $101,705 |
| Mean Household Income | 232 | $113,855 |
| Income Deficit | 201 | $0 |
| Wage / Income Gap (%) | 684 | 9.49% |
| Wage / Income Gap ($) | 684 | 90.51¢ per $1 |
| Gini / Inequality Index | 684 | 0.34 |
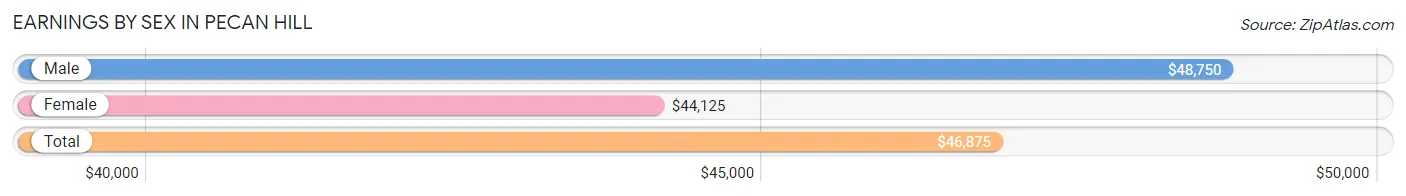
Earnings by Sex in Pecan Hill
Average Earnings in Pecan Hill are $46,875, $48,750 for men and $44,125 for women, a difference of 9.5%.
| Sex | Number | Average Earnings |
| Male | 213 (56.0%) | $48,750 |
| Female | 167 (44.0%) | $44,125 |
| Total | 380 (100.0%) | $46,875 |
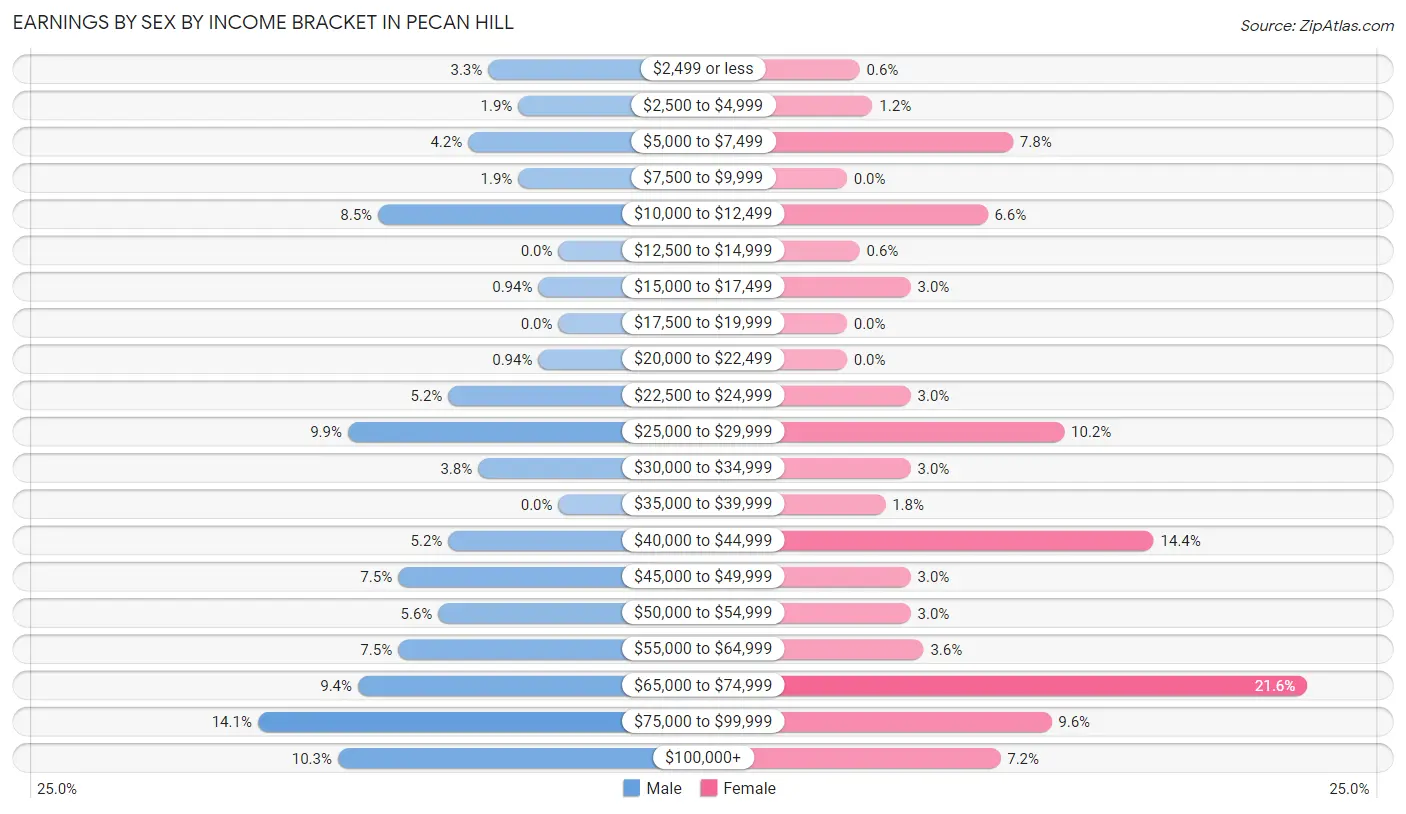
Earnings by Sex by Income Bracket in Pecan Hill
The most common earnings brackets in Pecan Hill are $75,000 to $99,999 for men (30 | 14.1%) and $65,000 to $74,999 for women (36 | 21.6%).
| Income | Male | Female |
| $2,499 or less | 7 (3.3%) | 1 (0.6%) |
| $2,500 to $4,999 | 4 (1.9%) | 2 (1.2%) |
| $5,000 to $7,499 | 9 (4.2%) | 13 (7.8%) |
| $7,500 to $9,999 | 4 (1.9%) | 0 (0.0%) |
| $10,000 to $12,499 | 18 (8.5%) | 11 (6.6%) |
| $12,500 to $14,999 | 0 (0.0%) | 1 (0.6%) |
| $15,000 to $17,499 | 2 (0.9%) | 5 (3.0%) |
| $17,500 to $19,999 | 0 (0.0%) | 0 (0.0%) |
| $20,000 to $22,499 | 2 (0.9%) | 0 (0.0%) |
| $22,500 to $24,999 | 11 (5.2%) | 5 (3.0%) |
| $25,000 to $29,999 | 21 (9.9%) | 17 (10.2%) |
| $30,000 to $34,999 | 8 (3.8%) | 5 (3.0%) |
| $35,000 to $39,999 | 0 (0.0%) | 3 (1.8%) |
| $40,000 to $44,999 | 11 (5.2%) | 24 (14.4%) |
| $45,000 to $49,999 | 16 (7.5%) | 5 (3.0%) |
| $50,000 to $54,999 | 12 (5.6%) | 5 (3.0%) |
| $55,000 to $64,999 | 16 (7.5%) | 6 (3.6%) |
| $65,000 to $74,999 | 20 (9.4%) | 36 (21.6%) |
| $75,000 to $99,999 | 30 (14.1%) | 16 (9.6%) |
| $100,000+ | 22 (10.3%) | 12 (7.2%) |
| Total | 213 (100.0%) | 167 (100.0%) |
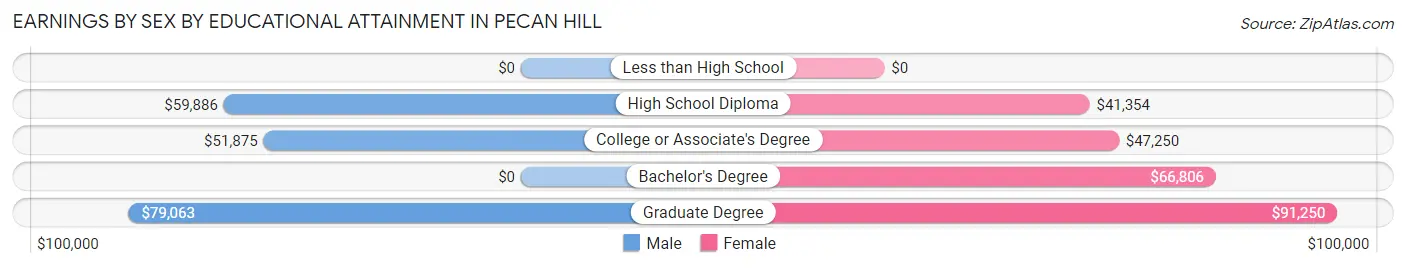
Earnings by Sex by Educational Attainment in Pecan Hill
Average earnings in Pecan Hill are $58,182 for men and $53,250 for women, a difference of 8.5%. Men with an educational attainment of graduate degree enjoy the highest average annual earnings of $79,063, while those with college or associate's degree education earn the least with $51,875. Women with an educational attainment of graduate degree earn the most with the average annual earnings of $91,250, while those with high school diploma education have the smallest earnings of $41,354.
| Educational Attainment | Male Income | Female Income |
| Less than High School | - | - |
| High School Diploma | $59,886 | $41,354 |
| College or Associate's Degree | $51,875 | $47,250 |
| Bachelor's Degree | - | - |
| Graduate Degree | $79,063 | $91,250 |
| Total | $58,182 | $53,250 |
Family Income in Pecan Hill
Family Income Brackets in Pecan Hill
According to the Pecan Hill family income data, there are 69 families falling into the $100,000 to $149,999 income range, which is the most common income bracket and makes up 34.3% of all families.
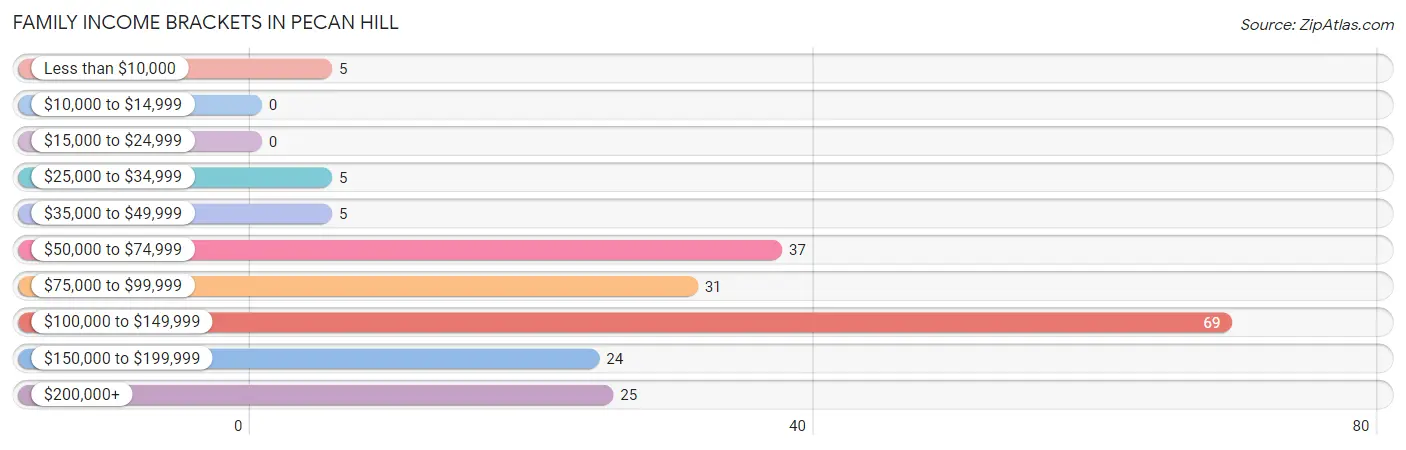
| Income Bracket | # Families | % Families |
| Less than $10,000 | 5 | 2.5% |
| $10,000 to $14,999 | 0 | 0.0% |
| $15,000 to $24,999 | 0 | 0.0% |
| $25,000 to $34,999 | 5 | 2.5% |
| $35,000 to $49,999 | 5 | 2.5% |
| $50,000 to $74,999 | 37 | 18.4% |
| $75,000 to $99,999 | 31 | 15.4% |
| $100,000 to $149,999 | 69 | 34.3% |
| $150,000 to $199,999 | 24 | 11.9% |
| $200,000+ | 25 | 12.4% |
Family Income by Famaliy Size in Pecan Hill
6-person families (11 | 5.5%) account for the highest median family income in Pecan Hill with $169,375 per family, while 2-person families (108 | 53.7%) have the highest median income of $46,979 per family member.
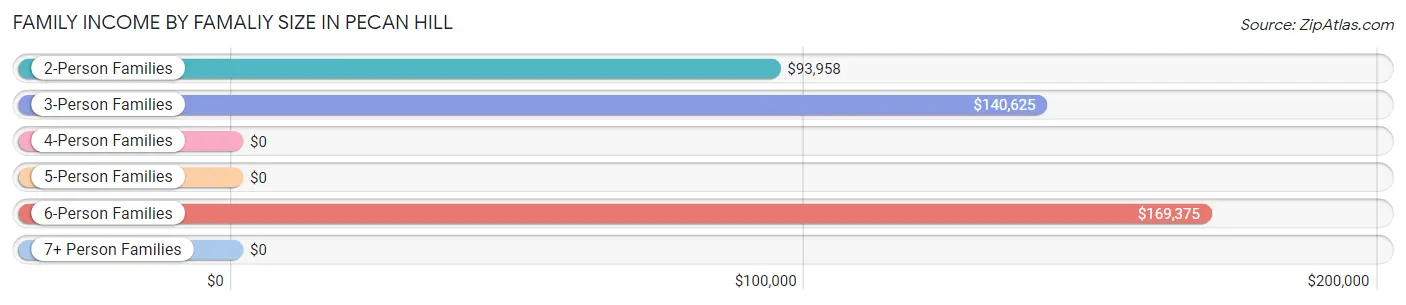
| Income Bracket | # Families | Median Income |
| 2-Person Families | 108 (53.7%) | $93,958 |
| 3-Person Families | 37 (18.4%) | $140,625 |
| 4-Person Families | 23 (11.4%) | $0 |
| 5-Person Families | 22 (11.0%) | $0 |
| 6-Person Families | 11 (5.5%) | $169,375 |
| 7+ Person Families | 0 (0.0%) | $0 |
| Total | 201 (100.0%) | $101,989 |
Family Income by Number of Earners in Pecan Hill
The median family income in Pecan Hill is $101,989, with families comprising 3+ earners (29) having the highest median family income of $185,417, while families with no earners (34) have the lowest median family income of $73,750, accounting for 14.4% and 16.9% of families, respectively.
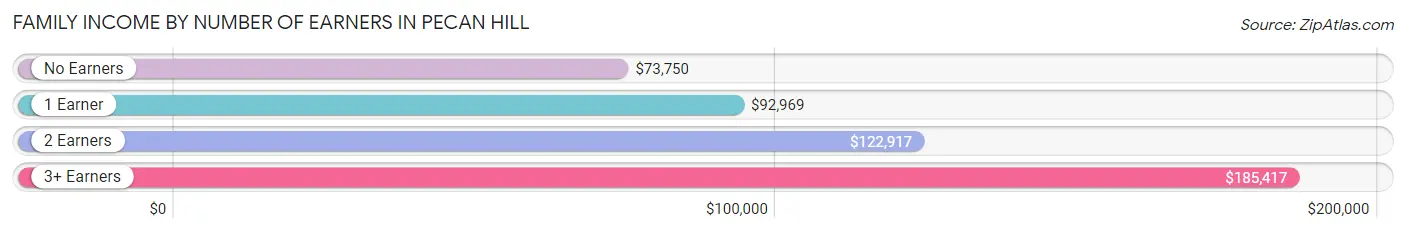
| Number of Earners | # Families | Median Income |
| No Earners | 34 (16.9%) | $73,750 |
| 1 Earner | 43 (21.4%) | $92,969 |
| 2 Earners | 95 (47.3%) | $122,917 |
| 3+ Earners | 29 (14.4%) | $185,417 |
| Total | 201 (100.0%) | $101,989 |
Household Income in Pecan Hill
Household Income Brackets in Pecan Hill
With 78 households falling in the category, the $100,000 to $149,999 income range is the most frequent in Pecan Hill, accounting for 33.6% of all households. In contrast, only 4 households (1.7%) fall into the $10,000 to $14,999 income bracket, making it the least populous group.
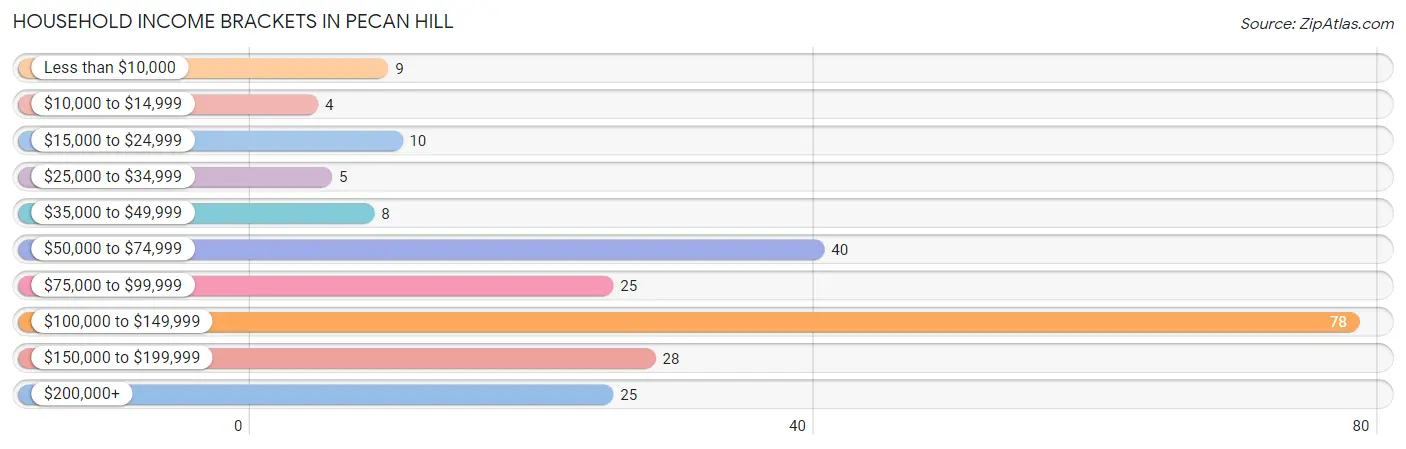
| Income Bracket | # Households | % Households |
| Less than $10,000 | 9 | 3.9% |
| $10,000 to $14,999 | 4 | 1.7% |
| $15,000 to $24,999 | 10 | 4.3% |
| $25,000 to $34,999 | 5 | 2.2% |
| $35,000 to $49,999 | 8 | 3.4% |
| $50,000 to $74,999 | 40 | 17.2% |
| $75,000 to $99,999 | 25 | 10.8% |
| $100,000 to $149,999 | 78 | 33.6% |
| $150,000 to $199,999 | 28 | 12.1% |
| $200,000+ | 25 | 10.8% |
Household Income by Householder Age in Pecan Hill
The median household income in Pecan Hill is $101,705, with the highest median household income of $123,611 found in the 45 to 64 years age bracket for the primary householder. A total of 104 households (44.8%) fall into this category.
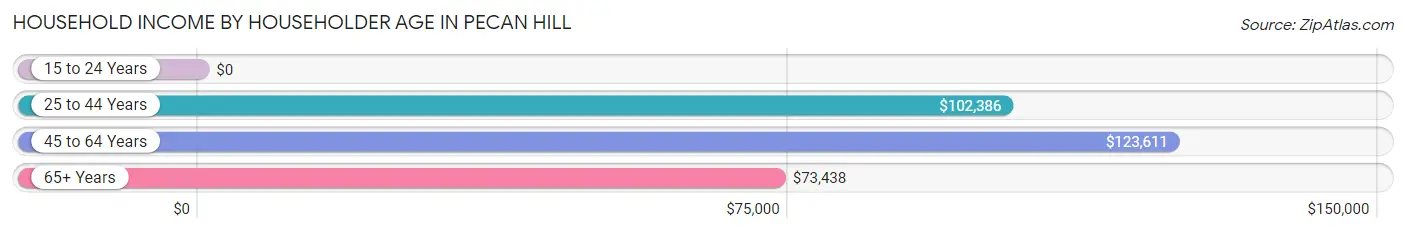
| Income Bracket | # Households | Median Income |
| 15 to 24 Years | 0 (0.0%) | $0 |
| 25 to 44 Years | 53 (22.8%) | $102,386 |
| 45 to 64 Years | 104 (44.8%) | $123,611 |
| 65+ Years | 75 (32.3%) | $73,438 |
| Total | 232 (100.0%) | $101,705 |
Poverty in Pecan Hill
Income Below Poverty by Sex and Age in Pecan Hill
With 4.0% poverty level for males and 4.6% for females among the residents of Pecan Hill, 16 and 17 year old males and 25 to 34 year old females are the most vulnerable to poverty, with 2 males (100.0%) and 5 females (11.1%) in their respective age groups living below the poverty level.
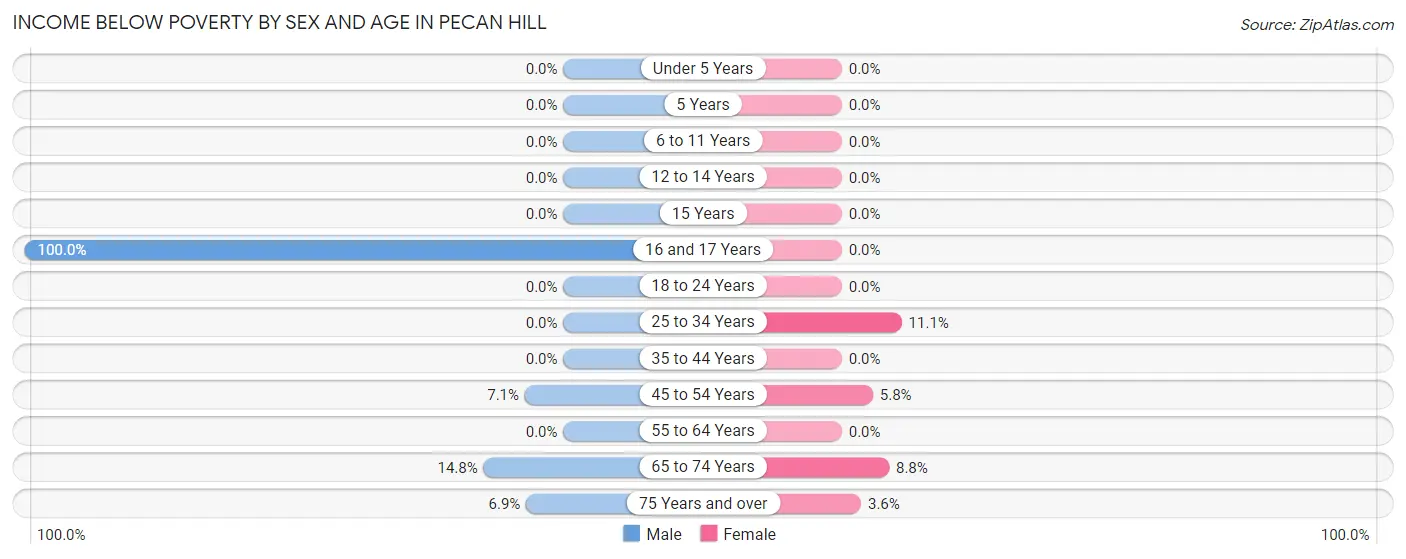
| Age Bracket | Male | Female |
| Under 5 Years | 0 (0.0%) | 0 (0.0%) |
| 5 Years | 0 (0.0%) | 0 (0.0%) |
| 6 to 11 Years | 0 (0.0%) | 0 (0.0%) |
| 12 to 14 Years | 0 (0.0%) | 0 (0.0%) |
| 15 Years | 0 (0.0%) | 0 (0.0%) |
| 16 and 17 Years | 2 (100.0%) | 0 (0.0%) |
| 18 to 24 Years | 0 (0.0%) | 0 (0.0%) |
| 25 to 34 Years | 0 (0.0%) | 5 (11.1%) |
| 35 to 44 Years | 0 (0.0%) | 0 (0.0%) |
| 45 to 54 Years | 3 (7.1%) | 3 (5.8%) |
| 55 to 64 Years | 0 (0.0%) | 0 (0.0%) |
| 65 to 74 Years | 8 (14.8%) | 5 (8.8%) |
| 75 Years and over | 2 (6.9%) | 1 (3.6%) |
| Total | 15 (4.0%) | 14 (4.6%) |
Income Above Poverty by Sex and Age in Pecan Hill
According to the poverty statistics in Pecan Hill, males aged under 5 years and females aged under 5 years are the age groups that are most secure financially, with 100.0% of males and 100.0% of females in these age groups living above the poverty line.
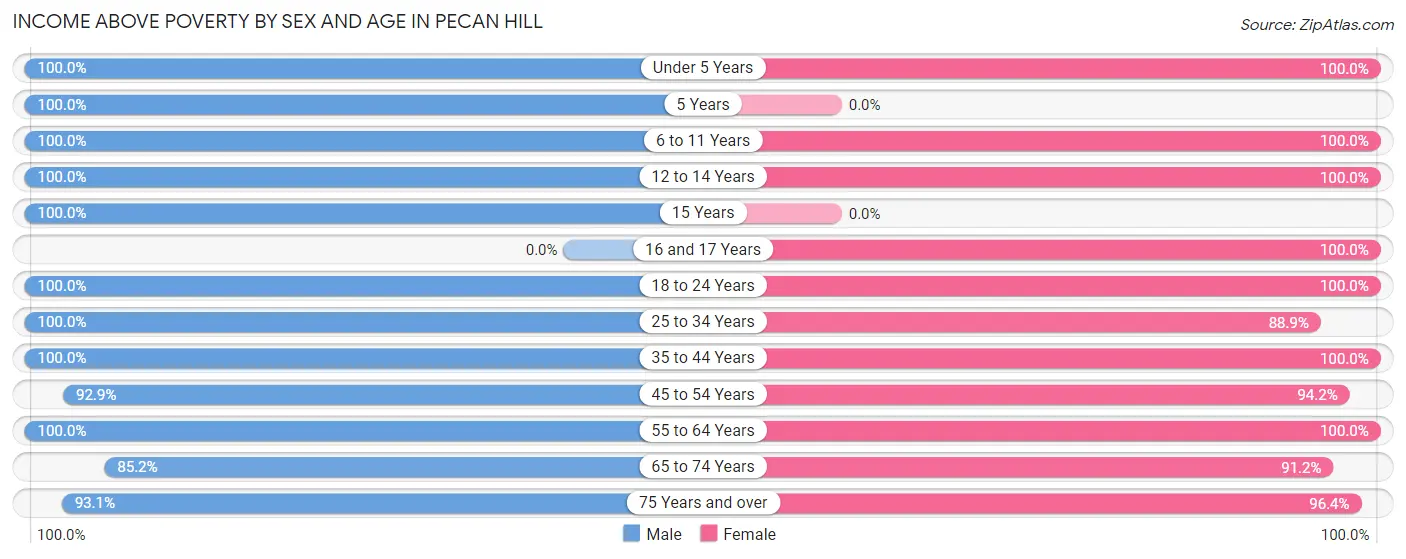
| Age Bracket | Male | Female |
| Under 5 Years | 15 (100.0%) | 9 (100.0%) |
| 5 Years | 4 (100.0%) | 0 (0.0%) |
| 6 to 11 Years | 19 (100.0%) | 6 (100.0%) |
| 12 to 14 Years | 25 (100.0%) | 7 (100.0%) |
| 15 Years | 4 (100.0%) | 0 (0.0%) |
| 16 and 17 Years | 0 (0.0%) | 13 (100.0%) |
| 18 to 24 Years | 54 (100.0%) | 12 (100.0%) |
| 25 to 34 Years | 41 (100.0%) | 40 (88.9%) |
| 35 to 44 Years | 38 (100.0%) | 32 (100.0%) |
| 45 to 54 Years | 39 (92.9%) | 49 (94.2%) |
| 55 to 64 Years | 49 (100.0%) | 45 (100.0%) |
| 65 to 74 Years | 46 (85.2%) | 52 (91.2%) |
| 75 Years and over | 27 (93.1%) | 27 (96.4%) |
| Total | 361 (96.0%) | 292 (95.4%) |
Income Below Poverty Among Married-Couple Families in Pecan Hill
The poverty statistics for married-couple families in Pecan Hill show that 2.9% or 5 of the total 170 families live below the poverty line. Families with no children have the highest poverty rate of 3.7%, comprising of 5 families. On the other hand, families with 1 or 2 children have the lowest poverty rate of 0.0%, which includes 0 families.
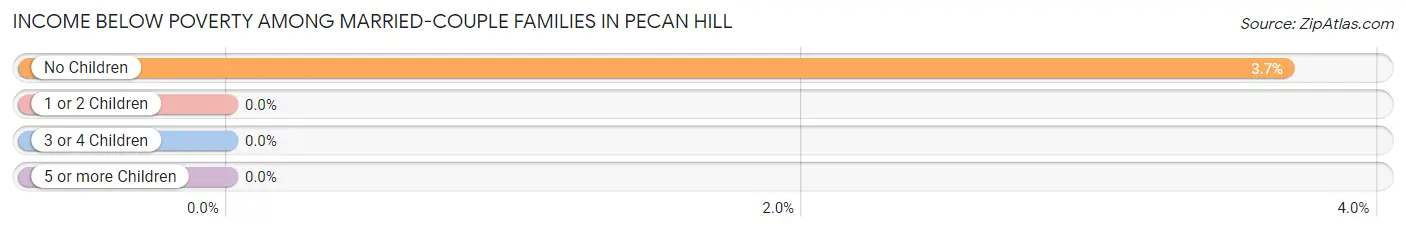
| Children | Above Poverty | Below Poverty |
| No Children | 131 (96.3%) | 5 (3.7%) |
| 1 or 2 Children | 18 (100.0%) | 0 (0.0%) |
| 3 or 4 Children | 16 (100.0%) | 0 (0.0%) |
| 5 or more Children | 0 (0.0%) | 0 (0.0%) |
| Total | 165 (97.1%) | 5 (2.9%) |
Income Below Poverty Among Single-Parent Households in Pecan Hill
| Children | Single Father | Single Mother |
| No Children | 0 (0.0%) | 0 (0.0%) |
| 1 or 2 Children | 0 (0.0%) | 0 (0.0%) |
| 3 or 4 Children | 0 (0.0%) | 0 (0.0%) |
| 5 or more Children | 0 (0.0%) | 0 (0.0%) |
| Total | 0 (0.0%) | 0 (0.0%) |
Income Below Poverty Among Married-Couple vs Single-Parent Households in Pecan Hill
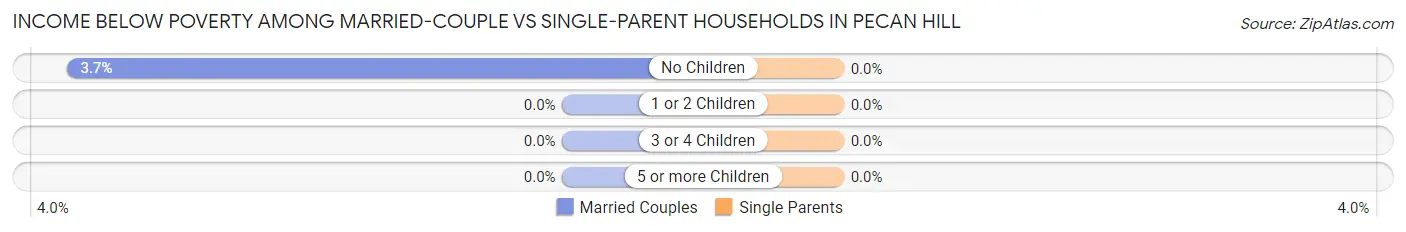
| Children | Married-Couple Families | Single-Parent Households |
| No Children | 5 (3.7%) | 0 (0.0%) |
| 1 or 2 Children | 0 (0.0%) | 0 (0.0%) |
| 3 or 4 Children | 0 (0.0%) | 0 (0.0%) |
| 5 or more Children | 0 (0.0%) | 0 (0.0%) |
| Total | 5 (2.9%) | 0 (0.0%) |
Race in Pecan Hill
The most populous races in Pecan Hill are White / Caucasian (538 | 78.6%), Hispanic or Latino (189 | 27.6%), and Some other Race (44 | 6.4%).
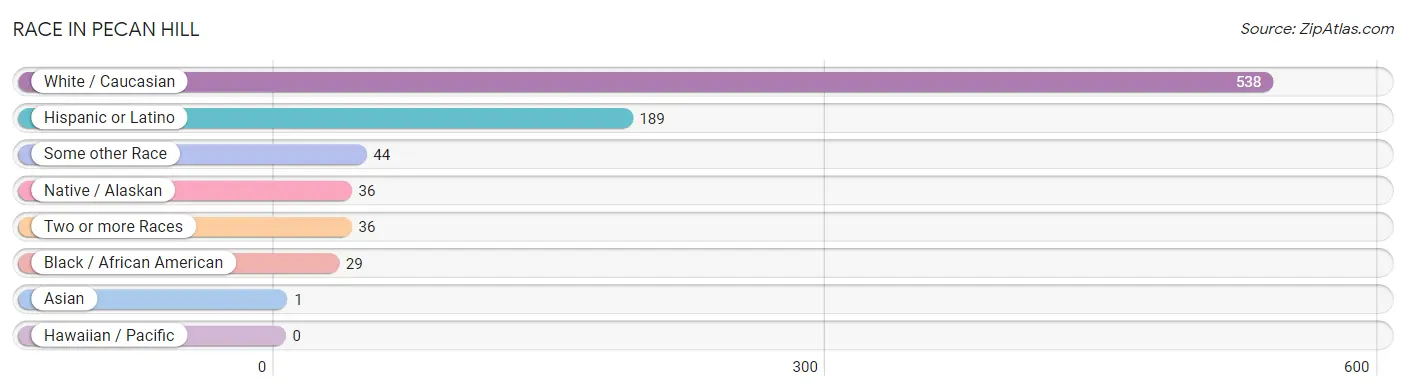
| Race | # Population | % Population |
| Asian | 1 | 0.2% |
| Black / African American | 29 | 4.2% |
| Hawaiian / Pacific | 0 | 0.0% |
| Hispanic or Latino | 189 | 27.6% |
| Native / Alaskan | 36 | 5.3% |
| White / Caucasian | 538 | 78.6% |
| Two or more Races | 36 | 5.3% |
| Some other Race | 44 | 6.4% |
| Total | 684 | 100.0% |
Ancestry in Pecan Hill
The most populous ancestries reported in Pecan Hill are Mexican (167 | 24.4%), German (85 | 12.4%), Irish (75 | 11.0%), Italian (63 | 9.2%), and American (61 | 8.9%), together accounting for 65.9% of all Pecan Hill residents.
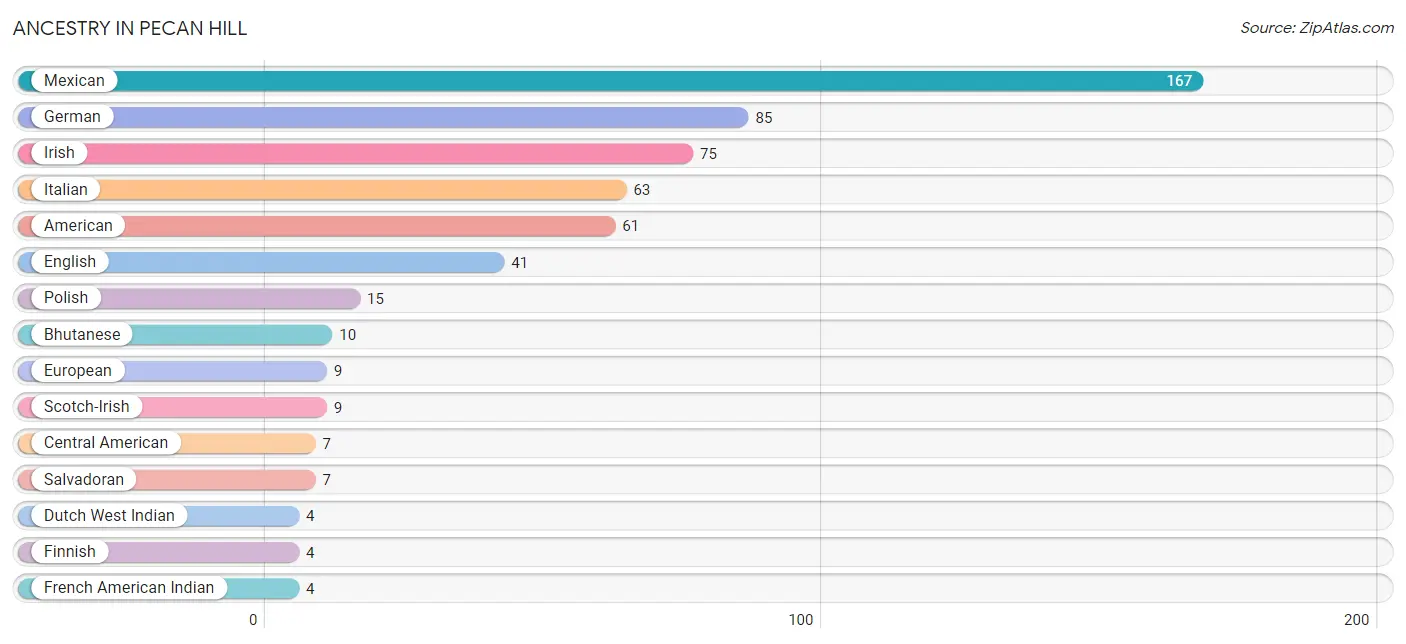
| Ancestry | # Population | % Population |
| American | 61 | 8.9% |
| Bhutanese | 10 | 1.5% |
| Blackfeet | 2 | 0.3% |
| British | 2 | 0.3% |
| Canadian | 2 | 0.3% |
| Central American | 7 | 1.0% |
| Cherokee | 2 | 0.3% |
| Chickasaw | 1 | 0.2% |
| Dutch | 3 | 0.4% |
| Dutch West Indian | 4 | 0.6% |
| English | 41 | 6.0% |
| European | 9 | 1.3% |
| Finnish | 4 | 0.6% |
| French | 3 | 0.4% |
| French American Indian | 4 | 0.6% |
| French Canadian | 2 | 0.3% |
| German | 85 | 12.4% |
| Irish | 75 | 11.0% |
| Italian | 63 | 9.2% |
| Korean | 4 | 0.6% |
| Mexican | 167 | 24.4% |
| Mexican American Indian | 4 | 0.6% |
| Norwegian | 3 | 0.4% |
| Polish | 15 | 2.2% |
| Puerto Rican | 3 | 0.4% |
| Salvadoran | 7 | 1.0% |
| Scandinavian | 2 | 0.3% |
| Scotch-Irish | 9 | 1.3% |
| Swiss | 3 | 0.4% | View All 29 Rows |
Immigrants in Pecan Hill
The most numerous immigrant groups reported in Pecan Hill came from Central America (37 | 5.4%), Latin America (37 | 5.4%), Mexico (37 | 5.4%), Asia (4 | 0.6%), and China (4 | 0.6%), together accounting for 17.4% of all Pecan Hill residents.
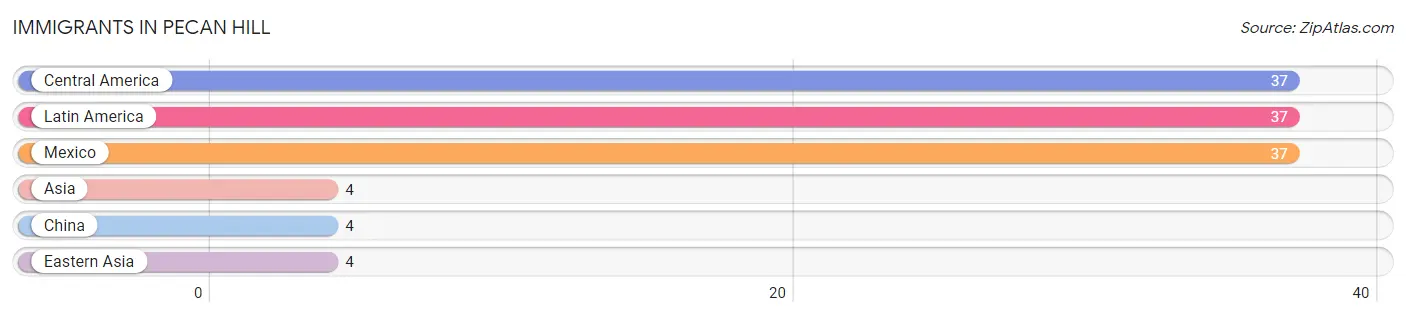
| Immigration Origin | # Population | % Population |
| Asia | 4 | 0.6% |
| Central America | 37 | 5.4% |
| China | 4 | 0.6% |
| Eastern Asia | 4 | 0.6% |
| Latin America | 37 | 5.4% |
| Mexico | 37 | 5.4% | View All 6 Rows |
Sex and Age in Pecan Hill
Sex and Age in Pecan Hill
The most populous age groups in Pecan Hill are 50 to 54 Years (36 | 9.5%) for men and 65 to 69 Years (37 | 12.1%) for women.
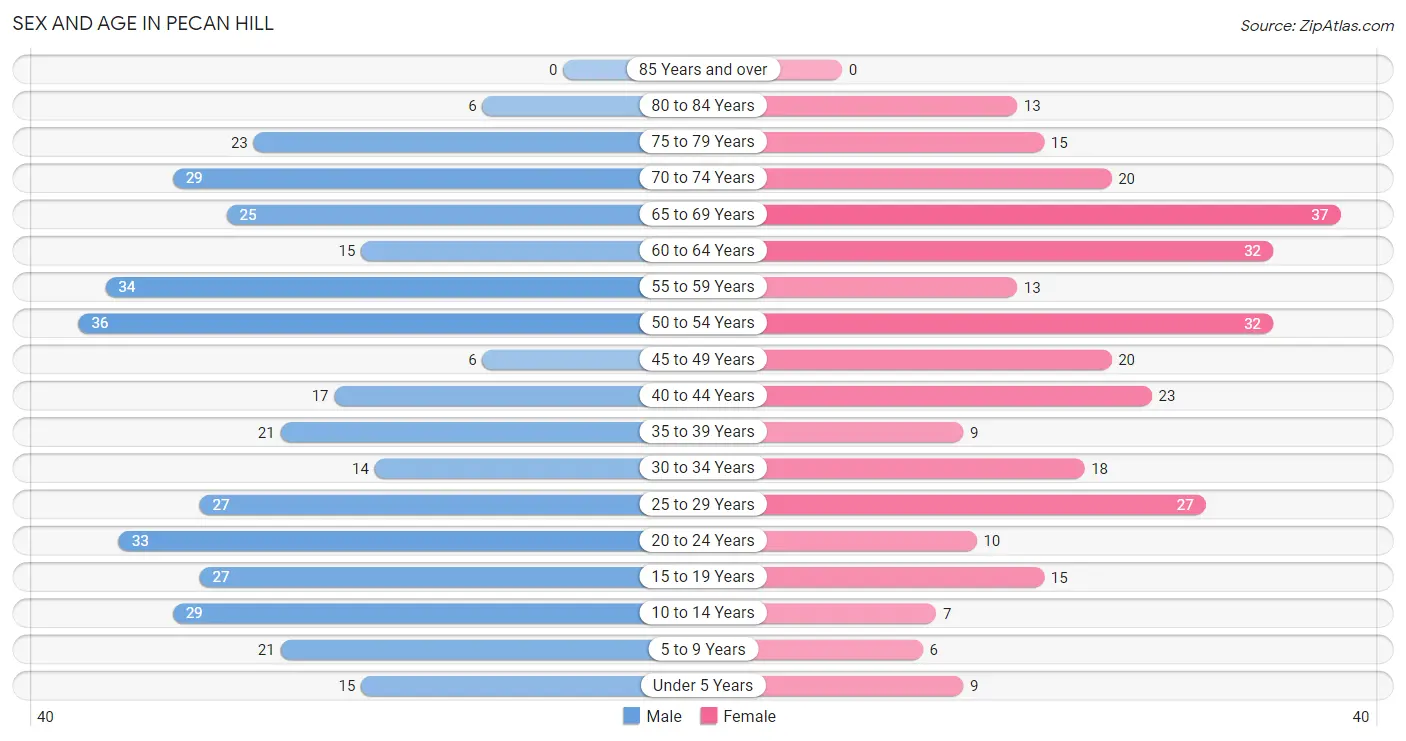
| Age Bracket | Male | Female |
| Under 5 Years | 15 (4.0%) | 9 (2.9%) |
| 5 to 9 Years | 21 (5.6%) | 6 (2.0%) |
| 10 to 14 Years | 29 (7.7%) | 7 (2.3%) |
| 15 to 19 Years | 27 (7.1%) | 15 (4.9%) |
| 20 to 24 Years | 33 (8.7%) | 10 (3.3%) |
| 25 to 29 Years | 27 (7.1%) | 27 (8.8%) |
| 30 to 34 Years | 14 (3.7%) | 18 (5.9%) |
| 35 to 39 Years | 21 (5.6%) | 9 (2.9%) |
| 40 to 44 Years | 17 (4.5%) | 23 (7.5%) |
| 45 to 49 Years | 6 (1.6%) | 20 (6.5%) |
| 50 to 54 Years | 36 (9.5%) | 32 (10.5%) |
| 55 to 59 Years | 34 (9.0%) | 13 (4.3%) |
| 60 to 64 Years | 15 (4.0%) | 32 (10.5%) |
| 65 to 69 Years | 25 (6.6%) | 37 (12.1%) |
| 70 to 74 Years | 29 (7.7%) | 20 (6.5%) |
| 75 to 79 Years | 23 (6.1%) | 15 (4.9%) |
| 80 to 84 Years | 6 (1.6%) | 13 (4.3%) |
| 85 Years and over | 0 (0.0%) | 0 (0.0%) |
| Total | 378 (100.0%) | 306 (100.0%) |
Families and Households in Pecan Hill
Median Family Size in Pecan Hill
The median family size in Pecan Hill is 3.14 persons per family, with single female/mother families (13 | 6.5%) accounting for the largest median family size of 5.31 persons per family. On the other hand, single male/father families (18 | 9.0%) represent the smallest median family size with 2.67 persons per family.
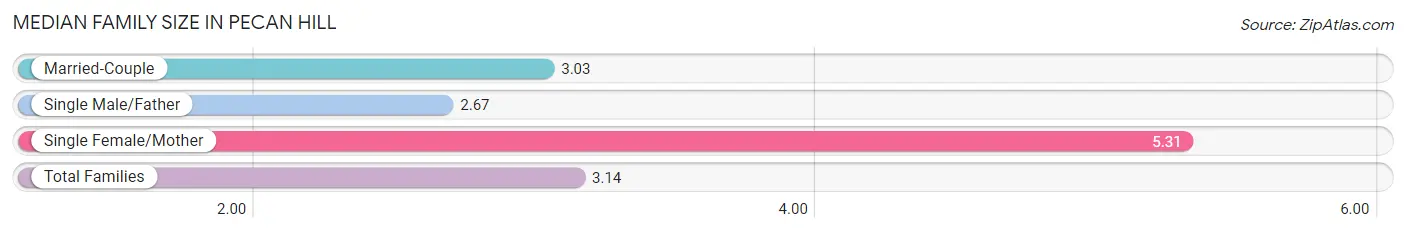
| Family Type | # Families | Family Size |
| Married-Couple | 170 (84.6%) | 3.03 |
| Single Male/Father | 18 (9.0%) | 2.67 |
| Single Female/Mother | 13 (6.5%) | 5.31 |
| Total Families | 201 (100.0%) | 3.14 |
Median Household Size in Pecan Hill
The median household size in Pecan Hill is 2.95 persons per household, with single female/mother households (13 | 5.6%) accounting for the largest median household size of 5.31 persons per household. non-family households (31 | 13.4%) represent the smallest median household size with 1.16 persons per household.
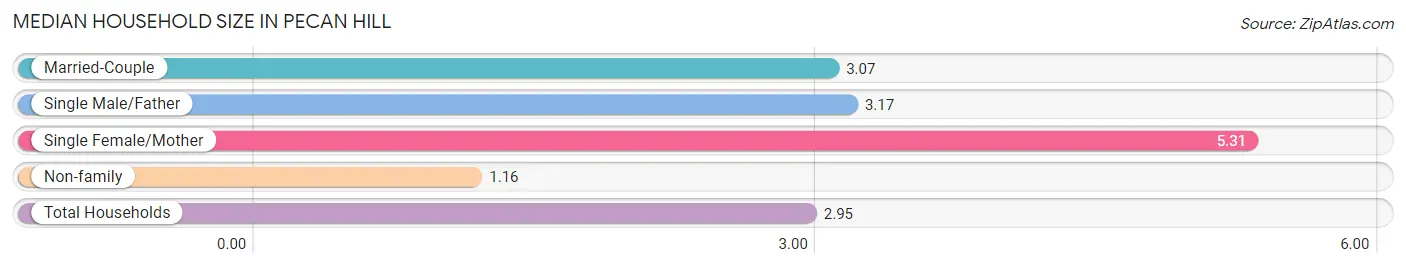
| Household Type | # Households | Household Size |
| Married-Couple | 170 (73.3%) | 3.07 |
| Single Male/Father | 18 (7.8%) | 3.17 |
| Single Female/Mother | 13 (5.6%) | 5.31 |
| Non-family | 31 (13.4%) | 1.16 |
| Total Households | 232 (100.0%) | 2.95 |
Household Size by Marriage Status in Pecan Hill
Out of a total of 232 households in Pecan Hill, 201 (86.6%) are family households, while 31 (13.4%) are nonfamily households. The most numerous type of family households are 2-person households, comprising 98, and the most common type of nonfamily households are 1-person households, comprising 27.
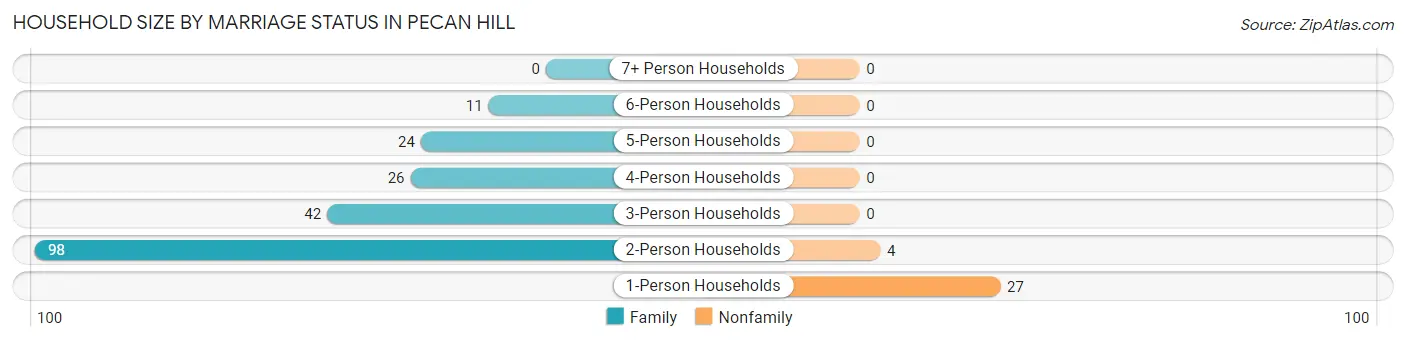
| Household Size | Family Households | Nonfamily Households |
| 1-Person Households | - | 27 (11.6%) |
| 2-Person Households | 98 (42.2%) | 4 (1.7%) |
| 3-Person Households | 42 (18.1%) | 0 (0.0%) |
| 4-Person Households | 26 (11.2%) | 0 (0.0%) |
| 5-Person Households | 24 (10.3%) | 0 (0.0%) |
| 6-Person Households | 11 (4.7%) | 0 (0.0%) |
| 7+ Person Households | 0 (0.0%) | 0 (0.0%) |
| Total | 201 (86.6%) | 31 (13.4%) |
Female Fertility in Pecan Hill
Fertility by Age in Pecan Hill
| Age Bracket | Women with Births | Births / 1,000 Women |
| 15 to 19 years | 0 (0.0%) | 0.0 |
| 20 to 34 years | 0 (0.0%) | 0.0 |
| 35 to 50 years | 0 (0.0%) | 0.0 |
| Total | 0 (0.0%) | 0.0 |
Fertility by Age by Marriage Status in Pecan Hill
| Age Bracket | Married | Unmarried |
| 15 to 19 years | 0 (0.0%) | 0 (0.0%) |
| 20 to 34 years | 0 (0.0%) | 0 (0.0%) |
| 35 to 50 years | 0 (0.0%) | 0 (0.0%) |
| Total | 0 (0.0%) | 0 (0.0%) |
Fertility by Education in Pecan Hill
| Educational Attainment | Women with Births | Births / 1,000 Women |
| Less than High School | 0 (0.0%) | 0.0 |
| High School Diploma | 0 (0.0%) | 0.0 |
| College or Associate's Degree | 0 (0.0%) | 0.0 |
| Bachelor's Degree | 0 (0.0%) | 0.0 |
| Graduate Degree | 0 (0.0%) | 0.0 |
| Total | 0 (0.0%) | 0.0 |
Fertility by Education by Marriage Status in Pecan Hill
| Educational Attainment | Married | Unmarried |
| Less than High School | 0 (0.0%) | 0 (0.0%) |
| High School Diploma | 0 (0.0%) | 0 (0.0%) |
| College or Associate's Degree | 0 (0.0%) | 0 (0.0%) |
| Bachelor's Degree | 0 (0.0%) | 0 (0.0%) |
| Graduate Degree | 0 (0.0%) | 0 (0.0%) |
| Total | 0 (0.0%) | 0 (0.0%) |
Employment Characteristics in Pecan Hill
Employment by Class of Employer in Pecan Hill
Among the 351 employed individuals in Pecan Hill, private company employees (229 | 65.2%), local government employees (45 | 12.8%), and not-for-profit organizations (25 | 7.1%) make up the most common classes of employment.
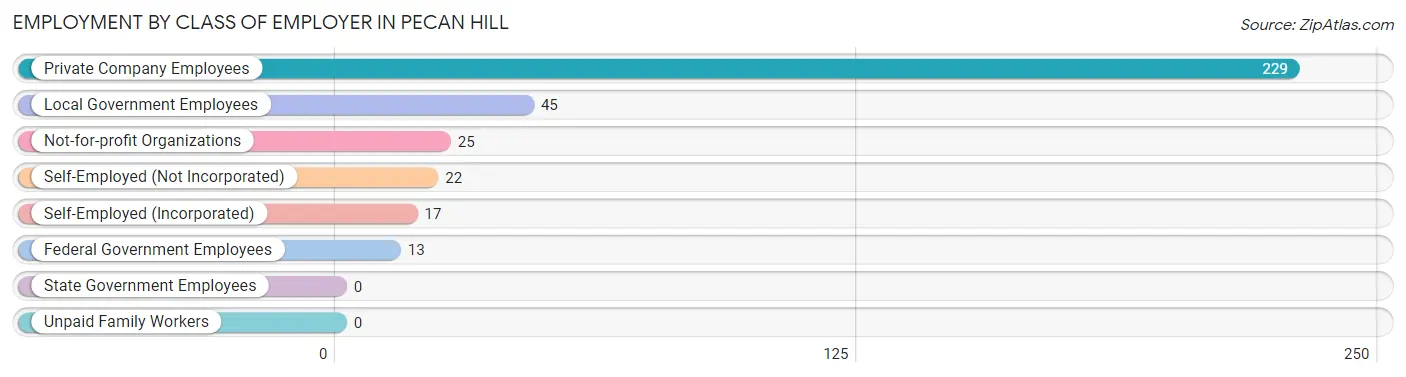
| Employer Class | # Employees | % Employees |
| Private Company Employees | 229 | 65.2% |
| Self-Employed (Incorporated) | 17 | 4.8% |
| Self-Employed (Not Incorporated) | 22 | 6.3% |
| Not-for-profit Organizations | 25 | 7.1% |
| Local Government Employees | 45 | 12.8% |
| State Government Employees | 0 | 0.0% |
| Federal Government Employees | 13 | 3.7% |
| Unpaid Family Workers | 0 | 0.0% |
| Total | 351 | 100.0% |
Employment Status by Age in Pecan Hill
According to the labor force statistics for Pecan Hill, out of the total population over 16 years of age (593), 63.1% or 374 individuals are in the labor force, with 3.2% or 12 of them unemployed. The age group with the highest labor force participation rate is 25 to 29 years, with 96.3% or 52 individuals in the labor force. Within the labor force, the 25 to 29 years age range has the highest percentage of unemployed individuals, with 23.1% or 12 of them being unemployed.
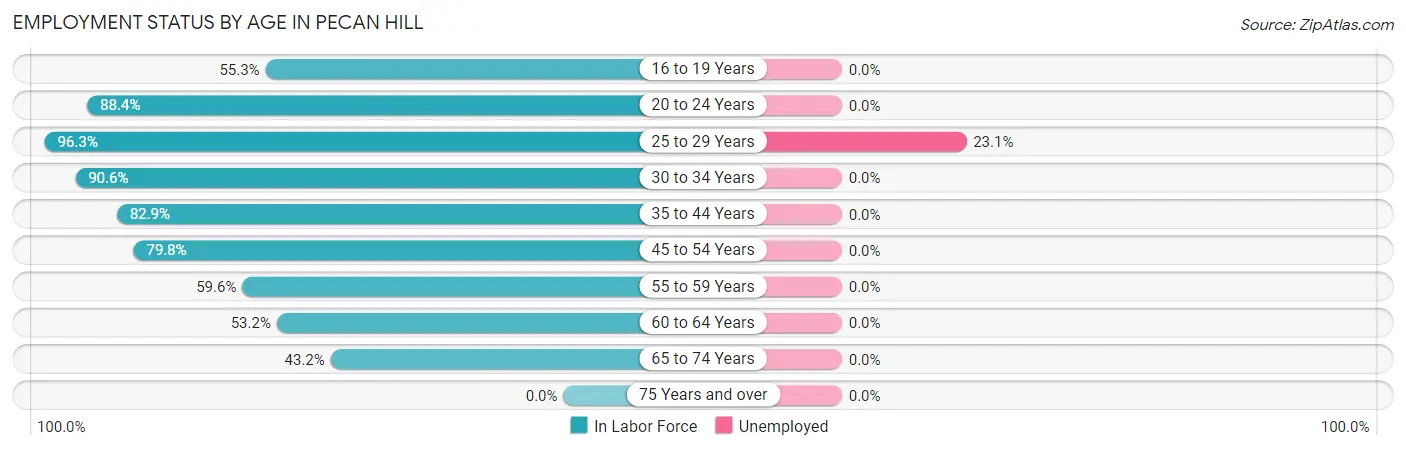
| Age Bracket | In Labor Force | Unemployed |
| 16 to 19 Years | 21 (55.3%) | 0 (0.0%) |
| 20 to 24 Years | 38 (88.4%) | 0 (0.0%) |
| 25 to 29 Years | 52 (96.3%) | 12 (23.1%) |
| 30 to 34 Years | 29 (90.6%) | 0 (0.0%) |
| 35 to 44 Years | 58 (82.9%) | 0 (0.0%) |
| 45 to 54 Years | 75 (79.8%) | 0 (0.0%) |
| 55 to 59 Years | 28 (59.6%) | 0 (0.0%) |
| 60 to 64 Years | 25 (53.2%) | 0 (0.0%) |
| 65 to 74 Years | 48 (43.2%) | 0 (0.0%) |
| 75 Years and over | 0 (0.0%) | 0 (0.0%) |
| Total | 374 (63.1%) | 12 (3.2%) |
Employment Status by Educational Attainment in Pecan Hill
According to labor force statistics for Pecan Hill, 77.6% of individuals (267) out of the total population between 25 and 64 years of age (344) are in the labor force, with 4.5% or 12 of them being unemployed. The group with the highest labor force participation rate are those with the educational attainment of college / associate degree, with 93.4% or 114 individuals in the labor force. Within the labor force, individuals with high school diploma education have the highest percentage of unemployment, with 13.0% or 12 of them being unemployed.
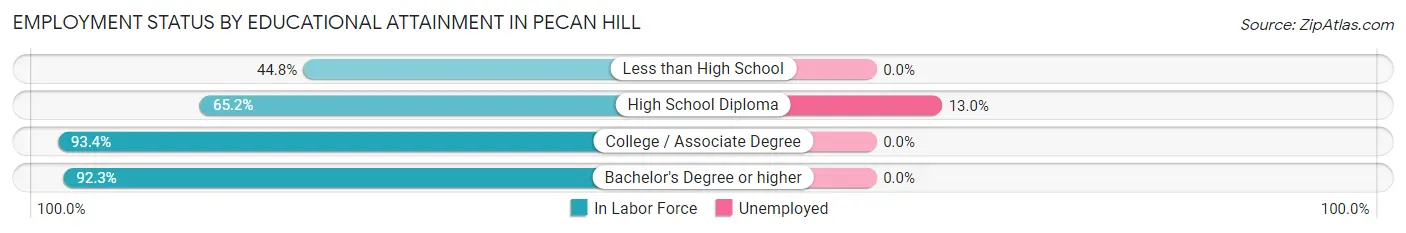
| Educational Attainment | In Labor Force | Unemployed |
| Less than High School | 13 (44.8%) | 0 (0.0%) |
| High School Diploma | 92 (65.2%) | 18 (13.0%) |
| College / Associate Degree | 114 (93.4%) | 0 (0.0%) |
| Bachelor's Degree or higher | 48 (92.3%) | 0 (0.0%) |
| Total | 267 (77.6%) | 15 (4.5%) |
Employment Occupations by Sex in Pecan Hill
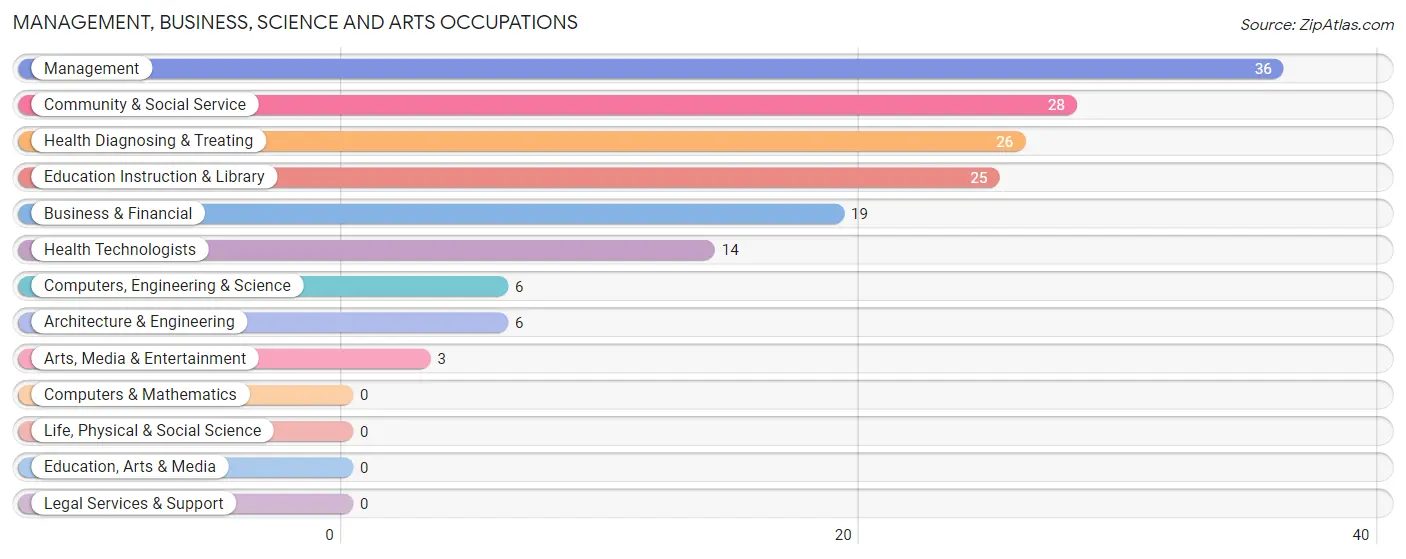
Management, Business, Science and Arts Occupations
The most common Management, Business, Science and Arts occupations in Pecan Hill are Management (36 | 9.9%), Community & Social Service (28 | 7.7%), Health Diagnosing & Treating (26 | 7.2%), Education Instruction & Library (25 | 6.9%), and Business & Financial (19 | 5.2%).
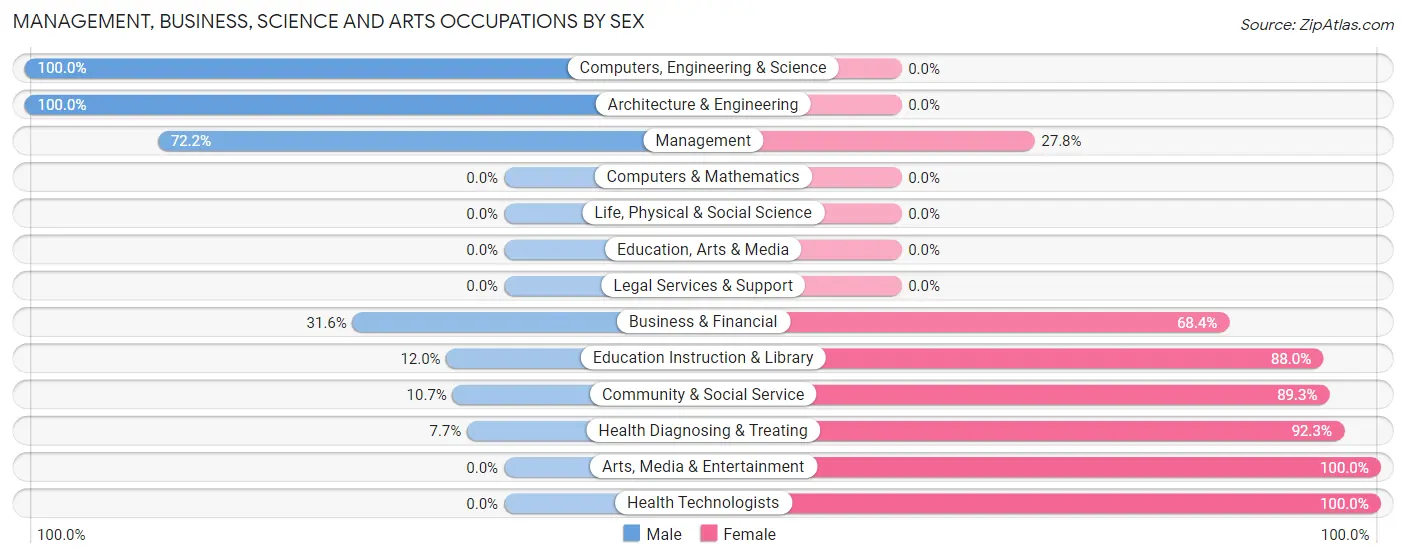
Management, Business, Science and Arts Occupations by Sex
Within the Management, Business, Science and Arts occupations in Pecan Hill, the most male-oriented occupations are Computers, Engineering & Science (100.0%), Architecture & Engineering (100.0%), and Management (72.2%), while the most female-oriented occupations are Arts, Media & Entertainment (100.0%), Health Technologists (100.0%), and Health Diagnosing & Treating (92.3%).
| Occupation | Male | Female |
| Management | 26 (72.2%) | 10 (27.8%) |
| Business & Financial | 6 (31.6%) | 13 (68.4%) |
| Computers, Engineering & Science | 6 (100.0%) | 0 (0.0%) |
| Computers & Mathematics | 0 (0.0%) | 0 (0.0%) |
| Architecture & Engineering | 6 (100.0%) | 0 (0.0%) |
| Life, Physical & Social Science | 0 (0.0%) | 0 (0.0%) |
| Community & Social Service | 3 (10.7%) | 25 (89.3%) |
| Education, Arts & Media | 0 (0.0%) | 0 (0.0%) |
| Legal Services & Support | 0 (0.0%) | 0 (0.0%) |
| Education Instruction & Library | 3 (12.0%) | 22 (88.0%) |
| Arts, Media & Entertainment | 0 (0.0%) | 3 (100.0%) |
| Health Diagnosing & Treating | 2 (7.7%) | 24 (92.3%) |
| Health Technologists | 0 (0.0%) | 14 (100.0%) |
| Total (Category) | 43 (37.4%) | 72 (62.6%) |
| Total (Overall) | 210 (58.0%) | 152 (42.0%) |
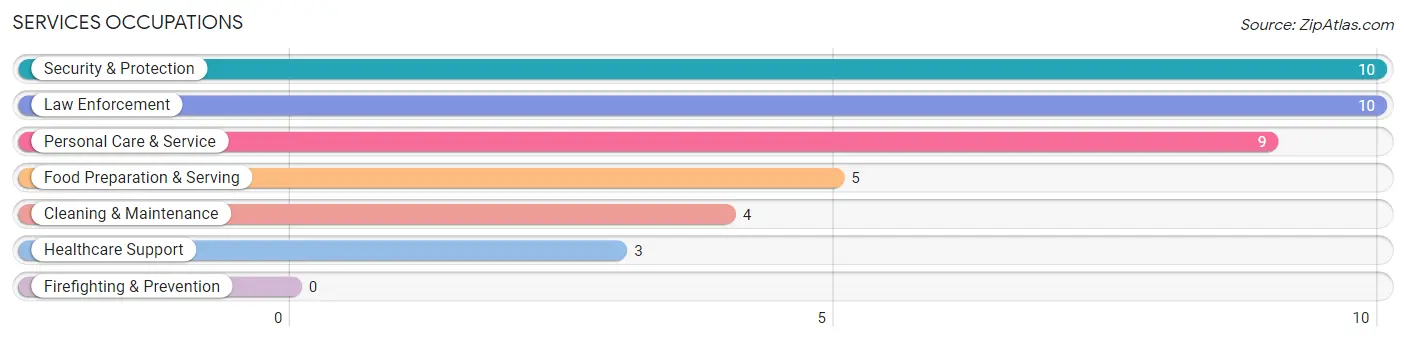
Services Occupations
The most common Services occupations in Pecan Hill are Security & Protection (10 | 2.8%), Law Enforcement (10 | 2.8%), Personal Care & Service (9 | 2.5%), Food Preparation & Serving (5 | 1.4%), and Cleaning & Maintenance (4 | 1.1%).
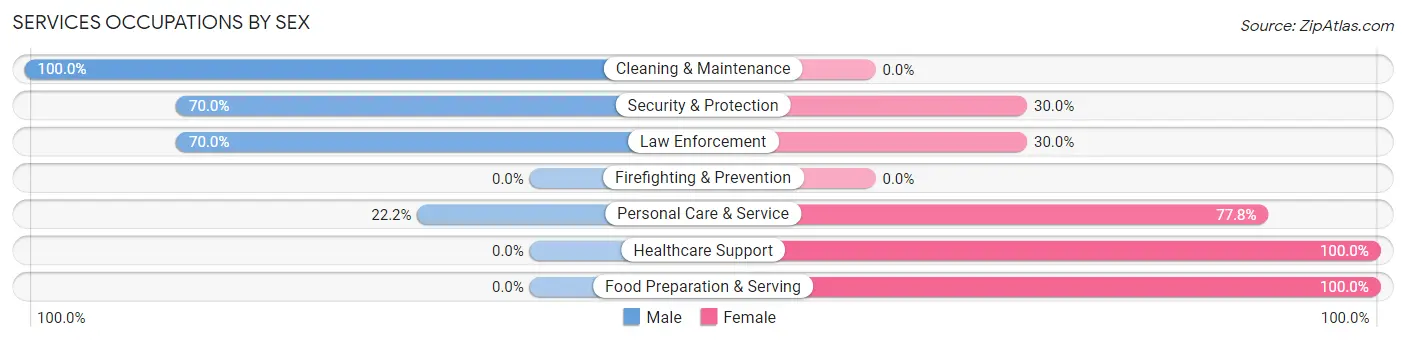
Services Occupations by Sex
Within the Services occupations in Pecan Hill, the most male-oriented occupations are Cleaning & Maintenance (100.0%), Security & Protection (70.0%), and Law Enforcement (70.0%), while the most female-oriented occupations are Healthcare Support (100.0%), Food Preparation & Serving (100.0%), and Personal Care & Service (77.8%).
| Occupation | Male | Female |
| Healthcare Support | 0 (0.0%) | 3 (100.0%) |
| Security & Protection | 7 (70.0%) | 3 (30.0%) |
| Firefighting & Prevention | 0 (0.0%) | 0 (0.0%) |
| Law Enforcement | 7 (70.0%) | 3 (30.0%) |
| Food Preparation & Serving | 0 (0.0%) | 5 (100.0%) |
| Cleaning & Maintenance | 4 (100.0%) | 0 (0.0%) |
| Personal Care & Service | 2 (22.2%) | 7 (77.8%) |
| Total (Category) | 13 (41.9%) | 18 (58.1%) |
| Total (Overall) | 210 (58.0%) | 152 (42.0%) |
Sales and Office Occupations
The most common Sales and Office occupations in Pecan Hill are Sales & Related (48 | 13.3%), and Office & Administration (46 | 12.7%).

Sales and Office Occupations by Sex
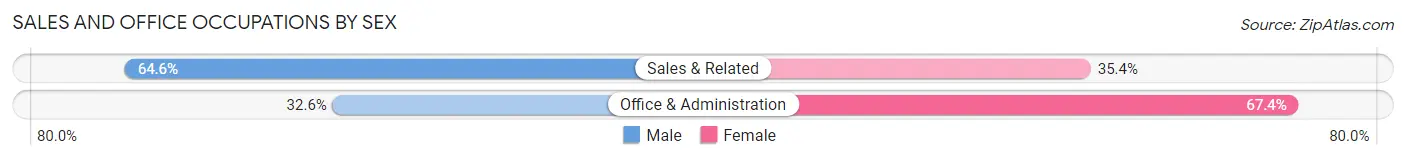
| Occupation | Male | Female |
| Sales & Related | 31 (64.6%) | 17 (35.4%) |
| Office & Administration | 15 (32.6%) | 31 (67.4%) |
| Total (Category) | 46 (48.9%) | 48 (51.1%) |
| Total (Overall) | 210 (58.0%) | 152 (42.0%) |
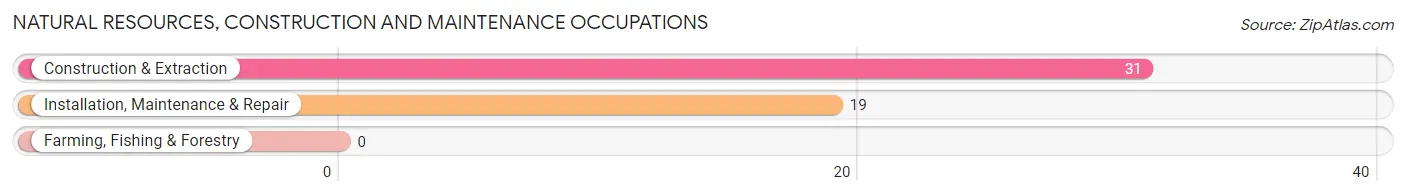
Natural Resources, Construction and Maintenance Occupations
The most common Natural Resources, Construction and Maintenance occupations in Pecan Hill are Construction & Extraction (31 | 8.6%), and Installation, Maintenance & Repair (19 | 5.2%).
Natural Resources, Construction and Maintenance Occupations by Sex
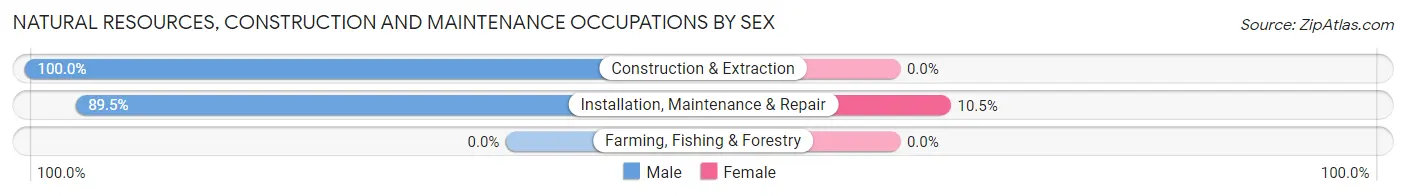
| Occupation | Male | Female |
| Farming, Fishing & Forestry | 0 (0.0%) | 0 (0.0%) |
| Construction & Extraction | 31 (100.0%) | 0 (0.0%) |
| Installation, Maintenance & Repair | 17 (89.5%) | 2 (10.5%) |
| Total (Category) | 48 (96.0%) | 2 (4.0%) |
| Total (Overall) | 210 (58.0%) | 152 (42.0%) |
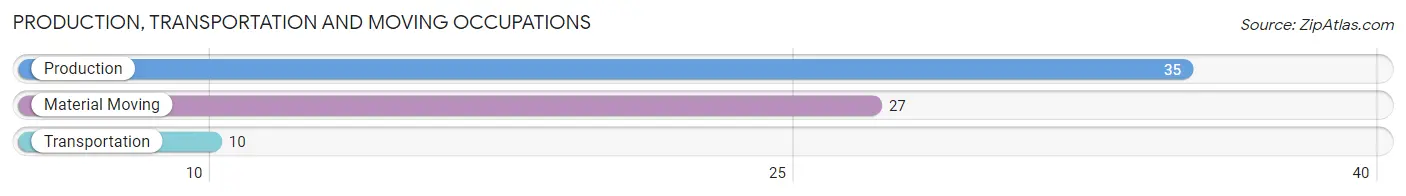
Production, Transportation and Moving Occupations
The most common Production, Transportation and Moving occupations in Pecan Hill are Production (35 | 9.7%), Material Moving (27 | 7.5%), and Transportation (10 | 2.8%).
Production, Transportation and Moving Occupations by Sex
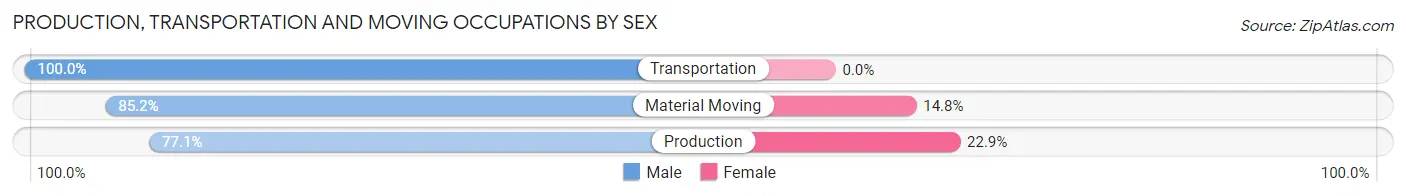
| Occupation | Male | Female |
| Production | 27 (77.1%) | 8 (22.9%) |
| Transportation | 10 (100.0%) | 0 (0.0%) |
| Material Moving | 23 (85.2%) | 4 (14.8%) |
| Total (Category) | 60 (83.3%) | 12 (16.7%) |
| Total (Overall) | 210 (58.0%) | 152 (42.0%) |
Employment Industries by Sex in Pecan Hill
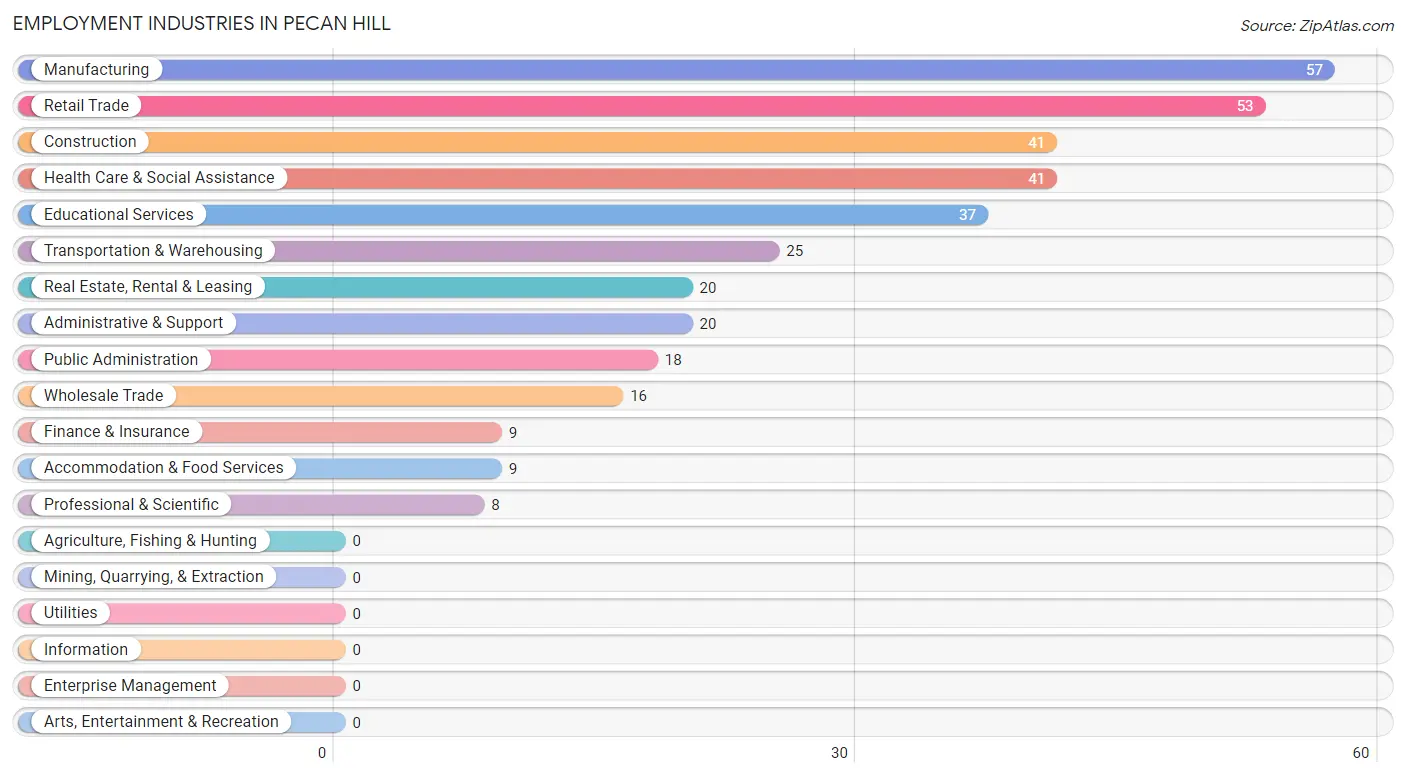
Employment Industries in Pecan Hill
The major employment industries in Pecan Hill include Manufacturing (57 | 15.8%), Retail Trade (53 | 14.6%), Construction (41 | 11.3%), Health Care & Social Assistance (41 | 11.3%), and Educational Services (37 | 10.2%).
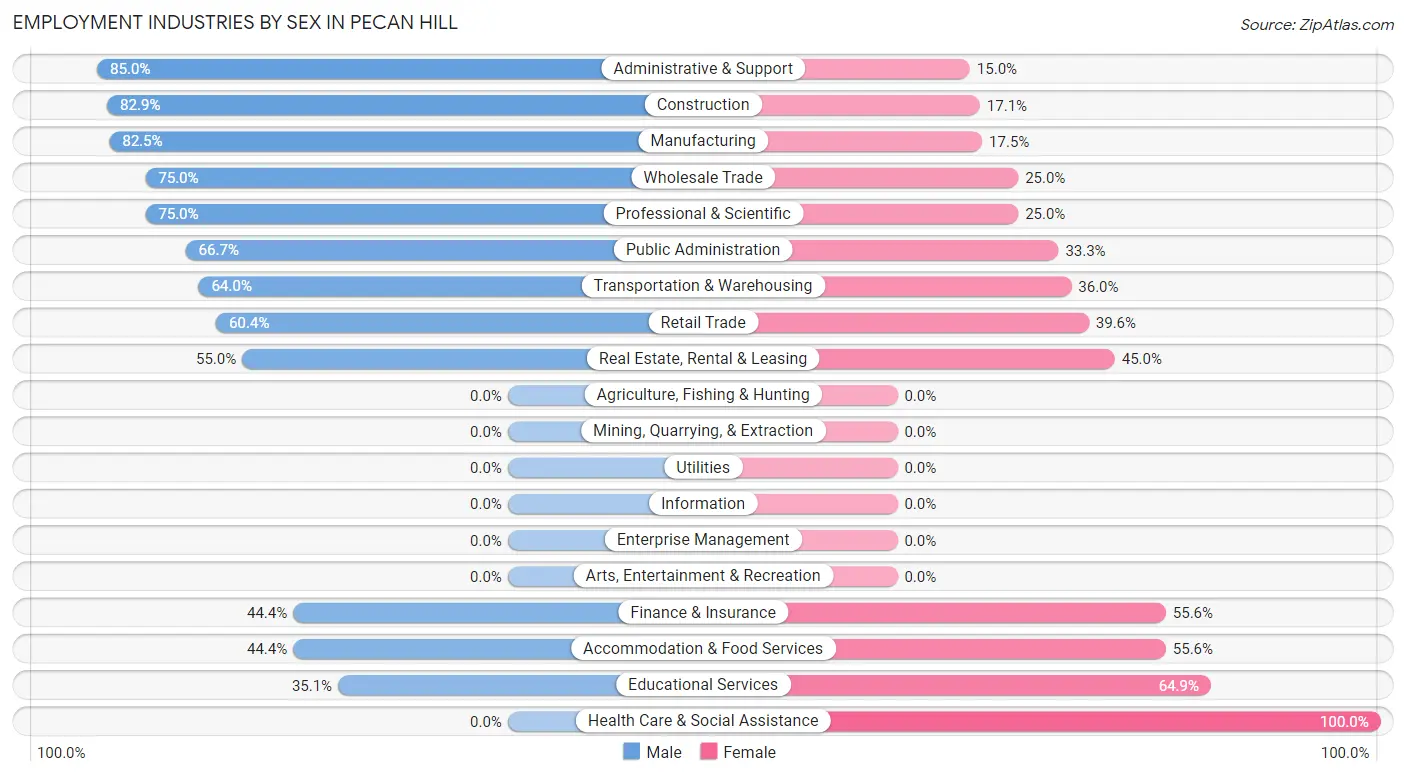
Employment Industries by Sex in Pecan Hill
The Pecan Hill industries that see more men than women are Administrative & Support (85.0%), Construction (82.9%), and Manufacturing (82.5%), whereas the industries that tend to have a higher number of women are Health Care & Social Assistance (100.0%), Educational Services (64.9%), and Finance & Insurance (55.6%).
| Industry | Male | Female |
| Agriculture, Fishing & Hunting | 0 (0.0%) | 0 (0.0%) |
| Mining, Quarrying, & Extraction | 0 (0.0%) | 0 (0.0%) |
| Construction | 34 (82.9%) | 7 (17.1%) |
| Manufacturing | 47 (82.5%) | 10 (17.5%) |
| Wholesale Trade | 12 (75.0%) | 4 (25.0%) |
| Retail Trade | 32 (60.4%) | 21 (39.6%) |
| Transportation & Warehousing | 16 (64.0%) | 9 (36.0%) |
| Utilities | 0 (0.0%) | 0 (0.0%) |
| Information | 0 (0.0%) | 0 (0.0%) |
| Finance & Insurance | 4 (44.4%) | 5 (55.6%) |
| Real Estate, Rental & Leasing | 11 (55.0%) | 9 (45.0%) |
| Professional & Scientific | 6 (75.0%) | 2 (25.0%) |
| Enterprise Management | 0 (0.0%) | 0 (0.0%) |
| Administrative & Support | 17 (85.0%) | 3 (15.0%) |
| Educational Services | 13 (35.1%) | 24 (64.9%) |
| Health Care & Social Assistance | 0 (0.0%) | 41 (100.0%) |
| Arts, Entertainment & Recreation | 0 (0.0%) | 0 (0.0%) |
| Accommodation & Food Services | 4 (44.4%) | 5 (55.6%) |
| Public Administration | 12 (66.7%) | 6 (33.3%) |
| Total | 210 (58.0%) | 152 (42.0%) |
Education in Pecan Hill
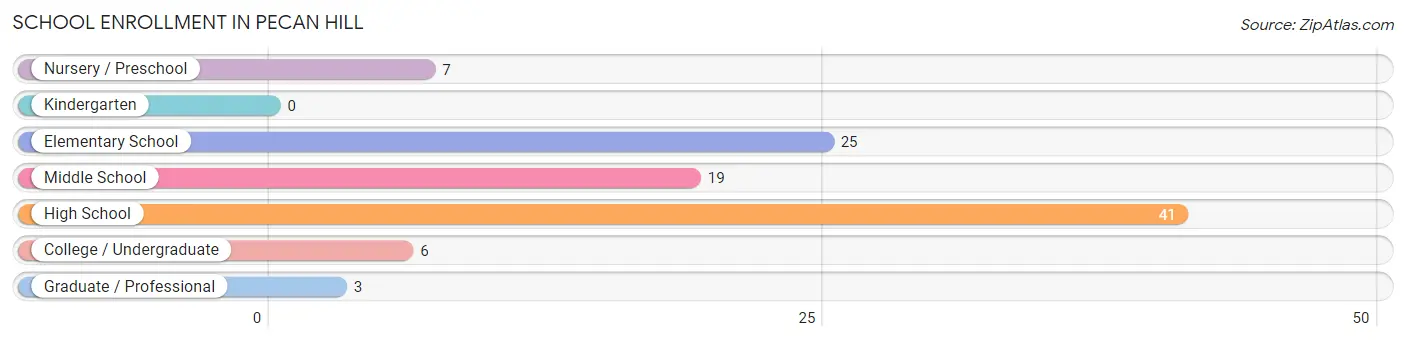
School Enrollment in Pecan Hill
The most common levels of schooling among the 101 students in Pecan Hill are high school (41 | 40.6%), elementary school (25 | 24.7%), and middle school (19 | 18.8%).
| School Level | # Students | % Students |
| Nursery / Preschool | 7 | 6.9% |
| Kindergarten | 0 | 0.0% |
| Elementary School | 25 | 24.7% |
| Middle School | 19 | 18.8% |
| High School | 41 | 40.6% |
| College / Undergraduate | 6 | 5.9% |
| Graduate / Professional | 3 | 3.0% |
| Total | 101 | 100.0% |
School Enrollment by Age by Funding Source in Pecan Hill
Out of a total of 101 students who are enrolled in schools in Pecan Hill, 6 (5.9%) attend a private institution, while the remaining 95 (94.1%) are enrolled in public schools. The age group of 3 to 4 year olds has the highest likelihood of being enrolled in private schools, with 3 (100.0% in the age bracket) enrolled. Conversely, the age group of 5 to 9 year old has the lowest likelihood of being enrolled in a private school, with 27 (100.0% in the age bracket) attending a public institution.
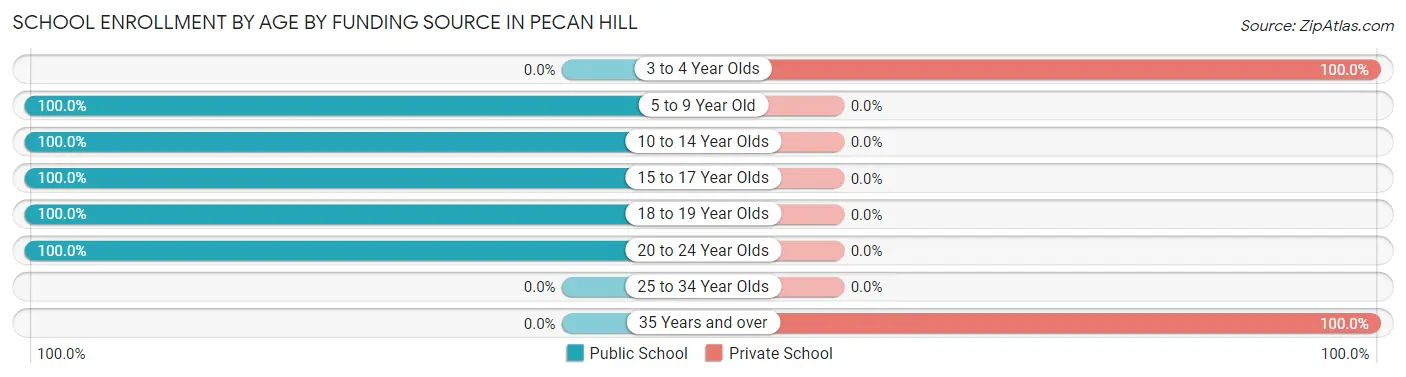
| Age Bracket | Public School | Private School |
| 3 to 4 Year Olds | 0 (0.0%) | 3 (100.0%) |
| 5 to 9 Year Old | 27 (100.0%) | 0 (0.0%) |
| 10 to 14 Year Olds | 32 (100.0%) | 0 (0.0%) |
| 15 to 17 Year Olds | 19 (100.0%) | 0 (0.0%) |
| 18 to 19 Year Olds | 13 (100.0%) | 0 (0.0%) |
| 20 to 24 Year Olds | 4 (100.0%) | 0 (0.0%) |
| 25 to 34 Year Olds | 0 (0.0%) | 0 (0.0%) |
| 35 Years and over | 0 (0.0%) | 3 (100.0%) |
| Total | 95 (94.1%) | 6 (5.9%) |
Educational Attainment by Field of Study in Pecan Hill
Business (31 | 43.1%), education (14 | 19.4%), science & technology (9 | 12.5%), visual & performing arts (6 | 8.3%), and computers & mathematics (3 | 4.2%) are the most common fields of study among 72 individuals in Pecan Hill who have obtained a bachelor's degree or higher.
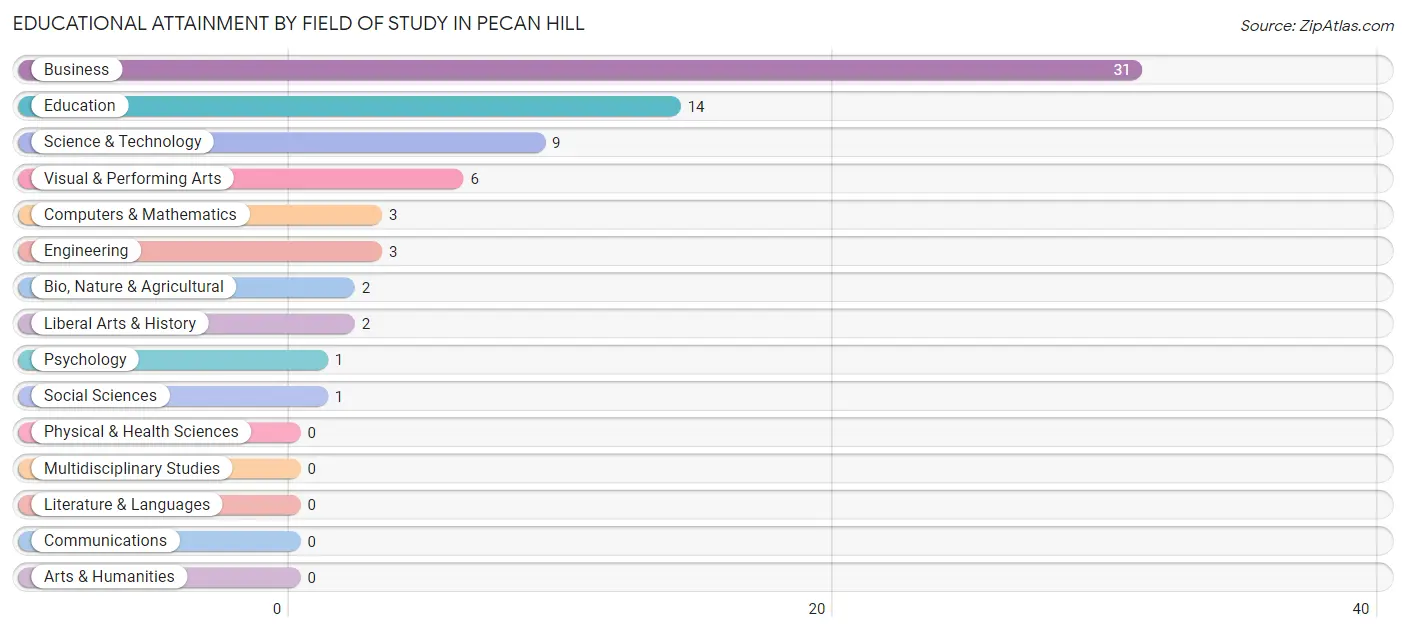
| Field of Study | # Graduates | % Graduates |
| Computers & Mathematics | 3 | 4.2% |
| Bio, Nature & Agricultural | 2 | 2.8% |
| Physical & Health Sciences | 0 | 0.0% |
| Psychology | 1 | 1.4% |
| Social Sciences | 1 | 1.4% |
| Engineering | 3 | 4.2% |
| Multidisciplinary Studies | 0 | 0.0% |
| Science & Technology | 9 | 12.5% |
| Business | 31 | 43.1% |
| Education | 14 | 19.4% |
| Literature & Languages | 0 | 0.0% |
| Liberal Arts & History | 2 | 2.8% |
| Visual & Performing Arts | 6 | 8.3% |
| Communications | 0 | 0.0% |
| Arts & Humanities | 0 | 0.0% |
| Total | 72 | 100.0% |
Transportation & Commute in Pecan Hill
Vehicle Availability by Sex in Pecan Hill
The most prevalent vehicle ownership categories in Pecan Hill are males with 3 vehicles (67, accounting for 33.3%) and females with 3 vehicles (41, making up 44.7%).
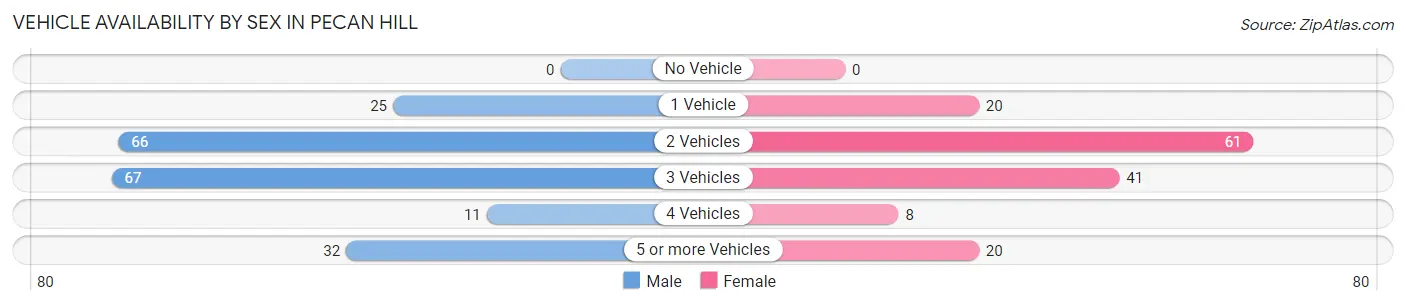
| Vehicles Available | Male | Female |
| No Vehicle | 0 (0.0%) | 0 (0.0%) |
| 1 Vehicle | 25 (12.4%) | 20 (13.3%) |
| 2 Vehicles | 66 (32.8%) | 61 (40.7%) |
| 3 Vehicles | 67 (33.3%) | 41 (27.3%) |
| 4 Vehicles | 11 (5.5%) | 8 (5.3%) |
| 5 or more Vehicles | 32 (15.9%) | 20 (13.3%) |
| Total | 201 (100.0%) | 150 (100.0%) |
Commute Time in Pecan Hill
The most frequently occuring commute durations in Pecan Hill are 45 to 59 minutes (63 commuters, 18.5%), 30 to 34 minutes (53 commuters, 15.5%), and 60 to 89 minutes (47 commuters, 13.8%).
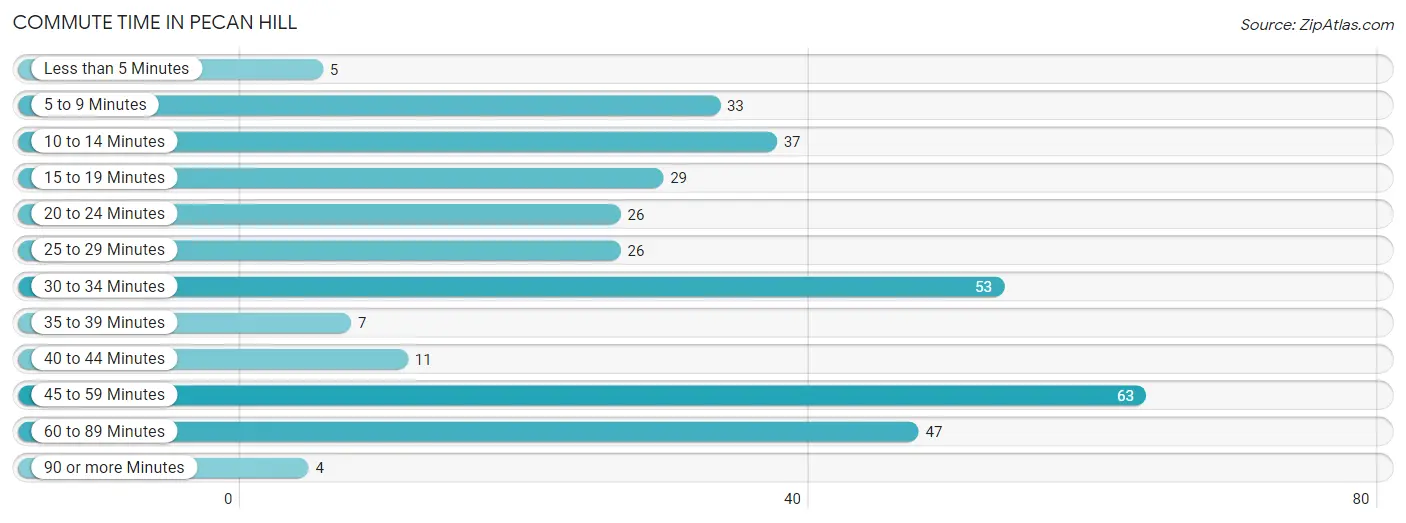
| Commute Time | # Commuters | % Commuters |
| Less than 5 Minutes | 5 | 1.5% |
| 5 to 9 Minutes | 33 | 9.7% |
| 10 to 14 Minutes | 37 | 10.8% |
| 15 to 19 Minutes | 29 | 8.5% |
| 20 to 24 Minutes | 26 | 7.6% |
| 25 to 29 Minutes | 26 | 7.6% |
| 30 to 34 Minutes | 53 | 15.5% |
| 35 to 39 Minutes | 7 | 2.1% |
| 40 to 44 Minutes | 11 | 3.2% |
| 45 to 59 Minutes | 63 | 18.5% |
| 60 to 89 Minutes | 47 | 13.8% |
| 90 or more Minutes | 4 | 1.2% |
Commute Time by Sex in Pecan Hill
The most common commute times in Pecan Hill are 45 to 59 minutes (45 commuters, 22.6%) for males and 30 to 34 minutes (30 commuters, 21.1%) for females.
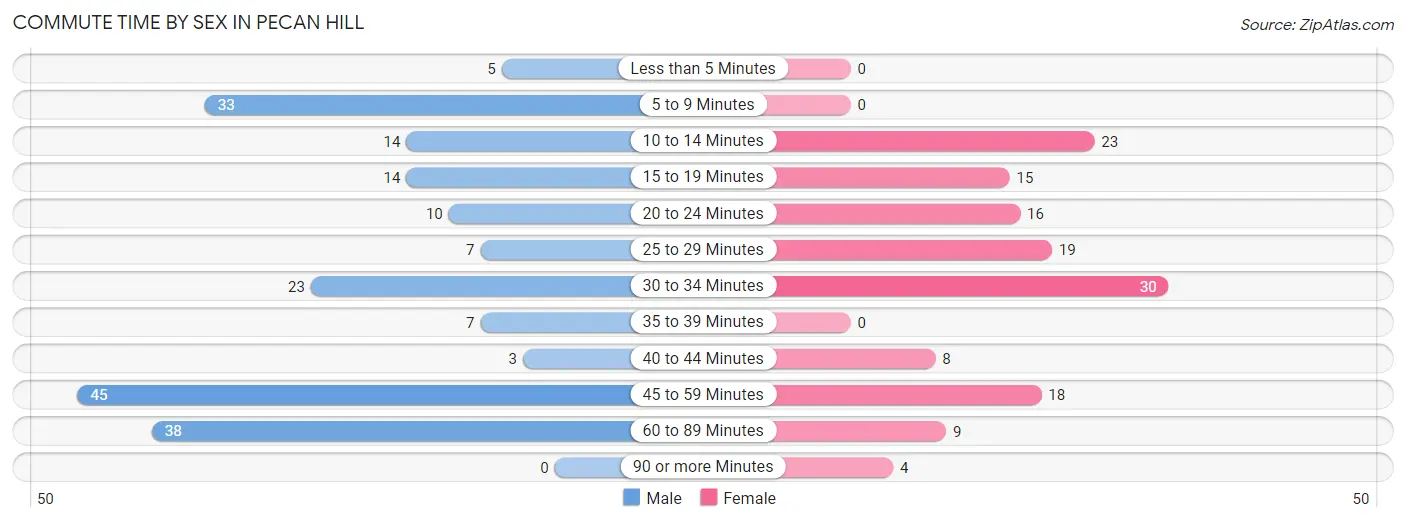
| Commute Time | Male | Female |
| Less than 5 Minutes | 5 (2.5%) | 0 (0.0%) |
| 5 to 9 Minutes | 33 (16.6%) | 0 (0.0%) |
| 10 to 14 Minutes | 14 (7.0%) | 23 (16.2%) |
| 15 to 19 Minutes | 14 (7.0%) | 15 (10.6%) |
| 20 to 24 Minutes | 10 (5.0%) | 16 (11.3%) |
| 25 to 29 Minutes | 7 (3.5%) | 19 (13.4%) |
| 30 to 34 Minutes | 23 (11.6%) | 30 (21.1%) |
| 35 to 39 Minutes | 7 (3.5%) | 0 (0.0%) |
| 40 to 44 Minutes | 3 (1.5%) | 8 (5.6%) |
| 45 to 59 Minutes | 45 (22.6%) | 18 (12.7%) |
| 60 to 89 Minutes | 38 (19.1%) | 9 (6.3%) |
| 90 or more Minutes | 0 (0.0%) | 4 (2.8%) |
Time of Departure to Work by Sex in Pecan Hill
The most frequent times of departure to work in Pecan Hill are 6:30 AM to 6:59 AM (39, 19.6%) for males and 7:00 AM to 7:29 AM (31, 21.8%) for females.
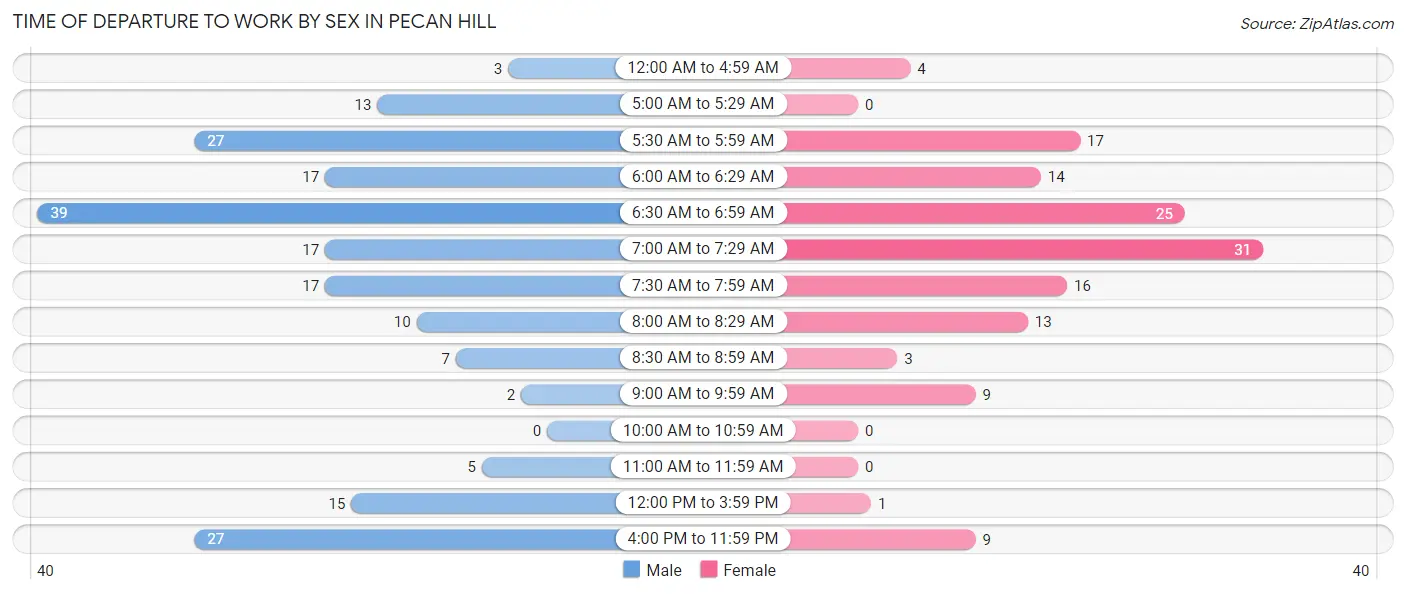
| Time of Departure | Male | Female |
| 12:00 AM to 4:59 AM | 3 (1.5%) | 4 (2.8%) |
| 5:00 AM to 5:29 AM | 13 (6.5%) | 0 (0.0%) |
| 5:30 AM to 5:59 AM | 27 (13.6%) | 17 (12.0%) |
| 6:00 AM to 6:29 AM | 17 (8.5%) | 14 (9.9%) |
| 6:30 AM to 6:59 AM | 39 (19.6%) | 25 (17.6%) |
| 7:00 AM to 7:29 AM | 17 (8.5%) | 31 (21.8%) |
| 7:30 AM to 7:59 AM | 17 (8.5%) | 16 (11.3%) |
| 8:00 AM to 8:29 AM | 10 (5.0%) | 13 (9.1%) |
| 8:30 AM to 8:59 AM | 7 (3.5%) | 3 (2.1%) |
| 9:00 AM to 9:59 AM | 2 (1.0%) | 9 (6.3%) |
| 10:00 AM to 10:59 AM | 0 (0.0%) | 0 (0.0%) |
| 11:00 AM to 11:59 AM | 5 (2.5%) | 0 (0.0%) |
| 12:00 PM to 3:59 PM | 15 (7.5%) | 1 (0.7%) |
| 4:00 PM to 11:59 PM | 27 (13.6%) | 9 (6.3%) |
| Total | 199 (100.0%) | 142 (100.0%) |
Housing Occupancy in Pecan Hill
Occupancy by Ownership in Pecan Hill
Of the total 232 dwellings in Pecan Hill, owner-occupied units account for 208 (89.7%), while renter-occupied units make up 24 (10.3%).
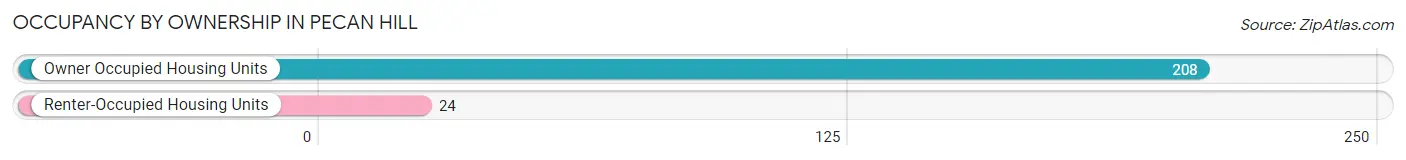
| Occupancy | # Housing Units | % Housing Units |
| Owner Occupied Housing Units | 208 | 89.7% |
| Renter-Occupied Housing Units | 24 | 10.3% |
| Total Occupied Housing Units | 232 | 100.0% |
Occupancy by Household Size in Pecan Hill
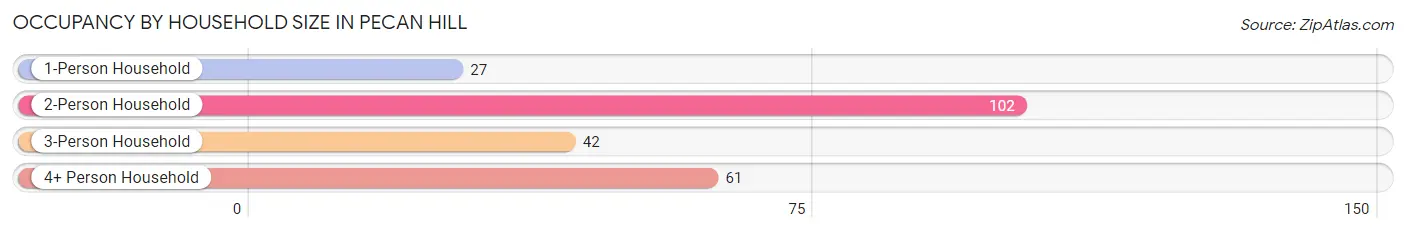
| Household Size | # Housing Units | % Housing Units |
| 1-Person Household | 27 | 11.6% |
| 2-Person Household | 102 | 44.0% |
| 3-Person Household | 42 | 18.1% |
| 4+ Person Household | 61 | 26.3% |
| Total Housing Units | 232 | 100.0% |
Occupancy by Ownership by Household Size in Pecan Hill
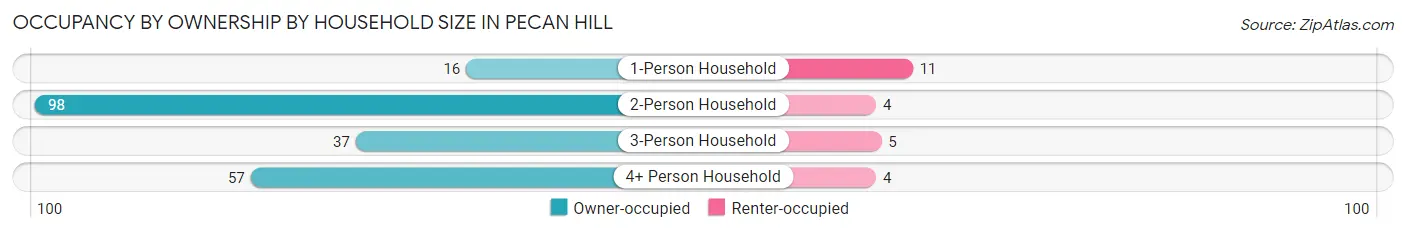
| Household Size | Owner-occupied | Renter-occupied |
| 1-Person Household | 16 (59.3%) | 11 (40.7%) |
| 2-Person Household | 98 (96.1%) | 4 (3.9%) |
| 3-Person Household | 37 (88.1%) | 5 (11.9%) |
| 4+ Person Household | 57 (93.4%) | 4 (6.6%) |
| Total Housing Units | 208 (89.7%) | 24 (10.3%) |
Occupancy by Educational Attainment in Pecan Hill
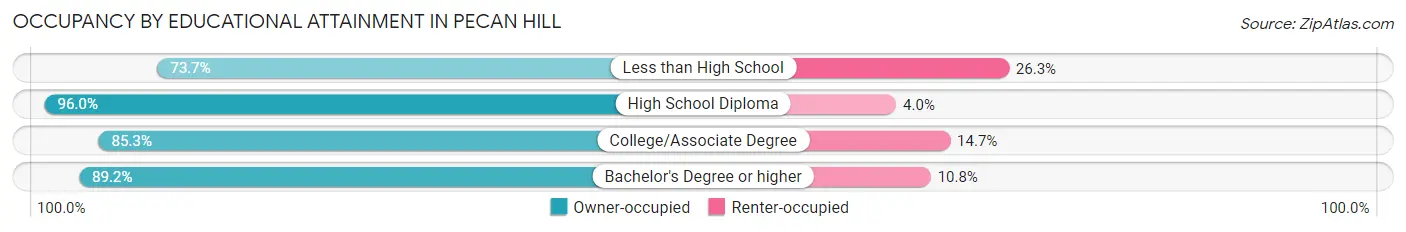
| Household Size | Owner-occupied | Renter-occupied |
| Less than High School | 14 (73.7%) | 5 (26.3%) |
| High School Diploma | 97 (96.0%) | 4 (4.0%) |
| College/Associate Degree | 64 (85.3%) | 11 (14.7%) |
| Bachelor's Degree or higher | 33 (89.2%) | 4 (10.8%) |
Occupancy by Age of Householder in Pecan Hill
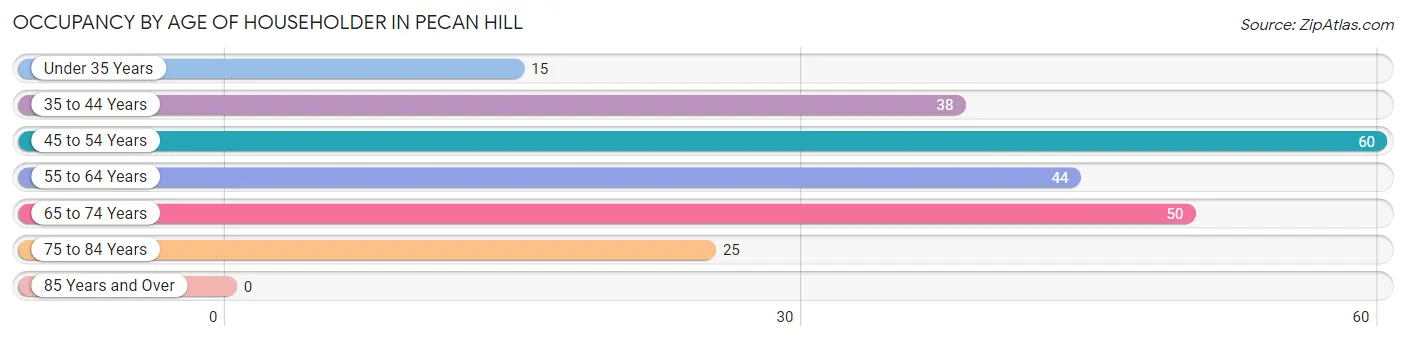
| Age Bracket | # Households | % Households |
| Under 35 Years | 15 | 6.5% |
| 35 to 44 Years | 38 | 16.4% |
| 45 to 54 Years | 60 | 25.9% |
| 55 to 64 Years | 44 | 19.0% |
| 65 to 74 Years | 50 | 21.5% |
| 75 to 84 Years | 25 | 10.8% |
| 85 Years and Over | 0 | 0.0% |
| Total | 232 | 100.0% |
Housing Finances in Pecan Hill
Median Income by Occupancy in Pecan Hill
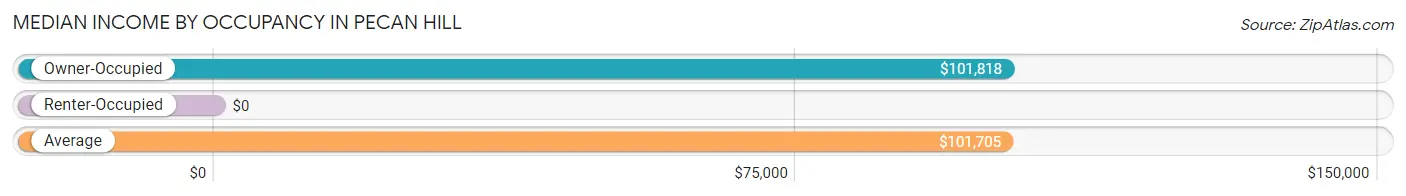
| Occupancy Type | # Households | Median Income |
| Owner-Occupied | 208 (89.7%) | $101,818 |
| Renter-Occupied | 24 (10.3%) | $0 |
| Average | 232 (100.0%) | $101,705 |
Occupancy by Householder Income Bracket in Pecan Hill
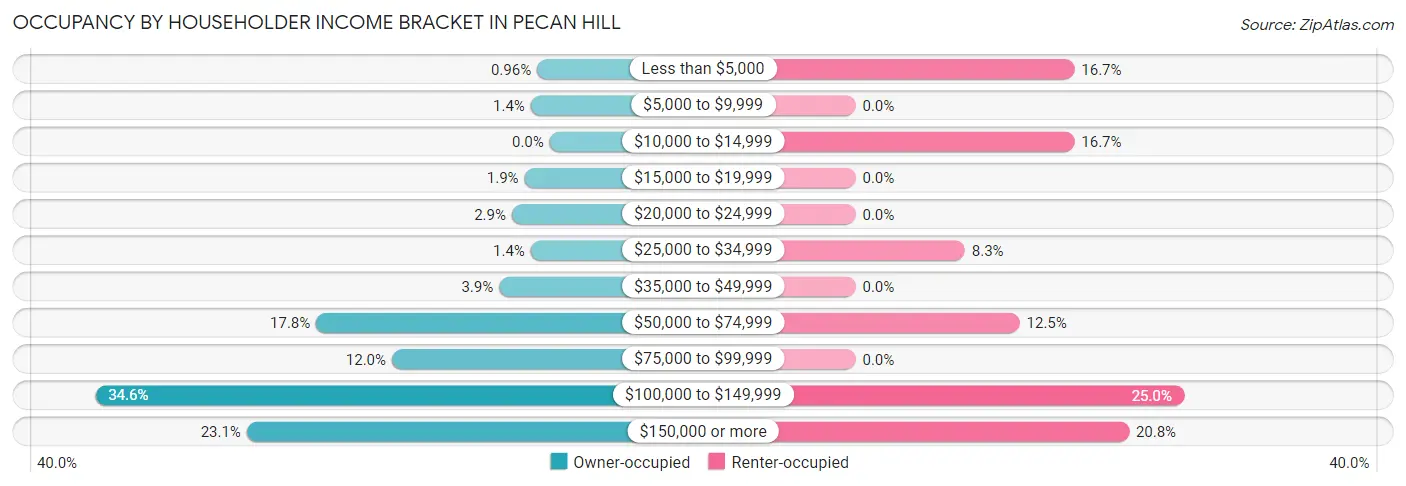
| Income Bracket | Owner-occupied | Renter-occupied |
| Less than $5,000 | 2 (1.0%) | 4 (16.7%) |
| $5,000 to $9,999 | 3 (1.4%) | 0 (0.0%) |
| $10,000 to $14,999 | 0 (0.0%) | 4 (16.7%) |
| $15,000 to $19,999 | 4 (1.9%) | 0 (0.0%) |
| $20,000 to $24,999 | 6 (2.9%) | 0 (0.0%) |
| $25,000 to $34,999 | 3 (1.4%) | 2 (8.3%) |
| $35,000 to $49,999 | 8 (3.8%) | 0 (0.0%) |
| $50,000 to $74,999 | 37 (17.8%) | 3 (12.5%) |
| $75,000 to $99,999 | 25 (12.0%) | 0 (0.0%) |
| $100,000 to $149,999 | 72 (34.6%) | 6 (25.0%) |
| $150,000 or more | 48 (23.1%) | 5 (20.8%) |
| Total | 208 (100.0%) | 24 (100.0%) |
Monthly Housing Cost Tiers in Pecan Hill
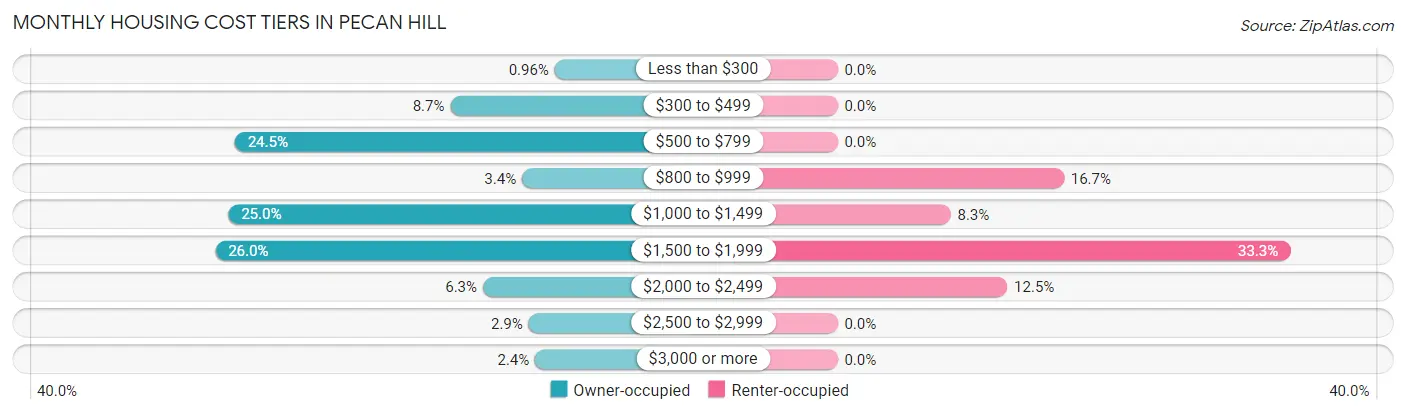
| Monthly Cost | Owner-occupied | Renter-occupied |
| Less than $300 | 2 (1.0%) | 0 (0.0%) |
| $300 to $499 | 18 (8.6%) | 0 (0.0%) |
| $500 to $799 | 51 (24.5%) | 0 (0.0%) |
| $800 to $999 | 7 (3.4%) | 4 (16.7%) |
| $1,000 to $1,499 | 52 (25.0%) | 2 (8.3%) |
| $1,500 to $1,999 | 54 (26.0%) | 8 (33.3%) |
| $2,000 to $2,499 | 13 (6.2%) | 3 (12.5%) |
| $2,500 to $2,999 | 6 (2.9%) | 0 (0.0%) |
| $3,000 or more | 5 (2.4%) | 0 (0.0%) |
| Total | 208 (100.0%) | 24 (100.0%) |
Physical Housing Characteristics in Pecan Hill
Housing Structures in Pecan Hill
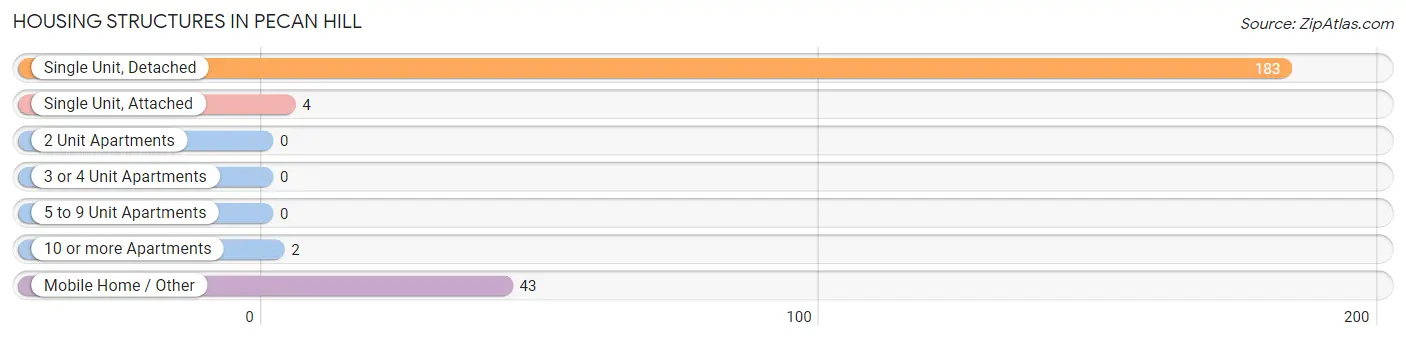
| Structure Type | # Housing Units | % Housing Units |
| Single Unit, Detached | 183 | 78.9% |
| Single Unit, Attached | 4 | 1.7% |
| 2 Unit Apartments | 0 | 0.0% |
| 3 or 4 Unit Apartments | 0 | 0.0% |
| 5 to 9 Unit Apartments | 0 | 0.0% |
| 10 or more Apartments | 2 | 0.9% |
| Mobile Home / Other | 43 | 18.5% |
| Total | 232 | 100.0% |
Housing Structures by Occupancy in Pecan Hill
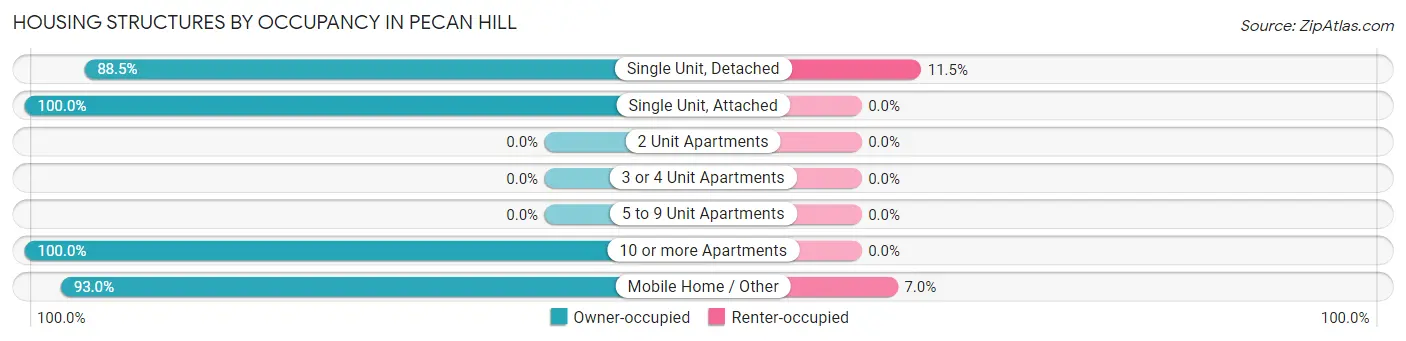
| Structure Type | Owner-occupied | Renter-occupied |
| Single Unit, Detached | 162 (88.5%) | 21 (11.5%) |
| Single Unit, Attached | 4 (100.0%) | 0 (0.0%) |
| 2 Unit Apartments | 0 (0.0%) | 0 (0.0%) |
| 3 or 4 Unit Apartments | 0 (0.0%) | 0 (0.0%) |
| 5 to 9 Unit Apartments | 0 (0.0%) | 0 (0.0%) |
| 10 or more Apartments | 2 (100.0%) | 0 (0.0%) |
| Mobile Home / Other | 40 (93.0%) | 3 (7.0%) |
| Total | 208 (89.7%) | 24 (10.3%) |
Housing Structures by Number of Rooms in Pecan Hill
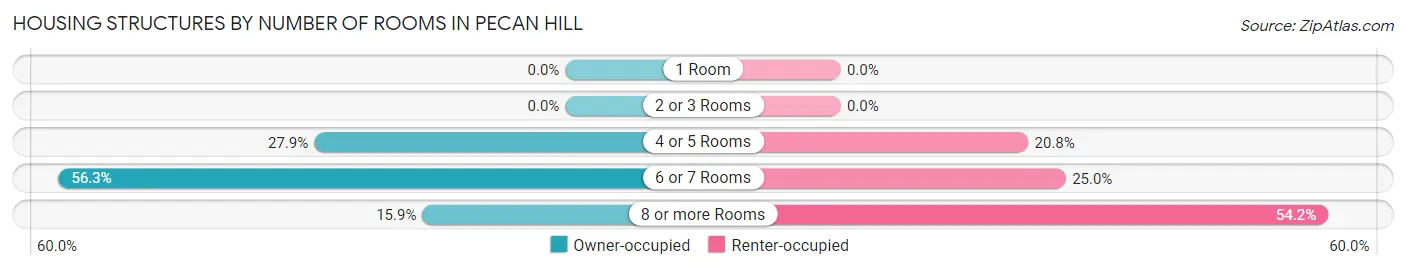
| Number of Rooms | Owner-occupied | Renter-occupied |
| 1 Room | 0 (0.0%) | 0 (0.0%) |
| 2 or 3 Rooms | 0 (0.0%) | 0 (0.0%) |
| 4 or 5 Rooms | 58 (27.9%) | 5 (20.8%) |
| 6 or 7 Rooms | 117 (56.2%) | 6 (25.0%) |
| 8 or more Rooms | 33 (15.9%) | 13 (54.2%) |
| Total | 208 (100.0%) | 24 (100.0%) |
Housing Structure by Heating Type in Pecan Hill
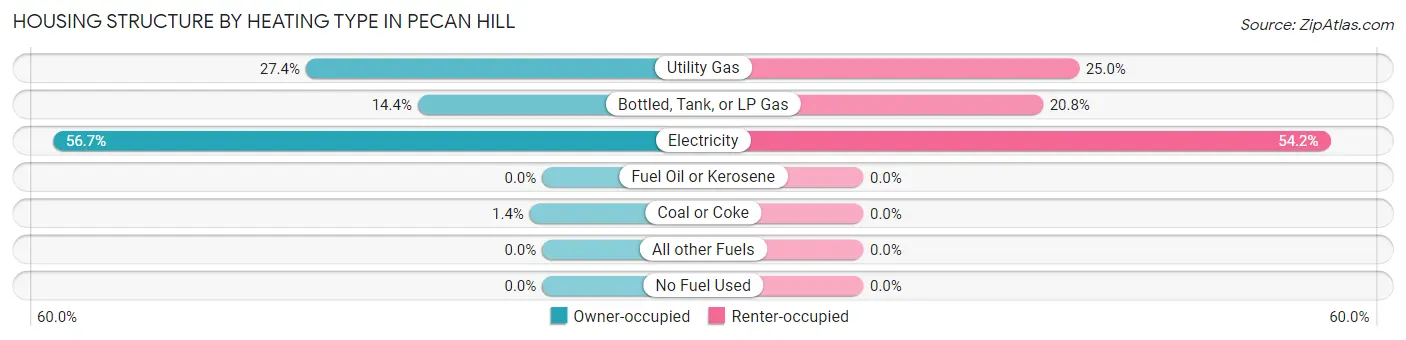
| Heating Type | Owner-occupied | Renter-occupied |
| Utility Gas | 57 (27.4%) | 6 (25.0%) |
| Bottled, Tank, or LP Gas | 30 (14.4%) | 5 (20.8%) |
| Electricity | 118 (56.7%) | 13 (54.2%) |
| Fuel Oil or Kerosene | 0 (0.0%) | 0 (0.0%) |
| Coal or Coke | 3 (1.4%) | 0 (0.0%) |
| All other Fuels | 0 (0.0%) | 0 (0.0%) |
| No Fuel Used | 0 (0.0%) | 0 (0.0%) |
| Total | 208 (100.0%) | 24 (100.0%) |
Household Vehicle Usage in Pecan Hill
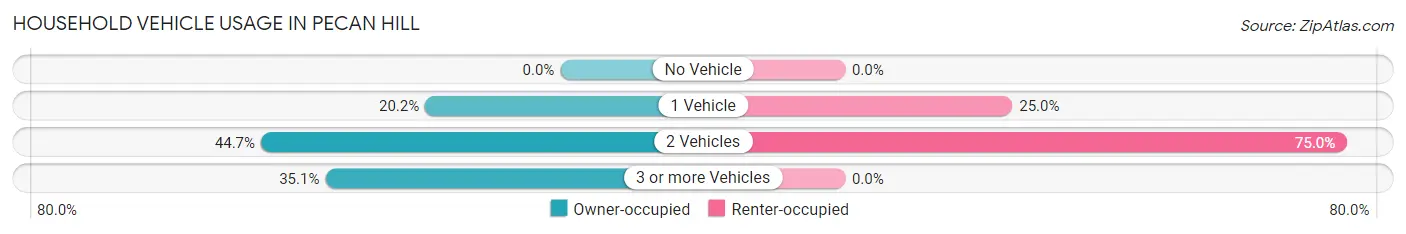
| Vehicles per Household | Owner-occupied | Renter-occupied |
| No Vehicle | 0 (0.0%) | 0 (0.0%) |
| 1 Vehicle | 42 (20.2%) | 6 (25.0%) |
| 2 Vehicles | 93 (44.7%) | 18 (75.0%) |
| 3 or more Vehicles | 73 (35.1%) | 0 (0.0%) |
| Total | 208 (100.0%) | 24 (100.0%) |
Real Estate & Mortgages in Pecan Hill
Real Estate and Mortgage Overview in Pecan Hill
| Characteristic | Without Mortgage | With Mortgage |
| Housing Units | 103 | 105 |
| Median Property Value | $182,500 | $281,500 |
| Median Household Income | $94,688 | $27 |
| Monthly Housing Costs | $703 | $5 |
| Real Estate Taxes | $2,000 | $13 |
Property Value by Mortgage Status in Pecan Hill
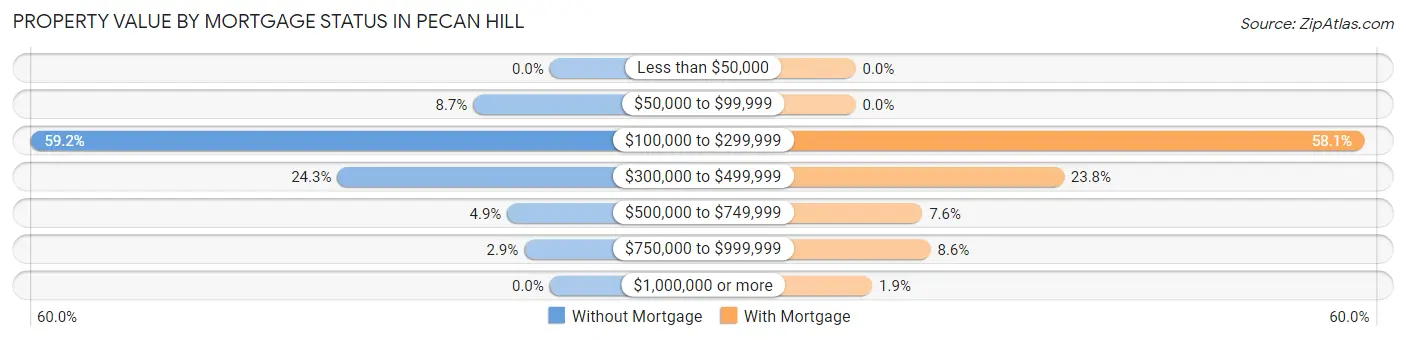
| Property Value | Without Mortgage | With Mortgage |
| Less than $50,000 | 0 (0.0%) | 0 (0.0%) |
| $50,000 to $99,999 | 9 (8.7%) | 0 (0.0%) |
| $100,000 to $299,999 | 61 (59.2%) | 61 (58.1%) |
| $300,000 to $499,999 | 25 (24.3%) | 25 (23.8%) |
| $500,000 to $749,999 | 5 (4.9%) | 8 (7.6%) |
| $750,000 to $999,999 | 3 (2.9%) | 9 (8.6%) |
| $1,000,000 or more | 0 (0.0%) | 2 (1.9%) |
| Total | 103 (100.0%) | 105 (100.0%) |
Household Income by Mortgage Status in Pecan Hill
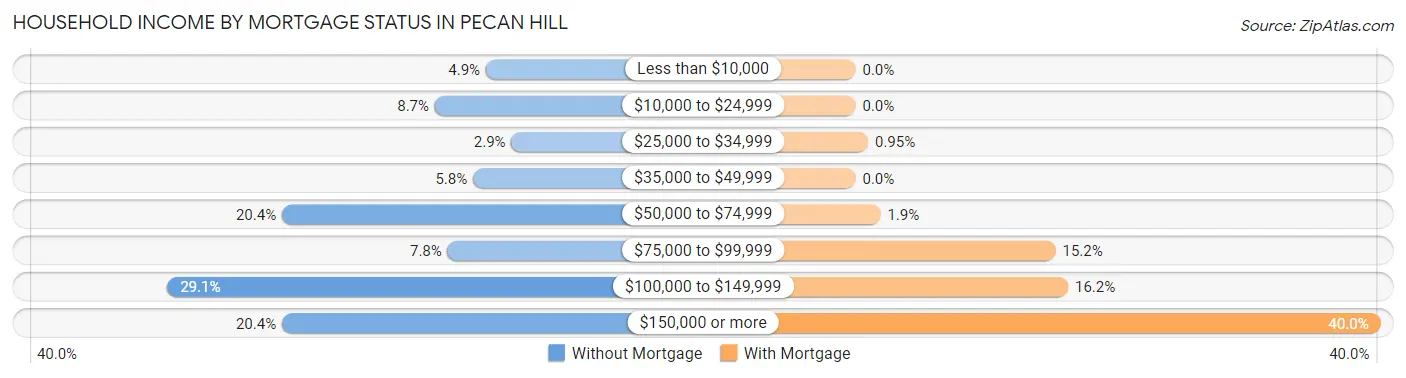
| Household Income | Without Mortgage | With Mortgage |
| Less than $10,000 | 5 (4.9%) | 0 (0.0%) |
| $10,000 to $24,999 | 9 (8.7%) | 0 (0.0%) |
| $25,000 to $34,999 | 3 (2.9%) | 1 (0.9%) |
| $35,000 to $49,999 | 6 (5.8%) | 0 (0.0%) |
| $50,000 to $74,999 | 21 (20.4%) | 2 (1.9%) |
| $75,000 to $99,999 | 8 (7.8%) | 16 (15.2%) |
| $100,000 to $149,999 | 30 (29.1%) | 17 (16.2%) |
| $150,000 or more | 21 (20.4%) | 42 (40.0%) |
| Total | 103 (100.0%) | 105 (100.0%) |
Property Value to Household Income Ratio in Pecan Hill
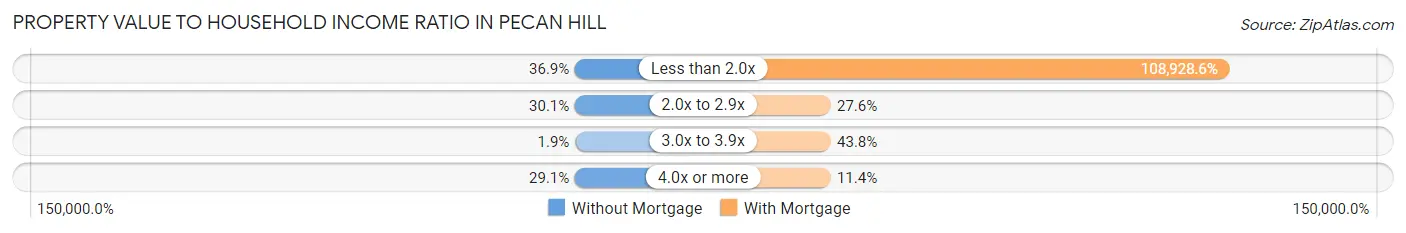
| Value-to-Income Ratio | Without Mortgage | With Mortgage |
| Less than 2.0x | 38 (36.9%) | 114,375 (108,928.6%) |
| 2.0x to 2.9x | 31 (30.1%) | 29 (27.6%) |
| 3.0x to 3.9x | 2 (1.9%) | 46 (43.8%) |
| 4.0x or more | 30 (29.1%) | 12 (11.4%) |
| Total | 103 (100.0%) | 105 (100.0%) |
Real Estate Taxes by Mortgage Status in Pecan Hill
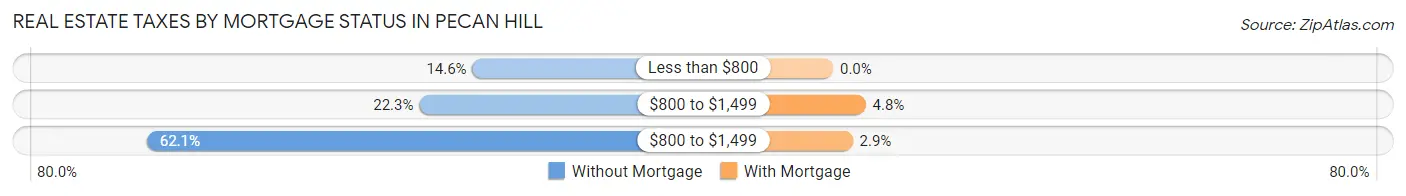
| Property Taxes | Without Mortgage | With Mortgage |
| Less than $800 | 15 (14.6%) | 0 (0.0%) |
| $800 to $1,499 | 23 (22.3%) | 5 (4.8%) |
| $800 to $1,499 | 64 (62.1%) | 3 (2.9%) |
| Total | 103 (100.0%) | 105 (100.0%) |
Health & Disability in Pecan Hill
Health Insurance Coverage by Age in Pecan Hill
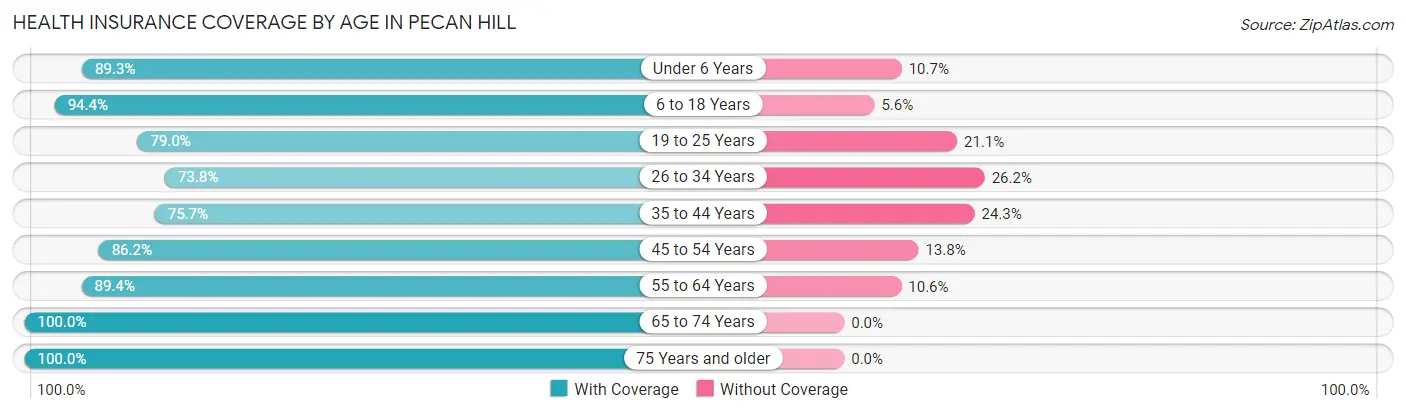
| Age Bracket | With Coverage | Without Coverage |
| Under 6 Years | 25 (89.3%) | 3 (10.7%) |
| 6 to 18 Years | 84 (94.4%) | 5 (5.6%) |
| 19 to 25 Years | 45 (78.9%) | 12 (21.0%) |
| 26 to 34 Years | 62 (73.8%) | 22 (26.2%) |
| 35 to 44 Years | 53 (75.7%) | 17 (24.3%) |
| 45 to 54 Years | 81 (86.2%) | 13 (13.8%) |
| 55 to 64 Years | 84 (89.4%) | 10 (10.6%) |
| 65 to 74 Years | 111 (100.0%) | 0 (0.0%) |
| 75 Years and older | 57 (100.0%) | 0 (0.0%) |
| Total | 602 (88.0%) | 82 (12.0%) |
Health Insurance Coverage by Citizenship Status in Pecan Hill
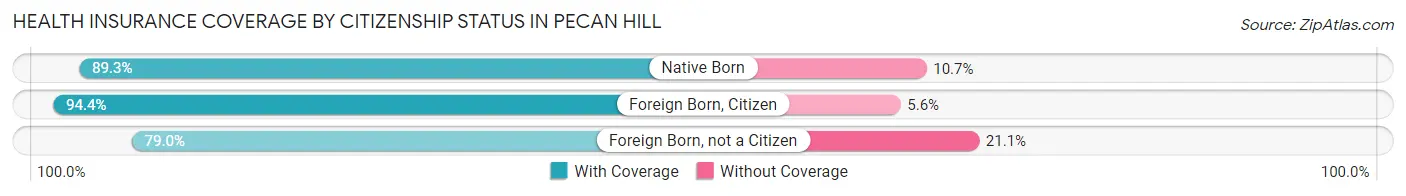
| Citizenship Status | With Coverage | Without Coverage |
| Native Born | 25 (89.3%) | 3 (10.7%) |
| Foreign Born, Citizen | 84 (94.4%) | 5 (5.6%) |
| Foreign Born, not a Citizen | 45 (78.9%) | 12 (21.0%) |
Health Insurance Coverage by Household Income in Pecan Hill
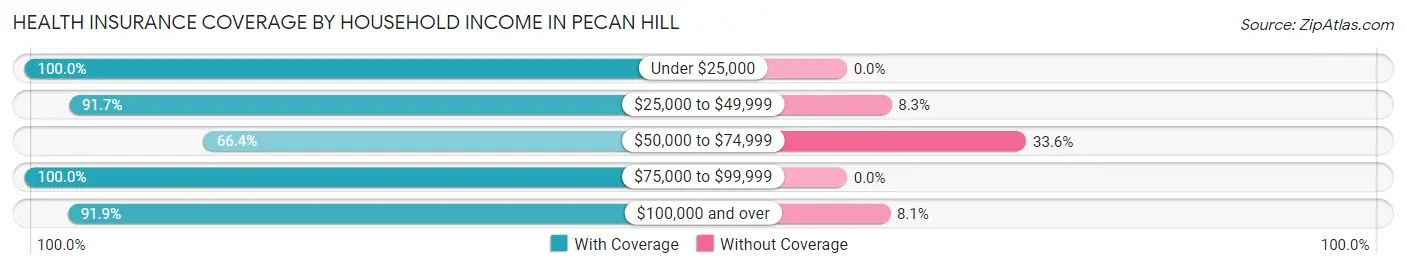
| Household Income | With Coverage | Without Coverage |
| Under $25,000 | 27 (100.0%) | 0 (0.0%) |
| $25,000 to $49,999 | 22 (91.7%) | 2 (8.3%) |
| $50,000 to $74,999 | 87 (66.4%) | 44 (33.6%) |
| $75,000 to $99,999 | 57 (100.0%) | 0 (0.0%) |
| $100,000 and over | 409 (91.9%) | 36 (8.1%) |
Public vs Private Health Insurance Coverage by Age in Pecan Hill
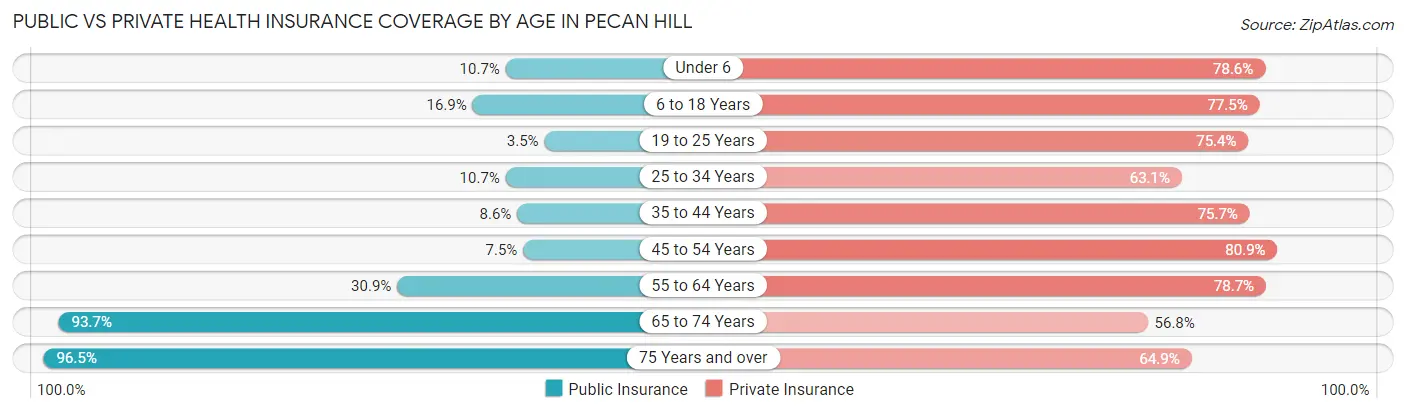
| Age Bracket | Public Insurance | Private Insurance |
| Under 6 | 3 (10.7%) | 22 (78.6%) |
| 6 to 18 Years | 15 (16.9%) | 69 (77.5%) |
| 19 to 25 Years | 2 (3.5%) | 43 (75.4%) |
| 25 to 34 Years | 9 (10.7%) | 53 (63.1%) |
| 35 to 44 Years | 6 (8.6%) | 53 (75.7%) |
| 45 to 54 Years | 7 (7.4%) | 76 (80.8%) |
| 55 to 64 Years | 29 (30.8%) | 74 (78.7%) |
| 65 to 74 Years | 104 (93.7%) | 63 (56.8%) |
| 75 Years and over | 55 (96.5%) | 37 (64.9%) |
| Total | 230 (33.6%) | 490 (71.6%) |
Disability Status by Sex by Age in Pecan Hill
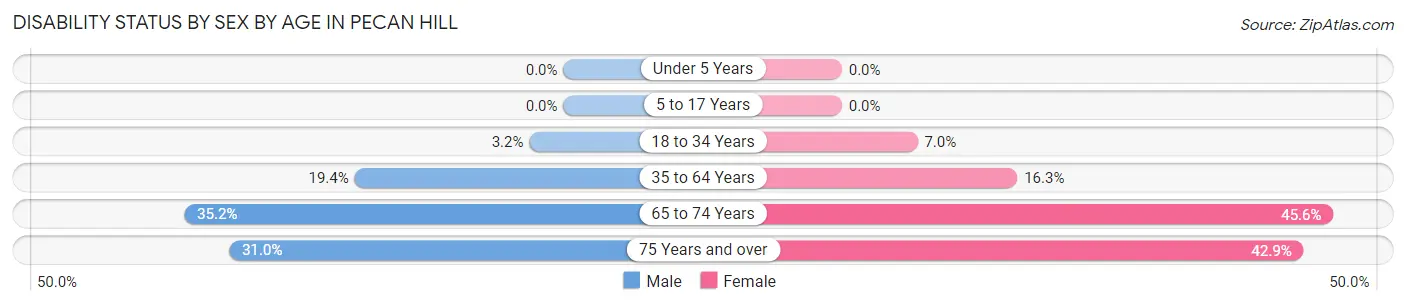
| Age Bracket | Male | Female |
| Under 5 Years | 0 (0.0%) | 0 (0.0%) |
| 5 to 17 Years | 0 (0.0%) | 0 (0.0%) |
| 18 to 34 Years | 3 (3.2%) | 4 (7.0%) |
| 35 to 64 Years | 25 (19.4%) | 21 (16.3%) |
| 65 to 74 Years | 19 (35.2%) | 26 (45.6%) |
| 75 Years and over | 9 (31.0%) | 12 (42.9%) |
Disability Class by Sex by Age in Pecan Hill
Disability Class: Hearing Difficulty
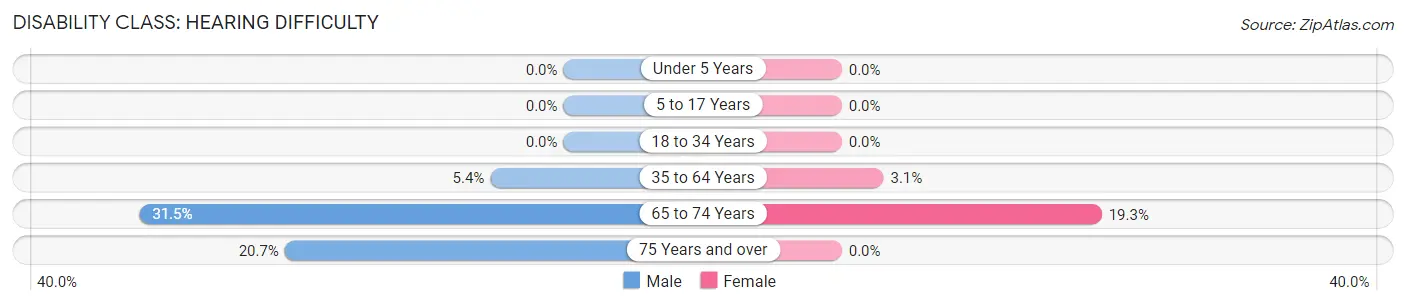
| Age Bracket | Male | Female |
| Under 5 Years | 0 (0.0%) | 0 (0.0%) |
| 5 to 17 Years | 0 (0.0%) | 0 (0.0%) |
| 18 to 34 Years | 0 (0.0%) | 0 (0.0%) |
| 35 to 64 Years | 7 (5.4%) | 4 (3.1%) |
| 65 to 74 Years | 17 (31.5%) | 11 (19.3%) |
| 75 Years and over | 6 (20.7%) | 0 (0.0%) |
Disability Class: Vision Difficulty
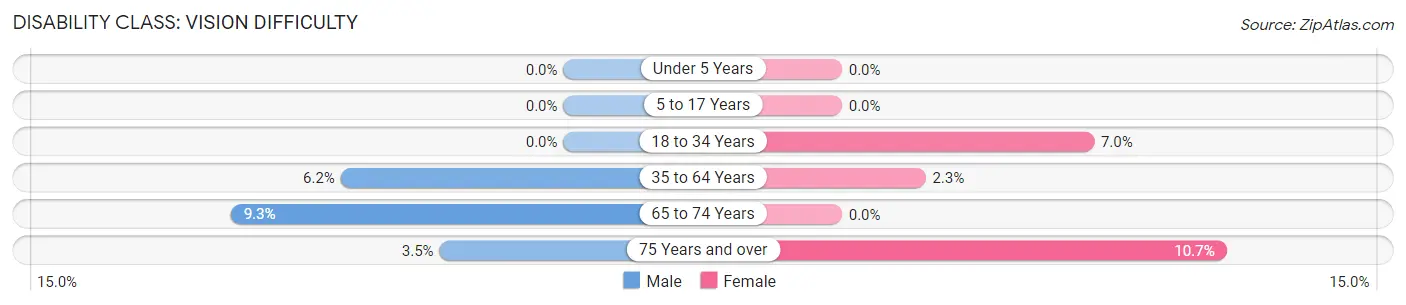
| Age Bracket | Male | Female |
| Under 5 Years | 0 (0.0%) | 0 (0.0%) |
| 5 to 17 Years | 0 (0.0%) | 0 (0.0%) |
| 18 to 34 Years | 0 (0.0%) | 4 (7.0%) |
| 35 to 64 Years | 8 (6.2%) | 3 (2.3%) |
| 65 to 74 Years | 5 (9.3%) | 0 (0.0%) |
| 75 Years and over | 1 (3.5%) | 3 (10.7%) |
Disability Class: Cognitive Difficulty
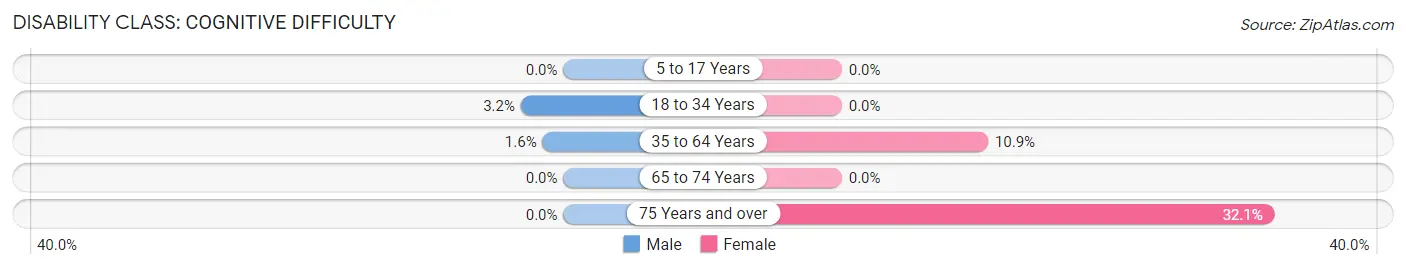
| Age Bracket | Male | Female |
| 5 to 17 Years | 0 (0.0%) | 0 (0.0%) |
| 18 to 34 Years | 3 (3.2%) | 0 (0.0%) |
| 35 to 64 Years | 2 (1.5%) | 14 (10.8%) |
| 65 to 74 Years | 0 (0.0%) | 0 (0.0%) |
| 75 Years and over | 0 (0.0%) | 9 (32.1%) |
Disability Class: Ambulatory Difficulty
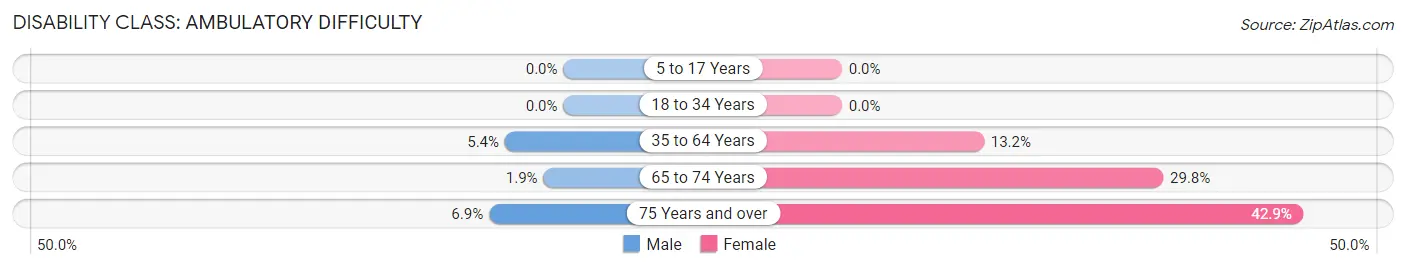
| Age Bracket | Male | Female |
| 5 to 17 Years | 0 (0.0%) | 0 (0.0%) |
| 18 to 34 Years | 0 (0.0%) | 0 (0.0%) |
| 35 to 64 Years | 7 (5.4%) | 17 (13.2%) |
| 65 to 74 Years | 1 (1.8%) | 17 (29.8%) |
| 75 Years and over | 2 (6.9%) | 12 (42.9%) |
Disability Class: Self-Care Difficulty
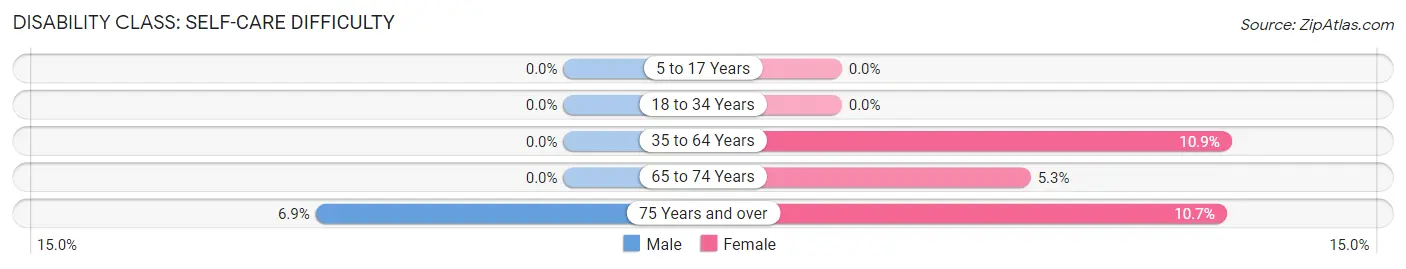
| Age Bracket | Male | Female |
| 5 to 17 Years | 0 (0.0%) | 0 (0.0%) |
| 18 to 34 Years | 0 (0.0%) | 0 (0.0%) |
| 35 to 64 Years | 0 (0.0%) | 14 (10.8%) |
| 65 to 74 Years | 0 (0.0%) | 3 (5.3%) |
| 75 Years and over | 2 (6.9%) | 3 (10.7%) |
Technology Access in Pecan Hill
Computing Device Access in Pecan Hill
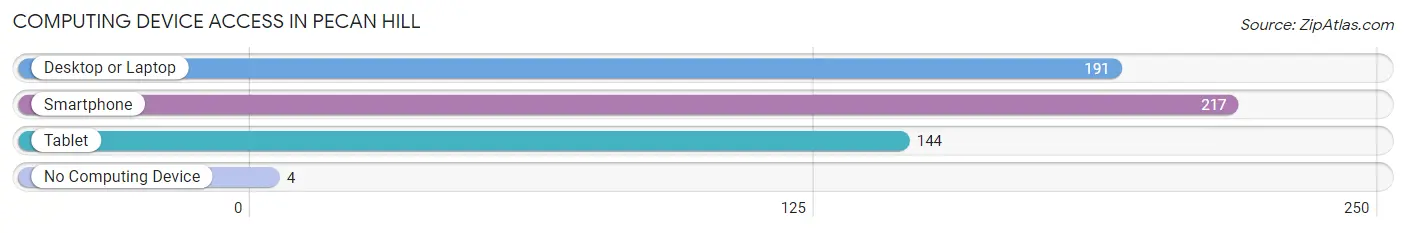
| Device Type | # Households | % Households |
| Desktop or Laptop | 191 | 82.3% |
| Smartphone | 217 | 93.5% |
| Tablet | 144 | 62.1% |
| No Computing Device | 4 | 1.7% |
| Total | 232 | 100.0% |
Internet Access in Pecan Hill
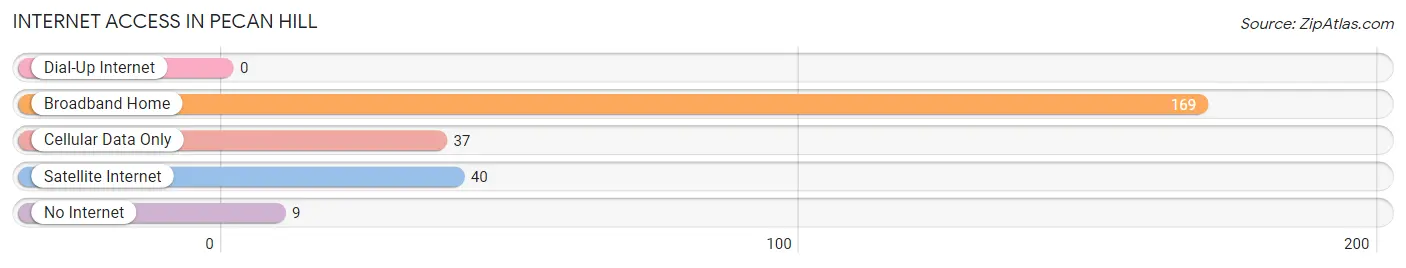
| Internet Type | # Households | % Households |
| Dial-Up Internet | 0 | 0.0% |
| Broadband Home | 169 | 72.8% |
| Cellular Data Only | 37 | 16.0% |
| Satellite Internet | 40 | 17.2% |
| No Internet | 9 | 3.9% |
| Total | 232 | 100.0% |
Pecan Hill Summary
Pecan Hill is a small town located in Collin County, Texas, United States. It is situated about 30 miles northeast of Dallas and is part of the Dallas-Fort Worth-Arlington metropolitan area. The town has a population of approximately 1,000 people and is known for its rural atmosphere and its pecan trees.
History
Pecan Hill was founded in 1872 by a group of settlers from Kentucky. The town was originally called “Pecan Hill” because of the abundance of pecan trees in the area. The town was incorporated in 1876 and the first post office was established in 1877.
The town grew slowly over the years and by the early 1900s, it had a population of around 500 people. The town was primarily an agricultural community, with cotton and corn being the main crops. In the 1920s, the town began to experience a population boom as more people moved to the area to take advantage of the fertile soil and the abundance of pecan trees.
By the 1950s, the population had grown to around 1,000 people and the town had become a popular tourist destination. The town was known for its pecan pies, which were sold in local stores and restaurants.
Geography
Pecan Hill is located in Collin County, Texas, about 30 miles northeast of Dallas. The town is situated on the banks of the Trinity River and is surrounded by rolling hills and pecan trees. The town has a total area of 1.2 square miles and a population density of 830 people per square mile.
The climate in Pecan Hill is humid subtropical, with hot summers and mild winters. The average annual temperature is around 70 degrees Fahrenheit and the average annual precipitation is around 40 inches.
Economy
The economy of Pecan Hill is primarily based on agriculture. The town is known for its pecan trees, which are harvested for their nuts. The town also produces cotton, corn, and other crops.
In addition to agriculture, the town also has a few small businesses, including a grocery store, a hardware store, and a few restaurants. The town also has a few small manufacturing companies that produce furniture and other items.
Demographics
As of the 2010 census, the population of Pecan Hill was 1,000 people. The racial makeup of the town was 94.2% White, 0.7% African American, 0.2% Native American, 0.2% Asian, 0.1% Pacific Islander, and 4.7% from other races. Hispanic or Latino of any race were 8.2% of the population.
The median income for a household in Pecan Hill was $45,000 and the median income for a family was $50,000. The per capita income for the town was $20,000. About 10.2% of the population was below the poverty line.
Pecan Hill is a small town with a rural atmosphere and a strong sense of community. The town is known for its pecan trees and its agricultural heritage. The town has a few small businesses and is a popular tourist destination. The town has a population of around 1,000 people and is a great place to live and work.
Common Questions
What is Per Capita Income in Pecan Hill?
Per Capita income in Pecan Hill is $38,940.
What is the Median Family Income in Pecan Hill?
Median Family Income in Pecan Hill is $101,989.
What is the Median Household income in Pecan Hill?
Median Household Income in Pecan Hill is $101,705.
What is Income or Wage Gap in Pecan Hill?
Income or Wage Gap in Pecan Hill is 9.5%.
Women in Pecan Hill earn 90.5 cents for every dollar earned by a man.
What is Inequality or Gini Index in Pecan Hill?
Inequality or Gini Index in Pecan Hill is 0.34.
What is the Total Population of Pecan Hill?
Total Population of Pecan Hill is 684.
What is the Total Male Population of Pecan Hill?
Total Male Population of Pecan Hill is 378.
What is the Total Female Population of Pecan Hill?
Total Female Population of Pecan Hill is 306.
What is the Ratio of Males per 100 Females in Pecan Hill?
There are 123.53 Males per 100 Females in Pecan Hill.
What is the Ratio of Females per 100 Males in Pecan Hill?
There are 80.95 Females per 100 Males in Pecan Hill.
What is the Median Population Age in Pecan Hill?
Median Population Age in Pecan Hill is 48.5 Years.
What is the Average Family Size in Pecan Hill
Average Family Size in Pecan Hill is 3.1 People.
What is the Average Household Size in Pecan Hill
Average Household Size in Pecan Hill is 3.0 People.
How Large is the Labor Force in Pecan Hill?
There are 374 People in the Labor Forcein in Pecan Hill.
What is the Percentage of People in the Labor Force in Pecan Hill?
63.1% of People are in the Labor Force in Pecan Hill.
What is the Unemployment Rate in Pecan Hill?
Unemployment Rate in Pecan Hill is 3.2%.