Zip Codes with the Highest Percentage of Population Employed in Real Estate, Rental & Leasing in Corpus Christi, TX
RELATED REPORTS & OPTIONS
Real Estate, Rental & Leasing
Corpus Christi
Compare Zip Codes
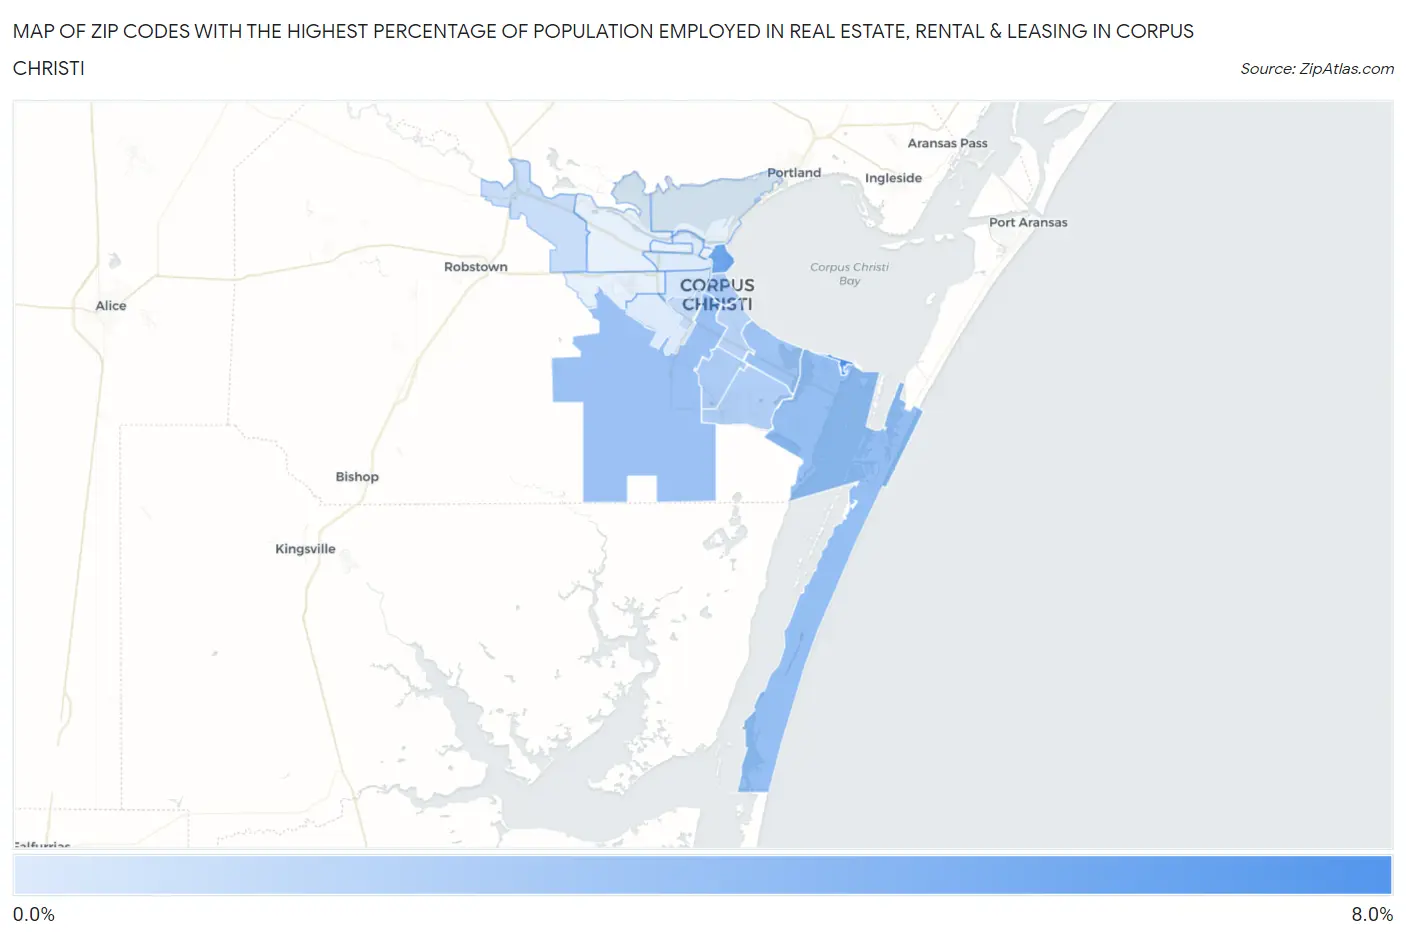
Map of Zip Codes with the Highest Percentage of Population Employed in Real Estate, Rental & Leasing in Corpus Christi
0.22%
6.7%
Zip Codes with the Highest Percentage of Population Employed in Real Estate, Rental & Leasing in Corpus Christi, TX
| Zip Code | % Employed | vs State | vs National | |
| 1. | 78419 | 6.7% | 2.0%(+4.71)#35 | 1.9%(+4.83)#782 |
| 2. | 78401 | 5.0% | 2.0%(+3.01)#74 | 1.9%(+3.13)#1,371 |
| 3. | 78418 | 3.3% | 2.0%(+1.26)#208 | 1.9%(+1.38)#3,279 |
| 4. | 78415 | 3.0% | 2.0%(+1.04)#247 | 1.9%(+1.16)#3,767 |
| 5. | 78412 | 2.9% | 2.0%(+0.914)#279 | 1.9%(+1.03)#4,106 |
| 6. | 78404 | 2.3% | 2.0%(+0.320)#446 | 1.9%(+0.436)#6,188 |
| 7. | 78413 | 2.3% | 2.0%(+0.281)#459 | 1.9%(+0.397)#6,356 |
| 8. | 78414 | 2.1% | 2.0%(+0.114)#526 | 1.9%(+0.230)#7,205 |
| 9. | 78411 | 1.8% | 2.0%(-0.189)#643 | 1.9%(-0.073)#8,994 |
| 10. | 78416 | 1.3% | 2.0%(-0.738)#920 | 1.9%(-0.622)#12,960 |
| 11. | 78410 | 1.1% | 2.0%(-0.951)#1,004 | 1.9%(-0.835)#14,663 |
| 12. | 78405 | 0.64% | 2.0%(-1.37)#1,180 | 1.9%(-1.26)#17,986 |
| 13. | 78408 | 0.27% | 2.0%(-1.74)#1,302 | 1.9%(-1.62)#20,649 |
| 14. | 78417 | 0.22% | 2.0%(-1.78)#1,312 | 1.9%(-1.67)#20,881 |
1
Common Questions
What are the Top 10 Zip Codes with the Highest Percentage of Population Employed in Real Estate, Rental & Leasing in Corpus Christi, TX?
Top 10 Zip Codes with the Highest Percentage of Population Employed in Real Estate, Rental & Leasing in Corpus Christi, TX are:
What zip code has the Highest Percentage of Population Employed in Real Estate, Rental & Leasing in Corpus Christi, TX?
78419 has the Highest Percentage of Population Employed in Real Estate, Rental & Leasing in Corpus Christi, TX with 6.7%.
What is the Percentage of Population Employed in Real Estate, Rental & Leasing in Corpus Christi, TX?
Percentage of Population Employed in Real Estate, Rental & Leasing in Corpus Christi is 2.3%.
What is the Percentage of Population Employed in Real Estate, Rental & Leasing in Texas?
Percentage of Population Employed in Real Estate, Rental & Leasing in Texas is 2.0%.
What is the Percentage of Population Employed in Real Estate, Rental & Leasing in the United States?
Percentage of Population Employed in Real Estate, Rental & Leasing in the United States is 1.9%.