Zip Codes with the Highest Percentage of Population Employed in Real Estate, Rental & Leasing in Spring, TX
RELATED REPORTS & OPTIONS
Real Estate, Rental & Leasing
Spring
Compare Zip Codes
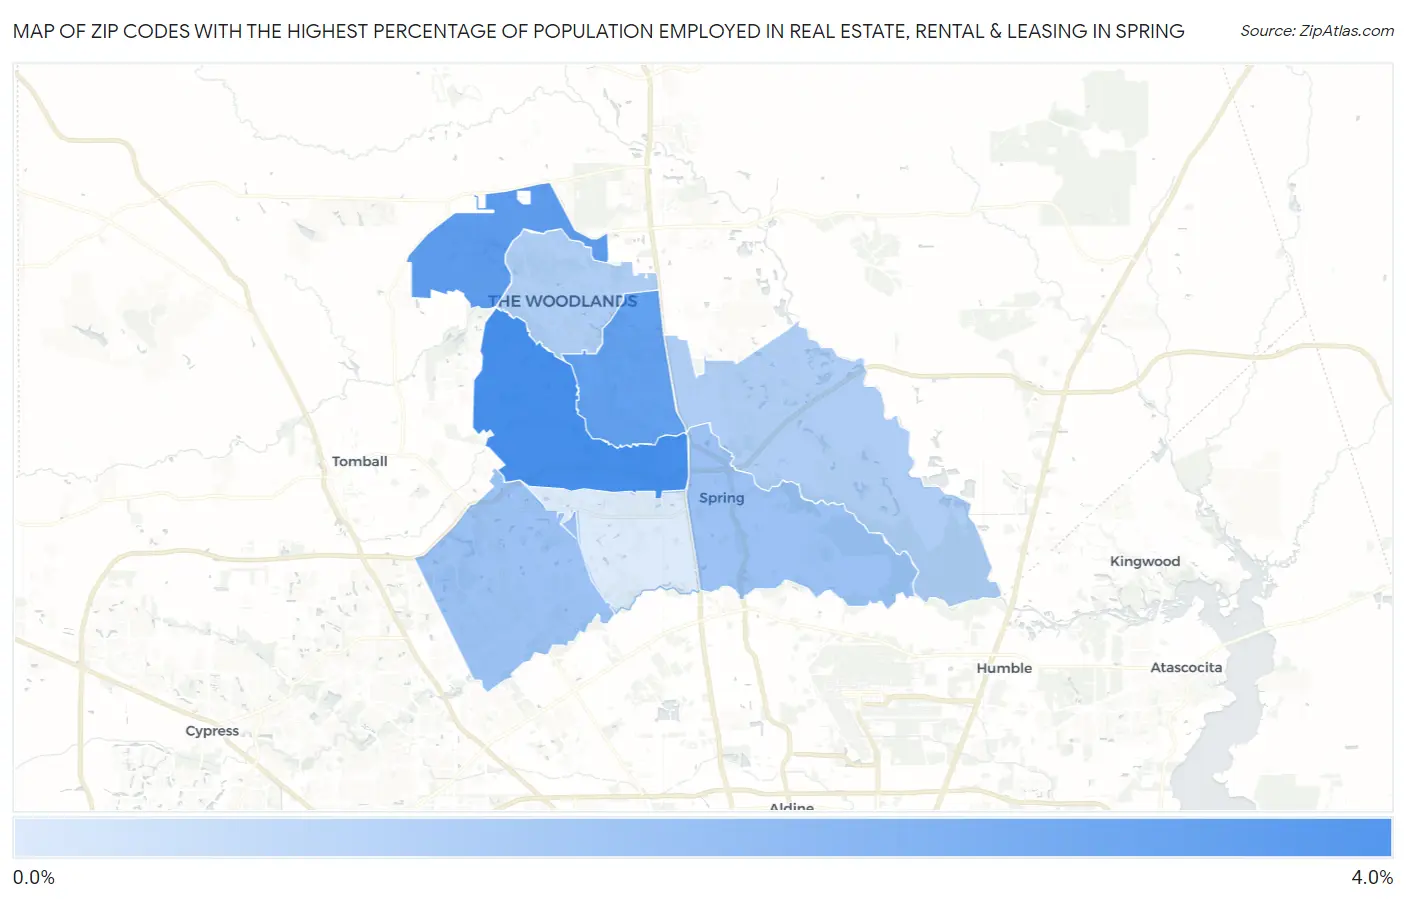
Map of Zip Codes with the Highest Percentage of Population Employed in Real Estate, Rental & Leasing in Spring
0.92%
3.2%
Zip Codes with the Highest Percentage of Population Employed in Real Estate, Rental & Leasing in Spring, TX
| Zip Code | % Employed | vs State | vs National | |
| 1. | 77389 | 3.2% | 2.0%(+1.20)#214 | 1.9%(+1.32)#3,402 |
| 2. | 77382 | 2.9% | 2.0%(+0.848)#296 | 1.9%(+0.964)#4,288 |
| 3. | 77380 | 2.8% | 2.0%(+0.777)#314 | 1.9%(+0.893)#4,471 |
| 4. | 77379 | 1.9% | 2.0%(-0.061)#587 | 1.9%(+0.055)#8,145 |
| 5. | 77373 | 1.9% | 2.0%(-0.079)#596 | 1.9%(+0.037)#8,263 |
| 6. | 77386 | 1.6% | 2.0%(-0.394)#741 | 1.9%(-0.278)#10,358 |
| 7. | 77381 | 1.6% | 2.0%(-0.410)#750 | 1.9%(-0.294)#10,449 |
| 8. | 77388 | 0.92% | 2.0%(-1.09)#1,067 | 1.9%(-0.975)#15,828 |
1
Common Questions
What are the Top 5 Zip Codes with the Highest Percentage of Population Employed in Real Estate, Rental & Leasing in Spring, TX?
Top 5 Zip Codes with the Highest Percentage of Population Employed in Real Estate, Rental & Leasing in Spring, TX are:
What zip code has the Highest Percentage of Population Employed in Real Estate, Rental & Leasing in Spring, TX?
77389 has the Highest Percentage of Population Employed in Real Estate, Rental & Leasing in Spring, TX with 3.2%.
What is the Percentage of Population Employed in Real Estate, Rental & Leasing in Spring, TX?
Percentage of Population Employed in Real Estate, Rental & Leasing in Spring is 2.0%.
What is the Percentage of Population Employed in Real Estate, Rental & Leasing in Texas?
Percentage of Population Employed in Real Estate, Rental & Leasing in Texas is 2.0%.
What is the Percentage of Population Employed in Real Estate, Rental & Leasing in the United States?
Percentage of Population Employed in Real Estate, Rental & Leasing in the United States is 1.9%.