Kempner, TX Map & Demographics
Kempner Map
Kempner Overview
$29,541
PER CAPITA INCOME
$67,270
AVG FAMILY INCOME
$67,204
AVG HOUSEHOLD INCOME
29.4%
WAGE / INCOME GAP [ % ]
70.6¢/ $1
WAGE / INCOME GAP [ $ ]
0.37
INEQUALITY / GINI INDEX
1,346
TOTAL POPULATION
715
MALE POPULATION
631
FEMALE POPULATION
113.31
MALES / 100 FEMALES
88.25
FEMALES / 100 MALES
45.8
MEDIAN AGE
3.6
AVG FAMILY SIZE
3.0
AVG HOUSEHOLD SIZE
759
LABOR FORCE [ PEOPLE ]
69.4%
PERCENT IN LABOR FORCE
2.0%
UNEMPLOYMENT RATE
Kempner Zip Codes
Kempner Area Codes
Income in Kempner
Income Overview in Kempner
Per Capita Income in Kempner is $29,541, while median incomes of families and households are $67,270 and $67,204 respectively.
| Characteristic | Number | Measure |
| Per Capita Income | 1,346 | $29,541 |
| Median Family Income | 307 | $67,270 |
| Mean Family Income | 307 | $88,281 |
| Median Household Income | 443 | $67,204 |
| Mean Household Income | 443 | $81,596 |
| Income Deficit | 307 | $0 |
| Wage / Income Gap (%) | 1,346 | 29.42% |
| Wage / Income Gap ($) | 1,346 | 70.58¢ per $1 |
| Gini / Inequality Index | 1,346 | 0.37 |
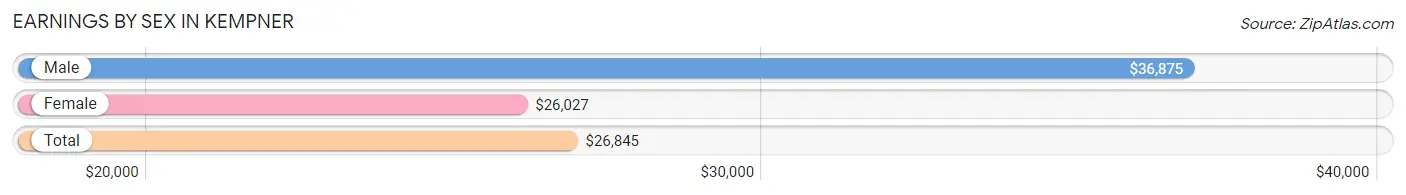
Earnings by Sex in Kempner
Average Earnings in Kempner are $26,845, $36,875 for men and $26,027 for women, a difference of 29.4%.
| Sex | Number | Average Earnings |
| Male | 399 (51.5%) | $36,875 |
| Female | 375 (48.4%) | $26,027 |
| Total | 774 (100.0%) | $26,845 |
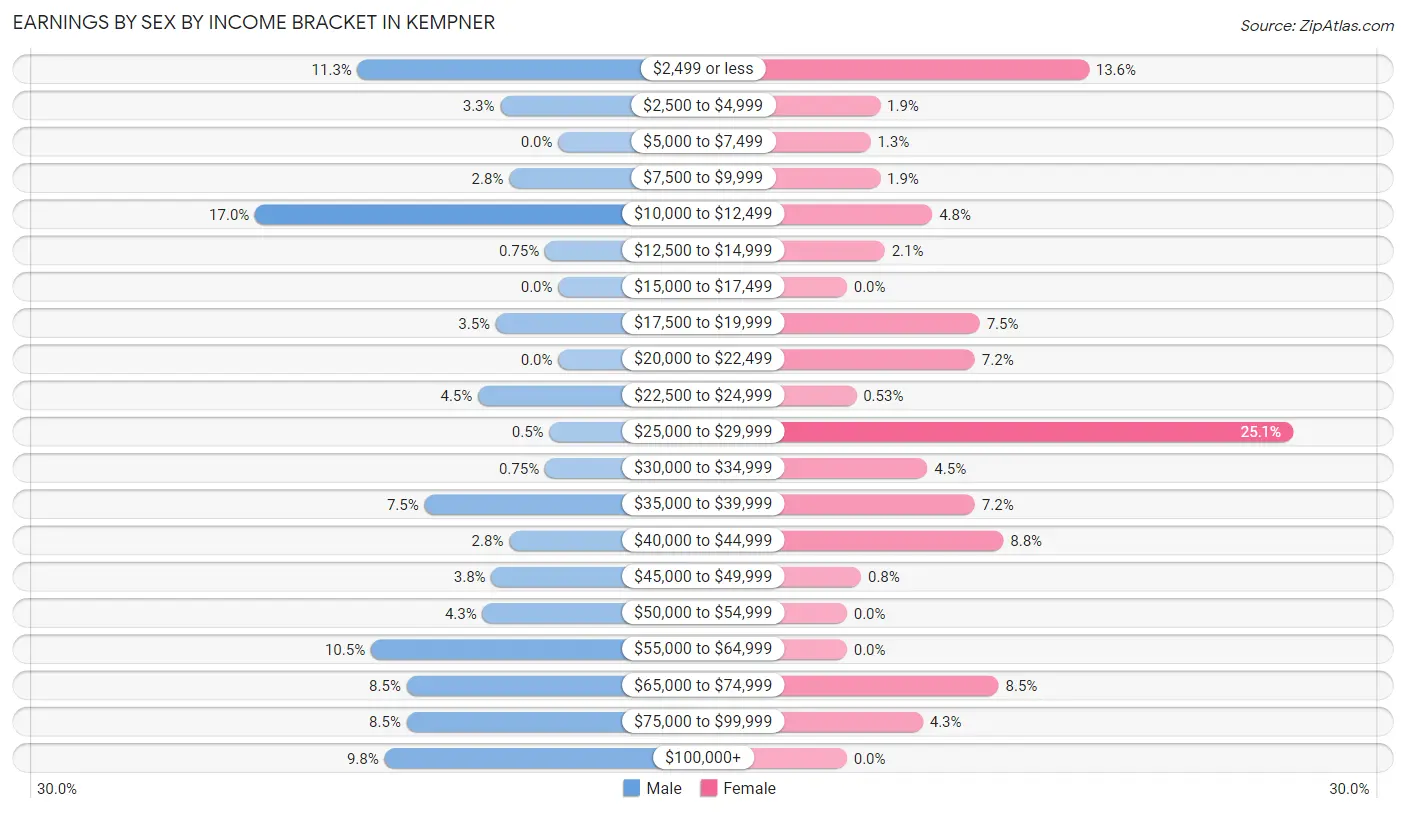
Earnings by Sex by Income Bracket in Kempner
The most common earnings brackets in Kempner are $10,000 to $12,499 for men (68 | 17.0%) and $25,000 to $29,999 for women (94 | 25.1%).
| Income | Male | Female |
| $2,499 or less | 45 (11.3%) | 51 (13.6%) |
| $2,500 to $4,999 | 13 (3.3%) | 7 (1.9%) |
| $5,000 to $7,499 | 0 (0.0%) | 5 (1.3%) |
| $7,500 to $9,999 | 11 (2.8%) | 7 (1.9%) |
| $10,000 to $12,499 | 68 (17.0%) | 18 (4.8%) |
| $12,500 to $14,999 | 3 (0.7%) | 8 (2.1%) |
| $15,000 to $17,499 | 0 (0.0%) | 0 (0.0%) |
| $17,500 to $19,999 | 14 (3.5%) | 28 (7.5%) |
| $20,000 to $22,499 | 0 (0.0%) | 27 (7.2%) |
| $22,500 to $24,999 | 18 (4.5%) | 2 (0.5%) |
| $25,000 to $29,999 | 2 (0.5%) | 94 (25.1%) |
| $30,000 to $34,999 | 3 (0.7%) | 17 (4.5%) |
| $35,000 to $39,999 | 30 (7.5%) | 27 (7.2%) |
| $40,000 to $44,999 | 11 (2.8%) | 33 (8.8%) |
| $45,000 to $49,999 | 15 (3.8%) | 3 (0.8%) |
| $50,000 to $54,999 | 17 (4.3%) | 0 (0.0%) |
| $55,000 to $64,999 | 42 (10.5%) | 0 (0.0%) |
| $65,000 to $74,999 | 34 (8.5%) | 32 (8.5%) |
| $75,000 to $99,999 | 34 (8.5%) | 16 (4.3%) |
| $100,000+ | 39 (9.8%) | 0 (0.0%) |
| Total | 399 (100.0%) | 375 (100.0%) |
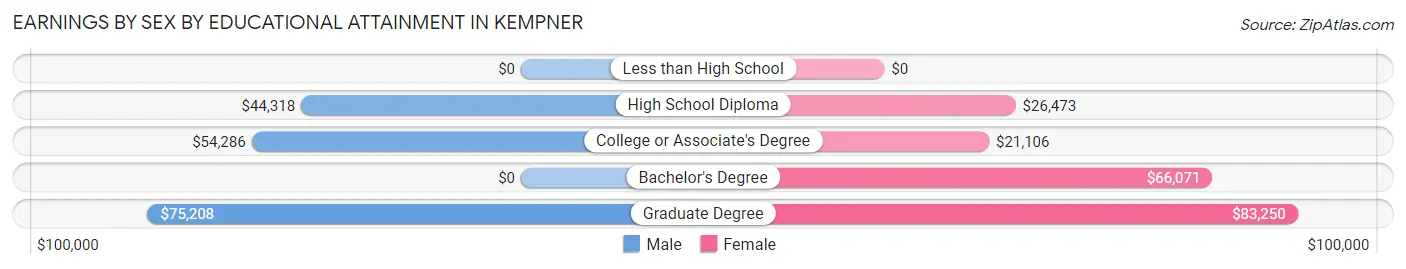
Earnings by Sex by Educational Attainment in Kempner
Average earnings in Kempner are $49,519 for men and $26,343 for women, a difference of 46.8%. Men with an educational attainment of graduate degree enjoy the highest average annual earnings of $75,208, while those with high school diploma education earn the least with $44,318. Women with an educational attainment of graduate degree earn the most with the average annual earnings of $83,250, while those with college or associate's degree education have the smallest earnings of $21,106.
| Educational Attainment | Male Income | Female Income |
| Less than High School | - | - |
| High School Diploma | $44,318 | $26,473 |
| College or Associate's Degree | $54,286 | $21,106 |
| Bachelor's Degree | - | - |
| Graduate Degree | $75,208 | $83,250 |
| Total | $49,519 | $26,343 |
Family Income in Kempner
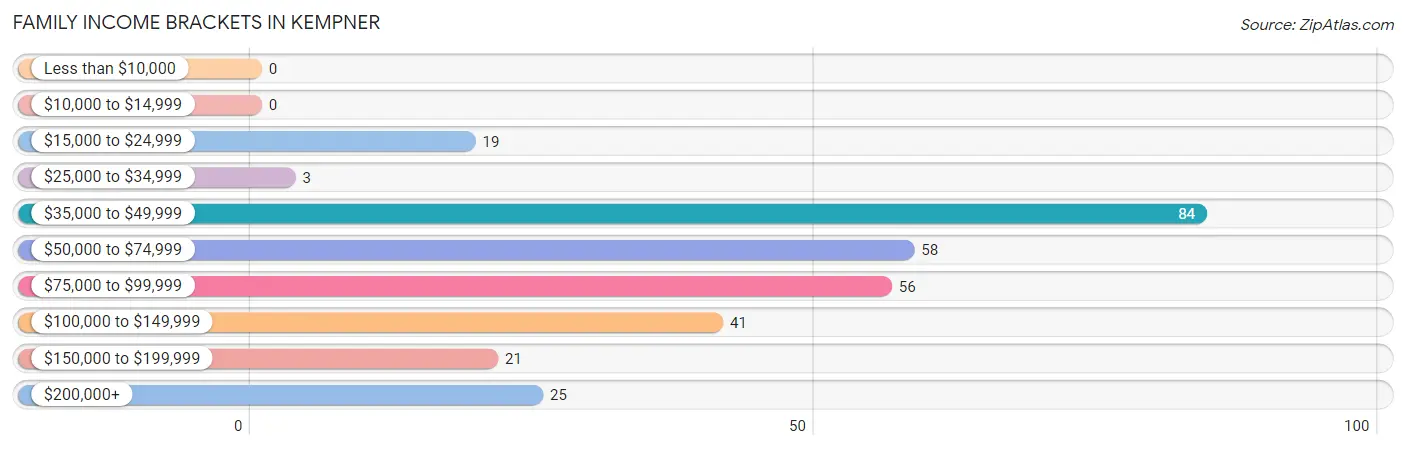
Family Income Brackets in Kempner
According to the Kempner family income data, there are 84 families falling into the $35,000 to $49,999 income range, which is the most common income bracket and makes up 27.4% of all families.
| Income Bracket | # Families | % Families |
| Less than $10,000 | 0 | 0.0% |
| $10,000 to $14,999 | 0 | 0.0% |
| $15,000 to $24,999 | 19 | 6.2% |
| $25,000 to $34,999 | 3 | 1.0% |
| $35,000 to $49,999 | 84 | 27.4% |
| $50,000 to $74,999 | 58 | 18.9% |
| $75,000 to $99,999 | 56 | 18.2% |
| $100,000 to $149,999 | 41 | 13.4% |
| $150,000 to $199,999 | 21 | 6.8% |
| $200,000+ | 25 | 8.1% |
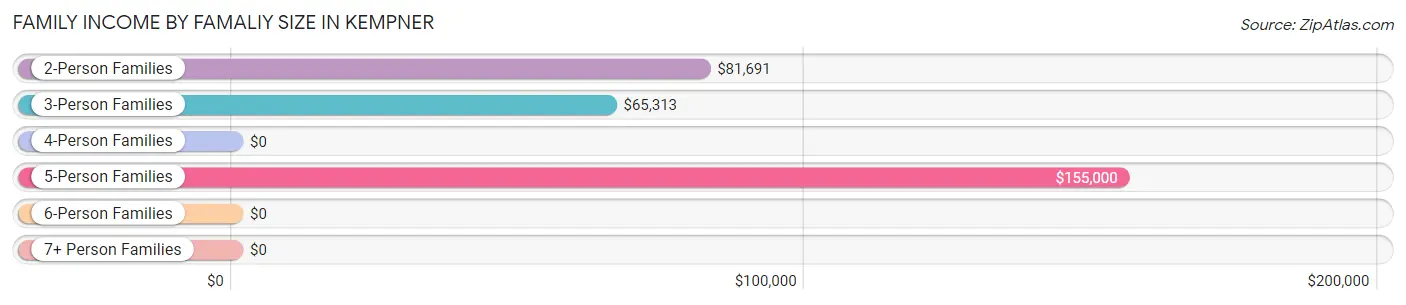
Family Income by Famaliy Size in Kempner
5-person families (24 | 7.8%) account for the highest median family income in Kempner with $155,000 per family, while 2-person families (117 | 38.1%) have the highest median income of $40,846 per family member.
| Income Bracket | # Families | Median Income |
| 2-Person Families | 117 (38.1%) | $81,691 |
| 3-Person Families | 103 (33.6%) | $65,313 |
| 4-Person Families | 37 (12.0%) | $0 |
| 5-Person Families | 24 (7.8%) | $155,000 |
| 6-Person Families | 26 (8.5%) | $0 |
| 7+ Person Families | 0 (0.0%) | $0 |
| Total | 307 (100.0%) | $67,270 |
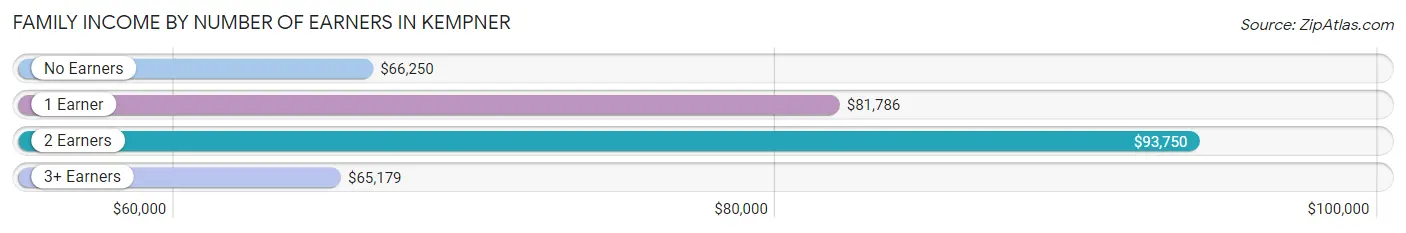
Family Income by Number of Earners in Kempner
The median family income in Kempner is $67,270, with families comprising 2 earners (89) having the highest median family income of $93,750, while families with 3+ earners (82) have the lowest median family income of $65,179, accounting for 29.0% and 26.7% of families, respectively.
| Number of Earners | # Families | Median Income |
| No Earners | 44 (14.3%) | $66,250 |
| 1 Earner | 92 (30.0%) | $81,786 |
| 2 Earners | 89 (29.0%) | $93,750 |
| 3+ Earners | 82 (26.7%) | $65,179 |
| Total | 307 (100.0%) | $67,270 |
Household Income in Kempner
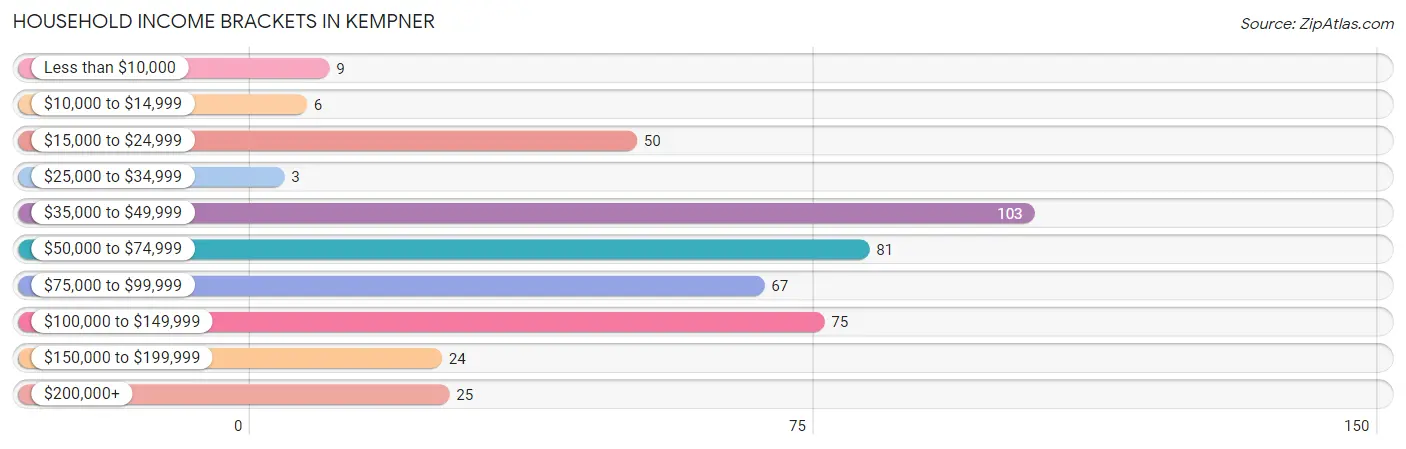
Household Income Brackets in Kempner
With 103 households falling in the category, the $35,000 to $49,999 income range is the most frequent in Kempner, accounting for 23.3% of all households. In contrast, only 3 households (0.7%) fall into the $25,000 to $34,999 income bracket, making it the least populous group.
| Income Bracket | # Households | % Households |
| Less than $10,000 | 9 | 2.0% |
| $10,000 to $14,999 | 6 | 1.4% |
| $15,000 to $24,999 | 50 | 11.3% |
| $25,000 to $34,999 | 3 | 0.7% |
| $35,000 to $49,999 | 103 | 23.3% |
| $50,000 to $74,999 | 81 | 18.3% |
| $75,000 to $99,999 | 67 | 15.1% |
| $100,000 to $149,999 | 75 | 16.9% |
| $150,000 to $199,999 | 24 | 5.4% |
| $200,000+ | 25 | 5.6% |
Household Income by Householder Age in Kempner
The median household income in Kempner is $67,204, with the highest median household income of $71,458 found in the 45 to 64 years age bracket for the primary householder. A total of 239 households (53.9%) fall into this category.
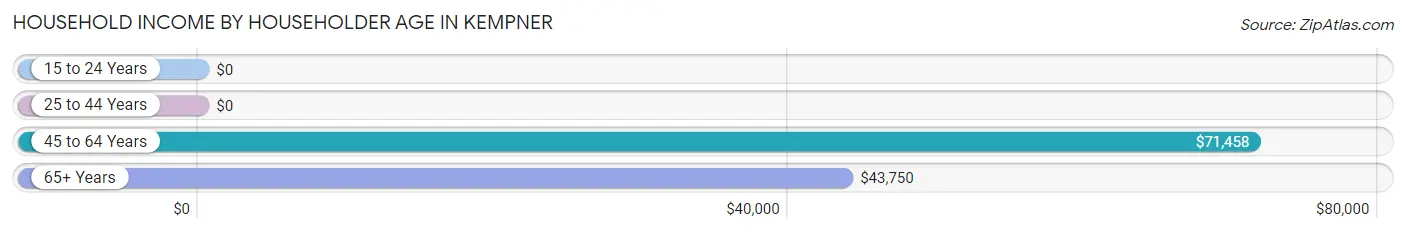
| Income Bracket | # Households | Median Income |
| 15 to 24 Years | 0 (0.0%) | $0 |
| 25 to 44 Years | 96 (21.7%) | $0 |
| 45 to 64 Years | 239 (53.9%) | $71,458 |
| 65+ Years | 108 (24.4%) | $43,750 |
| Total | 443 (100.0%) | $67,204 |
Poverty in Kempner
Income Below Poverty by Sex and Age in Kempner
With 8.8% poverty level for males and 6.0% for females among the residents of Kempner, 5 year old males and 25 to 34 year old females are the most vulnerable to poverty, with 6 males (100.0%) and 18 females (27.3%) in their respective age groups living below the poverty level.
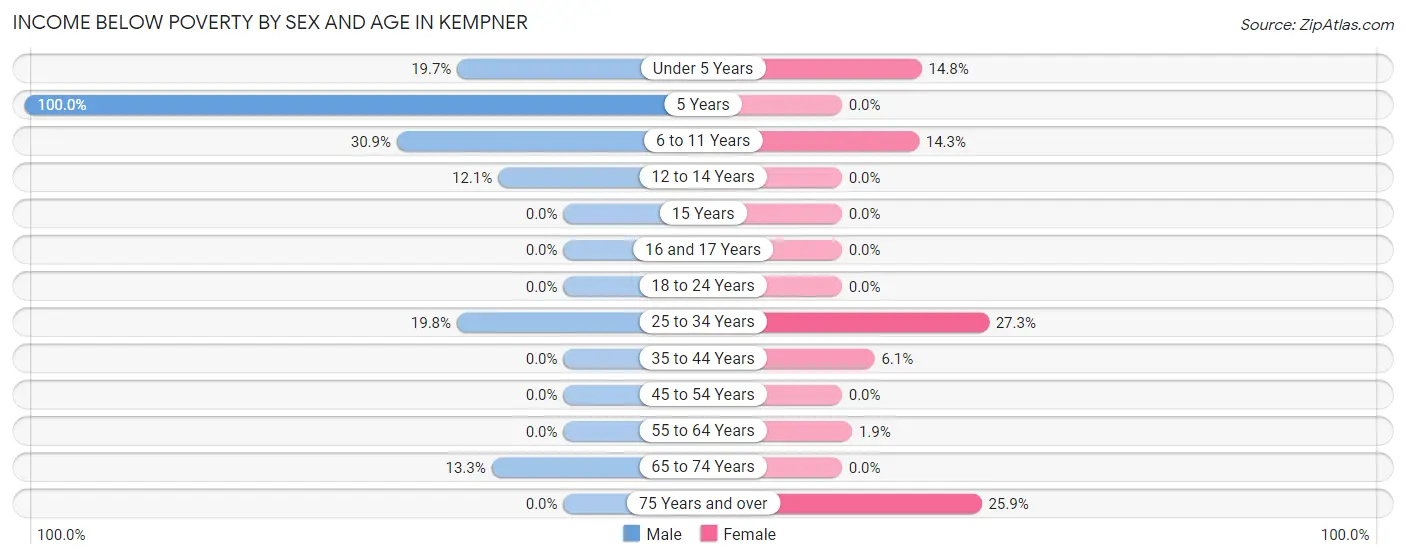
| Age Bracket | Male | Female |
| Under 5 Years | 13 (19.7%) | 4 (14.8%) |
| 5 Years | 6 (100.0%) | 0 (0.0%) |
| 6 to 11 Years | 17 (30.9%) | 4 (14.3%) |
| 12 to 14 Years | 4 (12.1%) | 0 (0.0%) |
| 15 Years | 0 (0.0%) | 0 (0.0%) |
| 16 and 17 Years | 0 (0.0%) | 0 (0.0%) |
| 18 to 24 Years | 0 (0.0%) | 0 (0.0%) |
| 25 to 34 Years | 17 (19.8%) | 18 (27.3%) |
| 35 to 44 Years | 0 (0.0%) | 2 (6.1%) |
| 45 to 54 Years | 0 (0.0%) | 0 (0.0%) |
| 55 to 64 Years | 0 (0.0%) | 3 (1.9%) |
| 65 to 74 Years | 6 (13.3%) | 0 (0.0%) |
| 75 Years and over | 0 (0.0%) | 7 (25.9%) |
| Total | 63 (8.8%) | 38 (6.0%) |
Income Above Poverty by Sex and Age in Kempner
According to the poverty statistics in Kempner, males aged 15 years and females aged 5 years are the age groups that are most secure financially, with 100.0% of males and 100.0% of females in these age groups living above the poverty line.
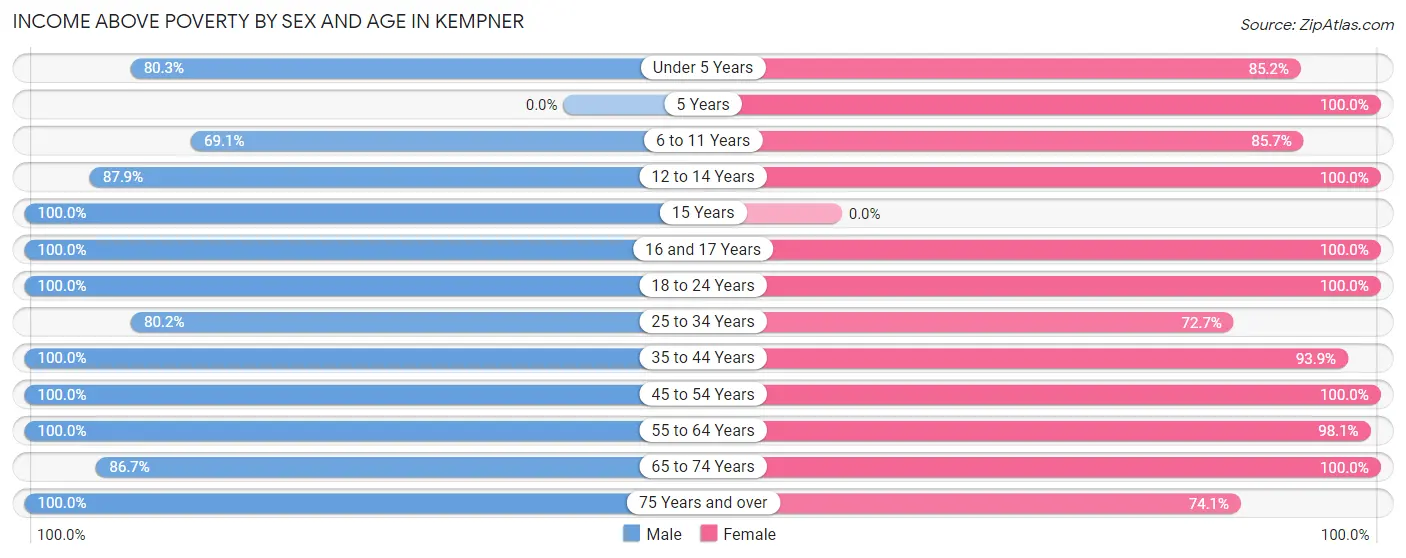
| Age Bracket | Male | Female |
| Under 5 Years | 53 (80.3%) | 23 (85.2%) |
| 5 Years | 0 (0.0%) | 5 (100.0%) |
| 6 to 11 Years | 38 (69.1%) | 24 (85.7%) |
| 12 to 14 Years | 29 (87.9%) | 20 (100.0%) |
| 15 Years | 10 (100.0%) | 0 (0.0%) |
| 16 and 17 Years | 11 (100.0%) | 3 (100.0%) |
| 18 to 24 Years | 62 (100.0%) | 61 (100.0%) |
| 25 to 34 Years | 69 (80.2%) | 48 (72.7%) |
| 35 to 44 Years | 80 (100.0%) | 31 (93.9%) |
| 45 to 54 Years | 87 (100.0%) | 129 (100.0%) |
| 55 to 64 Years | 147 (100.0%) | 156 (98.1%) |
| 65 to 74 Years | 39 (86.7%) | 70 (100.0%) |
| 75 Years and over | 27 (100.0%) | 20 (74.1%) |
| Total | 652 (91.2%) | 590 (94.0%) |
Income Below Poverty Among Married-Couple Families in Kempner
The poverty statistics for married-couple families in Kempner show that 6.1% or 15 of the total 246 families live below the poverty line. Families with 1 or 2 children have the highest poverty rate of 20.7%, comprising of 11 families. On the other hand, families with no children have the lowest poverty rate of 0.0%, which includes 0 families.
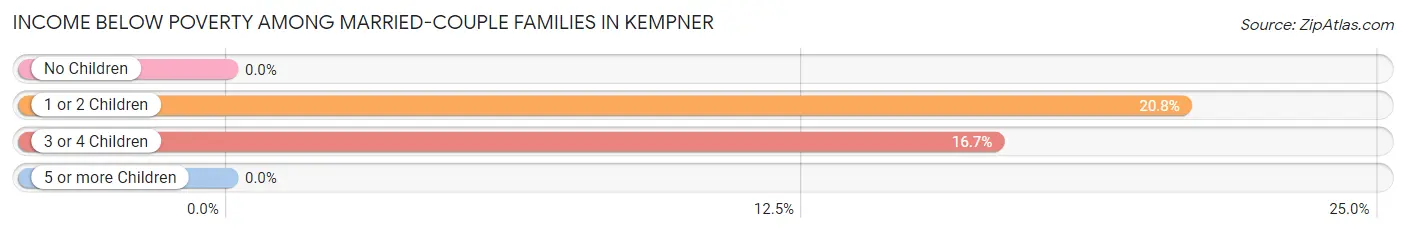
| Children | Above Poverty | Below Poverty |
| No Children | 169 (100.0%) | 0 (0.0%) |
| 1 or 2 Children | 42 (79.2%) | 11 (20.7%) |
| 3 or 4 Children | 20 (83.3%) | 4 (16.7%) |
| 5 or more Children | 0 (0.0%) | 0 (0.0%) |
| Total | 231 (93.9%) | 15 (6.1%) |
Income Below Poverty Among Single-Parent Households in Kempner
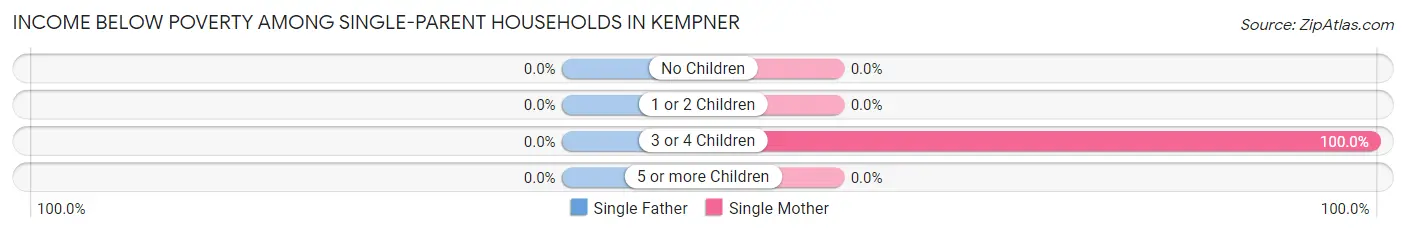
| Children | Single Father | Single Mother |
| No Children | 0 (0.0%) | 0 (0.0%) |
| 1 or 2 Children | 0 (0.0%) | 0 (0.0%) |
| 3 or 4 Children | 0 (0.0%) | 2 (100.0%) |
| 5 or more Children | 0 (0.0%) | 0 (0.0%) |
| Total | 0 (0.0%) | 2 (3.5%) |
Income Below Poverty Among Married-Couple vs Single-Parent Households in Kempner
The poverty data for Kempner shows that 15 of the married-couple family households (6.1%) and 2 of the single-parent households (3.3%) are living below the poverty level. Within the married-couple family households, those with 1 or 2 children have the highest poverty rate, with 11 households (20.7%) falling below the poverty line. Among the single-parent households, those with 3 or 4 children have the highest poverty rate, with 2 household (33.3%) living below poverty.
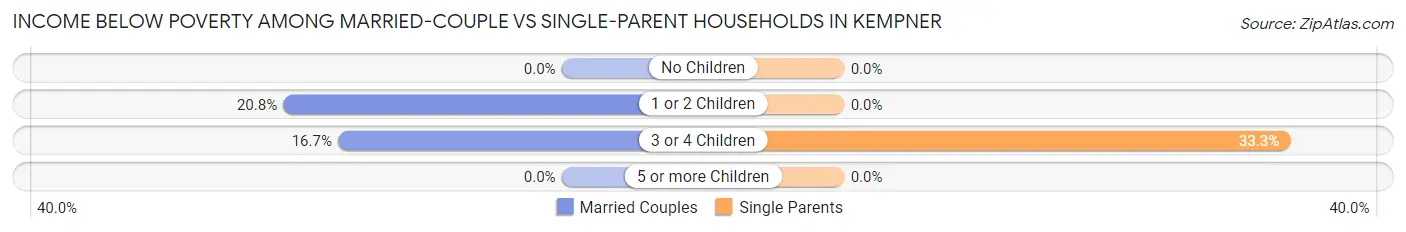
| Children | Married-Couple Families | Single-Parent Households |
| No Children | 0 (0.0%) | 0 (0.0%) |
| 1 or 2 Children | 11 (20.7%) | 0 (0.0%) |
| 3 or 4 Children | 4 (16.7%) | 2 (33.3%) |
| 5 or more Children | 0 (0.0%) | 0 (0.0%) |
| Total | 15 (6.1%) | 2 (3.3%) |
Race in Kempner
The most populous races in Kempner are White / Caucasian (1,011 | 75.1%), Hispanic or Latino (199 | 14.8%), and Black / African American (136 | 10.1%).
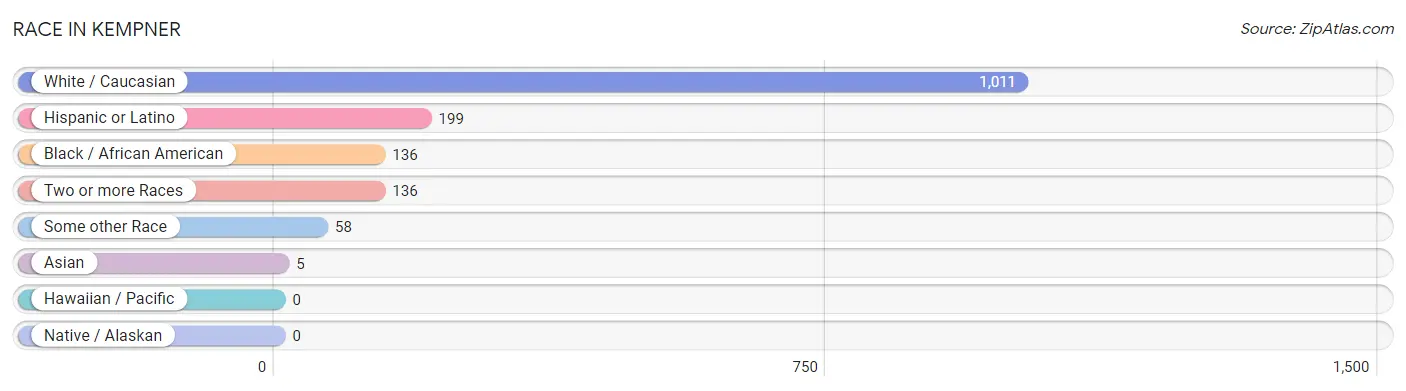
| Race | # Population | % Population |
| Asian | 5 | 0.4% |
| Black / African American | 136 | 10.1% |
| Hawaiian / Pacific | 0 | 0.0% |
| Hispanic or Latino | 199 | 14.8% |
| Native / Alaskan | 0 | 0.0% |
| White / Caucasian | 1,011 | 75.1% |
| Two or more Races | 136 | 10.1% |
| Some other Race | 58 | 4.3% |
| Total | 1,346 | 100.0% |
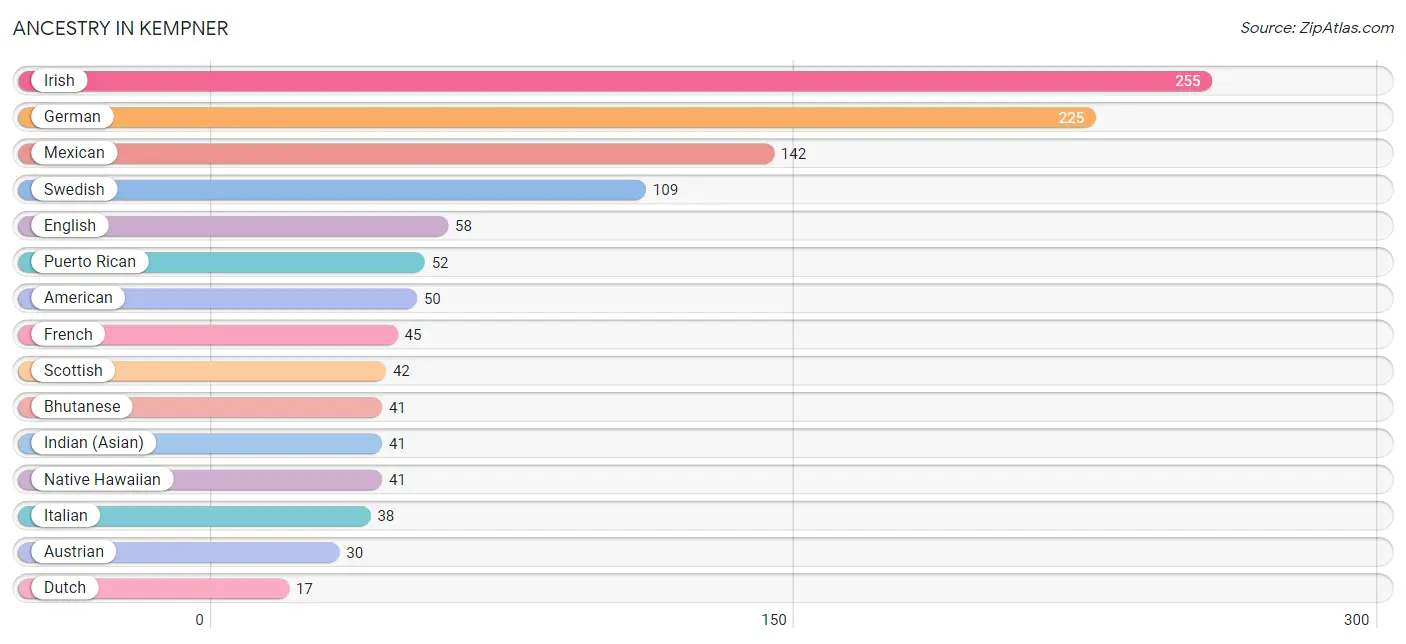
Ancestry in Kempner
The most populous ancestries reported in Kempner are Irish (255 | 19.0%), German (225 | 16.7%), Mexican (142 | 10.5%), Swedish (109 | 8.1%), and English (58 | 4.3%), together accounting for 58.6% of all Kempner residents.
| Ancestry | # Population | % Population |
| American | 50 | 3.7% |
| Austrian | 30 | 2.2% |
| Bhutanese | 41 | 3.0% |
| British | 3 | 0.2% |
| Burmese | 15 | 1.1% |
| Canadian | 3 | 0.2% |
| Central American | 3 | 0.2% |
| Costa Rican | 3 | 0.2% |
| Dutch | 17 | 1.3% |
| Eastern European | 2 | 0.2% |
| English | 58 | 4.3% |
| European | 12 | 0.9% |
| French | 45 | 3.3% |
| French Canadian | 1 | 0.1% |
| German | 225 | 16.7% |
| Hungarian | 2 | 0.2% |
| Indian (Asian) | 41 | 3.0% |
| Irish | 255 | 19.0% |
| Italian | 38 | 2.8% |
| Mexican | 142 | 10.5% |
| Native Hawaiian | 41 | 3.0% |
| Norwegian | 11 | 0.8% |
| Polish | 12 | 0.9% |
| Portuguese | 11 | 0.8% |
| Puerto Rican | 52 | 3.9% |
| Scotch-Irish | 16 | 1.2% |
| Scottish | 42 | 3.1% |
| Swedish | 109 | 8.1% |
| Ukrainian | 2 | 0.2% |
| Welsh | 12 | 0.9% | View All 30 Rows |
Immigrants in Kempner
The most numerous immigrant groups reported in Kempner came from Europe (28 | 2.1%), Germany (28 | 2.1%), Western Europe (28 | 2.1%), Asia (5 | 0.4%), and Eastern Asia (5 | 0.4%), together accounting for 7.0% of all Kempner residents.
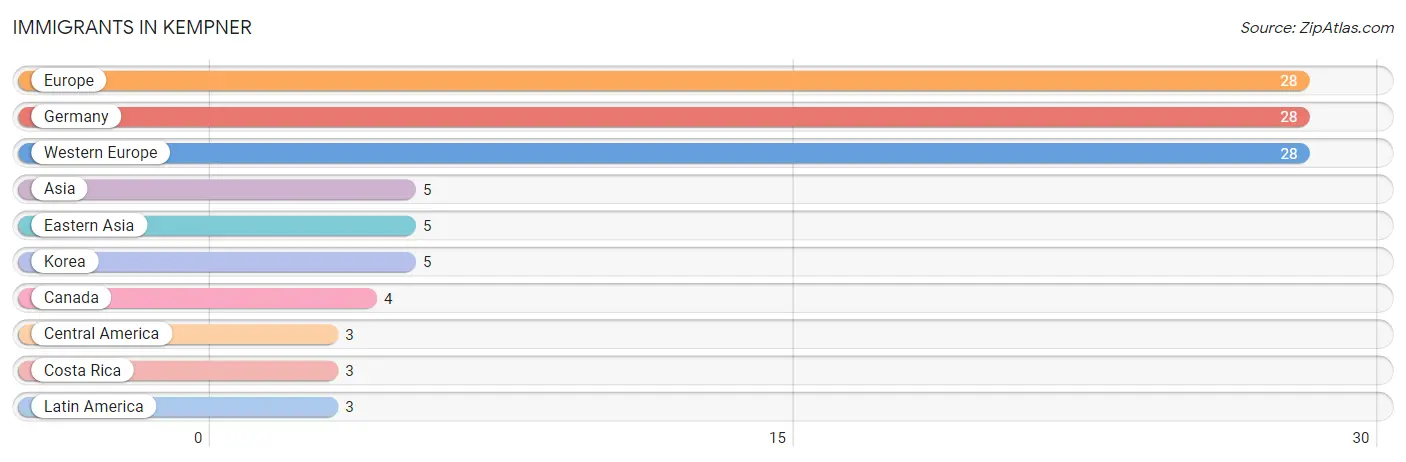
| Immigration Origin | # Population | % Population |
| Asia | 5 | 0.4% |
| Canada | 4 | 0.3% |
| Central America | 3 | 0.2% |
| Costa Rica | 3 | 0.2% |
| Eastern Asia | 5 | 0.4% |
| Europe | 28 | 2.1% |
| Germany | 28 | 2.1% |
| Korea | 5 | 0.4% |
| Latin America | 3 | 0.2% |
| Western Europe | 28 | 2.1% | View All 10 Rows |
Sex and Age in Kempner
Sex and Age in Kempner
The most populous age groups in Kempner are 60 to 64 Years (102 | 14.3%) for men and 50 to 54 Years (114 | 18.1%) for women.
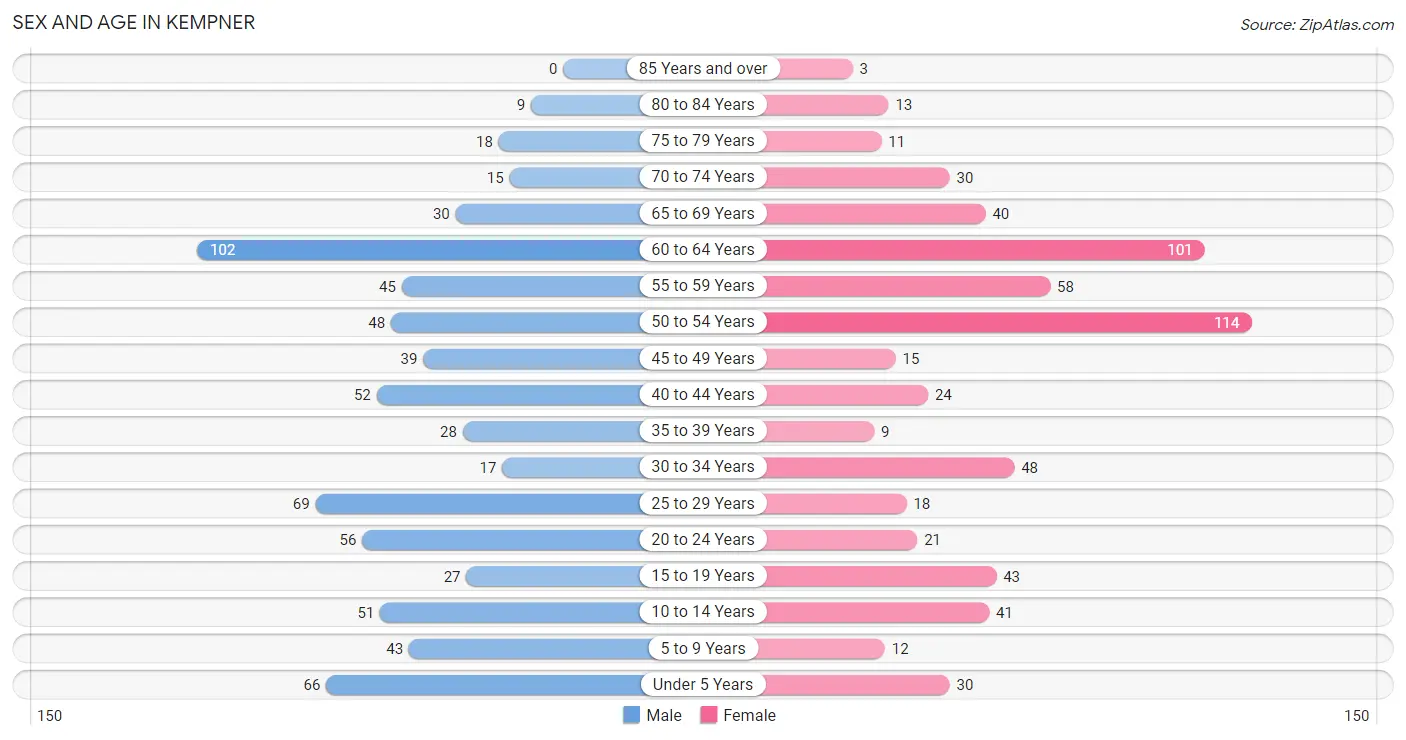
| Age Bracket | Male | Female |
| Under 5 Years | 66 (9.2%) | 30 (4.8%) |
| 5 to 9 Years | 43 (6.0%) | 12 (1.9%) |
| 10 to 14 Years | 51 (7.1%) | 41 (6.5%) |
| 15 to 19 Years | 27 (3.8%) | 43 (6.8%) |
| 20 to 24 Years | 56 (7.8%) | 21 (3.3%) |
| 25 to 29 Years | 69 (9.7%) | 18 (2.9%) |
| 30 to 34 Years | 17 (2.4%) | 48 (7.6%) |
| 35 to 39 Years | 28 (3.9%) | 9 (1.4%) |
| 40 to 44 Years | 52 (7.3%) | 24 (3.8%) |
| 45 to 49 Years | 39 (5.4%) | 15 (2.4%) |
| 50 to 54 Years | 48 (6.7%) | 114 (18.1%) |
| 55 to 59 Years | 45 (6.3%) | 58 (9.2%) |
| 60 to 64 Years | 102 (14.3%) | 101 (16.0%) |
| 65 to 69 Years | 30 (4.2%) | 40 (6.3%) |
| 70 to 74 Years | 15 (2.1%) | 30 (4.8%) |
| 75 to 79 Years | 18 (2.5%) | 11 (1.7%) |
| 80 to 84 Years | 9 (1.3%) | 13 (2.1%) |
| 85 Years and over | 0 (0.0%) | 3 (0.5%) |
| Total | 715 (100.0%) | 631 (100.0%) |
Families and Households in Kempner
Median Family Size in Kempner
The median family size in Kempner is 3.59 persons per family, with single male/father families (4 | 1.3%) accounting for the largest median family size of 6 persons per family. On the other hand, married-couple families (246 | 80.1%) represent the smallest median family size with 3.46 persons per family.
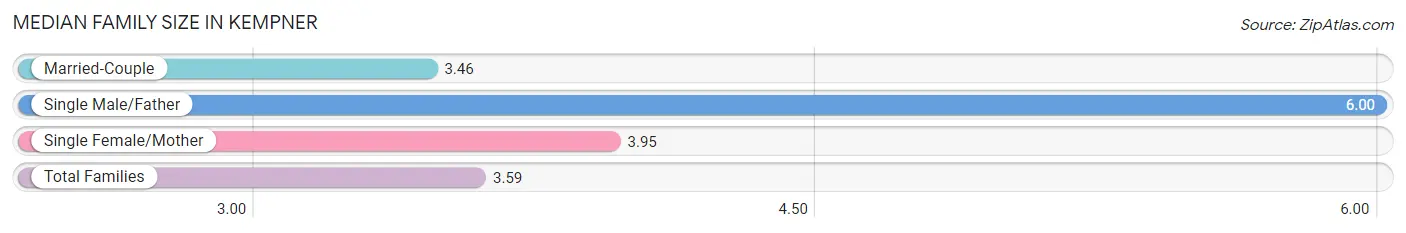
| Family Type | # Families | Family Size |
| Married-Couple | 246 (80.1%) | 3.46 |
| Single Male/Father | 4 (1.3%) | 6.00 |
| Single Female/Mother | 57 (18.6%) | 3.95 |
| Total Families | 307 (100.0%) | 3.59 |
Median Household Size in Kempner
The median household size in Kempner is 3.04 persons per household, with single male/father households (4 | 0.9%) accounting for the largest median household size of 6.75 persons per household. non-family households (136 | 30.7%) represent the smallest median household size with 1.58 persons per household.
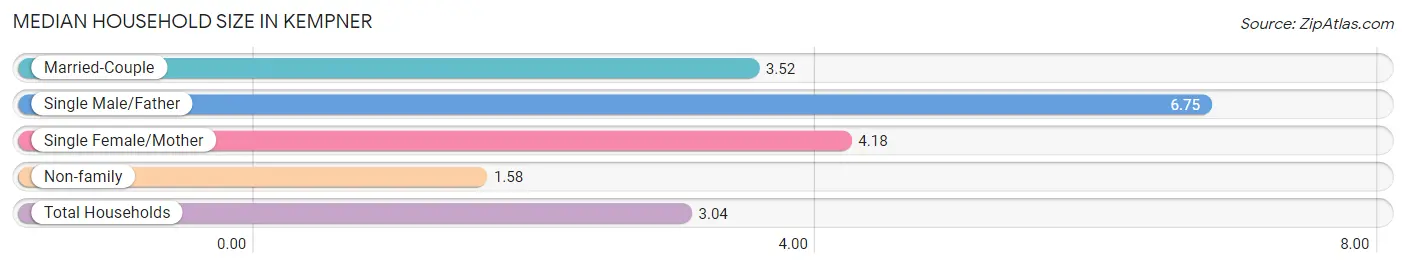
| Household Type | # Households | Household Size |
| Married-Couple | 246 (55.5%) | 3.52 |
| Single Male/Father | 4 (0.9%) | 6.75 |
| Single Female/Mother | 57 (12.9%) | 4.18 |
| Non-family | 136 (30.7%) | 1.58 |
| Total Households | 443 (100.0%) | 3.04 |
Household Size by Marriage Status in Kempner
Out of a total of 443 households in Kempner, 307 (69.3%) are family households, while 136 (30.7%) are nonfamily households. The most numerous type of family households are 2-person households, comprising 117, and the most common type of nonfamily households are 1-person households, comprising 106.
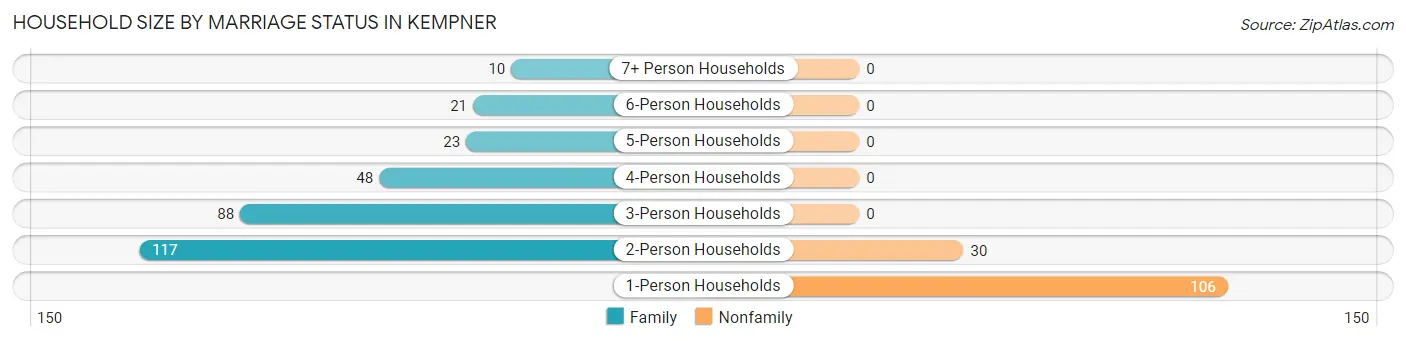
| Household Size | Family Households | Nonfamily Households |
| 1-Person Households | - | 106 (23.9%) |
| 2-Person Households | 117 (26.4%) | 30 (6.8%) |
| 3-Person Households | 88 (19.9%) | 0 (0.0%) |
| 4-Person Households | 48 (10.8%) | 0 (0.0%) |
| 5-Person Households | 23 (5.2%) | 0 (0.0%) |
| 6-Person Households | 21 (4.7%) | 0 (0.0%) |
| 7+ Person Households | 10 (2.3%) | 0 (0.0%) |
| Total | 307 (69.3%) | 136 (30.7%) |
Female Fertility in Kempner
Fertility by Age in Kempner
Average fertility rate in Kempner is 132.0 births per 1,000 women. Women in the age bracket of 20 to 34 years have the highest fertility rate with 207.0 births per 1,000 women. Women in the age bracket of 20 to 34 years acount for 72.0% of all women with births.
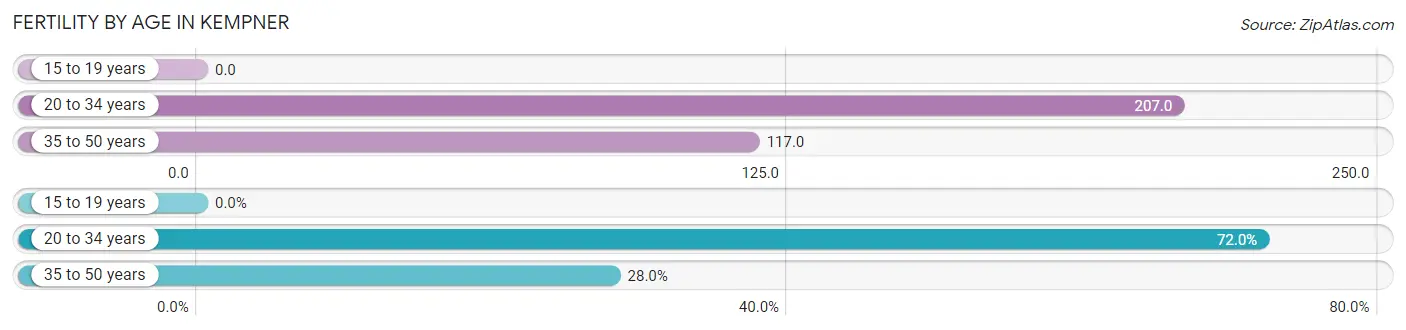
| Age Bracket | Women with Births | Births / 1,000 Women |
| 15 to 19 years | 0 (0.0%) | 0.0 |
| 20 to 34 years | 18 (72.0%) | 207.0 |
| 35 to 50 years | 7 (28.0%) | 117.0 |
| Total | 25 (100.0%) | 132.0 |
Fertility by Age by Marriage Status in Kempner
92.0% of women with births (25) in Kempner are married. The highest percentage of unmarried women with births falls into 35 to 50 years age bracket with 28.6% of them unmarried at the time of birth, while the lowest percentage of unmarried women with births belong to 20 to 34 years age bracket with 0.0% of them unmarried.
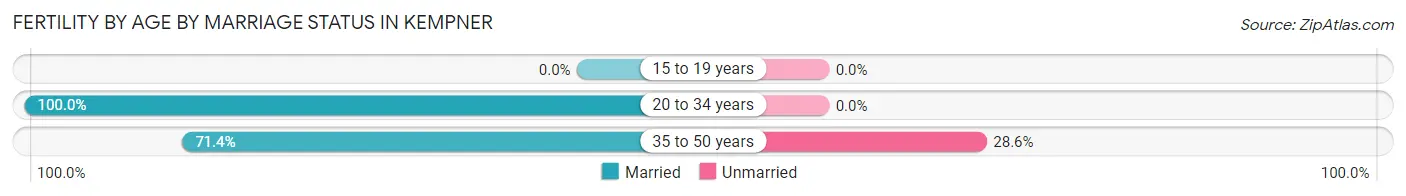
| Age Bracket | Married | Unmarried |
| 15 to 19 years | 0 (0.0%) | 0 (0.0%) |
| 20 to 34 years | 18 (100.0%) | 0 (0.0%) |
| 35 to 50 years | 5 (71.4%) | 2 (28.6%) |
| Total | 23 (92.0%) | 2 (8.0%) |
Fertility by Education in Kempner
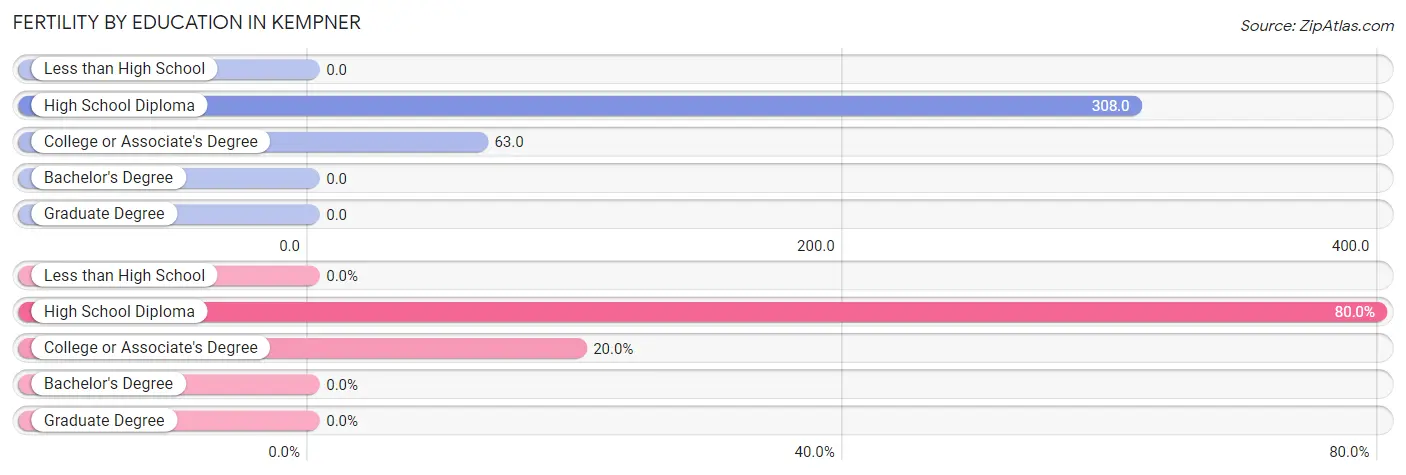
| Educational Attainment | Women with Births | Births / 1,000 Women |
| Less than High School | 0 (0.0%) | 0.0 |
| High School Diploma | 20 (80.0%) | 308.0 |
| College or Associate's Degree | 5 (20.0%) | 63.0 |
| Bachelor's Degree | 0 (0.0%) | 0.0 |
| Graduate Degree | 0 (0.0%) | 0.0 |
| Total | 25 (100.0%) | 132.0 |
Fertility by Education by Marriage Status in Kempner
8.0% of women with births in Kempner are unmarried. Women with the educational attainment of college or associate's degree are most likely to be married with 100.0% of them married at childbirth, while women with the educational attainment of high school diploma are least likely to be married with 10.0% of them unmarried at childbirth.
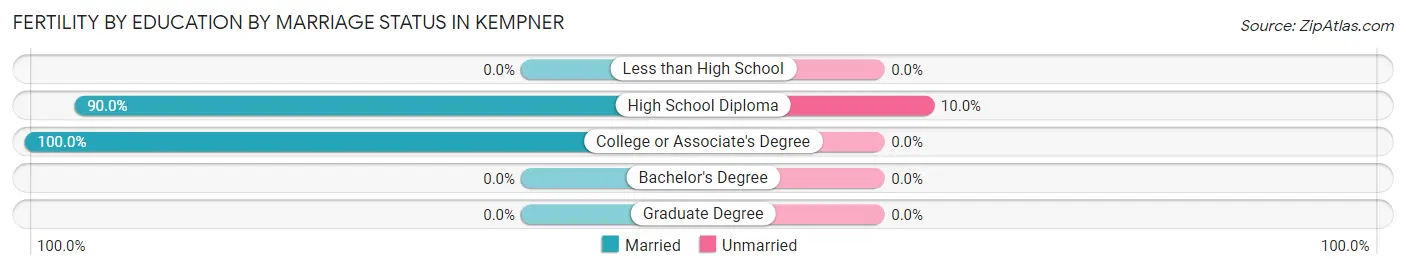
| Educational Attainment | Married | Unmarried |
| Less than High School | 0 (0.0%) | 0 (0.0%) |
| High School Diploma | 18 (90.0%) | 2 (10.0%) |
| College or Associate's Degree | 5 (100.0%) | 0 (0.0%) |
| Bachelor's Degree | 0 (0.0%) | 0 (0.0%) |
| Graduate Degree | 0 (0.0%) | 0 (0.0%) |
| Total | 23 (92.0%) | 2 (8.0%) |
Employment Characteristics in Kempner
Employment by Class of Employer in Kempner
Among the 744 employed individuals in Kempner, private company employees (545 | 73.3%), state government employees (53 | 7.1%), and self-employed (not incorporated) (47 | 6.3%) make up the most common classes of employment.
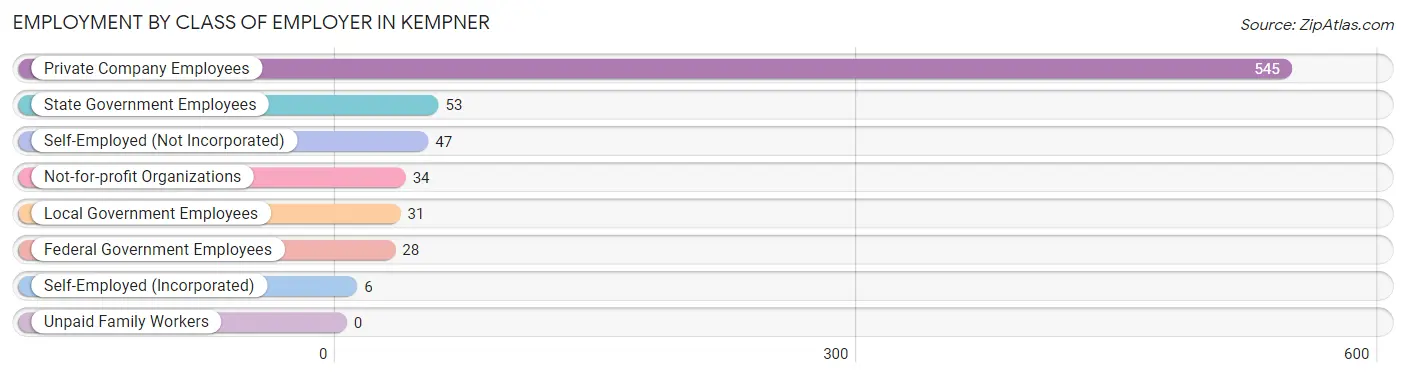
| Employer Class | # Employees | % Employees |
| Private Company Employees | 545 | 73.3% |
| Self-Employed (Incorporated) | 6 | 0.8% |
| Self-Employed (Not Incorporated) | 47 | 6.3% |
| Not-for-profit Organizations | 34 | 4.6% |
| Local Government Employees | 31 | 4.2% |
| State Government Employees | 53 | 7.1% |
| Federal Government Employees | 28 | 3.8% |
| Unpaid Family Workers | 0 | 0.0% |
| Total | 744 | 100.0% |
Employment Status by Age in Kempner
According to the labor force statistics for Kempner, out of the total population over 16 years of age (1,093), 69.4% or 759 individuals are in the labor force, with 2.0% or 15 of them unemployed. The age group with the highest labor force participation rate is 20 to 24 years, with 100.0% or 77 individuals in the labor force. Within the labor force, the 65 to 74 years age range has the highest percentage of unemployed individuals, with 20.0% or 3 of them being unemployed.
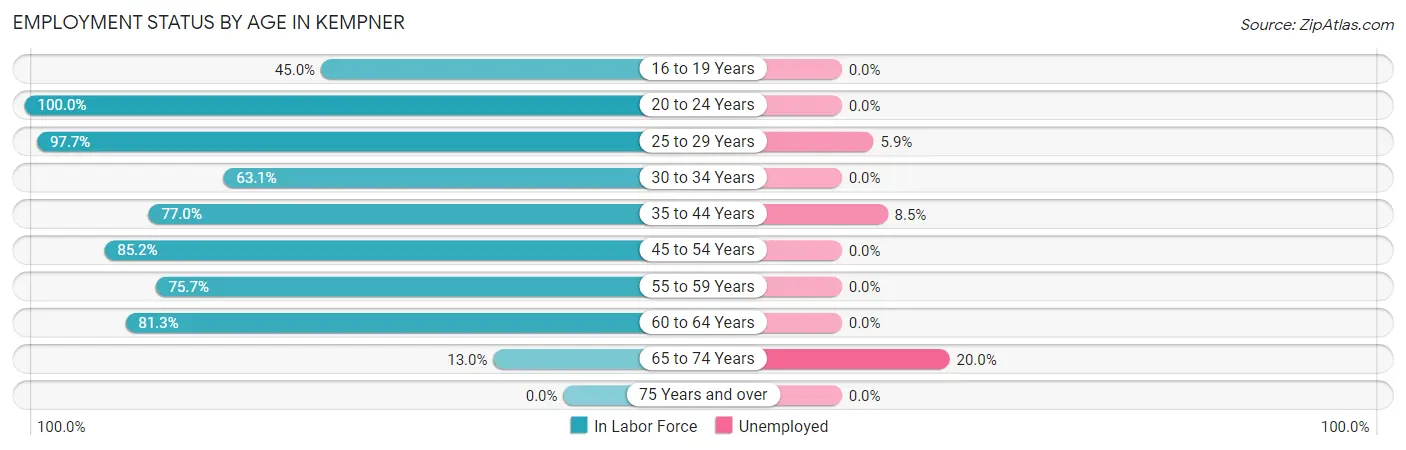
| Age Bracket | In Labor Force | Unemployed |
| 16 to 19 Years | 27 (45.0%) | 0 (0.0%) |
| 20 to 24 Years | 77 (100.0%) | 0 (0.0%) |
| 25 to 29 Years | 85 (97.7%) | 5 (5.9%) |
| 30 to 34 Years | 41 (63.1%) | 0 (0.0%) |
| 35 to 44 Years | 87 (77.0%) | 7 (8.5%) |
| 45 to 54 Years | 184 (85.2%) | 0 (0.0%) |
| 55 to 59 Years | 78 (75.7%) | 0 (0.0%) |
| 60 to 64 Years | 165 (81.3%) | 0 (0.0%) |
| 65 to 74 Years | 15 (13.0%) | 3 (20.0%) |
| 75 Years and over | 0 (0.0%) | 0 (0.0%) |
| Total | 759 (69.4%) | 15 (2.0%) |
Employment Status by Educational Attainment in Kempner
According to labor force statistics for Kempner, 81.3% of individuals (640) out of the total population between 25 and 64 years of age (787) are in the labor force, with 1.9% or 12 of them being unemployed. The group with the highest labor force participation rate are those with the educational attainment of high school diploma, with 83.8% or 290 individuals in the labor force. Within the labor force, individuals with high school diploma education have the highest percentage of unemployment, with 2.4% or 7 of them being unemployed.
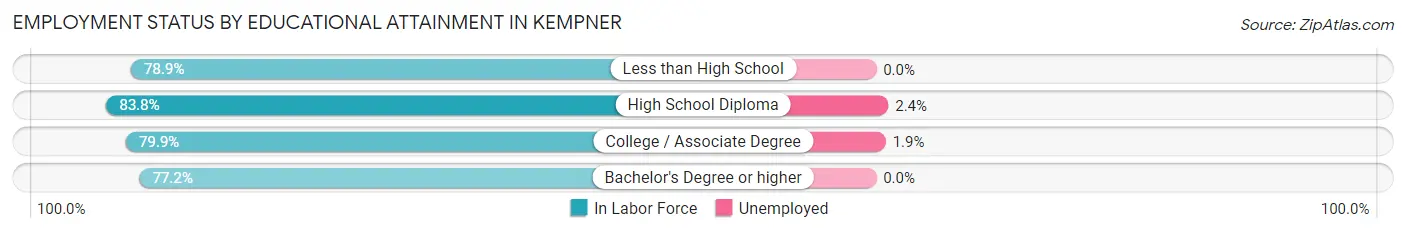
| Educational Attainment | In Labor Force | Unemployed |
| Less than High School | 30 (78.9%) | 0 (0.0%) |
| High School Diploma | 290 (83.8%) | 8 (2.4%) |
| College / Associate Degree | 259 (79.9%) | 6 (1.9%) |
| Bachelor's Degree or higher | 61 (77.2%) | 0 (0.0%) |
| Total | 640 (81.3%) | 15 (1.9%) |
Employment Occupations by Sex in Kempner
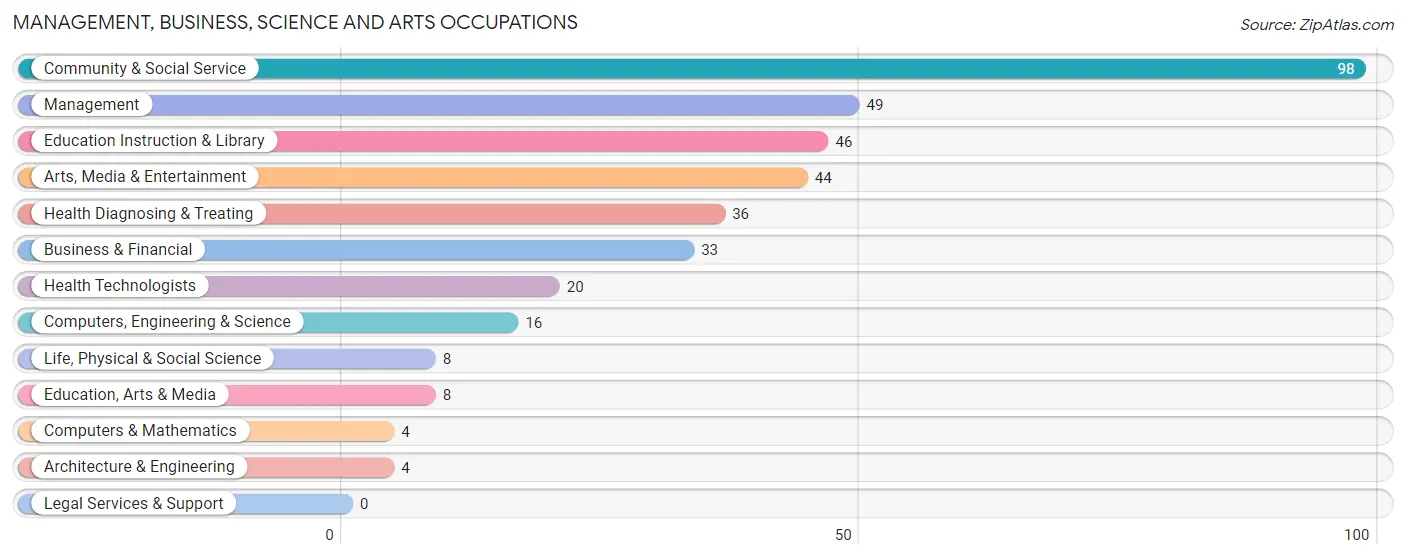
Management, Business, Science and Arts Occupations
The most common Management, Business, Science and Arts occupations in Kempner are Community & Social Service (98 | 13.3%), Management (49 | 6.6%), Education Instruction & Library (46 | 6.2%), Arts, Media & Entertainment (44 | 5.9%), and Health Diagnosing & Treating (36 | 4.9%).
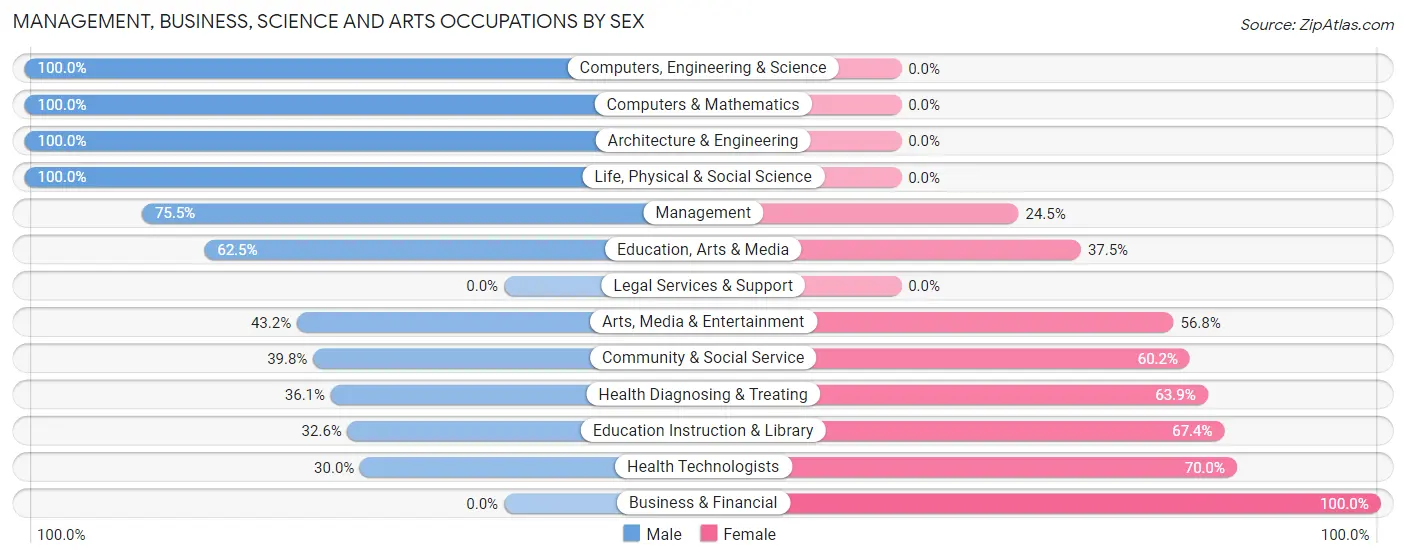
Management, Business, Science and Arts Occupations by Sex
Within the Management, Business, Science and Arts occupations in Kempner, the most male-oriented occupations are Computers, Engineering & Science (100.0%), Computers & Mathematics (100.0%), and Architecture & Engineering (100.0%), while the most female-oriented occupations are Business & Financial (100.0%), Health Technologists (70.0%), and Education Instruction & Library (67.4%).
| Occupation | Male | Female |
| Management | 37 (75.5%) | 12 (24.5%) |
| Business & Financial | 0 (0.0%) | 33 (100.0%) |
| Computers, Engineering & Science | 16 (100.0%) | 0 (0.0%) |
| Computers & Mathematics | 4 (100.0%) | 0 (0.0%) |
| Architecture & Engineering | 4 (100.0%) | 0 (0.0%) |
| Life, Physical & Social Science | 8 (100.0%) | 0 (0.0%) |
| Community & Social Service | 39 (39.8%) | 59 (60.2%) |
| Education, Arts & Media | 5 (62.5%) | 3 (37.5%) |
| Legal Services & Support | 0 (0.0%) | 0 (0.0%) |
| Education Instruction & Library | 15 (32.6%) | 31 (67.4%) |
| Arts, Media & Entertainment | 19 (43.2%) | 25 (56.8%) |
| Health Diagnosing & Treating | 13 (36.1%) | 23 (63.9%) |
| Health Technologists | 6 (30.0%) | 14 (70.0%) |
| Total (Category) | 105 (45.3%) | 127 (54.7%) |
| Total (Overall) | 385 (52.1%) | 354 (47.9%) |
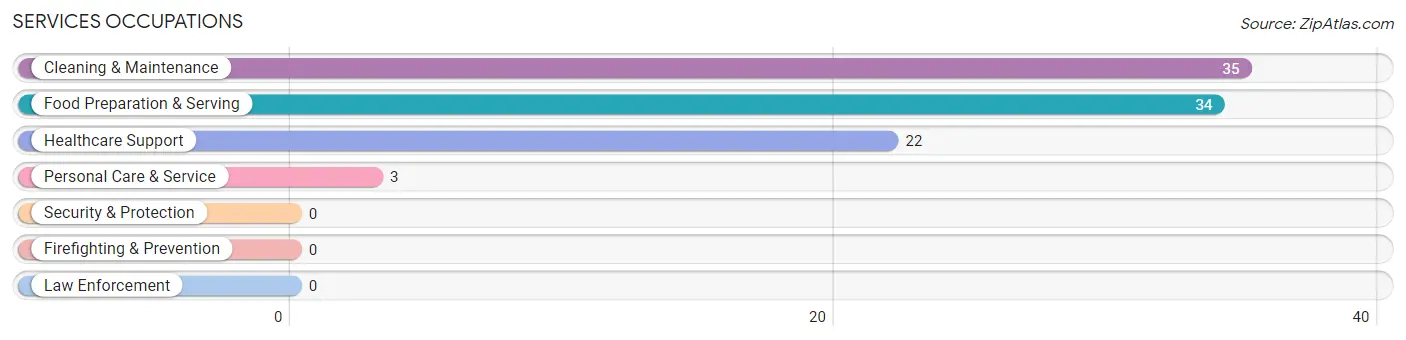
Services Occupations
The most common Services occupations in Kempner are Cleaning & Maintenance (35 | 4.7%), Food Preparation & Serving (34 | 4.6%), Healthcare Support (22 | 3.0%), and Personal Care & Service (3 | 0.4%).
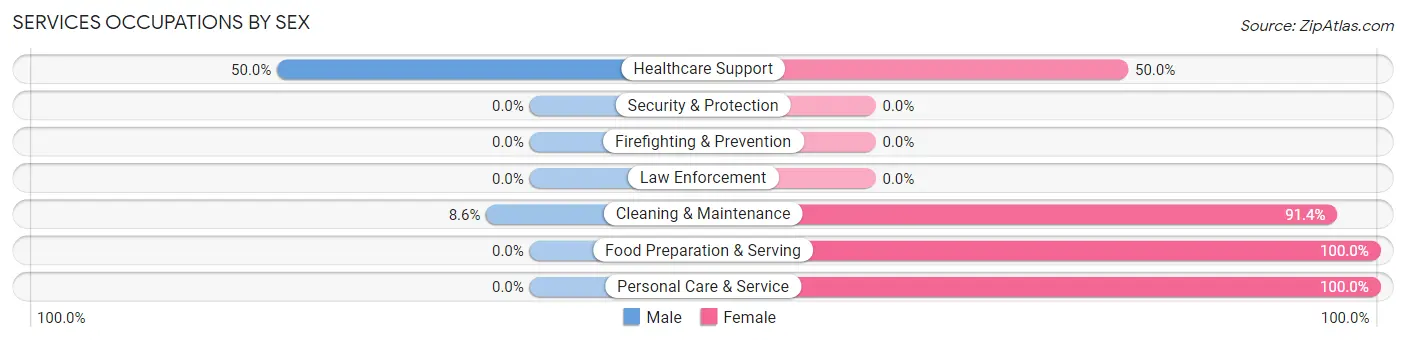
Services Occupations by Sex
Within the Services occupations in Kempner, the most male-oriented occupations are Healthcare Support (50.0%), and Cleaning & Maintenance (8.6%), while the most female-oriented occupations are Food Preparation & Serving (100.0%), Personal Care & Service (100.0%), and Cleaning & Maintenance (91.4%).
| Occupation | Male | Female |
| Healthcare Support | 11 (50.0%) | 11 (50.0%) |
| Security & Protection | 0 (0.0%) | 0 (0.0%) |
| Firefighting & Prevention | 0 (0.0%) | 0 (0.0%) |
| Law Enforcement | 0 (0.0%) | 0 (0.0%) |
| Food Preparation & Serving | 0 (0.0%) | 34 (100.0%) |
| Cleaning & Maintenance | 3 (8.6%) | 32 (91.4%) |
| Personal Care & Service | 0 (0.0%) | 3 (100.0%) |
| Total (Category) | 14 (14.9%) | 80 (85.1%) |
| Total (Overall) | 385 (52.1%) | 354 (47.9%) |
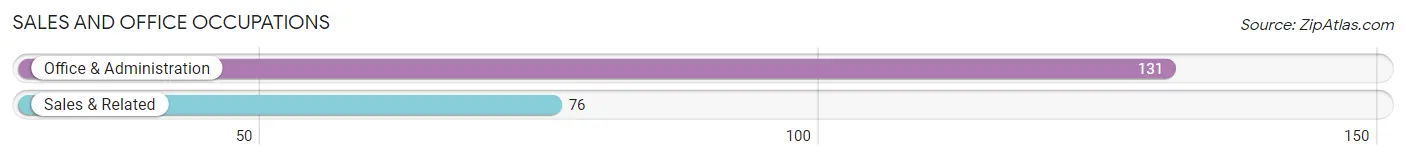
Sales and Office Occupations
The most common Sales and Office occupations in Kempner are Office & Administration (131 | 17.7%), and Sales & Related (76 | 10.3%).
Sales and Office Occupations by Sex
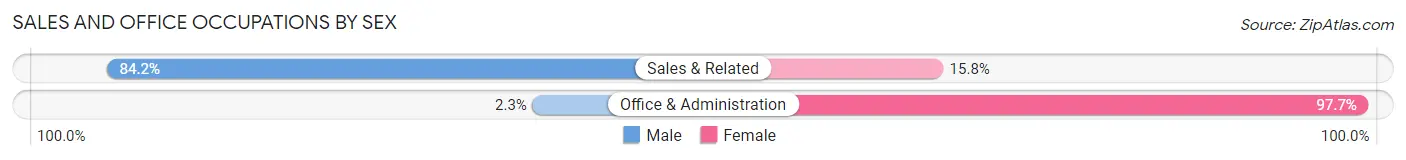
| Occupation | Male | Female |
| Sales & Related | 64 (84.2%) | 12 (15.8%) |
| Office & Administration | 3 (2.3%) | 128 (97.7%) |
| Total (Category) | 67 (32.4%) | 140 (67.6%) |
| Total (Overall) | 385 (52.1%) | 354 (47.9%) |
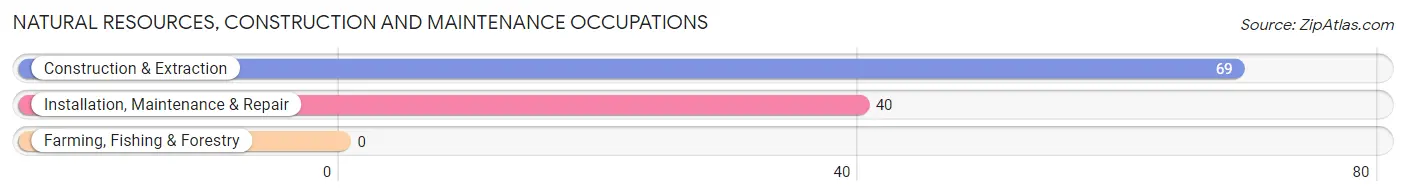
Natural Resources, Construction and Maintenance Occupations
The most common Natural Resources, Construction and Maintenance occupations in Kempner are Construction & Extraction (69 | 9.3%), and Installation, Maintenance & Repair (40 | 5.4%).
Natural Resources, Construction and Maintenance Occupations by Sex
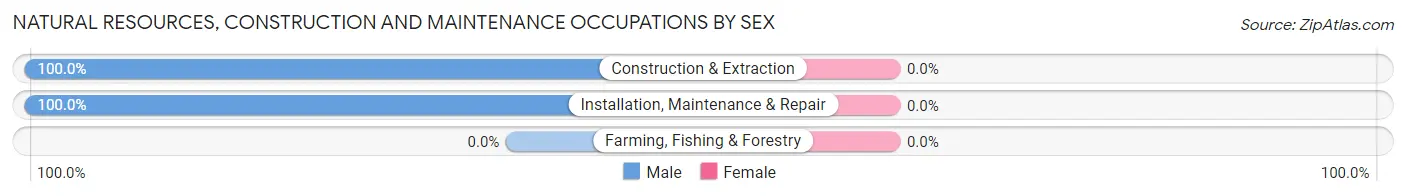
| Occupation | Male | Female |
| Farming, Fishing & Forestry | 0 (0.0%) | 0 (0.0%) |
| Construction & Extraction | 69 (100.0%) | 0 (0.0%) |
| Installation, Maintenance & Repair | 40 (100.0%) | 0 (0.0%) |
| Total (Category) | 109 (100.0%) | 0 (0.0%) |
| Total (Overall) | 385 (52.1%) | 354 (47.9%) |
Production, Transportation and Moving Occupations
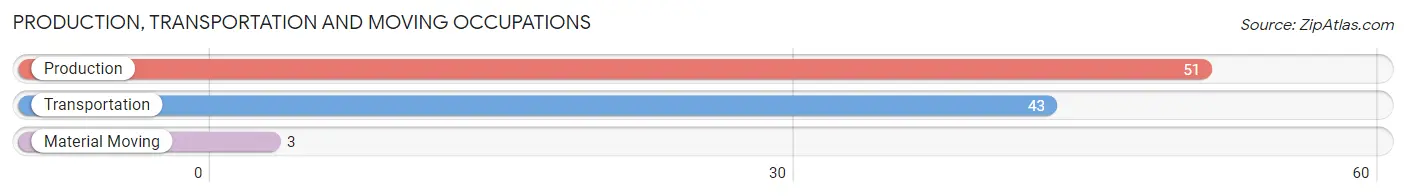
The most common Production, Transportation and Moving occupations in Kempner are Production (51 | 6.9%), Transportation (43 | 5.8%), and Material Moving (3 | 0.4%).
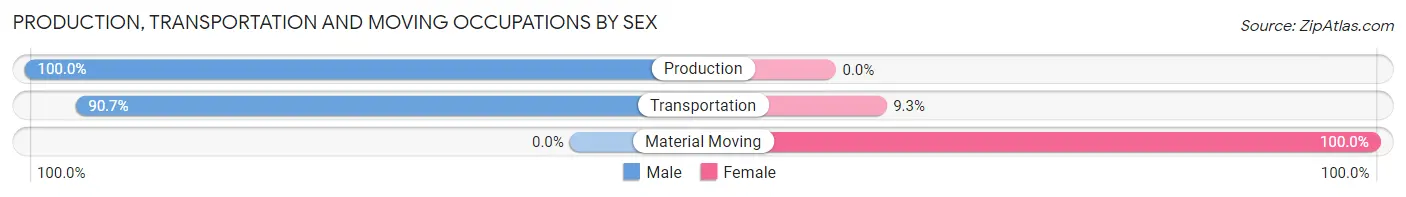
Production, Transportation and Moving Occupations by Sex
| Occupation | Male | Female |
| Production | 51 (100.0%) | 0 (0.0%) |
| Transportation | 39 (90.7%) | 4 (9.3%) |
| Material Moving | 0 (0.0%) | 3 (100.0%) |
| Total (Category) | 90 (92.8%) | 7 (7.2%) |
| Total (Overall) | 385 (52.1%) | 354 (47.9%) |
Employment Industries by Sex in Kempner
Employment Industries in Kempner
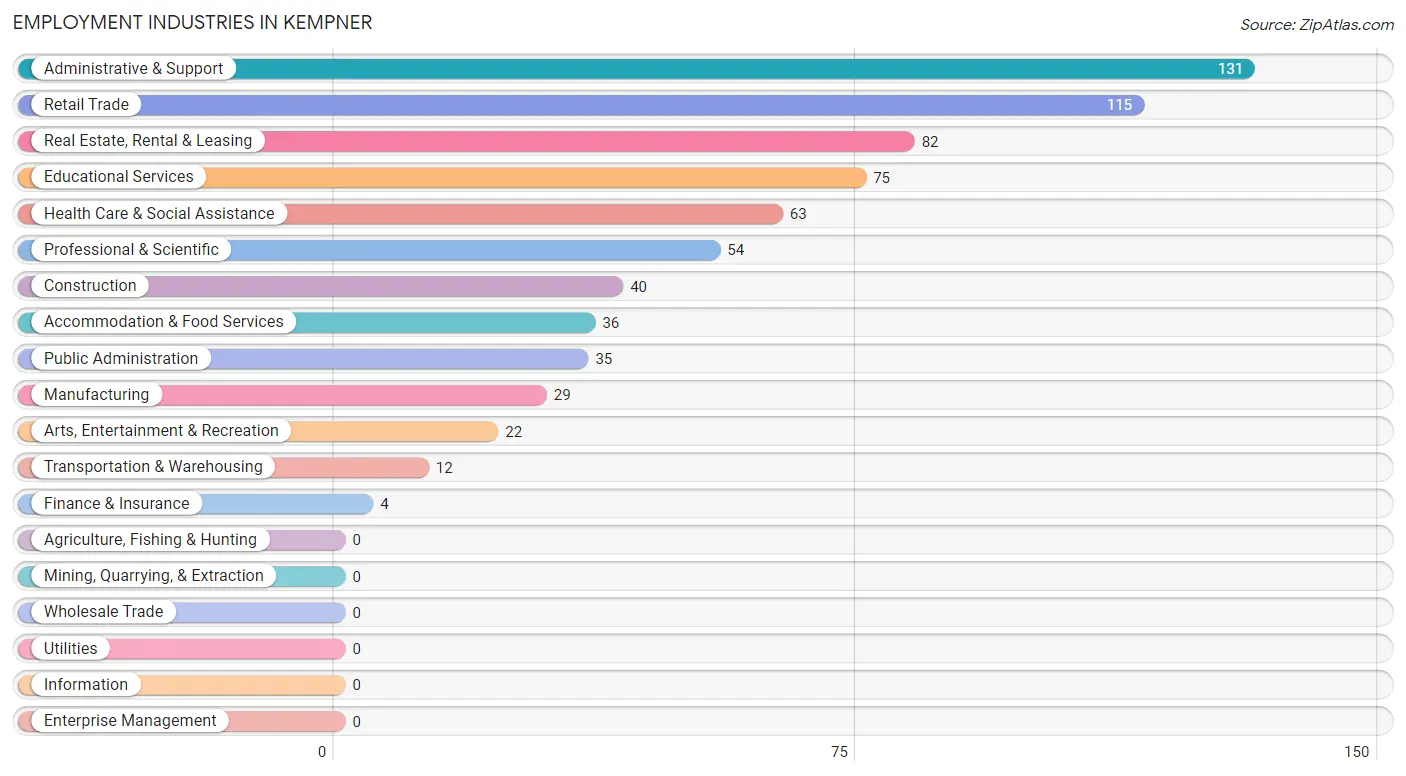
The major employment industries in Kempner include Administrative & Support (131 | 17.7%), Retail Trade (115 | 15.6%), Real Estate, Rental & Leasing (82 | 11.1%), Educational Services (75 | 10.2%), and Health Care & Social Assistance (63 | 8.5%).
Employment Industries by Sex in Kempner
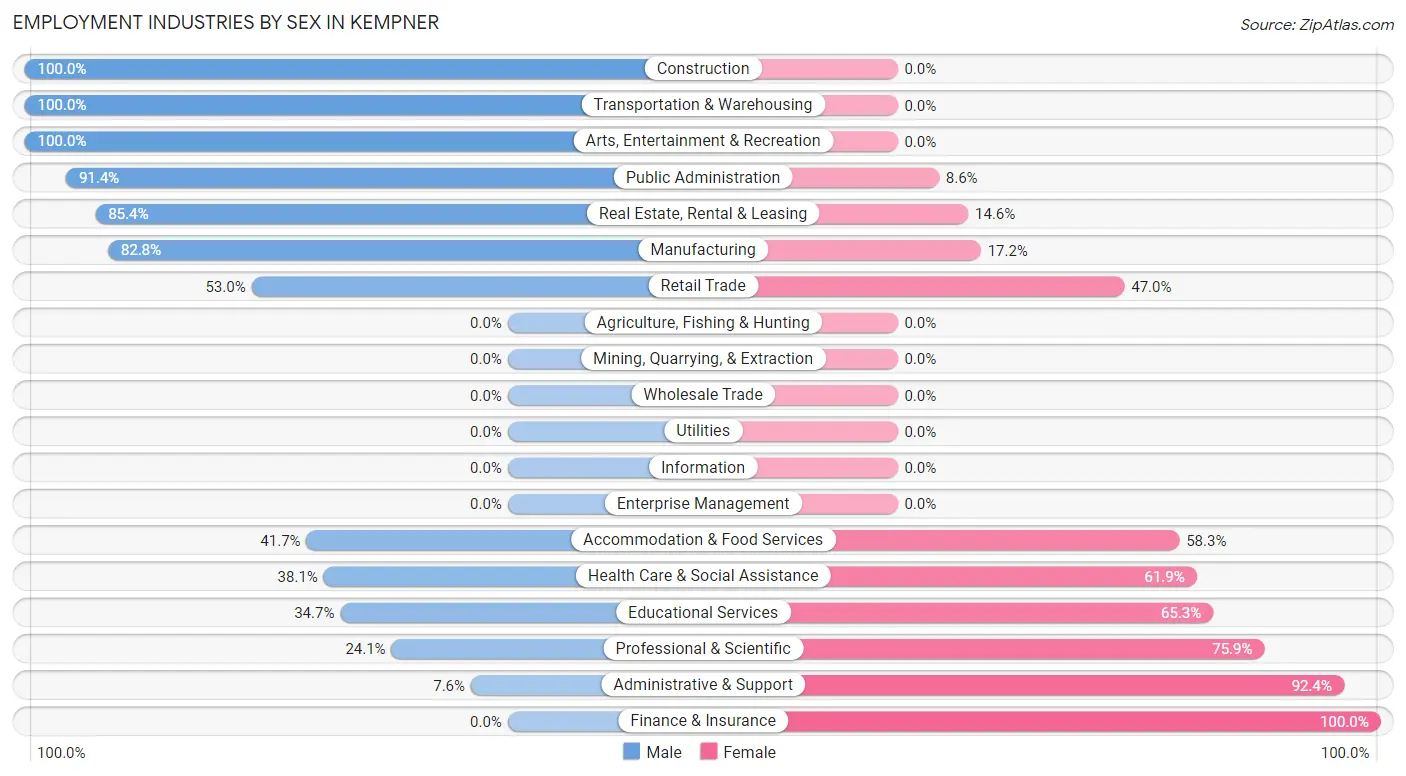
The Kempner industries that see more men than women are Construction (100.0%), Transportation & Warehousing (100.0%), and Arts, Entertainment & Recreation (100.0%), whereas the industries that tend to have a higher number of women are Finance & Insurance (100.0%), Administrative & Support (92.4%), and Professional & Scientific (75.9%).
| Industry | Male | Female |
| Agriculture, Fishing & Hunting | 0 (0.0%) | 0 (0.0%) |
| Mining, Quarrying, & Extraction | 0 (0.0%) | 0 (0.0%) |
| Construction | 40 (100.0%) | 0 (0.0%) |
| Manufacturing | 24 (82.8%) | 5 (17.2%) |
| Wholesale Trade | 0 (0.0%) | 0 (0.0%) |
| Retail Trade | 61 (53.0%) | 54 (47.0%) |
| Transportation & Warehousing | 12 (100.0%) | 0 (0.0%) |
| Utilities | 0 (0.0%) | 0 (0.0%) |
| Information | 0 (0.0%) | 0 (0.0%) |
| Finance & Insurance | 0 (0.0%) | 4 (100.0%) |
| Real Estate, Rental & Leasing | 70 (85.4%) | 12 (14.6%) |
| Professional & Scientific | 13 (24.1%) | 41 (75.9%) |
| Enterprise Management | 0 (0.0%) | 0 (0.0%) |
| Administrative & Support | 10 (7.6%) | 121 (92.4%) |
| Educational Services | 26 (34.7%) | 49 (65.3%) |
| Health Care & Social Assistance | 24 (38.1%) | 39 (61.9%) |
| Arts, Entertainment & Recreation | 22 (100.0%) | 0 (0.0%) |
| Accommodation & Food Services | 15 (41.7%) | 21 (58.3%) |
| Public Administration | 32 (91.4%) | 3 (8.6%) |
| Total | 385 (52.1%) | 354 (47.9%) |
Education in Kempner
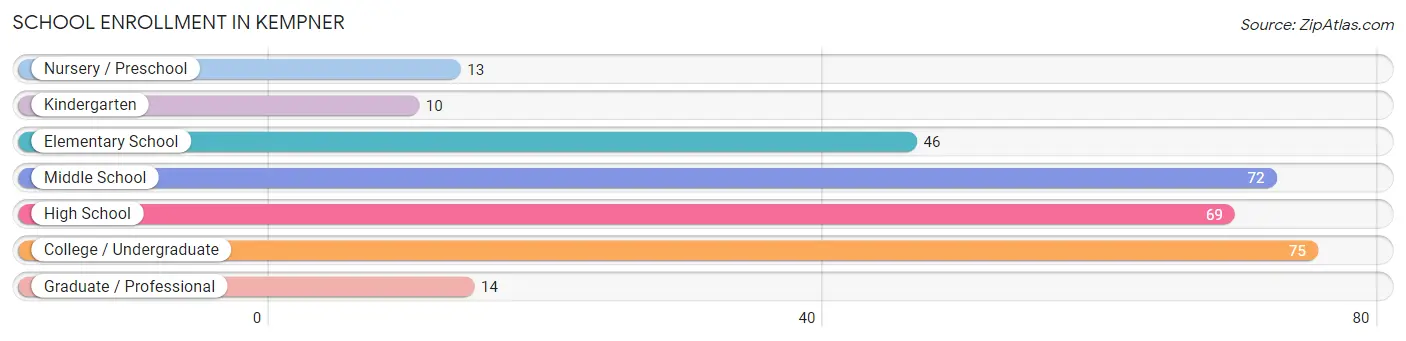
School Enrollment in Kempner
The most common levels of schooling among the 299 students in Kempner are college / undergraduate (75 | 25.1%), middle school (72 | 24.1%), and high school (69 | 23.1%).
| School Level | # Students | % Students |
| Nursery / Preschool | 13 | 4.3% |
| Kindergarten | 10 | 3.3% |
| Elementary School | 46 | 15.4% |
| Middle School | 72 | 24.1% |
| High School | 69 | 23.1% |
| College / Undergraduate | 75 | 25.1% |
| Graduate / Professional | 14 | 4.7% |
| Total | 299 | 100.0% |
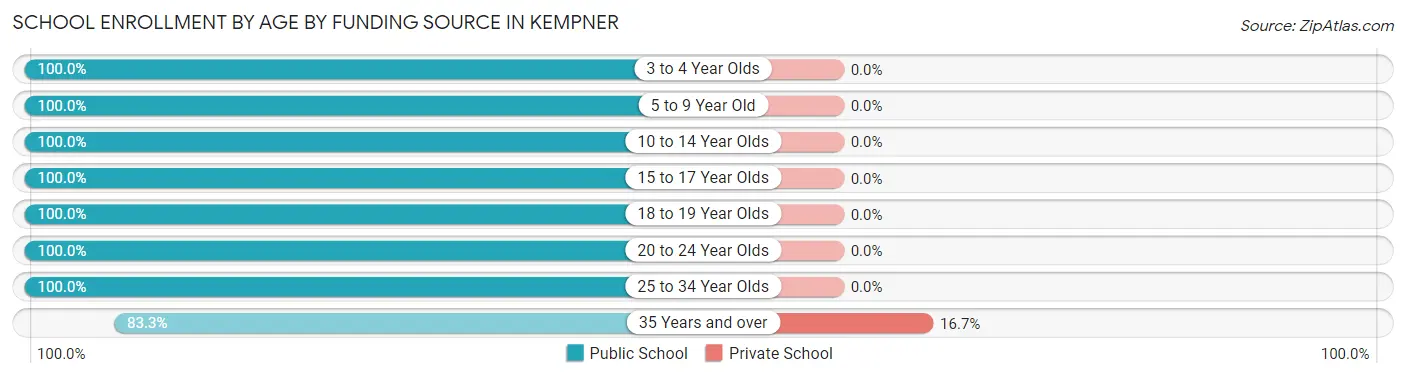
School Enrollment by Age by Funding Source in Kempner
Out of a total of 299 students who are enrolled in schools in Kempner, 4 (1.3%) attend a private institution, while the remaining 295 (98.7%) are enrolled in public schools. The age group of 35 years and over has the highest likelihood of being enrolled in private schools, with 4 (16.7% in the age bracket) enrolled. Conversely, the age group of 3 to 4 year olds has the lowest likelihood of being enrolled in a private school, with 12 (100.0% in the age bracket) attending a public institution.
| Age Bracket | Public School | Private School |
| 3 to 4 Year Olds | 12 (100.0%) | 0 (0.0%) |
| 5 to 9 Year Old | 55 (100.0%) | 0 (0.0%) |
| 10 to 14 Year Olds | 92 (100.0%) | 0 (0.0%) |
| 15 to 17 Year Olds | 24 (100.0%) | 0 (0.0%) |
| 18 to 19 Year Olds | 30 (100.0%) | 0 (0.0%) |
| 20 to 24 Year Olds | 56 (100.0%) | 0 (0.0%) |
| 25 to 34 Year Olds | 6 (100.0%) | 0 (0.0%) |
| 35 Years and over | 20 (83.3%) | 4 (16.7%) |
| Total | 295 (98.7%) | 4 (1.3%) |
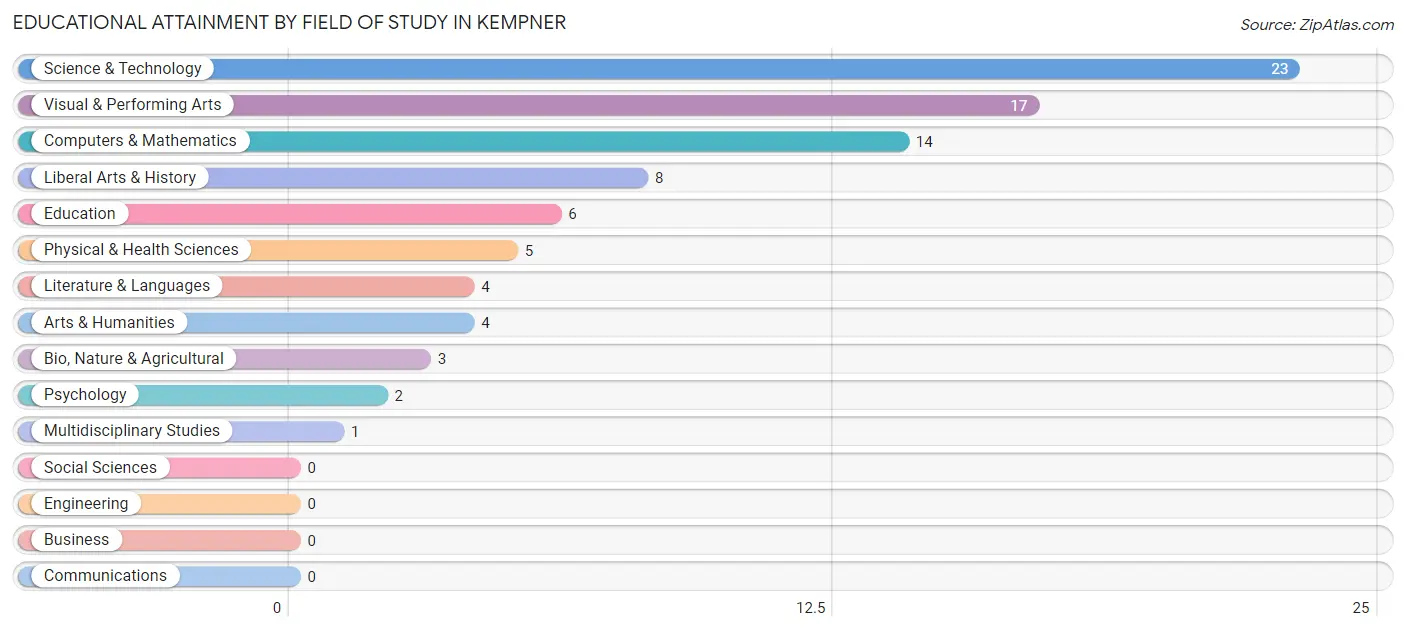
Educational Attainment by Field of Study in Kempner
Science & technology (23 | 26.4%), visual & performing arts (17 | 19.5%), computers & mathematics (14 | 16.1%), liberal arts & history (8 | 9.2%), and education (6 | 6.9%) are the most common fields of study among 87 individuals in Kempner who have obtained a bachelor's degree or higher.
| Field of Study | # Graduates | % Graduates |
| Computers & Mathematics | 14 | 16.1% |
| Bio, Nature & Agricultural | 3 | 3.5% |
| Physical & Health Sciences | 5 | 5.8% |
| Psychology | 2 | 2.3% |
| Social Sciences | 0 | 0.0% |
| Engineering | 0 | 0.0% |
| Multidisciplinary Studies | 1 | 1.1% |
| Science & Technology | 23 | 26.4% |
| Business | 0 | 0.0% |
| Education | 6 | 6.9% |
| Literature & Languages | 4 | 4.6% |
| Liberal Arts & History | 8 | 9.2% |
| Visual & Performing Arts | 17 | 19.5% |
| Communications | 0 | 0.0% |
| Arts & Humanities | 4 | 4.6% |
| Total | 87 | 100.0% |
Transportation & Commute in Kempner
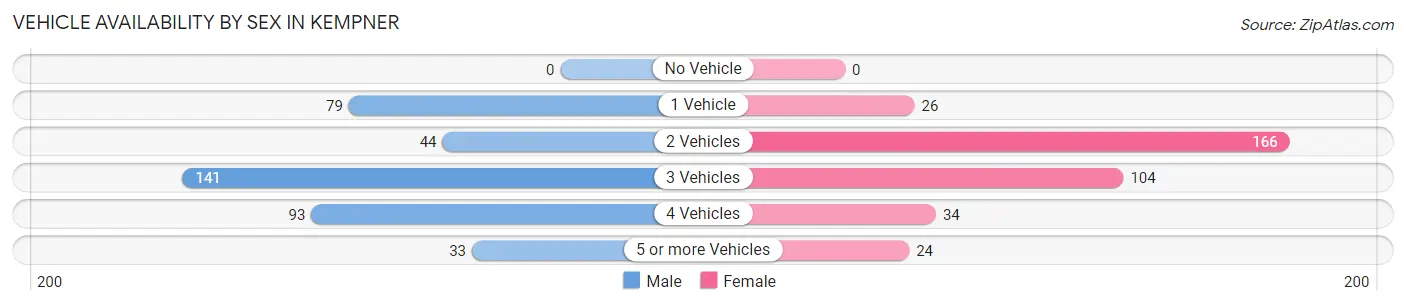
Vehicle Availability by Sex in Kempner
The most prevalent vehicle ownership categories in Kempner are males with 3 vehicles (141, accounting for 36.1%) and females with 3 vehicles (104, making up 39.8%).
| Vehicles Available | Male | Female |
| No Vehicle | 0 (0.0%) | 0 (0.0%) |
| 1 Vehicle | 79 (20.3%) | 26 (7.3%) |
| 2 Vehicles | 44 (11.3%) | 166 (46.9%) |
| 3 Vehicles | 141 (36.1%) | 104 (29.4%) |
| 4 Vehicles | 93 (23.8%) | 34 (9.6%) |
| 5 or more Vehicles | 33 (8.5%) | 24 (6.8%) |
| Total | 390 (100.0%) | 354 (100.0%) |
Commute Time in Kempner
The most frequently occuring commute durations in Kempner are 20 to 24 minutes (180 commuters, 28.6%), 15 to 19 minutes (98 commuters, 15.6%), and 25 to 29 minutes (76 commuters, 12.1%).
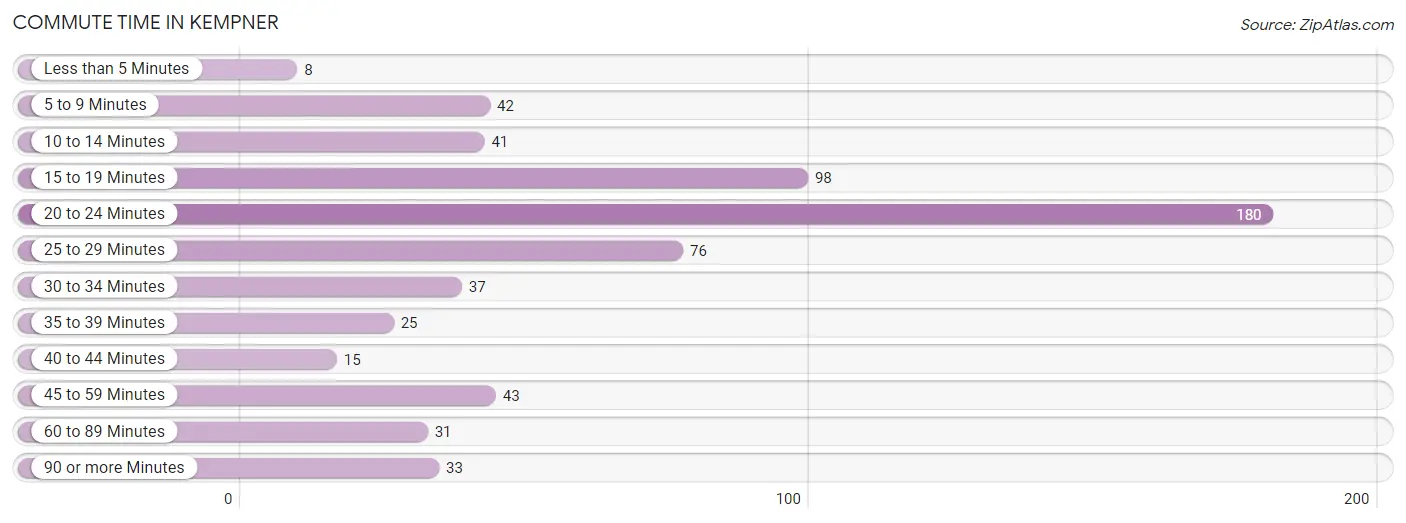
| Commute Time | # Commuters | % Commuters |
| Less than 5 Minutes | 8 | 1.3% |
| 5 to 9 Minutes | 42 | 6.7% |
| 10 to 14 Minutes | 41 | 6.5% |
| 15 to 19 Minutes | 98 | 15.6% |
| 20 to 24 Minutes | 180 | 28.6% |
| 25 to 29 Minutes | 76 | 12.1% |
| 30 to 34 Minutes | 37 | 5.9% |
| 35 to 39 Minutes | 25 | 4.0% |
| 40 to 44 Minutes | 15 | 2.4% |
| 45 to 59 Minutes | 43 | 6.8% |
| 60 to 89 Minutes | 31 | 4.9% |
| 90 or more Minutes | 33 | 5.2% |
Commute Time by Sex in Kempner
The most common commute times in Kempner are 20 to 24 minutes (73 commuters, 19.4%) for males and 20 to 24 minutes (107 commuters, 42.5%) for females.
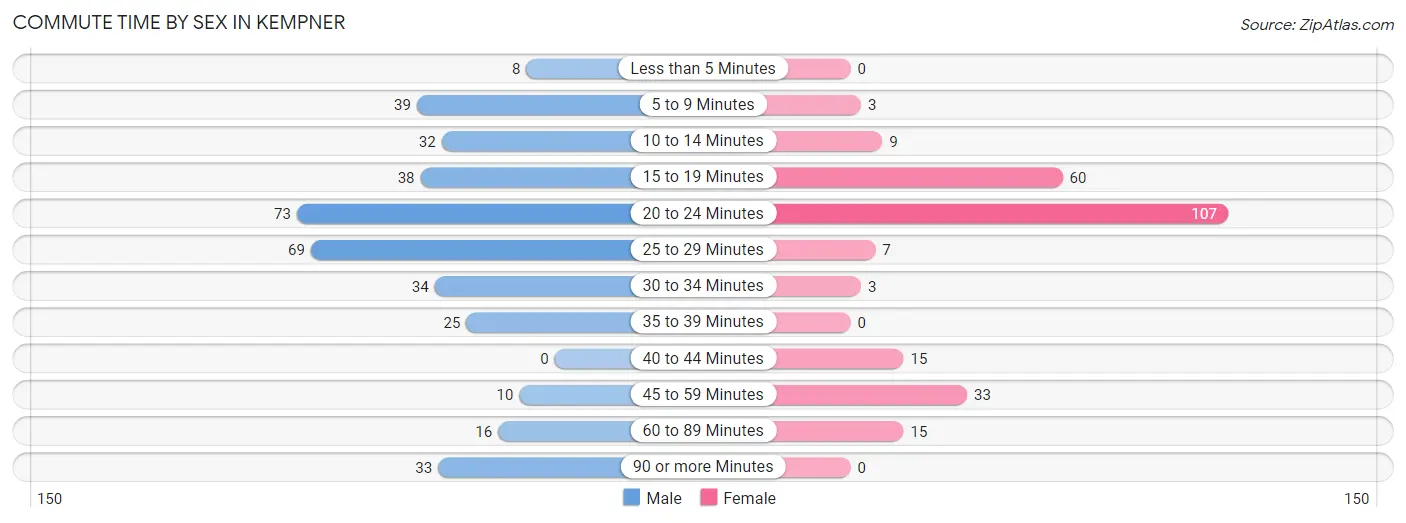
| Commute Time | Male | Female |
| Less than 5 Minutes | 8 (2.1%) | 0 (0.0%) |
| 5 to 9 Minutes | 39 (10.3%) | 3 (1.2%) |
| 10 to 14 Minutes | 32 (8.5%) | 9 (3.6%) |
| 15 to 19 Minutes | 38 (10.1%) | 60 (23.8%) |
| 20 to 24 Minutes | 73 (19.4%) | 107 (42.5%) |
| 25 to 29 Minutes | 69 (18.3%) | 7 (2.8%) |
| 30 to 34 Minutes | 34 (9.0%) | 3 (1.2%) |
| 35 to 39 Minutes | 25 (6.6%) | 0 (0.0%) |
| 40 to 44 Minutes | 0 (0.0%) | 15 (5.9%) |
| 45 to 59 Minutes | 10 (2.6%) | 33 (13.1%) |
| 60 to 89 Minutes | 16 (4.2%) | 15 (5.9%) |
| 90 or more Minutes | 33 (8.7%) | 0 (0.0%) |
Time of Departure to Work by Sex in Kempner
The most frequent times of departure to work in Kempner are 8:00 AM to 8:29 AM (114, 30.2%) for males and 7:00 AM to 7:29 AM (60, 23.8%) for females.
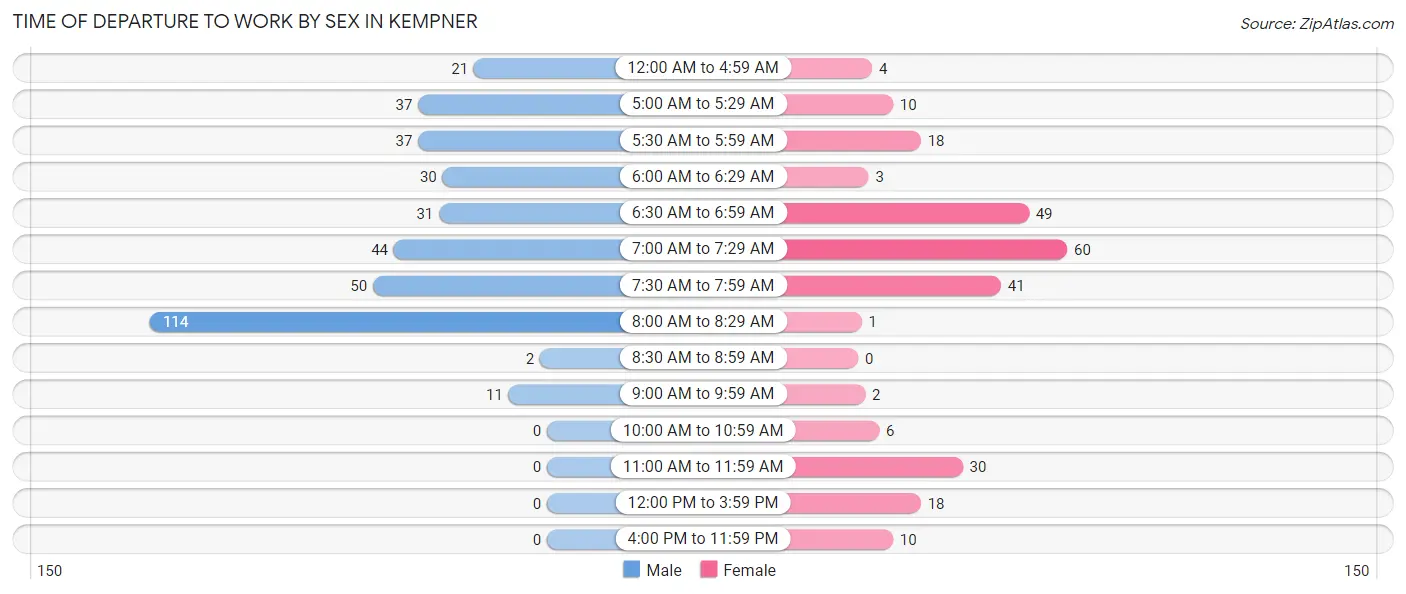
| Time of Departure | Male | Female |
| 12:00 AM to 4:59 AM | 21 (5.6%) | 4 (1.6%) |
| 5:00 AM to 5:29 AM | 37 (9.8%) | 10 (4.0%) |
| 5:30 AM to 5:59 AM | 37 (9.8%) | 18 (7.1%) |
| 6:00 AM to 6:29 AM | 30 (8.0%) | 3 (1.2%) |
| 6:30 AM to 6:59 AM | 31 (8.2%) | 49 (19.4%) |
| 7:00 AM to 7:29 AM | 44 (11.7%) | 60 (23.8%) |
| 7:30 AM to 7:59 AM | 50 (13.3%) | 41 (16.3%) |
| 8:00 AM to 8:29 AM | 114 (30.2%) | 1 (0.4%) |
| 8:30 AM to 8:59 AM | 2 (0.5%) | 0 (0.0%) |
| 9:00 AM to 9:59 AM | 11 (2.9%) | 2 (0.8%) |
| 10:00 AM to 10:59 AM | 0 (0.0%) | 6 (2.4%) |
| 11:00 AM to 11:59 AM | 0 (0.0%) | 30 (11.9%) |
| 12:00 PM to 3:59 PM | 0 (0.0%) | 18 (7.1%) |
| 4:00 PM to 11:59 PM | 0 (0.0%) | 10 (4.0%) |
| Total | 377 (100.0%) | 252 (100.0%) |
Housing Occupancy in Kempner
Occupancy by Ownership in Kempner
Of the total 443 dwellings in Kempner, owner-occupied units account for 327 (73.8%), while renter-occupied units make up 116 (26.2%).
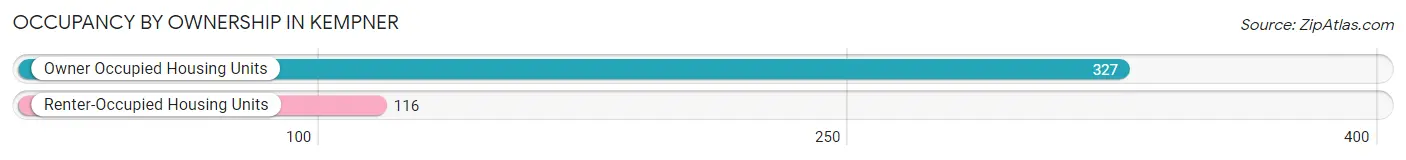
| Occupancy | # Housing Units | % Housing Units |
| Owner Occupied Housing Units | 327 | 73.8% |
| Renter-Occupied Housing Units | 116 | 26.2% |
| Total Occupied Housing Units | 443 | 100.0% |
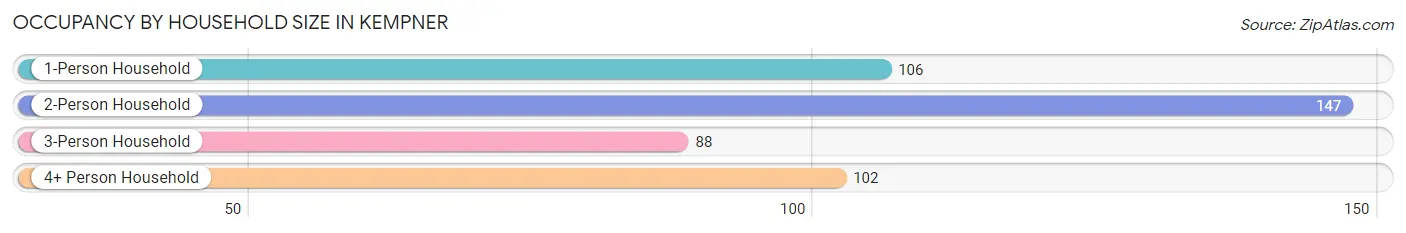
Occupancy by Household Size in Kempner
| Household Size | # Housing Units | % Housing Units |
| 1-Person Household | 106 | 23.9% |
| 2-Person Household | 147 | 33.2% |
| 3-Person Household | 88 | 19.9% |
| 4+ Person Household | 102 | 23.0% |
| Total Housing Units | 443 | 100.0% |
Occupancy by Ownership by Household Size in Kempner
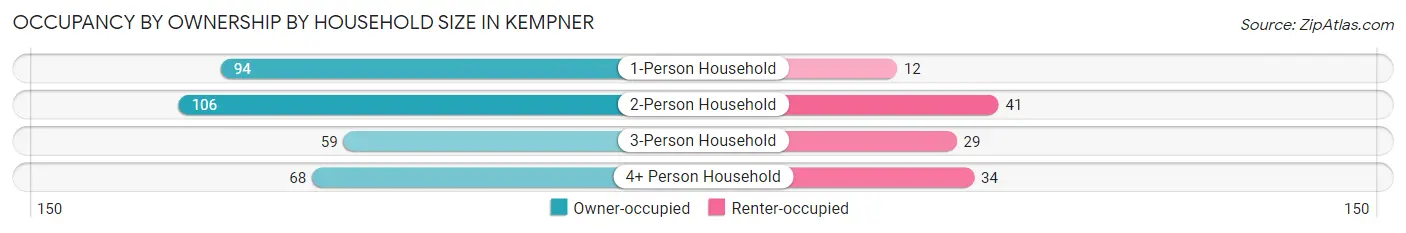
| Household Size | Owner-occupied | Renter-occupied |
| 1-Person Household | 94 (88.7%) | 12 (11.3%) |
| 2-Person Household | 106 (72.1%) | 41 (27.9%) |
| 3-Person Household | 59 (67.0%) | 29 (33.0%) |
| 4+ Person Household | 68 (66.7%) | 34 (33.3%) |
| Total Housing Units | 327 (73.8%) | 116 (26.2%) |
Occupancy by Educational Attainment in Kempner
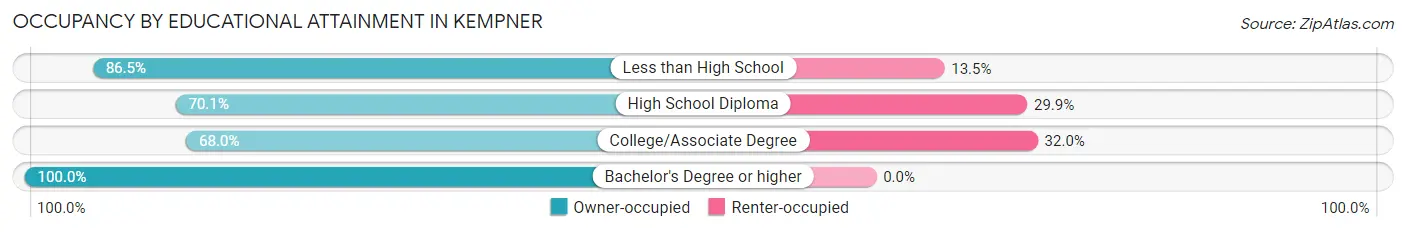
| Household Size | Owner-occupied | Renter-occupied |
| Less than High School | 32 (86.5%) | 5 (13.5%) |
| High School Diploma | 89 (70.1%) | 38 (29.9%) |
| College/Associate Degree | 155 (68.0%) | 73 (32.0%) |
| Bachelor's Degree or higher | 51 (100.0%) | 0 (0.0%) |
Occupancy by Age of Householder in Kempner
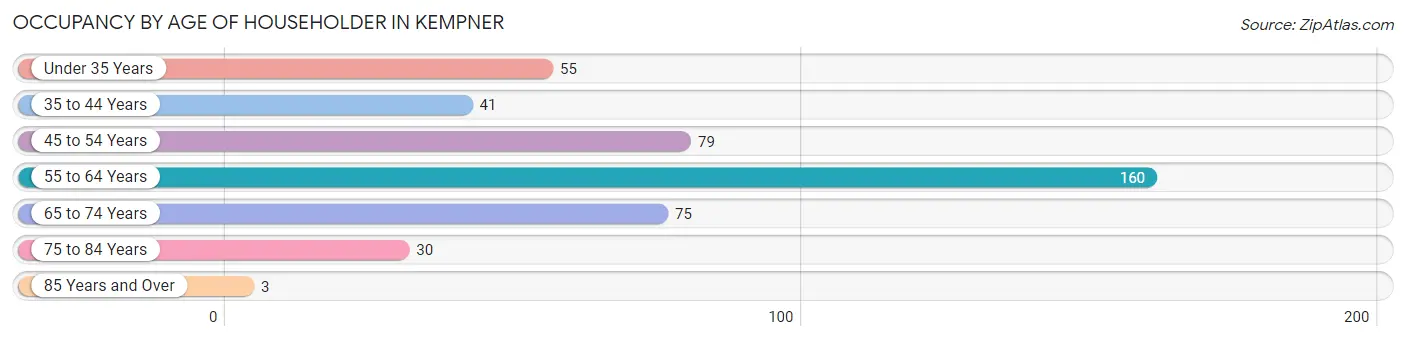
| Age Bracket | # Households | % Households |
| Under 35 Years | 55 | 12.4% |
| 35 to 44 Years | 41 | 9.3% |
| 45 to 54 Years | 79 | 17.8% |
| 55 to 64 Years | 160 | 36.1% |
| 65 to 74 Years | 75 | 16.9% |
| 75 to 84 Years | 30 | 6.8% |
| 85 Years and Over | 3 | 0.7% |
| Total | 443 | 100.0% |
Housing Finances in Kempner
Median Income by Occupancy in Kempner
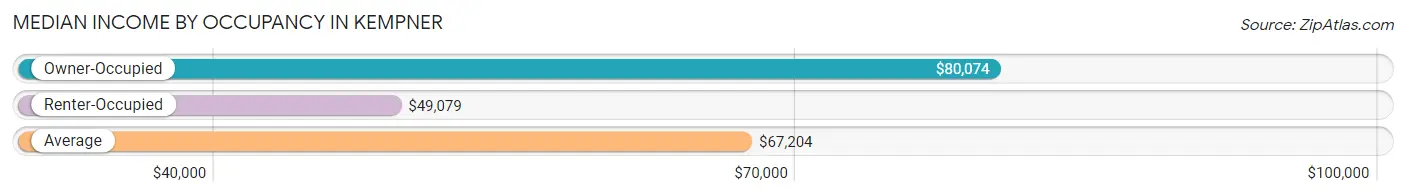
| Occupancy Type | # Households | Median Income |
| Owner-Occupied | 327 (73.8%) | $80,074 |
| Renter-Occupied | 116 (26.2%) | $49,079 |
| Average | 443 (100.0%) | $67,204 |
Occupancy by Householder Income Bracket in Kempner
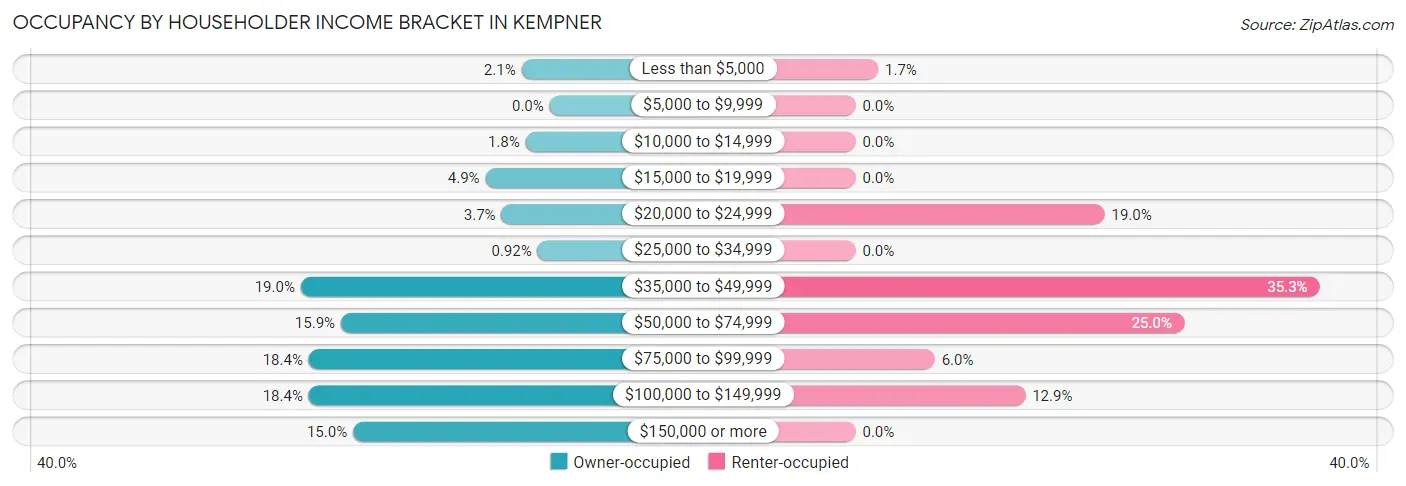
| Income Bracket | Owner-occupied | Renter-occupied |
| Less than $5,000 | 7 (2.1%) | 2 (1.7%) |
| $5,000 to $9,999 | 0 (0.0%) | 0 (0.0%) |
| $10,000 to $14,999 | 6 (1.8%) | 0 (0.0%) |
| $15,000 to $19,999 | 16 (4.9%) | 0 (0.0%) |
| $20,000 to $24,999 | 12 (3.7%) | 22 (19.0%) |
| $25,000 to $34,999 | 3 (0.9%) | 0 (0.0%) |
| $35,000 to $49,999 | 62 (19.0%) | 41 (35.3%) |
| $50,000 to $74,999 | 52 (15.9%) | 29 (25.0%) |
| $75,000 to $99,999 | 60 (18.3%) | 7 (6.0%) |
| $100,000 to $149,999 | 60 (18.3%) | 15 (12.9%) |
| $150,000 or more | 49 (15.0%) | 0 (0.0%) |
| Total | 327 (100.0%) | 116 (100.0%) |
Monthly Housing Cost Tiers in Kempner
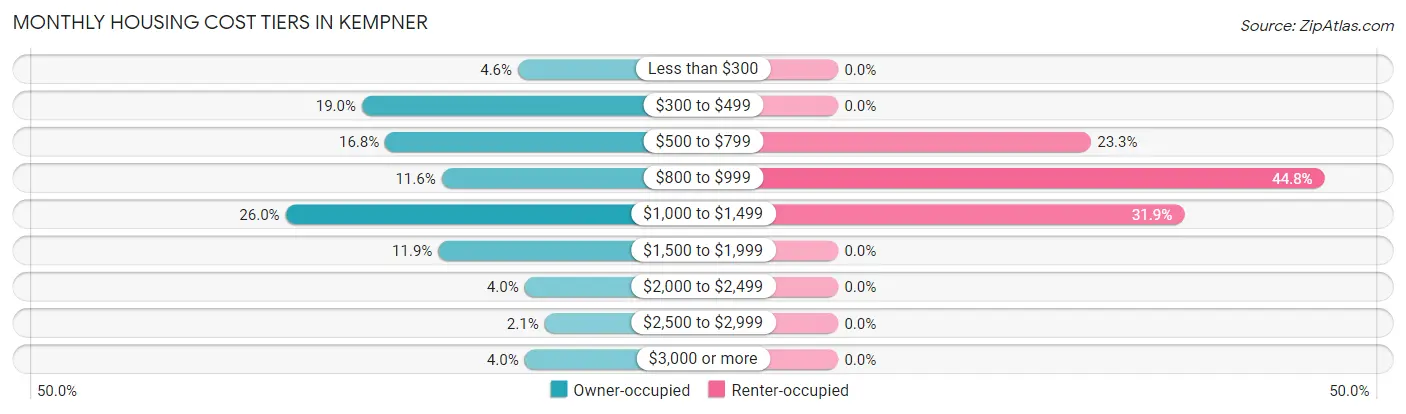
| Monthly Cost | Owner-occupied | Renter-occupied |
| Less than $300 | 15 (4.6%) | 0 (0.0%) |
| $300 to $499 | 62 (19.0%) | 0 (0.0%) |
| $500 to $799 | 55 (16.8%) | 27 (23.3%) |
| $800 to $999 | 38 (11.6%) | 52 (44.8%) |
| $1,000 to $1,499 | 85 (26.0%) | 37 (31.9%) |
| $1,500 to $1,999 | 39 (11.9%) | 0 (0.0%) |
| $2,000 to $2,499 | 13 (4.0%) | 0 (0.0%) |
| $2,500 to $2,999 | 7 (2.1%) | 0 (0.0%) |
| $3,000 or more | 13 (4.0%) | 0 (0.0%) |
| Total | 327 (100.0%) | 116 (100.0%) |
Physical Housing Characteristics in Kempner
Housing Structures in Kempner
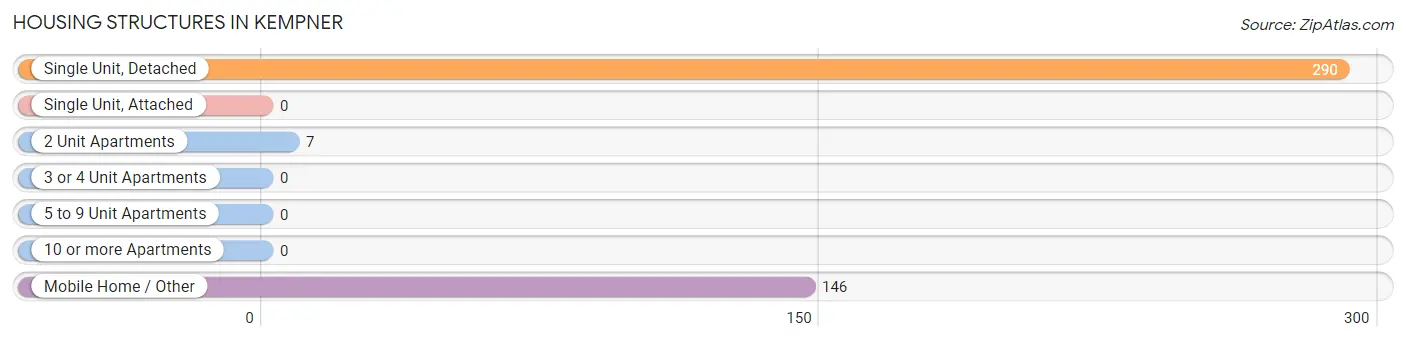
| Structure Type | # Housing Units | % Housing Units |
| Single Unit, Detached | 290 | 65.5% |
| Single Unit, Attached | 0 | 0.0% |
| 2 Unit Apartments | 7 | 1.6% |
| 3 or 4 Unit Apartments | 0 | 0.0% |
| 5 to 9 Unit Apartments | 0 | 0.0% |
| 10 or more Apartments | 0 | 0.0% |
| Mobile Home / Other | 146 | 33.0% |
| Total | 443 | 100.0% |
Housing Structures by Occupancy in Kempner
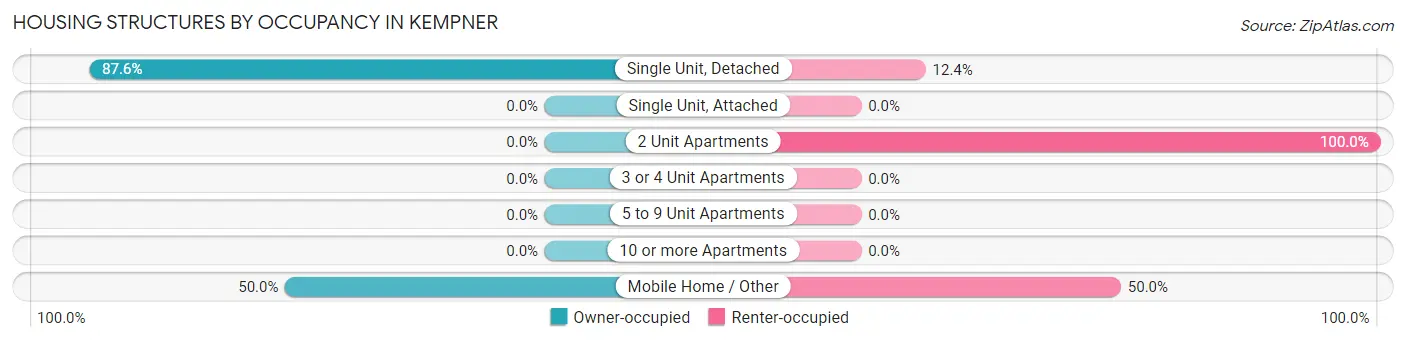
| Structure Type | Owner-occupied | Renter-occupied |
| Single Unit, Detached | 254 (87.6%) | 36 (12.4%) |
| Single Unit, Attached | 0 (0.0%) | 0 (0.0%) |
| 2 Unit Apartments | 0 (0.0%) | 7 (100.0%) |
| 3 or 4 Unit Apartments | 0 (0.0%) | 0 (0.0%) |
| 5 to 9 Unit Apartments | 0 (0.0%) | 0 (0.0%) |
| 10 or more Apartments | 0 (0.0%) | 0 (0.0%) |
| Mobile Home / Other | 73 (50.0%) | 73 (50.0%) |
| Total | 327 (73.8%) | 116 (26.2%) |
Housing Structures by Number of Rooms in Kempner
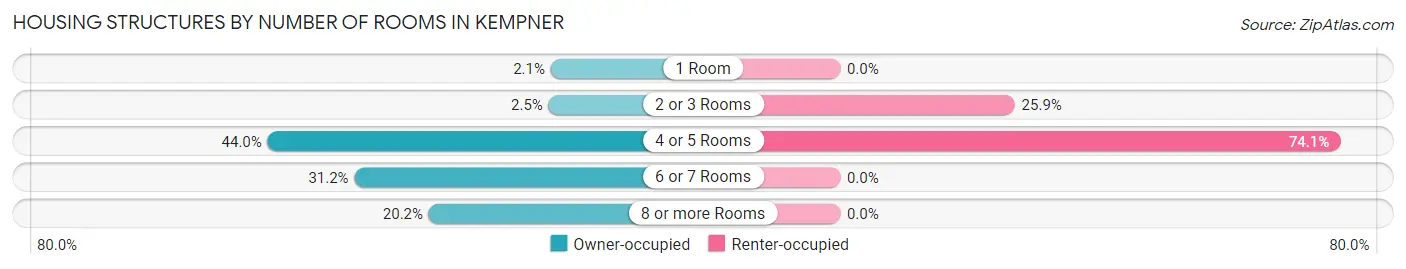
| Number of Rooms | Owner-occupied | Renter-occupied |
| 1 Room | 7 (2.1%) | 0 (0.0%) |
| 2 or 3 Rooms | 8 (2.5%) | 30 (25.9%) |
| 4 or 5 Rooms | 144 (44.0%) | 86 (74.1%) |
| 6 or 7 Rooms | 102 (31.2%) | 0 (0.0%) |
| 8 or more Rooms | 66 (20.2%) | 0 (0.0%) |
| Total | 327 (100.0%) | 116 (100.0%) |
Housing Structure by Heating Type in Kempner
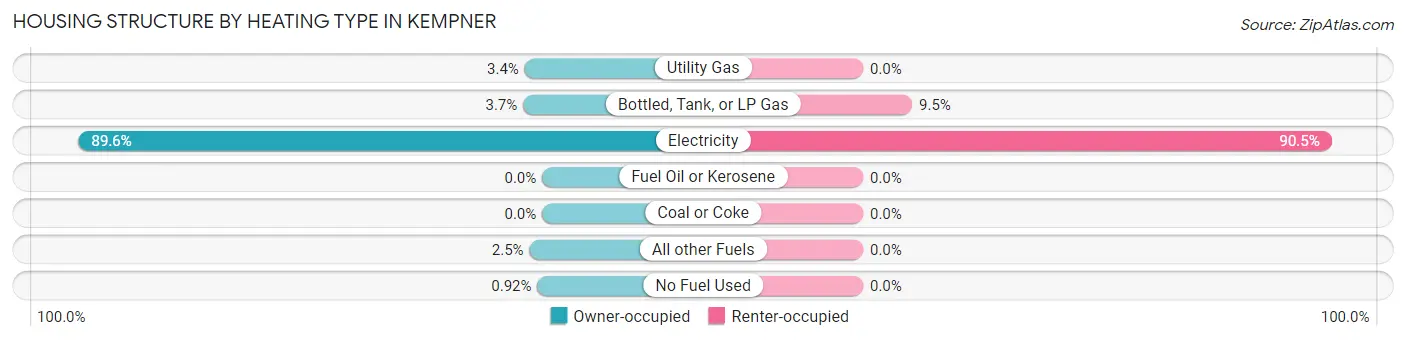
| Heating Type | Owner-occupied | Renter-occupied |
| Utility Gas | 11 (3.4%) | 0 (0.0%) |
| Bottled, Tank, or LP Gas | 12 (3.7%) | 11 (9.5%) |
| Electricity | 293 (89.6%) | 105 (90.5%) |
| Fuel Oil or Kerosene | 0 (0.0%) | 0 (0.0%) |
| Coal or Coke | 0 (0.0%) | 0 (0.0%) |
| All other Fuels | 8 (2.5%) | 0 (0.0%) |
| No Fuel Used | 3 (0.9%) | 0 (0.0%) |
| Total | 327 (100.0%) | 116 (100.0%) |
Household Vehicle Usage in Kempner
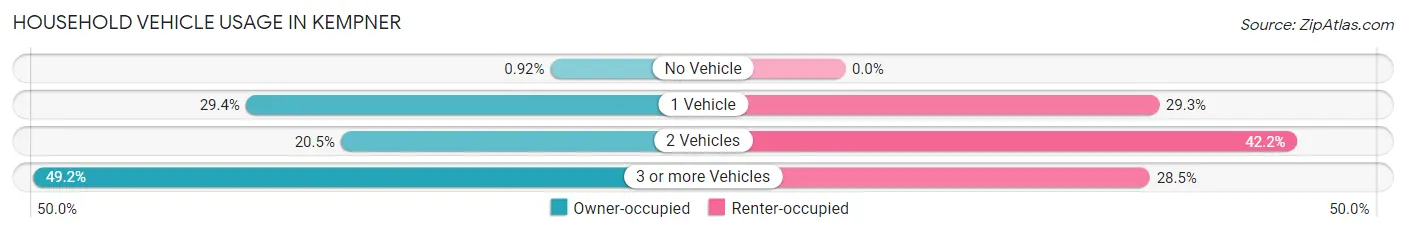
| Vehicles per Household | Owner-occupied | Renter-occupied |
| No Vehicle | 3 (0.9%) | 0 (0.0%) |
| 1 Vehicle | 96 (29.4%) | 34 (29.3%) |
| 2 Vehicles | 67 (20.5%) | 49 (42.2%) |
| 3 or more Vehicles | 161 (49.2%) | 33 (28.4%) |
| Total | 327 (100.0%) | 116 (100.0%) |
Real Estate & Mortgages in Kempner
Real Estate and Mortgage Overview in Kempner
| Characteristic | Without Mortgage | With Mortgage |
| Housing Units | 160 | 167 |
| Median Property Value | $185,000 | $174,800 |
| Median Household Income | $80,147 | $32 |
| Monthly Housing Costs | $518 | $13 |
| Real Estate Taxes | - | - |
Property Value by Mortgage Status in Kempner
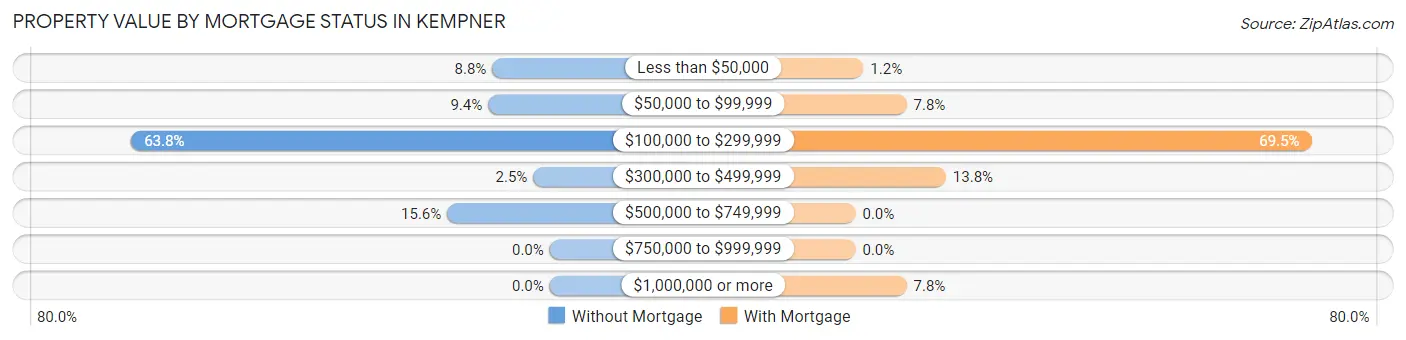
| Property Value | Without Mortgage | With Mortgage |
| Less than $50,000 | 14 (8.7%) | 2 (1.2%) |
| $50,000 to $99,999 | 15 (9.4%) | 13 (7.8%) |
| $100,000 to $299,999 | 102 (63.7%) | 116 (69.5%) |
| $300,000 to $499,999 | 4 (2.5%) | 23 (13.8%) |
| $500,000 to $749,999 | 25 (15.6%) | 0 (0.0%) |
| $750,000 to $999,999 | 0 (0.0%) | 0 (0.0%) |
| $1,000,000 or more | 0 (0.0%) | 13 (7.8%) |
| Total | 160 (100.0%) | 167 (100.0%) |
Household Income by Mortgage Status in Kempner
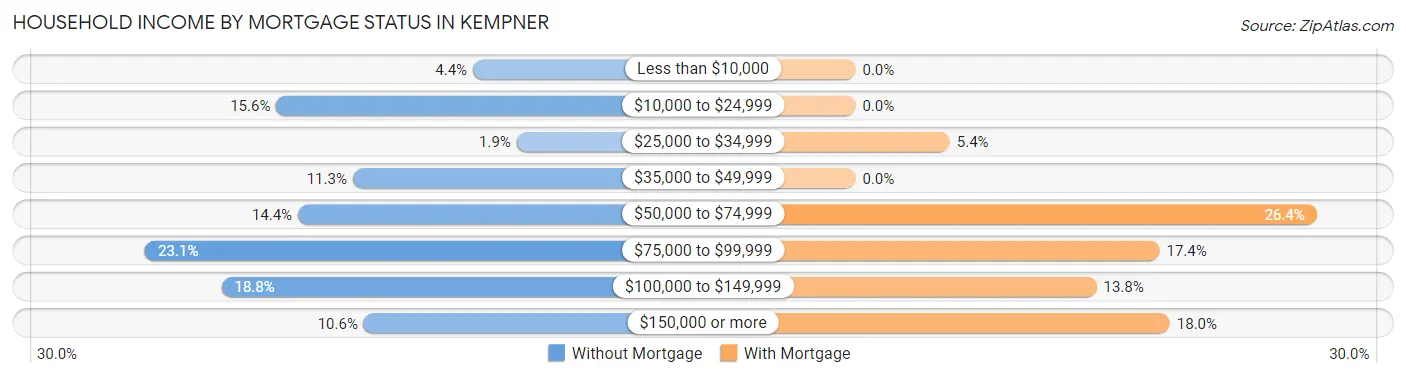
| Household Income | Without Mortgage | With Mortgage |
| Less than $10,000 | 7 (4.4%) | 0 (0.0%) |
| $10,000 to $24,999 | 25 (15.6%) | 0 (0.0%) |
| $25,000 to $34,999 | 3 (1.9%) | 9 (5.4%) |
| $35,000 to $49,999 | 18 (11.3%) | 0 (0.0%) |
| $50,000 to $74,999 | 23 (14.4%) | 44 (26.4%) |
| $75,000 to $99,999 | 37 (23.1%) | 29 (17.4%) |
| $100,000 to $149,999 | 30 (18.8%) | 23 (13.8%) |
| $150,000 or more | 17 (10.6%) | 30 (18.0%) |
| Total | 160 (100.0%) | 167 (100.0%) |
Property Value to Household Income Ratio in Kempner
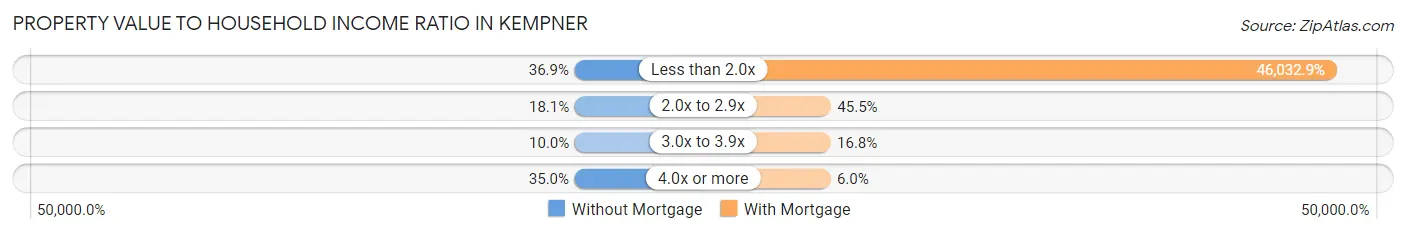
| Value-to-Income Ratio | Without Mortgage | With Mortgage |
| Less than 2.0x | 59 (36.9%) | 76,875 (46,032.9%) |
| 2.0x to 2.9x | 29 (18.1%) | 76 (45.5%) |
| 3.0x to 3.9x | 16 (10.0%) | 28 (16.8%) |
| 4.0x or more | 56 (35.0%) | 10 (6.0%) |
| Total | 160 (100.0%) | 167 (100.0%) |
Real Estate Taxes by Mortgage Status in Kempner
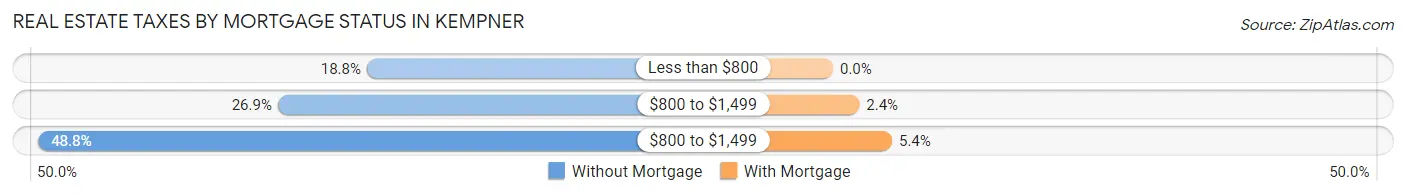
| Property Taxes | Without Mortgage | With Mortgage |
| Less than $800 | 30 (18.8%) | 0 (0.0%) |
| $800 to $1,499 | 43 (26.9%) | 4 (2.4%) |
| $800 to $1,499 | 78 (48.7%) | 9 (5.4%) |
| Total | 160 (100.0%) | 167 (100.0%) |
Health & Disability in Kempner
Health Insurance Coverage by Age in Kempner
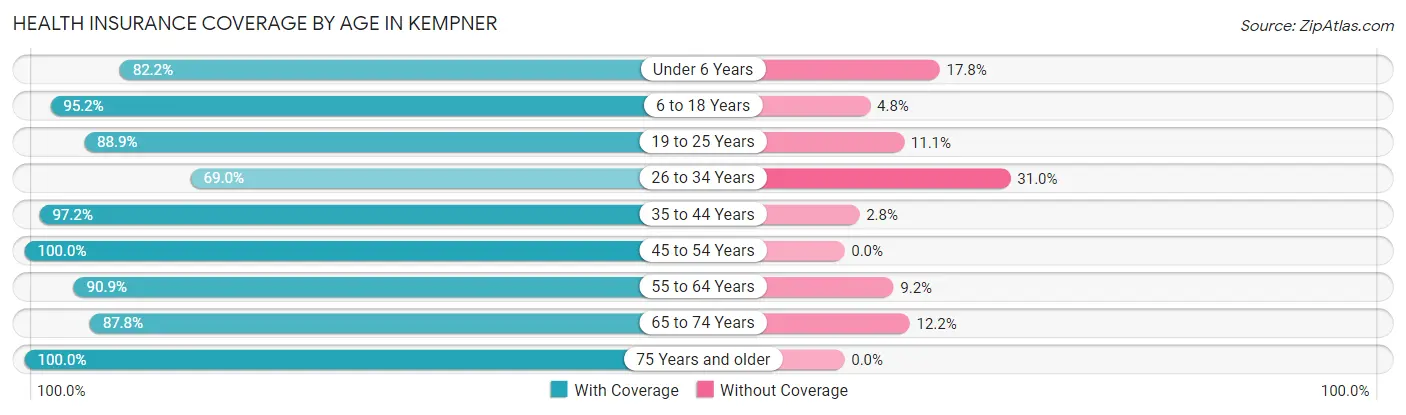
| Age Bracket | With Coverage | Without Coverage |
| Under 6 Years | 88 (82.2%) | 19 (17.8%) |
| 6 to 18 Years | 178 (95.2%) | 9 (4.8%) |
| 19 to 25 Years | 120 (88.9%) | 15 (11.1%) |
| 26 to 34 Years | 78 (69.0%) | 35 (31.0%) |
| 35 to 44 Years | 105 (97.2%) | 3 (2.8%) |
| 45 to 54 Years | 216 (100.0%) | 0 (0.0%) |
| 55 to 64 Years | 278 (90.8%) | 28 (9.1%) |
| 65 to 74 Years | 101 (87.8%) | 14 (12.2%) |
| 75 Years and older | 54 (100.0%) | 0 (0.0%) |
| Total | 1,218 (90.8%) | 123 (9.2%) |
Health Insurance Coverage by Citizenship Status in Kempner
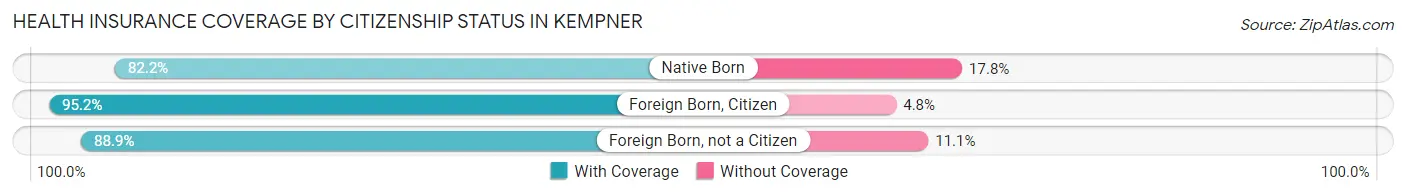
| Citizenship Status | With Coverage | Without Coverage |
| Native Born | 88 (82.2%) | 19 (17.8%) |
| Foreign Born, Citizen | 178 (95.2%) | 9 (4.8%) |
| Foreign Born, not a Citizen | 120 (88.9%) | 15 (11.1%) |
Health Insurance Coverage by Household Income in Kempner
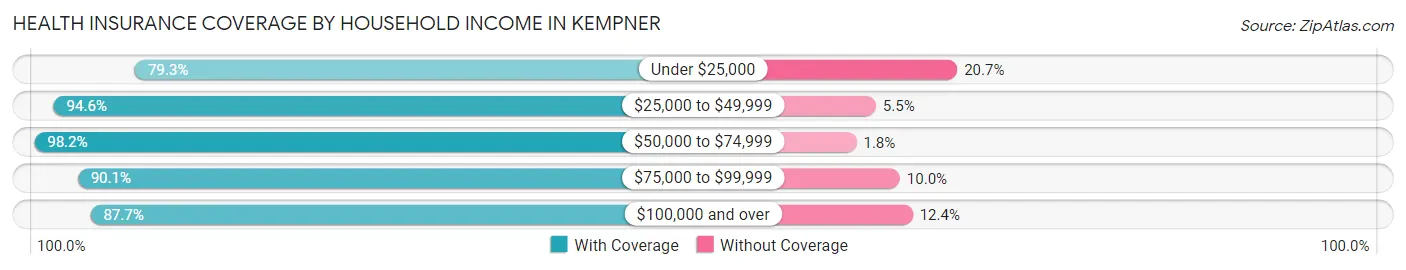
| Household Income | With Coverage | Without Coverage |
| Under $25,000 | 92 (79.3%) | 24 (20.7%) |
| $25,000 to $49,999 | 416 (94.6%) | 24 (5.4%) |
| $50,000 to $74,999 | 162 (98.2%) | 3 (1.8%) |
| $75,000 to $99,999 | 172 (90.0%) | 19 (10.0%) |
| $100,000 and over | 376 (87.6%) | 53 (12.3%) |
Public vs Private Health Insurance Coverage by Age in Kempner
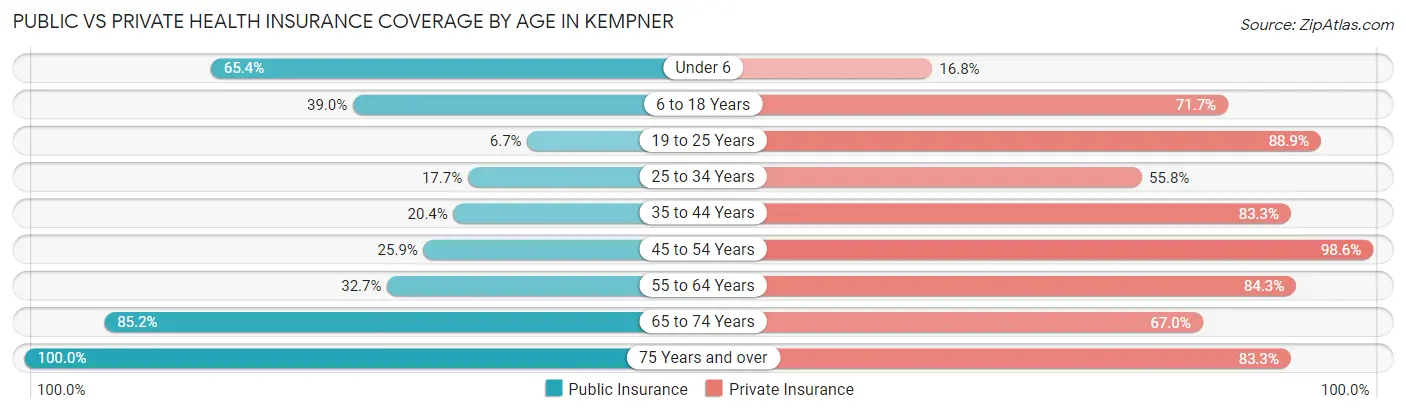
| Age Bracket | Public Insurance | Private Insurance |
| Under 6 | 70 (65.4%) | 18 (16.8%) |
| 6 to 18 Years | 73 (39.0%) | 134 (71.7%) |
| 19 to 25 Years | 9 (6.7%) | 120 (88.9%) |
| 25 to 34 Years | 20 (17.7%) | 63 (55.7%) |
| 35 to 44 Years | 22 (20.4%) | 90 (83.3%) |
| 45 to 54 Years | 56 (25.9%) | 213 (98.6%) |
| 55 to 64 Years | 100 (32.7%) | 258 (84.3%) |
| 65 to 74 Years | 98 (85.2%) | 77 (67.0%) |
| 75 Years and over | 54 (100.0%) | 45 (83.3%) |
| Total | 502 (37.4%) | 1,018 (75.9%) |
Disability Status by Sex by Age in Kempner
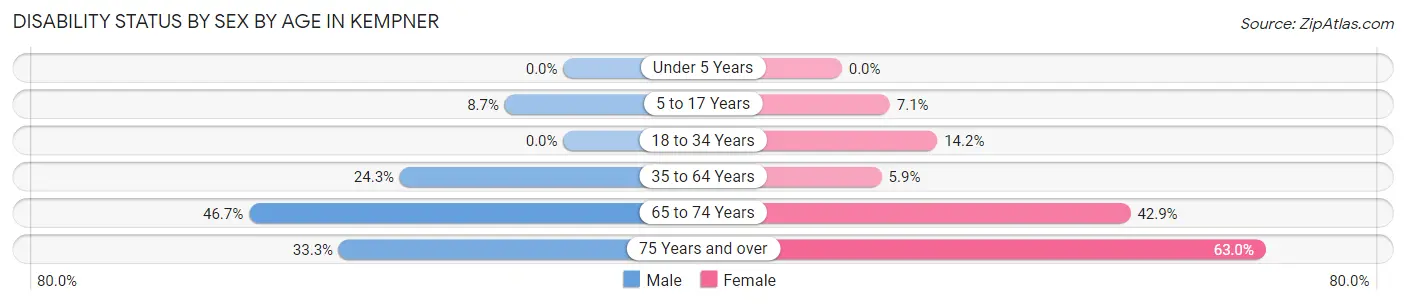
| Age Bracket | Male | Female |
| Under 5 Years | 0 (0.0%) | 0 (0.0%) |
| 5 to 17 Years | 10 (8.7%) | 4 (7.1%) |
| 18 to 34 Years | 0 (0.0%) | 18 (14.2%) |
| 35 to 64 Years | 75 (24.3%) | 19 (5.9%) |
| 65 to 74 Years | 21 (46.7%) | 30 (42.9%) |
| 75 Years and over | 9 (33.3%) | 17 (63.0%) |
Disability Class by Sex by Age in Kempner
Disability Class: Hearing Difficulty
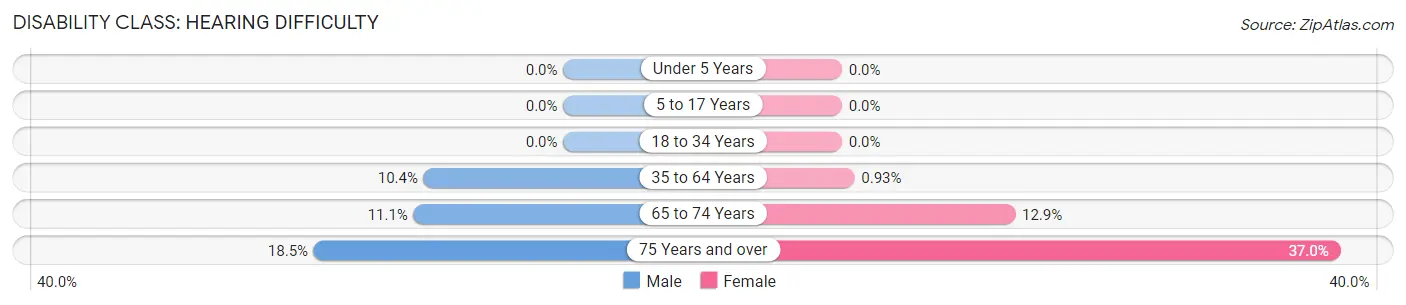
| Age Bracket | Male | Female |
| Under 5 Years | 0 (0.0%) | 0 (0.0%) |
| 5 to 17 Years | 0 (0.0%) | 0 (0.0%) |
| 18 to 34 Years | 0 (0.0%) | 0 (0.0%) |
| 35 to 64 Years | 32 (10.4%) | 3 (0.9%) |
| 65 to 74 Years | 5 (11.1%) | 9 (12.9%) |
| 75 Years and over | 5 (18.5%) | 10 (37.0%) |
Disability Class: Vision Difficulty
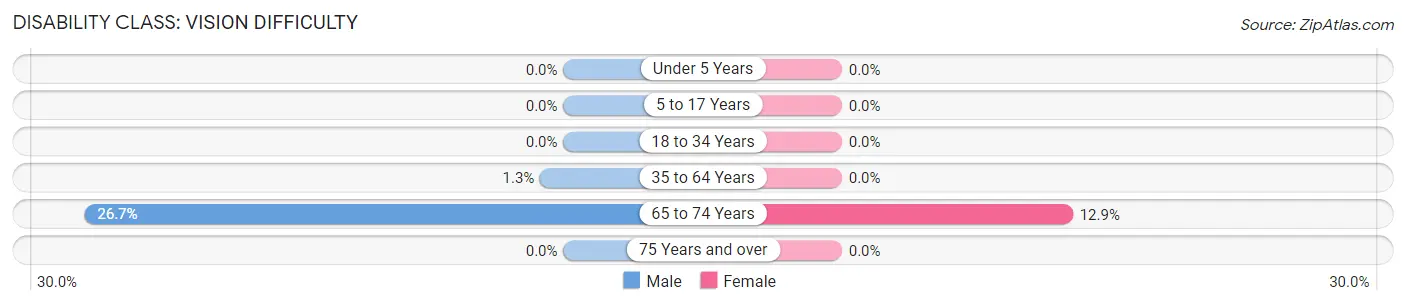
| Age Bracket | Male | Female |
| Under 5 Years | 0 (0.0%) | 0 (0.0%) |
| 5 to 17 Years | 0 (0.0%) | 0 (0.0%) |
| 18 to 34 Years | 0 (0.0%) | 0 (0.0%) |
| 35 to 64 Years | 4 (1.3%) | 0 (0.0%) |
| 65 to 74 Years | 12 (26.7%) | 9 (12.9%) |
| 75 Years and over | 0 (0.0%) | 0 (0.0%) |
Disability Class: Cognitive Difficulty
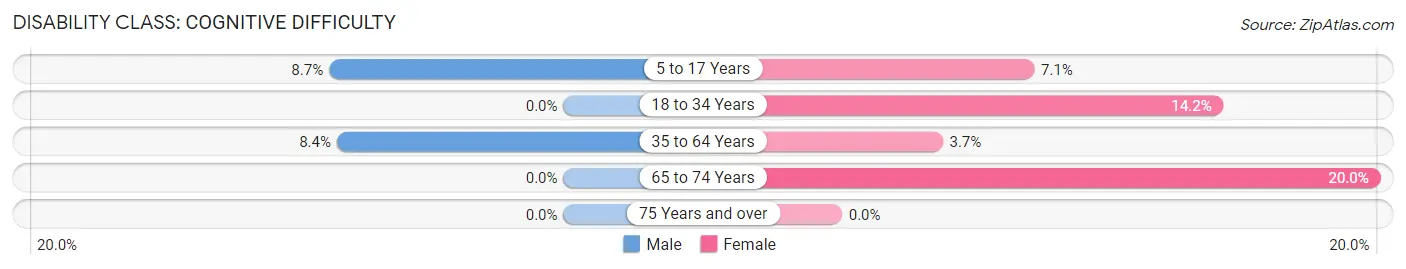
| Age Bracket | Male | Female |
| 5 to 17 Years | 10 (8.7%) | 4 (7.1%) |
| 18 to 34 Years | 0 (0.0%) | 18 (14.2%) |
| 35 to 64 Years | 26 (8.4%) | 12 (3.7%) |
| 65 to 74 Years | 0 (0.0%) | 14 (20.0%) |
| 75 Years and over | 0 (0.0%) | 0 (0.0%) |
Disability Class: Ambulatory Difficulty
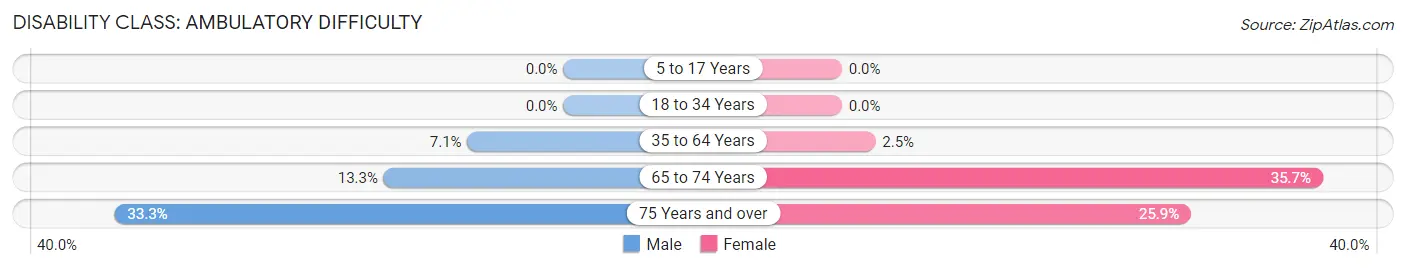
| Age Bracket | Male | Female |
| 5 to 17 Years | 0 (0.0%) | 0 (0.0%) |
| 18 to 34 Years | 0 (0.0%) | 0 (0.0%) |
| 35 to 64 Years | 22 (7.1%) | 8 (2.5%) |
| 65 to 74 Years | 6 (13.3%) | 25 (35.7%) |
| 75 Years and over | 9 (33.3%) | 7 (25.9%) |
Disability Class: Self-Care Difficulty
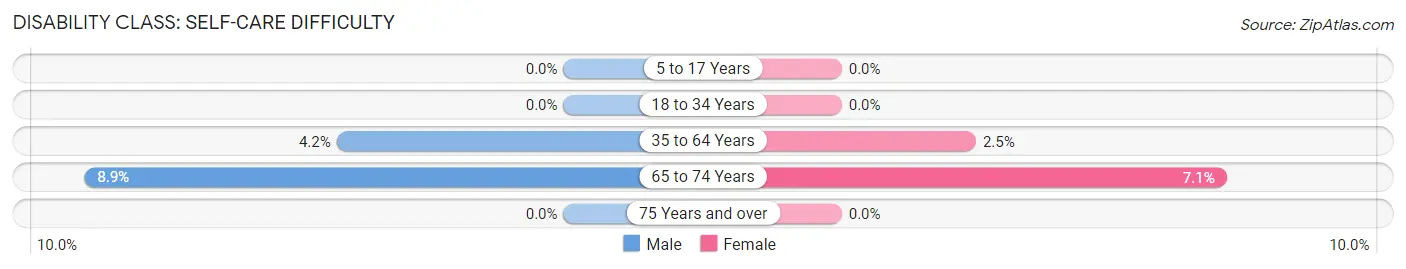
| Age Bracket | Male | Female |
| 5 to 17 Years | 0 (0.0%) | 0 (0.0%) |
| 18 to 34 Years | 0 (0.0%) | 0 (0.0%) |
| 35 to 64 Years | 13 (4.2%) | 8 (2.5%) |
| 65 to 74 Years | 4 (8.9%) | 5 (7.1%) |
| 75 Years and over | 0 (0.0%) | 0 (0.0%) |
Technology Access in Kempner
Computing Device Access in Kempner
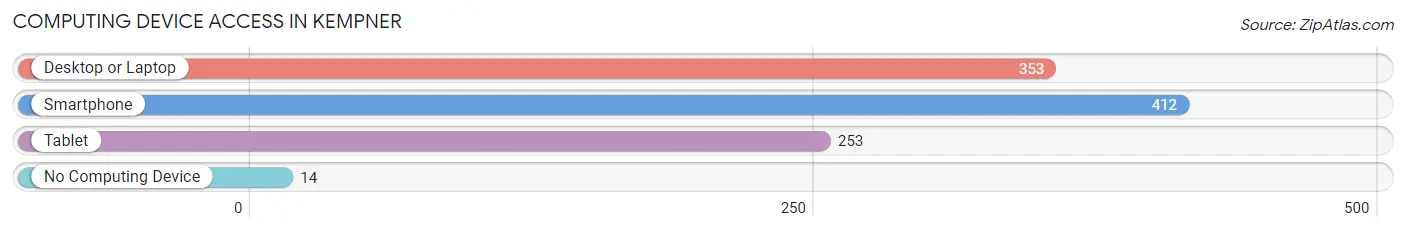
| Device Type | # Households | % Households |
| Desktop or Laptop | 353 | 79.7% |
| Smartphone | 412 | 93.0% |
| Tablet | 253 | 57.1% |
| No Computing Device | 14 | 3.2% |
| Total | 443 | 100.0% |
Internet Access in Kempner
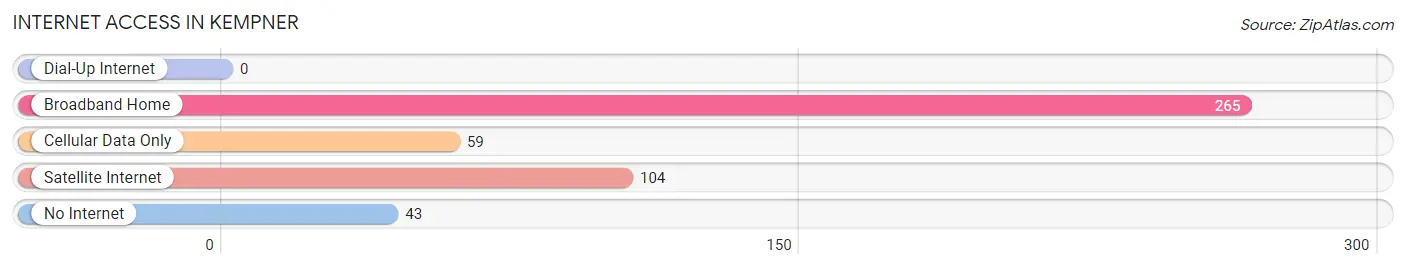
| Internet Type | # Households | % Households |
| Dial-Up Internet | 0 | 0.0% |
| Broadband Home | 265 | 59.8% |
| Cellular Data Only | 59 | 13.3% |
| Satellite Internet | 104 | 23.5% |
| No Internet | 43 | 9.7% |
| Total | 443 | 100.0% |
Kempner Summary
Kempner, Texas is a small town located in Lampasas County, Texas. It is situated about 25 miles northwest of Killeen and about 50 miles southwest of Waco. The town was founded in 1883 by John and Mary Kempner, who were German immigrants. The town was named after the Kempner family.
Kempner is located in the rolling hills of Central Texas. The terrain is mostly flat with some hills and valleys. The climate is generally mild with hot summers and cool winters. The average temperature in the summer is around 90 degrees Fahrenheit and the average temperature in the winter is around 50 degrees Fahrenheit.
The population of Kempner was 1,845 in the 2010 census. The population is mostly white (90.2%) with a small Hispanic population (7.2%). The median household income is $45,000 and the median home value is $90,000. The town is served by the Lampasas Independent School District.
The economy of Kempner is largely based on agriculture. The town is home to several farms and ranches, as well as a few small businesses. The town is also home to a few manufacturing plants, including a plant that produces plastic products.
Kempner is home to several parks and recreational areas, including Kempner Park, which features a playground, picnic areas, and a walking trail. The town also has a public library and a community center.
Kempner is a small town with a rich history and a bright future. The town is home to a diverse population and a strong economy. The town is a great place to live, work, and raise a family.
Common Questions
What is Per Capita Income in Kempner?
Per Capita income in Kempner is $29,541.
What is the Median Family Income in Kempner?
Median Family Income in Kempner is $67,270.
What is the Median Household income in Kempner?
Median Household Income in Kempner is $67,204.
What is Income or Wage Gap in Kempner?
Income or Wage Gap in Kempner is 29.4%.
Women in Kempner earn 70.6 cents for every dollar earned by a man.
What is Inequality or Gini Index in Kempner?
Inequality or Gini Index in Kempner is 0.37.
What is the Total Population of Kempner?
Total Population of Kempner is 1,346.
What is the Total Male Population of Kempner?
Total Male Population of Kempner is 715.
What is the Total Female Population of Kempner?
Total Female Population of Kempner is 631.
What is the Ratio of Males per 100 Females in Kempner?
There are 113.31 Males per 100 Females in Kempner.
What is the Ratio of Females per 100 Males in Kempner?
There are 88.25 Females per 100 Males in Kempner.
What is the Median Population Age in Kempner?
Median Population Age in Kempner is 45.8 Years.
What is the Average Family Size in Kempner
Average Family Size in Kempner is 3.6 People.
What is the Average Household Size in Kempner
Average Household Size in Kempner is 3.0 People.
How Large is the Labor Force in Kempner?
There are 759 People in the Labor Forcein in Kempner.
What is the Percentage of People in the Labor Force in Kempner?
69.4% of People are in the Labor Force in Kempner.
What is the Unemployment Rate in Kempner?
Unemployment Rate in Kempner is 2.0%.