Fairview, TX Map & Demographics
Fairview Map
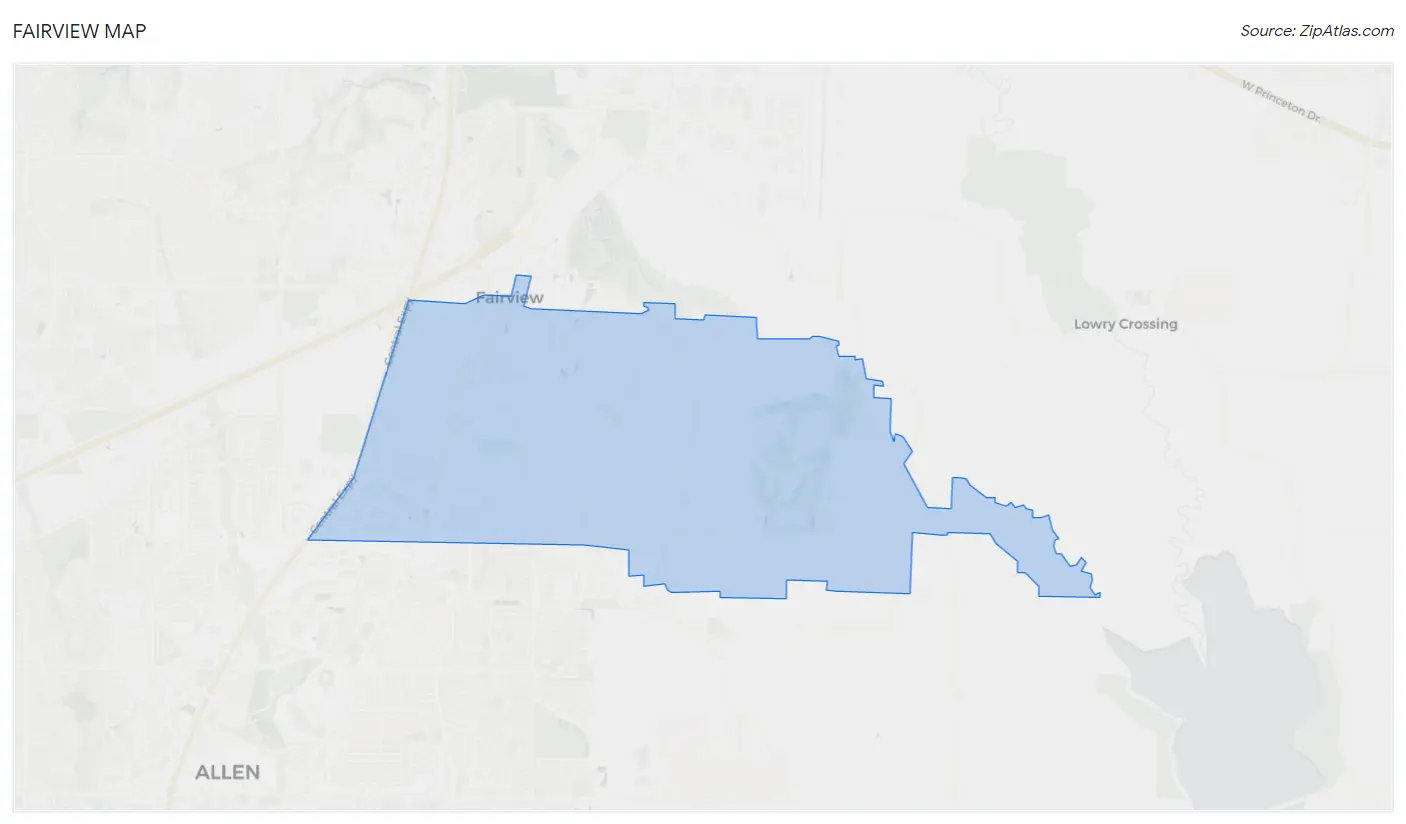
Fairview Overview
$61,139
PER CAPITA INCOME
$131,476
AVG FAMILY INCOME
$103,219
AVG HOUSEHOLD INCOME
57.7%
WAGE / INCOME GAP [ % ]
42.3¢/ $1
WAGE / INCOME GAP [ $ ]
$15,738
FAMILY INCOME DEFICIT
0.47
INEQUALITY / GINI INDEX
10,354
TOTAL POPULATION
4,473
MALE POPULATION
5,881
FEMALE POPULATION
76.06
MALES / 100 FEMALES
131.48
FEMALES / 100 MALES
49.6
MEDIAN AGE
3.0
AVG FAMILY SIZE
2.4
AVG HOUSEHOLD SIZE
4,048
LABOR FORCE [ PEOPLE ]
47.8%
PERCENT IN LABOR FORCE
2.0%
UNEMPLOYMENT RATE
Income in Fairview
Income Overview in Fairview
Per Capita Income in Fairview is $61,139, while median incomes of families and households are $131,476 and $103,219 respectively.
| Characteristic | Number | Measure |
| Per Capita Income | 10,354 | $61,139 |
| Median Family Income | 3,051 | $131,476 |
| Mean Family Income | 3,051 | $167,288 |
| Median Household Income | 4,313 | $103,219 |
| Mean Household Income | 4,313 | $144,599 |
| Income Deficit | 3,051 | $15,738 |
| Wage / Income Gap (%) | 10,354 | 57.72% |
| Wage / Income Gap ($) | 10,354 | 42.28¢ per $1 |
| Gini / Inequality Index | 10,354 | 0.47 |
Earnings by Sex in Fairview
Average Earnings in Fairview are $73,824, $91,458 for men and $38,667 for women, a difference of 57.7%.
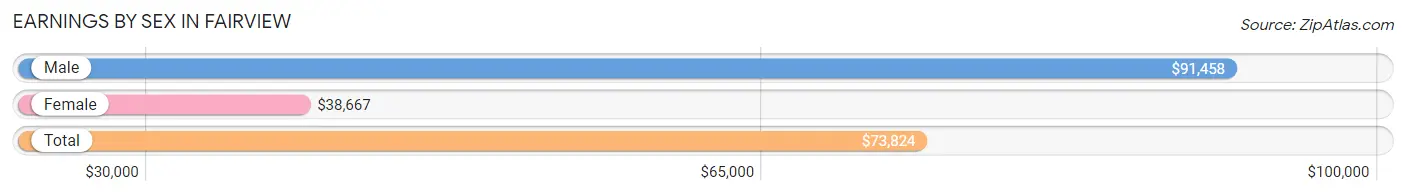
| Sex | Number | Average Earnings |
| Male | 2,346 (55.8%) | $91,458 |
| Female | 1,860 (44.2%) | $38,667 |
| Total | 4,206 (100.0%) | $73,824 |
Earnings by Sex by Income Bracket in Fairview
The most common earnings brackets in Fairview are $100,000+ for men (1,053 | 44.9%) and $100,000+ for women (338 | 18.2%).
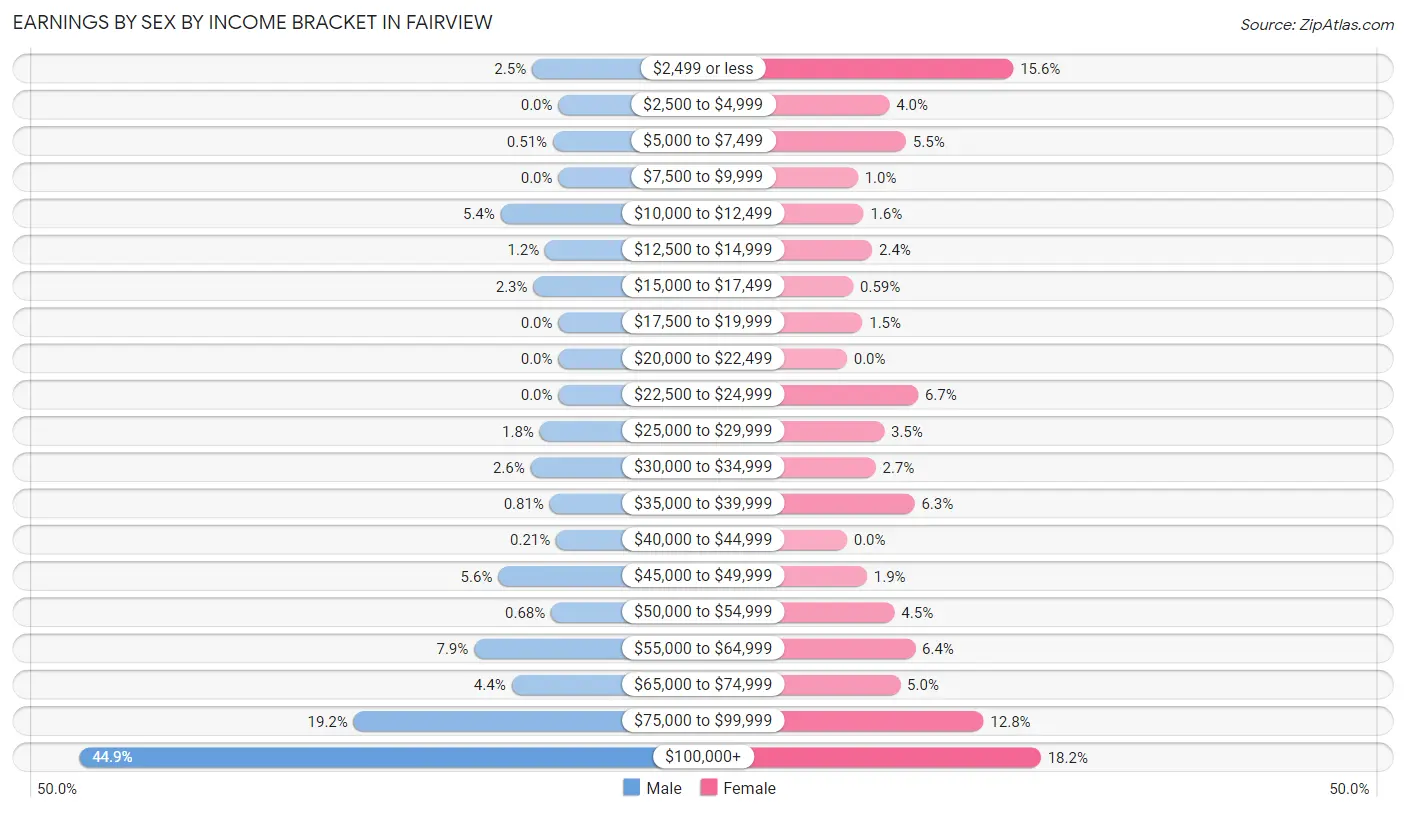
| Income | Male | Female |
| $2,499 or less | 58 (2.5%) | 290 (15.6%) |
| $2,500 to $4,999 | 0 (0.0%) | 74 (4.0%) |
| $5,000 to $7,499 | 12 (0.5%) | 103 (5.5%) |
| $7,500 to $9,999 | 0 (0.0%) | 19 (1.0%) |
| $10,000 to $12,499 | 127 (5.4%) | 29 (1.6%) |
| $12,500 to $14,999 | 29 (1.2%) | 44 (2.4%) |
| $15,000 to $17,499 | 55 (2.3%) | 11 (0.6%) |
| $17,500 to $19,999 | 0 (0.0%) | 27 (1.5%) |
| $20,000 to $22,499 | 0 (0.0%) | 0 (0.0%) |
| $22,500 to $24,999 | 0 (0.0%) | 124 (6.7%) |
| $25,000 to $29,999 | 41 (1.8%) | 65 (3.5%) |
| $30,000 to $34,999 | 61 (2.6%) | 50 (2.7%) |
| $35,000 to $39,999 | 19 (0.8%) | 118 (6.3%) |
| $40,000 to $44,999 | 5 (0.2%) | 0 (0.0%) |
| $45,000 to $49,999 | 132 (5.6%) | 35 (1.9%) |
| $50,000 to $54,999 | 16 (0.7%) | 83 (4.5%) |
| $55,000 to $64,999 | 185 (7.9%) | 119 (6.4%) |
| $65,000 to $74,999 | 103 (4.4%) | 93 (5.0%) |
| $75,000 to $99,999 | 450 (19.2%) | 238 (12.8%) |
| $100,000+ | 1,053 (44.9%) | 338 (18.2%) |
| Total | 2,346 (100.0%) | 1,860 (100.0%) |
Earnings by Sex by Educational Attainment in Fairview
Average earnings in Fairview are $92,231 for men and $45,179 for women, a difference of 51.0%. Men with an educational attainment of graduate degree enjoy the highest average annual earnings of $149,844, while those with college or associate's degree education earn the least with $69,669. Women with an educational attainment of graduate degree earn the most with the average annual earnings of $66,000, while those with less than high school education have the smallest earnings of $2,499.
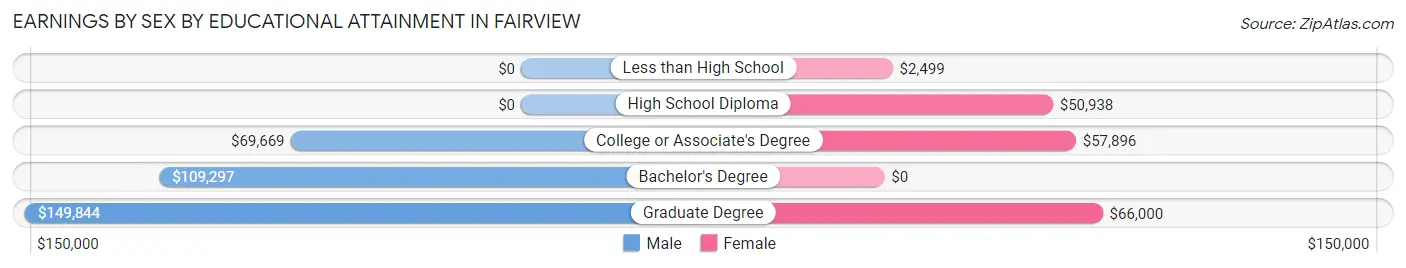
| Educational Attainment | Male Income | Female Income |
| Less than High School | - | - |
| High School Diploma | - | - |
| College or Associate's Degree | $69,669 | $57,896 |
| Bachelor's Degree | $109,297 | $0 |
| Graduate Degree | $149,844 | $66,000 |
| Total | $92,231 | $45,179 |
Family Income in Fairview
Family Income Brackets in Fairview
According to the Fairview family income data, there are 747 families falling into the $200,000+ income range, which is the most common income bracket and makes up 24.5% of all families.
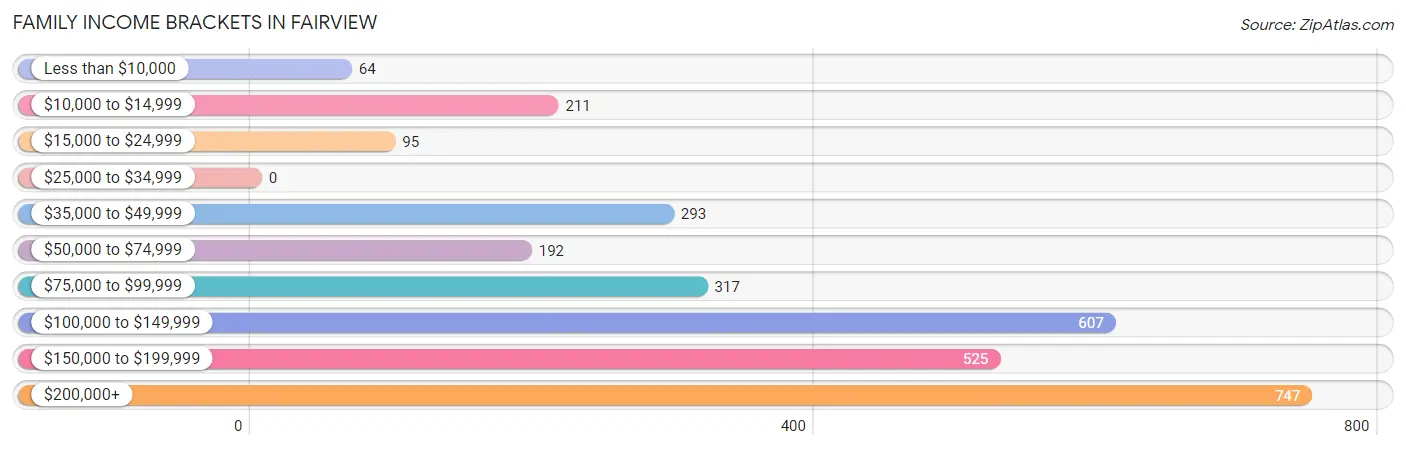
| Income Bracket | # Families | % Families |
| Less than $10,000 | 64 | 2.1% |
| $10,000 to $14,999 | 211 | 6.9% |
| $15,000 to $24,999 | 95 | 3.1% |
| $25,000 to $34,999 | 0 | 0.0% |
| $35,000 to $49,999 | 293 | 9.6% |
| $50,000 to $74,999 | 192 | 6.3% |
| $75,000 to $99,999 | 317 | 10.4% |
| $100,000 to $149,999 | 607 | 19.9% |
| $150,000 to $199,999 | 525 | 17.2% |
| $200,000+ | 747 | 24.5% |
Family Income by Famaliy Size in Fairview
3-person families (432 | 14.2%) account for the highest median family income in Fairview with $163,667 per family, while 2-person families (1,722 | 56.4%) have the highest median income of $58,274 per family member.
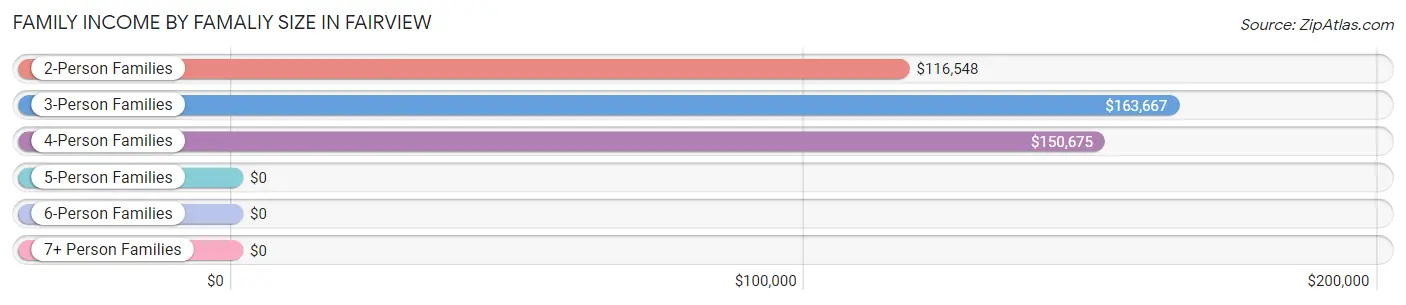
| Income Bracket | # Families | Median Income |
| 2-Person Families | 1,722 (56.4%) | $116,548 |
| 3-Person Families | 432 (14.2%) | $163,667 |
| 4-Person Families | 653 (21.4%) | $150,675 |
| 5-Person Families | 113 (3.7%) | $0 |
| 6-Person Families | 131 (4.3%) | $0 |
| 7+ Person Families | 0 (0.0%) | $0 |
| Total | 3,051 (100.0%) | $131,476 |
Family Income by Number of Earners in Fairview
The median family income in Fairview is $131,476, with families comprising 2 earners (1,154) having the highest median family income of $158,322, while families with no earners (922) have the lowest median family income of $83,000, accounting for 37.8% and 30.2% of families, respectively.
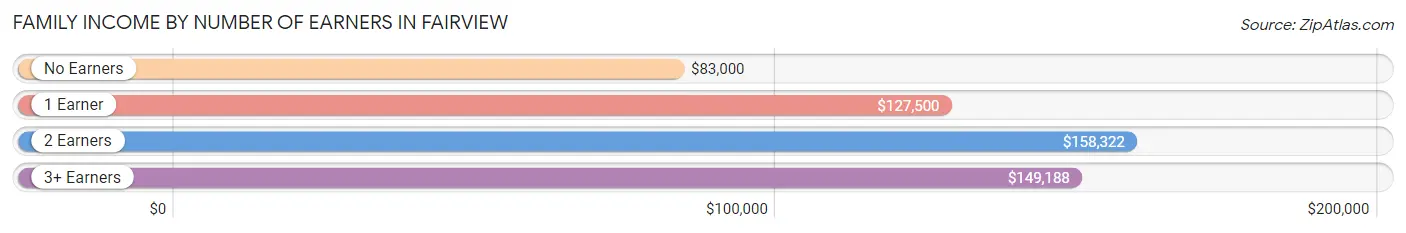
| Number of Earners | # Families | Median Income |
| No Earners | 922 (30.2%) | $83,000 |
| 1 Earner | 904 (29.6%) | $127,500 |
| 2 Earners | 1,154 (37.8%) | $158,322 |
| 3+ Earners | 71 (2.3%) | $149,188 |
| Total | 3,051 (100.0%) | $131,476 |
Household Income in Fairview
Household Income Brackets in Fairview
With 923 households falling in the category, the $200,000+ income range is the most frequent in Fairview, accounting for 21.4% of all households. In contrast, only 116 households (2.7%) fall into the $15,000 to $24,999 income bracket, making it the least populous group.
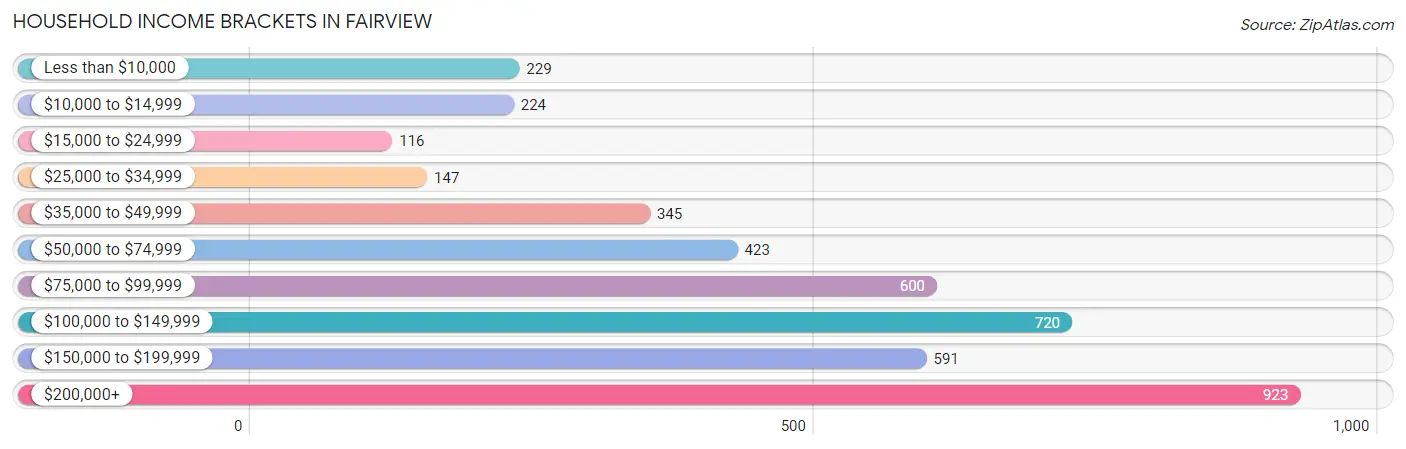
| Income Bracket | # Households | % Households |
| Less than $10,000 | 229 | 5.3% |
| $10,000 to $14,999 | 224 | 5.2% |
| $15,000 to $24,999 | 116 | 2.7% |
| $25,000 to $34,999 | 147 | 3.4% |
| $35,000 to $49,999 | 345 | 8.0% |
| $50,000 to $74,999 | 423 | 9.8% |
| $75,000 to $99,999 | 600 | 13.9% |
| $100,000 to $149,999 | 720 | 16.7% |
| $150,000 to $199,999 | 591 | 13.7% |
| $200,000+ | 923 | 21.4% |
Household Income by Householder Age in Fairview
The median household income in Fairview is $103,219, with the highest median household income of $151,046 found in the 45 to 64 years age bracket for the primary householder. A total of 1,499 households (34.8%) fall into this category.
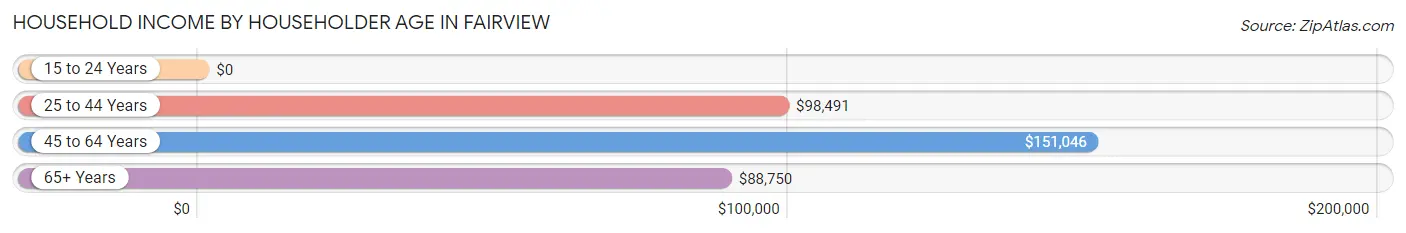
| Income Bracket | # Households | Median Income |
| 15 to 24 Years | 0 (0.0%) | $0 |
| 25 to 44 Years | 938 (21.7%) | $98,491 |
| 45 to 64 Years | 1,499 (34.8%) | $151,046 |
| 65+ Years | 1,876 (43.5%) | $88,750 |
| Total | 4,313 (100.0%) | $103,219 |
Poverty in Fairview
Income Below Poverty by Sex and Age in Fairview
With 11.0% poverty level for males and 17.9% for females among the residents of Fairview, 18 to 24 year old males and 16 and 17 year old females are the most vulnerable to poverty, with 214 males (72.3%) and 187 females (59.7%) in their respective age groups living below the poverty level.
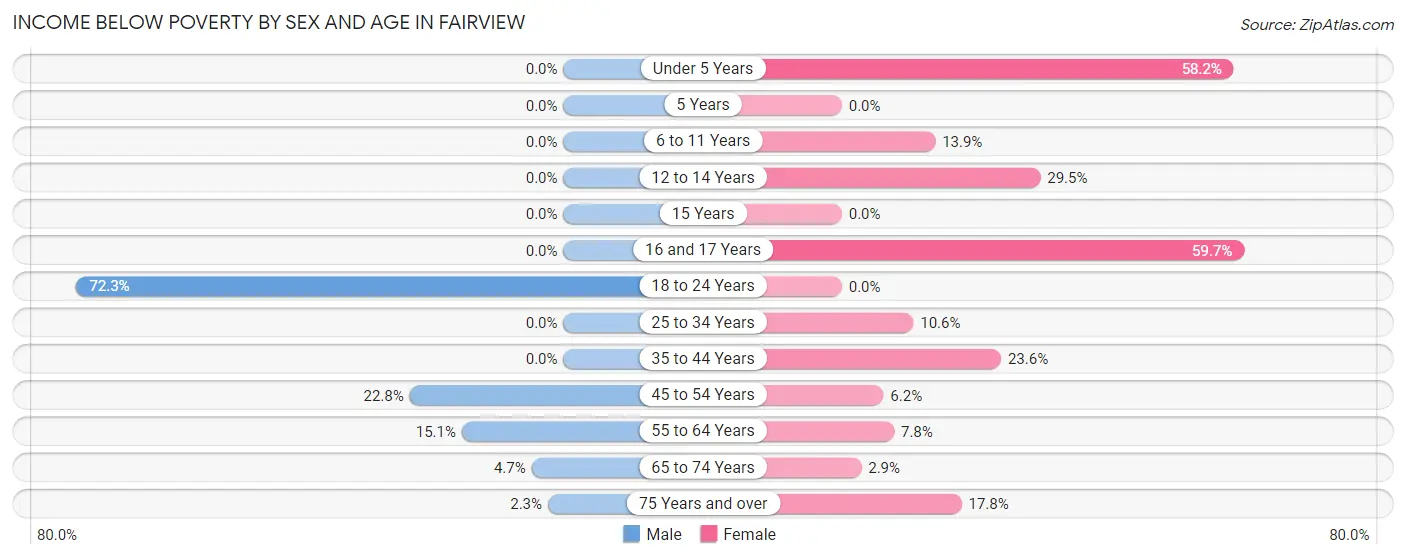
| Age Bracket | Male | Female |
| Under 5 Years | 0 (0.0%) | 238 (58.2%) |
| 5 Years | 0 (0.0%) | 0 (0.0%) |
| 6 to 11 Years | 0 (0.0%) | 33 (13.9%) |
| 12 to 14 Years | 0 (0.0%) | 135 (29.5%) |
| 15 Years | 0 (0.0%) | 0 (0.0%) |
| 16 and 17 Years | 0 (0.0%) | 187 (59.7%) |
| 18 to 24 Years | 214 (72.3%) | 0 (0.0%) |
| 25 to 34 Years | 0 (0.0%) | 50 (10.6%) |
| 35 to 44 Years | 0 (0.0%) | 122 (23.6%) |
| 45 to 54 Years | 119 (22.8%) | 34 (6.2%) |
| 55 to 64 Years | 116 (15.1%) | 64 (7.8%) |
| 65 to 74 Years | 28 (4.7%) | 30 (2.9%) |
| 75 Years and over | 14 (2.3%) | 160 (17.8%) |
| Total | 491 (11.0%) | 1,053 (17.9%) |
Income Above Poverty by Sex and Age in Fairview
According to the poverty statistics in Fairview, males aged under 5 years and females aged 5 years are the age groups that are most secure financially, with 100.0% of males and 100.0% of females in these age groups living above the poverty line.
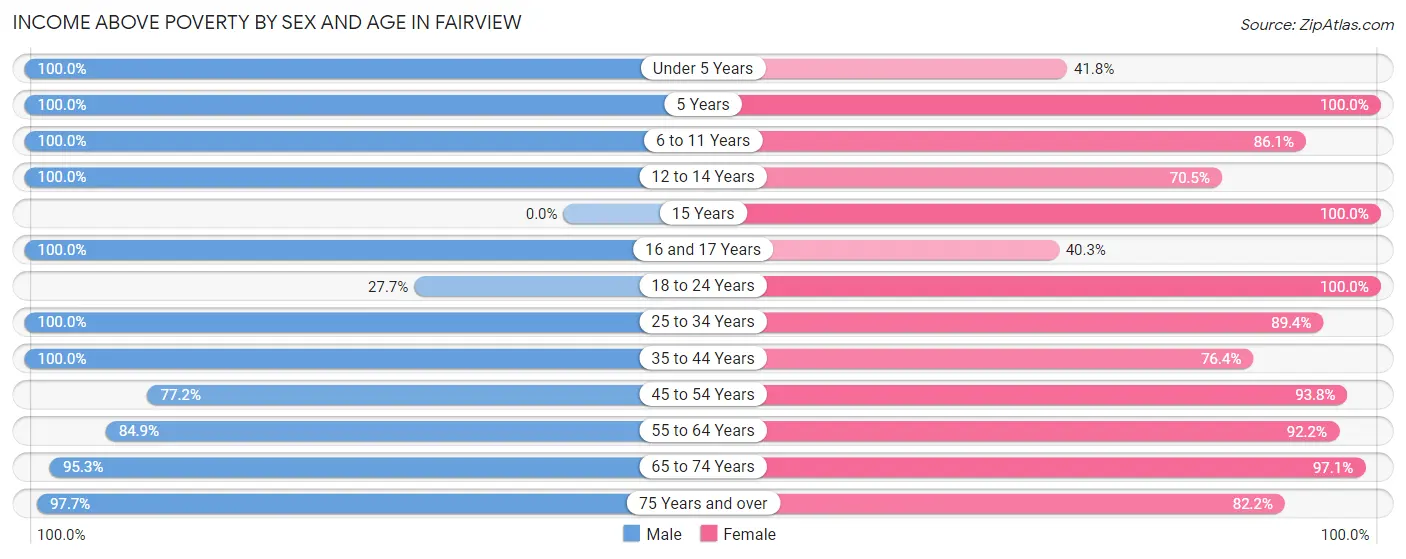
| Age Bracket | Male | Female |
| Under 5 Years | 136 (100.0%) | 171 (41.8%) |
| 5 Years | 22 (100.0%) | 45 (100.0%) |
| 6 to 11 Years | 363 (100.0%) | 205 (86.1%) |
| 12 to 14 Years | 159 (100.0%) | 323 (70.5%) |
| 15 Years | 0 (0.0%) | 56 (100.0%) |
| 16 and 17 Years | 74 (100.0%) | 126 (40.3%) |
| 18 to 24 Years | 82 (27.7%) | 62 (100.0%) |
| 25 to 34 Years | 386 (100.0%) | 421 (89.4%) |
| 35 to 44 Years | 544 (100.0%) | 394 (76.4%) |
| 45 to 54 Years | 402 (77.2%) | 516 (93.8%) |
| 55 to 64 Years | 653 (84.9%) | 761 (92.2%) |
| 65 to 74 Years | 565 (95.3%) | 1,008 (97.1%) |
| 75 Years and over | 596 (97.7%) | 740 (82.2%) |
| Total | 3,982 (89.0%) | 4,828 (82.1%) |
Income Below Poverty Among Married-Couple Families in Fairview
The poverty statistics for married-couple families in Fairview show that 5.8% or 161 of the total 2,764 families live below the poverty line. Families with 3 or 4 children have the highest poverty rate of 53.6%, comprising of 119 families. On the other hand, families with 1 or 2 children have the lowest poverty rate of 0.0%, which includes 0 families.
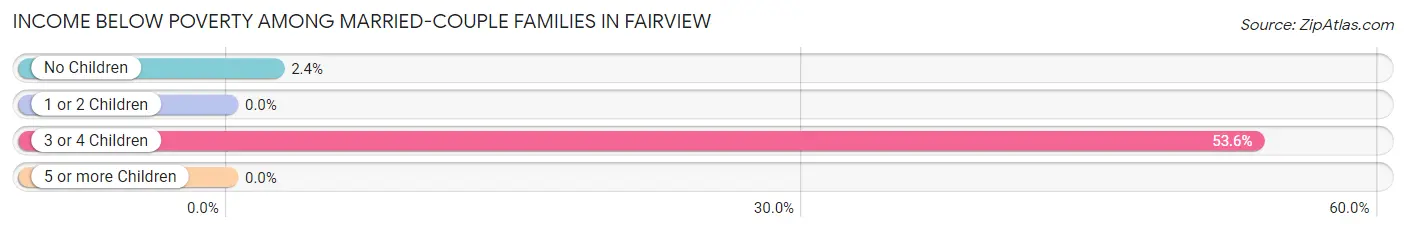
| Children | Above Poverty | Below Poverty |
| No Children | 1,703 (97.6%) | 42 (2.4%) |
| 1 or 2 Children | 797 (100.0%) | 0 (0.0%) |
| 3 or 4 Children | 103 (46.4%) | 119 (53.6%) |
| 5 or more Children | 0 (0.0%) | 0 (0.0%) |
| Total | 2,603 (94.2%) | 161 (5.8%) |
Income Below Poverty Among Single-Parent Households in Fairview
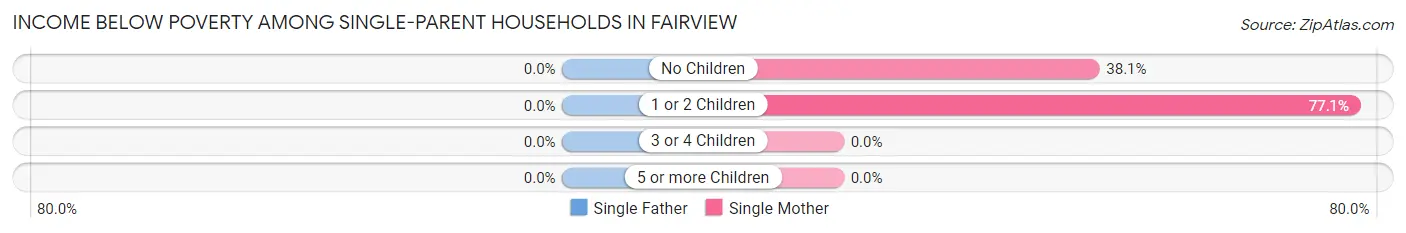
| Children | Single Father | Single Mother |
| No Children | 0 (0.0%) | 64 (38.1%) |
| 1 or 2 Children | 0 (0.0%) | 84 (77.1%) |
| 3 or 4 Children | 0 (0.0%) | 0 (0.0%) |
| 5 or more Children | 0 (0.0%) | 0 (0.0%) |
| Total | 0 (0.0%) | 148 (53.4%) |
Income Below Poverty Among Married-Couple vs Single-Parent Households in Fairview
The poverty data for Fairview shows that 161 of the married-couple family households (5.8%) and 148 of the single-parent households (51.6%) are living below the poverty level. Within the married-couple family households, those with 3 or 4 children have the highest poverty rate, with 119 households (53.6%) falling below the poverty line. Among the single-parent households, those with 1 or 2 children have the highest poverty rate, with 84 household (77.1%) living below poverty.
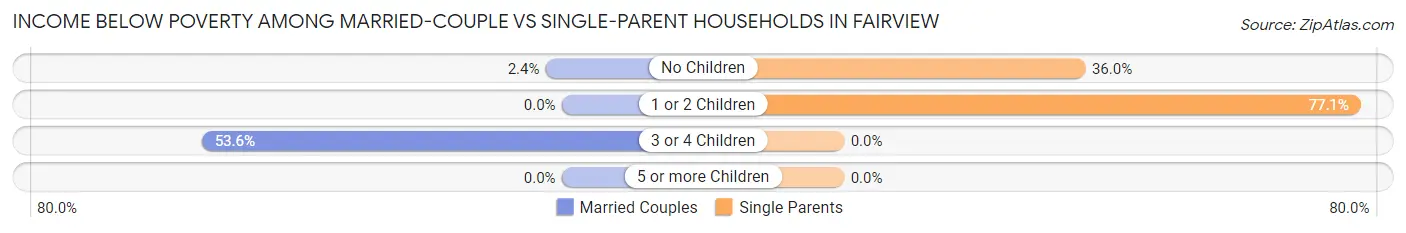
| Children | Married-Couple Families | Single-Parent Households |
| No Children | 42 (2.4%) | 64 (36.0%) |
| 1 or 2 Children | 0 (0.0%) | 84 (77.1%) |
| 3 or 4 Children | 119 (53.6%) | 0 (0.0%) |
| 5 or more Children | 0 (0.0%) | 0 (0.0%) |
| Total | 161 (5.8%) | 148 (51.6%) |
Race in Fairview
The most populous races in Fairview are White / Caucasian (7,985 | 77.1%), Black / African American (1,120 | 10.8%), and Hispanic or Latino (824 | 8.0%).
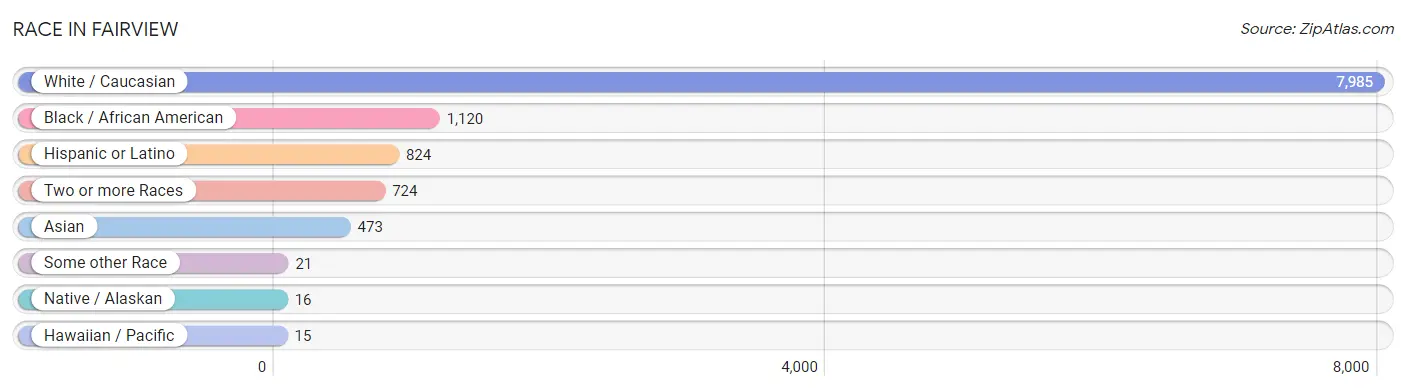
| Race | # Population | % Population |
| Asian | 473 | 4.6% |
| Black / African American | 1,120 | 10.8% |
| Hawaiian / Pacific | 15 | 0.1% |
| Hispanic or Latino | 824 | 8.0% |
| Native / Alaskan | 16 | 0.2% |
| White / Caucasian | 7,985 | 77.1% |
| Two or more Races | 724 | 7.0% |
| Some other Race | 21 | 0.2% |
| Total | 10,354 | 100.0% |
Ancestry in Fairview
The most populous ancestries reported in Fairview are Irish (1,568 | 15.1%), English (1,537 | 14.8%), American (1,450 | 14.0%), German (1,086 | 10.5%), and Mexican (479 | 4.6%), together accounting for 59.1% of all Fairview residents.
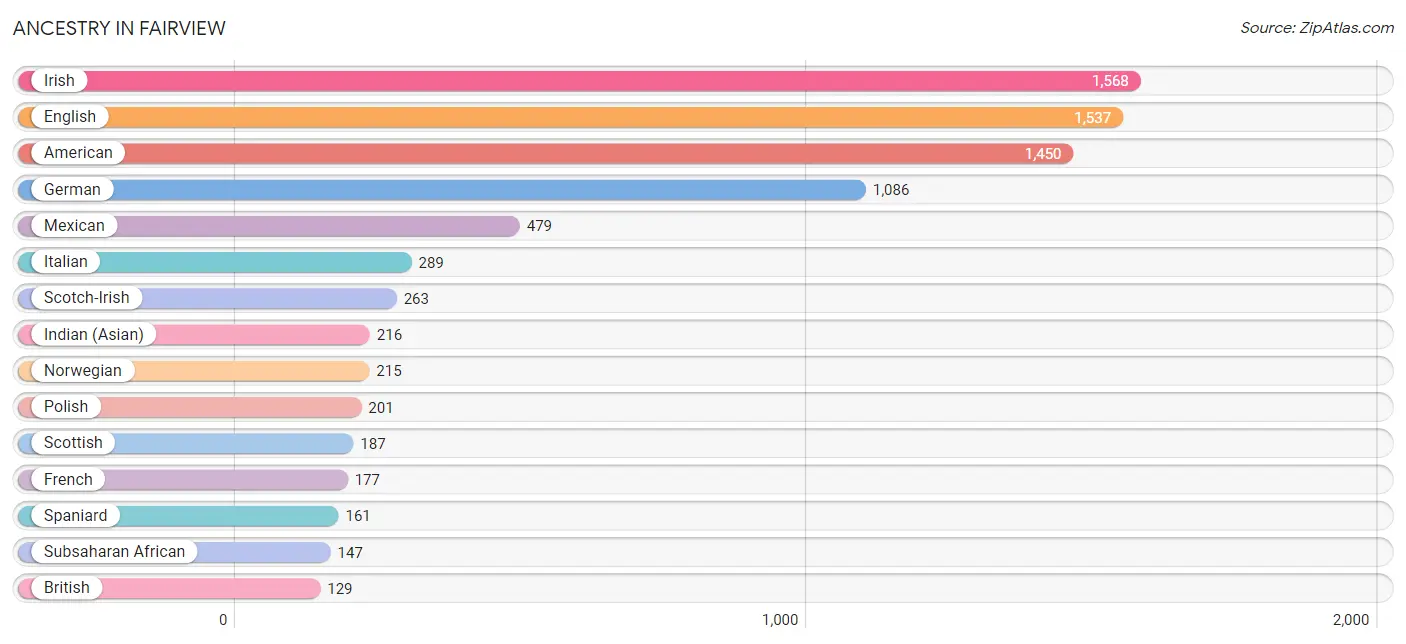
| Ancestry | # Population | % Population |
| American | 1,450 | 14.0% |
| Arab | 33 | 0.3% |
| Belizean | 37 | 0.4% |
| Bhutanese | 88 | 0.9% |
| British | 129 | 1.3% |
| Burmese | 19 | 0.2% |
| Canadian | 123 | 1.2% |
| Central American | 50 | 0.5% |
| Cherokee | 13 | 0.1% |
| Colombian | 16 | 0.2% |
| Croatian | 13 | 0.1% |
| Czech | 52 | 0.5% |
| Danish | 44 | 0.4% |
| Dutch | 75 | 0.7% |
| English | 1,537 | 14.8% |
| European | 95 | 0.9% |
| Finnish | 72 | 0.7% |
| French | 177 | 1.7% |
| French Canadian | 11 | 0.1% |
| German | 1,086 | 10.5% |
| Guamanian / Chamorro | 27 | 0.3% |
| Guatemalan | 50 | 0.5% |
| Hungarian | 11 | 0.1% |
| Indian (Asian) | 216 | 2.1% |
| Irish | 1,568 | 15.1% |
| Italian | 289 | 2.8% |
| Korean | 82 | 0.8% |
| Latvian | 8 | 0.1% |
| Lithuanian | 8 | 0.1% |
| Macedonian | 27 | 0.3% |
| Mexican | 479 | 4.6% |
| Mexican American Indian | 41 | 0.4% |
| Native Hawaiian | 15 | 0.1% |
| Nigerian | 35 | 0.3% |
| Northern European | 28 | 0.3% |
| Norwegian | 215 | 2.1% |
| Pakistani | 83 | 0.8% |
| Polish | 201 | 1.9% |
| Puerto Rican | 33 | 0.3% |
| Scandinavian | 38 | 0.4% |
| Scotch-Irish | 263 | 2.5% |
| Scottish | 187 | 1.8% |
| Slovak | 25 | 0.2% |
| South American | 101 | 1.0% |
| Spaniard | 161 | 1.5% |
| Sri Lankan | 59 | 0.6% |
| Subsaharan African | 147 | 1.4% |
| Swedish | 89 | 0.9% |
| Thai | 89 | 0.9% |
| Venezuelan | 85 | 0.8% |
| Welsh | 81 | 0.8% | View All 51 Rows |
Immigrants in Fairview
The most numerous immigrant groups reported in Fairview came from Asia (419 | 4.1%), Central America (331 | 3.2%), Latin America (331 | 3.2%), Mexico (278 | 2.7%), and Eastern Asia (238 | 2.3%), together accounting for 15.4% of all Fairview residents.
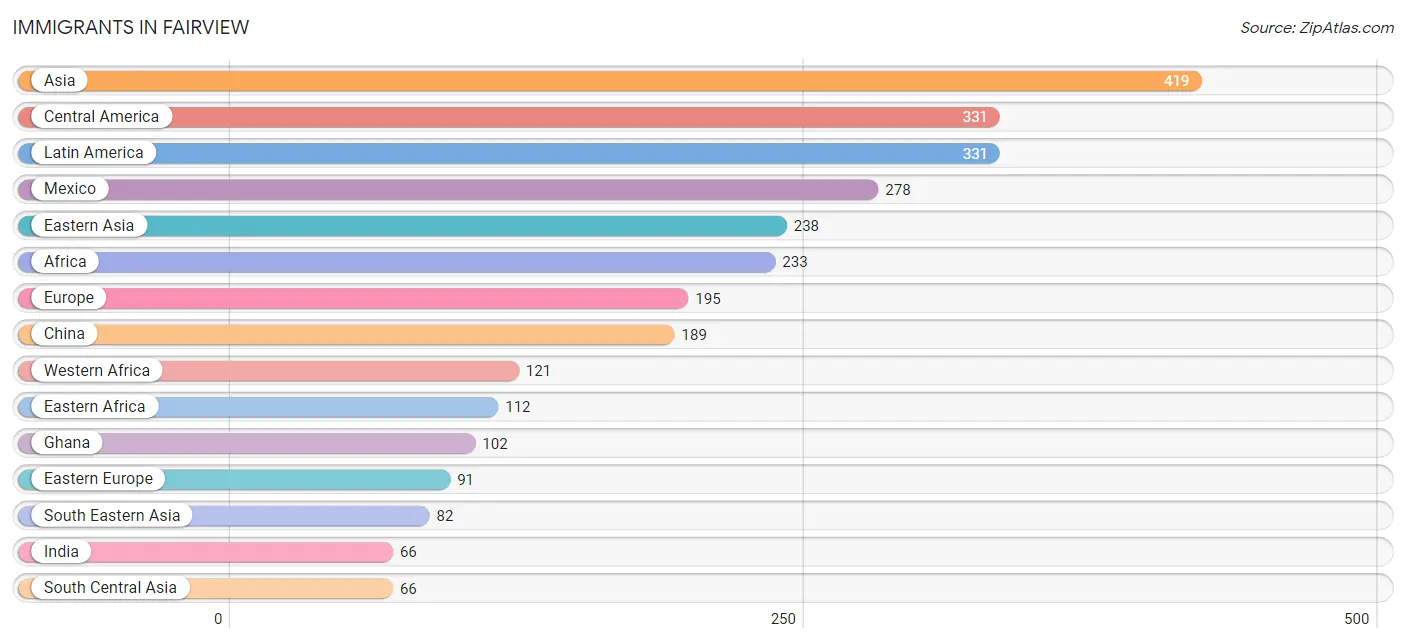
| Immigration Origin | # Population | % Population |
| Africa | 233 | 2.2% |
| Asia | 419 | 4.1% |
| Belize | 37 | 0.4% |
| Canada | 36 | 0.4% |
| Central America | 331 | 3.2% |
| China | 189 | 1.8% |
| Eastern Africa | 112 | 1.1% |
| Eastern Asia | 238 | 2.3% |
| Eastern Europe | 91 | 0.9% |
| El Salvador | 16 | 0.2% |
| England | 19 | 0.2% |
| Europe | 195 | 1.9% |
| Ghana | 102 | 1.0% |
| India | 66 | 0.6% |
| Japan | 30 | 0.3% |
| Korea | 19 | 0.2% |
| Latin America | 331 | 3.2% |
| Mexico | 278 | 2.7% |
| Nigeria | 19 | 0.2% |
| North Macedonia | 27 | 0.3% |
| Northern Europe | 40 | 0.4% |
| Poland | 64 | 0.6% |
| Saudi Arabia | 33 | 0.3% |
| South Central Asia | 66 | 0.6% |
| South Eastern Asia | 82 | 0.8% |
| Southern Europe | 64 | 0.6% |
| Spain | 64 | 0.6% |
| Sweden | 9 | 0.1% |
| Taiwan | 40 | 0.4% |
| Thailand | 23 | 0.2% |
| Vietnam | 59 | 0.6% |
| Western Africa | 121 | 1.2% |
| Western Asia | 33 | 0.3% | View All 33 Rows |
Sex and Age in Fairview
Sex and Age in Fairview
The most populous age groups in Fairview are 40 to 44 Years (471 | 10.5%) for men and 70 to 74 Years (730 | 12.4%) for women.
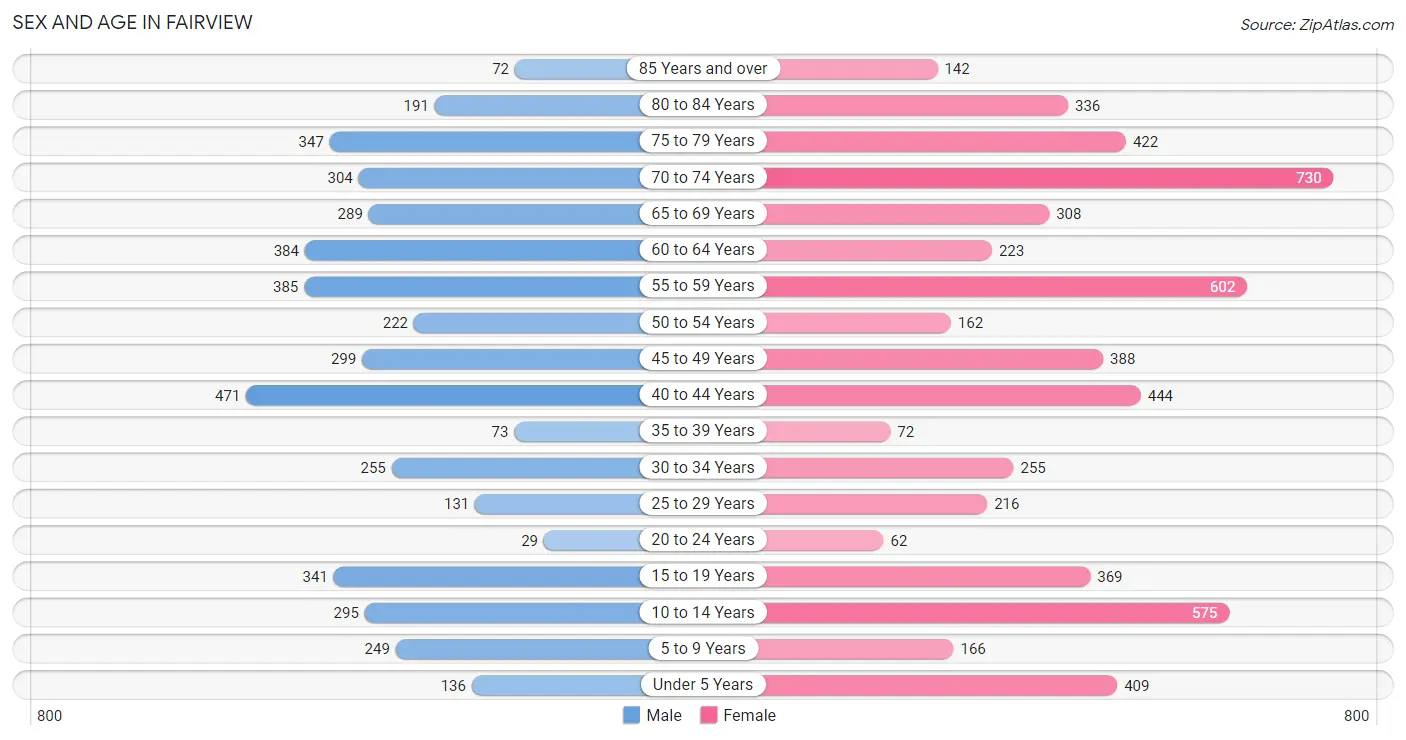
| Age Bracket | Male | Female |
| Under 5 Years | 136 (3.0%) | 409 (7.0%) |
| 5 to 9 Years | 249 (5.6%) | 166 (2.8%) |
| 10 to 14 Years | 295 (6.6%) | 575 (9.8%) |
| 15 to 19 Years | 341 (7.6%) | 369 (6.3%) |
| 20 to 24 Years | 29 (0.6%) | 62 (1.1%) |
| 25 to 29 Years | 131 (2.9%) | 216 (3.7%) |
| 30 to 34 Years | 255 (5.7%) | 255 (4.3%) |
| 35 to 39 Years | 73 (1.6%) | 72 (1.2%) |
| 40 to 44 Years | 471 (10.5%) | 444 (7.5%) |
| 45 to 49 Years | 299 (6.7%) | 388 (6.6%) |
| 50 to 54 Years | 222 (5.0%) | 162 (2.8%) |
| 55 to 59 Years | 385 (8.6%) | 602 (10.2%) |
| 60 to 64 Years | 384 (8.6%) | 223 (3.8%) |
| 65 to 69 Years | 289 (6.5%) | 308 (5.2%) |
| 70 to 74 Years | 304 (6.8%) | 730 (12.4%) |
| 75 to 79 Years | 347 (7.8%) | 422 (7.2%) |
| 80 to 84 Years | 191 (4.3%) | 336 (5.7%) |
| 85 Years and over | 72 (1.6%) | 142 (2.4%) |
| Total | 4,473 (100.0%) | 5,881 (100.0%) |
Families and Households in Fairview
Median Family Size in Fairview
The median family size in Fairview is 2.96 persons per family, with single male/father families (10 | 0.3%) accounting for the largest median family size of 3.6 persons per family. On the other hand, single female/mother families (277 | 9.1%) represent the smallest median family size with 2.40 persons per family.
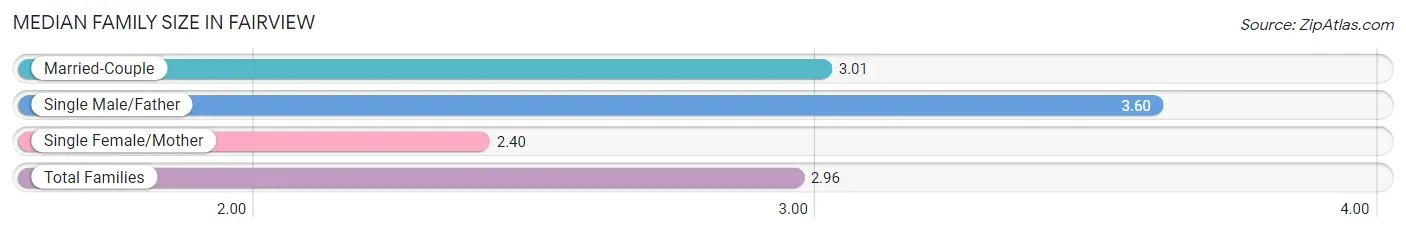
| Family Type | # Families | Family Size |
| Married-Couple | 2,764 (90.6%) | 3.01 |
| Single Male/Father | 10 (0.3%) | 3.60 |
| Single Female/Mother | 277 (9.1%) | 2.40 |
| Total Families | 3,051 (100.0%) | 2.96 |
Median Household Size in Fairview
The median household size in Fairview is 2.40 persons per household, with single male/father households (10 | 0.2%) accounting for the largest median household size of 3.6 persons per household. non-family households (1,262 | 29.3%) represent the smallest median household size with 1.03 persons per household.
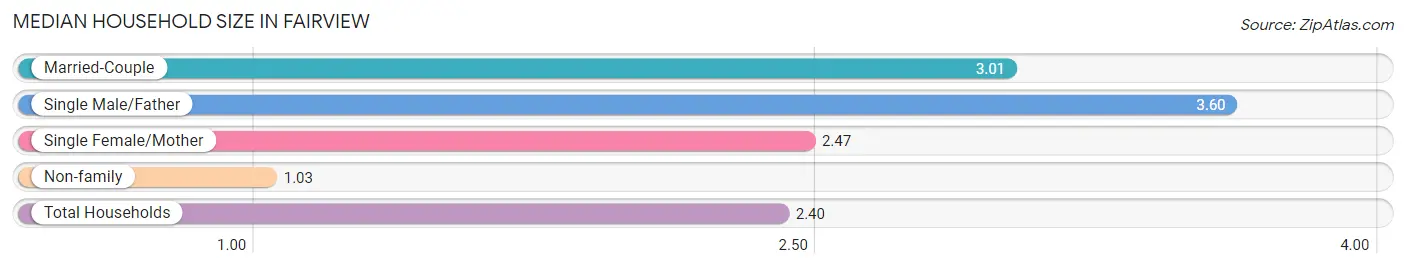
| Household Type | # Households | Household Size |
| Married-Couple | 2,764 (64.1%) | 3.01 |
| Single Male/Father | 10 (0.2%) | 3.60 |
| Single Female/Mother | 277 (6.4%) | 2.47 |
| Non-family | 1,262 (29.3%) | 1.03 |
| Total Households | 4,313 (100.0%) | 2.40 |
Household Size by Marriage Status in Fairview
Out of a total of 4,313 households in Fairview, 3,051 (70.7%) are family households, while 1,262 (29.3%) are nonfamily households. The most numerous type of family households are 2-person households, comprising 1,704, and the most common type of nonfamily households are 1-person households, comprising 1,218.
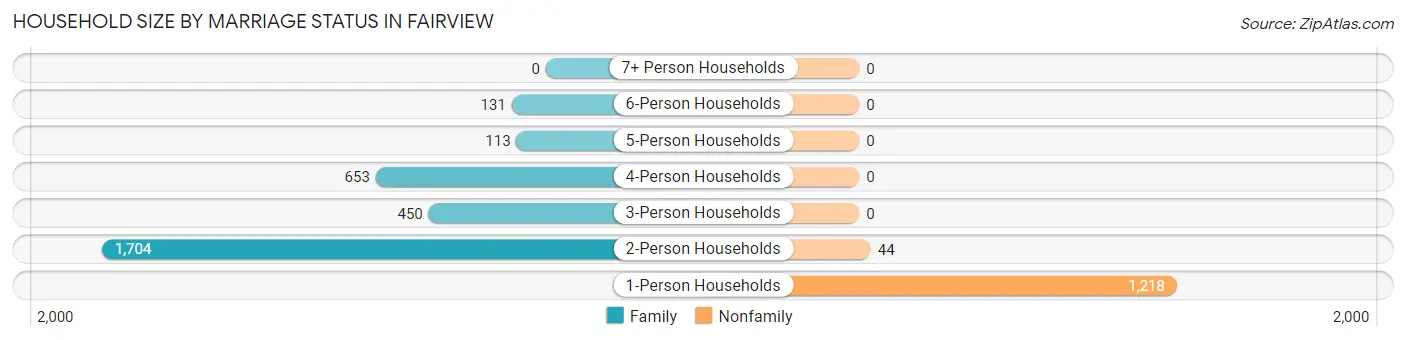
| Household Size | Family Households | Nonfamily Households |
| 1-Person Households | - | 1,218 (28.2%) |
| 2-Person Households | 1,704 (39.5%) | 44 (1.0%) |
| 3-Person Households | 450 (10.4%) | 0 (0.0%) |
| 4-Person Households | 653 (15.1%) | 0 (0.0%) |
| 5-Person Households | 113 (2.6%) | 0 (0.0%) |
| 6-Person Households | 131 (3.0%) | 0 (0.0%) |
| 7+ Person Households | 0 (0.0%) | 0 (0.0%) |
| Total | 3,051 (70.7%) | 1,262 (29.3%) |
Female Fertility in Fairview
Fertility by Age in Fairview
Average fertility rate in Fairview is 8.0 births per 1,000 women. Women in the age bracket of 35 to 50 years have the highest fertility rate with 16.0 births per 1,000 women. Women in the age bracket of 35 to 50 years acount for 100.0% of all women with births.
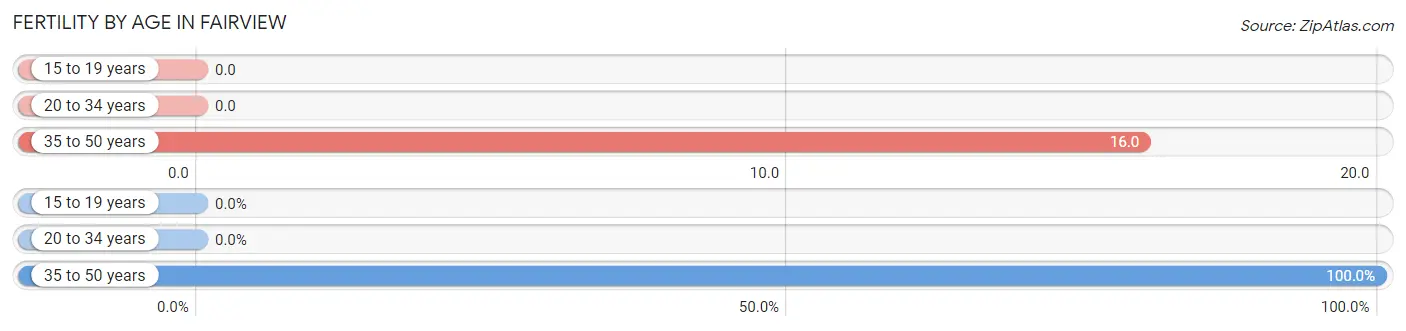
| Age Bracket | Women with Births | Births / 1,000 Women |
| 15 to 19 years | 0 (0.0%) | 0.0 |
| 20 to 34 years | 0 (0.0%) | 0.0 |
| 35 to 50 years | 15 (100.0%) | 16.0 |
| Total | 15 (100.0%) | 8.0 |
Fertility by Age by Marriage Status in Fairview
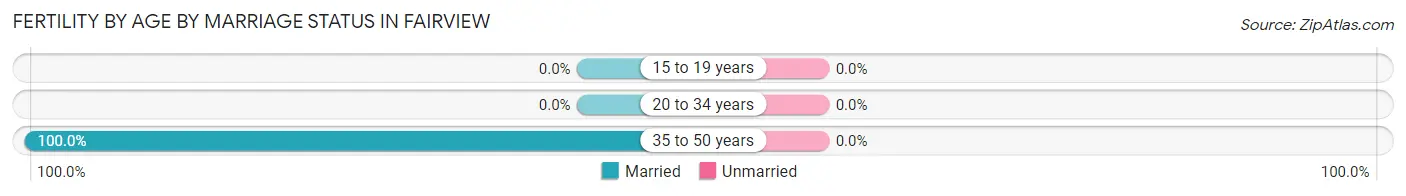
| Age Bracket | Married | Unmarried |
| 15 to 19 years | 0 (0.0%) | 0 (0.0%) |
| 20 to 34 years | 0 (0.0%) | 0 (0.0%) |
| 35 to 50 years | 15 (100.0%) | 0 (0.0%) |
| Total | 15 (100.0%) | 0 (0.0%) |
Fertility by Education in Fairview
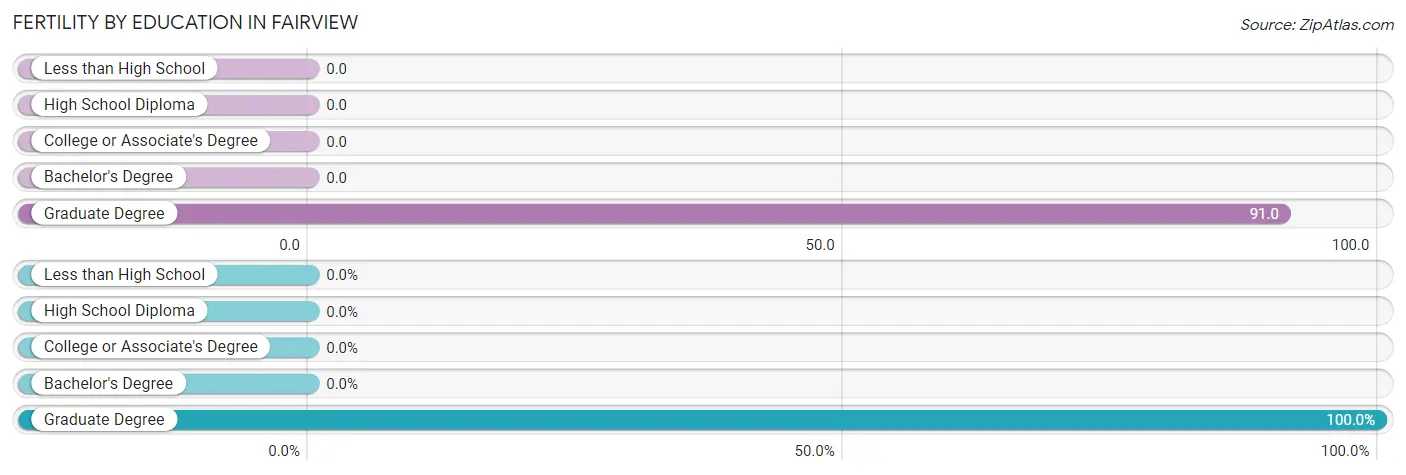
| Educational Attainment | Women with Births | Births / 1,000 Women |
| Less than High School | 0 (0.0%) | 0.0 |
| High School Diploma | 0 (0.0%) | 0.0 |
| College or Associate's Degree | 0 (0.0%) | 0.0 |
| Bachelor's Degree | 0 (0.0%) | 0.0 |
| Graduate Degree | 15 (100.0%) | 91.0 |
| Total | 15 (100.0%) | 8.0 |
Fertility by Education by Marriage Status in Fairview
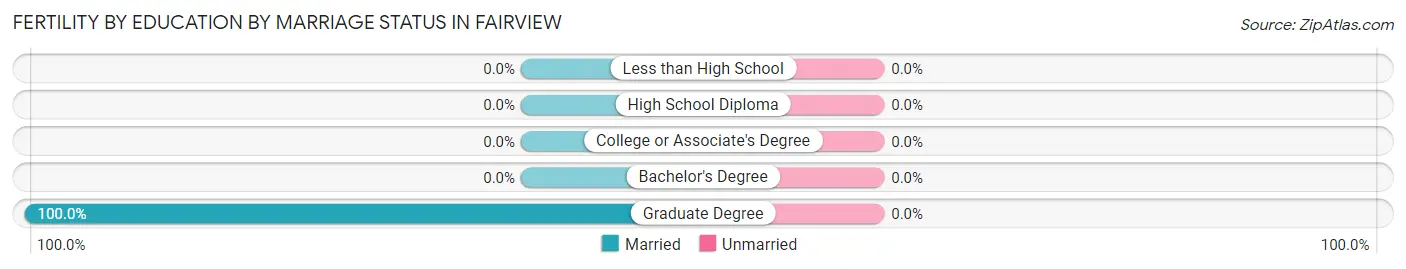
| Educational Attainment | Married | Unmarried |
| Less than High School | 0 (0.0%) | 0 (0.0%) |
| High School Diploma | 0 (0.0%) | 0 (0.0%) |
| College or Associate's Degree | 0 (0.0%) | 0 (0.0%) |
| Bachelor's Degree | 0 (0.0%) | 0 (0.0%) |
| Graduate Degree | 15 (100.0%) | 0 (0.0%) |
| Total | 15 (100.0%) | 0 (0.0%) |
Employment Characteristics in Fairview
Employment by Class of Employer in Fairview
Among the 3,964 employed individuals in Fairview, private company employees (2,899 | 73.1%), self-employed (incorporated) (315 | 8.0%), and not-for-profit organizations (239 | 6.0%) make up the most common classes of employment.
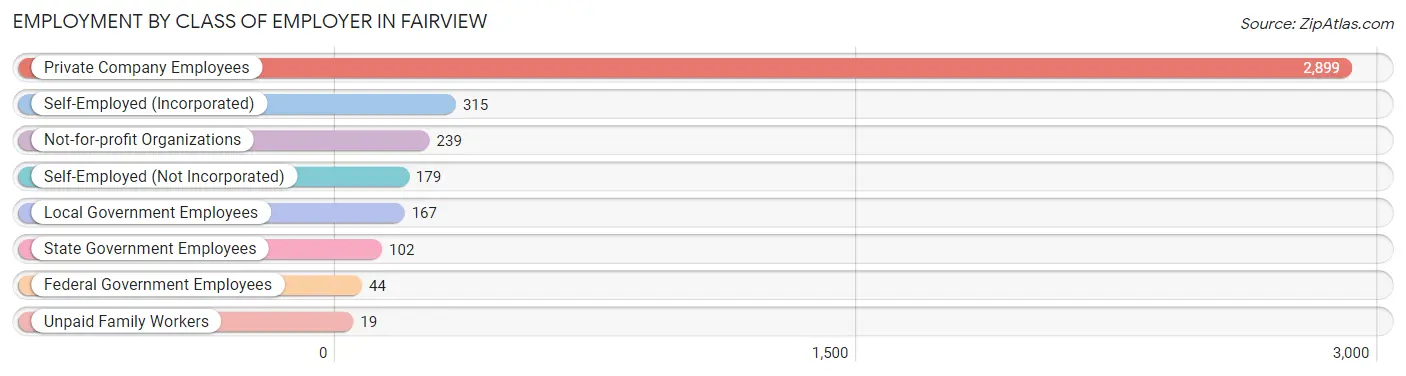
| Employer Class | # Employees | % Employees |
| Private Company Employees | 2,899 | 73.1% |
| Self-Employed (Incorporated) | 315 | 8.0% |
| Self-Employed (Not Incorporated) | 179 | 4.5% |
| Not-for-profit Organizations | 239 | 6.0% |
| Local Government Employees | 167 | 4.2% |
| State Government Employees | 102 | 2.6% |
| Federal Government Employees | 44 | 1.1% |
| Unpaid Family Workers | 19 | 0.5% |
| Total | 3,964 | 100.0% |
Employment Status by Age in Fairview
According to the labor force statistics for Fairview, out of the total population over 16 years of age (8,468), 47.8% or 4,048 individuals are in the labor force, with 2.0% or 81 of them unemployed. The age group with the highest labor force participation rate is 30 to 34 years, with 96.9% or 494 individuals in the labor force. Within the labor force, the 25 to 29 years age range has the highest percentage of unemployed individuals, with 20.3% or 50 of them being unemployed.
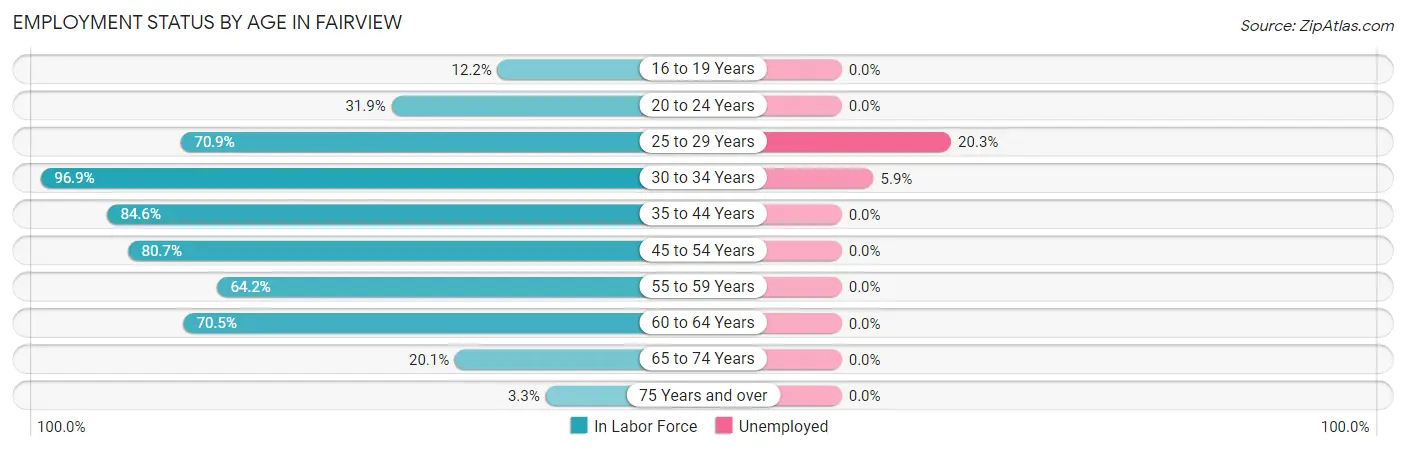
| Age Bracket | In Labor Force | Unemployed |
| 16 to 19 Years | 80 (12.2%) | 0 (0.0%) |
| 20 to 24 Years | 29 (31.9%) | 0 (0.0%) |
| 25 to 29 Years | 246 (70.9%) | 50 (20.3%) |
| 30 to 34 Years | 494 (96.9%) | 29 (5.9%) |
| 35 to 44 Years | 897 (84.6%) | 0 (0.0%) |
| 45 to 54 Years | 864 (80.7%) | 0 (0.0%) |
| 55 to 59 Years | 634 (64.2%) | 0 (0.0%) |
| 60 to 64 Years | 428 (70.5%) | 0 (0.0%) |
| 65 to 74 Years | 328 (20.1%) | 0 (0.0%) |
| 75 Years and over | 50 (3.3%) | 0 (0.0%) |
| Total | 4,048 (47.8%) | 81 (2.0%) |
Employment Status by Educational Attainment in Fairview
According to labor force statistics for Fairview, 77.8% of individuals (3,565) out of the total population between 25 and 64 years of age (4,582) are in the labor force, with 2.2% or 78 of them being unemployed. The group with the highest labor force participation rate are those with the educational attainment of college / associate degree, with 83.6% or 773 individuals in the labor force. Within the labor force, individuals with high school diploma education have the highest percentage of unemployment, with 10.1% or 50 of them being unemployed.
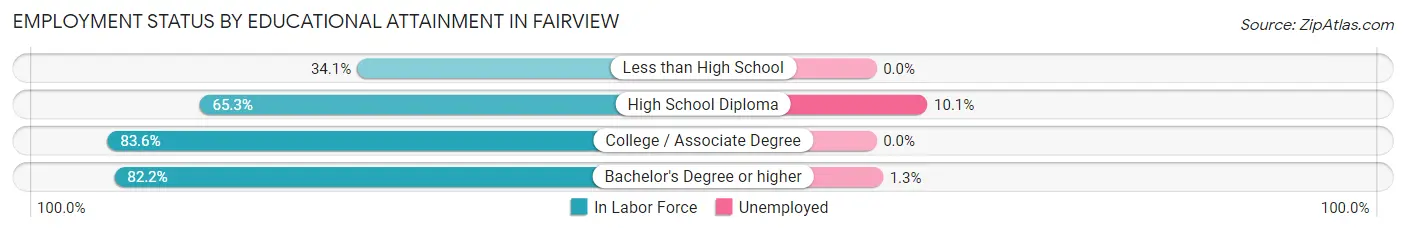
| Educational Attainment | In Labor Force | Unemployed |
| Less than High School | 62 (34.1%) | 0 (0.0%) |
| High School Diploma | 496 (65.3%) | 77 (10.1%) |
| College / Associate Degree | 773 (83.6%) | 0 (0.0%) |
| Bachelor's Degree or higher | 2,233 (82.2%) | 35 (1.3%) |
| Total | 3,565 (77.8%) | 101 (2.2%) |
Employment Occupations by Sex in Fairview
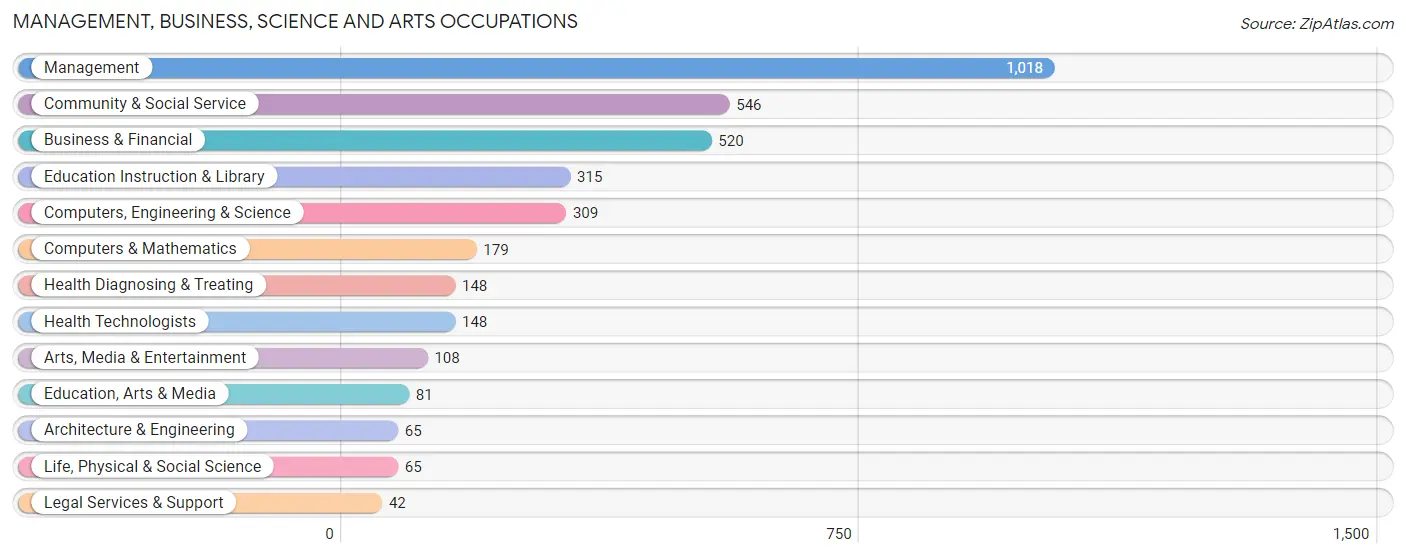
Management, Business, Science and Arts Occupations
The most common Management, Business, Science and Arts occupations in Fairview are Management (1,018 | 25.6%), Community & Social Service (546 | 13.8%), Business & Financial (520 | 13.1%), Education Instruction & Library (315 | 7.9%), and Computers, Engineering & Science (309 | 7.8%).
Management, Business, Science and Arts Occupations by Sex
Within the Management, Business, Science and Arts occupations in Fairview, the most male-oriented occupations are Architecture & Engineering (100.0%), Legal Services & Support (100.0%), and Computers & Mathematics (87.7%), while the most female-oriented occupations are Education, Arts & Media (100.0%), Health Diagnosing & Treating (89.9%), and Health Technologists (89.9%).
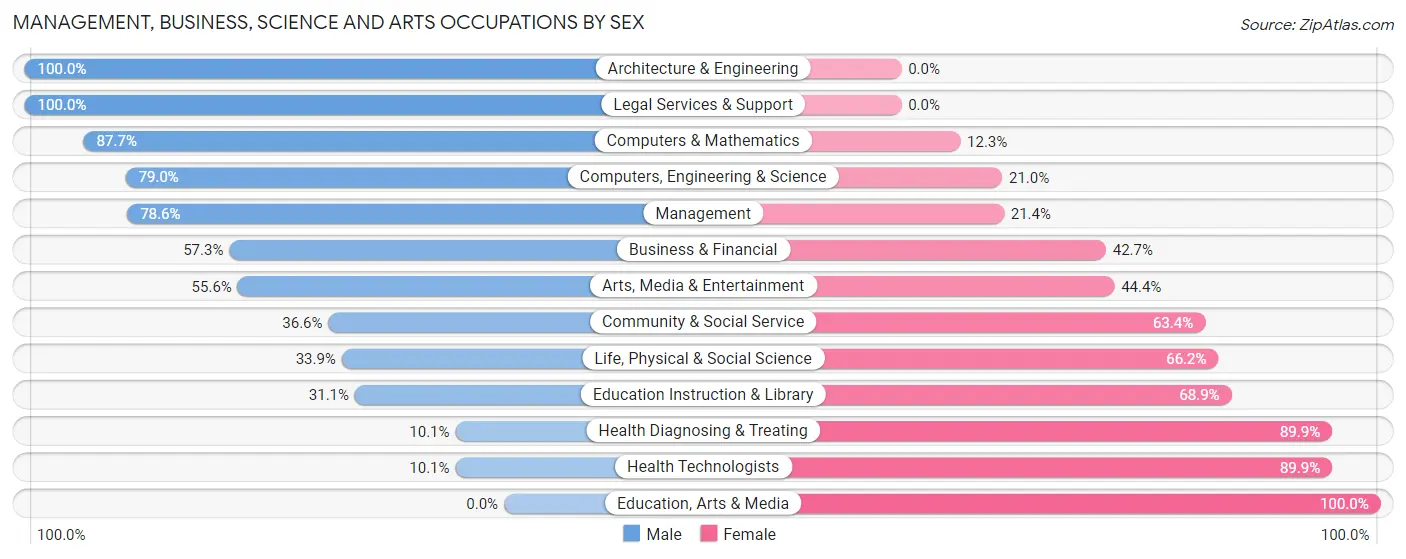
| Occupation | Male | Female |
| Management | 800 (78.6%) | 218 (21.4%) |
| Business & Financial | 298 (57.3%) | 222 (42.7%) |
| Computers, Engineering & Science | 244 (79.0%) | 65 (21.0%) |
| Computers & Mathematics | 157 (87.7%) | 22 (12.3%) |
| Architecture & Engineering | 65 (100.0%) | 0 (0.0%) |
| Life, Physical & Social Science | 22 (33.9%) | 43 (66.1%) |
| Community & Social Service | 200 (36.6%) | 346 (63.4%) |
| Education, Arts & Media | 0 (0.0%) | 81 (100.0%) |
| Legal Services & Support | 42 (100.0%) | 0 (0.0%) |
| Education Instruction & Library | 98 (31.1%) | 217 (68.9%) |
| Arts, Media & Entertainment | 60 (55.6%) | 48 (44.4%) |
| Health Diagnosing & Treating | 15 (10.1%) | 133 (89.9%) |
| Health Technologists | 15 (10.1%) | 133 (89.9%) |
| Total (Category) | 1,557 (61.3%) | 984 (38.7%) |
| Total (Overall) | 2,257 (56.8%) | 1,714 (43.2%) |
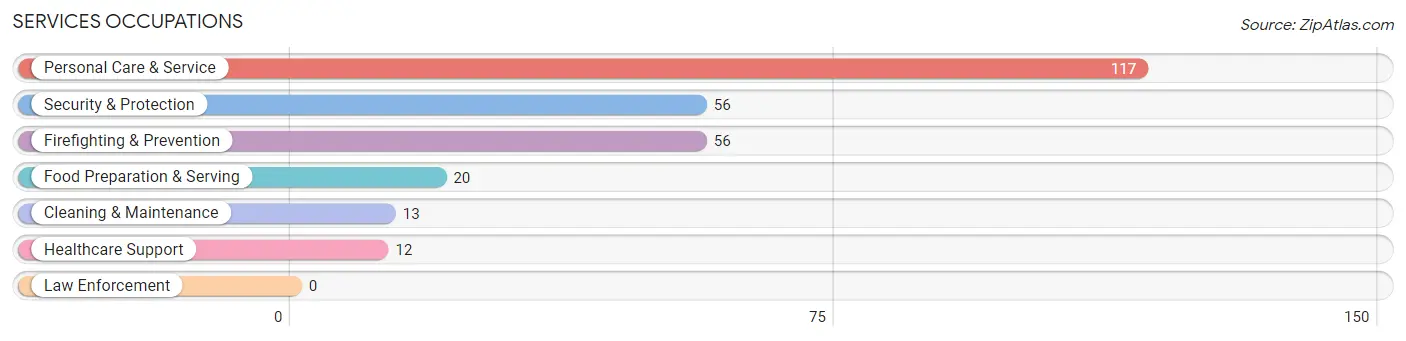
Services Occupations
The most common Services occupations in Fairview are Personal Care & Service (117 | 2.9%), Security & Protection (56 | 1.4%), Firefighting & Prevention (56 | 1.4%), Food Preparation & Serving (20 | 0.5%), and Cleaning & Maintenance (13 | 0.3%).
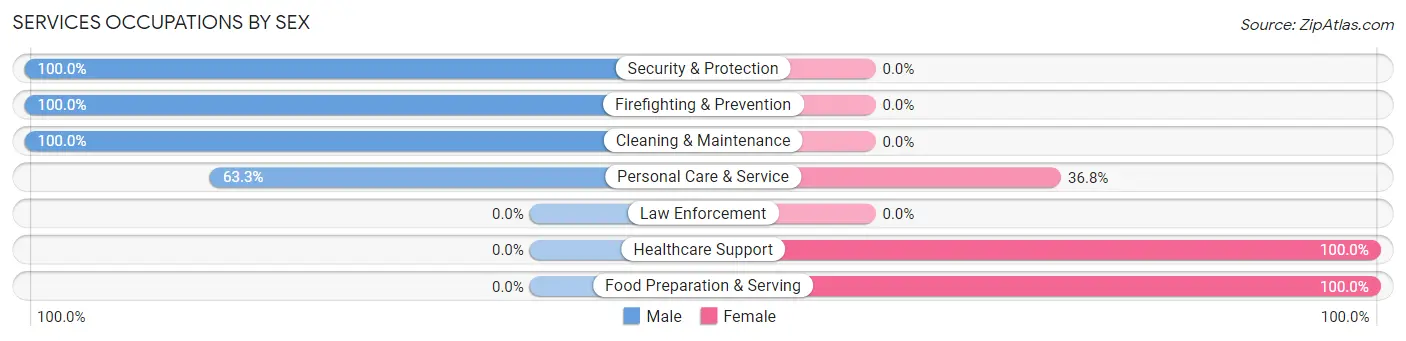
Services Occupations by Sex
Within the Services occupations in Fairview, the most male-oriented occupations are Security & Protection (100.0%), Firefighting & Prevention (100.0%), and Cleaning & Maintenance (100.0%), while the most female-oriented occupations are Healthcare Support (100.0%), Food Preparation & Serving (100.0%), and Personal Care & Service (36.7%).
| Occupation | Male | Female |
| Healthcare Support | 0 (0.0%) | 12 (100.0%) |
| Security & Protection | 56 (100.0%) | 0 (0.0%) |
| Firefighting & Prevention | 56 (100.0%) | 0 (0.0%) |
| Law Enforcement | 0 (0.0%) | 0 (0.0%) |
| Food Preparation & Serving | 0 (0.0%) | 20 (100.0%) |
| Cleaning & Maintenance | 13 (100.0%) | 0 (0.0%) |
| Personal Care & Service | 74 (63.2%) | 43 (36.7%) |
| Total (Category) | 143 (65.6%) | 75 (34.4%) |
| Total (Overall) | 2,257 (56.8%) | 1,714 (43.2%) |
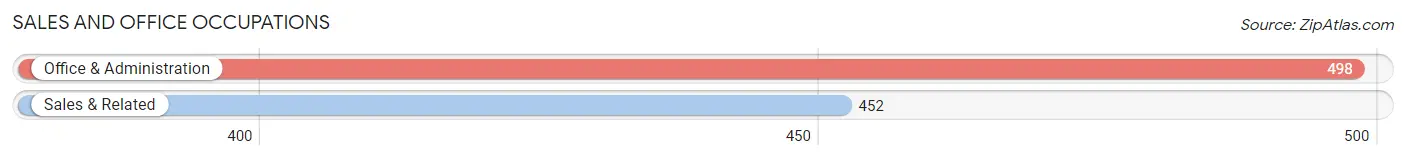
Sales and Office Occupations
The most common Sales and Office occupations in Fairview are Office & Administration (498 | 12.5%), and Sales & Related (452 | 11.4%).
Sales and Office Occupations by Sex
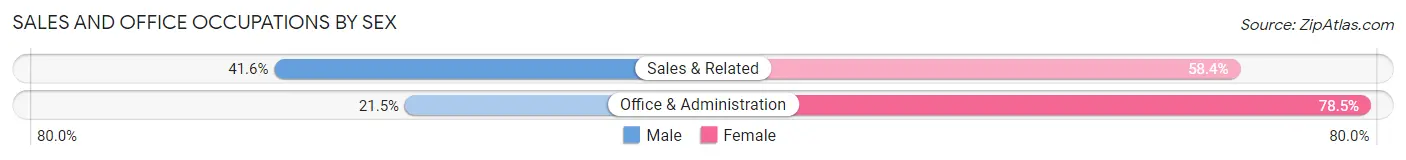
| Occupation | Male | Female |
| Sales & Related | 188 (41.6%) | 264 (58.4%) |
| Office & Administration | 107 (21.5%) | 391 (78.5%) |
| Total (Category) | 295 (31.0%) | 655 (69.0%) |
| Total (Overall) | 2,257 (56.8%) | 1,714 (43.2%) |
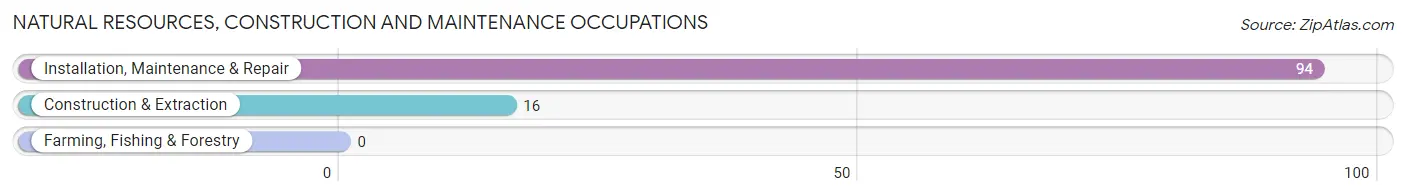
Natural Resources, Construction and Maintenance Occupations
The most common Natural Resources, Construction and Maintenance occupations in Fairview are Installation, Maintenance & Repair (94 | 2.4%), and Construction & Extraction (16 | 0.4%).
Natural Resources, Construction and Maintenance Occupations by Sex
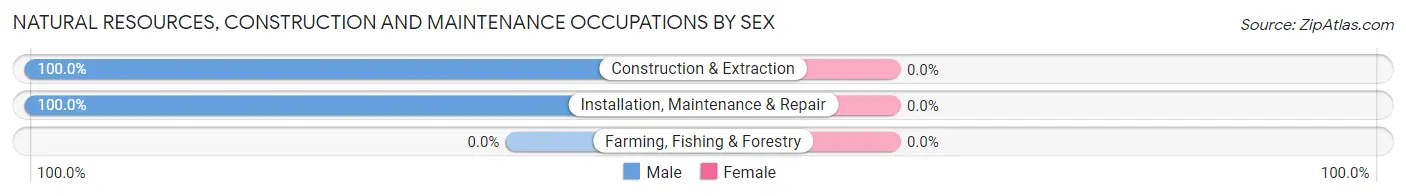
| Occupation | Male | Female |
| Farming, Fishing & Forestry | 0 (0.0%) | 0 (0.0%) |
| Construction & Extraction | 16 (100.0%) | 0 (0.0%) |
| Installation, Maintenance & Repair | 94 (100.0%) | 0 (0.0%) |
| Total (Category) | 110 (100.0%) | 0 (0.0%) |
| Total (Overall) | 2,257 (56.8%) | 1,714 (43.2%) |
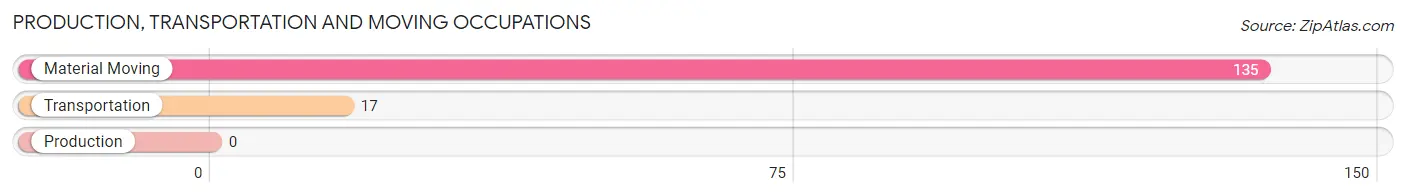
Production, Transportation and Moving Occupations
The most common Production, Transportation and Moving occupations in Fairview are Material Moving (135 | 3.4%), and Transportation (17 | 0.4%).
Production, Transportation and Moving Occupations by Sex
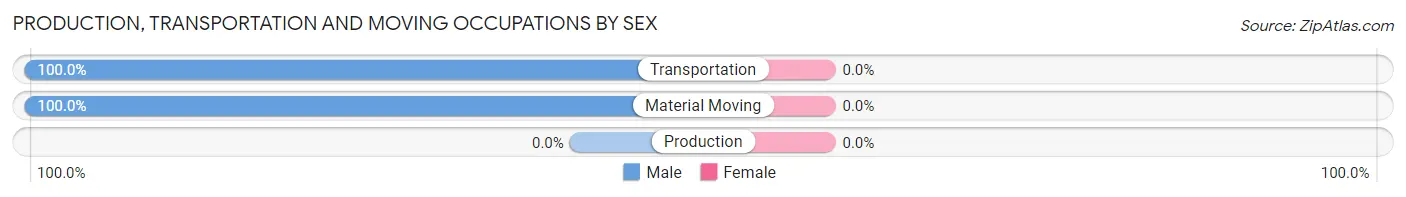
| Occupation | Male | Female |
| Production | 0 (0.0%) | 0 (0.0%) |
| Transportation | 17 (100.0%) | 0 (0.0%) |
| Material Moving | 135 (100.0%) | 0 (0.0%) |
| Total (Category) | 152 (100.0%) | 0 (0.0%) |
| Total (Overall) | 2,257 (56.8%) | 1,714 (43.2%) |
Employment Industries by Sex in Fairview
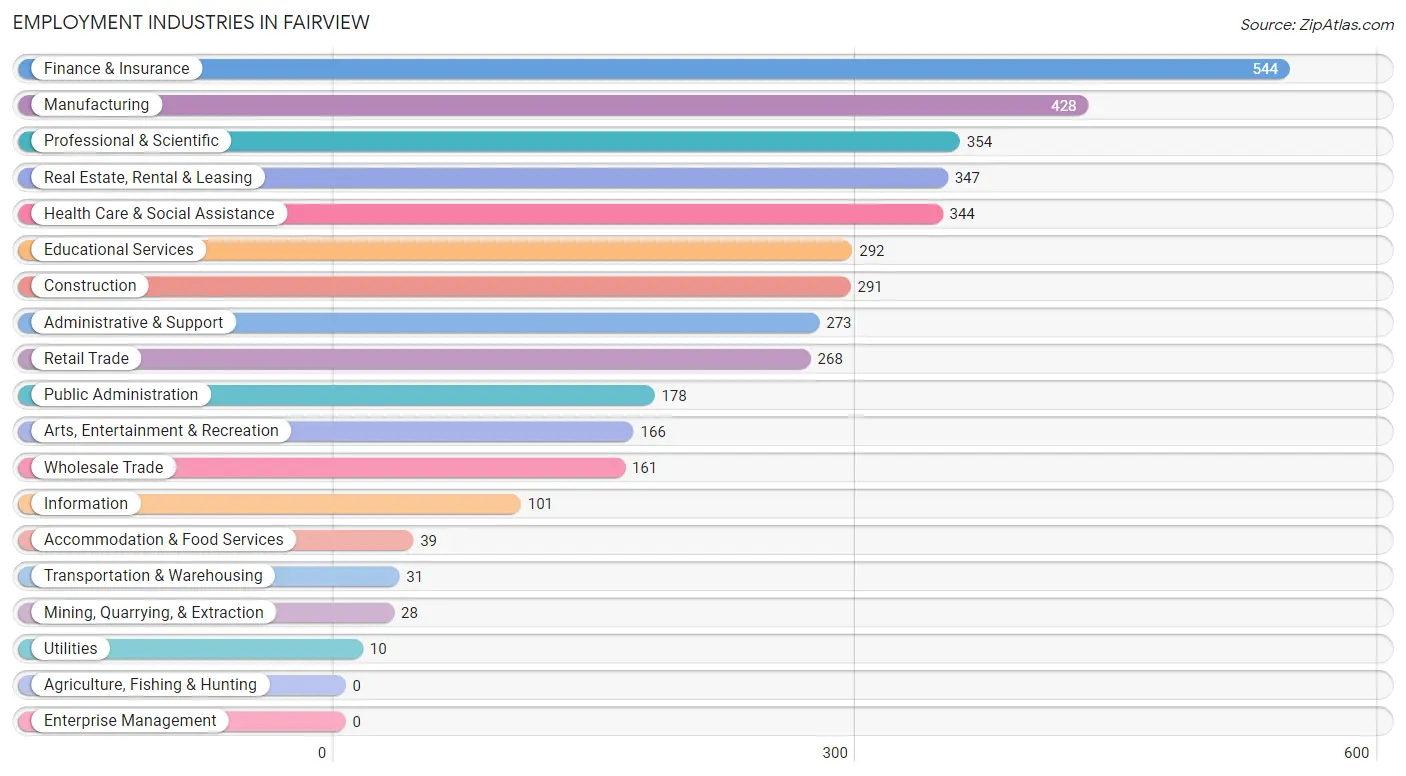
Employment Industries in Fairview
The major employment industries in Fairview include Finance & Insurance (544 | 13.7%), Manufacturing (428 | 10.8%), Professional & Scientific (354 | 8.9%), Real Estate, Rental & Leasing (347 | 8.7%), and Health Care & Social Assistance (344 | 8.7%).
Employment Industries by Sex in Fairview
The Fairview industries that see more men than women are Utilities (100.0%), Information (100.0%), and Public Administration (100.0%), whereas the industries that tend to have a higher number of women are Mining, Quarrying, & Extraction (100.0%), Accommodation & Food Services (100.0%), and Health Care & Social Assistance (91.6%).
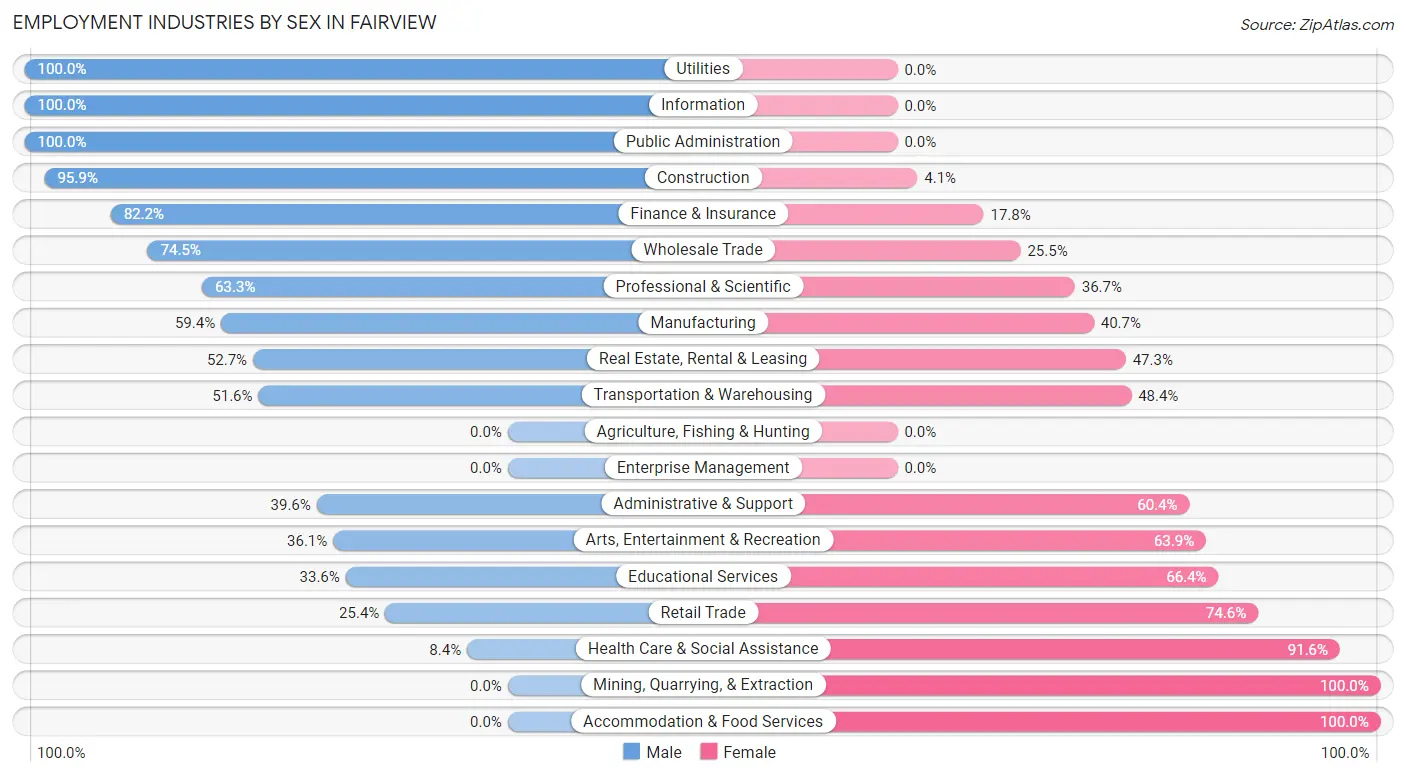
| Industry | Male | Female |
| Agriculture, Fishing & Hunting | 0 (0.0%) | 0 (0.0%) |
| Mining, Quarrying, & Extraction | 0 (0.0%) | 28 (100.0%) |
| Construction | 279 (95.9%) | 12 (4.1%) |
| Manufacturing | 254 (59.4%) | 174 (40.6%) |
| Wholesale Trade | 120 (74.5%) | 41 (25.5%) |
| Retail Trade | 68 (25.4%) | 200 (74.6%) |
| Transportation & Warehousing | 16 (51.6%) | 15 (48.4%) |
| Utilities | 10 (100.0%) | 0 (0.0%) |
| Information | 101 (100.0%) | 0 (0.0%) |
| Finance & Insurance | 447 (82.2%) | 97 (17.8%) |
| Real Estate, Rental & Leasing | 183 (52.7%) | 164 (47.3%) |
| Professional & Scientific | 224 (63.3%) | 130 (36.7%) |
| Enterprise Management | 0 (0.0%) | 0 (0.0%) |
| Administrative & Support | 108 (39.6%) | 165 (60.4%) |
| Educational Services | 98 (33.6%) | 194 (66.4%) |
| Health Care & Social Assistance | 29 (8.4%) | 315 (91.6%) |
| Arts, Entertainment & Recreation | 60 (36.1%) | 106 (63.9%) |
| Accommodation & Food Services | 0 (0.0%) | 39 (100.0%) |
| Public Administration | 178 (100.0%) | 0 (0.0%) |
| Total | 2,257 (56.8%) | 1,714 (43.2%) |
Education in Fairview
School Enrollment in Fairview
The most common levels of schooling among the 2,439 students in Fairview are middle school (601 | 24.6%), high school (589 | 24.1%), and college / undergraduate (529 | 21.7%).
| School Level | # Students | % Students |
| Nursery / Preschool | 160 | 6.6% |
| Kindergarten | 97 | 4.0% |
| Elementary School | 384 | 15.7% |
| Middle School | 601 | 24.6% |
| High School | 589 | 24.1% |
| College / Undergraduate | 529 | 21.7% |
| Graduate / Professional | 79 | 3.2% |
| Total | 2,439 | 100.0% |
School Enrollment by Age by Funding Source in Fairview
Out of a total of 2,439 students who are enrolled in schools in Fairview, 327 (13.4%) attend a private institution, while the remaining 2,112 (86.6%) are enrolled in public schools. The age group of 3 to 4 year olds has the highest likelihood of being enrolled in private schools, with 163 (100.0% in the age bracket) enrolled. Conversely, the age group of 15 to 17 year olds has the lowest likelihood of being enrolled in a private school, with 443 (100.0% in the age bracket) attending a public institution.
| Age Bracket | Public School | Private School |
| 3 to 4 Year Olds | 0 (0.0%) | 163 (100.0%) |
| 5 to 9 Year Old | 384 (97.2%) | 11 (2.8%) |
| 10 to 14 Year Olds | 804 (98.3%) | 14 (1.7%) |
| 15 to 17 Year Olds | 443 (100.0%) | 0 (0.0%) |
| 18 to 19 Year Olds | 214 (86.3%) | 34 (13.7%) |
| 20 to 24 Year Olds | 35 (100.0%) | 0 (0.0%) |
| 25 to 34 Year Olds | 104 (61.9%) | 64 (38.1%) |
| 35 Years and over | 128 (75.7%) | 41 (24.3%) |
| Total | 2,112 (86.6%) | 327 (13.4%) |
Educational Attainment by Field of Study in Fairview
Business (1,333 | 26.3%), education (859 | 17.0%), engineering (559 | 11.0%), social sciences (375 | 7.4%), and science & technology (298 | 5.9%) are the most common fields of study among 5,068 individuals in Fairview who have obtained a bachelor's degree or higher.
| Field of Study | # Graduates | % Graduates |
| Computers & Mathematics | 242 | 4.8% |
| Bio, Nature & Agricultural | 159 | 3.1% |
| Physical & Health Sciences | 236 | 4.7% |
| Psychology | 166 | 3.3% |
| Social Sciences | 375 | 7.4% |
| Engineering | 559 | 11.0% |
| Multidisciplinary Studies | 75 | 1.5% |
| Science & Technology | 298 | 5.9% |
| Business | 1,333 | 26.3% |
| Education | 859 | 17.0% |
| Literature & Languages | 142 | 2.8% |
| Liberal Arts & History | 95 | 1.9% |
| Visual & Performing Arts | 224 | 4.4% |
| Communications | 109 | 2.1% |
| Arts & Humanities | 196 | 3.9% |
| Total | 5,068 | 100.0% |
Transportation & Commute in Fairview
Vehicle Availability by Sex in Fairview
The most prevalent vehicle ownership categories in Fairview are males with 2 vehicles (1,147, accounting for 50.8%) and females with 2 vehicles (835, making up 67.2%).
| Vehicles Available | Male | Female |
| No Vehicle | 25 (1.1%) | 22 (1.3%) |
| 1 Vehicle | 317 (14.1%) | 378 (22.1%) |
| 2 Vehicles | 1,147 (50.8%) | 835 (48.9%) |
| 3 Vehicles | 487 (21.6%) | 197 (11.5%) |
| 4 Vehicles | 281 (12.4%) | 275 (16.1%) |
| 5 or more Vehicles | 0 (0.0%) | 0 (0.0%) |
| Total | 2,257 (100.0%) | 1,707 (100.0%) |
Commute Time in Fairview
The most frequently occuring commute durations in Fairview are 20 to 24 minutes (617 commuters, 21.6%), 30 to 34 minutes (441 commuters, 15.4%), and 15 to 19 minutes (357 commuters, 12.5%).
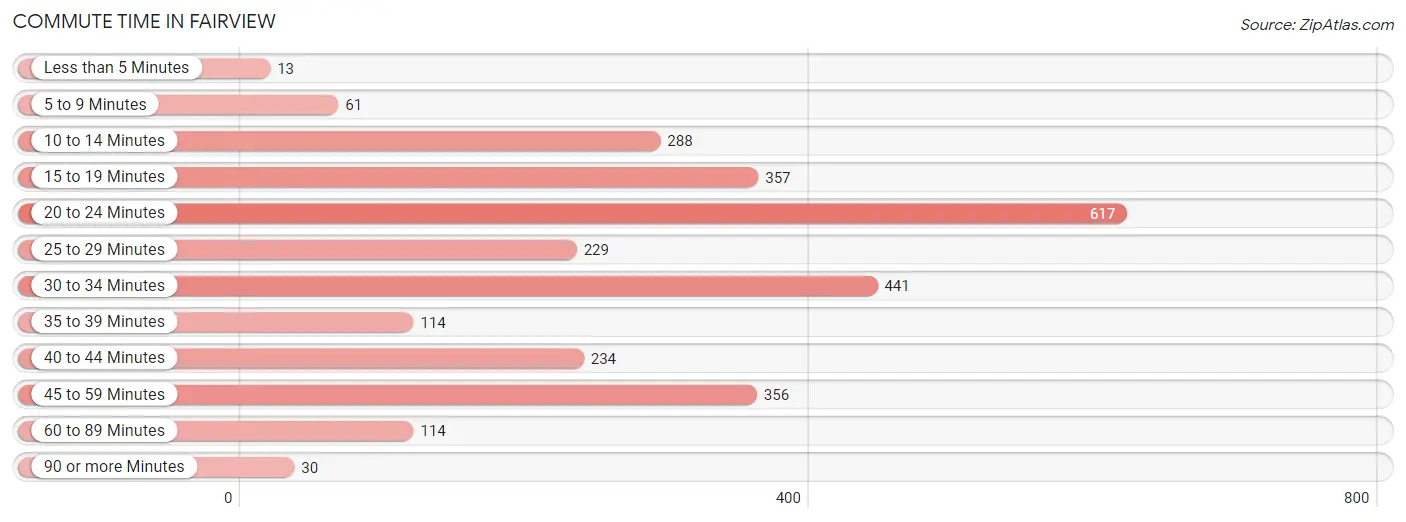
| Commute Time | # Commuters | % Commuters |
| Less than 5 Minutes | 13 | 0.5% |
| 5 to 9 Minutes | 61 | 2.1% |
| 10 to 14 Minutes | 288 | 10.1% |
| 15 to 19 Minutes | 357 | 12.5% |
| 20 to 24 Minutes | 617 | 21.6% |
| 25 to 29 Minutes | 229 | 8.0% |
| 30 to 34 Minutes | 441 | 15.4% |
| 35 to 39 Minutes | 114 | 4.0% |
| 40 to 44 Minutes | 234 | 8.2% |
| 45 to 59 Minutes | 356 | 12.5% |
| 60 to 89 Minutes | 114 | 4.0% |
| 90 or more Minutes | 30 | 1.1% |
Commute Time by Sex in Fairview
The most common commute times in Fairview are 20 to 24 minutes (381 commuters, 23.1%) for males and 20 to 24 minutes (236 commuters, 19.7%) for females.
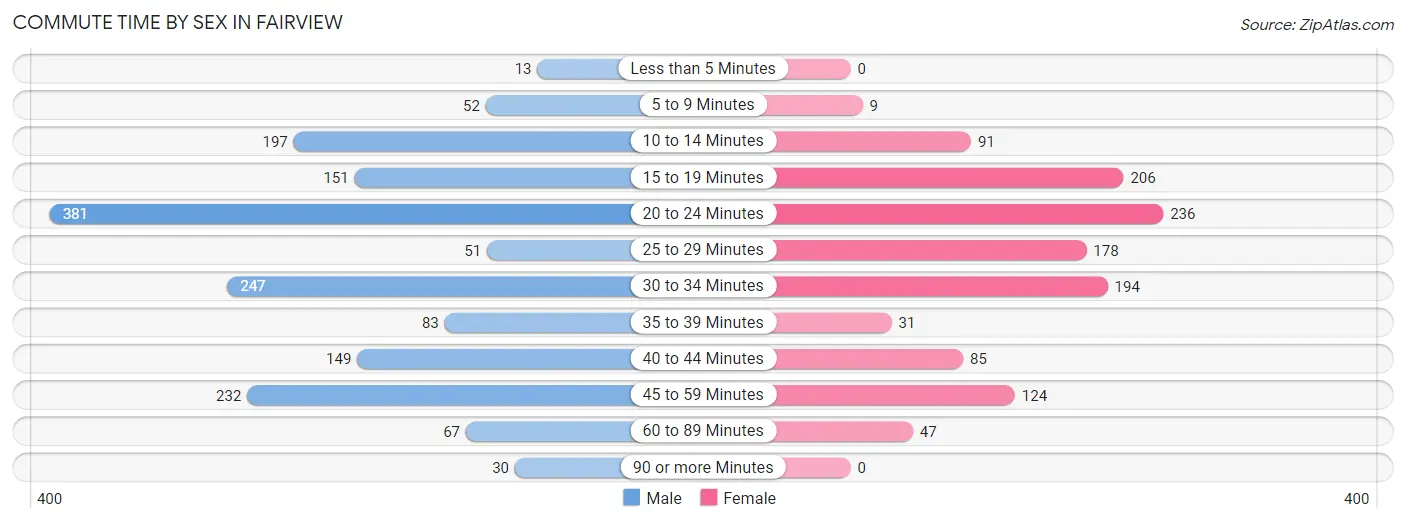
| Commute Time | Male | Female |
| Less than 5 Minutes | 13 (0.8%) | 0 (0.0%) |
| 5 to 9 Minutes | 52 (3.2%) | 9 (0.7%) |
| 10 to 14 Minutes | 197 (11.9%) | 91 (7.6%) |
| 15 to 19 Minutes | 151 (9.1%) | 206 (17.2%) |
| 20 to 24 Minutes | 381 (23.1%) | 236 (19.7%) |
| 25 to 29 Minutes | 51 (3.1%) | 178 (14.8%) |
| 30 to 34 Minutes | 247 (14.9%) | 194 (16.2%) |
| 35 to 39 Minutes | 83 (5.0%) | 31 (2.6%) |
| 40 to 44 Minutes | 149 (9.0%) | 85 (7.1%) |
| 45 to 59 Minutes | 232 (14.0%) | 124 (10.3%) |
| 60 to 89 Minutes | 67 (4.1%) | 47 (3.9%) |
| 90 or more Minutes | 30 (1.8%) | 0 (0.0%) |
Time of Departure to Work by Sex in Fairview
The most frequent times of departure to work in Fairview are 8:00 AM to 8:29 AM (451, 27.3%) for males and 8:00 AM to 8:29 AM (191, 15.9%) for females.
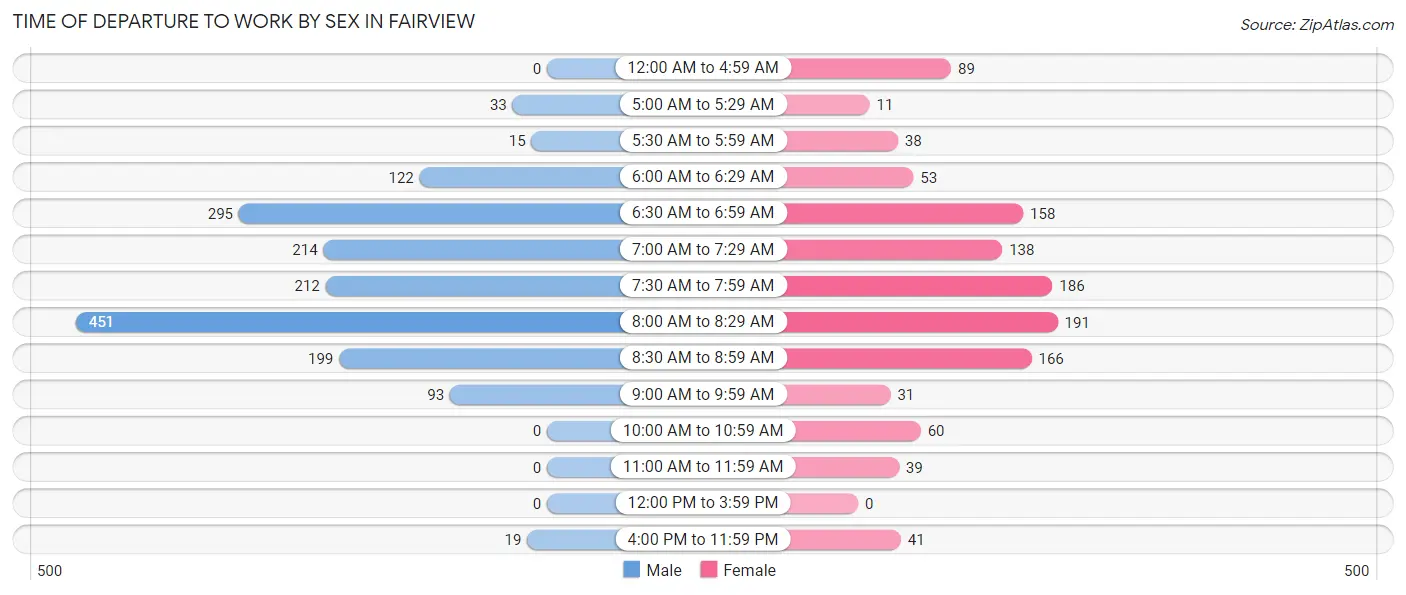
| Time of Departure | Male | Female |
| 12:00 AM to 4:59 AM | 0 (0.0%) | 89 (7.4%) |
| 5:00 AM to 5:29 AM | 33 (2.0%) | 11 (0.9%) |
| 5:30 AM to 5:59 AM | 15 (0.9%) | 38 (3.2%) |
| 6:00 AM to 6:29 AM | 122 (7.4%) | 53 (4.4%) |
| 6:30 AM to 6:59 AM | 295 (17.8%) | 158 (13.2%) |
| 7:00 AM to 7:29 AM | 214 (13.0%) | 138 (11.5%) |
| 7:30 AM to 7:59 AM | 212 (12.8%) | 186 (15.5%) |
| 8:00 AM to 8:29 AM | 451 (27.3%) | 191 (15.9%) |
| 8:30 AM to 8:59 AM | 199 (12.0%) | 166 (13.8%) |
| 9:00 AM to 9:59 AM | 93 (5.6%) | 31 (2.6%) |
| 10:00 AM to 10:59 AM | 0 (0.0%) | 60 (5.0%) |
| 11:00 AM to 11:59 AM | 0 (0.0%) | 39 (3.3%) |
| 12:00 PM to 3:59 PM | 0 (0.0%) | 0 (0.0%) |
| 4:00 PM to 11:59 PM | 19 (1.1%) | 41 (3.4%) |
| Total | 1,653 (100.0%) | 1,201 (100.0%) |
Housing Occupancy in Fairview
Occupancy by Ownership in Fairview
Of the total 4,313 dwellings in Fairview, owner-occupied units account for 3,104 (72.0%), while renter-occupied units make up 1,209 (28.0%).
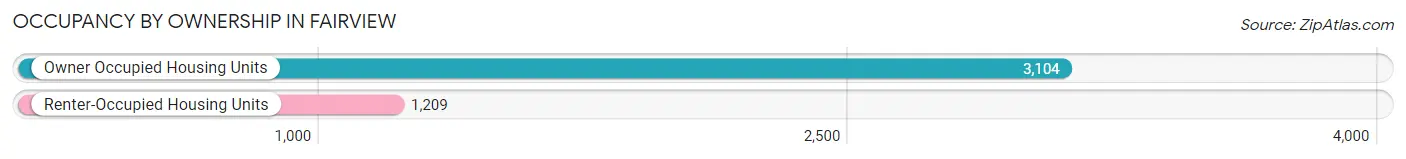
| Occupancy | # Housing Units | % Housing Units |
| Owner Occupied Housing Units | 3,104 | 72.0% |
| Renter-Occupied Housing Units | 1,209 | 28.0% |
| Total Occupied Housing Units | 4,313 | 100.0% |
Occupancy by Household Size in Fairview
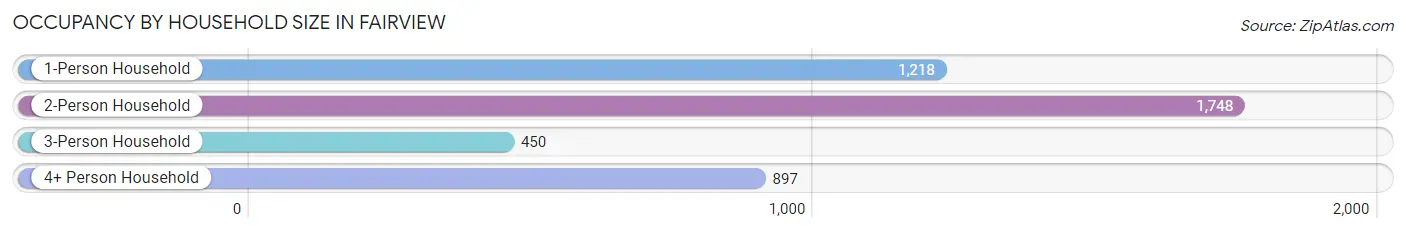
| Household Size | # Housing Units | % Housing Units |
| 1-Person Household | 1,218 | 28.2% |
| 2-Person Household | 1,748 | 40.5% |
| 3-Person Household | 450 | 10.4% |
| 4+ Person Household | 897 | 20.8% |
| Total Housing Units | 4,313 | 100.0% |
Occupancy by Ownership by Household Size in Fairview
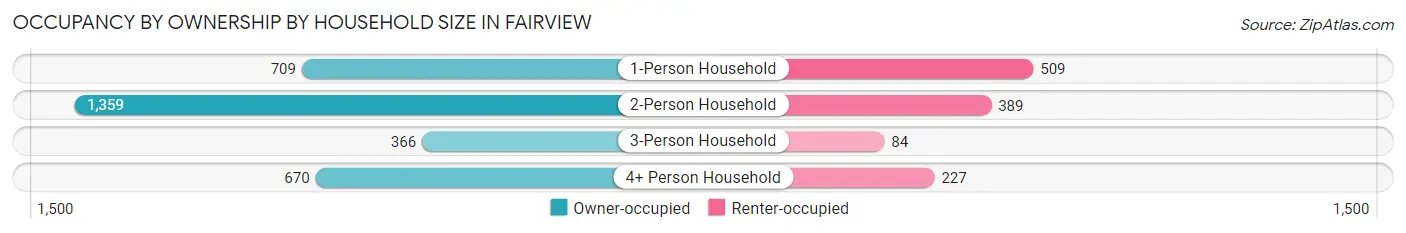
| Household Size | Owner-occupied | Renter-occupied |
| 1-Person Household | 709 (58.2%) | 509 (41.8%) |
| 2-Person Household | 1,359 (77.7%) | 389 (22.3%) |
| 3-Person Household | 366 (81.3%) | 84 (18.7%) |
| 4+ Person Household | 670 (74.7%) | 227 (25.3%) |
| Total Housing Units | 3,104 (72.0%) | 1,209 (28.0%) |
Occupancy by Educational Attainment in Fairview
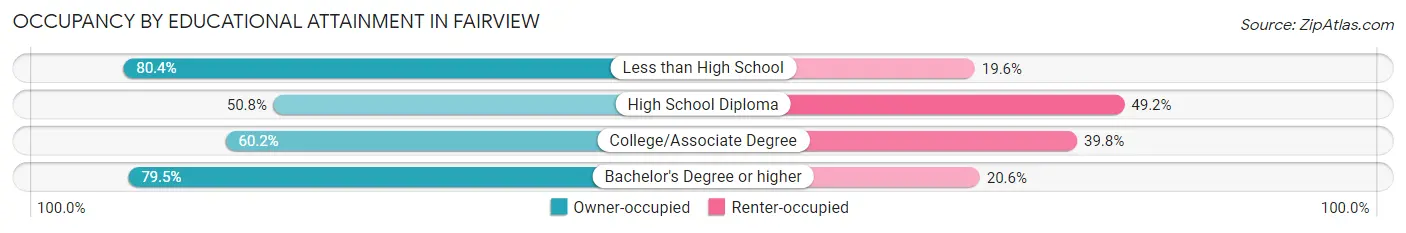
| Household Size | Owner-occupied | Renter-occupied |
| Less than High School | 74 (80.4%) | 18 (19.6%) |
| High School Diploma | 256 (50.8%) | 248 (49.2%) |
| College/Associate Degree | 559 (60.2%) | 370 (39.8%) |
| Bachelor's Degree or higher | 2,215 (79.4%) | 573 (20.5%) |
Occupancy by Age of Householder in Fairview
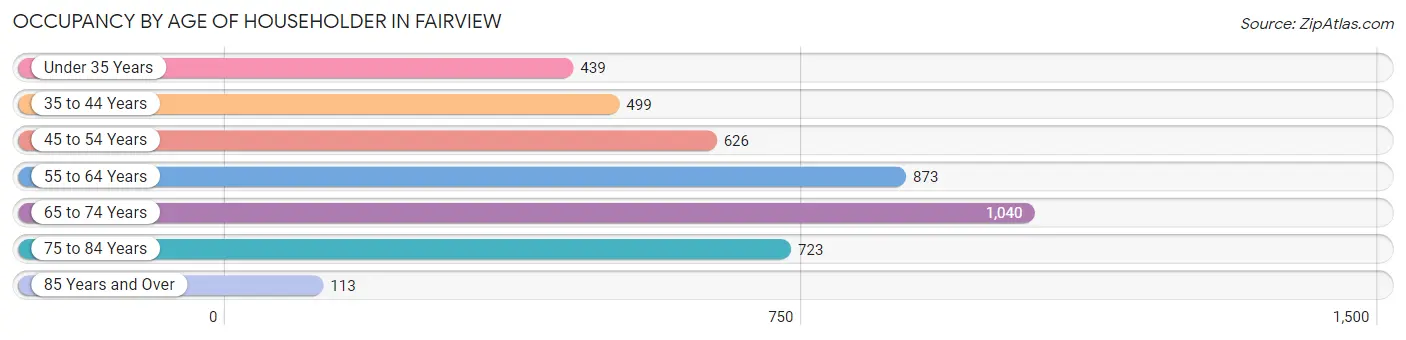
| Age Bracket | # Households | % Households |
| Under 35 Years | 439 | 10.2% |
| 35 to 44 Years | 499 | 11.6% |
| 45 to 54 Years | 626 | 14.5% |
| 55 to 64 Years | 873 | 20.2% |
| 65 to 74 Years | 1,040 | 24.1% |
| 75 to 84 Years | 723 | 16.8% |
| 85 Years and Over | 113 | 2.6% |
| Total | 4,313 | 100.0% |
Housing Finances in Fairview
Median Income by Occupancy in Fairview
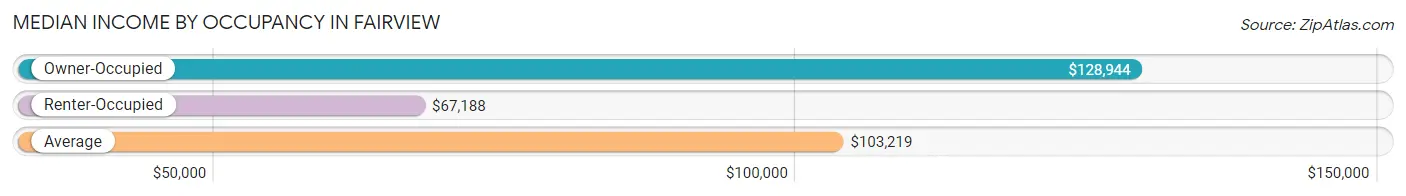
| Occupancy Type | # Households | Median Income |
| Owner-Occupied | 3,104 (72.0%) | $128,944 |
| Renter-Occupied | 1,209 (28.0%) | $67,188 |
| Average | 4,313 (100.0%) | $103,219 |
Occupancy by Householder Income Bracket in Fairview
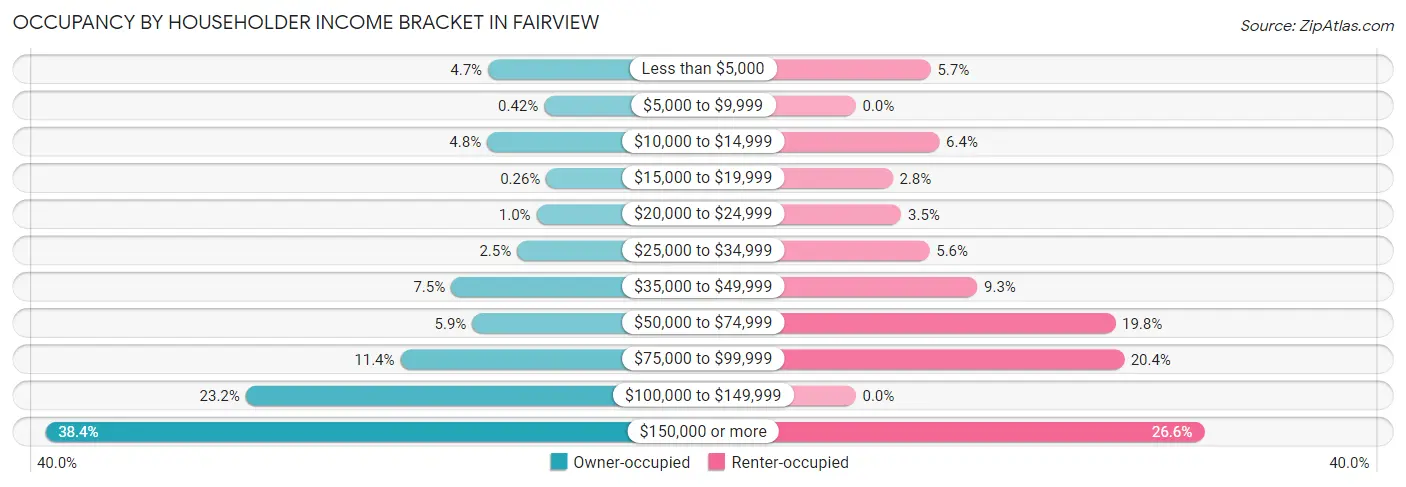
| Income Bracket | Owner-occupied | Renter-occupied |
| Less than $5,000 | 146 (4.7%) | 69 (5.7%) |
| $5,000 to $9,999 | 13 (0.4%) | 0 (0.0%) |
| $10,000 to $14,999 | 148 (4.8%) | 77 (6.4%) |
| $15,000 to $19,999 | 8 (0.3%) | 34 (2.8%) |
| $20,000 to $24,999 | 31 (1.0%) | 42 (3.5%) |
| $25,000 to $34,999 | 77 (2.5%) | 68 (5.6%) |
| $35,000 to $49,999 | 233 (7.5%) | 112 (9.3%) |
| $50,000 to $74,999 | 183 (5.9%) | 239 (19.8%) |
| $75,000 to $99,999 | 353 (11.4%) | 247 (20.4%) |
| $100,000 to $149,999 | 719 (23.2%) | 0 (0.0%) |
| $150,000 or more | 1,193 (38.4%) | 321 (26.6%) |
| Total | 3,104 (100.0%) | 1,209 (100.0%) |
Monthly Housing Cost Tiers in Fairview
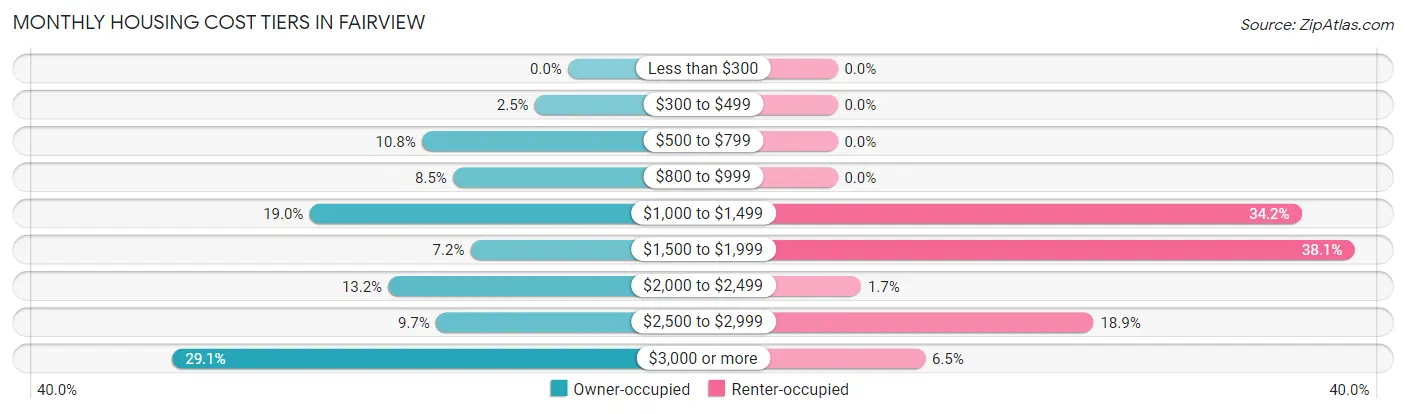
| Monthly Cost | Owner-occupied | Renter-occupied |
| Less than $300 | 0 (0.0%) | 0 (0.0%) |
| $300 to $499 | 76 (2.5%) | 0 (0.0%) |
| $500 to $799 | 334 (10.8%) | 0 (0.0%) |
| $800 to $999 | 263 (8.5%) | 0 (0.0%) |
| $1,000 to $1,499 | 591 (19.0%) | 413 (34.2%) |
| $1,500 to $1,999 | 223 (7.2%) | 460 (38.1%) |
| $2,000 to $2,499 | 411 (13.2%) | 21 (1.7%) |
| $2,500 to $2,999 | 302 (9.7%) | 228 (18.9%) |
| $3,000 or more | 904 (29.1%) | 78 (6.5%) |
| Total | 3,104 (100.0%) | 1,209 (100.0%) |
Physical Housing Characteristics in Fairview
Housing Structures in Fairview
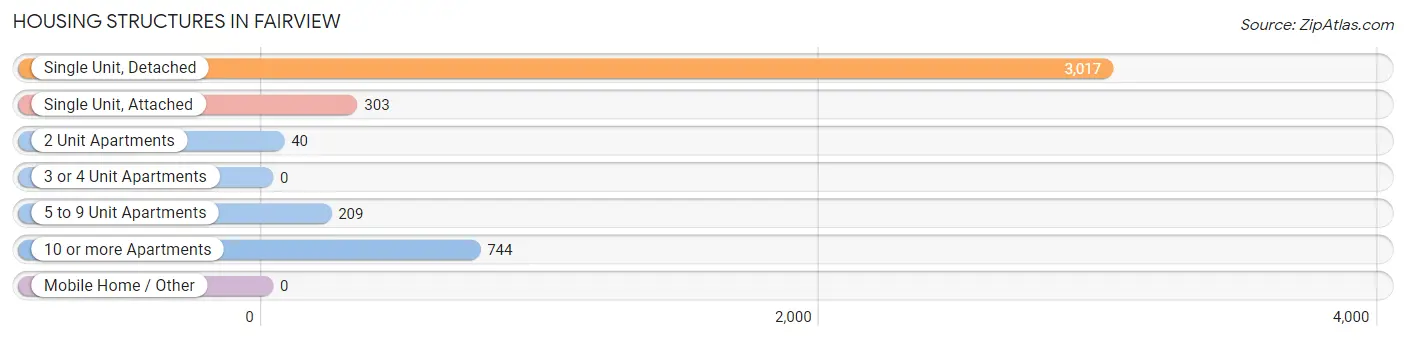
| Structure Type | # Housing Units | % Housing Units |
| Single Unit, Detached | 3,017 | 70.0% |
| Single Unit, Attached | 303 | 7.0% |
| 2 Unit Apartments | 40 | 0.9% |
| 3 or 4 Unit Apartments | 0 | 0.0% |
| 5 to 9 Unit Apartments | 209 | 4.9% |
| 10 or more Apartments | 744 | 17.2% |
| Mobile Home / Other | 0 | 0.0% |
| Total | 4,313 | 100.0% |
Housing Structures by Occupancy in Fairview
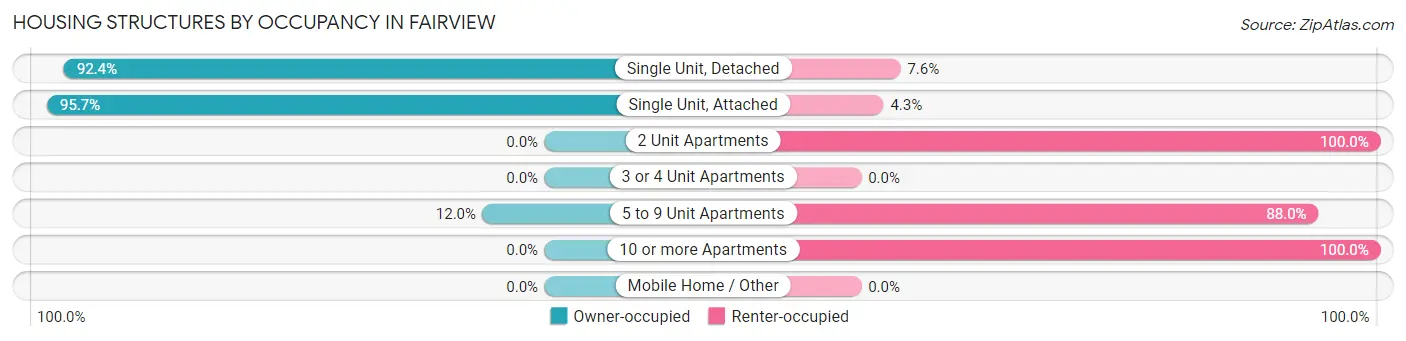
| Structure Type | Owner-occupied | Renter-occupied |
| Single Unit, Detached | 2,789 (92.4%) | 228 (7.6%) |
| Single Unit, Attached | 290 (95.7%) | 13 (4.3%) |
| 2 Unit Apartments | 0 (0.0%) | 40 (100.0%) |
| 3 or 4 Unit Apartments | 0 (0.0%) | 0 (0.0%) |
| 5 to 9 Unit Apartments | 25 (12.0%) | 184 (88.0%) |
| 10 or more Apartments | 0 (0.0%) | 744 (100.0%) |
| Mobile Home / Other | 0 (0.0%) | 0 (0.0%) |
| Total | 3,104 (72.0%) | 1,209 (28.0%) |
Housing Structures by Number of Rooms in Fairview
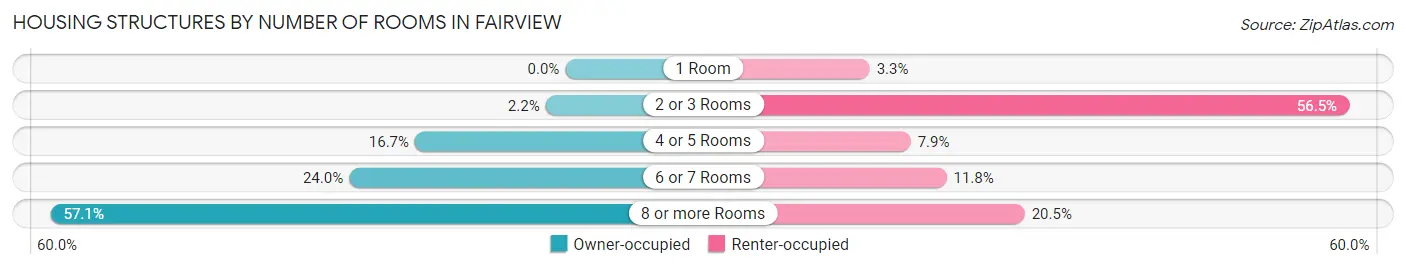
| Number of Rooms | Owner-occupied | Renter-occupied |
| 1 Room | 0 (0.0%) | 40 (3.3%) |
| 2 or 3 Rooms | 68 (2.2%) | 683 (56.5%) |
| 4 or 5 Rooms | 518 (16.7%) | 95 (7.9%) |
| 6 or 7 Rooms | 745 (24.0%) | 143 (11.8%) |
| 8 or more Rooms | 1,773 (57.1%) | 248 (20.5%) |
| Total | 3,104 (100.0%) | 1,209 (100.0%) |
Housing Structure by Heating Type in Fairview
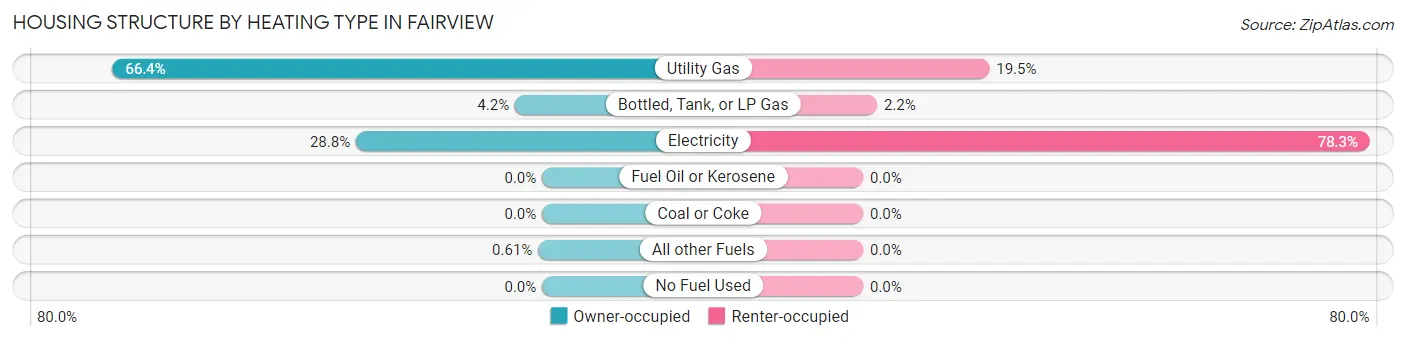
| Heating Type | Owner-occupied | Renter-occupied |
| Utility Gas | 2,062 (66.4%) | 236 (19.5%) |
| Bottled, Tank, or LP Gas | 130 (4.2%) | 26 (2.1%) |
| Electricity | 893 (28.8%) | 947 (78.3%) |
| Fuel Oil or Kerosene | 0 (0.0%) | 0 (0.0%) |
| Coal or Coke | 0 (0.0%) | 0 (0.0%) |
| All other Fuels | 19 (0.6%) | 0 (0.0%) |
| No Fuel Used | 0 (0.0%) | 0 (0.0%) |
| Total | 3,104 (100.0%) | 1,209 (100.0%) |
Household Vehicle Usage in Fairview
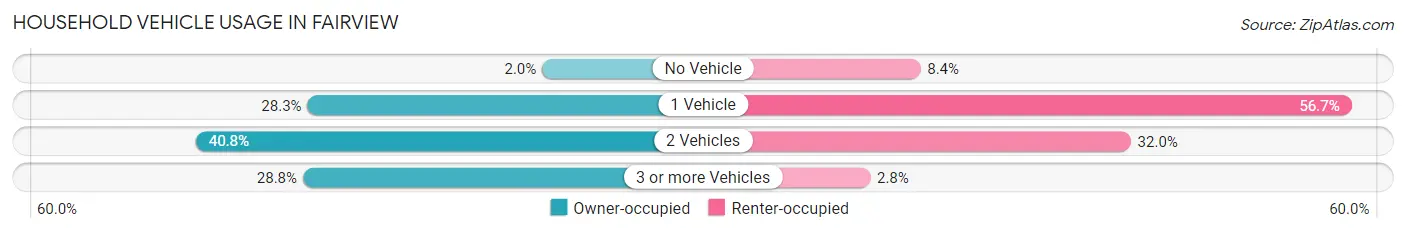
| Vehicles per Household | Owner-occupied | Renter-occupied |
| No Vehicle | 63 (2.0%) | 102 (8.4%) |
| 1 Vehicle | 879 (28.3%) | 686 (56.7%) |
| 2 Vehicles | 1,267 (40.8%) | 387 (32.0%) |
| 3 or more Vehicles | 895 (28.8%) | 34 (2.8%) |
| Total | 3,104 (100.0%) | 1,209 (100.0%) |
Real Estate & Mortgages in Fairview
Real Estate and Mortgage Overview in Fairview
| Characteristic | Without Mortgage | With Mortgage |
| Housing Units | 1,352 | 1,752 |
| Median Property Value | $476,900 | $560,900 |
| Median Household Income | $99,876 | $819 |
| Monthly Housing Costs | $1,016 | $805 |
| Real Estate Taxes | $6,413 | $0 |
Property Value by Mortgage Status in Fairview
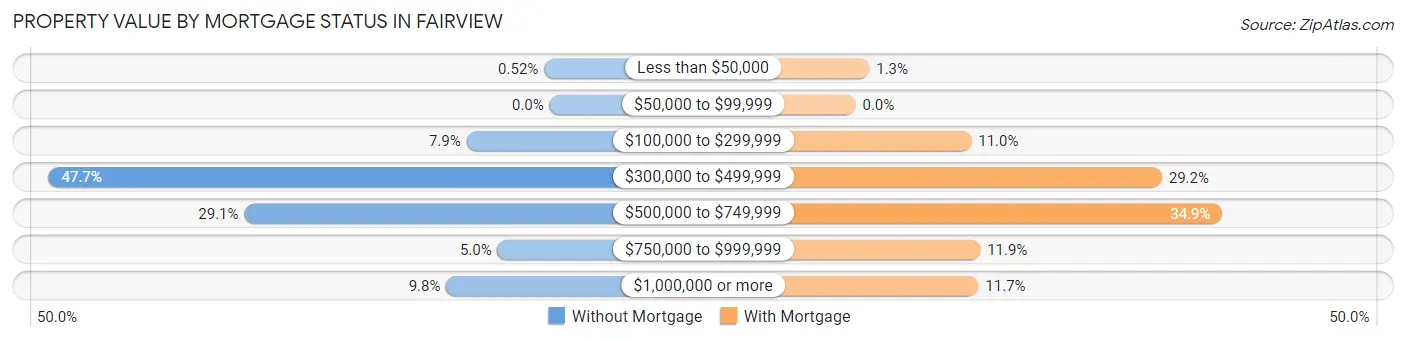
| Property Value | Without Mortgage | With Mortgage |
| Less than $50,000 | 7 (0.5%) | 23 (1.3%) |
| $50,000 to $99,999 | 0 (0.0%) | 0 (0.0%) |
| $100,000 to $299,999 | 107 (7.9%) | 193 (11.0%) |
| $300,000 to $499,999 | 645 (47.7%) | 511 (29.2%) |
| $500,000 to $749,999 | 393 (29.1%) | 612 (34.9%) |
| $750,000 to $999,999 | 67 (5.0%) | 208 (11.9%) |
| $1,000,000 or more | 133 (9.8%) | 205 (11.7%) |
| Total | 1,352 (100.0%) | 1,752 (100.0%) |
Household Income by Mortgage Status in Fairview
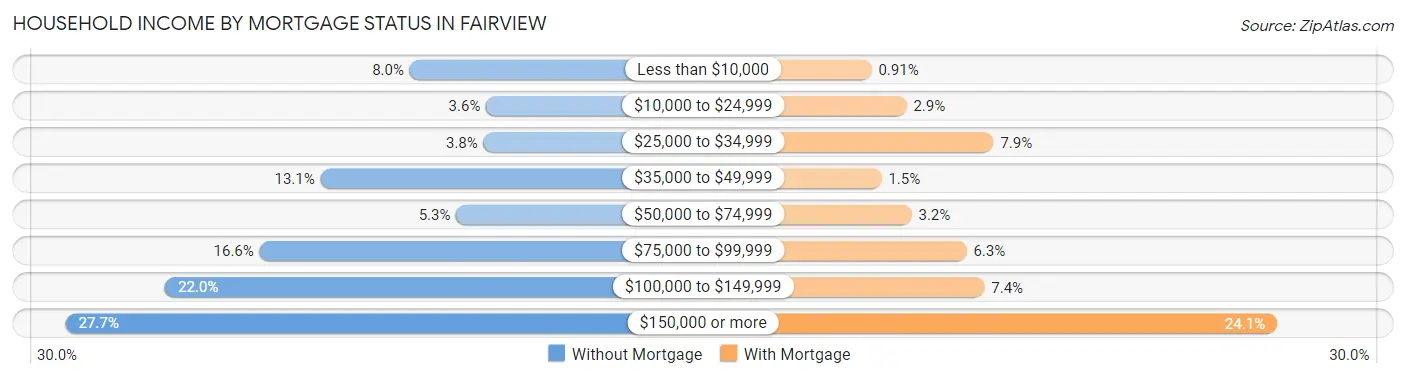
| Household Income | Without Mortgage | With Mortgage |
| Less than $10,000 | 108 (8.0%) | 16 (0.9%) |
| $10,000 to $24,999 | 49 (3.6%) | 51 (2.9%) |
| $25,000 to $34,999 | 51 (3.8%) | 138 (7.9%) |
| $35,000 to $49,999 | 177 (13.1%) | 26 (1.5%) |
| $50,000 to $74,999 | 72 (5.3%) | 56 (3.2%) |
| $75,000 to $99,999 | 224 (16.6%) | 111 (6.3%) |
| $100,000 to $149,999 | 297 (22.0%) | 129 (7.4%) |
| $150,000 or more | 374 (27.7%) | 422 (24.1%) |
| Total | 1,352 (100.0%) | 1,752 (100.0%) |
Property Value to Household Income Ratio in Fairview
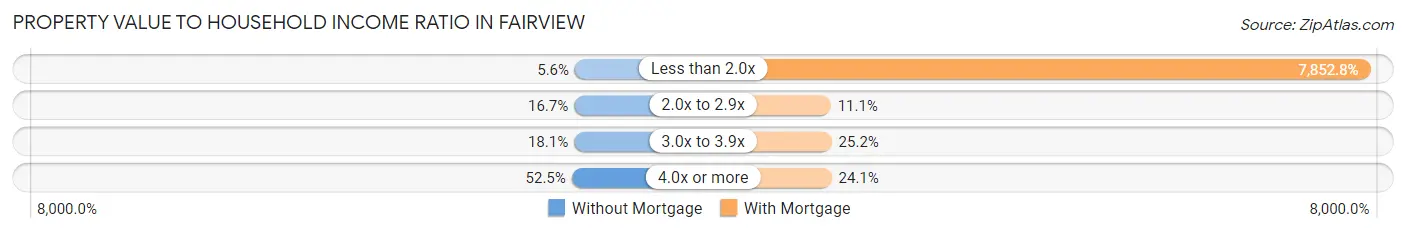
| Value-to-Income Ratio | Without Mortgage | With Mortgage |
| Less than 2.0x | 76 (5.6%) | 137,581 (7,852.8%) |
| 2.0x to 2.9x | 226 (16.7%) | 195 (11.1%) |
| 3.0x to 3.9x | 245 (18.1%) | 441 (25.2%) |
| 4.0x or more | 710 (52.5%) | 423 (24.1%) |
| Total | 1,352 (100.0%) | 1,752 (100.0%) |
Real Estate Taxes by Mortgage Status in Fairview
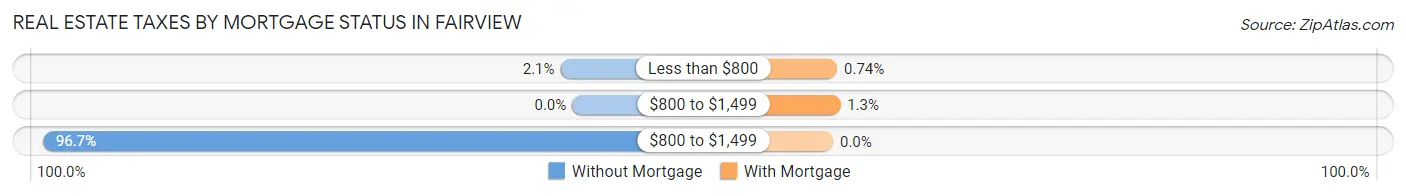
| Property Taxes | Without Mortgage | With Mortgage |
| Less than $800 | 29 (2.1%) | 13 (0.7%) |
| $800 to $1,499 | 0 (0.0%) | 23 (1.3%) |
| $800 to $1,499 | 1,307 (96.7%) | 0 (0.0%) |
| Total | 1,352 (100.0%) | 1,752 (100.0%) |
Health & Disability in Fairview
Health Insurance Coverage by Age in Fairview
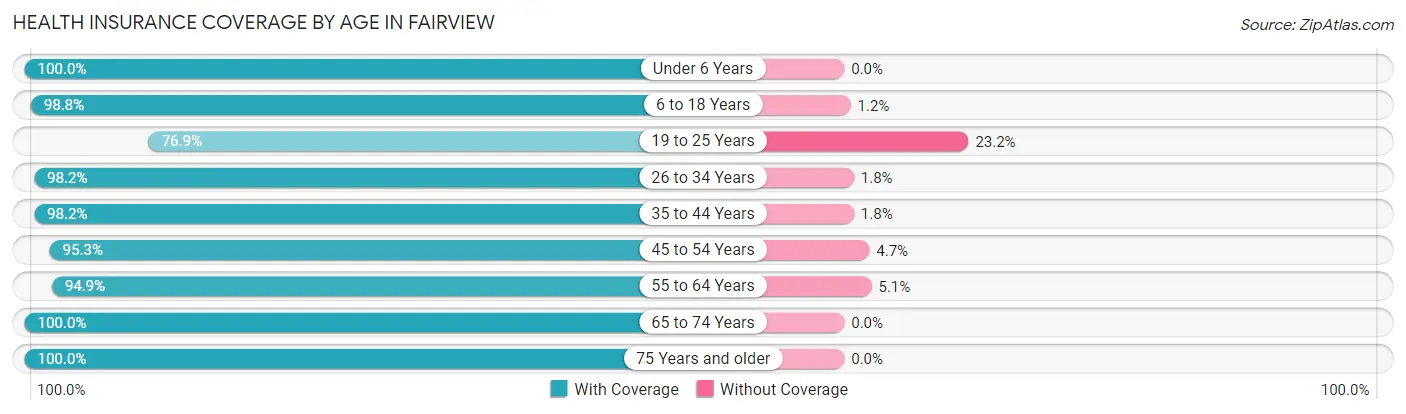
| Age Bracket | With Coverage | Without Coverage |
| Under 6 Years | 612 (100.0%) | 0 (0.0%) |
| 6 to 18 Years | 1,853 (98.8%) | 22 (1.2%) |
| 19 to 25 Years | 166 (76.8%) | 50 (23.2%) |
| 26 to 34 Years | 771 (98.2%) | 14 (1.8%) |
| 35 to 44 Years | 1,041 (98.2%) | 19 (1.8%) |
| 45 to 54 Years | 1,021 (95.3%) | 50 (4.7%) |
| 55 to 64 Years | 1,513 (94.9%) | 81 (5.1%) |
| 65 to 74 Years | 1,631 (100.0%) | 0 (0.0%) |
| 75 Years and older | 1,510 (100.0%) | 0 (0.0%) |
| Total | 10,118 (97.7%) | 236 (2.3%) |
Health Insurance Coverage by Citizenship Status in Fairview
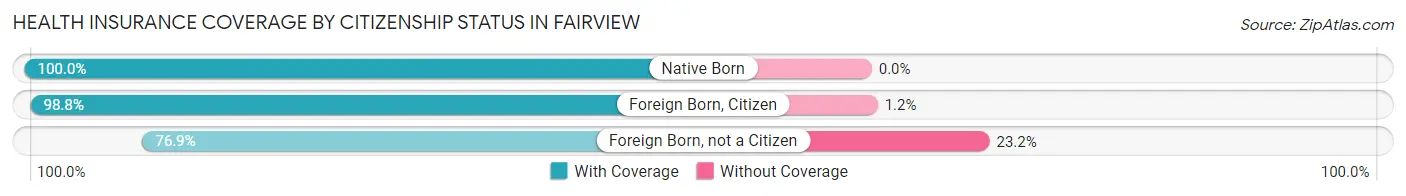
| Citizenship Status | With Coverage | Without Coverage |
| Native Born | 612 (100.0%) | 0 (0.0%) |
| Foreign Born, Citizen | 1,853 (98.8%) | 22 (1.2%) |
| Foreign Born, not a Citizen | 166 (76.8%) | 50 (23.2%) |
Health Insurance Coverage by Household Income in Fairview
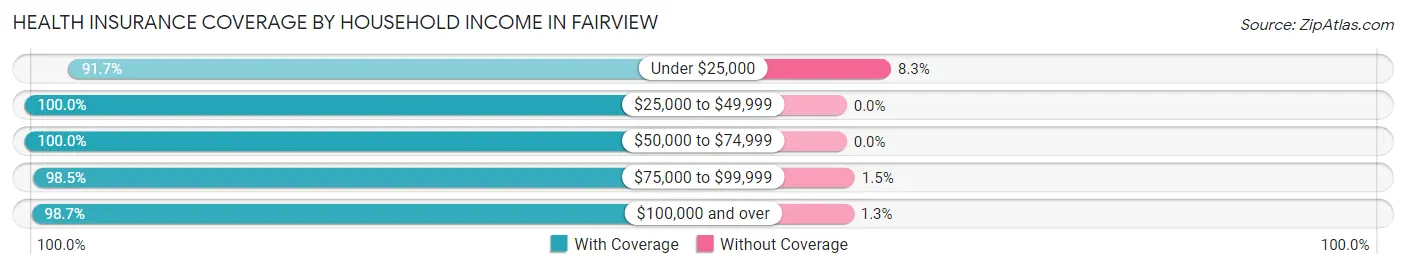
| Household Income | With Coverage | Without Coverage |
| Under $25,000 | 1,559 (91.7%) | 141 (8.3%) |
| $25,000 to $49,999 | 965 (100.0%) | 0 (0.0%) |
| $50,000 to $74,999 | 637 (100.0%) | 0 (0.0%) |
| $75,000 to $99,999 | 1,232 (98.5%) | 19 (1.5%) |
| $100,000 and over | 5,725 (98.7%) | 76 (1.3%) |
Public vs Private Health Insurance Coverage by Age in Fairview
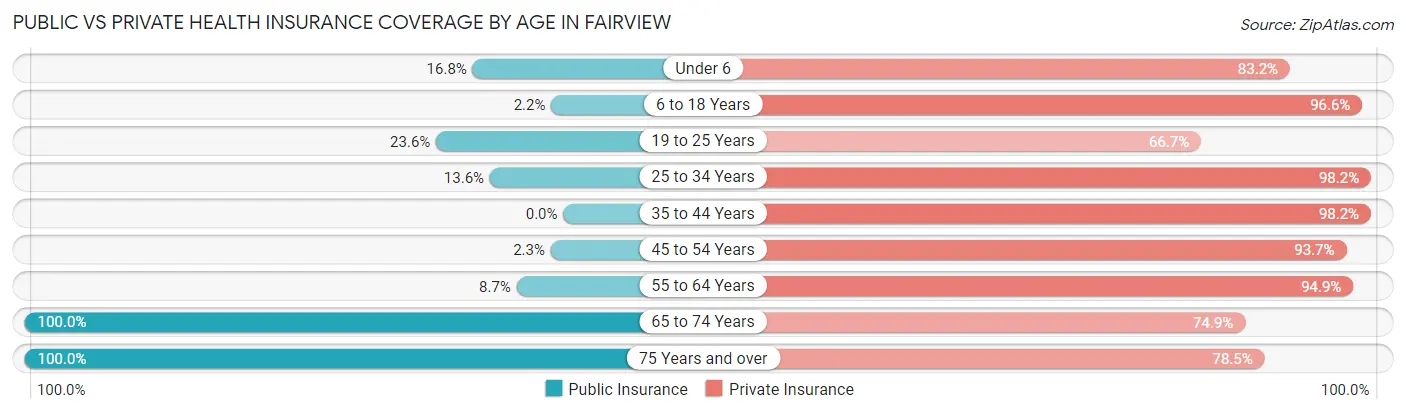
| Age Bracket | Public Insurance | Private Insurance |
| Under 6 | 103 (16.8%) | 509 (83.2%) |
| 6 to 18 Years | 42 (2.2%) | 1,811 (96.6%) |
| 19 to 25 Years | 51 (23.6%) | 144 (66.7%) |
| 25 to 34 Years | 107 (13.6%) | 771 (98.2%) |
| 35 to 44 Years | 0 (0.0%) | 1,041 (98.2%) |
| 45 to 54 Years | 25 (2.3%) | 1,003 (93.6%) |
| 55 to 64 Years | 138 (8.7%) | 1,513 (94.9%) |
| 65 to 74 Years | 1,631 (100.0%) | 1,221 (74.9%) |
| 75 Years and over | 1,510 (100.0%) | 1,185 (78.5%) |
| Total | 3,607 (34.8%) | 9,198 (88.8%) |
Disability Status by Sex by Age in Fairview
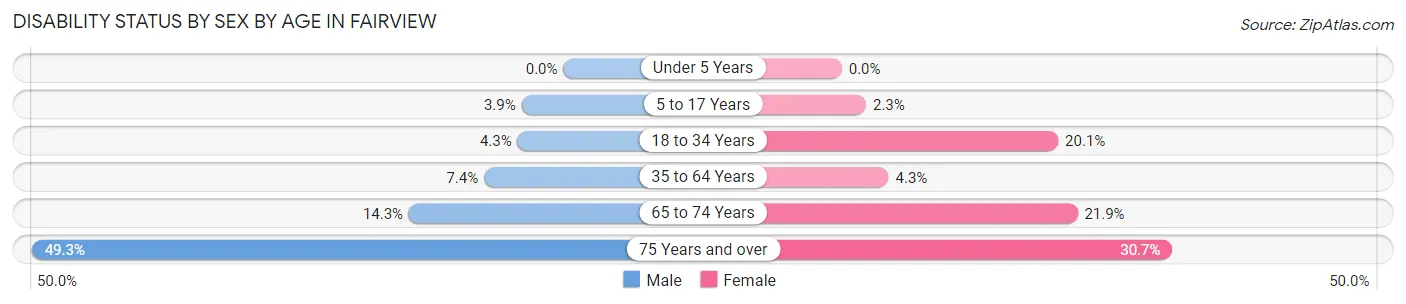
| Age Bracket | Male | Female |
| Under 5 Years | 0 (0.0%) | 0 (0.0%) |
| 5 to 17 Years | 24 (3.9%) | 25 (2.2%) |
| 18 to 34 Years | 29 (4.3%) | 107 (20.1%) |
| 35 to 64 Years | 135 (7.4%) | 82 (4.3%) |
| 65 to 74 Years | 85 (14.3%) | 227 (21.9%) |
| 75 Years and over | 301 (49.3%) | 276 (30.7%) |
Disability Class by Sex by Age in Fairview
Disability Class: Hearing Difficulty
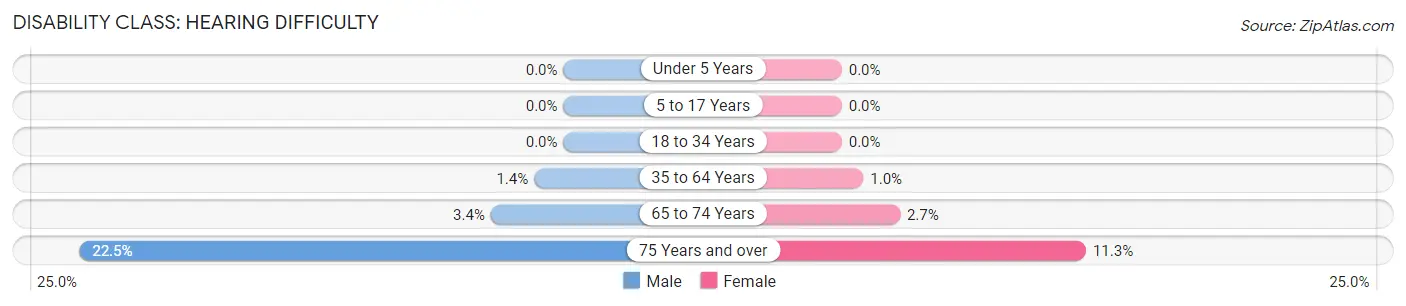
| Age Bracket | Male | Female |
| Under 5 Years | 0 (0.0%) | 0 (0.0%) |
| 5 to 17 Years | 0 (0.0%) | 0 (0.0%) |
| 18 to 34 Years | 0 (0.0%) | 0 (0.0%) |
| 35 to 64 Years | 25 (1.4%) | 19 (1.0%) |
| 65 to 74 Years | 20 (3.4%) | 28 (2.7%) |
| 75 Years and over | 137 (22.5%) | 102 (11.3%) |
Disability Class: Vision Difficulty
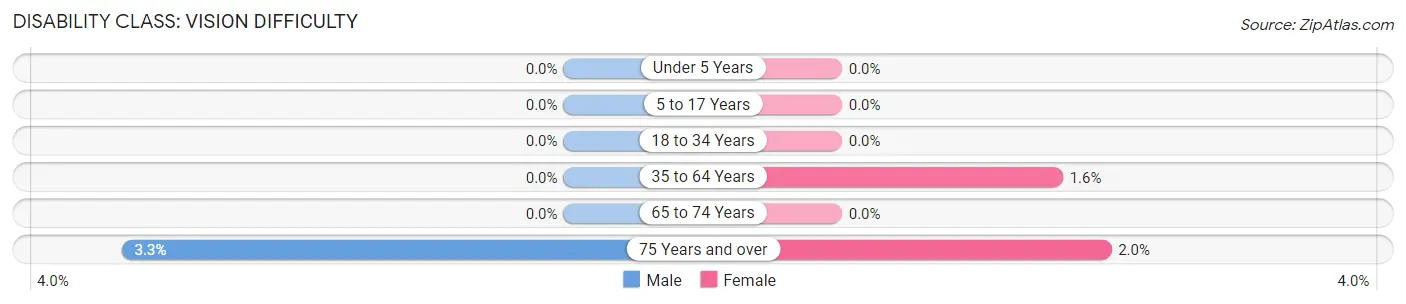
| Age Bracket | Male | Female |
| Under 5 Years | 0 (0.0%) | 0 (0.0%) |
| 5 to 17 Years | 0 (0.0%) | 0 (0.0%) |
| 18 to 34 Years | 0 (0.0%) | 0 (0.0%) |
| 35 to 64 Years | 0 (0.0%) | 31 (1.6%) |
| 65 to 74 Years | 0 (0.0%) | 0 (0.0%) |
| 75 Years and over | 20 (3.3%) | 18 (2.0%) |
Disability Class: Cognitive Difficulty
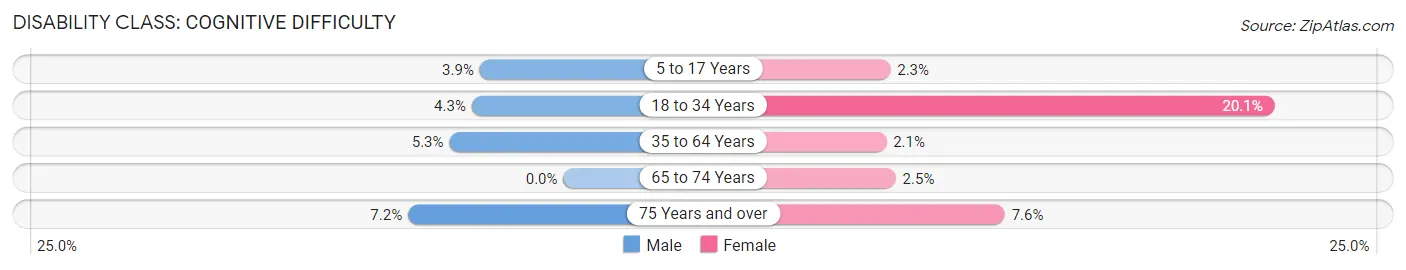
| Age Bracket | Male | Female |
| 5 to 17 Years | 24 (3.9%) | 25 (2.2%) |
| 18 to 34 Years | 29 (4.3%) | 107 (20.1%) |
| 35 to 64 Years | 97 (5.3%) | 39 (2.1%) |
| 65 to 74 Years | 0 (0.0%) | 26 (2.5%) |
| 75 Years and over | 44 (7.2%) | 68 (7.6%) |
Disability Class: Ambulatory Difficulty
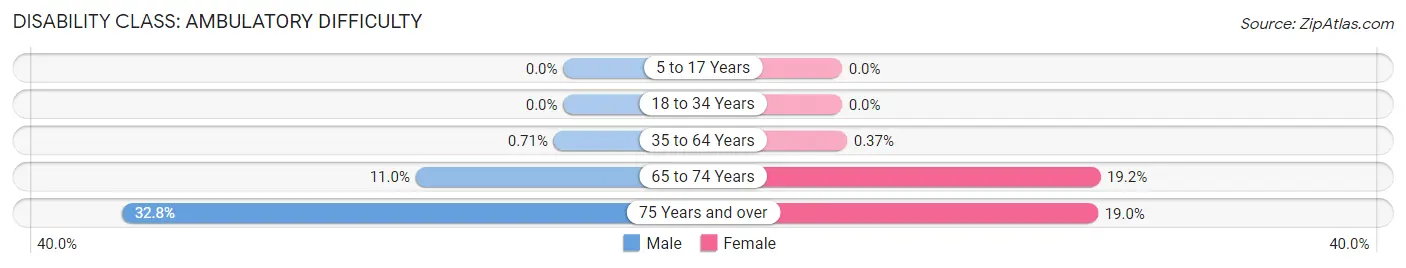
| Age Bracket | Male | Female |
| 5 to 17 Years | 0 (0.0%) | 0 (0.0%) |
| 18 to 34 Years | 0 (0.0%) | 0 (0.0%) |
| 35 to 64 Years | 13 (0.7%) | 7 (0.4%) |
| 65 to 74 Years | 65 (11.0%) | 199 (19.2%) |
| 75 Years and over | 200 (32.8%) | 171 (19.0%) |
Disability Class: Self-Care Difficulty
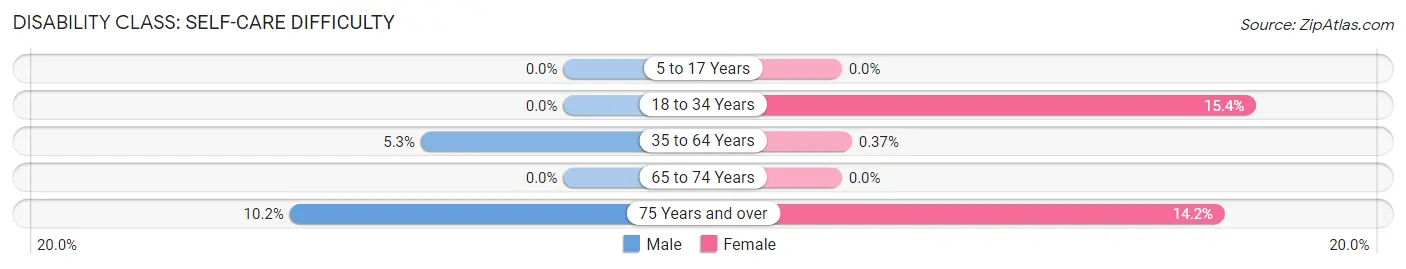
| Age Bracket | Male | Female |
| 5 to 17 Years | 0 (0.0%) | 0 (0.0%) |
| 18 to 34 Years | 0 (0.0%) | 82 (15.4%) |
| 35 to 64 Years | 97 (5.3%) | 7 (0.4%) |
| 65 to 74 Years | 0 (0.0%) | 0 (0.0%) |
| 75 Years and over | 62 (10.2%) | 128 (14.2%) |
Technology Access in Fairview
Computing Device Access in Fairview
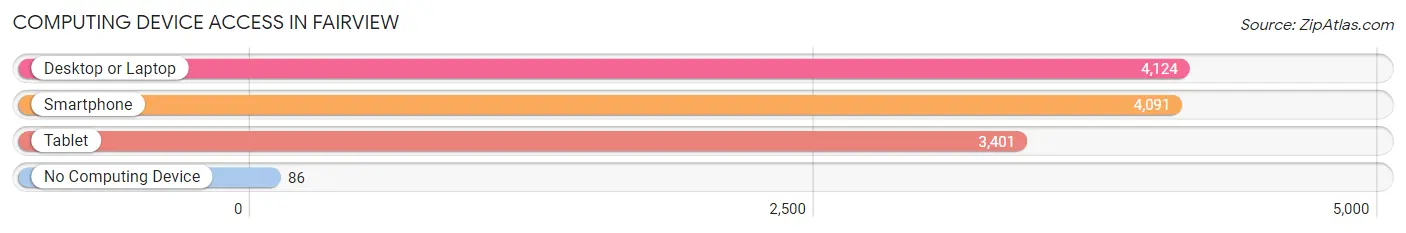
| Device Type | # Households | % Households |
| Desktop or Laptop | 4,124 | 95.6% |
| Smartphone | 4,091 | 94.9% |
| Tablet | 3,401 | 78.8% |
| No Computing Device | 86 | 2.0% |
| Total | 4,313 | 100.0% |
Internet Access in Fairview
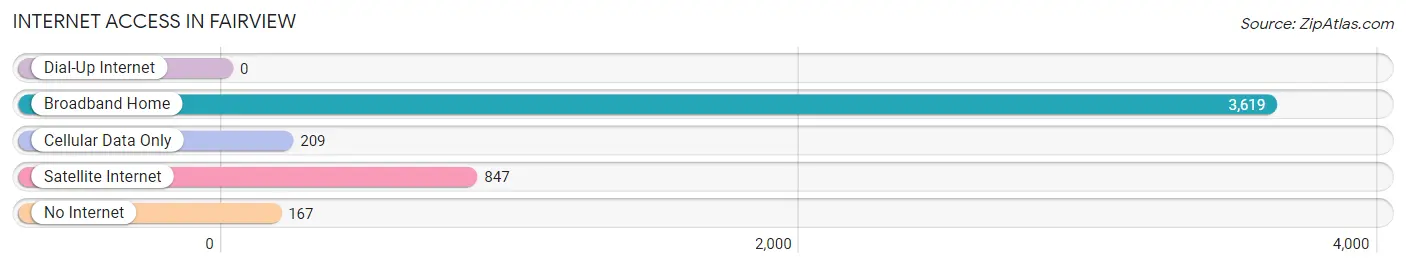
| Internet Type | # Households | % Households |
| Dial-Up Internet | 0 | 0.0% |
| Broadband Home | 3,619 | 83.9% |
| Cellular Data Only | 209 | 4.9% |
| Satellite Internet | 847 | 19.6% |
| No Internet | 167 | 3.9% |
| Total | 4,313 | 100.0% |
Fairview Summary
History
The small town of Fairview, Texas is located in Collin County, about 30 miles northeast of Dallas. The town was founded in 1872 by a group of settlers from Kentucky, led by William and Mary Fair. The town was originally called Fair’s View, but the name was later changed to Fairview. The town was incorporated in 1876 and has remained a small, rural community ever since.
The town was originally an agricultural community, with cotton and corn being the main crops. In the early 1900s, the town began to grow and develop, with the construction of a railroad line and the opening of a post office. The town also had a school, a bank, and several stores.
In the 1950s, the town began to experience a population boom, as people moved to the area from other parts of the state. This growth continued into the 1960s and 1970s, as the town became a popular bedroom community for people who worked in Dallas.
Geography
Fairview is located in Collin County, about 30 miles northeast of Dallas. The town is situated on the banks of the East Fork of the Trinity River. The town is surrounded by rolling hills and is located in the Blackland Prairie region of Texas. The climate in Fairview is hot and humid in the summer and mild in the winter.
The town covers an area of about 4.5 square miles and has a population of about 5,000 people. The town is served by two major highways, US Highway 75 and State Highway 5.
Economy
The economy of Fairview is largely based on agriculture and tourism. The town is home to several farms, which produce cotton, corn, and other crops. The town also has several small businesses, including restaurants, retail stores, and service providers.
The town is also home to several tourist attractions, including the Fairview Historical Museum, the Fairview Nature Center, and the Fairview Country Club. The town also hosts several annual events, such as the Fairview Festival and the Fairview Rodeo.
Demographics
As of the 2010 census, the population of Fairview was 5,000 people. The racial makeup of the town was 87.3% White, 5.2% African American, 0.7% Native American, 0.7% Asian, and 4.9% from other races. The median household income was $50,000 and the median age was 37.
The town is served by the Fairview Independent School District, which includes two elementary schools, one middle school, and one high school. The town is also home to several churches, including the First Baptist Church of Fairview and the Fairview United Methodist Church.
Common Questions
What is Per Capita Income in Fairview?
Per Capita income in Fairview is $61,139.
What is the Median Family Income in Fairview?
Median Family Income in Fairview is $131,476.
What is the Median Household income in Fairview?
Median Household Income in Fairview is $103,219.
What is Income or Wage Gap in Fairview?
Income or Wage Gap in Fairview is 57.7%.
Women in Fairview earn 42.3 cents for every dollar earned by a man.
What is Family Income Deficit in Fairview?
Family Income Deficit in Fairview is $15,738.
Families that are below poverty line in Fairview earn $15,738 less on average than the poverty threshold level.
What is Inequality or Gini Index in Fairview?
Inequality or Gini Index in Fairview is 0.47.
What is the Total Population of Fairview?
Total Population of Fairview is 10,354.
What is the Total Male Population of Fairview?
Total Male Population of Fairview is 4,473.
What is the Total Female Population of Fairview?
Total Female Population of Fairview is 5,881.
What is the Ratio of Males per 100 Females in Fairview?
There are 76.06 Males per 100 Females in Fairview.
What is the Ratio of Females per 100 Males in Fairview?
There are 131.48 Females per 100 Males in Fairview.
What is the Median Population Age in Fairview?
Median Population Age in Fairview is 49.6 Years.
What is the Average Family Size in Fairview
Average Family Size in Fairview is 3.0 People.
What is the Average Household Size in Fairview
Average Household Size in Fairview is 2.4 People.
How Large is the Labor Force in Fairview?
There are 4,048 People in the Labor Forcein in Fairview.
What is the Percentage of People in the Labor Force in Fairview?
47.8% of People are in the Labor Force in Fairview.
What is the Unemployment Rate in Fairview?
Unemployment Rate in Fairview is 2.0%.