Round Top, TX Map & Demographics
Round Top Map
Round Top Overview
$191,799
PER CAPITA INCOME
$195,625
AVG FAMILY INCOME
$155,000
AVG HOUSEHOLD INCOME
0.70
INEQUALITY / GINI INDEX
111
TOTAL POPULATION
53
MALE POPULATION
58
FEMALE POPULATION
91.38
MALES / 100 FEMALES
109.43
FEMALES / 100 MALES
56.5
MEDIAN AGE
2.9
AVG FAMILY SIZE
2.3
AVG HOUSEHOLD SIZE
62
LABOR FORCE [ PEOPLE ]
61.4%
PERCENT IN LABOR FORCE
Round Top Zip Codes
Round Top Area Codes
Income in Round Top
Income Overview in Round Top
Per Capita Income in Round Top is $191,799, while median incomes of families and households are $195,625 and $155,000 respectively.
| Characteristic | Number | Measure |
| Per Capita Income | 111 | $191,799 |
| Median Family Income | 33 | $195,625 |
| Mean Family Income | 33 | $573,691 |
| Median Household Income | 48 | $155,000 |
| Mean Household Income | 48 | $445,719 |
| Income Deficit | 33 | $0 |
| Wage / Income Gap (%) | 111 | 0.00% |
| Wage / Income Gap ($) | 111 | 100.00¢ per $1 |
| Gini / Inequality Index | 111 | 0.70 |
Earnings by Sex in Round Top
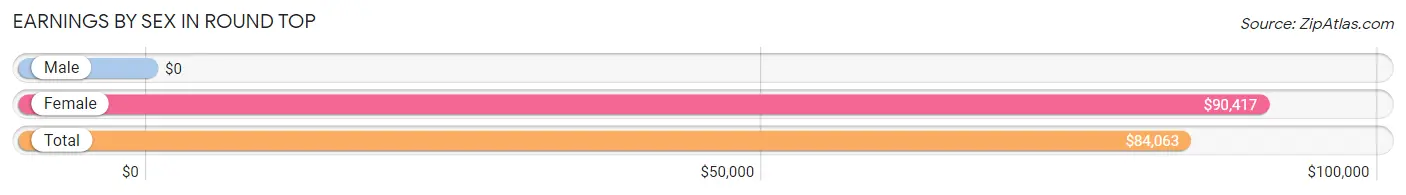
| Sex | Number | Average Earnings |
| Male | 39 (60.0%) | $0 |
| Female | 26 (40.0%) | $90,417 |
| Total | 65 (100.0%) | $84,063 |
Earnings by Sex by Income Bracket in Round Top
The most common earnings brackets in Round Top are $45,000 to $49,999 for men (13 | 33.3%) and $75,000 to $99,999 for women (12 | 46.2%).
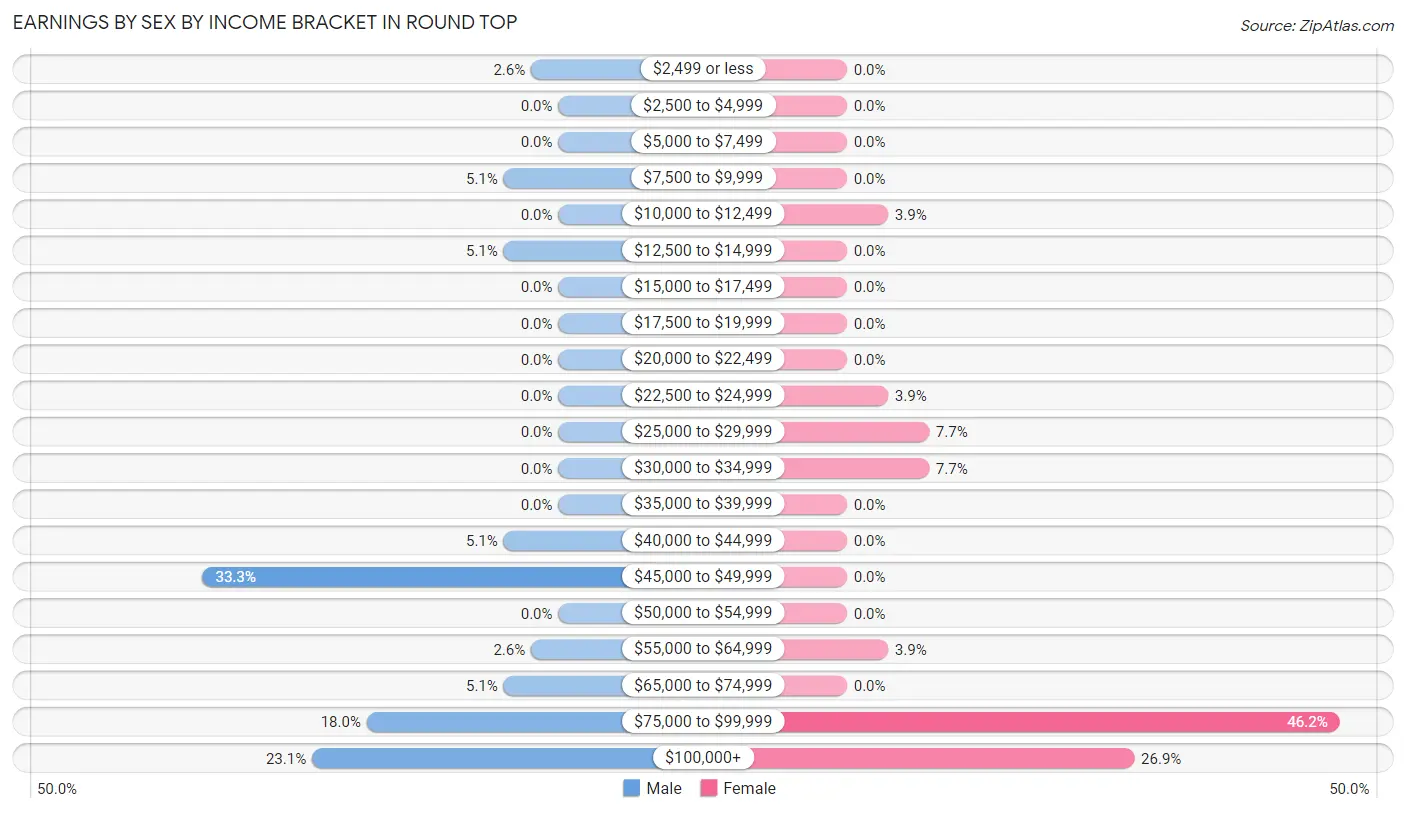
| Income | Male | Female |
| $2,499 or less | 1 (2.6%) | 0 (0.0%) |
| $2,500 to $4,999 | 0 (0.0%) | 0 (0.0%) |
| $5,000 to $7,499 | 0 (0.0%) | 0 (0.0%) |
| $7,500 to $9,999 | 2 (5.1%) | 0 (0.0%) |
| $10,000 to $12,499 | 0 (0.0%) | 1 (3.8%) |
| $12,500 to $14,999 | 2 (5.1%) | 0 (0.0%) |
| $15,000 to $17,499 | 0 (0.0%) | 0 (0.0%) |
| $17,500 to $19,999 | 0 (0.0%) | 0 (0.0%) |
| $20,000 to $22,499 | 0 (0.0%) | 0 (0.0%) |
| $22,500 to $24,999 | 0 (0.0%) | 1 (3.8%) |
| $25,000 to $29,999 | 0 (0.0%) | 2 (7.7%) |
| $30,000 to $34,999 | 0 (0.0%) | 2 (7.7%) |
| $35,000 to $39,999 | 0 (0.0%) | 0 (0.0%) |
| $40,000 to $44,999 | 2 (5.1%) | 0 (0.0%) |
| $45,000 to $49,999 | 13 (33.3%) | 0 (0.0%) |
| $50,000 to $54,999 | 0 (0.0%) | 0 (0.0%) |
| $55,000 to $64,999 | 1 (2.6%) | 1 (3.8%) |
| $65,000 to $74,999 | 2 (5.1%) | 0 (0.0%) |
| $75,000 to $99,999 | 7 (17.9%) | 12 (46.2%) |
| $100,000+ | 9 (23.1%) | 7 (26.9%) |
| Total | 39 (100.0%) | 26 (100.0%) |
Earnings by Sex by Educational Attainment in Round Top
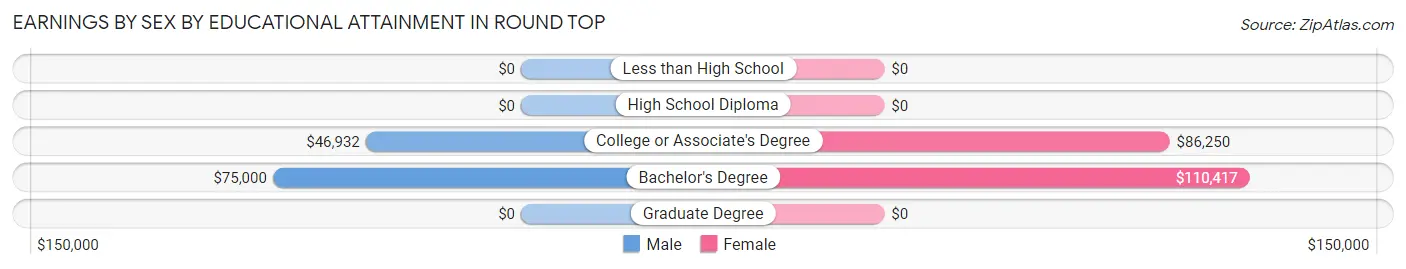
| Educational Attainment | Male Income | Female Income |
| Less than High School | - | - |
| High School Diploma | - | - |
| College or Associate's Degree | $46,932 | $86,250 |
| Bachelor's Degree | $75,000 | $110,417 |
| Graduate Degree | - | - |
| Total | - | - |
Family Income in Round Top
Family Income Brackets in Round Top
According to the Round Top family income data, there are 15 families falling into the $200,000+ income range, which is the most common income bracket and makes up 45.5% of all families.
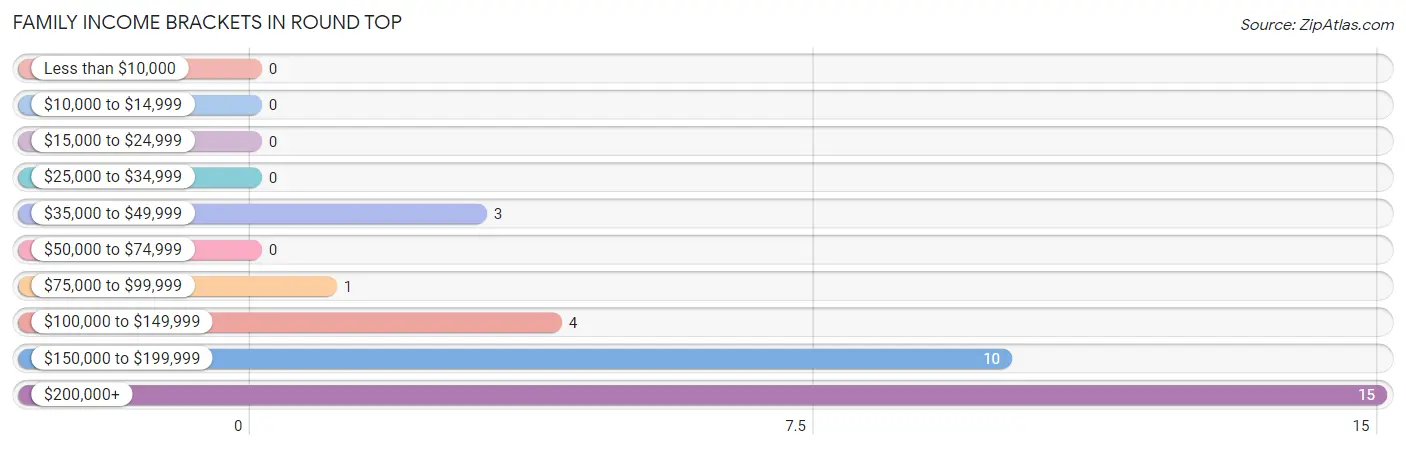
| Income Bracket | # Families | % Families |
| Less than $10,000 | 0 | 0.0% |
| $10,000 to $14,999 | 0 | 0.0% |
| $15,000 to $24,999 | 0 | 0.0% |
| $25,000 to $34,999 | 0 | 0.0% |
| $35,000 to $49,999 | 3 | 9.1% |
| $50,000 to $74,999 | 0 | 0.0% |
| $75,000 to $99,999 | 1 | 3.0% |
| $100,000 to $149,999 | 4 | 12.1% |
| $150,000 to $199,999 | 10 | 30.3% |
| $200,000+ | 15 | 45.5% |
Family Income by Famaliy Size in Round Top
2-person families (22 | 66.7%) account for the highest median family income in Round Top with $196,250 per family, while 2-person families (22 | 66.7%) have the highest median income of $98,125 per family member.
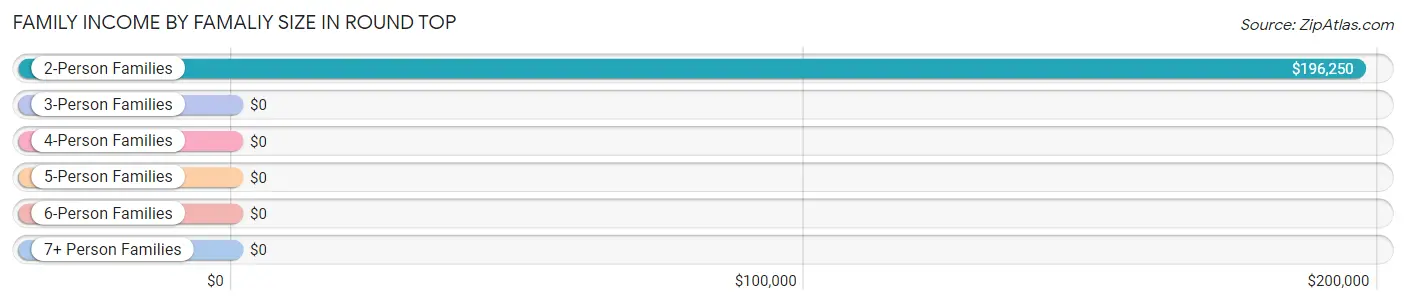
| Income Bracket | # Families | Median Income |
| 2-Person Families | 22 (66.7%) | $196,250 |
| 3-Person Families | 7 (21.2%) | $0 |
| 4-Person Families | 2 (6.1%) | $0 |
| 5-Person Families | 2 (6.1%) | $0 |
| 6-Person Families | 0 (0.0%) | $0 |
| 7+ Person Families | 0 (0.0%) | $0 |
| Total | 33 (100.0%) | $195,625 |
Family Income by Number of Earners in Round Top
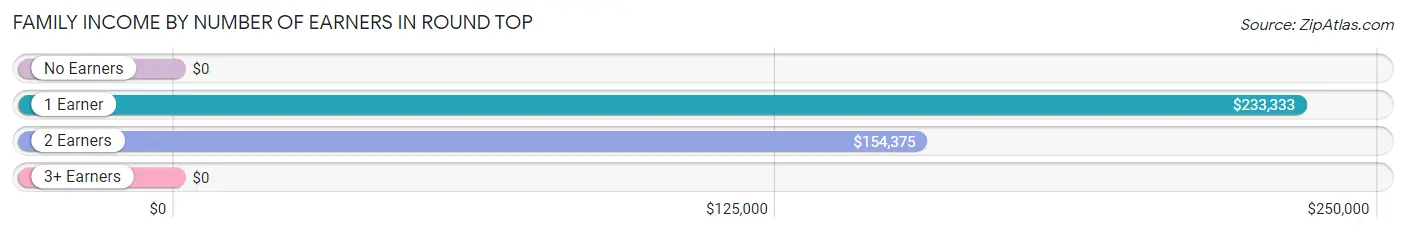
| Number of Earners | # Families | Median Income |
| No Earners | 3 (9.1%) | $0 |
| 1 Earner | 16 (48.5%) | $233,333 |
| 2 Earners | 9 (27.3%) | $154,375 |
| 3+ Earners | 5 (15.1%) | $0 |
| Total | 33 (100.0%) | $195,625 |
Household Income in Round Top
Household Income Brackets in Round Top
With 17 households falling in the category, the $200,000+ income range is the most frequent in Round Top, accounting for 35.4% of all households.
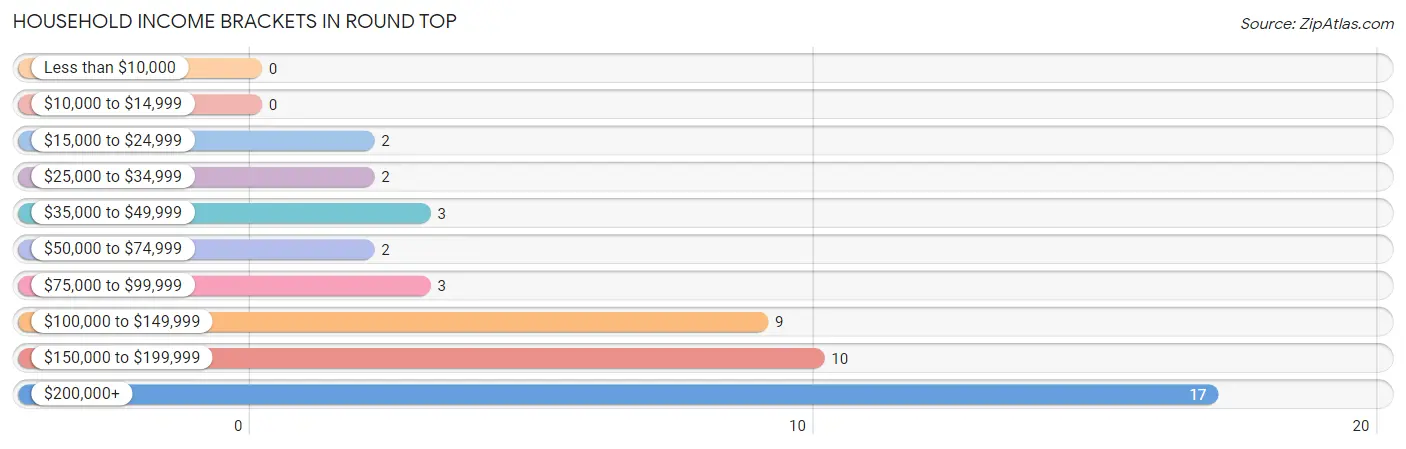
| Income Bracket | # Households | % Households |
| Less than $10,000 | 0 | 0.0% |
| $10,000 to $14,999 | 0 | 0.0% |
| $15,000 to $24,999 | 2 | 4.2% |
| $25,000 to $34,999 | 2 | 4.2% |
| $35,000 to $49,999 | 3 | 6.3% |
| $50,000 to $74,999 | 2 | 4.2% |
| $75,000 to $99,999 | 3 | 6.3% |
| $100,000 to $149,999 | 9 | 18.8% |
| $150,000 to $199,999 | 10 | 20.8% |
| $200,000+ | 17 | 35.4% |
Household Income by Householder Age in Round Top
The median household income in Round Top is $155,000, with the highest median household income of $226,000 found in the 45 to 64 years age bracket for the primary householder. A total of 18 households (37.5%) fall into this category.
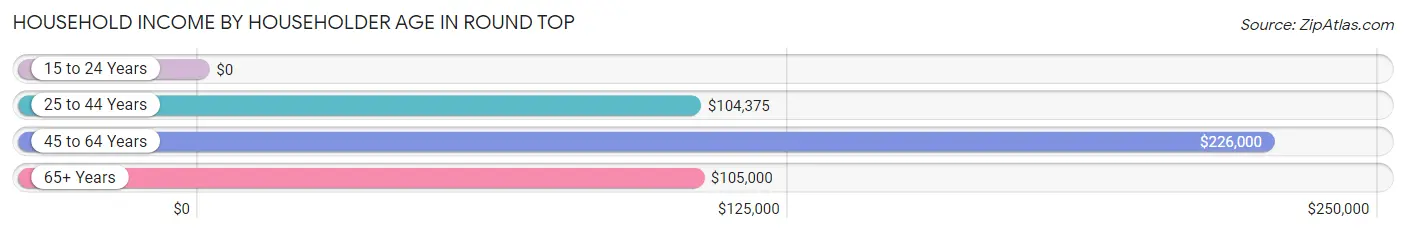
| Income Bracket | # Households | Median Income |
| 15 to 24 Years | 0 (0.0%) | $0 |
| 25 to 44 Years | 6 (12.5%) | $104,375 |
| 45 to 64 Years | 18 (37.5%) | $226,000 |
| 65+ Years | 24 (50.0%) | $105,000 |
| Total | 48 (100.0%) | $155,000 |
Poverty in Round Top
Income Below Poverty by Sex and Age in Round Top
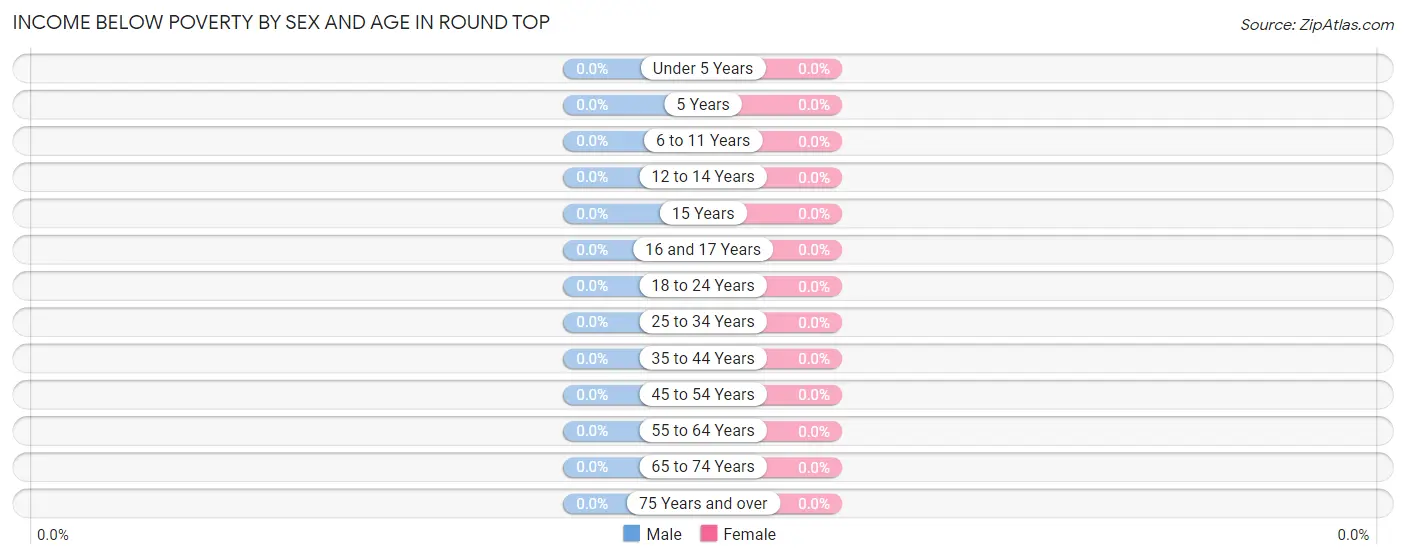
| Age Bracket | Male | Female |
| Under 5 Years | 0 (0.0%) | 0 (0.0%) |
| 5 Years | 0 (0.0%) | 0 (0.0%) |
| 6 to 11 Years | 0 (0.0%) | 0 (0.0%) |
| 12 to 14 Years | 0 (0.0%) | 0 (0.0%) |
| 15 Years | 0 (0.0%) | 0 (0.0%) |
| 16 and 17 Years | 0 (0.0%) | 0 (0.0%) |
| 18 to 24 Years | 0 (0.0%) | 0 (0.0%) |
| 25 to 34 Years | 0 (0.0%) | 0 (0.0%) |
| 35 to 44 Years | 0 (0.0%) | 0 (0.0%) |
| 45 to 54 Years | 0 (0.0%) | 0 (0.0%) |
| 55 to 64 Years | 0 (0.0%) | 0 (0.0%) |
| 65 to 74 Years | 0 (0.0%) | 0 (0.0%) |
| 75 Years and over | 0 (0.0%) | 0 (0.0%) |
| Total | 0 (0.0%) | 0 (0.0%) |
Income Above Poverty by Sex and Age in Round Top
According to the poverty statistics in Round Top, males aged 6 to 11 years and females aged 6 to 11 years are the age groups that are most secure financially, with 100.0% of males and 100.0% of females in these age groups living above the poverty line.
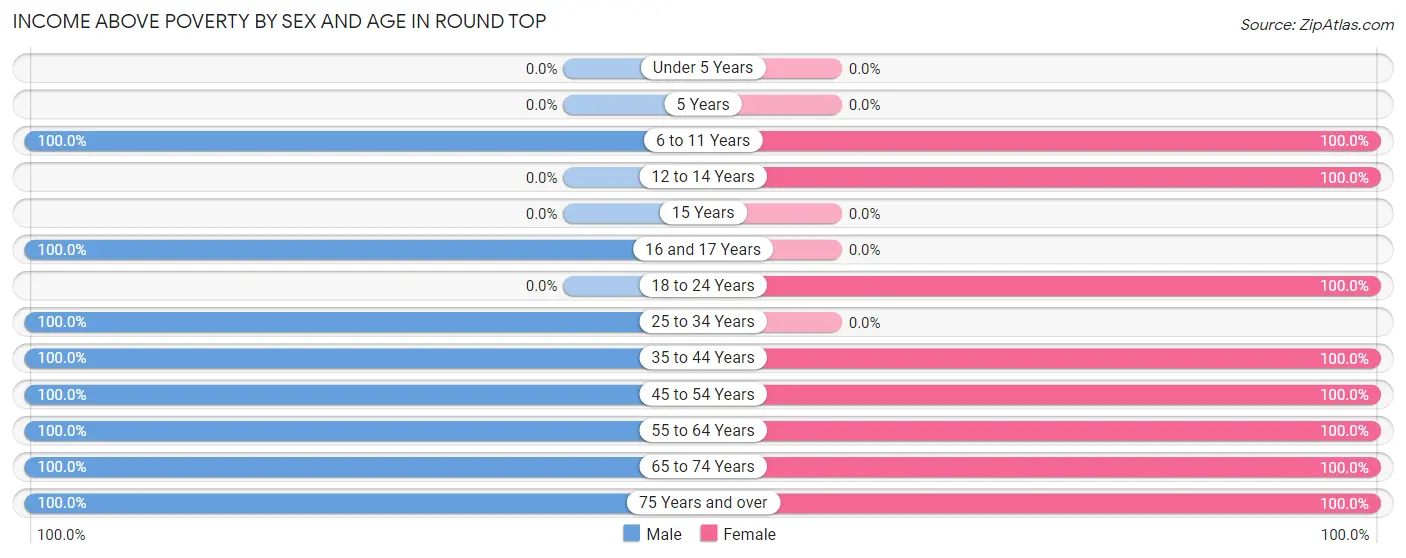
| Age Bracket | Male | Female |
| Under 5 Years | 0 (0.0%) | 0 (0.0%) |
| 5 Years | 0 (0.0%) | 0 (0.0%) |
| 6 to 11 Years | 3 (100.0%) | 5 (100.0%) |
| 12 to 14 Years | 0 (0.0%) | 2 (100.0%) |
| 15 Years | 0 (0.0%) | 0 (0.0%) |
| 16 and 17 Years | 2 (100.0%) | 0 (0.0%) |
| 18 to 24 Years | 0 (0.0%) | 2 (100.0%) |
| 25 to 34 Years | 13 (100.0%) | 0 (0.0%) |
| 35 to 44 Years | 4 (100.0%) | 6 (100.0%) |
| 45 to 54 Years | 3 (100.0%) | 9 (100.0%) |
| 55 to 64 Years | 14 (100.0%) | 13 (100.0%) |
| 65 to 74 Years | 9 (100.0%) | 20 (100.0%) |
| 75 Years and over | 5 (100.0%) | 1 (100.0%) |
| Total | 53 (100.0%) | 58 (100.0%) |
Income Below Poverty Among Married-Couple Families in Round Top
| Children | Above Poverty | Below Poverty |
| No Children | 27 (100.0%) | 0 (0.0%) |
| 1 or 2 Children | 4 (100.0%) | 0 (0.0%) |
| 3 or 4 Children | 2 (100.0%) | 0 (0.0%) |
| 5 or more Children | 0 (0.0%) | 0 (0.0%) |
| Total | 33 (100.0%) | 0 (0.0%) |
Income Below Poverty Among Single-Parent Households in Round Top
| Children | Single Father | Single Mother |
| No Children | 0 (0.0%) | 0 (0.0%) |
| 1 or 2 Children | 0 (0.0%) | 0 (0.0%) |
| 3 or 4 Children | 0 (0.0%) | 0 (0.0%) |
| 5 or more Children | 0 (0.0%) | 0 (0.0%) |
| Total | 0 (0.0%) | 0 (0.0%) |
Income Below Poverty Among Married-Couple vs Single-Parent Households in Round Top
| Children | Married-Couple Families | Single-Parent Households |
| No Children | 0 (0.0%) | 0 (0.0%) |
| 1 or 2 Children | 0 (0.0%) | 0 (0.0%) |
| 3 or 4 Children | 0 (0.0%) | 0 (0.0%) |
| 5 or more Children | 0 (0.0%) | 0 (0.0%) |
| Total | 0 (0.0%) | 0 (0.0%) |
Race in Round Top
The most populous races in Round Top are White / Caucasian (95 | 85.6%), Hispanic or Latino (14 | 12.6%), and Two or more Races (12 | 10.8%).
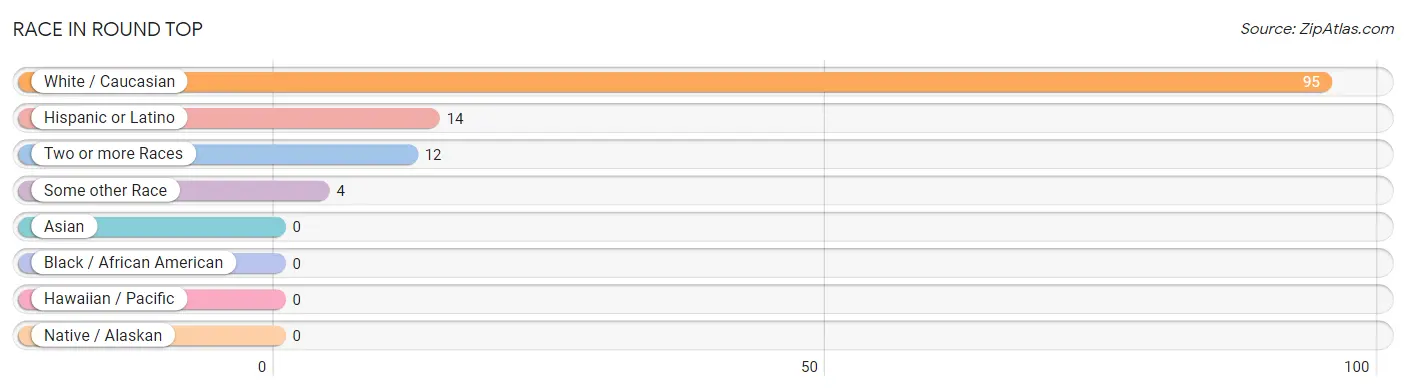
| Race | # Population | % Population |
| Asian | 0 | 0.0% |
| Black / African American | 0 | 0.0% |
| Hawaiian / Pacific | 0 | 0.0% |
| Hispanic or Latino | 14 | 12.6% |
| Native / Alaskan | 0 | 0.0% |
| White / Caucasian | 95 | 85.6% |
| Two or more Races | 12 | 10.8% |
| Some other Race | 4 | 3.6% |
| Total | 111 | 100.0% |
Ancestry in Round Top
The most populous ancestries reported in Round Top are German (50 | 45.1%), English (28 | 25.2%), Mexican (12 | 10.8%), European (9 | 8.1%), and American (6 | 5.4%), together accounting for 94.6% of all Round Top residents.
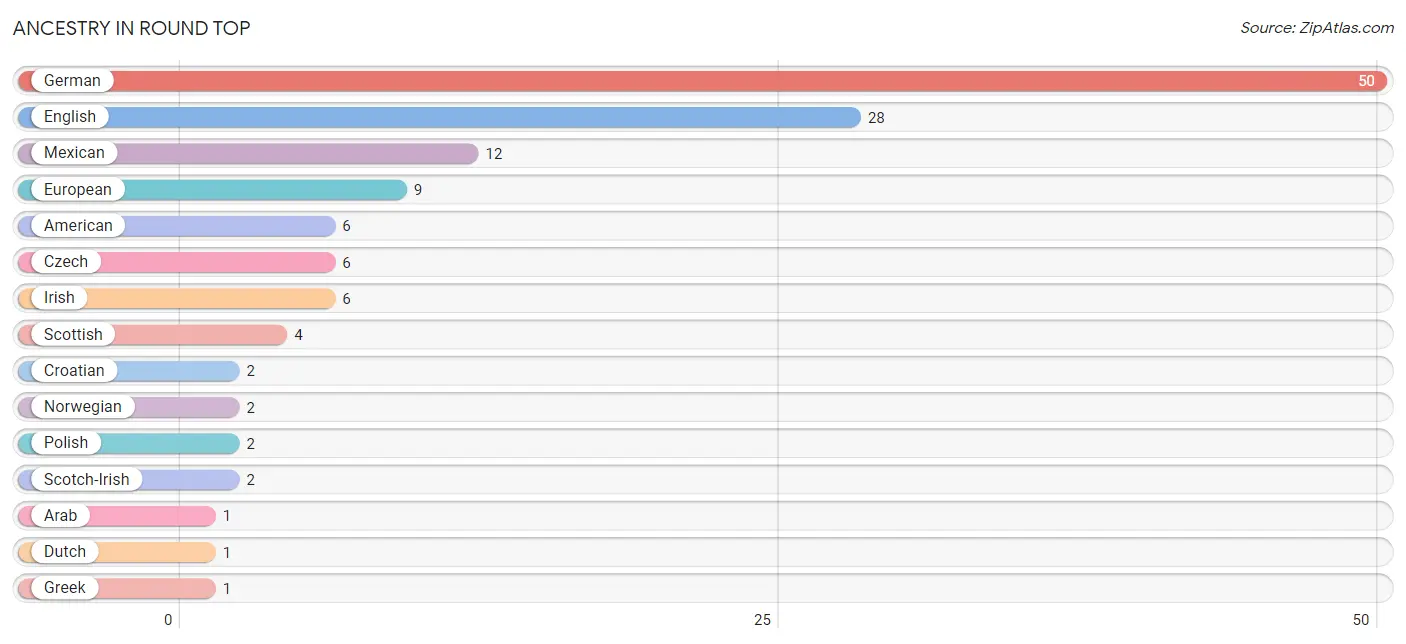
| Ancestry | # Population | % Population |
| American | 6 | 5.4% |
| Arab | 1 | 0.9% |
| Croatian | 2 | 1.8% |
| Czech | 6 | 5.4% |
| Dutch | 1 | 0.9% |
| English | 28 | 25.2% |
| European | 9 | 8.1% |
| German | 50 | 45.1% |
| Greek | 1 | 0.9% |
| Irish | 6 | 5.4% |
| Lebanese | 1 | 0.9% |
| Mexican | 12 | 10.8% |
| Norwegian | 2 | 1.8% |
| Polish | 2 | 1.8% |
| Scotch-Irish | 2 | 1.8% |
| Scottish | 4 | 3.6% | View All 16 Rows |
Immigrants in Round Top
The most numerous immigrant groups reported in Round Top came from Africa (1 | 0.9%), and South Africa (1 | 0.9%), together accounting for 1.8% of all Round Top residents.
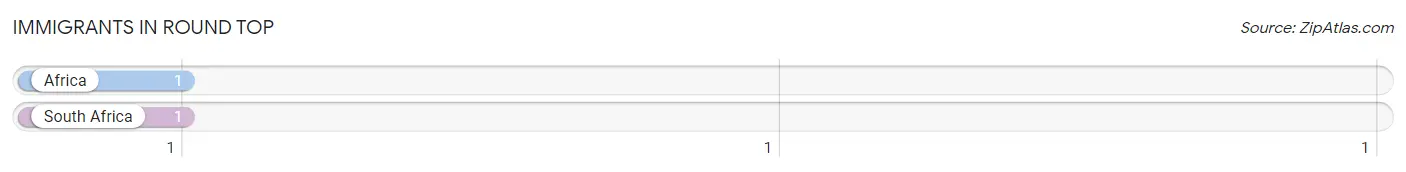
| Immigration Origin | # Population | % Population |
| Africa | 1 | 0.9% |
| South Africa | 1 | 0.9% | View All 2 Rows |
Sex and Age in Round Top
Sex and Age in Round Top
The most populous age groups in Round Top are 25 to 29 Years (11 | 20.7%) for men and 70 to 74 Years (12 | 20.7%) for women.
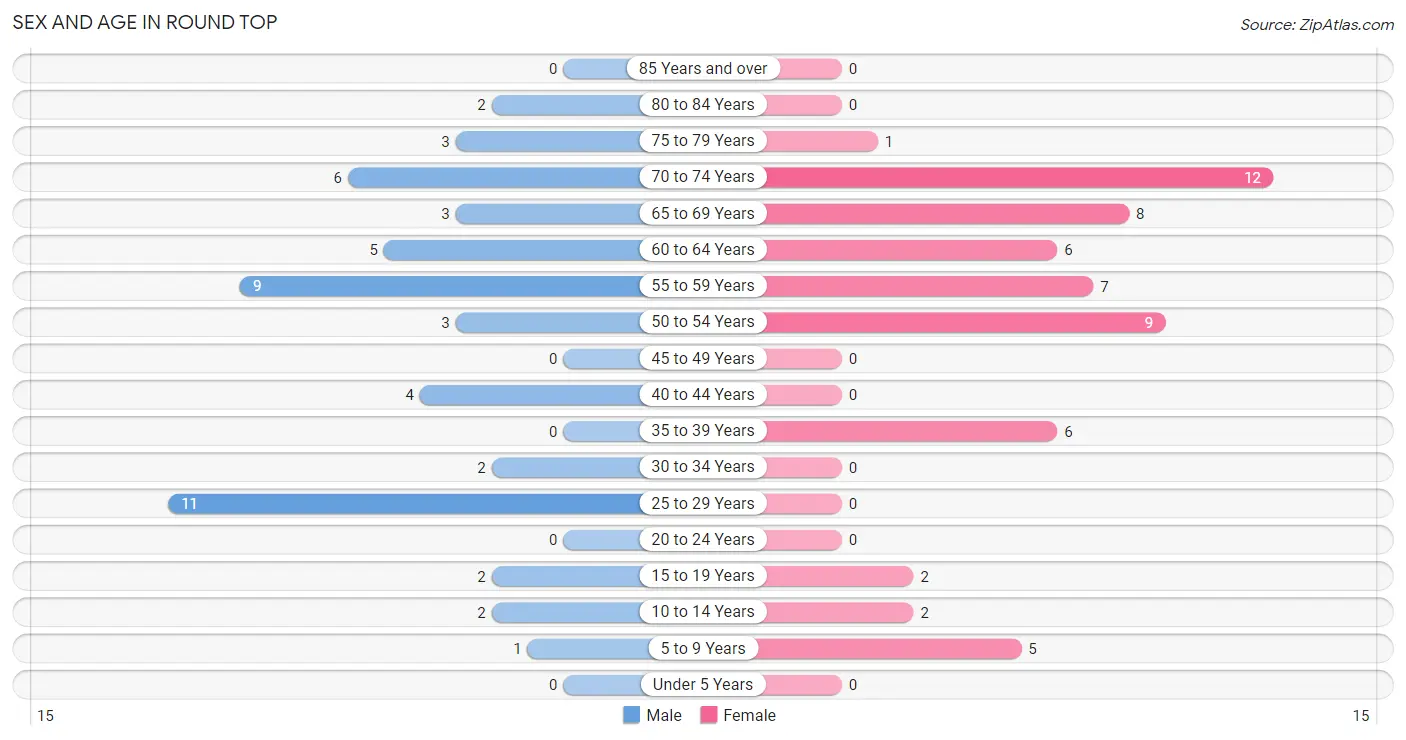
| Age Bracket | Male | Female |
| Under 5 Years | 0 (0.0%) | 0 (0.0%) |
| 5 to 9 Years | 1 (1.9%) | 5 (8.6%) |
| 10 to 14 Years | 2 (3.8%) | 2 (3.5%) |
| 15 to 19 Years | 2 (3.8%) | 2 (3.5%) |
| 20 to 24 Years | 0 (0.0%) | 0 (0.0%) |
| 25 to 29 Years | 11 (20.7%) | 0 (0.0%) |
| 30 to 34 Years | 2 (3.8%) | 0 (0.0%) |
| 35 to 39 Years | 0 (0.0%) | 6 (10.3%) |
| 40 to 44 Years | 4 (7.5%) | 0 (0.0%) |
| 45 to 49 Years | 0 (0.0%) | 0 (0.0%) |
| 50 to 54 Years | 3 (5.7%) | 9 (15.5%) |
| 55 to 59 Years | 9 (17.0%) | 7 (12.1%) |
| 60 to 64 Years | 5 (9.4%) | 6 (10.3%) |
| 65 to 69 Years | 3 (5.7%) | 8 (13.8%) |
| 70 to 74 Years | 6 (11.3%) | 12 (20.7%) |
| 75 to 79 Years | 3 (5.7%) | 1 (1.7%) |
| 80 to 84 Years | 2 (3.8%) | 0 (0.0%) |
| 85 Years and over | 0 (0.0%) | 0 (0.0%) |
| Total | 53 (100.0%) | 58 (100.0%) |
Families and Households in Round Top
Median Family Size in Round Top
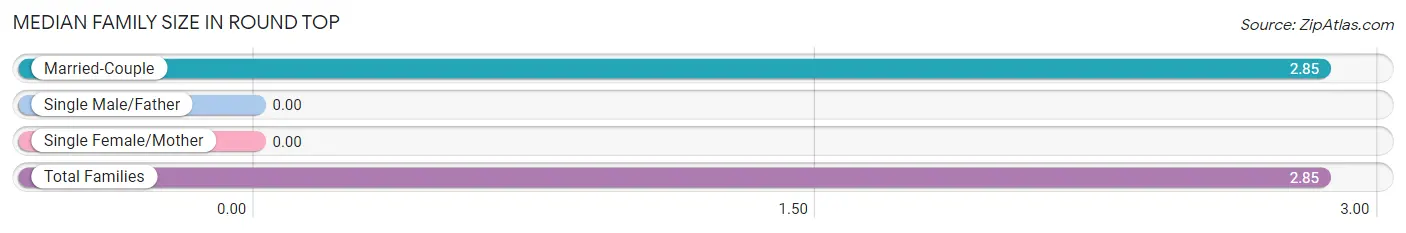
| Family Type | # Families | Family Size |
| Married-Couple | 33 (100.0%) | 2.85 |
| Single Male/Father | 0 (0.0%) | - |
| Single Female/Mother | 0 (0.0%) | - |
| Total Families | 33 (100.0%) | 2.85 |
Median Household Size in Round Top
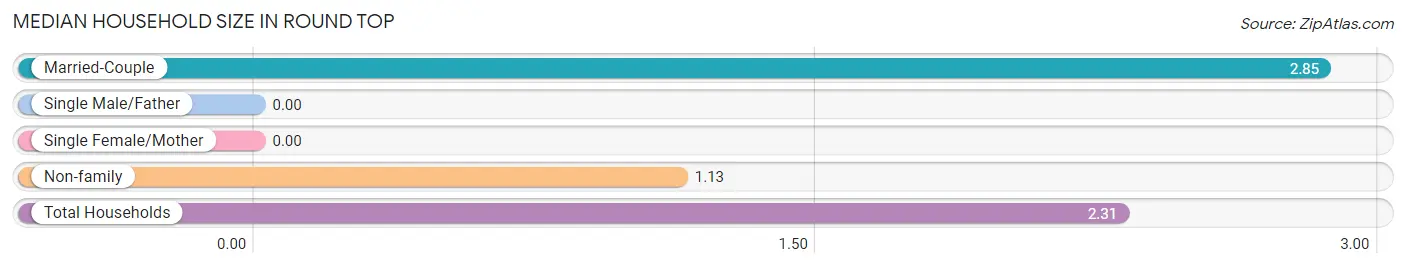
| Household Type | # Households | Household Size |
| Married-Couple | 33 (68.8%) | 2.85 |
| Single Male/Father | 0 (0.0%) | - |
| Single Female/Mother | 0 (0.0%) | - |
| Non-family | 15 (31.2%) | 1.13 |
| Total Households | 48 (100.0%) | 2.31 |
Household Size by Marriage Status in Round Top
Out of a total of 48 households in Round Top, 33 (68.8%) are family households, while 15 (31.2%) are nonfamily households. The most numerous type of family households are 2-person households, comprising 22, and the most common type of nonfamily households are 1-person households, comprising 12.
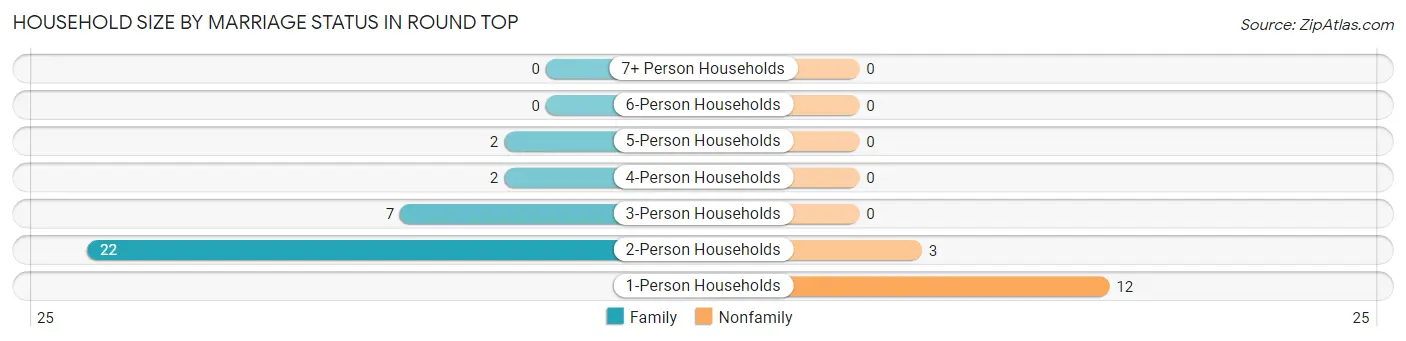
| Household Size | Family Households | Nonfamily Households |
| 1-Person Households | - | 12 (25.0%) |
| 2-Person Households | 22 (45.8%) | 3 (6.2%) |
| 3-Person Households | 7 (14.6%) | 0 (0.0%) |
| 4-Person Households | 2 (4.2%) | 0 (0.0%) |
| 5-Person Households | 2 (4.2%) | 0 (0.0%) |
| 6-Person Households | 0 (0.0%) | 0 (0.0%) |
| 7+ Person Households | 0 (0.0%) | 0 (0.0%) |
| Total | 33 (68.8%) | 15 (31.2%) |
Female Fertility in Round Top
Fertility by Age in Round Top
| Age Bracket | Women with Births | Births / 1,000 Women |
| 15 to 19 years | 0 (0.0%) | 0.0 |
| 20 to 34 years | 0 (0.0%) | 0.0 |
| 35 to 50 years | 0 (0.0%) | 0.0 |
| Total | 0 (0.0%) | 0.0 |
Fertility by Age by Marriage Status in Round Top
| Age Bracket | Married | Unmarried |
| 15 to 19 years | 0 (0.0%) | 0 (0.0%) |
| 20 to 34 years | 0 (0.0%) | 0 (0.0%) |
| 35 to 50 years | 0 (0.0%) | 0 (0.0%) |
| Total | 0 (0.0%) | 0 (0.0%) |
Fertility by Education in Round Top
| Educational Attainment | Women with Births | Births / 1,000 Women |
| Less than High School | 0 (0.0%) | 0.0 |
| High School Diploma | 0 (0.0%) | 0.0 |
| College or Associate's Degree | 0 (0.0%) | 0.0 |
| Bachelor's Degree | 0 (0.0%) | 0.0 |
| Graduate Degree | 0 (0.0%) | 0.0 |
| Total | 0 (0.0%) | 0.0 |
Fertility by Education by Marriage Status in Round Top
| Educational Attainment | Married | Unmarried |
| Less than High School | 0 (0.0%) | 0 (0.0%) |
| High School Diploma | 0 (0.0%) | 0 (0.0%) |
| College or Associate's Degree | 0 (0.0%) | 0 (0.0%) |
| Bachelor's Degree | 0 (0.0%) | 0 (0.0%) |
| Graduate Degree | 0 (0.0%) | 0 (0.0%) |
| Total | 0 (0.0%) | 0 (0.0%) |
Employment Characteristics in Round Top
Employment by Class of Employer in Round Top
Among the 62 employed individuals in Round Top, private company employees (26 | 41.9%), local government employees (11 | 17.7%), and self-employed (not incorporated) (9 | 14.5%) make up the most common classes of employment.
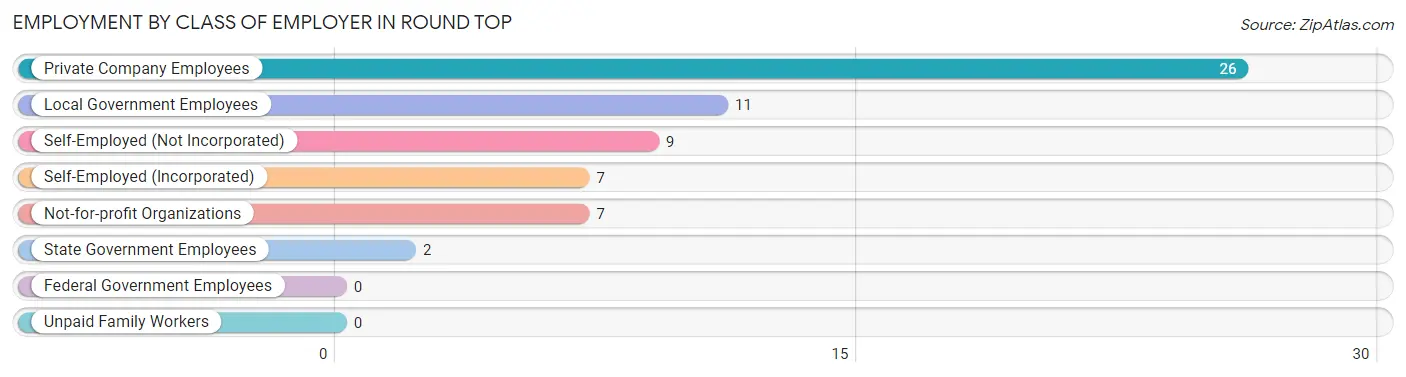
| Employer Class | # Employees | % Employees |
| Private Company Employees | 26 | 41.9% |
| Self-Employed (Incorporated) | 7 | 11.3% |
| Self-Employed (Not Incorporated) | 9 | 14.5% |
| Not-for-profit Organizations | 7 | 11.3% |
| Local Government Employees | 11 | 17.7% |
| State Government Employees | 2 | 3.2% |
| Federal Government Employees | 0 | 0.0% |
| Unpaid Family Workers | 0 | 0.0% |
| Total | 62 | 100.0% |
Employment Status by Age in Round Top
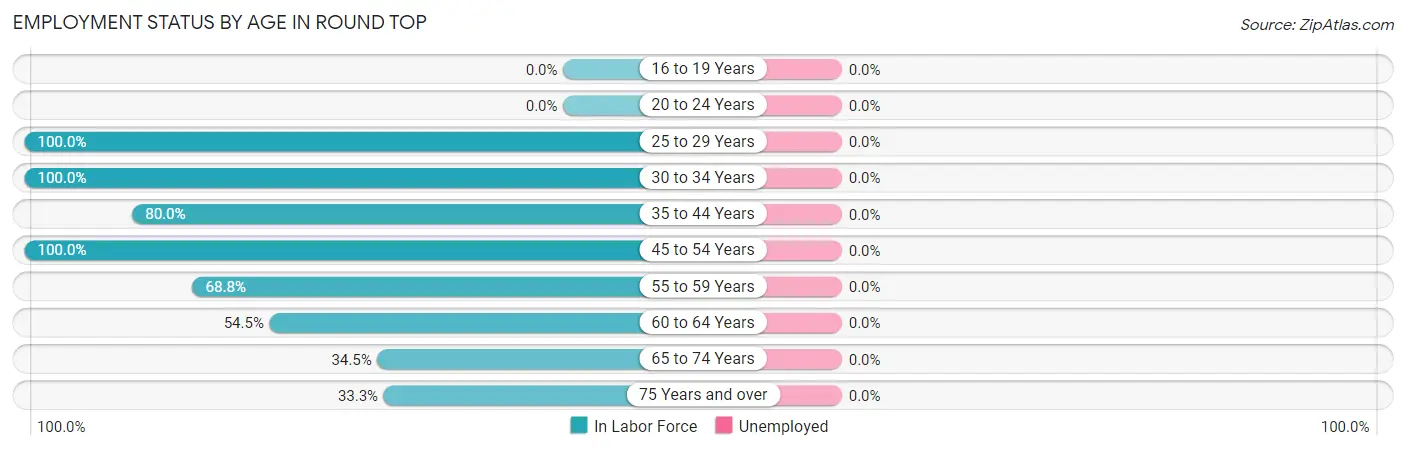
| Age Bracket | In Labor Force | Unemployed |
| 16 to 19 Years | 0 (0.0%) | 0 (0.0%) |
| 20 to 24 Years | 0 (0.0%) | 0 (0.0%) |
| 25 to 29 Years | 11 (100.0%) | 0 (0.0%) |
| 30 to 34 Years | 2 (100.0%) | 0 (0.0%) |
| 35 to 44 Years | 8 (80.0%) | 0 (0.0%) |
| 45 to 54 Years | 12 (100.0%) | 0 (0.0%) |
| 55 to 59 Years | 11 (68.8%) | 0 (0.0%) |
| 60 to 64 Years | 6 (54.5%) | 0 (0.0%) |
| 65 to 74 Years | 10 (34.5%) | 0 (0.0%) |
| 75 Years and over | 2 (33.3%) | 0 (0.0%) |
| Total | 62 (61.4%) | 0 (0.0%) |
Employment Status by Educational Attainment in Round Top
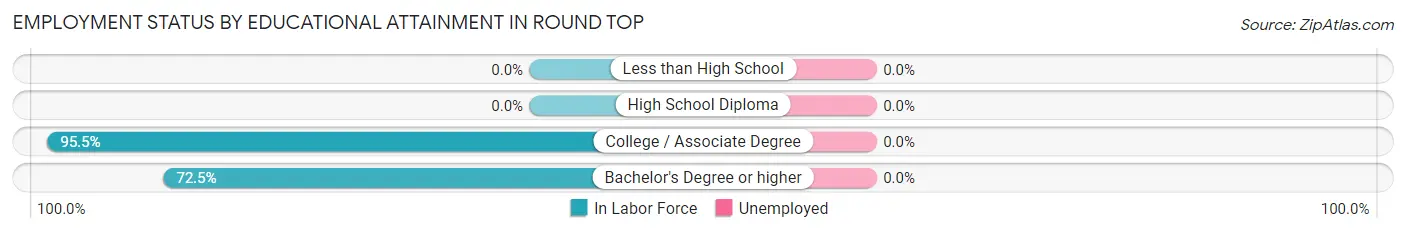
| Educational Attainment | In Labor Force | Unemployed |
| Less than High School | 0 (0.0%) | 0 (0.0%) |
| High School Diploma | 0 (0.0%) | 0 (0.0%) |
| College / Associate Degree | 21 (95.5%) | 0 (0.0%) |
| Bachelor's Degree or higher | 29 (72.5%) | 0 (0.0%) |
| Total | 50 (80.6%) | 0 (0.0%) |
Employment Occupations by Sex in Round Top
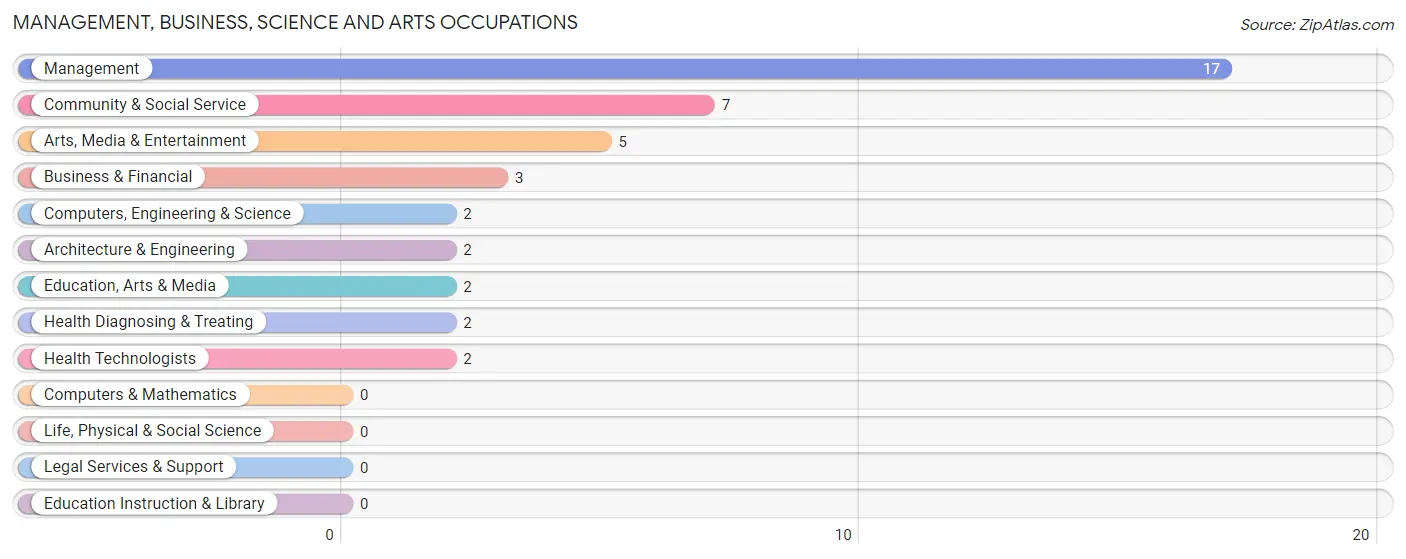
Management, Business, Science and Arts Occupations
The most common Management, Business, Science and Arts occupations in Round Top are Management (17 | 27.4%), Community & Social Service (7 | 11.3%), Arts, Media & Entertainment (5 | 8.1%), Business & Financial (3 | 4.8%), and Computers, Engineering & Science (2 | 3.2%).
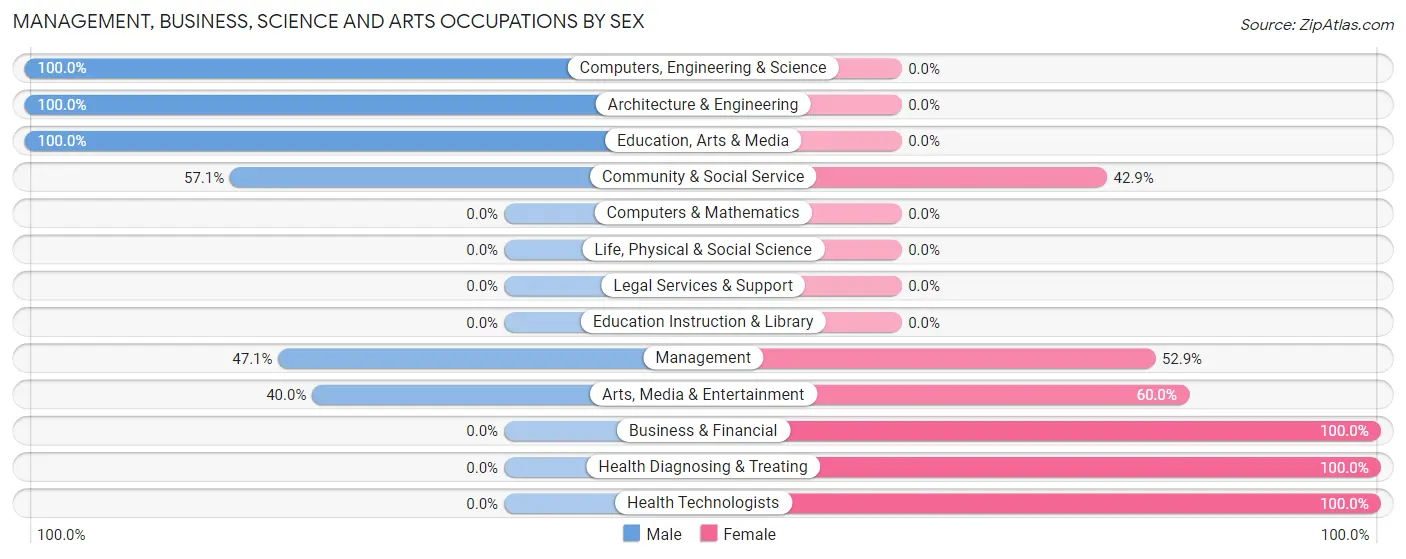
Management, Business, Science and Arts Occupations by Sex
Within the Management, Business, Science and Arts occupations in Round Top, the most male-oriented occupations are Computers, Engineering & Science (100.0%), Architecture & Engineering (100.0%), and Education, Arts & Media (100.0%), while the most female-oriented occupations are Business & Financial (100.0%), Health Diagnosing & Treating (100.0%), and Health Technologists (100.0%).
| Occupation | Male | Female |
| Management | 8 (47.1%) | 9 (52.9%) |
| Business & Financial | 0 (0.0%) | 3 (100.0%) |
| Computers, Engineering & Science | 2 (100.0%) | 0 (0.0%) |
| Computers & Mathematics | 0 (0.0%) | 0 (0.0%) |
| Architecture & Engineering | 2 (100.0%) | 0 (0.0%) |
| Life, Physical & Social Science | 0 (0.0%) | 0 (0.0%) |
| Community & Social Service | 4 (57.1%) | 3 (42.9%) |
| Education, Arts & Media | 2 (100.0%) | 0 (0.0%) |
| Legal Services & Support | 0 (0.0%) | 0 (0.0%) |
| Education Instruction & Library | 0 (0.0%) | 0 (0.0%) |
| Arts, Media & Entertainment | 2 (40.0%) | 3 (60.0%) |
| Health Diagnosing & Treating | 0 (0.0%) | 2 (100.0%) |
| Health Technologists | 0 (0.0%) | 2 (100.0%) |
| Total (Category) | 14 (45.2%) | 17 (54.8%) |
| Total (Overall) | 36 (58.1%) | 26 (41.9%) |
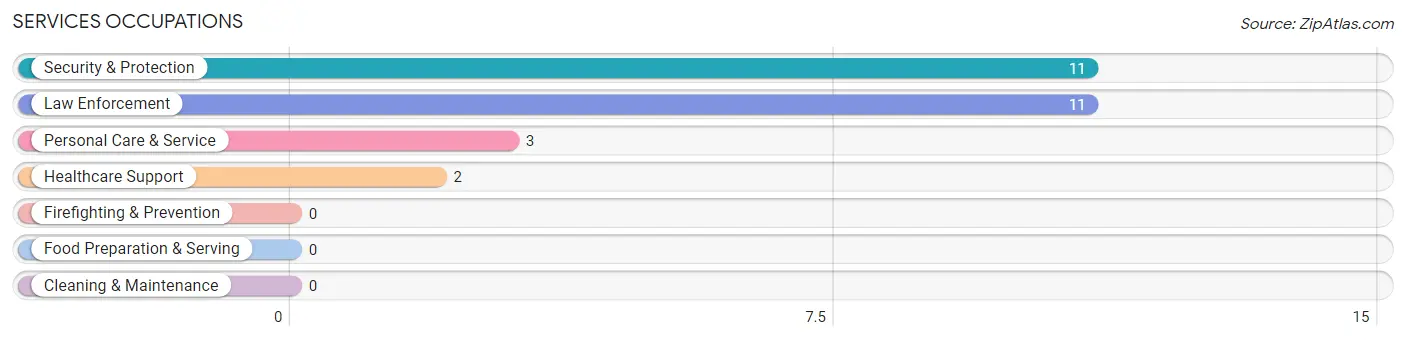
Services Occupations
The most common Services occupations in Round Top are Security & Protection (11 | 17.7%), Law Enforcement (11 | 17.7%), Personal Care & Service (3 | 4.8%), and Healthcare Support (2 | 3.2%).
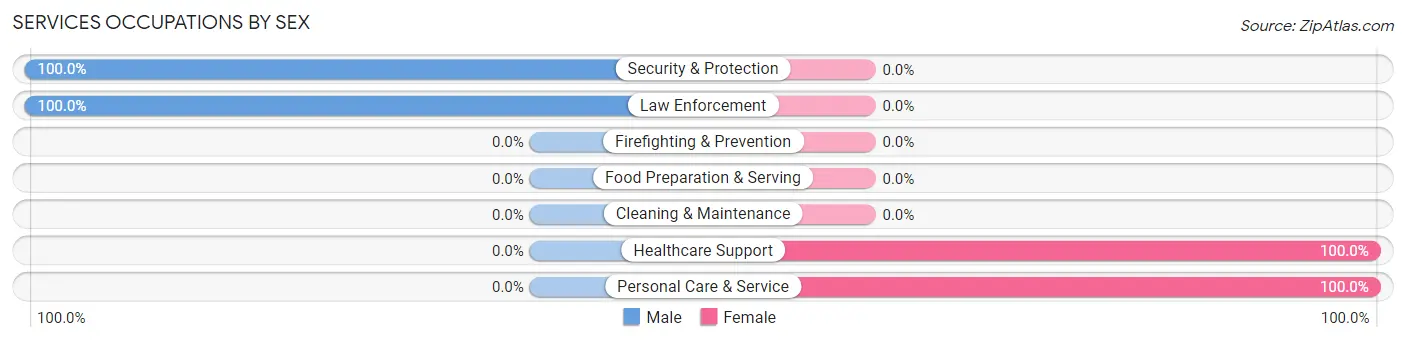
Services Occupations by Sex
Within the Services occupations in Round Top, the most male-oriented occupations are Security & Protection (100.0%), and Law Enforcement (100.0%), while the most female-oriented occupations are Healthcare Support (100.0%), and Personal Care & Service (100.0%).
| Occupation | Male | Female |
| Healthcare Support | 0 (0.0%) | 2 (100.0%) |
| Security & Protection | 11 (100.0%) | 0 (0.0%) |
| Firefighting & Prevention | 0 (0.0%) | 0 (0.0%) |
| Law Enforcement | 11 (100.0%) | 0 (0.0%) |
| Food Preparation & Serving | 0 (0.0%) | 0 (0.0%) |
| Cleaning & Maintenance | 0 (0.0%) | 0 (0.0%) |
| Personal Care & Service | 0 (0.0%) | 3 (100.0%) |
| Total (Category) | 11 (68.8%) | 5 (31.2%) |
| Total (Overall) | 36 (58.1%) | 26 (41.9%) |
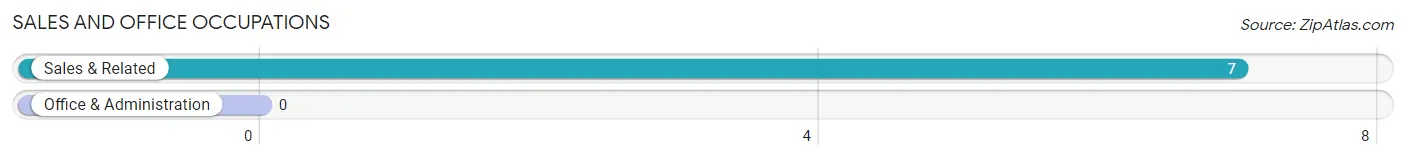
Sales and Office Occupations
The most common Sales and Office occupations in Round Top are , and Sales & Related (7 | 11.3%).
Sales and Office Occupations by Sex
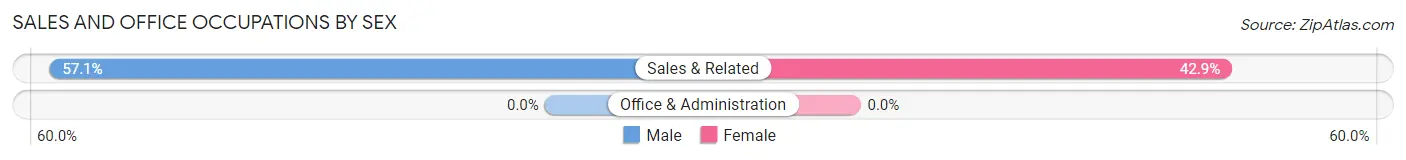
| Occupation | Male | Female |
| Sales & Related | 4 (57.1%) | 3 (42.9%) |
| Office & Administration | 0 (0.0%) | 0 (0.0%) |
| Total (Category) | 4 (57.1%) | 3 (42.9%) |
| Total (Overall) | 36 (58.1%) | 26 (41.9%) |
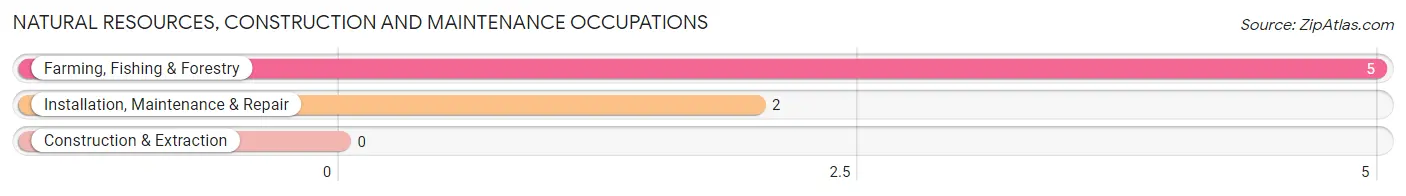
Natural Resources, Construction and Maintenance Occupations
The most common Natural Resources, Construction and Maintenance occupations in Round Top are Farming, Fishing & Forestry (5 | 8.1%), and Installation, Maintenance & Repair (2 | 3.2%).
Natural Resources, Construction and Maintenance Occupations by Sex
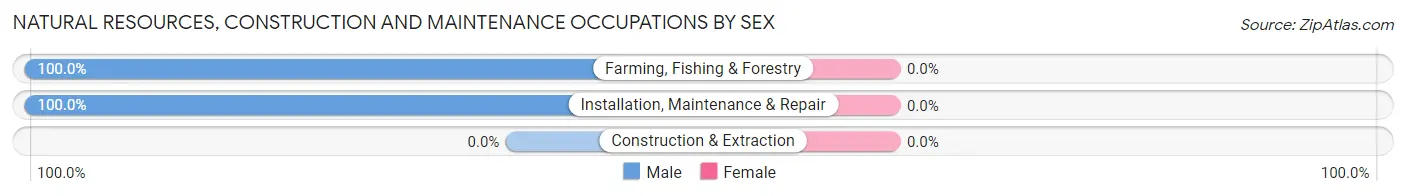
| Occupation | Male | Female |
| Farming, Fishing & Forestry | 5 (100.0%) | 0 (0.0%) |
| Construction & Extraction | 0 (0.0%) | 0 (0.0%) |
| Installation, Maintenance & Repair | 2 (100.0%) | 0 (0.0%) |
| Total (Category) | 7 (100.0%) | 0 (0.0%) |
| Total (Overall) | 36 (58.1%) | 26 (41.9%) |
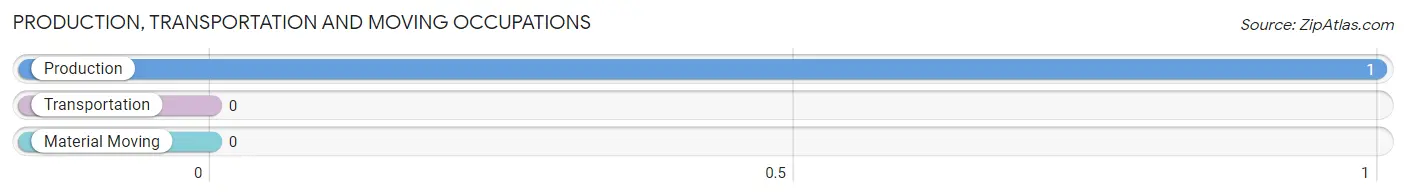
Production, Transportation and Moving Occupations
The most common Production, Transportation and Moving occupations in Round Top are , and Production (1 | 1.6%).
Production, Transportation and Moving Occupations by Sex
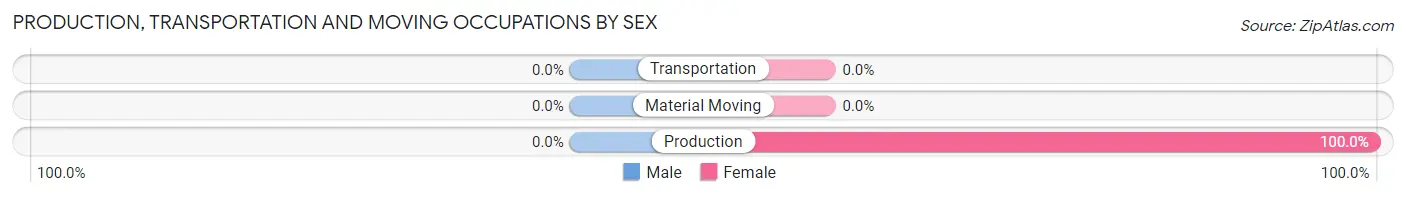
| Occupation | Male | Female |
| Production | 0 (0.0%) | 1 (100.0%) |
| Transportation | 0 (0.0%) | 0 (0.0%) |
| Material Moving | 0 (0.0%) | 0 (0.0%) |
| Total (Category) | 0 (0.0%) | 1 (100.0%) |
| Total (Overall) | 36 (58.1%) | 26 (41.9%) |
Employment Industries by Sex in Round Top
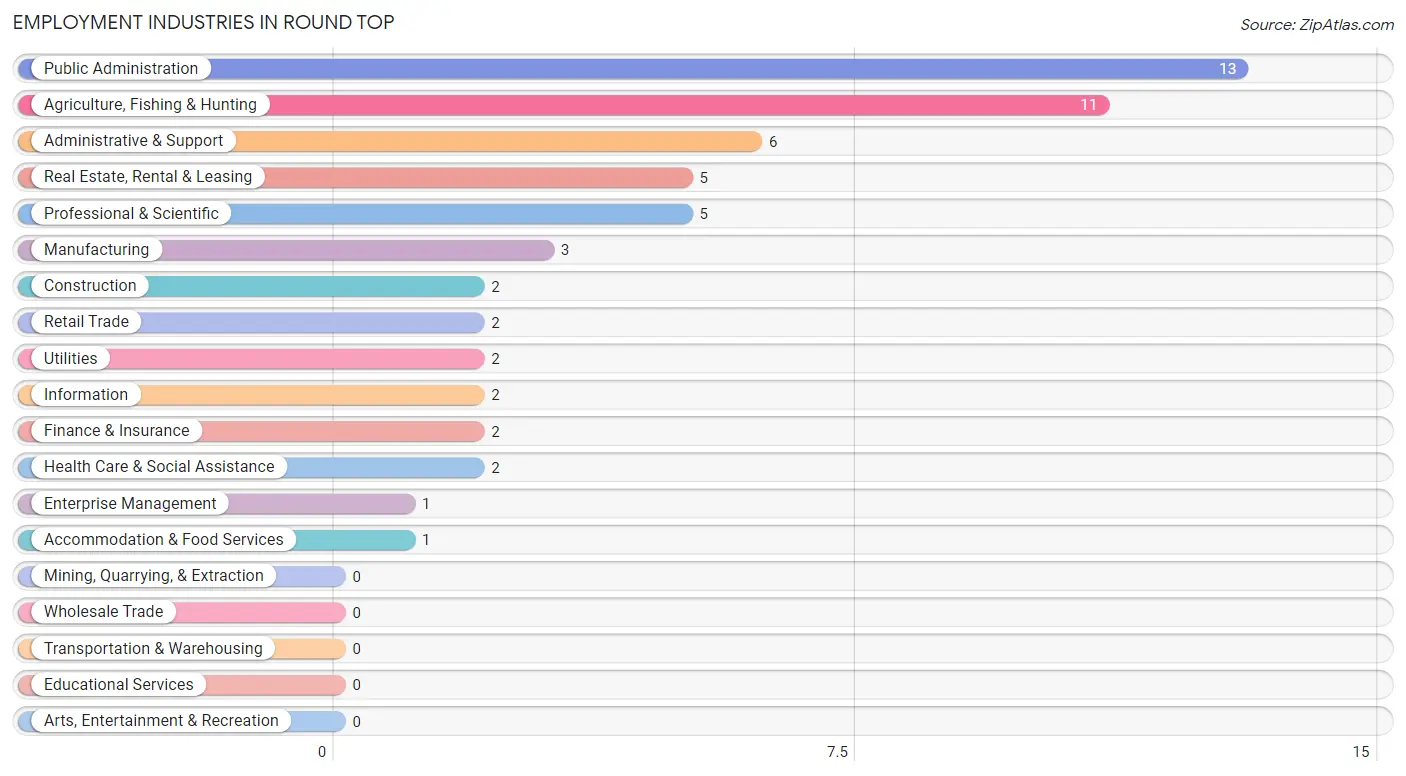
Employment Industries in Round Top
The major employment industries in Round Top include Public Administration (13 | 21.0%), Agriculture, Fishing & Hunting (11 | 17.7%), Administrative & Support (6 | 9.7%), Real Estate, Rental & Leasing (5 | 8.1%), and Professional & Scientific (5 | 8.1%).
Employment Industries by Sex in Round Top
The Round Top industries that see more men than women are Retail Trade (100.0%), Utilities (100.0%), and Information (100.0%), whereas the industries that tend to have a higher number of women are Finance & Insurance (100.0%), Professional & Scientific (100.0%), and Health Care & Social Assistance (100.0%).
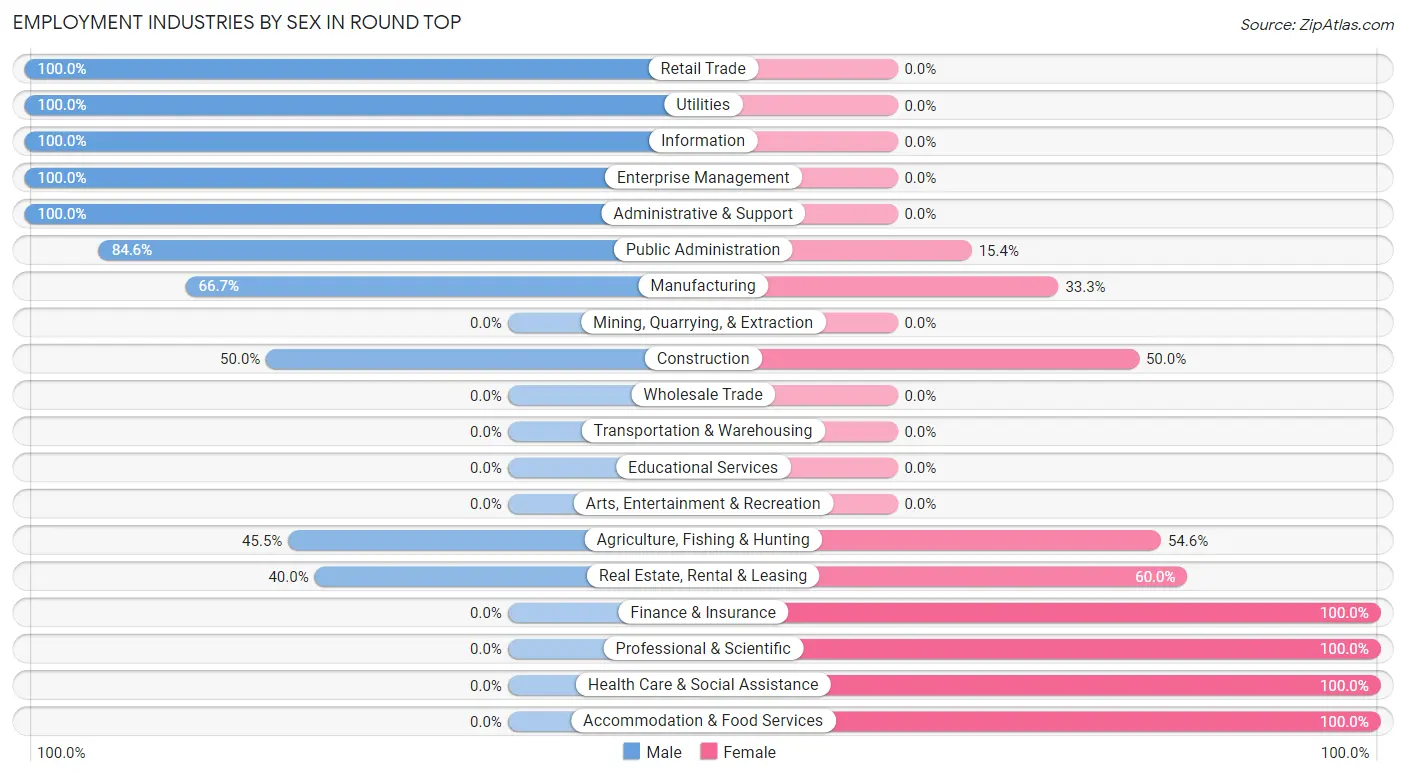
| Industry | Male | Female |
| Agriculture, Fishing & Hunting | 5 (45.5%) | 6 (54.5%) |
| Mining, Quarrying, & Extraction | 0 (0.0%) | 0 (0.0%) |
| Construction | 1 (50.0%) | 1 (50.0%) |
| Manufacturing | 2 (66.7%) | 1 (33.3%) |
| Wholesale Trade | 0 (0.0%) | 0 (0.0%) |
| Retail Trade | 2 (100.0%) | 0 (0.0%) |
| Transportation & Warehousing | 0 (0.0%) | 0 (0.0%) |
| Utilities | 2 (100.0%) | 0 (0.0%) |
| Information | 2 (100.0%) | 0 (0.0%) |
| Finance & Insurance | 0 (0.0%) | 2 (100.0%) |
| Real Estate, Rental & Leasing | 2 (40.0%) | 3 (60.0%) |
| Professional & Scientific | 0 (0.0%) | 5 (100.0%) |
| Enterprise Management | 1 (100.0%) | 0 (0.0%) |
| Administrative & Support | 6 (100.0%) | 0 (0.0%) |
| Educational Services | 0 (0.0%) | 0 (0.0%) |
| Health Care & Social Assistance | 0 (0.0%) | 2 (100.0%) |
| Arts, Entertainment & Recreation | 0 (0.0%) | 0 (0.0%) |
| Accommodation & Food Services | 0 (0.0%) | 1 (100.0%) |
| Public Administration | 11 (84.6%) | 2 (15.4%) |
| Total | 36 (58.1%) | 26 (41.9%) |
Education in Round Top
School Enrollment in Round Top
The most common levels of schooling among the 16 students in Round Top are elementary school (8 | 50.0%), high school (6 | 37.5%), and college / undergraduate (2 | 12.5%).
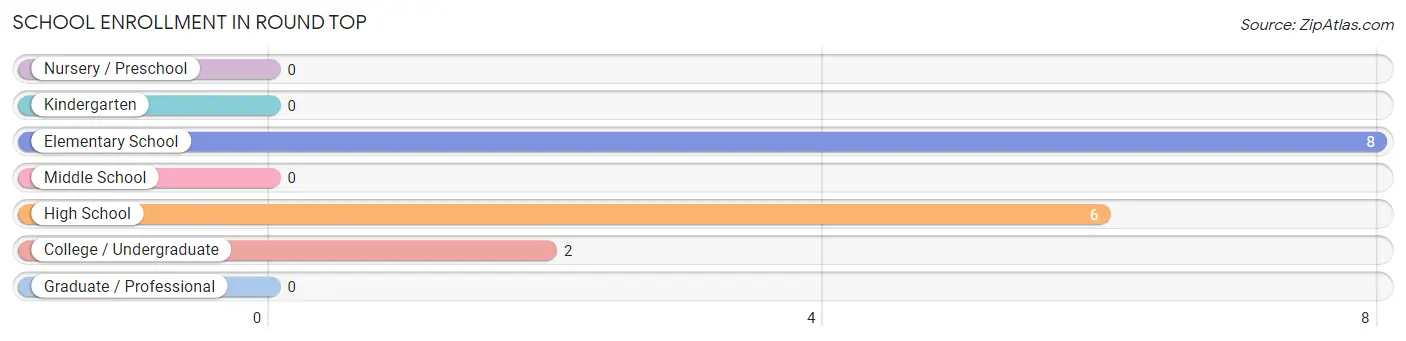
| School Level | # Students | % Students |
| Nursery / Preschool | 0 | 0.0% |
| Kindergarten | 0 | 0.0% |
| Elementary School | 8 | 50.0% |
| Middle School | 0 | 0.0% |
| High School | 6 | 37.5% |
| College / Undergraduate | 2 | 12.5% |
| Graduate / Professional | 0 | 0.0% |
| Total | 16 | 100.0% |
School Enrollment by Age by Funding Source in Round Top
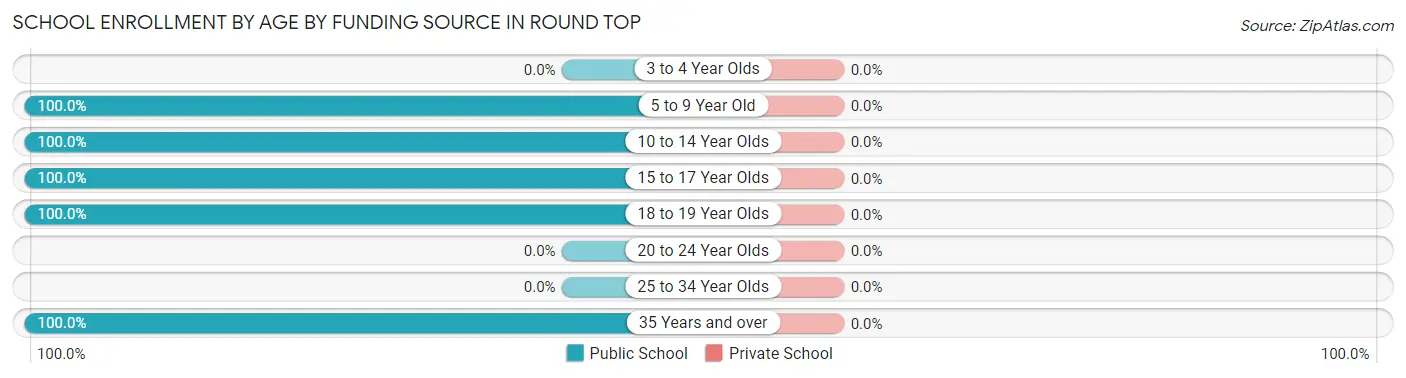
| Age Bracket | Public School | Private School |
| 3 to 4 Year Olds | 0 (0.0%) | 0 (0.0%) |
| 5 to 9 Year Old | 6 (100.0%) | 0 (0.0%) |
| 10 to 14 Year Olds | 4 (100.0%) | 0 (0.0%) |
| 15 to 17 Year Olds | 2 (100.0%) | 0 (0.0%) |
| 18 to 19 Year Olds | 2 (100.0%) | 0 (0.0%) |
| 20 to 24 Year Olds | 0 (0.0%) | 0 (0.0%) |
| 25 to 34 Year Olds | 0 (0.0%) | 0 (0.0%) |
| 35 Years and over | 2 (100.0%) | 0 (0.0%) |
| Total | 16 (100.0%) | 0 (0.0%) |
Educational Attainment by Field of Study in Round Top
Business (22 | 37.3%), science & technology (8 | 13.6%), communications (5 | 8.5%), arts & humanities (5 | 8.5%), and engineering (4 | 6.8%) are the most common fields of study among 59 individuals in Round Top who have obtained a bachelor's degree or higher.
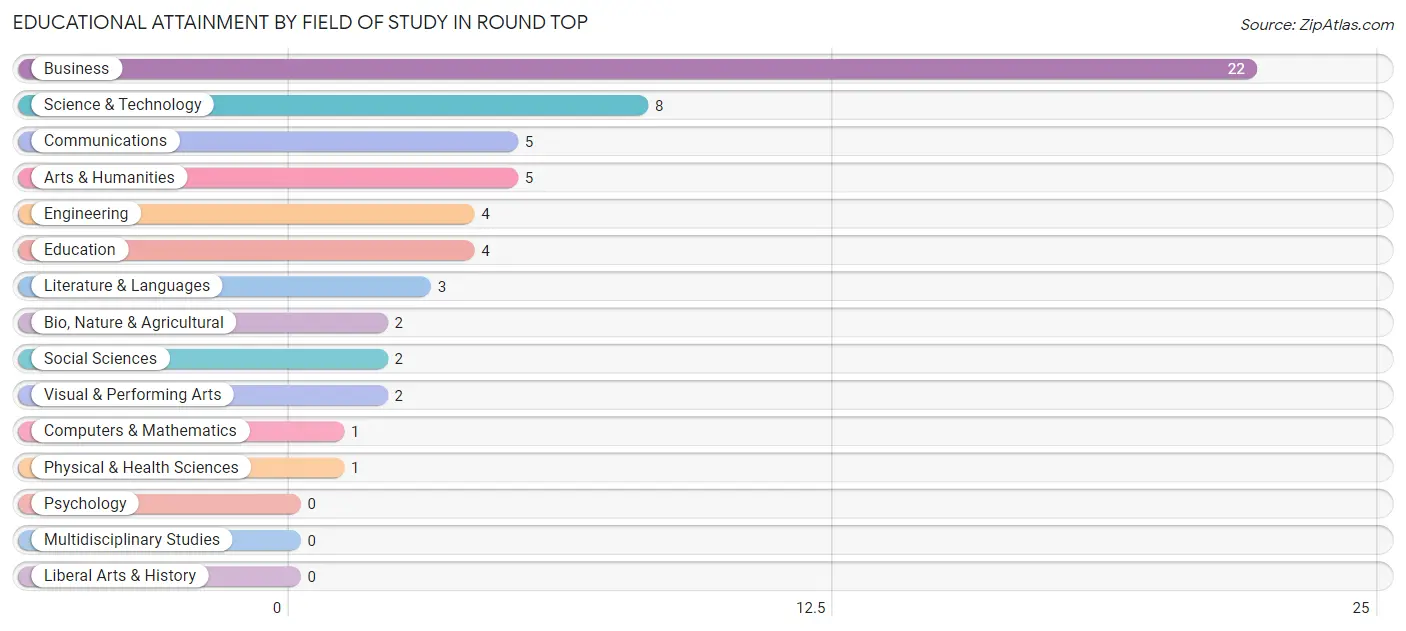
| Field of Study | # Graduates | % Graduates |
| Computers & Mathematics | 1 | 1.7% |
| Bio, Nature & Agricultural | 2 | 3.4% |
| Physical & Health Sciences | 1 | 1.7% |
| Psychology | 0 | 0.0% |
| Social Sciences | 2 | 3.4% |
| Engineering | 4 | 6.8% |
| Multidisciplinary Studies | 0 | 0.0% |
| Science & Technology | 8 | 13.6% |
| Business | 22 | 37.3% |
| Education | 4 | 6.8% |
| Literature & Languages | 3 | 5.1% |
| Liberal Arts & History | 0 | 0.0% |
| Visual & Performing Arts | 2 | 3.4% |
| Communications | 5 | 8.5% |
| Arts & Humanities | 5 | 8.5% |
| Total | 59 | 100.0% |
Transportation & Commute in Round Top
Vehicle Availability by Sex in Round Top
The most prevalent vehicle ownership categories in Round Top are males with 4 vehicles (20, accounting for 55.6%) and females with 4 vehicles (8, making up 76.9%).
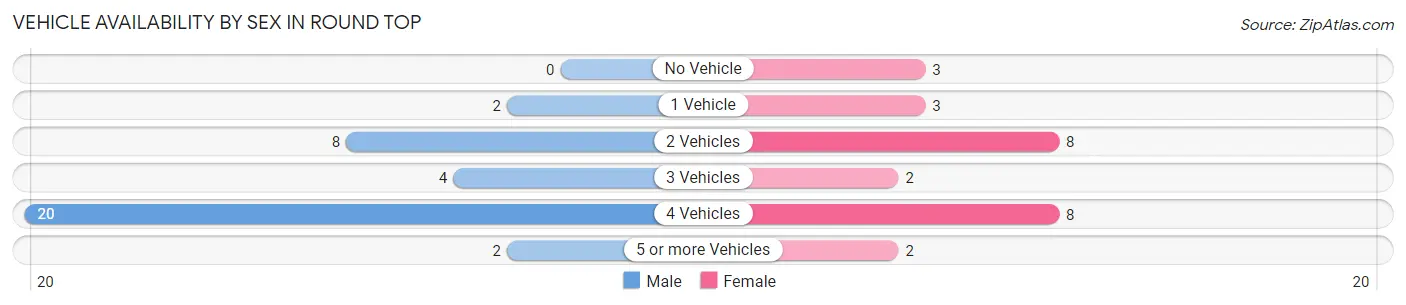
| Vehicles Available | Male | Female |
| No Vehicle | 0 (0.0%) | 3 (11.5%) |
| 1 Vehicle | 2 (5.6%) | 3 (11.5%) |
| 2 Vehicles | 8 (22.2%) | 8 (30.8%) |
| 3 Vehicles | 4 (11.1%) | 2 (7.7%) |
| 4 Vehicles | 20 (55.6%) | 8 (30.8%) |
| 5 or more Vehicles | 2 (5.6%) | 2 (7.7%) |
| Total | 36 (100.0%) | 26 (100.0%) |
Commute Time in Round Top
The most frequently occuring commute durations in Round Top are 10 to 14 minutes (16 commuters, 28.6%), 20 to 24 minutes (11 commuters, 19.6%), and 5 to 9 minutes (7 commuters, 12.5%).
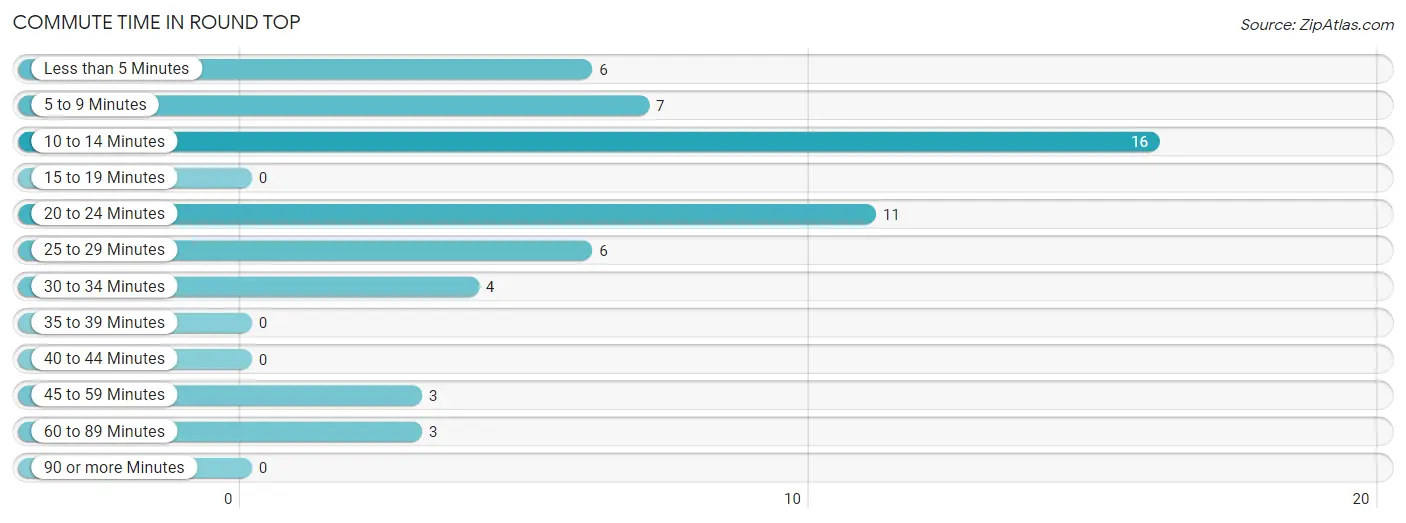
| Commute Time | # Commuters | % Commuters |
| Less than 5 Minutes | 6 | 10.7% |
| 5 to 9 Minutes | 7 | 12.5% |
| 10 to 14 Minutes | 16 | 28.6% |
| 15 to 19 Minutes | 0 | 0.0% |
| 20 to 24 Minutes | 11 | 19.6% |
| 25 to 29 Minutes | 6 | 10.7% |
| 30 to 34 Minutes | 4 | 7.1% |
| 35 to 39 Minutes | 0 | 0.0% |
| 40 to 44 Minutes | 0 | 0.0% |
| 45 to 59 Minutes | 3 | 5.4% |
| 60 to 89 Minutes | 3 | 5.4% |
| 90 or more Minutes | 0 | 0.0% |
Commute Time by Sex in Round Top
The most common commute times in Round Top are 20 to 24 minutes (11 commuters, 32.4%) for males and 10 to 14 minutes (10 commuters, 45.5%) for females.
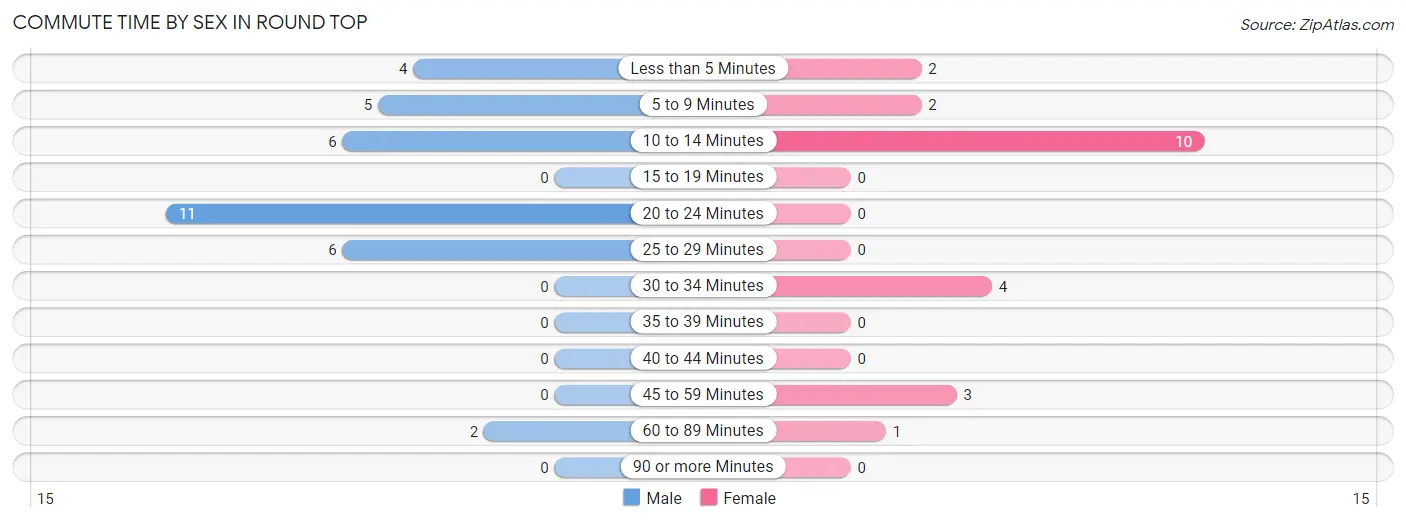
| Commute Time | Male | Female |
| Less than 5 Minutes | 4 (11.8%) | 2 (9.1%) |
| 5 to 9 Minutes | 5 (14.7%) | 2 (9.1%) |
| 10 to 14 Minutes | 6 (17.6%) | 10 (45.5%) |
| 15 to 19 Minutes | 0 (0.0%) | 0 (0.0%) |
| 20 to 24 Minutes | 11 (32.4%) | 0 (0.0%) |
| 25 to 29 Minutes | 6 (17.6%) | 0 (0.0%) |
| 30 to 34 Minutes | 0 (0.0%) | 4 (18.2%) |
| 35 to 39 Minutes | 0 (0.0%) | 0 (0.0%) |
| 40 to 44 Minutes | 0 (0.0%) | 0 (0.0%) |
| 45 to 59 Minutes | 0 (0.0%) | 3 (13.6%) |
| 60 to 89 Minutes | 2 (5.9%) | 1 (4.5%) |
| 90 or more Minutes | 0 (0.0%) | 0 (0.0%) |
Time of Departure to Work by Sex in Round Top
The most frequent times of departure to work in Round Top are 7:00 AM to 7:29 AM (16, 47.1%) for males and 8:30 AM to 8:59 AM (6, 27.3%) for females.
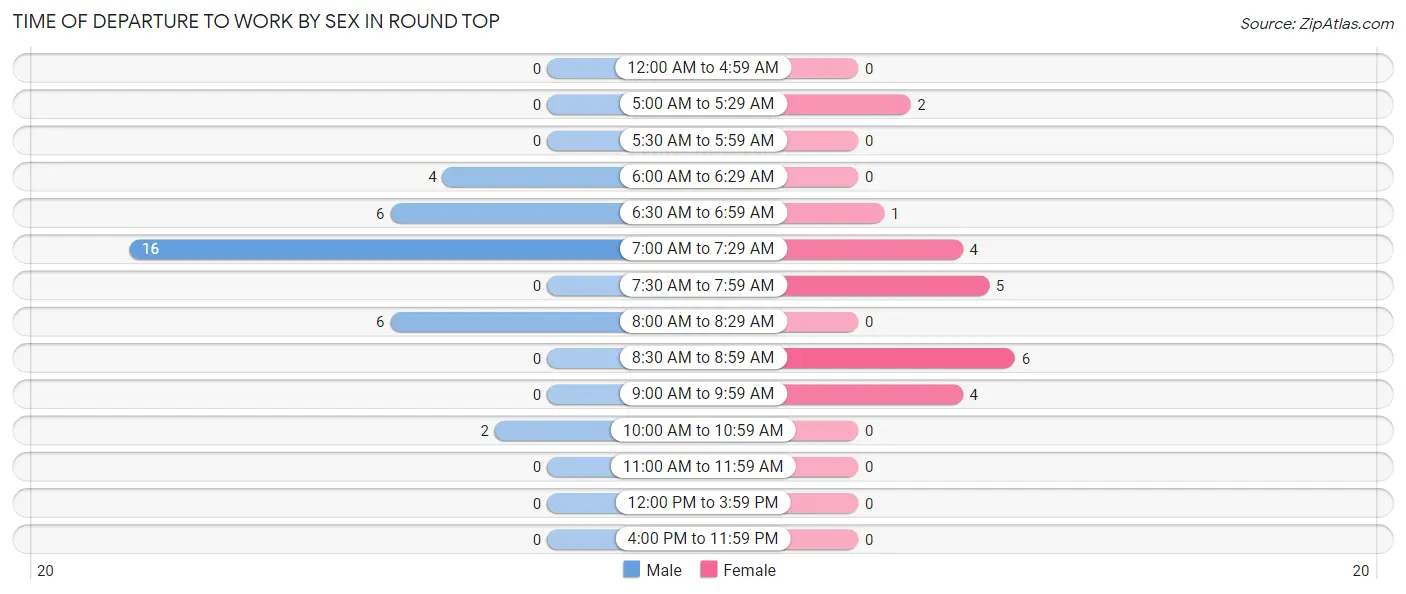
| Time of Departure | Male | Female |
| 12:00 AM to 4:59 AM | 0 (0.0%) | 0 (0.0%) |
| 5:00 AM to 5:29 AM | 0 (0.0%) | 2 (9.1%) |
| 5:30 AM to 5:59 AM | 0 (0.0%) | 0 (0.0%) |
| 6:00 AM to 6:29 AM | 4 (11.8%) | 0 (0.0%) |
| 6:30 AM to 6:59 AM | 6 (17.6%) | 1 (4.5%) |
| 7:00 AM to 7:29 AM | 16 (47.1%) | 4 (18.2%) |
| 7:30 AM to 7:59 AM | 0 (0.0%) | 5 (22.7%) |
| 8:00 AM to 8:29 AM | 6 (17.6%) | 0 (0.0%) |
| 8:30 AM to 8:59 AM | 0 (0.0%) | 6 (27.3%) |
| 9:00 AM to 9:59 AM | 0 (0.0%) | 4 (18.2%) |
| 10:00 AM to 10:59 AM | 2 (5.9%) | 0 (0.0%) |
| 11:00 AM to 11:59 AM | 0 (0.0%) | 0 (0.0%) |
| 12:00 PM to 3:59 PM | 0 (0.0%) | 0 (0.0%) |
| 4:00 PM to 11:59 PM | 0 (0.0%) | 0 (0.0%) |
| Total | 34 (100.0%) | 22 (100.0%) |
Housing Occupancy in Round Top
Occupancy by Ownership in Round Top
Of the total 48 dwellings in Round Top, owner-occupied units account for 44 (91.7%), while renter-occupied units make up 4 (8.3%).
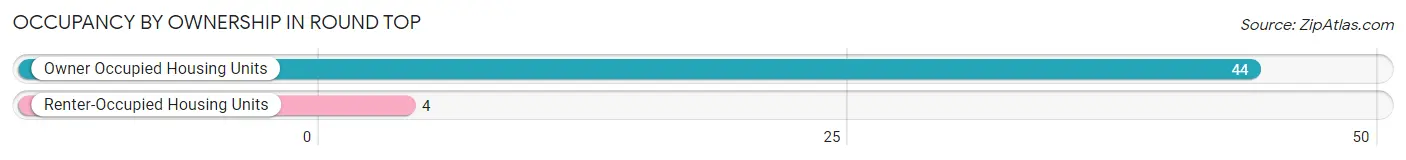
| Occupancy | # Housing Units | % Housing Units |
| Owner Occupied Housing Units | 44 | 91.7% |
| Renter-Occupied Housing Units | 4 | 8.3% |
| Total Occupied Housing Units | 48 | 100.0% |
Occupancy by Household Size in Round Top
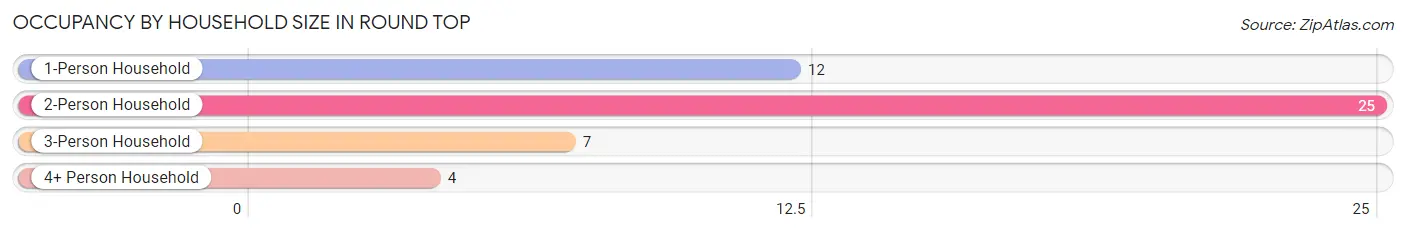
| Household Size | # Housing Units | % Housing Units |
| 1-Person Household | 12 | 25.0% |
| 2-Person Household | 25 | 52.1% |
| 3-Person Household | 7 | 14.6% |
| 4+ Person Household | 4 | 8.3% |
| Total Housing Units | 48 | 100.0% |
Occupancy by Ownership by Household Size in Round Top
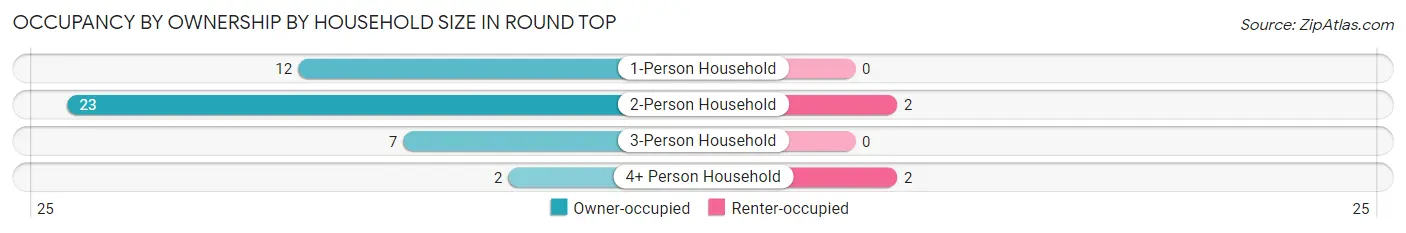
| Household Size | Owner-occupied | Renter-occupied |
| 1-Person Household | 12 (100.0%) | 0 (0.0%) |
| 2-Person Household | 23 (92.0%) | 2 (8.0%) |
| 3-Person Household | 7 (100.0%) | 0 (0.0%) |
| 4+ Person Household | 2 (50.0%) | 2 (50.0%) |
| Total Housing Units | 44 (91.7%) | 4 (8.3%) |
Occupancy by Educational Attainment in Round Top
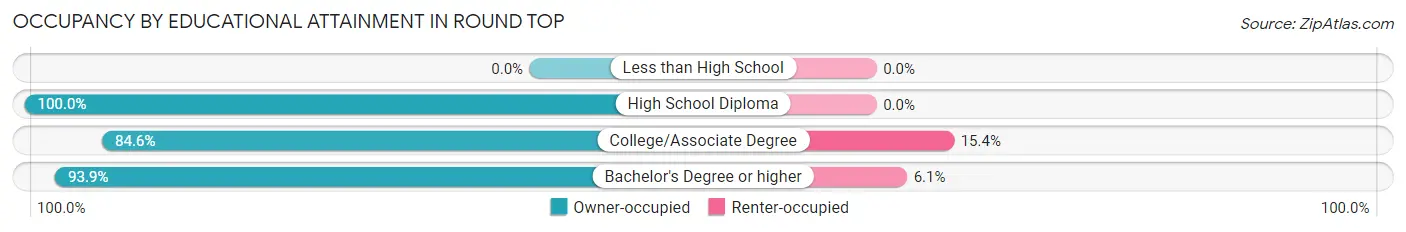
| Household Size | Owner-occupied | Renter-occupied |
| Less than High School | 0 (0.0%) | 0 (0.0%) |
| High School Diploma | 2 (100.0%) | 0 (0.0%) |
| College/Associate Degree | 11 (84.6%) | 2 (15.4%) |
| Bachelor's Degree or higher | 31 (93.9%) | 2 (6.1%) |
Occupancy by Age of Householder in Round Top
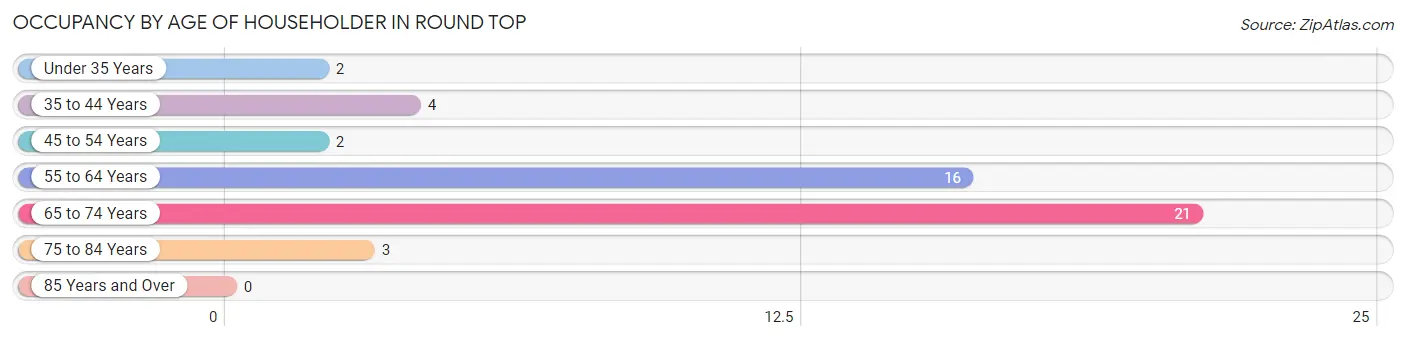
| Age Bracket | # Households | % Households |
| Under 35 Years | 2 | 4.2% |
| 35 to 44 Years | 4 | 8.3% |
| 45 to 54 Years | 2 | 4.2% |
| 55 to 64 Years | 16 | 33.3% |
| 65 to 74 Years | 21 | 43.8% |
| 75 to 84 Years | 3 | 6.2% |
| 85 Years and Over | 0 | 0.0% |
| Total | 48 | 100.0% |
Housing Finances in Round Top
Median Income by Occupancy in Round Top
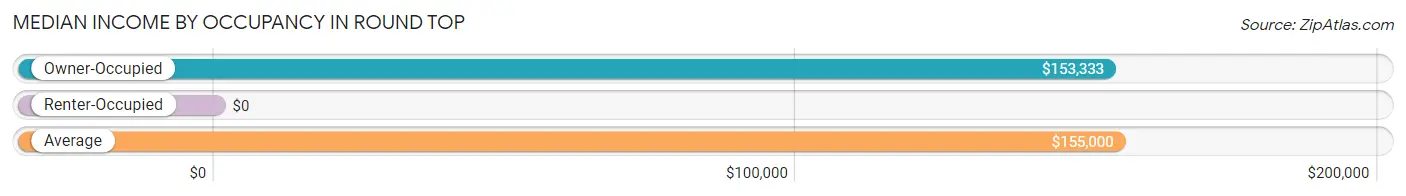
| Occupancy Type | # Households | Median Income |
| Owner-Occupied | 44 (91.7%) | $153,333 |
| Renter-Occupied | 4 (8.3%) | $0 |
| Average | 48 (100.0%) | $155,000 |
Occupancy by Householder Income Bracket in Round Top
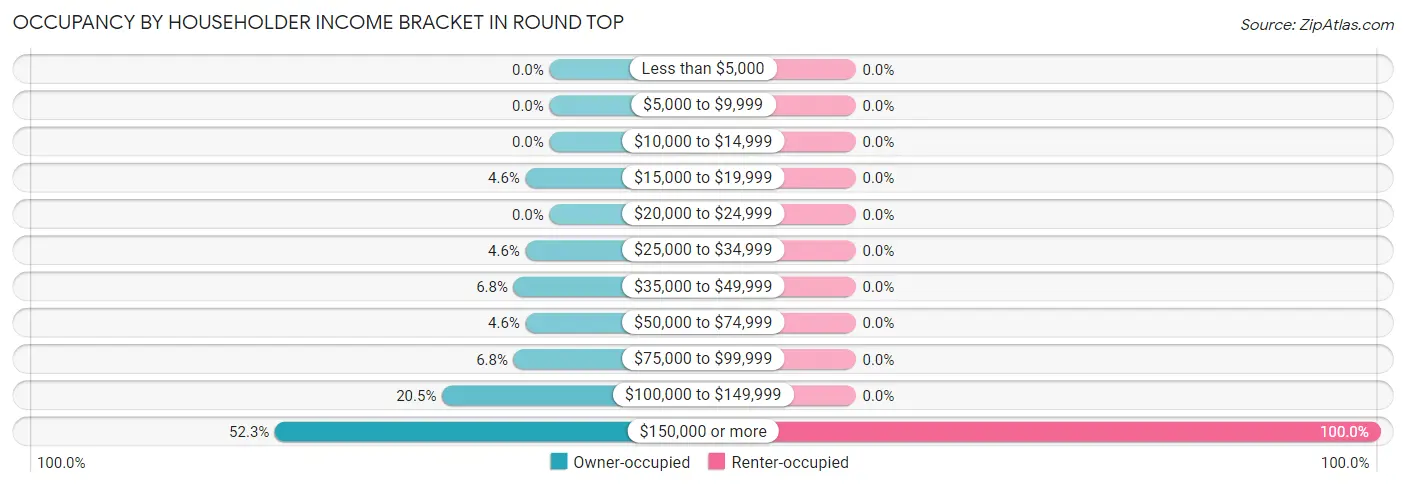
| Income Bracket | Owner-occupied | Renter-occupied |
| Less than $5,000 | 0 (0.0%) | 0 (0.0%) |
| $5,000 to $9,999 | 0 (0.0%) | 0 (0.0%) |
| $10,000 to $14,999 | 0 (0.0%) | 0 (0.0%) |
| $15,000 to $19,999 | 2 (4.5%) | 0 (0.0%) |
| $20,000 to $24,999 | 0 (0.0%) | 0 (0.0%) |
| $25,000 to $34,999 | 2 (4.5%) | 0 (0.0%) |
| $35,000 to $49,999 | 3 (6.8%) | 0 (0.0%) |
| $50,000 to $74,999 | 2 (4.5%) | 0 (0.0%) |
| $75,000 to $99,999 | 3 (6.8%) | 0 (0.0%) |
| $100,000 to $149,999 | 9 (20.4%) | 0 (0.0%) |
| $150,000 or more | 23 (52.3%) | 4 (100.0%) |
| Total | 44 (100.0%) | 4 (100.0%) |
Monthly Housing Cost Tiers in Round Top
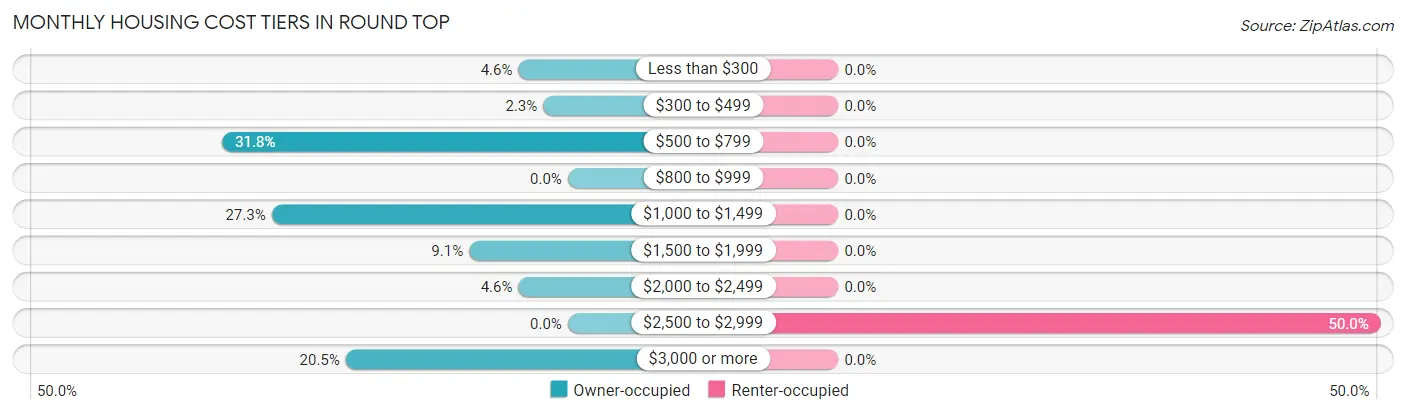
| Monthly Cost | Owner-occupied | Renter-occupied |
| Less than $300 | 2 (4.5%) | 0 (0.0%) |
| $300 to $499 | 1 (2.3%) | 0 (0.0%) |
| $500 to $799 | 14 (31.8%) | 0 (0.0%) |
| $800 to $999 | 0 (0.0%) | 0 (0.0%) |
| $1,000 to $1,499 | 12 (27.3%) | 0 (0.0%) |
| $1,500 to $1,999 | 4 (9.1%) | 0 (0.0%) |
| $2,000 to $2,499 | 2 (4.5%) | 0 (0.0%) |
| $2,500 to $2,999 | 0 (0.0%) | 2 (50.0%) |
| $3,000 or more | 9 (20.4%) | 0 (0.0%) |
| Total | 44 (100.0%) | 4 (100.0%) |
Physical Housing Characteristics in Round Top
Housing Structures in Round Top
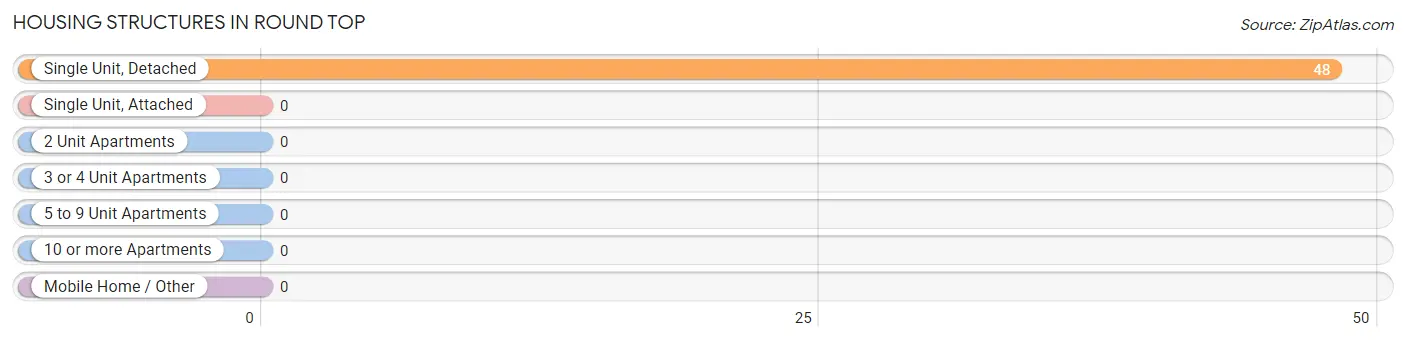
| Structure Type | # Housing Units | % Housing Units |
| Single Unit, Detached | 48 | 100.0% |
| Single Unit, Attached | 0 | 0.0% |
| 2 Unit Apartments | 0 | 0.0% |
| 3 or 4 Unit Apartments | 0 | 0.0% |
| 5 to 9 Unit Apartments | 0 | 0.0% |
| 10 or more Apartments | 0 | 0.0% |
| Mobile Home / Other | 0 | 0.0% |
| Total | 48 | 100.0% |
Housing Structures by Occupancy in Round Top
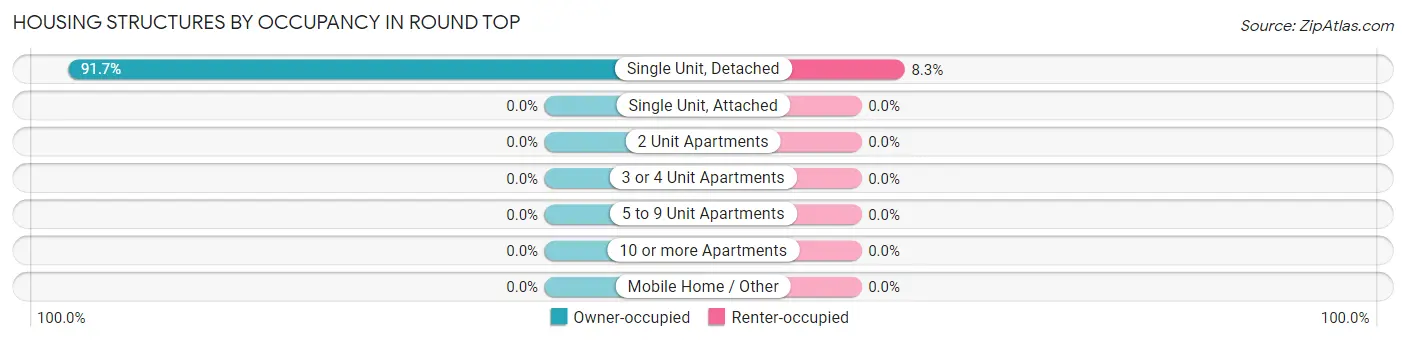
| Structure Type | Owner-occupied | Renter-occupied |
| Single Unit, Detached | 44 (91.7%) | 4 (8.3%) |
| Single Unit, Attached | 0 (0.0%) | 0 (0.0%) |
| 2 Unit Apartments | 0 (0.0%) | 0 (0.0%) |
| 3 or 4 Unit Apartments | 0 (0.0%) | 0 (0.0%) |
| 5 to 9 Unit Apartments | 0 (0.0%) | 0 (0.0%) |
| 10 or more Apartments | 0 (0.0%) | 0 (0.0%) |
| Mobile Home / Other | 0 (0.0%) | 0 (0.0%) |
| Total | 44 (91.7%) | 4 (8.3%) |
Housing Structures by Number of Rooms in Round Top
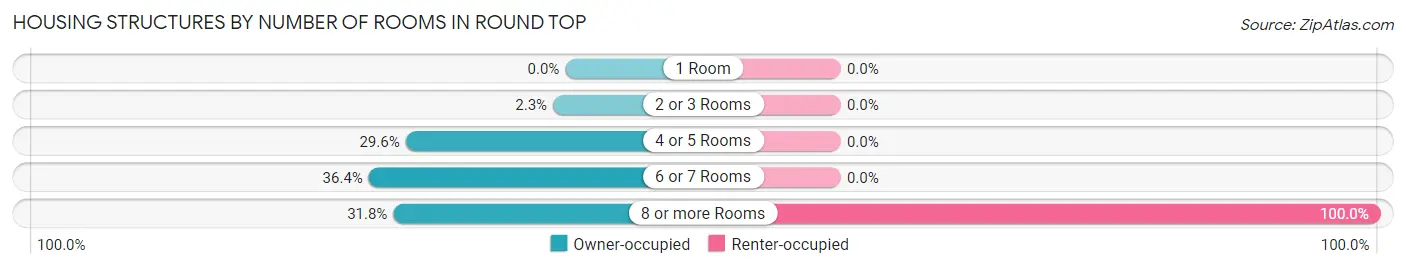
| Number of Rooms | Owner-occupied | Renter-occupied |
| 1 Room | 0 (0.0%) | 0 (0.0%) |
| 2 or 3 Rooms | 1 (2.3%) | 0 (0.0%) |
| 4 or 5 Rooms | 13 (29.5%) | 0 (0.0%) |
| 6 or 7 Rooms | 16 (36.4%) | 0 (0.0%) |
| 8 or more Rooms | 14 (31.8%) | 4 (100.0%) |
| Total | 44 (100.0%) | 4 (100.0%) |
Housing Structure by Heating Type in Round Top
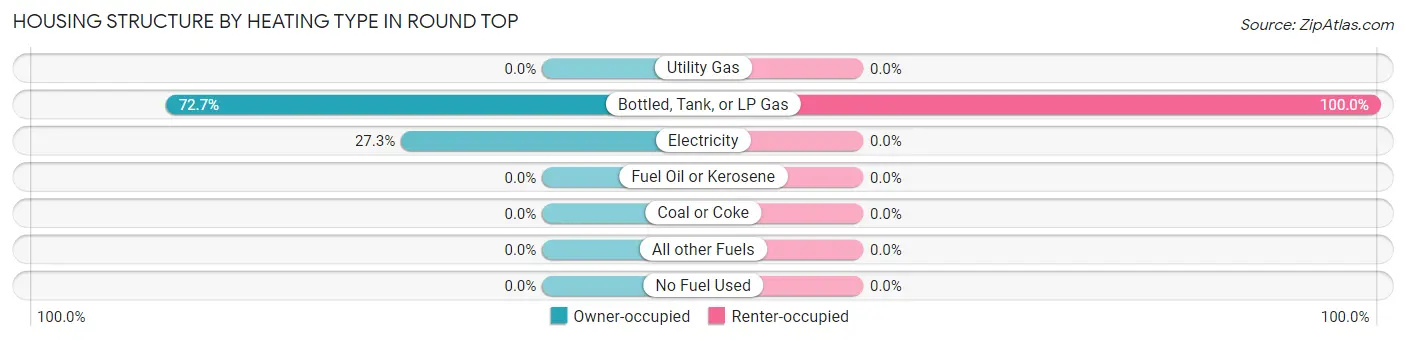
| Heating Type | Owner-occupied | Renter-occupied |
| Utility Gas | 0 (0.0%) | 0 (0.0%) |
| Bottled, Tank, or LP Gas | 32 (72.7%) | 4 (100.0%) |
| Electricity | 12 (27.3%) | 0 (0.0%) |
| Fuel Oil or Kerosene | 0 (0.0%) | 0 (0.0%) |
| Coal or Coke | 0 (0.0%) | 0 (0.0%) |
| All other Fuels | 0 (0.0%) | 0 (0.0%) |
| No Fuel Used | 0 (0.0%) | 0 (0.0%) |
| Total | 44 (100.0%) | 4 (100.0%) |
Household Vehicle Usage in Round Top
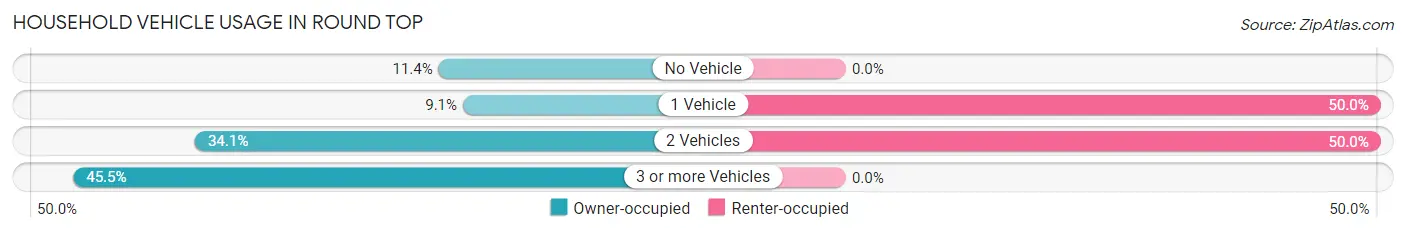
| Vehicles per Household | Owner-occupied | Renter-occupied |
| No Vehicle | 5 (11.4%) | 0 (0.0%) |
| 1 Vehicle | 4 (9.1%) | 2 (50.0%) |
| 2 Vehicles | 15 (34.1%) | 2 (50.0%) |
| 3 or more Vehicles | 20 (45.5%) | 0 (0.0%) |
| Total | 44 (100.0%) | 4 (100.0%) |
Real Estate & Mortgages in Round Top
Real Estate and Mortgage Overview in Round Top
| Characteristic | Without Mortgage | With Mortgage |
| Housing Units | 27 | 17 |
| Median Property Value | $708,300 | $875,000 |
| Median Household Income | $103,125 | $12 |
| Monthly Housing Costs | $756 | $9 |
| Real Estate Taxes | $4,786 | $0 |
Property Value by Mortgage Status in Round Top
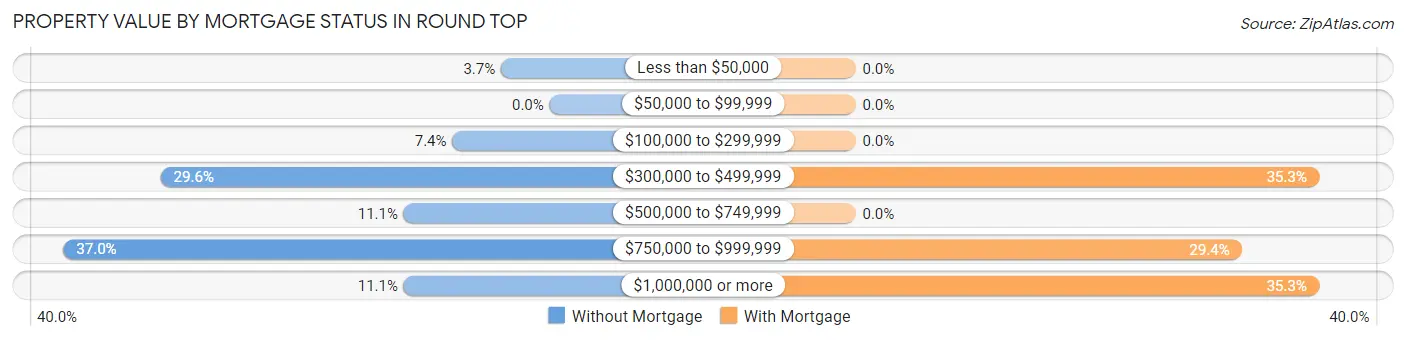
| Property Value | Without Mortgage | With Mortgage |
| Less than $50,000 | 1 (3.7%) | 0 (0.0%) |
| $50,000 to $99,999 | 0 (0.0%) | 0 (0.0%) |
| $100,000 to $299,999 | 2 (7.4%) | 0 (0.0%) |
| $300,000 to $499,999 | 8 (29.6%) | 6 (35.3%) |
| $500,000 to $749,999 | 3 (11.1%) | 0 (0.0%) |
| $750,000 to $999,999 | 10 (37.0%) | 5 (29.4%) |
| $1,000,000 or more | 3 (11.1%) | 6 (35.3%) |
| Total | 27 (100.0%) | 17 (100.0%) |
Household Income by Mortgage Status in Round Top
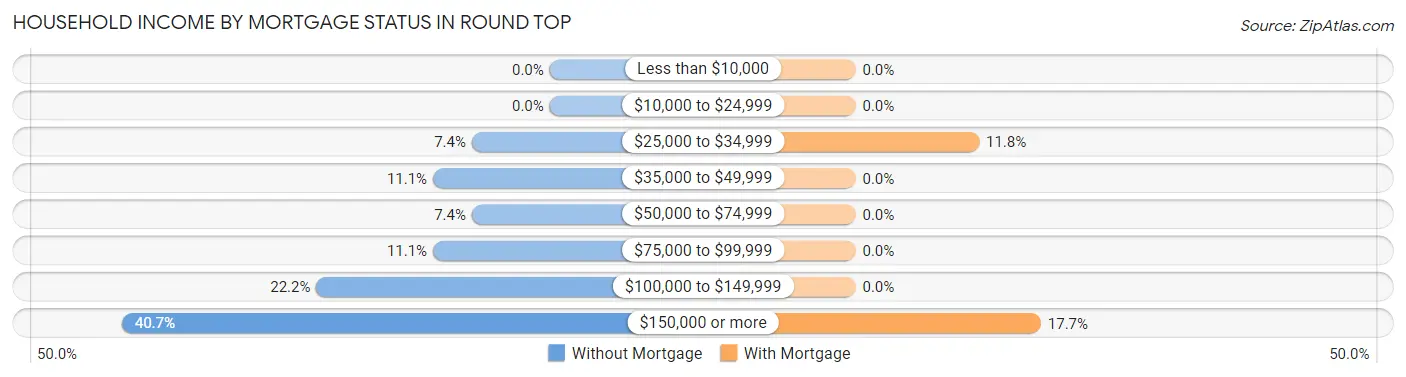
| Household Income | Without Mortgage | With Mortgage |
| Less than $10,000 | 0 (0.0%) | 0 (0.0%) |
| $10,000 to $24,999 | 0 (0.0%) | 0 (0.0%) |
| $25,000 to $34,999 | 2 (7.4%) | 2 (11.8%) |
| $35,000 to $49,999 | 3 (11.1%) | 0 (0.0%) |
| $50,000 to $74,999 | 2 (7.4%) | 0 (0.0%) |
| $75,000 to $99,999 | 3 (11.1%) | 0 (0.0%) |
| $100,000 to $149,999 | 6 (22.2%) | 0 (0.0%) |
| $150,000 or more | 11 (40.7%) | 3 (17.6%) |
| Total | 27 (100.0%) | 17 (100.0%) |
Property Value to Household Income Ratio in Round Top
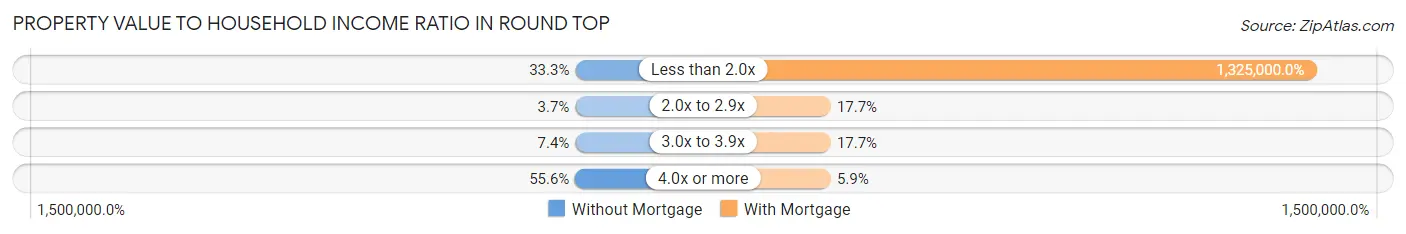
| Value-to-Income Ratio | Without Mortgage | With Mortgage |
| Less than 2.0x | 9 (33.3%) | 225,250 (1,325,000.0%) |
| 2.0x to 2.9x | 1 (3.7%) | 3 (17.6%) |
| 3.0x to 3.9x | 2 (7.4%) | 3 (17.6%) |
| 4.0x or more | 15 (55.6%) | 1 (5.9%) |
| Total | 27 (100.0%) | 17 (100.0%) |
Real Estate Taxes by Mortgage Status in Round Top
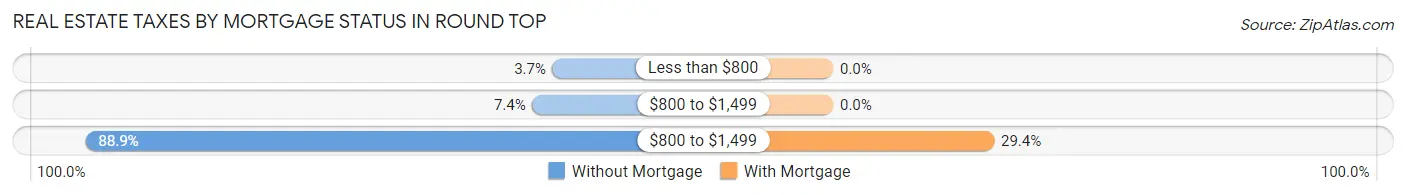
| Property Taxes | Without Mortgage | With Mortgage |
| Less than $800 | 1 (3.7%) | 0 (0.0%) |
| $800 to $1,499 | 2 (7.4%) | 0 (0.0%) |
| $800 to $1,499 | 24 (88.9%) | 5 (29.4%) |
| Total | 27 (100.0%) | 17 (100.0%) |
Health & Disability in Round Top
Health Insurance Coverage by Age in Round Top
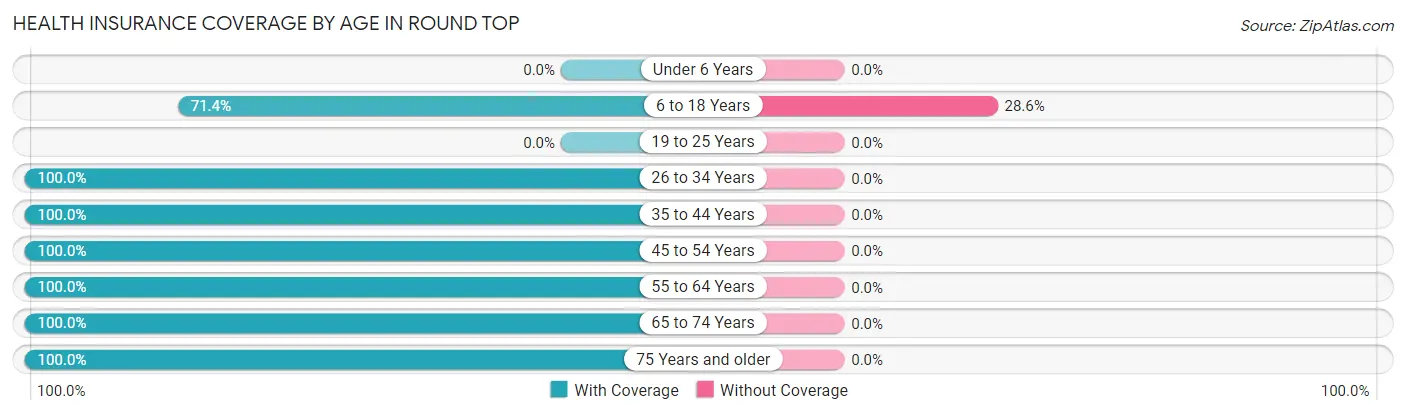
| Age Bracket | With Coverage | Without Coverage |
| Under 6 Years | 0 (0.0%) | 0 (0.0%) |
| 6 to 18 Years | 10 (71.4%) | 4 (28.6%) |
| 19 to 25 Years | 0 (0.0%) | 0 (0.0%) |
| 26 to 34 Years | 13 (100.0%) | 0 (0.0%) |
| 35 to 44 Years | 10 (100.0%) | 0 (0.0%) |
| 45 to 54 Years | 12 (100.0%) | 0 (0.0%) |
| 55 to 64 Years | 27 (100.0%) | 0 (0.0%) |
| 65 to 74 Years | 29 (100.0%) | 0 (0.0%) |
| 75 Years and older | 6 (100.0%) | 0 (0.0%) |
| Total | 107 (96.4%) | 4 (3.6%) |
Health Insurance Coverage by Citizenship Status in Round Top
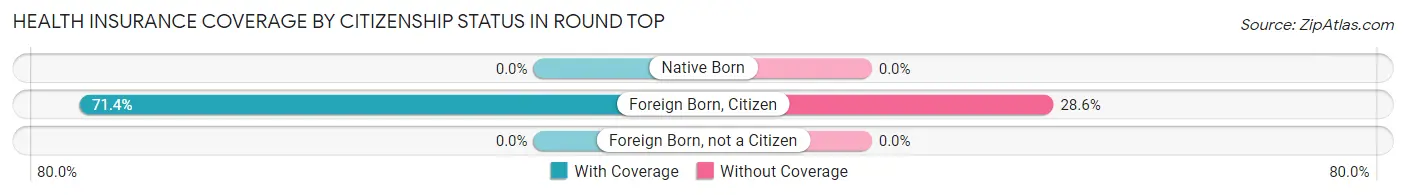
| Citizenship Status | With Coverage | Without Coverage |
| Native Born | 0 (0.0%) | 0 (0.0%) |
| Foreign Born, Citizen | 10 (71.4%) | 4 (28.6%) |
| Foreign Born, not a Citizen | 0 (0.0%) | 0 (0.0%) |
Health Insurance Coverage by Household Income in Round Top
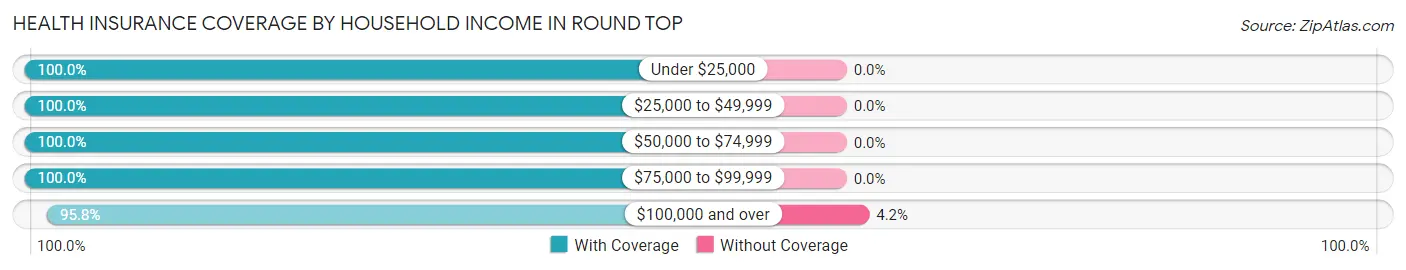
| Household Income | With Coverage | Without Coverage |
| Under $25,000 | 2 (100.0%) | 0 (0.0%) |
| $25,000 to $49,999 | 8 (100.0%) | 0 (0.0%) |
| $50,000 to $74,999 | 2 (100.0%) | 0 (0.0%) |
| $75,000 to $99,999 | 4 (100.0%) | 0 (0.0%) |
| $100,000 and over | 91 (95.8%) | 4 (4.2%) |
Public vs Private Health Insurance Coverage by Age in Round Top
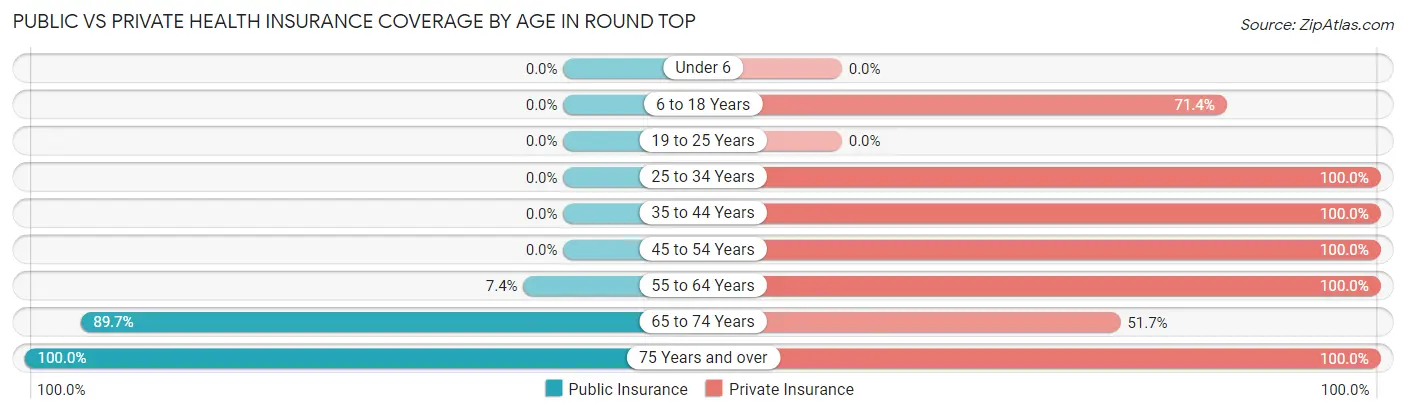
| Age Bracket | Public Insurance | Private Insurance |
| Under 6 | 0 (0.0%) | 0 (0.0%) |
| 6 to 18 Years | 0 (0.0%) | 10 (71.4%) |
| 19 to 25 Years | 0 (0.0%) | 0 (0.0%) |
| 25 to 34 Years | 0 (0.0%) | 13 (100.0%) |
| 35 to 44 Years | 0 (0.0%) | 10 (100.0%) |
| 45 to 54 Years | 0 (0.0%) | 12 (100.0%) |
| 55 to 64 Years | 2 (7.4%) | 27 (100.0%) |
| 65 to 74 Years | 26 (89.7%) | 15 (51.7%) |
| 75 Years and over | 6 (100.0%) | 6 (100.0%) |
| Total | 34 (30.6%) | 93 (83.8%) |
Disability Status by Sex by Age in Round Top
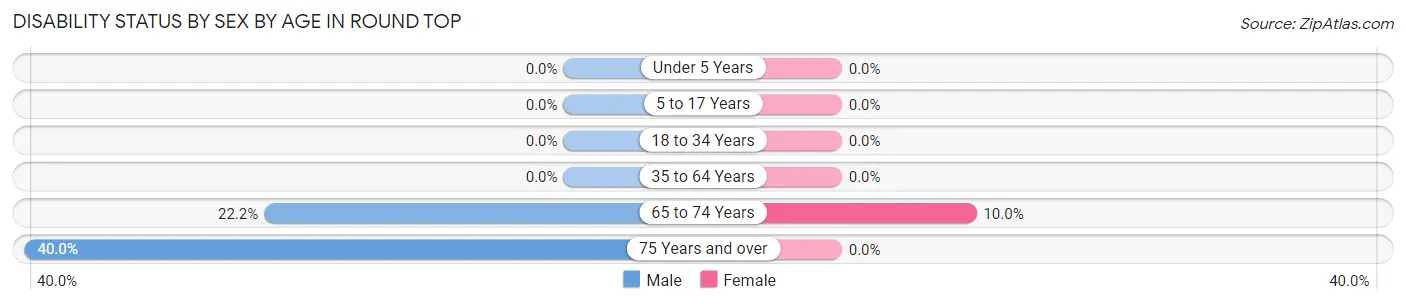
| Age Bracket | Male | Female |
| Under 5 Years | 0 (0.0%) | 0 (0.0%) |
| 5 to 17 Years | 0 (0.0%) | 0 (0.0%) |
| 18 to 34 Years | 0 (0.0%) | 0 (0.0%) |
| 35 to 64 Years | 0 (0.0%) | 0 (0.0%) |
| 65 to 74 Years | 2 (22.2%) | 2 (10.0%) |
| 75 Years and over | 2 (40.0%) | 0 (0.0%) |
Disability Class by Sex by Age in Round Top
Disability Class: Hearing Difficulty
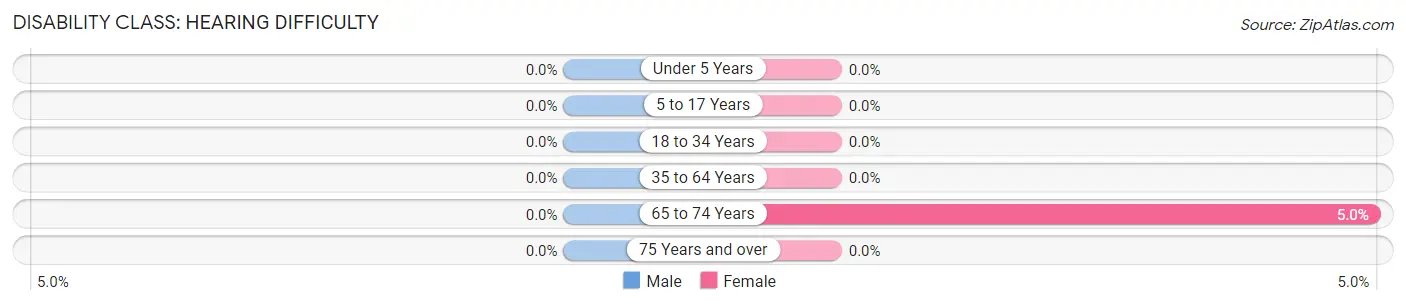
| Age Bracket | Male | Female |
| Under 5 Years | 0 (0.0%) | 0 (0.0%) |
| 5 to 17 Years | 0 (0.0%) | 0 (0.0%) |
| 18 to 34 Years | 0 (0.0%) | 0 (0.0%) |
| 35 to 64 Years | 0 (0.0%) | 0 (0.0%) |
| 65 to 74 Years | 0 (0.0%) | 1 (5.0%) |
| 75 Years and over | 0 (0.0%) | 0 (0.0%) |
Disability Class: Vision Difficulty
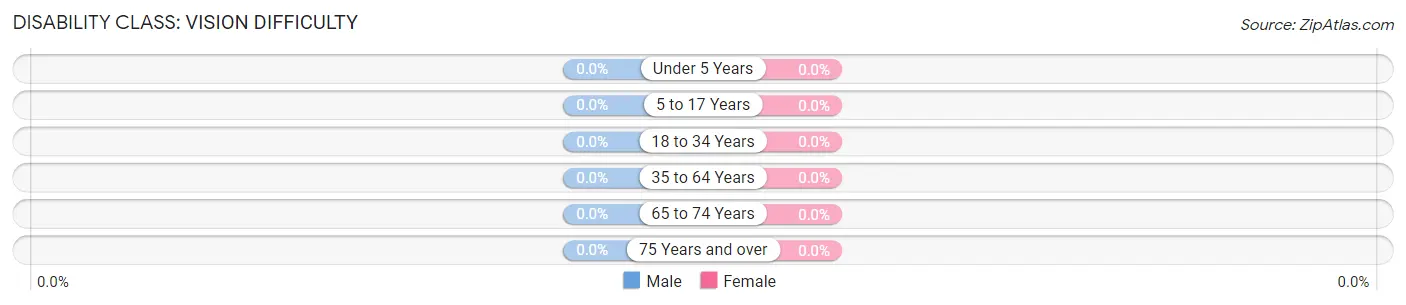
| Age Bracket | Male | Female |
| Under 5 Years | 0 (0.0%) | 0 (0.0%) |
| 5 to 17 Years | 0 (0.0%) | 0 (0.0%) |
| 18 to 34 Years | 0 (0.0%) | 0 (0.0%) |
| 35 to 64 Years | 0 (0.0%) | 0 (0.0%) |
| 65 to 74 Years | 0 (0.0%) | 0 (0.0%) |
| 75 Years and over | 0 (0.0%) | 0 (0.0%) |
Disability Class: Cognitive Difficulty
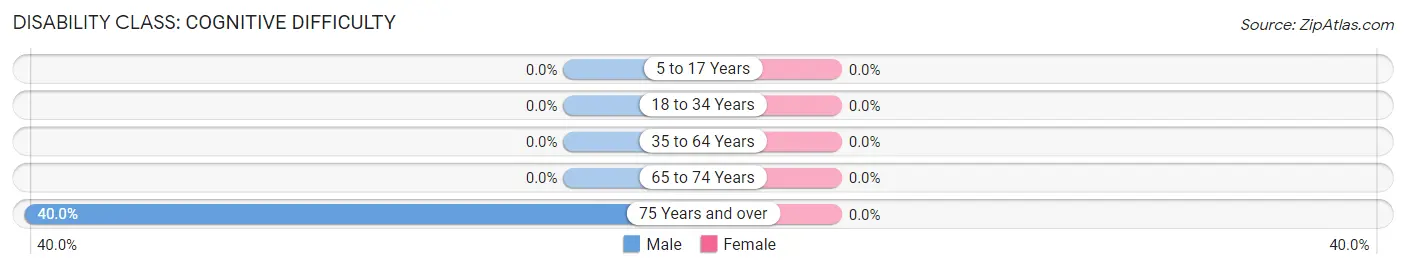
| Age Bracket | Male | Female |
| 5 to 17 Years | 0 (0.0%) | 0 (0.0%) |
| 18 to 34 Years | 0 (0.0%) | 0 (0.0%) |
| 35 to 64 Years | 0 (0.0%) | 0 (0.0%) |
| 65 to 74 Years | 0 (0.0%) | 0 (0.0%) |
| 75 Years and over | 2 (40.0%) | 0 (0.0%) |
Disability Class: Ambulatory Difficulty
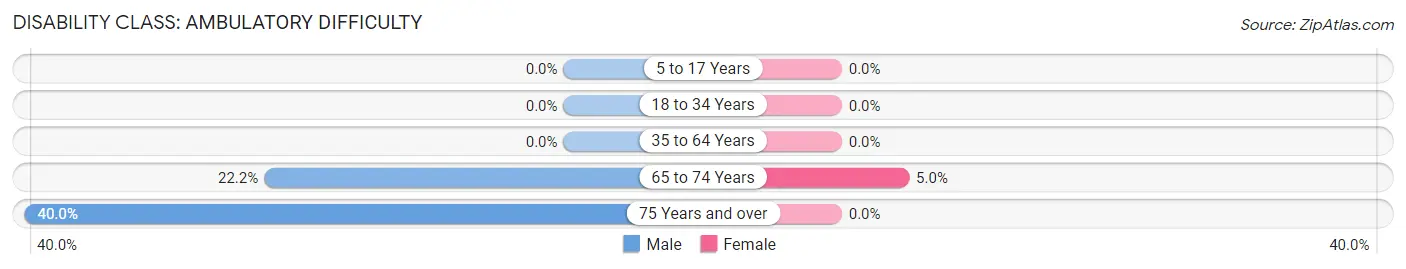
| Age Bracket | Male | Female |
| 5 to 17 Years | 0 (0.0%) | 0 (0.0%) |
| 18 to 34 Years | 0 (0.0%) | 0 (0.0%) |
| 35 to 64 Years | 0 (0.0%) | 0 (0.0%) |
| 65 to 74 Years | 2 (22.2%) | 1 (5.0%) |
| 75 Years and over | 2 (40.0%) | 0 (0.0%) |
Disability Class: Self-Care Difficulty

| Age Bracket | Male | Female |
| 5 to 17 Years | 0 (0.0%) | 0 (0.0%) |
| 18 to 34 Years | 0 (0.0%) | 0 (0.0%) |
| 35 to 64 Years | 0 (0.0%) | 0 (0.0%) |
| 65 to 74 Years | 0 (0.0%) | 0 (0.0%) |
| 75 Years and over | 2 (40.0%) | 0 (0.0%) |
Technology Access in Round Top
Computing Device Access in Round Top
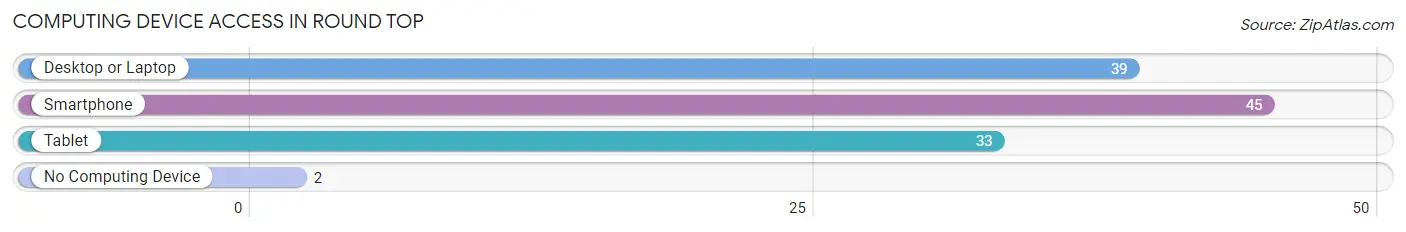
| Device Type | # Households | % Households |
| Desktop or Laptop | 39 | 81.2% |
| Smartphone | 45 | 93.8% |
| Tablet | 33 | 68.8% |
| No Computing Device | 2 | 4.2% |
| Total | 48 | 100.0% |
Internet Access in Round Top
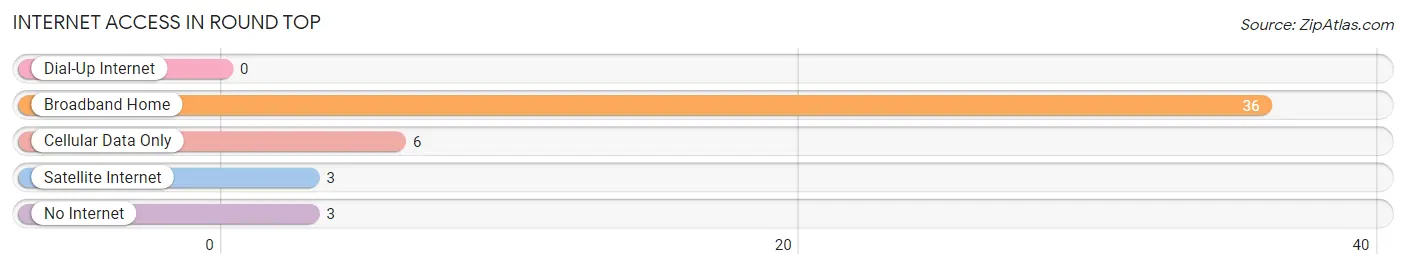
| Internet Type | # Households | % Households |
| Dial-Up Internet | 0 | 0.0% |
| Broadband Home | 36 | 75.0% |
| Cellular Data Only | 6 | 12.5% |
| Satellite Internet | 3 | 6.2% |
| No Internet | 3 | 6.2% |
| Total | 48 | 100.0% |
Round Top Summary
Round Top, Texas is a small unincorporated community located in Fayette County, Texas. It is situated about halfway between Austin and Houston, and is part of the Austin–Round Rock–San Marcos metropolitan area. The town is known for its annual Round Top Antiques Fair, which draws thousands of visitors each year.
History
Round Top was founded in 1837 by German immigrants who had settled in the area. The town was originally called “Friedrichsburg” after the German prince, Friedrich Wilhelm. The town was renamed Round Top in 1845, after the nearby hill.
The town was an important stop on the Chappell Hill-La Grange stagecoach route, and was a popular destination for travelers. In the late 19th century, Round Top was a thriving community with several stores, a post office, a school, and a hotel.
In the early 20th century, the town began to decline as the railroad bypassed it and the stagecoach route was discontinued. By the 1950s, the town had become a virtual ghost town.
In the 1970s, the town was rediscovered by antiques dealers and collectors, who began to flock to the area for the Round Top Antiques Fair. The fair has become an annual event, and has helped to revive the town.
Geography
Round Top is located in Fayette County, Texas, about halfway between Austin and Houston. It is situated at the intersection of State Highway 237 and FM 1457. The town is surrounded by rolling hills and is located in the Texas Hill Country.
The climate in Round Top is generally mild, with hot summers and cool winters. The average annual temperature is around 70°F (21°C).
Economy
The economy of Round Top is largely based on tourism. The town is known for its annual Round Top Antiques Fair, which draws thousands of visitors each year. The fair is held in the spring and fall, and features antiques dealers from all over the country.
In addition to the antiques fair, Round Top is home to several other businesses, including restaurants, art galleries, and gift shops. The town also has several bed and breakfasts, which cater to visitors who come to the area for the antiques fair.
Demographics
As of the 2010 census, the population of Round Top was 590. The racial makeup of the town was 97.2% White, 0.2% African American, 0.2% Native American, 0.2% Asian, 0.2% from other races, and 1.9% from two or more races. Hispanic or Latino of any race were 2.7% of the population.
The median household income in Round Top was $45,000, and the median family income was $50,000. The per capita income was $20,000. About 8.3% of families and 10.3% of the population were below the poverty line.
Common Questions
What is Per Capita Income in Round Top?
Per Capita income in Round Top is $191,799.
What is the Median Family Income in Round Top?
Median Family Income in Round Top is $195,625.
What is the Median Household income in Round Top?
Median Household Income in Round Top is $155,000.
What is Inequality or Gini Index in Round Top?
Inequality or Gini Index in Round Top is 0.70.
What is the Total Population of Round Top?
Total Population of Round Top is 111.
What is the Total Male Population of Round Top?
Total Male Population of Round Top is 53.
What is the Total Female Population of Round Top?
Total Female Population of Round Top is 58.
What is the Ratio of Males per 100 Females in Round Top?
There are 91.38 Males per 100 Females in Round Top.
What is the Ratio of Females per 100 Males in Round Top?
There are 109.43 Females per 100 Males in Round Top.
What is the Median Population Age in Round Top?
Median Population Age in Round Top is 56.5 Years.
What is the Average Family Size in Round Top
Average Family Size in Round Top is 2.9 People.
What is the Average Household Size in Round Top
Average Household Size in Round Top is 2.3 People.
How Large is the Labor Force in Round Top?
There are 62 People in the Labor Forcein in Round Top.
What is the Percentage of People in the Labor Force in Round Top?
61.4% of People are in the Labor Force in Round Top.