Industry, TX Map & Demographics
Industry Map
Industry Overview
$38,876
PER CAPITA INCOME
$75,156
AVG FAMILY INCOME
$82,778
AVG HOUSEHOLD INCOME
6.9%
WAGE / INCOME GAP [ % ]
93.1¢/ $1
WAGE / INCOME GAP [ $ ]
0.38
INEQUALITY / GINI INDEX
276
TOTAL POPULATION
125
MALE POPULATION
151
FEMALE POPULATION
82.78
MALES / 100 FEMALES
120.80
FEMALES / 100 MALES
57.1
MEDIAN AGE
2.6
AVG FAMILY SIZE
2.4
AVG HOUSEHOLD SIZE
143
LABOR FORCE [ PEOPLE ]
57.4%
PERCENT IN LABOR FORCE
2.1%
UNEMPLOYMENT RATE
Industry Zip Codes
Industry Area Codes
Income in Industry
Income Overview in Industry
Per Capita Income in Industry is $38,876, while median incomes of families and households are $75,156 and $82,778 respectively.
| Characteristic | Number | Measure |
| Per Capita Income | 276 | $38,876 |
| Median Family Income | 93 | $75,156 |
| Mean Family Income | 93 | $80,517 |
| Median Household Income | 116 | $82,778 |
| Mean Household Income | 116 | $90,379 |
| Income Deficit | 93 | $0 |
| Wage / Income Gap (%) | 276 | 6.87% |
| Wage / Income Gap ($) | 276 | 93.13¢ per $1 |
| Gini / Inequality Index | 276 | 0.38 |
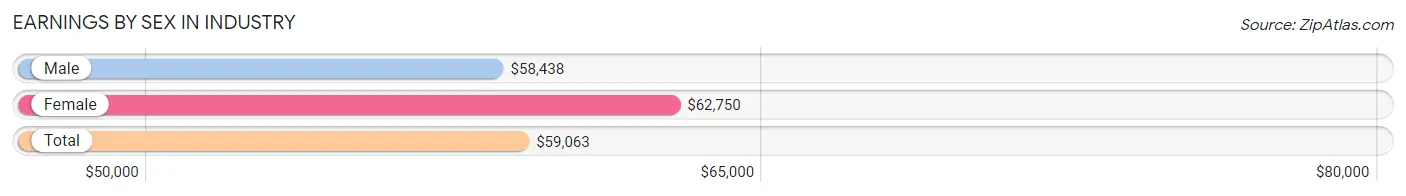
Earnings by Sex in Industry
Average Earnings in Industry are $59,063, $58,438 for men and $62,750 for women, a difference of 6.9%.
| Sex | Number | Average Earnings |
| Male | 65 (53.7%) | $58,438 |
| Female | 56 (46.3%) | $62,750 |
| Total | 121 (100.0%) | $59,063 |
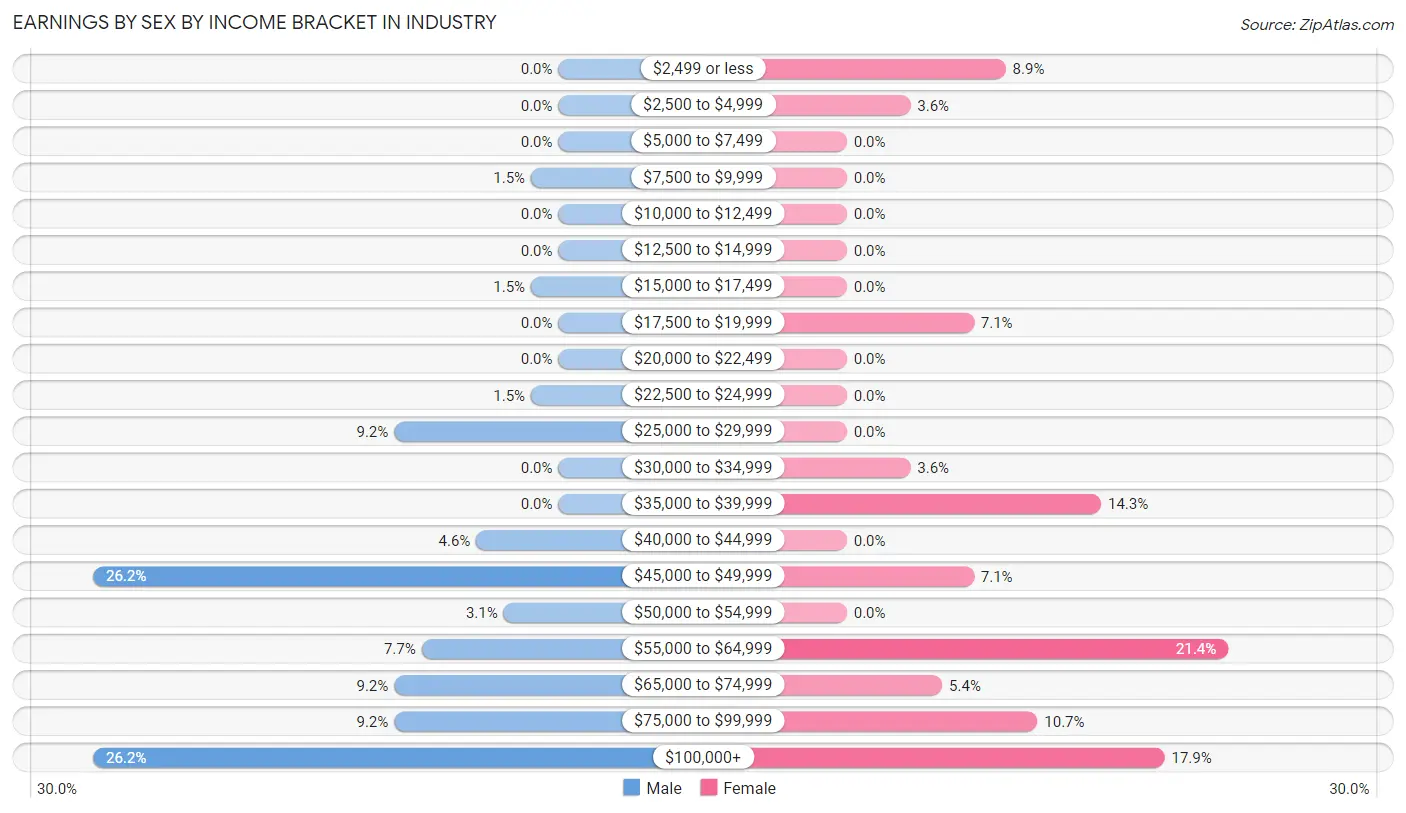
Earnings by Sex by Income Bracket in Industry
The most common earnings brackets in Industry are $45,000 to $49,999 for men (17 | 26.2%) and $55,000 to $64,999 for women (12 | 21.4%).
| Income | Male | Female |
| $2,499 or less | 0 (0.0%) | 5 (8.9%) |
| $2,500 to $4,999 | 0 (0.0%) | 2 (3.6%) |
| $5,000 to $7,499 | 0 (0.0%) | 0 (0.0%) |
| $7,500 to $9,999 | 1 (1.5%) | 0 (0.0%) |
| $10,000 to $12,499 | 0 (0.0%) | 0 (0.0%) |
| $12,500 to $14,999 | 0 (0.0%) | 0 (0.0%) |
| $15,000 to $17,499 | 1 (1.5%) | 0 (0.0%) |
| $17,500 to $19,999 | 0 (0.0%) | 4 (7.1%) |
| $20,000 to $22,499 | 0 (0.0%) | 0 (0.0%) |
| $22,500 to $24,999 | 1 (1.5%) | 0 (0.0%) |
| $25,000 to $29,999 | 6 (9.2%) | 0 (0.0%) |
| $30,000 to $34,999 | 0 (0.0%) | 2 (3.6%) |
| $35,000 to $39,999 | 0 (0.0%) | 8 (14.3%) |
| $40,000 to $44,999 | 3 (4.6%) | 0 (0.0%) |
| $45,000 to $49,999 | 17 (26.2%) | 4 (7.1%) |
| $50,000 to $54,999 | 2 (3.1%) | 0 (0.0%) |
| $55,000 to $64,999 | 5 (7.7%) | 12 (21.4%) |
| $65,000 to $74,999 | 6 (9.2%) | 3 (5.4%) |
| $75,000 to $99,999 | 6 (9.2%) | 6 (10.7%) |
| $100,000+ | 17 (26.2%) | 10 (17.9%) |
| Total | 65 (100.0%) | 56 (100.0%) |
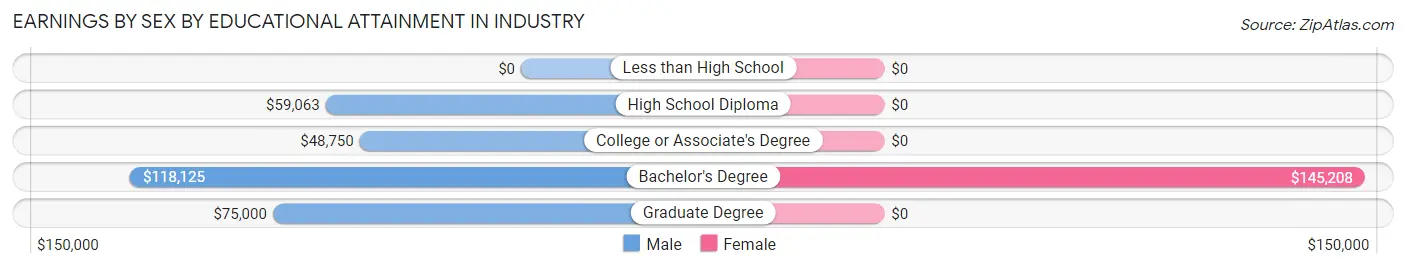
Earnings by Sex by Educational Attainment in Industry
| Educational Attainment | Male Income | Female Income |
| Less than High School | - | - |
| High School Diploma | $59,063 | $0 |
| College or Associate's Degree | $48,750 | $0 |
| Bachelor's Degree | $118,125 | $145,208 |
| Graduate Degree | $75,000 | $0 |
| Total | $58,438 | $0 |
Family Income in Industry
Family Income Brackets in Industry
According to the Industry family income data, there are 19 families falling into the $75,000 to $99,999 income range, which is the most common income bracket and makes up 20.4% of all families.
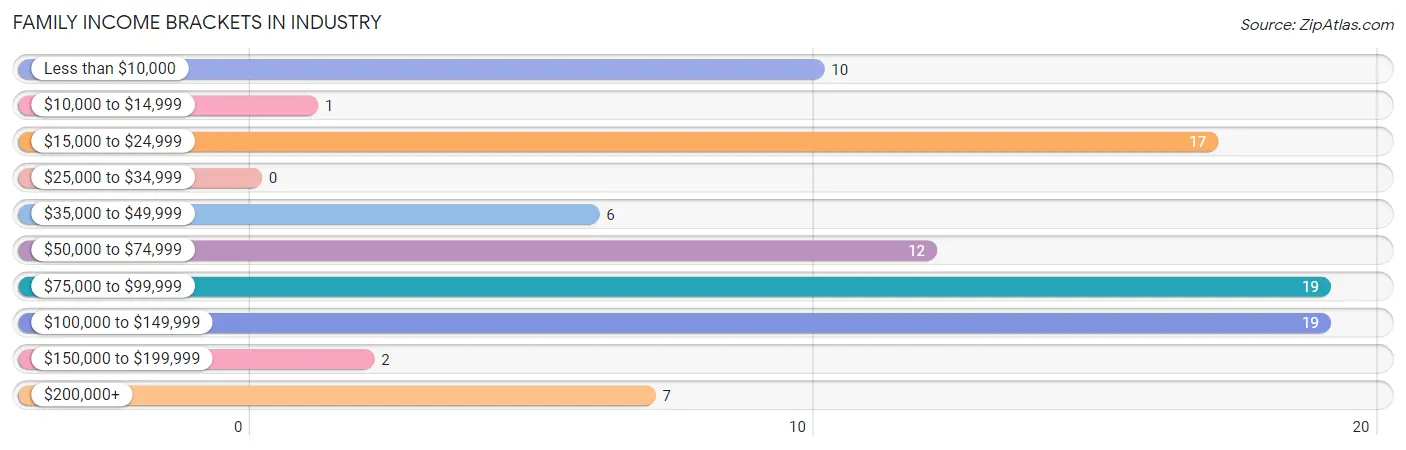
| Income Bracket | # Families | % Families |
| Less than $10,000 | 10 | 10.8% |
| $10,000 to $14,999 | 1 | 1.1% |
| $15,000 to $24,999 | 17 | 18.3% |
| $25,000 to $34,999 | 0 | 0.0% |
| $35,000 to $49,999 | 6 | 6.5% |
| $50,000 to $74,999 | 12 | 12.9% |
| $75,000 to $99,999 | 19 | 20.4% |
| $100,000 to $149,999 | 19 | 20.4% |
| $150,000 to $199,999 | 2 | 2.2% |
| $200,000+ | 7 | 7.5% |
Family Income by Famaliy Size in Industry
5-person families (6 | 6.5%) account for the highest median family income in Industry with $138,750 per family, while 2-person families (71 | 76.3%) have the highest median income of $36,625 per family member.
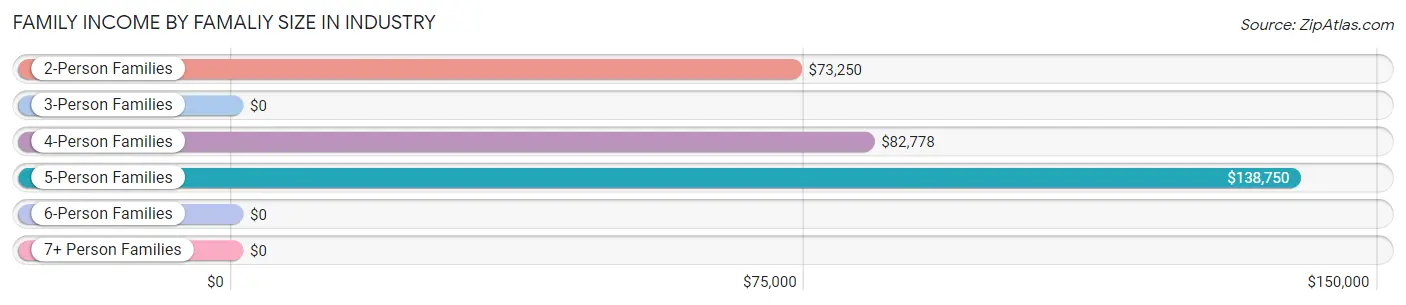
| Income Bracket | # Families | Median Income |
| 2-Person Families | 71 (76.3%) | $73,250 |
| 3-Person Families | 0 (0.0%) | $0 |
| 4-Person Families | 16 (17.2%) | $82,778 |
| 5-Person Families | 6 (6.5%) | $138,750 |
| 6-Person Families | 0 (0.0%) | $0 |
| 7+ Person Families | 0 (0.0%) | $0 |
| Total | 93 (100.0%) | $75,156 |
Family Income by Number of Earners in Industry
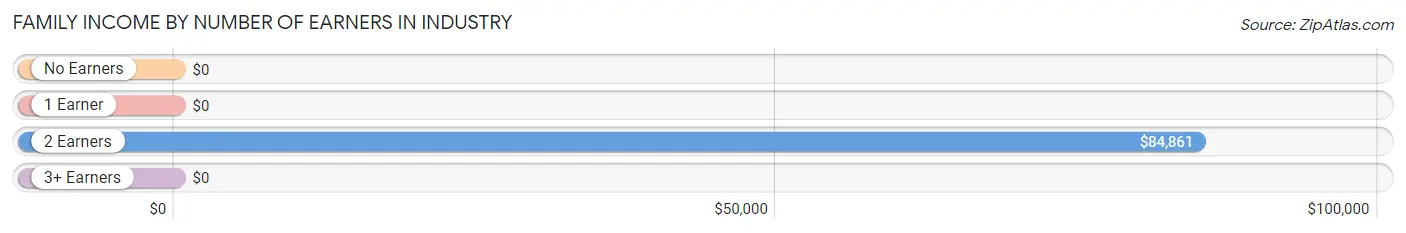
| Number of Earners | # Families | Median Income |
| No Earners | 33 (35.5%) | $0 |
| 1 Earner | 23 (24.7%) | $0 |
| 2 Earners | 35 (37.6%) | $84,861 |
| 3+ Earners | 2 (2.1%) | $0 |
| Total | 93 (100.0%) | $75,156 |
Household Income in Industry
Household Income Brackets in Industry
With 35 households falling in the category, the $100,000 to $149,999 income range is the most frequent in Industry, accounting for 30.2% of all households.
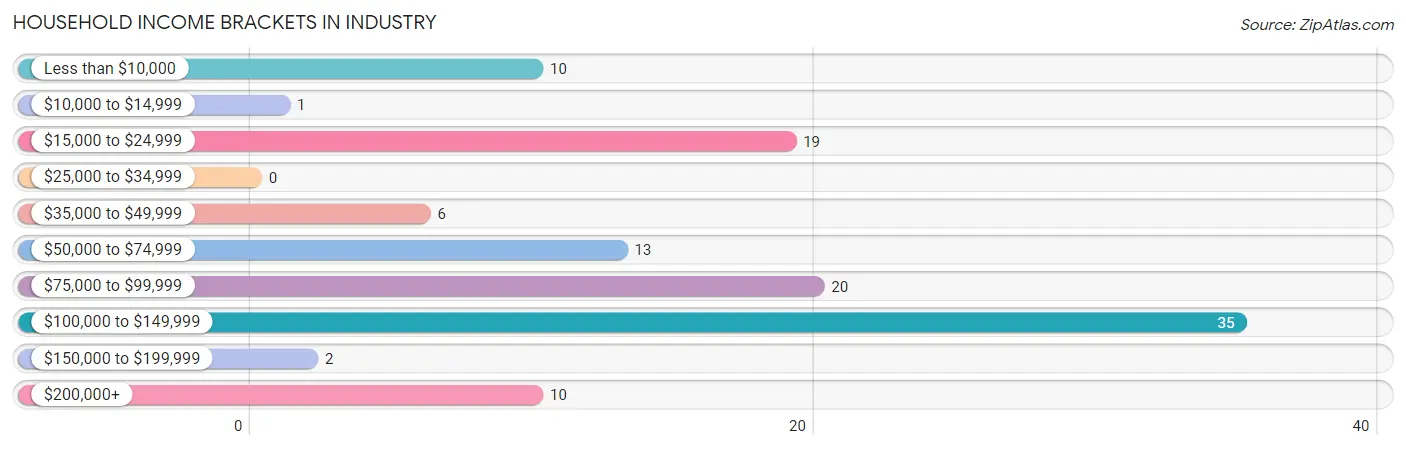
| Income Bracket | # Households | % Households |
| Less than $10,000 | 10 | 8.6% |
| $10,000 to $14,999 | 1 | 0.9% |
| $15,000 to $24,999 | 19 | 16.4% |
| $25,000 to $34,999 | 0 | 0.0% |
| $35,000 to $49,999 | 6 | 5.2% |
| $50,000 to $74,999 | 13 | 11.2% |
| $75,000 to $99,999 | 20 | 17.2% |
| $100,000 to $149,999 | 35 | 30.2% |
| $150,000 to $199,999 | 2 | 1.7% |
| $200,000+ | 10 | 8.6% |
Household Income by Householder Age in Industry
The median household income in Industry is $82,778, with the highest median household income of $120,000 found in the 65+ years age bracket for the primary householder. A total of 24 households (20.7%) fall into this category.
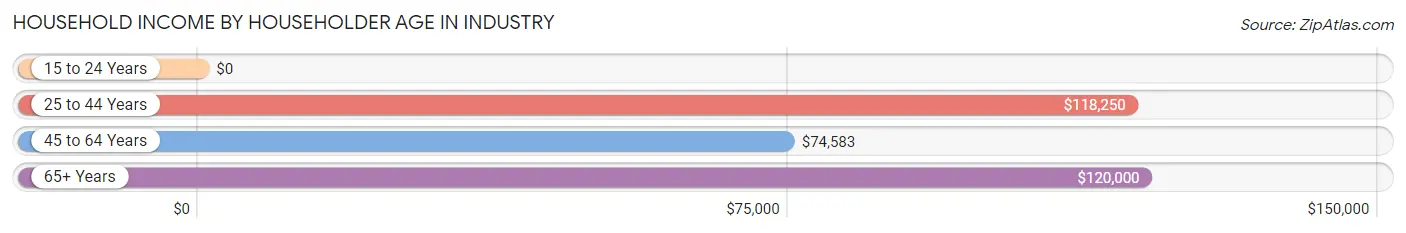
| Income Bracket | # Households | Median Income |
| 15 to 24 Years | 0 (0.0%) | $0 |
| 25 to 44 Years | 18 (15.5%) | $118,250 |
| 45 to 64 Years | 74 (63.8%) | $74,583 |
| 65+ Years | 24 (20.7%) | $120,000 |
| Total | 116 (100.0%) | $82,778 |
Poverty in Industry
Income Below Poverty by Sex and Age in Industry
With 2.5% poverty level for males and 8.6% for females among the residents of Industry, 35 to 44 year old males and 55 to 64 year old females are the most vulnerable to poverty, with 3 males (27.3%) and 10 females (23.3%) in their respective age groups living below the poverty level.
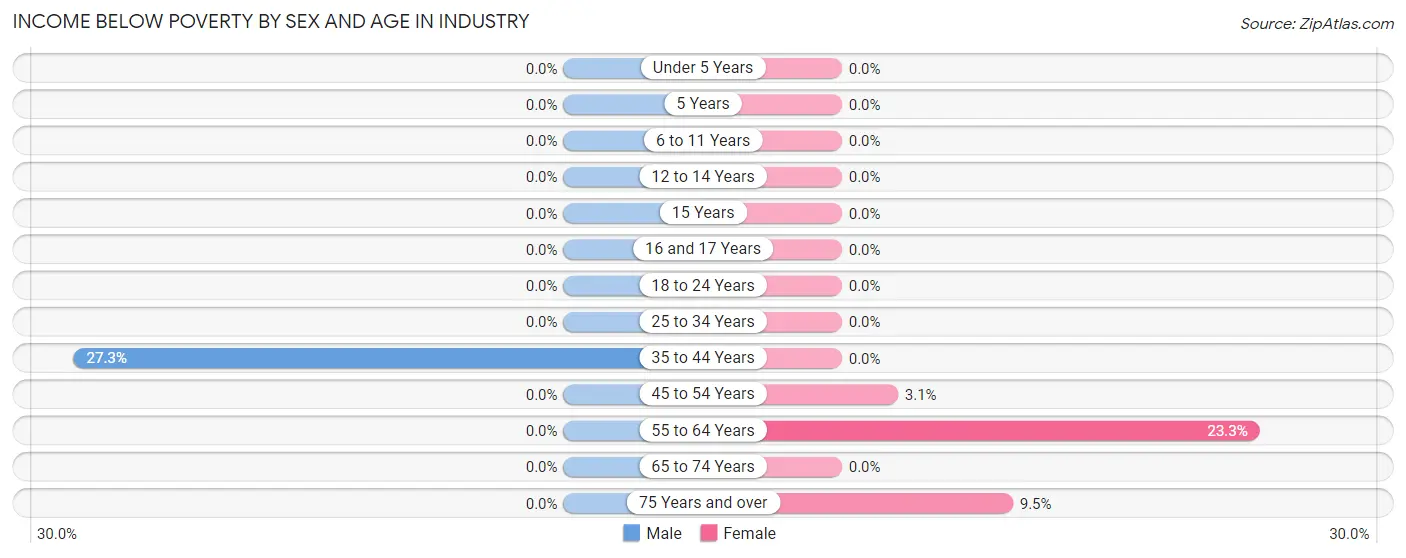
| Age Bracket | Male | Female |
| Under 5 Years | 0 (0.0%) | 0 (0.0%) |
| 5 Years | 0 (0.0%) | 0 (0.0%) |
| 6 to 11 Years | 0 (0.0%) | 0 (0.0%) |
| 12 to 14 Years | 0 (0.0%) | 0 (0.0%) |
| 15 Years | 0 (0.0%) | 0 (0.0%) |
| 16 and 17 Years | 0 (0.0%) | 0 (0.0%) |
| 18 to 24 Years | 0 (0.0%) | 0 (0.0%) |
| 25 to 34 Years | 0 (0.0%) | 0 (0.0%) |
| 35 to 44 Years | 3 (27.3%) | 0 (0.0%) |
| 45 to 54 Years | 0 (0.0%) | 1 (3.1%) |
| 55 to 64 Years | 0 (0.0%) | 10 (23.3%) |
| 65 to 74 Years | 0 (0.0%) | 0 (0.0%) |
| 75 Years and over | 0 (0.0%) | 2 (9.5%) |
| Total | 3 (2.5%) | 13 (8.6%) |
Income Above Poverty by Sex and Age in Industry
According to the poverty statistics in Industry, males aged 6 to 11 years and females aged 6 to 11 years are the age groups that are most secure financially, with 100.0% of males and 100.0% of females in these age groups living above the poverty line.
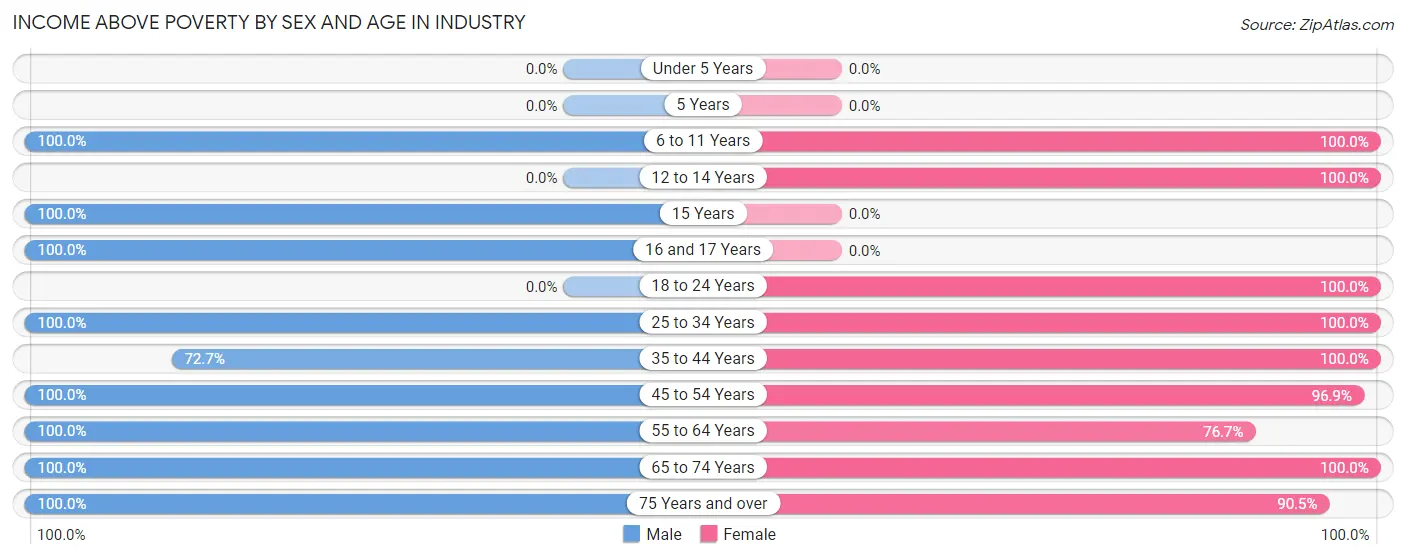
| Age Bracket | Male | Female |
| Under 5 Years | 0 (0.0%) | 0 (0.0%) |
| 5 Years | 0 (0.0%) | 0 (0.0%) |
| 6 to 11 Years | 8 (100.0%) | 4 (100.0%) |
| 12 to 14 Years | 0 (0.0%) | 9 (100.0%) |
| 15 Years | 3 (100.0%) | 0 (0.0%) |
| 16 and 17 Years | 3 (100.0%) | 0 (0.0%) |
| 18 to 24 Years | 0 (0.0%) | 23 (100.0%) |
| 25 to 34 Years | 12 (100.0%) | 2 (100.0%) |
| 35 to 44 Years | 8 (72.7%) | 4 (100.0%) |
| 45 to 54 Years | 19 (100.0%) | 31 (96.9%) |
| 55 to 64 Years | 54 (100.0%) | 33 (76.7%) |
| 65 to 74 Years | 6 (100.0%) | 13 (100.0%) |
| 75 Years and over | 6 (100.0%) | 19 (90.5%) |
| Total | 119 (97.5%) | 138 (91.4%) |
Income Below Poverty Among Married-Couple Families in Industry
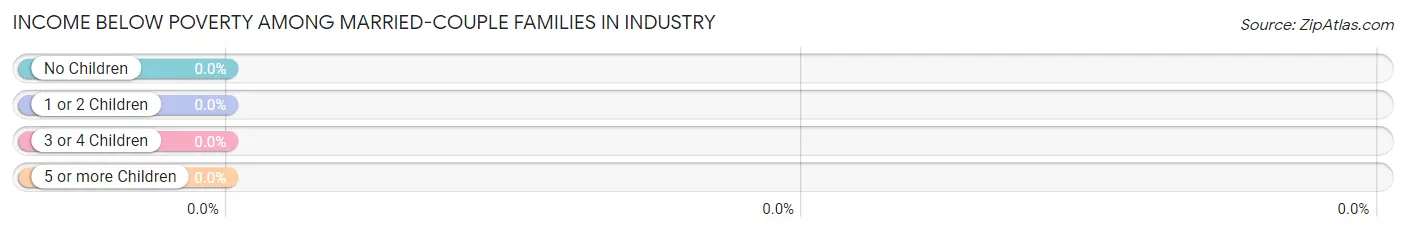
| Children | Above Poverty | Below Poverty |
| No Children | 56 (100.0%) | 0 (0.0%) |
| 1 or 2 Children | 16 (100.0%) | 0 (0.0%) |
| 3 or 4 Children | 4 (100.0%) | 0 (0.0%) |
| 5 or more Children | 0 (0.0%) | 0 (0.0%) |
| Total | 76 (100.0%) | 0 (0.0%) |
Income Below Poverty Among Single-Parent Households in Industry
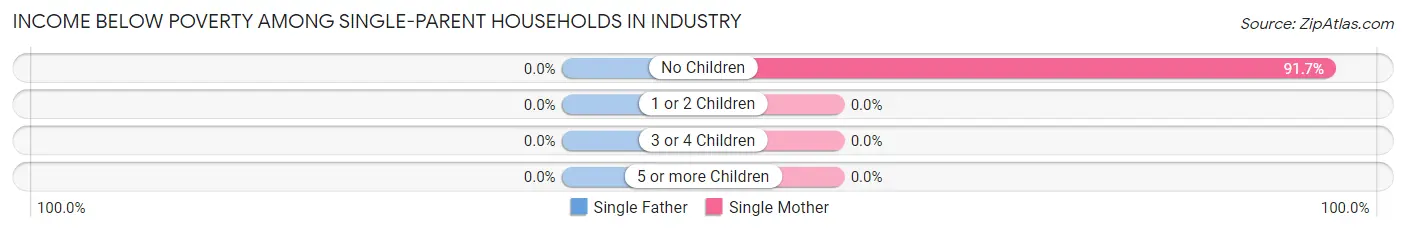
| Children | Single Father | Single Mother |
| No Children | 0 (0.0%) | 11 (91.7%) |
| 1 or 2 Children | 0 (0.0%) | 0 (0.0%) |
| 3 or 4 Children | 0 (0.0%) | 0 (0.0%) |
| 5 or more Children | 0 (0.0%) | 0 (0.0%) |
| Total | 0 (0.0%) | 11 (91.7%) |
Income Below Poverty Among Married-Couple vs Single-Parent Households in Industry
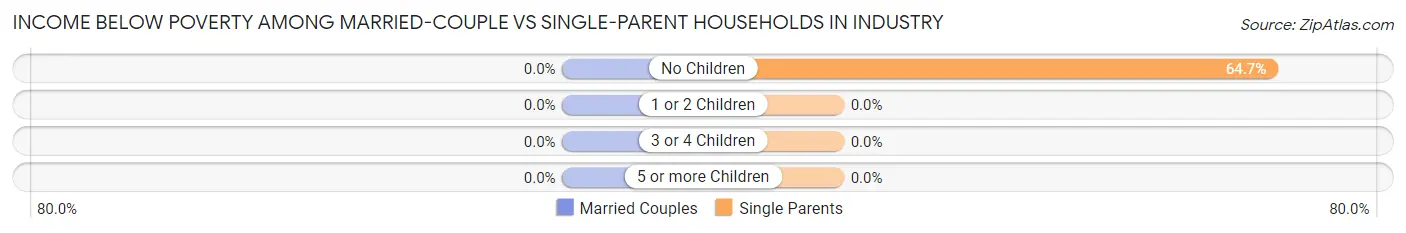
| Children | Married-Couple Families | Single-Parent Households |
| No Children | 0 (0.0%) | 11 (64.7%) |
| 1 or 2 Children | 0 (0.0%) | 0 (0.0%) |
| 3 or 4 Children | 0 (0.0%) | 0 (0.0%) |
| 5 or more Children | 0 (0.0%) | 0 (0.0%) |
| Total | 0 (0.0%) | 11 (64.7%) |
Race in Industry
The most populous races in Industry are White / Caucasian (186 | 67.4%), Black / African American (71 | 25.7%), and Hispanic or Latino (23 | 8.3%).
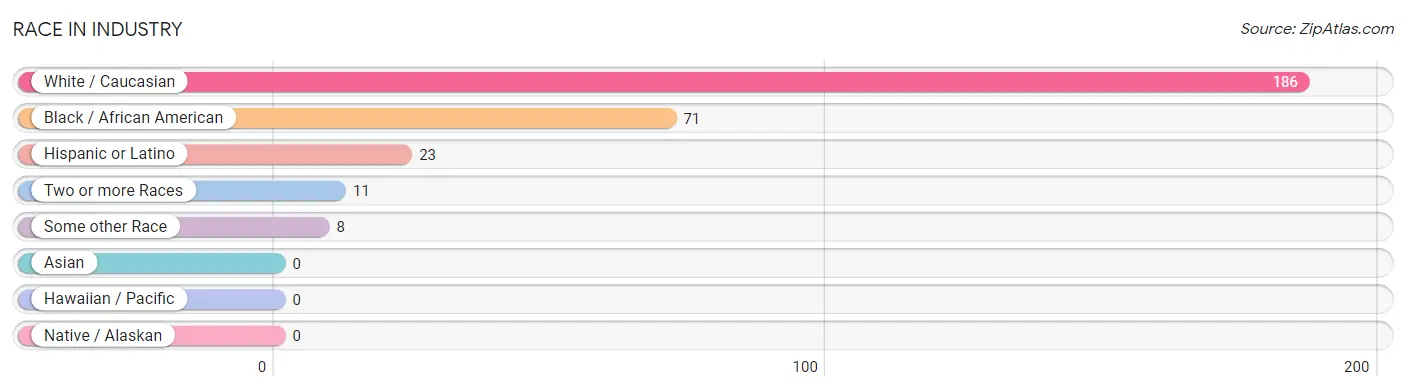
| Race | # Population | % Population |
| Asian | 0 | 0.0% |
| Black / African American | 71 | 25.7% |
| Hawaiian / Pacific | 0 | 0.0% |
| Hispanic or Latino | 23 | 8.3% |
| Native / Alaskan | 0 | 0.0% |
| White / Caucasian | 186 | 67.4% |
| Two or more Races | 11 | 4.0% |
| Some other Race | 8 | 2.9% |
| Total | 276 | 100.0% |
Ancestry in Industry
The most populous ancestries reported in Industry are German (122 | 44.2%), African (46 | 16.7%), Subsaharan African (46 | 16.7%), Irish (35 | 12.7%), and English (23 | 8.3%), together accounting for 98.6% of all Industry residents.
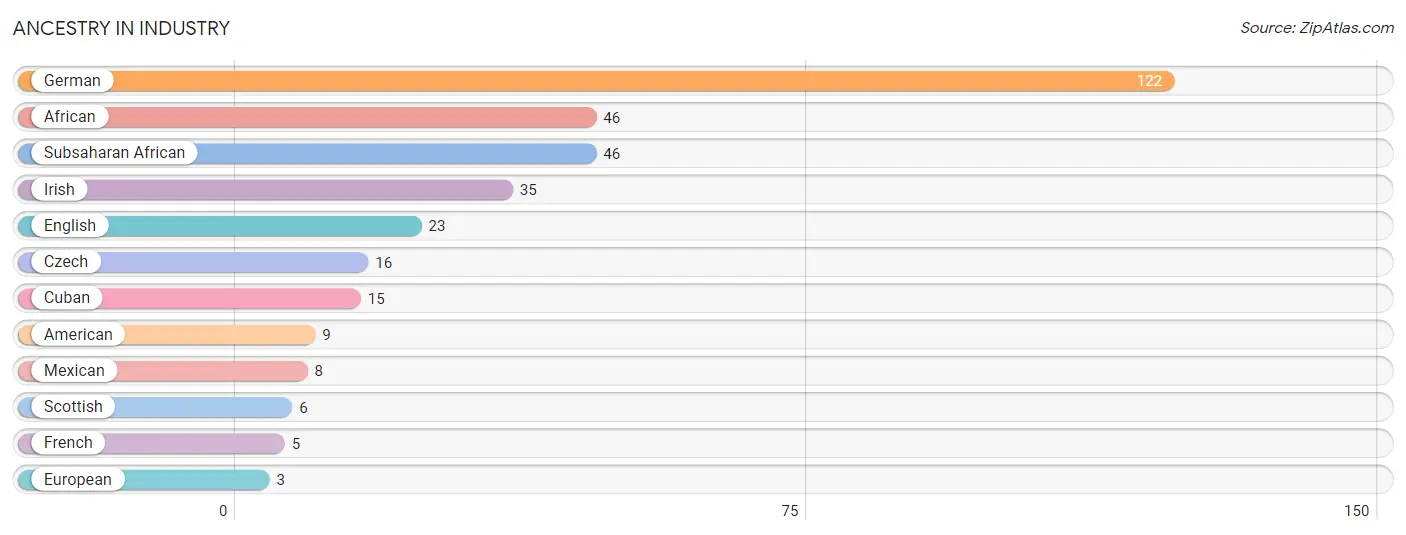
| Ancestry | # Population | % Population |
| African | 46 | 16.7% |
| American | 9 | 3.3% |
| Cuban | 15 | 5.4% |
| Czech | 16 | 5.8% |
| English | 23 | 8.3% |
| European | 3 | 1.1% |
| French | 5 | 1.8% |
| German | 122 | 44.2% |
| Irish | 35 | 12.7% |
| Mexican | 8 | 2.9% |
| Scottish | 6 | 2.2% |
| Subsaharan African | 46 | 16.7% | View All 12 Rows |
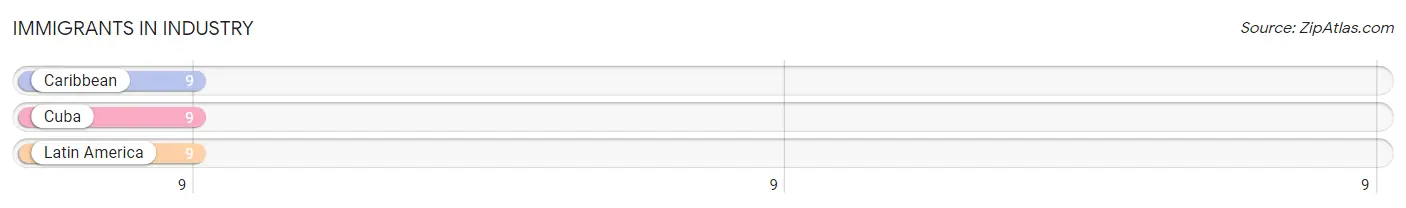
Immigrants in Industry
The most numerous immigrant groups reported in Industry came from Caribbean (9 | 3.3%), Cuba (9 | 3.3%), and Latin America (9 | 3.3%), together accounting for 9.8% of all Industry residents.
| Immigration Origin | # Population | % Population |
| Caribbean | 9 | 3.3% |
| Cuba | 9 | 3.3% |
| Latin America | 9 | 3.3% | View All 3 Rows |
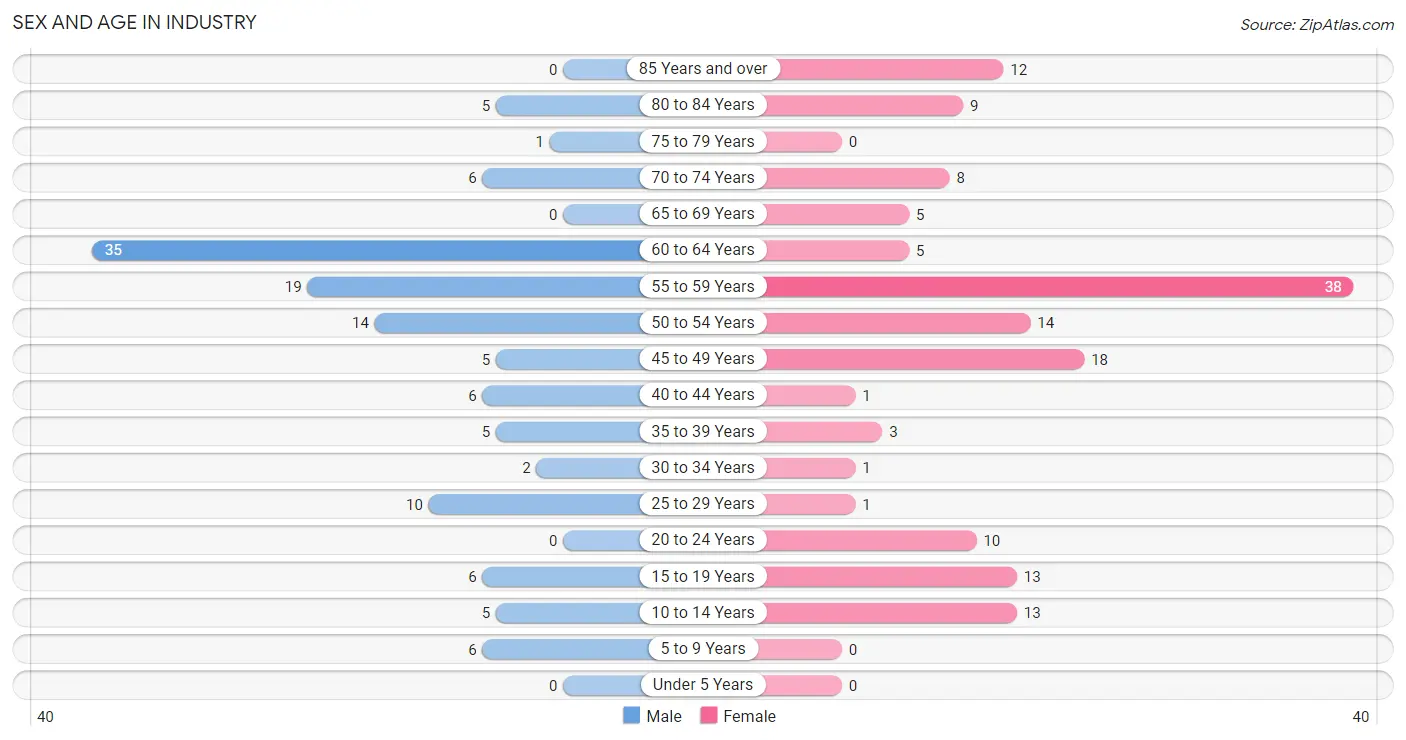
Sex and Age in Industry
Sex and Age in Industry
The most populous age groups in Industry are 60 to 64 Years (35 | 28.0%) for men and 55 to 59 Years (38 | 25.2%) for women.
| Age Bracket | Male | Female |
| Under 5 Years | 0 (0.0%) | 0 (0.0%) |
| 5 to 9 Years | 6 (4.8%) | 0 (0.0%) |
| 10 to 14 Years | 5 (4.0%) | 13 (8.6%) |
| 15 to 19 Years | 6 (4.8%) | 13 (8.6%) |
| 20 to 24 Years | 0 (0.0%) | 10 (6.6%) |
| 25 to 29 Years | 10 (8.0%) | 1 (0.7%) |
| 30 to 34 Years | 2 (1.6%) | 1 (0.7%) |
| 35 to 39 Years | 5 (4.0%) | 3 (2.0%) |
| 40 to 44 Years | 6 (4.8%) | 1 (0.7%) |
| 45 to 49 Years | 5 (4.0%) | 18 (11.9%) |
| 50 to 54 Years | 14 (11.2%) | 14 (9.3%) |
| 55 to 59 Years | 19 (15.2%) | 38 (25.2%) |
| 60 to 64 Years | 35 (28.0%) | 5 (3.3%) |
| 65 to 69 Years | 0 (0.0%) | 5 (3.3%) |
| 70 to 74 Years | 6 (4.8%) | 8 (5.3%) |
| 75 to 79 Years | 1 (0.8%) | 0 (0.0%) |
| 80 to 84 Years | 5 (4.0%) | 9 (6.0%) |
| 85 Years and over | 0 (0.0%) | 12 (8.0%) |
| Total | 125 (100.0%) | 151 (100.0%) |
Families and Households in Industry
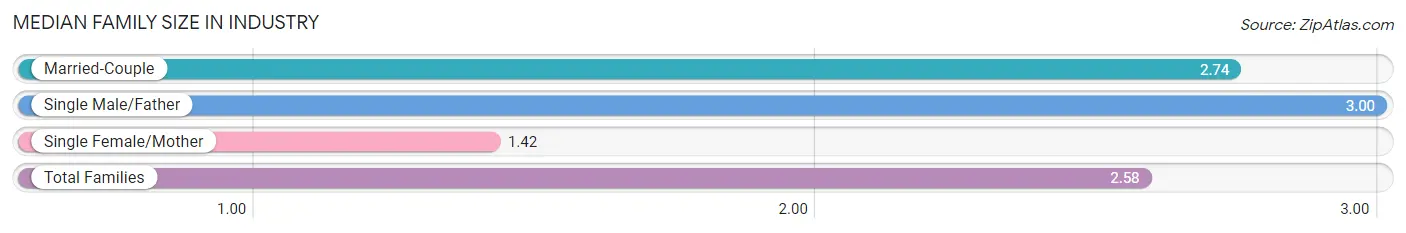
Median Family Size in Industry
The median family size in Industry is 2.58 persons per family, with single male/father families (5 | 5.4%) accounting for the largest median family size of 3 persons per family. On the other hand, single female/mother families (12 | 12.9%) represent the smallest median family size with 1.42 persons per family.
| Family Type | # Families | Family Size |
| Married-Couple | 76 (81.7%) | 2.74 |
| Single Male/Father | 5 (5.4%) | 3.00 |
| Single Female/Mother | 12 (12.9%) | 1.42 |
| Total Families | 93 (100.0%) | 2.58 |
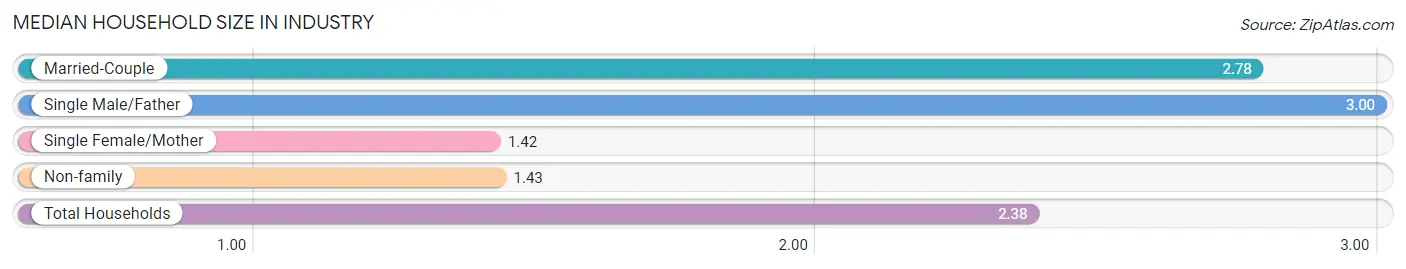
Median Household Size in Industry
The median household size in Industry is 2.38 persons per household, with single male/father households (5 | 4.3%) accounting for the largest median household size of 3 persons per household. single female/mother households (12 | 10.3%) represent the smallest median household size with 1.42 persons per household.
| Household Type | # Households | Household Size |
| Married-Couple | 76 (65.5%) | 2.78 |
| Single Male/Father | 5 (4.3%) | 3.00 |
| Single Female/Mother | 12 (10.3%) | 1.42 |
| Non-family | 23 (19.8%) | 1.43 |
| Total Households | 116 (100.0%) | 2.38 |
Household Size by Marriage Status in Industry
Out of a total of 116 households in Industry, 93 (80.2%) are family households, while 23 (19.8%) are nonfamily households. The most numerous type of family households are 2-person households, comprising 68, and the most common type of nonfamily households are 1-person households, comprising 21.
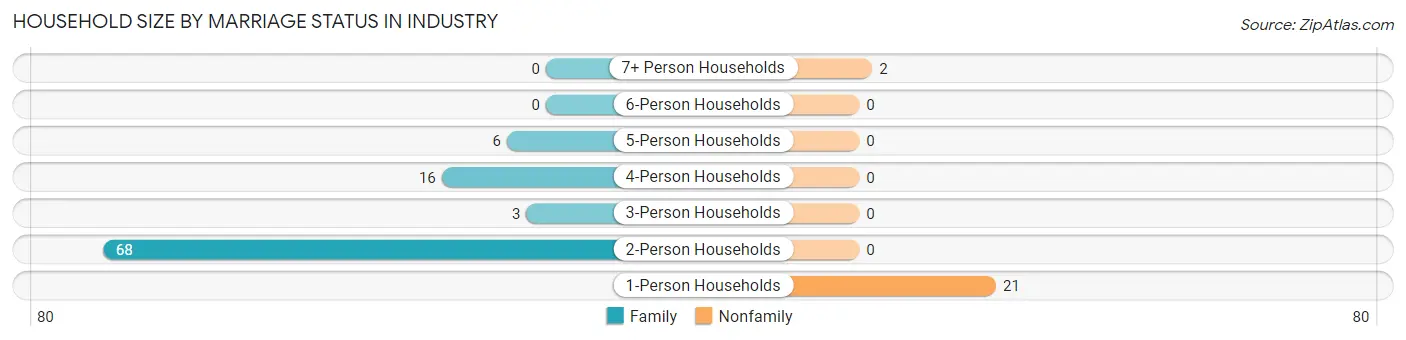
| Household Size | Family Households | Nonfamily Households |
| 1-Person Households | - | 21 (18.1%) |
| 2-Person Households | 68 (58.6%) | 0 (0.0%) |
| 3-Person Households | 3 (2.6%) | 0 (0.0%) |
| 4-Person Households | 16 (13.8%) | 0 (0.0%) |
| 5-Person Households | 6 (5.2%) | 0 (0.0%) |
| 6-Person Households | 0 (0.0%) | 0 (0.0%) |
| 7+ Person Households | 0 (0.0%) | 2 (1.7%) |
| Total | 93 (80.2%) | 23 (19.8%) |
Female Fertility in Industry
Fertility by Age in Industry
| Age Bracket | Women with Births | Births / 1,000 Women |
| 15 to 19 years | 0 (0.0%) | 0.0 |
| 20 to 34 years | 0 (0.0%) | 0.0 |
| 35 to 50 years | 0 (0.0%) | 0.0 |
| Total | 0 (0.0%) | 0.0 |
Fertility by Age by Marriage Status in Industry
| Age Bracket | Married | Unmarried |
| 15 to 19 years | 0 (0.0%) | 0 (0.0%) |
| 20 to 34 years | 0 (0.0%) | 0 (0.0%) |
| 35 to 50 years | 0 (0.0%) | 0 (0.0%) |
| Total | 0 (0.0%) | 0 (0.0%) |
Fertility by Education in Industry
| Educational Attainment | Women with Births | Births / 1,000 Women |
| Less than High School | 0 (0.0%) | 0.0 |
| High School Diploma | 0 (0.0%) | 0.0 |
| College or Associate's Degree | 0 (0.0%) | 0.0 |
| Bachelor's Degree | 0 (0.0%) | 0.0 |
| Graduate Degree | 0 (0.0%) | 0.0 |
| Total | 0 (0.0%) | 0.0 |
Fertility by Education by Marriage Status in Industry
| Educational Attainment | Married | Unmarried |
| Less than High School | 0 (0.0%) | 0 (0.0%) |
| High School Diploma | 0 (0.0%) | 0 (0.0%) |
| College or Associate's Degree | 0 (0.0%) | 0 (0.0%) |
| Bachelor's Degree | 0 (0.0%) | 0 (0.0%) |
| Graduate Degree | 0 (0.0%) | 0 (0.0%) |
| Total | 0 (0.0%) | 0 (0.0%) |
Employment Characteristics in Industry
Employment by Class of Employer in Industry
Among the 140 employed individuals in Industry, private company employees (74 | 52.9%), unpaid family workers (27 | 19.3%), and self-employed (not incorporated) (22 | 15.7%) make up the most common classes of employment.
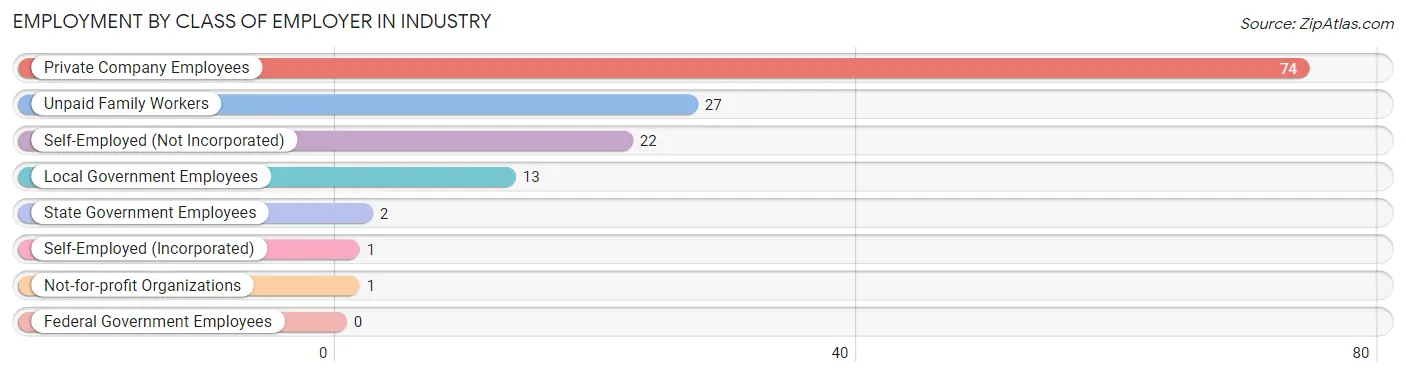
| Employer Class | # Employees | % Employees |
| Private Company Employees | 74 | 52.9% |
| Self-Employed (Incorporated) | 1 | 0.7% |
| Self-Employed (Not Incorporated) | 22 | 15.7% |
| Not-for-profit Organizations | 1 | 0.7% |
| Local Government Employees | 13 | 9.3% |
| State Government Employees | 2 | 1.4% |
| Federal Government Employees | 0 | 0.0% |
| Unpaid Family Workers | 27 | 19.3% |
| Total | 140 | 100.0% |
Employment Status by Age in Industry
According to the labor force statistics for Industry, out of the total population over 16 years of age (249), 57.4% or 143 individuals are in the labor force, with 2.1% or 3 of them unemployed. The age group with the highest labor force participation rate is 20 to 24 years, with 100.0% or 10 individuals in the labor force. Within the labor force, the 45 to 54 years age range has the highest percentage of unemployed individuals, with 8.6% or 3 of them being unemployed.
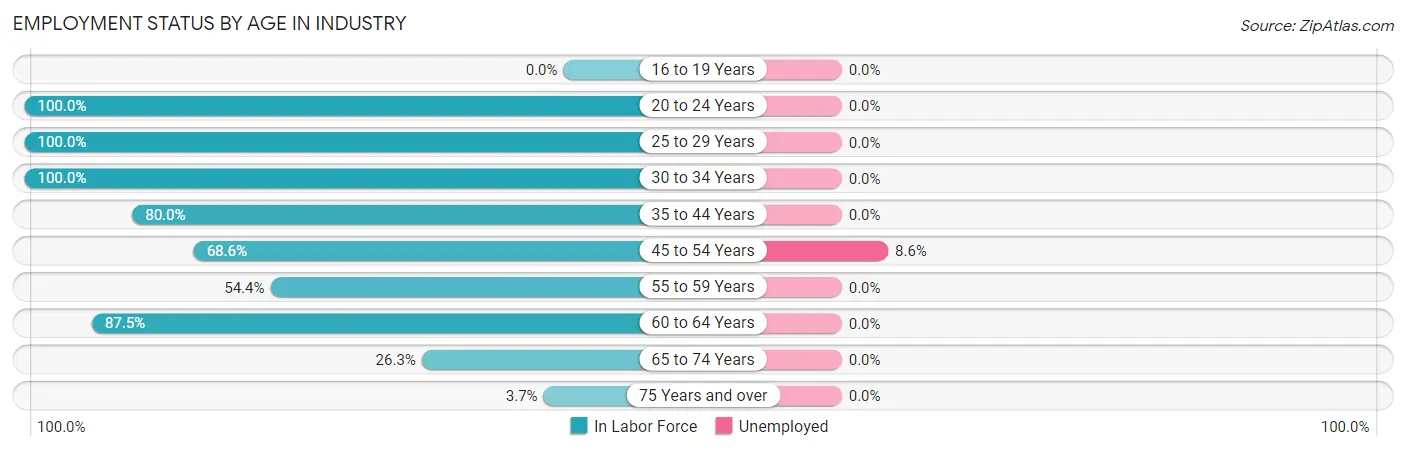
| Age Bracket | In Labor Force | Unemployed |
| 16 to 19 Years | 0 (0.0%) | 0 (0.0%) |
| 20 to 24 Years | 10 (100.0%) | 0 (0.0%) |
| 25 to 29 Years | 11 (100.0%) | 0 (0.0%) |
| 30 to 34 Years | 3 (100.0%) | 0 (0.0%) |
| 35 to 44 Years | 12 (80.0%) | 0 (0.0%) |
| 45 to 54 Years | 35 (68.6%) | 3 (8.6%) |
| 55 to 59 Years | 31 (54.4%) | 0 (0.0%) |
| 60 to 64 Years | 35 (87.5%) | 0 (0.0%) |
| 65 to 74 Years | 5 (26.3%) | 0 (0.0%) |
| 75 Years and over | 1 (3.7%) | 0 (0.0%) |
| Total | 143 (57.4%) | 3 (2.1%) |
Employment Status by Educational Attainment in Industry
According to labor force statistics for Industry, 71.8% of individuals (127) out of the total population between 25 and 64 years of age (177) are in the labor force, with 2.4% or 3 of them being unemployed. The group with the highest labor force participation rate are those with the educational attainment of bachelor's degree or higher, with 96.7% or 58 individuals in the labor force. Within the labor force, individuals with college / associate degree education have the highest percentage of unemployment, with 6.1% or 2 of them being unemployed.
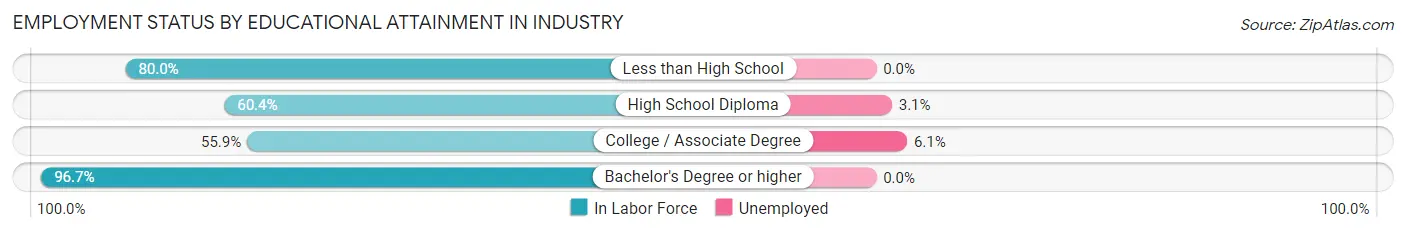
| Educational Attainment | In Labor Force | Unemployed |
| Less than High School | 4 (80.0%) | 0 (0.0%) |
| High School Diploma | 32 (60.4%) | 2 (3.1%) |
| College / Associate Degree | 33 (55.9%) | 4 (6.1%) |
| Bachelor's Degree or higher | 58 (96.7%) | 0 (0.0%) |
| Total | 127 (71.8%) | 4 (2.4%) |
Employment Occupations by Sex in Industry
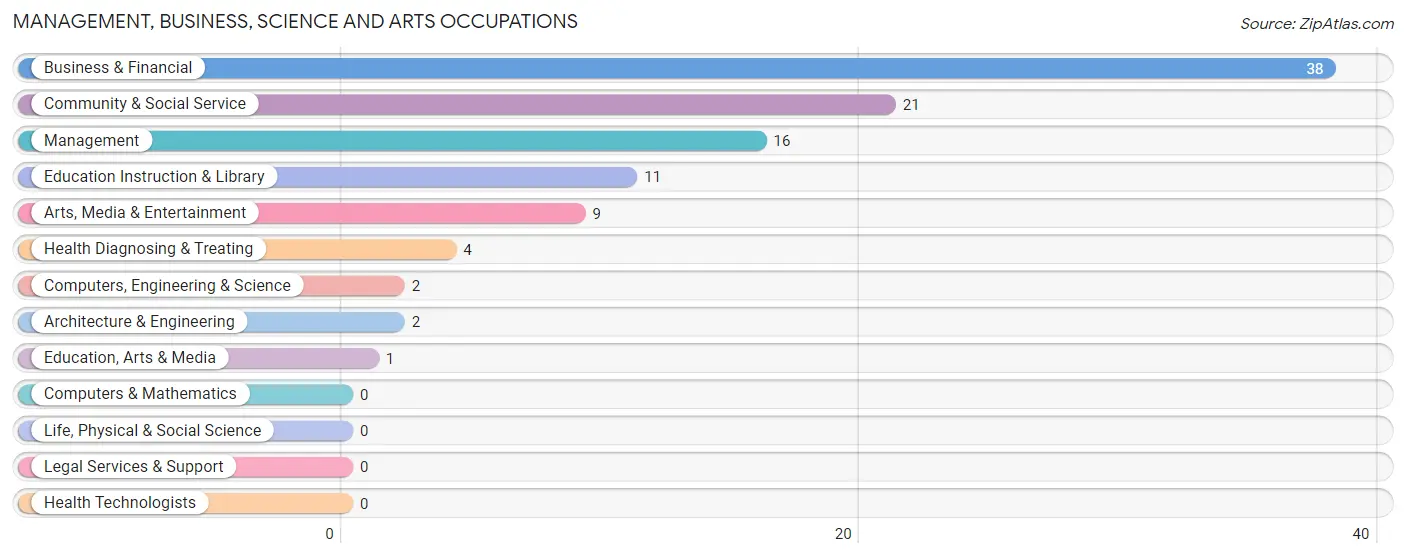
Management, Business, Science and Arts Occupations
The most common Management, Business, Science and Arts occupations in Industry are Business & Financial (38 | 27.1%), Community & Social Service (21 | 15.0%), Management (16 | 11.4%), Education Instruction & Library (11 | 7.9%), and Arts, Media & Entertainment (9 | 6.4%).
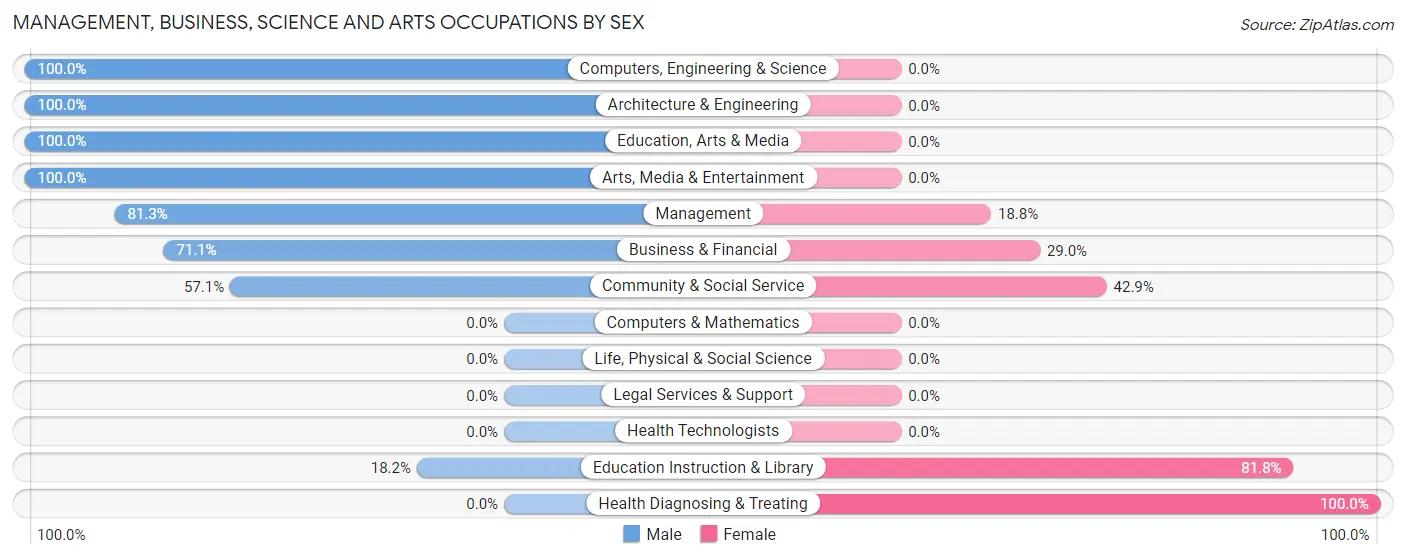
Management, Business, Science and Arts Occupations by Sex
Within the Management, Business, Science and Arts occupations in Industry, the most male-oriented occupations are Computers, Engineering & Science (100.0%), Architecture & Engineering (100.0%), and Education, Arts & Media (100.0%), while the most female-oriented occupations are Health Diagnosing & Treating (100.0%), Education Instruction & Library (81.8%), and Community & Social Service (42.9%).
| Occupation | Male | Female |
| Management | 13 (81.2%) | 3 (18.8%) |
| Business & Financial | 27 (71.1%) | 11 (28.9%) |
| Computers, Engineering & Science | 2 (100.0%) | 0 (0.0%) |
| Computers & Mathematics | 0 (0.0%) | 0 (0.0%) |
| Architecture & Engineering | 2 (100.0%) | 0 (0.0%) |
| Life, Physical & Social Science | 0 (0.0%) | 0 (0.0%) |
| Community & Social Service | 12 (57.1%) | 9 (42.9%) |
| Education, Arts & Media | 1 (100.0%) | 0 (0.0%) |
| Legal Services & Support | 0 (0.0%) | 0 (0.0%) |
| Education Instruction & Library | 2 (18.2%) | 9 (81.8%) |
| Arts, Media & Entertainment | 9 (100.0%) | 0 (0.0%) |
| Health Diagnosing & Treating | 0 (0.0%) | 4 (100.0%) |
| Health Technologists | 0 (0.0%) | 0 (0.0%) |
| Total (Category) | 54 (66.7%) | 27 (33.3%) |
| Total (Overall) | 91 (65.0%) | 49 (35.0%) |
Services Occupations
Services Occupations by Sex
| Occupation | Male | Female |
| Healthcare Support | 0 (0.0%) | 0 (0.0%) |
| Security & Protection | 0 (0.0%) | 0 (0.0%) |
| Firefighting & Prevention | 0 (0.0%) | 0 (0.0%) |
| Law Enforcement | 0 (0.0%) | 0 (0.0%) |
| Food Preparation & Serving | 0 (0.0%) | 0 (0.0%) |
| Cleaning & Maintenance | 0 (0.0%) | 0 (0.0%) |
| Personal Care & Service | 0 (0.0%) | 0 (0.0%) |
| Total (Category) | 0 (0.0%) | 0 (0.0%) |
| Total (Overall) | 91 (65.0%) | 49 (35.0%) |
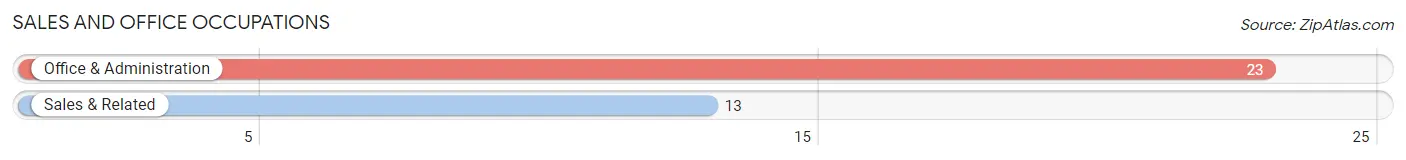
Sales and Office Occupations
The most common Sales and Office occupations in Industry are Office & Administration (23 | 16.4%), and Sales & Related (13 | 9.3%).
Sales and Office Occupations by Sex
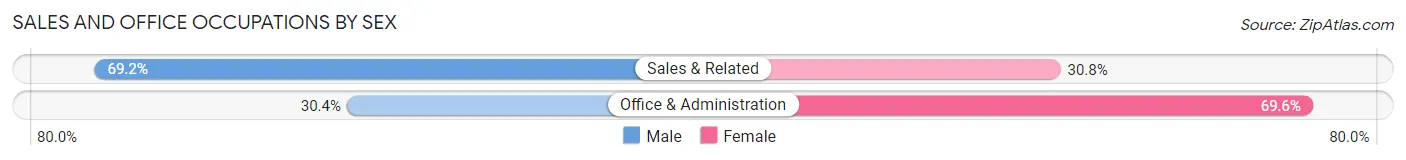
| Occupation | Male | Female |
| Sales & Related | 9 (69.2%) | 4 (30.8%) |
| Office & Administration | 7 (30.4%) | 16 (69.6%) |
| Total (Category) | 16 (44.4%) | 20 (55.6%) |
| Total (Overall) | 91 (65.0%) | 49 (35.0%) |
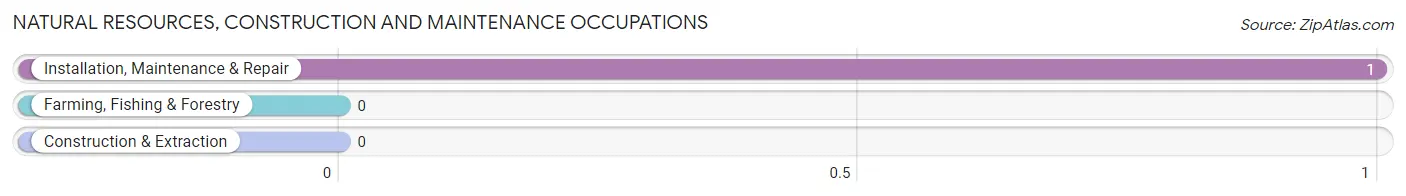
Natural Resources, Construction and Maintenance Occupations
The most common Natural Resources, Construction and Maintenance occupations in Industry are , and Installation, Maintenance & Repair (1 | 0.7%).
Natural Resources, Construction and Maintenance Occupations by Sex
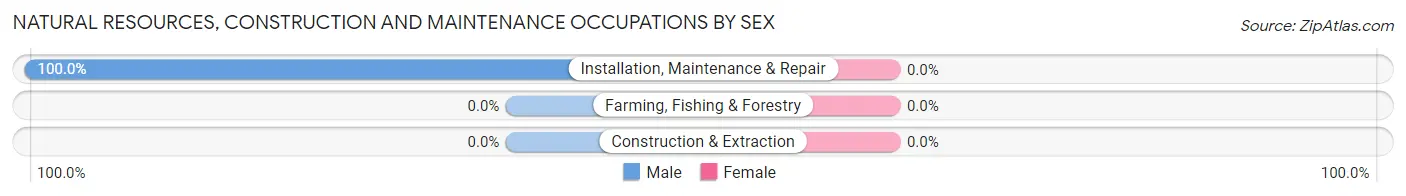
| Occupation | Male | Female |
| Farming, Fishing & Forestry | 0 (0.0%) | 0 (0.0%) |
| Construction & Extraction | 0 (0.0%) | 0 (0.0%) |
| Installation, Maintenance & Repair | 1 (100.0%) | 0 (0.0%) |
| Total (Category) | 1 (100.0%) | 0 (0.0%) |
| Total (Overall) | 91 (65.0%) | 49 (35.0%) |
Production, Transportation and Moving Occupations
The most common Production, Transportation and Moving occupations in Industry are Transportation (12 | 8.6%), Material Moving (8 | 5.7%), and Production (2 | 1.4%).
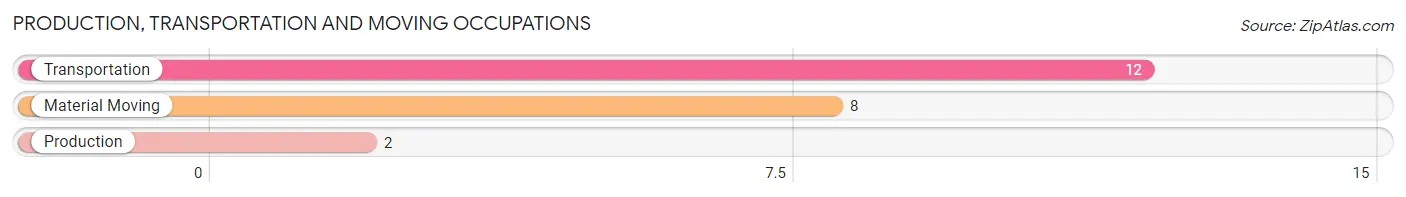
Production, Transportation and Moving Occupations by Sex
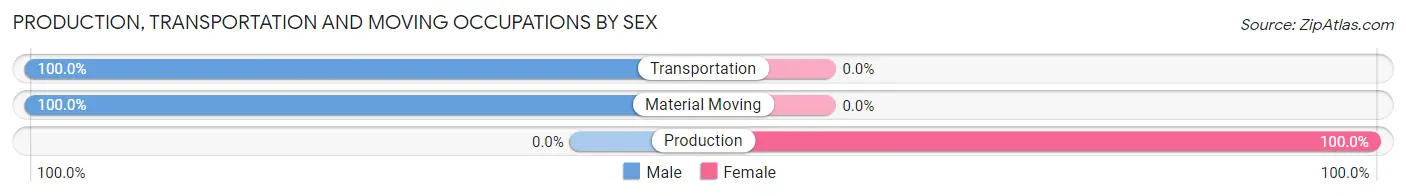
| Occupation | Male | Female |
| Production | 0 (0.0%) | 2 (100.0%) |
| Transportation | 12 (100.0%) | 0 (0.0%) |
| Material Moving | 8 (100.0%) | 0 (0.0%) |
| Total (Category) | 20 (90.9%) | 2 (9.1%) |
| Total (Overall) | 91 (65.0%) | 49 (35.0%) |
Employment Industries by Sex in Industry
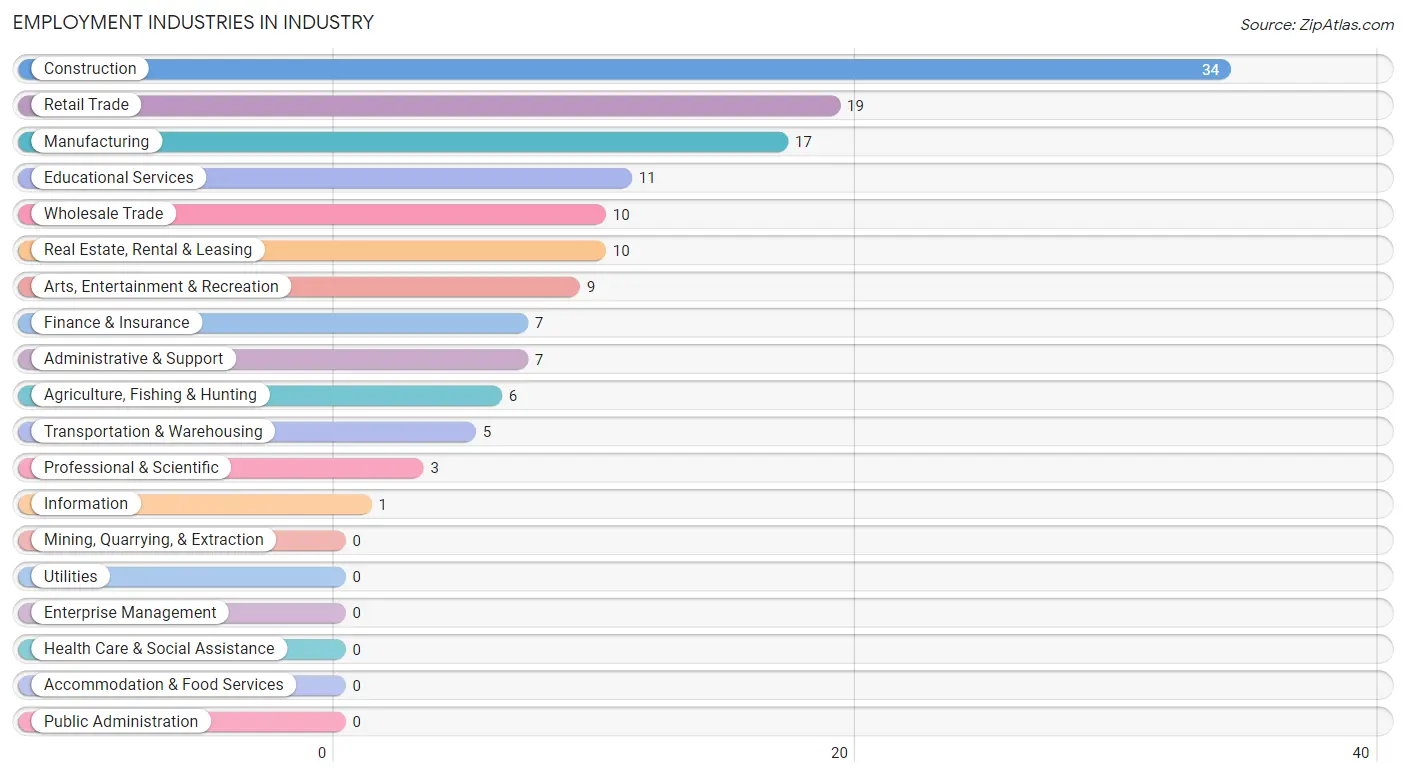
Employment Industries in Industry
The major employment industries in Industry include Construction (34 | 24.3%), Retail Trade (19 | 13.6%), Manufacturing (17 | 12.1%), Educational Services (11 | 7.9%), and Wholesale Trade (10 | 7.1%).
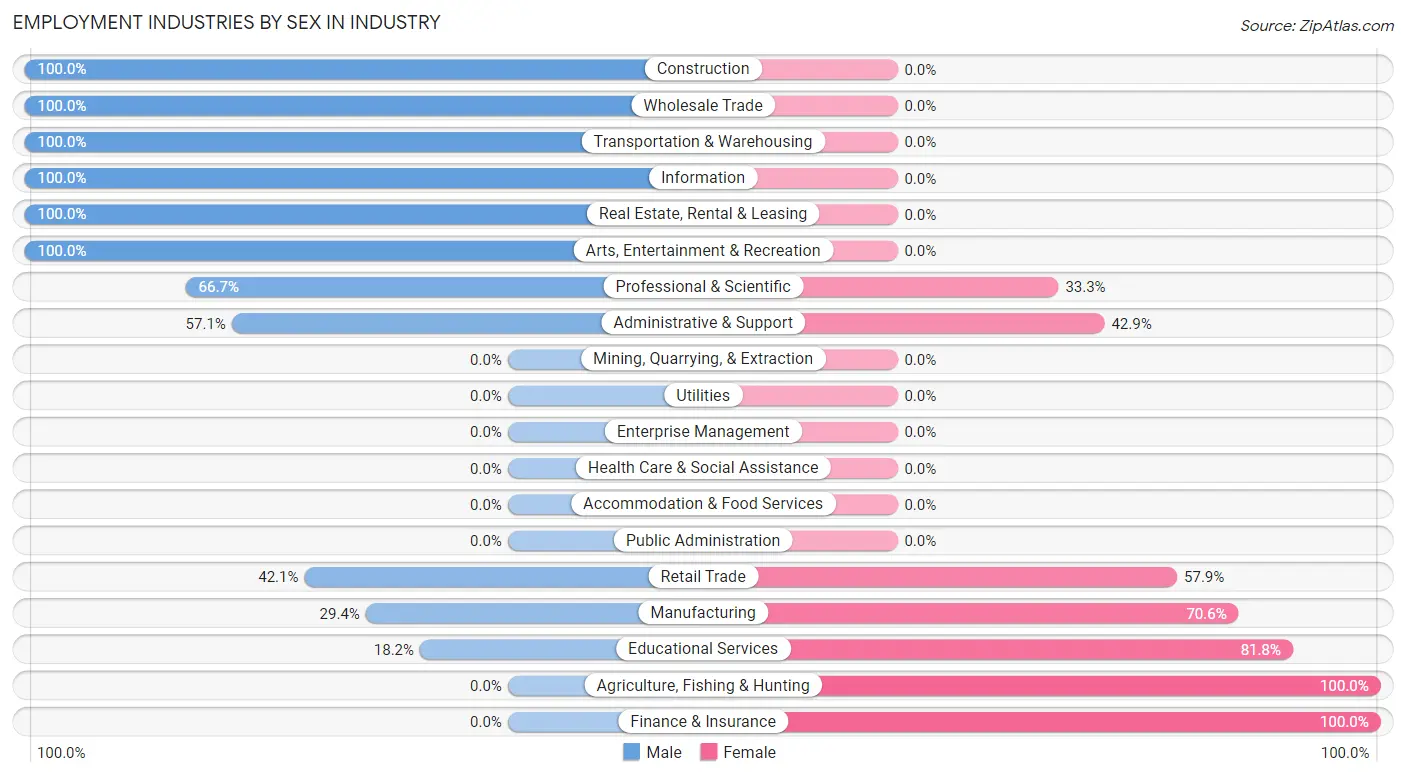
Employment Industries by Sex in Industry
The Industry industries that see more men than women are Construction (100.0%), Wholesale Trade (100.0%), and Transportation & Warehousing (100.0%), whereas the industries that tend to have a higher number of women are Agriculture, Fishing & Hunting (100.0%), Finance & Insurance (100.0%), and Educational Services (81.8%).
| Industry | Male | Female |
| Agriculture, Fishing & Hunting | 0 (0.0%) | 6 (100.0%) |
| Mining, Quarrying, & Extraction | 0 (0.0%) | 0 (0.0%) |
| Construction | 34 (100.0%) | 0 (0.0%) |
| Manufacturing | 5 (29.4%) | 12 (70.6%) |
| Wholesale Trade | 10 (100.0%) | 0 (0.0%) |
| Retail Trade | 8 (42.1%) | 11 (57.9%) |
| Transportation & Warehousing | 5 (100.0%) | 0 (0.0%) |
| Utilities | 0 (0.0%) | 0 (0.0%) |
| Information | 1 (100.0%) | 0 (0.0%) |
| Finance & Insurance | 0 (0.0%) | 7 (100.0%) |
| Real Estate, Rental & Leasing | 10 (100.0%) | 0 (0.0%) |
| Professional & Scientific | 2 (66.7%) | 1 (33.3%) |
| Enterprise Management | 0 (0.0%) | 0 (0.0%) |
| Administrative & Support | 4 (57.1%) | 3 (42.9%) |
| Educational Services | 2 (18.2%) | 9 (81.8%) |
| Health Care & Social Assistance | 0 (0.0%) | 0 (0.0%) |
| Arts, Entertainment & Recreation | 9 (100.0%) | 0 (0.0%) |
| Accommodation & Food Services | 0 (0.0%) | 0 (0.0%) |
| Public Administration | 0 (0.0%) | 0 (0.0%) |
| Total | 91 (65.0%) | 49 (35.0%) |
Education in Industry
School Enrollment in Industry
The most common levels of schooling among the 49 students in Industry are high school (19 | 38.8%), middle school (15 | 30.6%), and elementary school (9 | 18.4%).
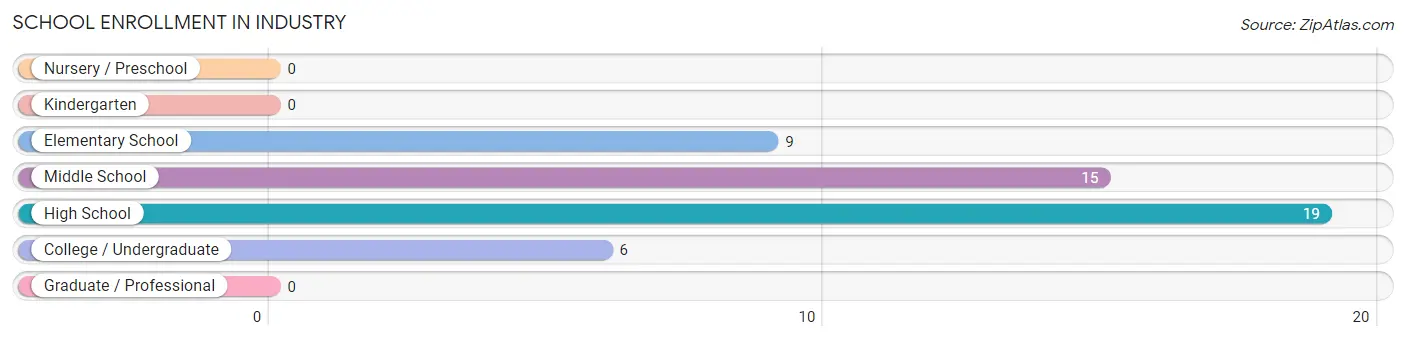
| School Level | # Students | % Students |
| Nursery / Preschool | 0 | 0.0% |
| Kindergarten | 0 | 0.0% |
| Elementary School | 9 | 18.4% |
| Middle School | 15 | 30.6% |
| High School | 19 | 38.8% |
| College / Undergraduate | 6 | 12.2% |
| Graduate / Professional | 0 | 0.0% |
| Total | 49 | 100.0% |
School Enrollment by Age by Funding Source in Industry
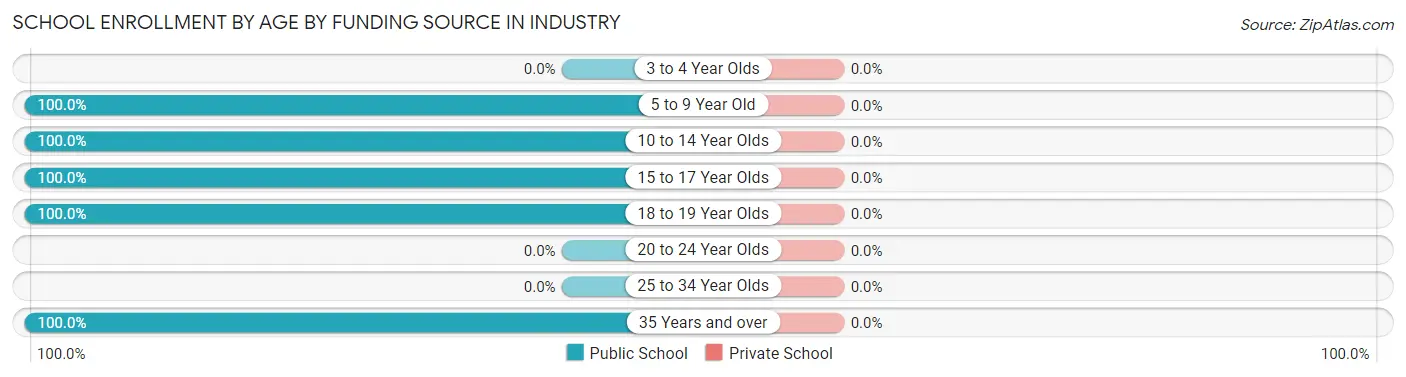
| Age Bracket | Public School | Private School |
| 3 to 4 Year Olds | 0 (0.0%) | 0 (0.0%) |
| 5 to 9 Year Old | 6 (100.0%) | 0 (0.0%) |
| 10 to 14 Year Olds | 18 (100.0%) | 0 (0.0%) |
| 15 to 17 Year Olds | 6 (100.0%) | 0 (0.0%) |
| 18 to 19 Year Olds | 13 (100.0%) | 0 (0.0%) |
| 20 to 24 Year Olds | 0 (0.0%) | 0 (0.0%) |
| 25 to 34 Year Olds | 0 (0.0%) | 0 (0.0%) |
| 35 Years and over | 6 (100.0%) | 0 (0.0%) |
| Total | 49 (100.0%) | 0 (0.0%) |
Educational Attainment by Field of Study in Industry
Business (40 | 54.0%), bio, nature & agricultural (14 | 18.9%), literature & languages (9 | 12.2%), education (5 | 6.8%), and social sciences (3 | 4.1%) are the most common fields of study among 74 individuals in Industry who have obtained a bachelor's degree or higher.
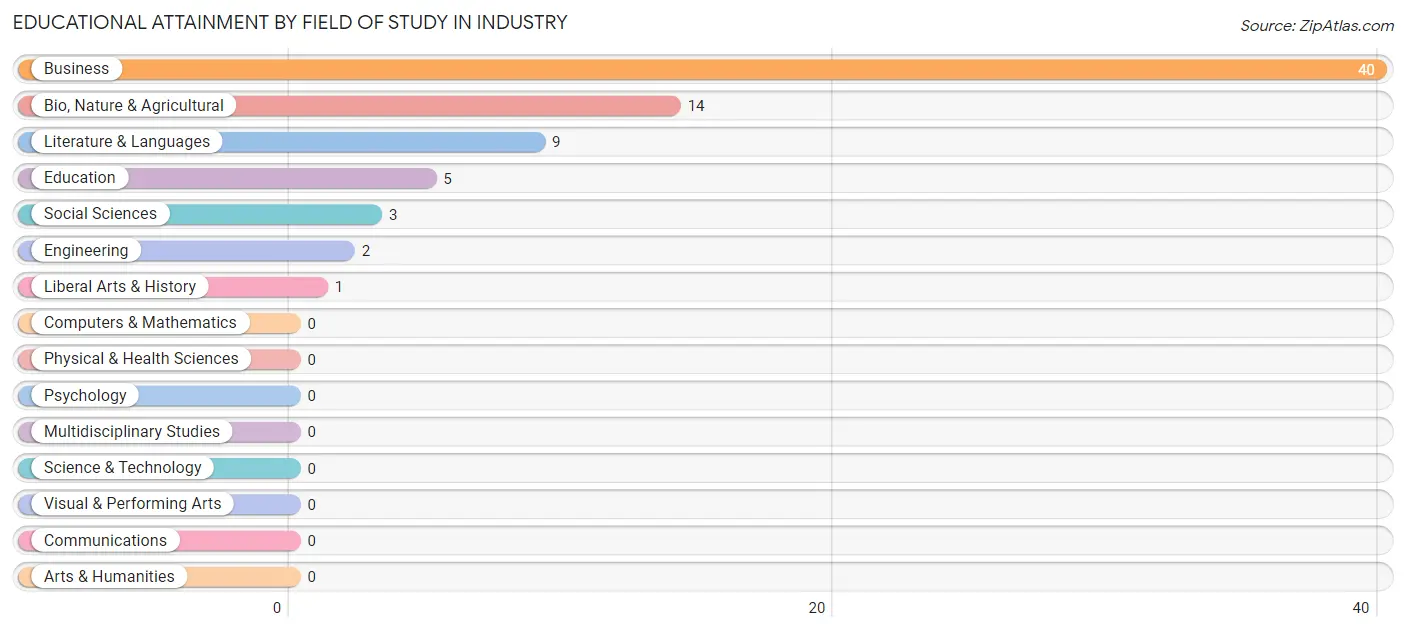
| Field of Study | # Graduates | % Graduates |
| Computers & Mathematics | 0 | 0.0% |
| Bio, Nature & Agricultural | 14 | 18.9% |
| Physical & Health Sciences | 0 | 0.0% |
| Psychology | 0 | 0.0% |
| Social Sciences | 3 | 4.1% |
| Engineering | 2 | 2.7% |
| Multidisciplinary Studies | 0 | 0.0% |
| Science & Technology | 0 | 0.0% |
| Business | 40 | 54.0% |
| Education | 5 | 6.8% |
| Literature & Languages | 9 | 12.2% |
| Liberal Arts & History | 1 | 1.3% |
| Visual & Performing Arts | 0 | 0.0% |
| Communications | 0 | 0.0% |
| Arts & Humanities | 0 | 0.0% |
| Total | 74 | 100.0% |
Transportation & Commute in Industry
Vehicle Availability by Sex in Industry
The most prevalent vehicle ownership categories in Industry are males with 2 vehicles (46, accounting for 50.5%) and females with 2 vehicles (12, making up 93.9%).
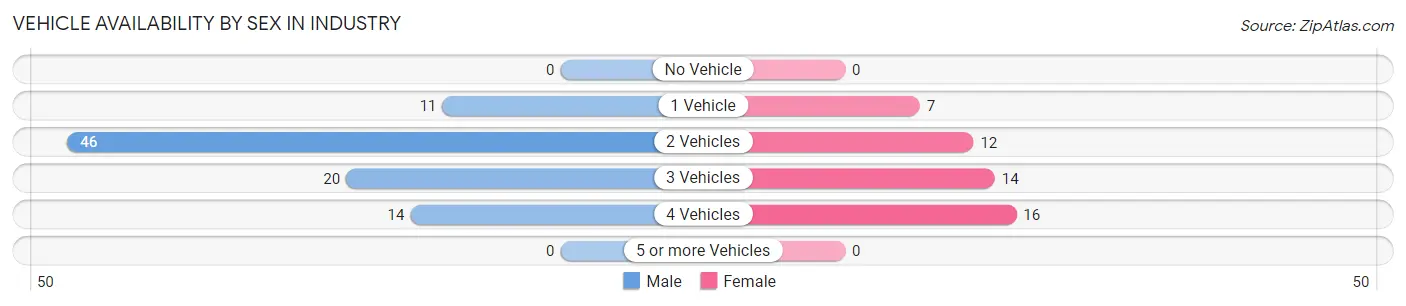
| Vehicles Available | Male | Female |
| No Vehicle | 0 (0.0%) | 0 (0.0%) |
| 1 Vehicle | 11 (12.1%) | 7 (14.3%) |
| 2 Vehicles | 46 (50.5%) | 12 (24.5%) |
| 3 Vehicles | 20 (22.0%) | 14 (28.6%) |
| 4 Vehicles | 14 (15.4%) | 16 (32.7%) |
| 5 or more Vehicles | 0 (0.0%) | 0 (0.0%) |
| Total | 91 (100.0%) | 49 (100.0%) |
Commute Time in Industry
The most frequently occuring commute durations in Industry are less than 5 minutes (34 commuters, 24.5%), 20 to 24 minutes (33 commuters, 23.7%), and 30 to 34 minutes (22 commuters, 15.8%).
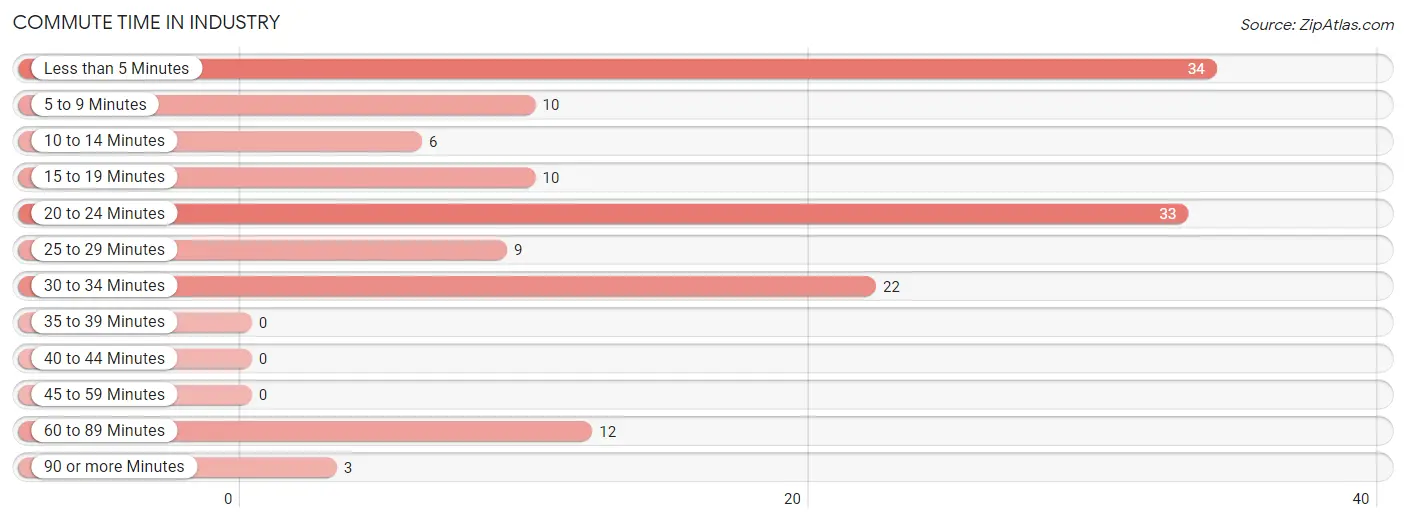
| Commute Time | # Commuters | % Commuters |
| Less than 5 Minutes | 34 | 24.5% |
| 5 to 9 Minutes | 10 | 7.2% |
| 10 to 14 Minutes | 6 | 4.3% |
| 15 to 19 Minutes | 10 | 7.2% |
| 20 to 24 Minutes | 33 | 23.7% |
| 25 to 29 Minutes | 9 | 6.5% |
| 30 to 34 Minutes | 22 | 15.8% |
| 35 to 39 Minutes | 0 | 0.0% |
| 40 to 44 Minutes | 0 | 0.0% |
| 45 to 59 Minutes | 0 | 0.0% |
| 60 to 89 Minutes | 12 | 8.6% |
| 90 or more Minutes | 3 | 2.2% |
Commute Time by Sex in Industry
The most common commute times in Industry are less than 5 minutes (34 commuters, 37.8%) for males and 30 to 34 minutes (18 commuters, 36.7%) for females.
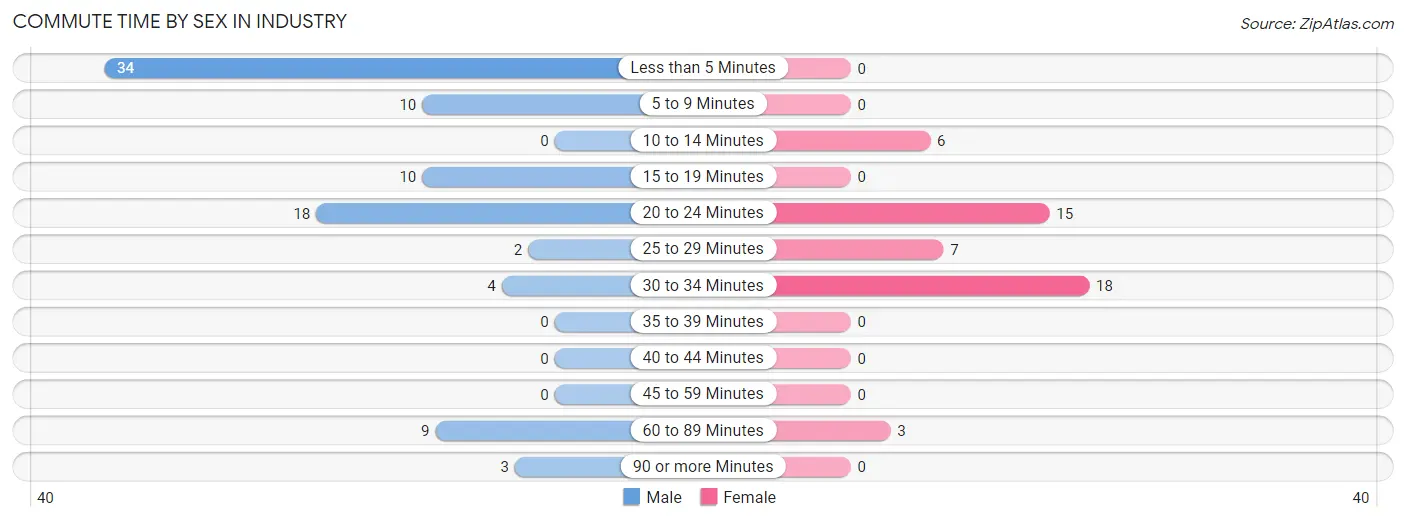
| Commute Time | Male | Female |
| Less than 5 Minutes | 34 (37.8%) | 0 (0.0%) |
| 5 to 9 Minutes | 10 (11.1%) | 0 (0.0%) |
| 10 to 14 Minutes | 0 (0.0%) | 6 (12.2%) |
| 15 to 19 Minutes | 10 (11.1%) | 0 (0.0%) |
| 20 to 24 Minutes | 18 (20.0%) | 15 (30.6%) |
| 25 to 29 Minutes | 2 (2.2%) | 7 (14.3%) |
| 30 to 34 Minutes | 4 (4.4%) | 18 (36.7%) |
| 35 to 39 Minutes | 0 (0.0%) | 0 (0.0%) |
| 40 to 44 Minutes | 0 (0.0%) | 0 (0.0%) |
| 45 to 59 Minutes | 0 (0.0%) | 0 (0.0%) |
| 60 to 89 Minutes | 9 (10.0%) | 3 (6.1%) |
| 90 or more Minutes | 3 (3.3%) | 0 (0.0%) |
Time of Departure to Work by Sex in Industry
The most frequent times of departure to work in Industry are 7:00 AM to 7:29 AM (40, 44.4%) for males and 7:00 AM to 7:29 AM (13, 26.5%) for females.
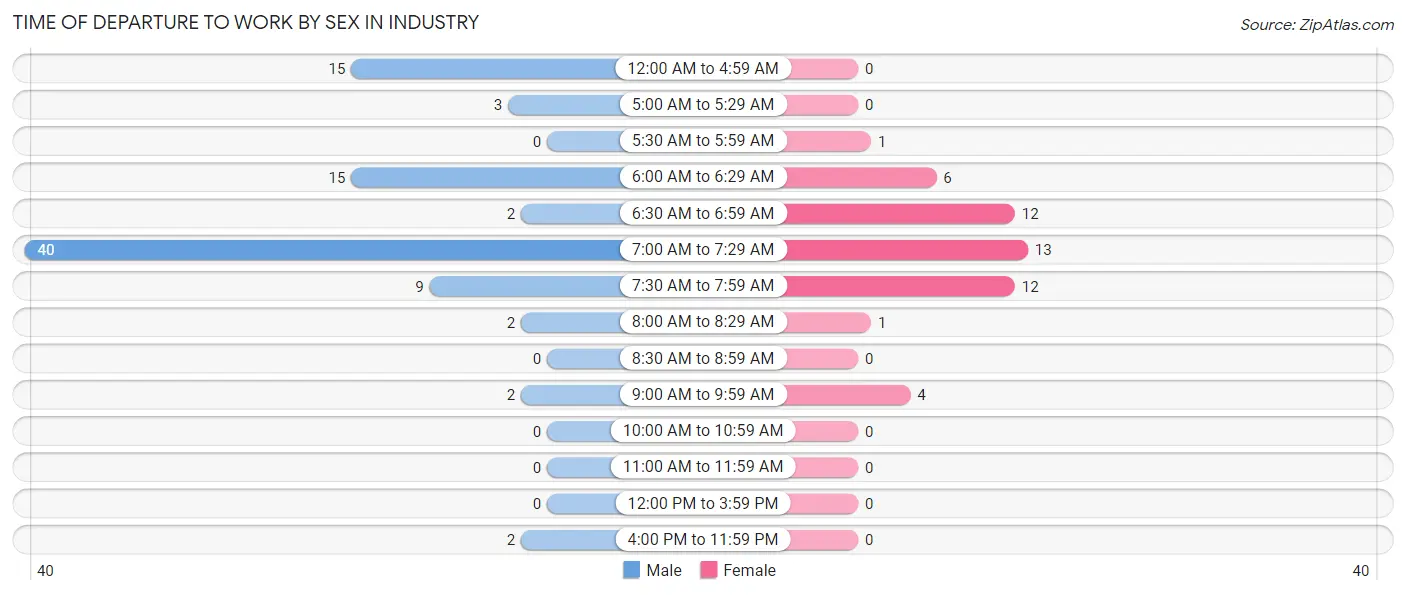
| Time of Departure | Male | Female |
| 12:00 AM to 4:59 AM | 15 (16.7%) | 0 (0.0%) |
| 5:00 AM to 5:29 AM | 3 (3.3%) | 0 (0.0%) |
| 5:30 AM to 5:59 AM | 0 (0.0%) | 1 (2.0%) |
| 6:00 AM to 6:29 AM | 15 (16.7%) | 6 (12.2%) |
| 6:30 AM to 6:59 AM | 2 (2.2%) | 12 (24.5%) |
| 7:00 AM to 7:29 AM | 40 (44.4%) | 13 (26.5%) |
| 7:30 AM to 7:59 AM | 9 (10.0%) | 12 (24.5%) |
| 8:00 AM to 8:29 AM | 2 (2.2%) | 1 (2.0%) |
| 8:30 AM to 8:59 AM | 0 (0.0%) | 0 (0.0%) |
| 9:00 AM to 9:59 AM | 2 (2.2%) | 4 (8.2%) |
| 10:00 AM to 10:59 AM | 0 (0.0%) | 0 (0.0%) |
| 11:00 AM to 11:59 AM | 0 (0.0%) | 0 (0.0%) |
| 12:00 PM to 3:59 PM | 0 (0.0%) | 0 (0.0%) |
| 4:00 PM to 11:59 PM | 2 (2.2%) | 0 (0.0%) |
| Total | 90 (100.0%) | 49 (100.0%) |
Housing Occupancy in Industry
Occupancy by Ownership in Industry
Of the total 116 dwellings in Industry, owner-occupied units account for 113 (97.4%), while renter-occupied units make up 3 (2.6%).
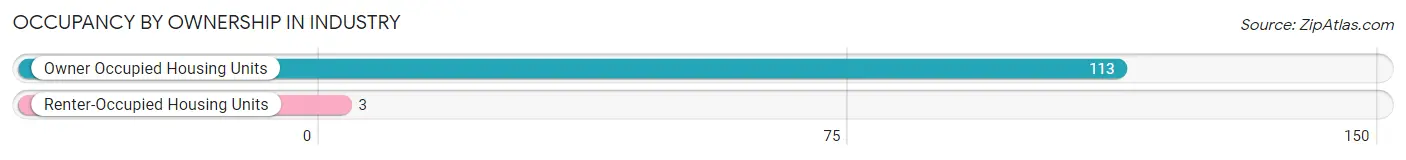
| Occupancy | # Housing Units | % Housing Units |
| Owner Occupied Housing Units | 113 | 97.4% |
| Renter-Occupied Housing Units | 3 | 2.6% |
| Total Occupied Housing Units | 116 | 100.0% |
Occupancy by Household Size in Industry
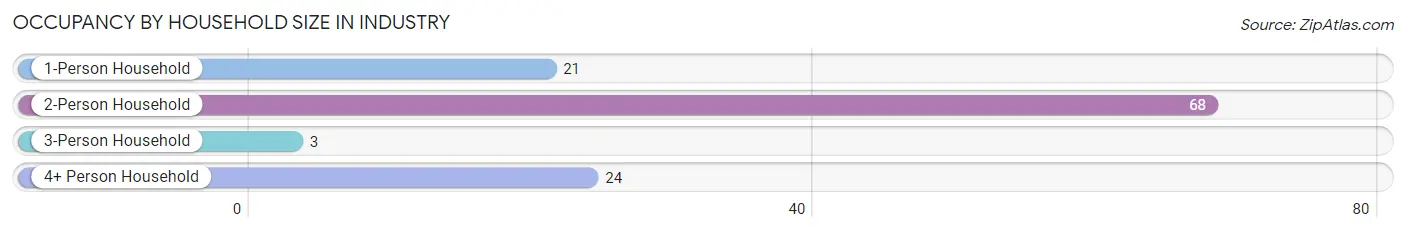
| Household Size | # Housing Units | % Housing Units |
| 1-Person Household | 21 | 18.1% |
| 2-Person Household | 68 | 58.6% |
| 3-Person Household | 3 | 2.6% |
| 4+ Person Household | 24 | 20.7% |
| Total Housing Units | 116 | 100.0% |
Occupancy by Ownership by Household Size in Industry
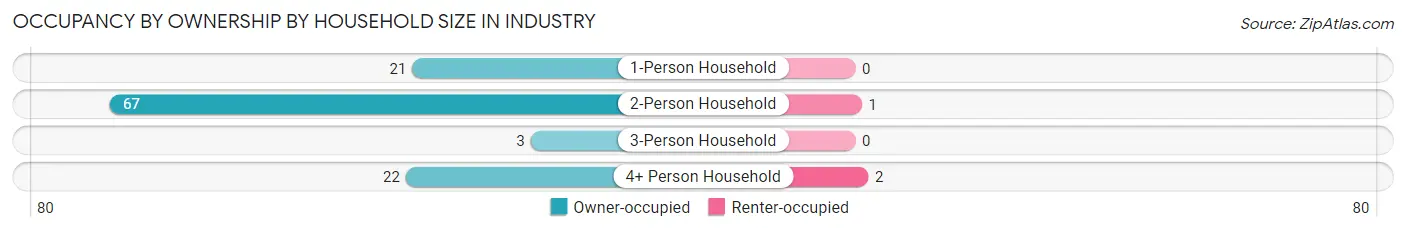
| Household Size | Owner-occupied | Renter-occupied |
| 1-Person Household | 21 (100.0%) | 0 (0.0%) |
| 2-Person Household | 67 (98.5%) | 1 (1.5%) |
| 3-Person Household | 3 (100.0%) | 0 (0.0%) |
| 4+ Person Household | 22 (91.7%) | 2 (8.3%) |
| Total Housing Units | 113 (97.4%) | 3 (2.6%) |
Occupancy by Educational Attainment in Industry
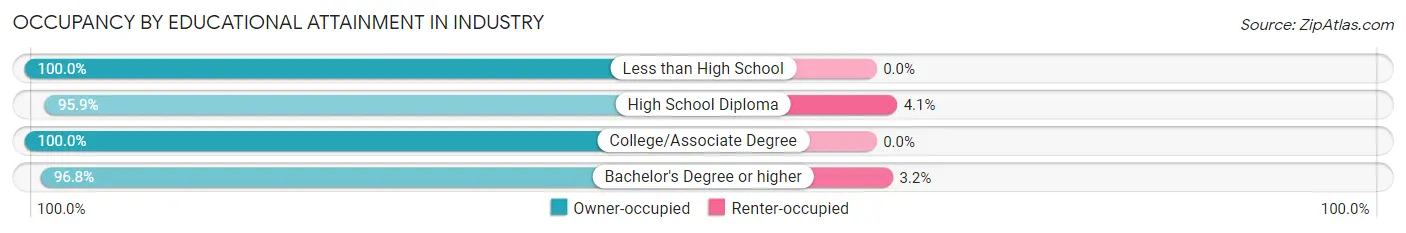
| Household Size | Owner-occupied | Renter-occupied |
| Less than High School | 2 (100.0%) | 0 (0.0%) |
| High School Diploma | 47 (95.9%) | 2 (4.1%) |
| College/Associate Degree | 34 (100.0%) | 0 (0.0%) |
| Bachelor's Degree or higher | 30 (96.8%) | 1 (3.2%) |
Occupancy by Age of Householder in Industry
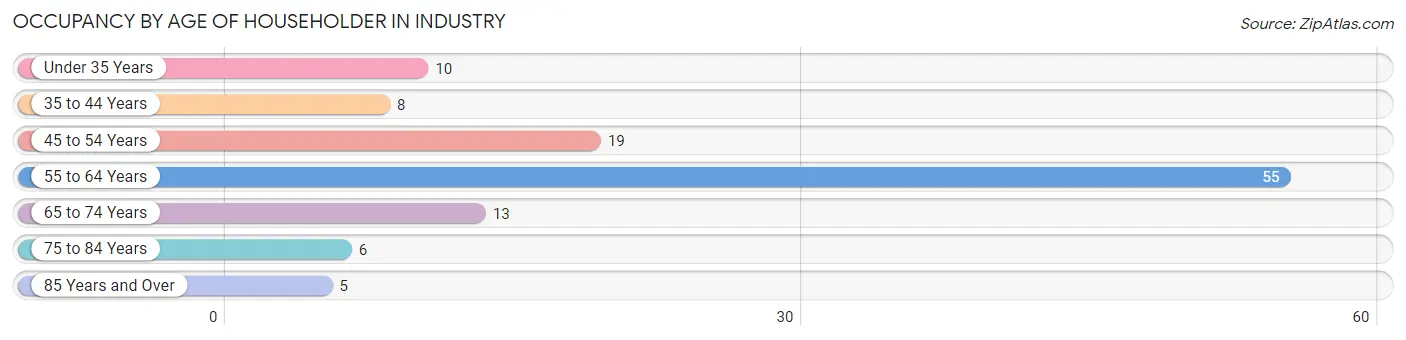
| Age Bracket | # Households | % Households |
| Under 35 Years | 10 | 8.6% |
| 35 to 44 Years | 8 | 6.9% |
| 45 to 54 Years | 19 | 16.4% |
| 55 to 64 Years | 55 | 47.4% |
| 65 to 74 Years | 13 | 11.2% |
| 75 to 84 Years | 6 | 5.2% |
| 85 Years and Over | 5 | 4.3% |
| Total | 116 | 100.0% |
Housing Finances in Industry
Median Income by Occupancy in Industry
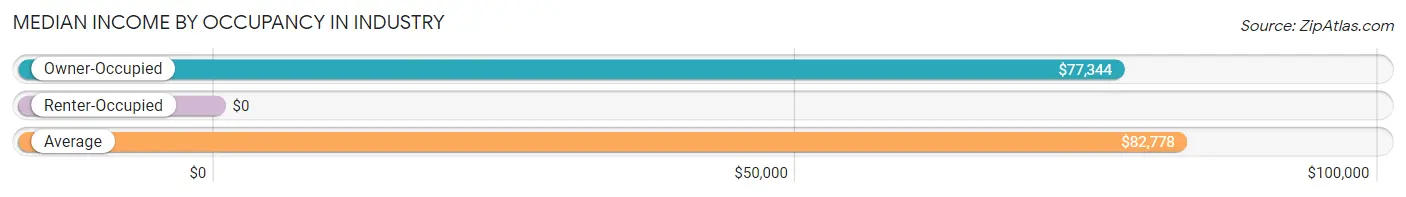
| Occupancy Type | # Households | Median Income |
| Owner-Occupied | 113 (97.4%) | $77,344 |
| Renter-Occupied | 3 (2.6%) | $0 |
| Average | 116 (100.0%) | $82,778 |
Occupancy by Householder Income Bracket in Industry
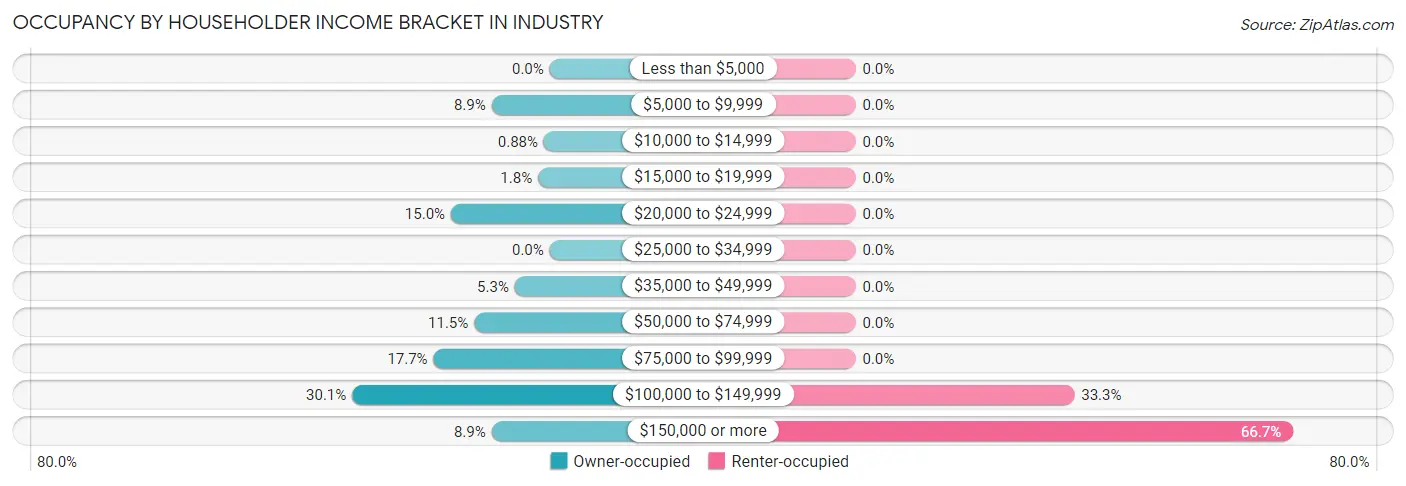
| Income Bracket | Owner-occupied | Renter-occupied |
| Less than $5,000 | 0 (0.0%) | 0 (0.0%) |
| $5,000 to $9,999 | 10 (8.8%) | 0 (0.0%) |
| $10,000 to $14,999 | 1 (0.9%) | 0 (0.0%) |
| $15,000 to $19,999 | 2 (1.8%) | 0 (0.0%) |
| $20,000 to $24,999 | 17 (15.0%) | 0 (0.0%) |
| $25,000 to $34,999 | 0 (0.0%) | 0 (0.0%) |
| $35,000 to $49,999 | 6 (5.3%) | 0 (0.0%) |
| $50,000 to $74,999 | 13 (11.5%) | 0 (0.0%) |
| $75,000 to $99,999 | 20 (17.7%) | 0 (0.0%) |
| $100,000 to $149,999 | 34 (30.1%) | 1 (33.3%) |
| $150,000 or more | 10 (8.8%) | 2 (66.7%) |
| Total | 113 (100.0%) | 3 (100.0%) |
Monthly Housing Cost Tiers in Industry
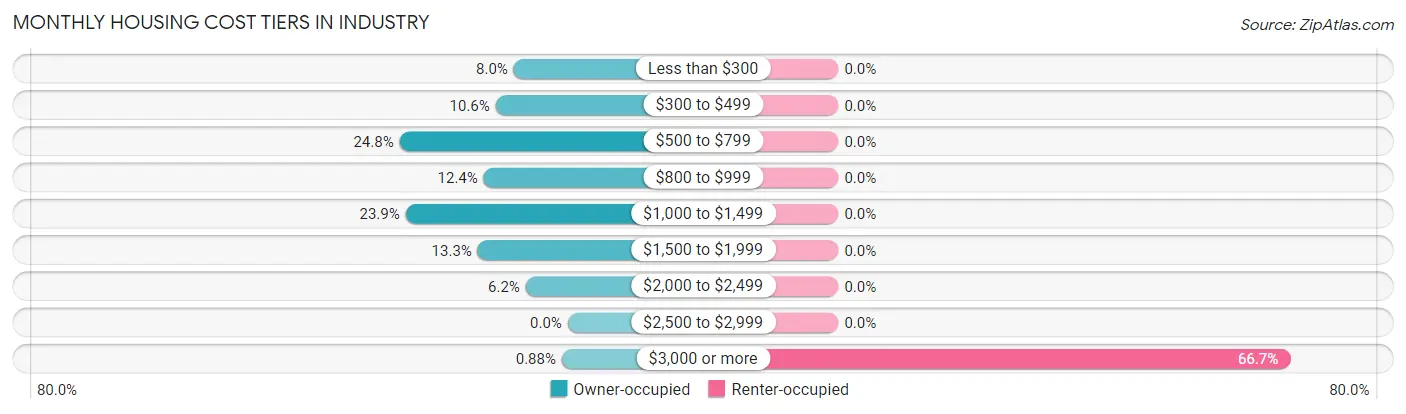
| Monthly Cost | Owner-occupied | Renter-occupied |
| Less than $300 | 9 (8.0%) | 0 (0.0%) |
| $300 to $499 | 12 (10.6%) | 0 (0.0%) |
| $500 to $799 | 28 (24.8%) | 0 (0.0%) |
| $800 to $999 | 14 (12.4%) | 0 (0.0%) |
| $1,000 to $1,499 | 27 (23.9%) | 0 (0.0%) |
| $1,500 to $1,999 | 15 (13.3%) | 0 (0.0%) |
| $2,000 to $2,499 | 7 (6.2%) | 0 (0.0%) |
| $2,500 to $2,999 | 0 (0.0%) | 0 (0.0%) |
| $3,000 or more | 1 (0.9%) | 2 (66.7%) |
| Total | 113 (100.0%) | 3 (100.0%) |
Physical Housing Characteristics in Industry
Housing Structures in Industry
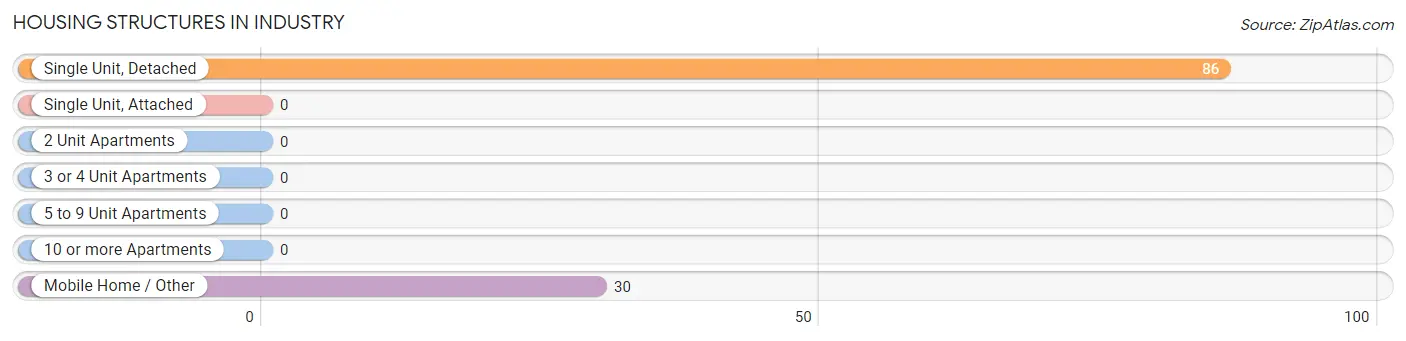
| Structure Type | # Housing Units | % Housing Units |
| Single Unit, Detached | 86 | 74.1% |
| Single Unit, Attached | 0 | 0.0% |
| 2 Unit Apartments | 0 | 0.0% |
| 3 or 4 Unit Apartments | 0 | 0.0% |
| 5 to 9 Unit Apartments | 0 | 0.0% |
| 10 or more Apartments | 0 | 0.0% |
| Mobile Home / Other | 30 | 25.9% |
| Total | 116 | 100.0% |
Housing Structures by Occupancy in Industry
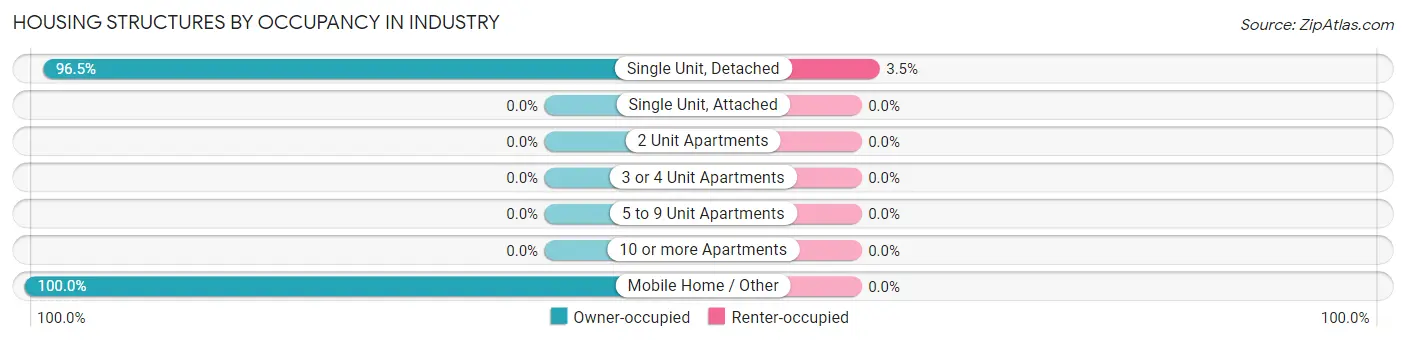
| Structure Type | Owner-occupied | Renter-occupied |
| Single Unit, Detached | 83 (96.5%) | 3 (3.5%) |
| Single Unit, Attached | 0 (0.0%) | 0 (0.0%) |
| 2 Unit Apartments | 0 (0.0%) | 0 (0.0%) |
| 3 or 4 Unit Apartments | 0 (0.0%) | 0 (0.0%) |
| 5 to 9 Unit Apartments | 0 (0.0%) | 0 (0.0%) |
| 10 or more Apartments | 0 (0.0%) | 0 (0.0%) |
| Mobile Home / Other | 30 (100.0%) | 0 (0.0%) |
| Total | 113 (97.4%) | 3 (2.6%) |
Housing Structures by Number of Rooms in Industry
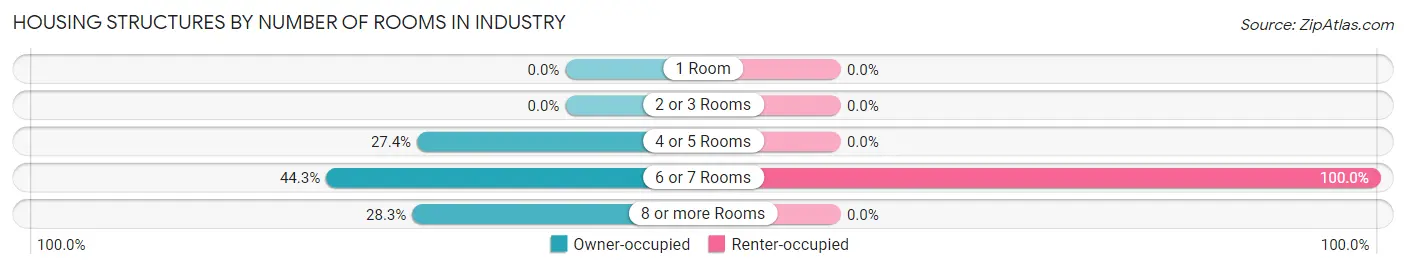
| Number of Rooms | Owner-occupied | Renter-occupied |
| 1 Room | 0 (0.0%) | 0 (0.0%) |
| 2 or 3 Rooms | 0 (0.0%) | 0 (0.0%) |
| 4 or 5 Rooms | 31 (27.4%) | 0 (0.0%) |
| 6 or 7 Rooms | 50 (44.3%) | 3 (100.0%) |
| 8 or more Rooms | 32 (28.3%) | 0 (0.0%) |
| Total | 113 (100.0%) | 3 (100.0%) |
Housing Structure by Heating Type in Industry
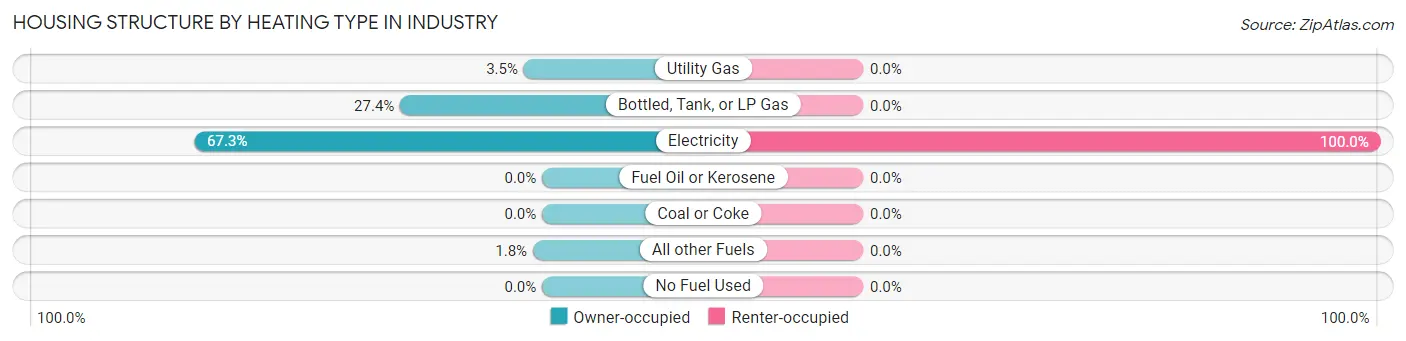
| Heating Type | Owner-occupied | Renter-occupied |
| Utility Gas | 4 (3.5%) | 0 (0.0%) |
| Bottled, Tank, or LP Gas | 31 (27.4%) | 0 (0.0%) |
| Electricity | 76 (67.3%) | 3 (100.0%) |
| Fuel Oil or Kerosene | 0 (0.0%) | 0 (0.0%) |
| Coal or Coke | 0 (0.0%) | 0 (0.0%) |
| All other Fuels | 2 (1.8%) | 0 (0.0%) |
| No Fuel Used | 0 (0.0%) | 0 (0.0%) |
| Total | 113 (100.0%) | 3 (100.0%) |
Household Vehicle Usage in Industry
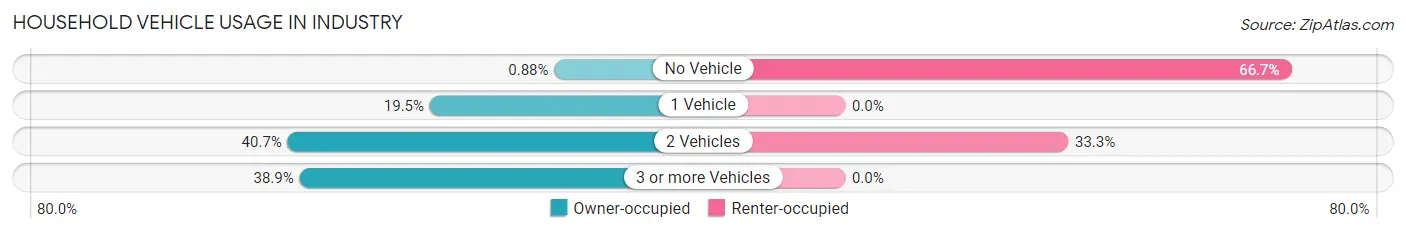
| Vehicles per Household | Owner-occupied | Renter-occupied |
| No Vehicle | 1 (0.9%) | 2 (66.7%) |
| 1 Vehicle | 22 (19.5%) | 0 (0.0%) |
| 2 Vehicles | 46 (40.7%) | 1 (33.3%) |
| 3 or more Vehicles | 44 (38.9%) | 0 (0.0%) |
| Total | 113 (100.0%) | 3 (100.0%) |
Real Estate & Mortgages in Industry
Real Estate and Mortgage Overview in Industry
| Characteristic | Without Mortgage | With Mortgage |
| Housing Units | 82 | 31 |
| Median Property Value | $294,100 | $227,500 |
| Median Household Income | $76,250 | $2 |
| Monthly Housing Costs | $750 | $1 |
| Real Estate Taxes | $4,800 | $0 |
Property Value by Mortgage Status in Industry
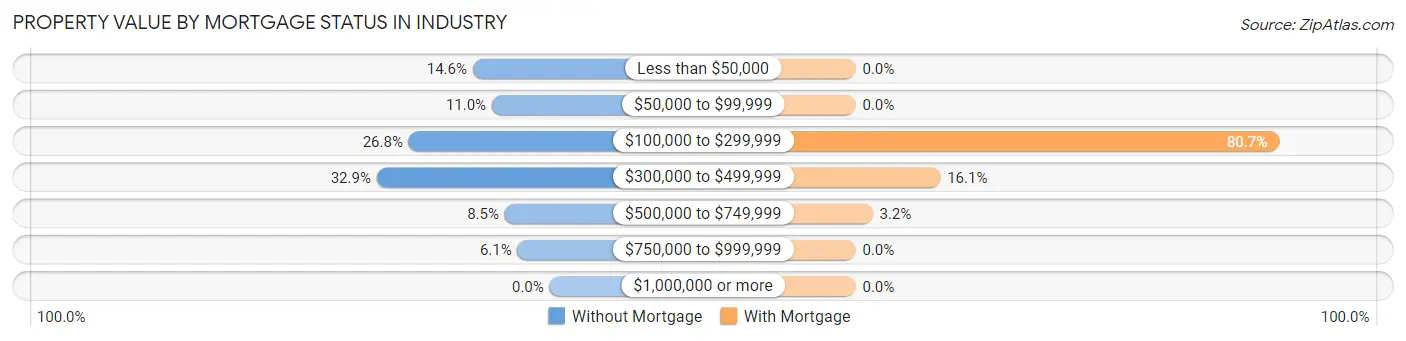
| Property Value | Without Mortgage | With Mortgage |
| Less than $50,000 | 12 (14.6%) | 0 (0.0%) |
| $50,000 to $99,999 | 9 (11.0%) | 0 (0.0%) |
| $100,000 to $299,999 | 22 (26.8%) | 25 (80.6%) |
| $300,000 to $499,999 | 27 (32.9%) | 5 (16.1%) |
| $500,000 to $749,999 | 7 (8.5%) | 1 (3.2%) |
| $750,000 to $999,999 | 5 (6.1%) | 0 (0.0%) |
| $1,000,000 or more | 0 (0.0%) | 0 (0.0%) |
| Total | 82 (100.0%) | 31 (100.0%) |
Household Income by Mortgage Status in Industry
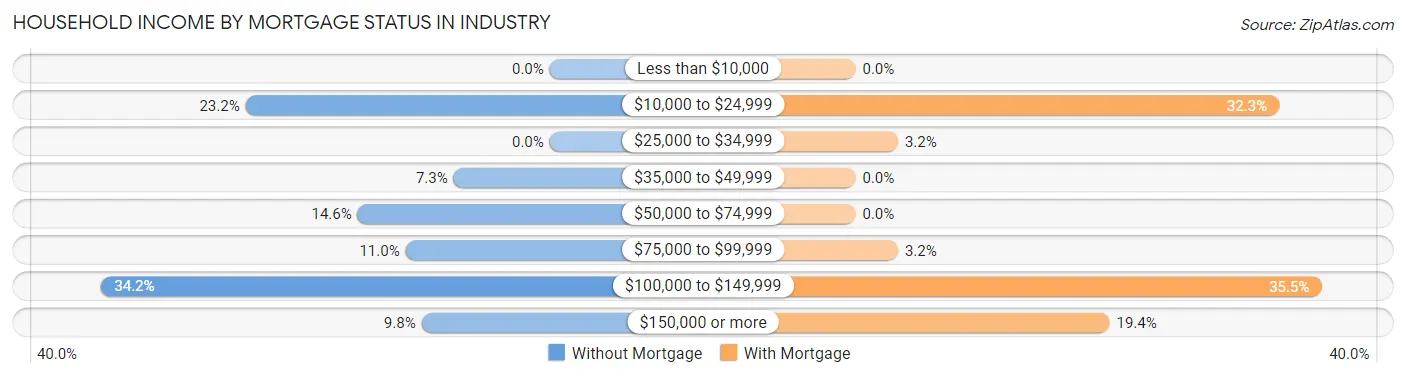
| Household Income | Without Mortgage | With Mortgage |
| Less than $10,000 | 0 (0.0%) | 0 (0.0%) |
| $10,000 to $24,999 | 19 (23.2%) | 10 (32.3%) |
| $25,000 to $34,999 | 0 (0.0%) | 1 (3.2%) |
| $35,000 to $49,999 | 6 (7.3%) | 0 (0.0%) |
| $50,000 to $74,999 | 12 (14.6%) | 0 (0.0%) |
| $75,000 to $99,999 | 9 (11.0%) | 1 (3.2%) |
| $100,000 to $149,999 | 28 (34.2%) | 11 (35.5%) |
| $150,000 or more | 8 (9.8%) | 6 (19.4%) |
| Total | 82 (100.0%) | 31 (100.0%) |
Property Value to Household Income Ratio in Industry
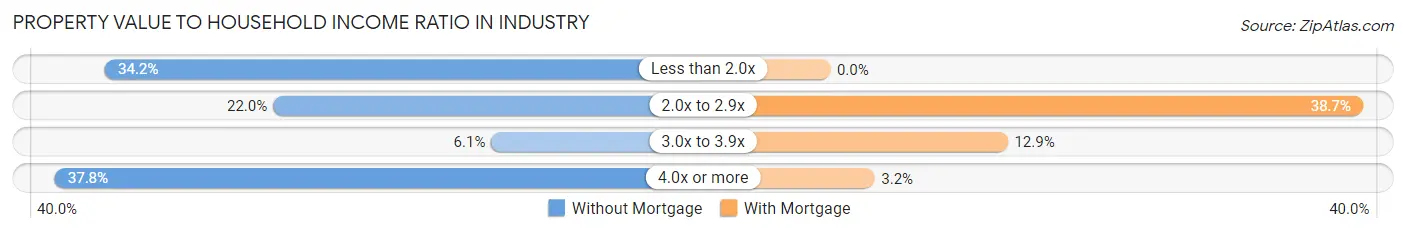
| Value-to-Income Ratio | Without Mortgage | With Mortgage |
| Less than 2.0x | 28 (34.2%) | 0 (0.0%) |
| 2.0x to 2.9x | 18 (22.0%) | 12 (38.7%) |
| 3.0x to 3.9x | 5 (6.1%) | 4 (12.9%) |
| 4.0x or more | 31 (37.8%) | 1 (3.2%) |
| Total | 82 (100.0%) | 31 (100.0%) |
Real Estate Taxes by Mortgage Status in Industry
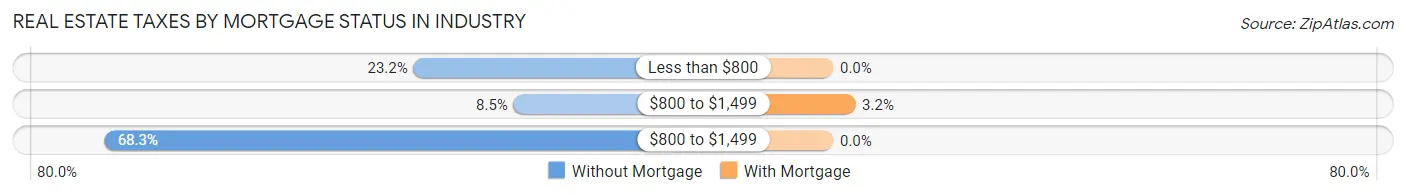
| Property Taxes | Without Mortgage | With Mortgage |
| Less than $800 | 19 (23.2%) | 0 (0.0%) |
| $800 to $1,499 | 7 (8.5%) | 1 (3.2%) |
| $800 to $1,499 | 56 (68.3%) | 0 (0.0%) |
| Total | 82 (100.0%) | 31 (100.0%) |
Health & Disability in Industry
Health Insurance Coverage by Age in Industry
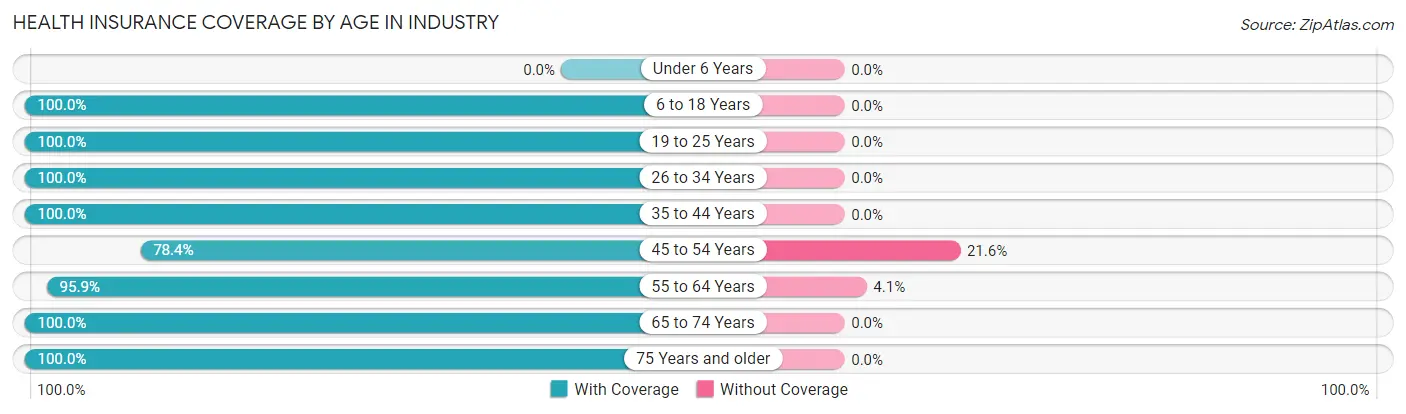
| Age Bracket | With Coverage | Without Coverage |
| Under 6 Years | 0 (0.0%) | 0 (0.0%) |
| 6 to 18 Years | 43 (100.0%) | 0 (0.0%) |
| 19 to 25 Years | 20 (100.0%) | 0 (0.0%) |
| 26 to 34 Years | 4 (100.0%) | 0 (0.0%) |
| 35 to 44 Years | 15 (100.0%) | 0 (0.0%) |
| 45 to 54 Years | 40 (78.4%) | 11 (21.6%) |
| 55 to 64 Years | 93 (95.9%) | 4 (4.1%) |
| 65 to 74 Years | 19 (100.0%) | 0 (0.0%) |
| 75 Years and older | 27 (100.0%) | 0 (0.0%) |
| Total | 261 (94.6%) | 15 (5.4%) |
Health Insurance Coverage by Citizenship Status in Industry
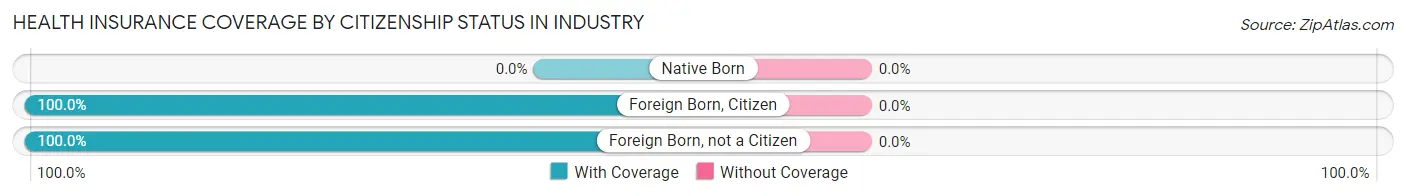
| Citizenship Status | With Coverage | Without Coverage |
| Native Born | 0 (0.0%) | 0 (0.0%) |
| Foreign Born, Citizen | 43 (100.0%) | 0 (0.0%) |
| Foreign Born, not a Citizen | 20 (100.0%) | 0 (0.0%) |
Health Insurance Coverage by Household Income in Industry
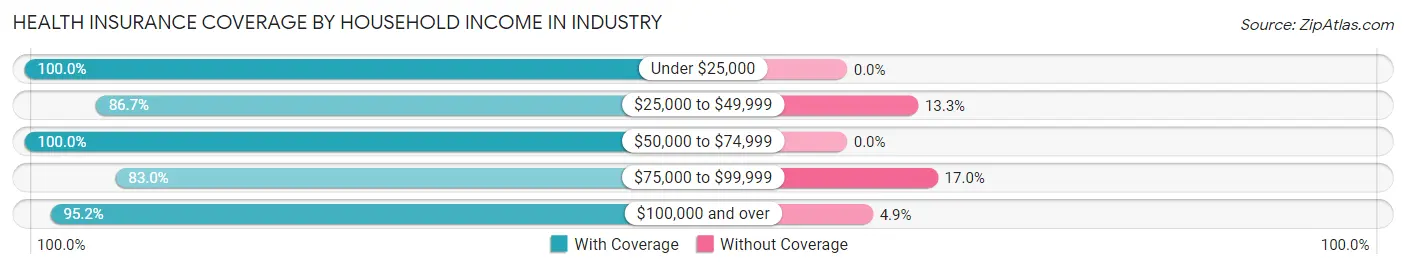
| Household Income | With Coverage | Without Coverage |
| Under $25,000 | 62 (100.0%) | 0 (0.0%) |
| $25,000 to $49,999 | 13 (86.7%) | 2 (13.3%) |
| $50,000 to $74,999 | 49 (100.0%) | 0 (0.0%) |
| $75,000 to $99,999 | 39 (83.0%) | 8 (17.0%) |
| $100,000 and over | 98 (95.2%) | 5 (4.9%) |
Public vs Private Health Insurance Coverage by Age in Industry
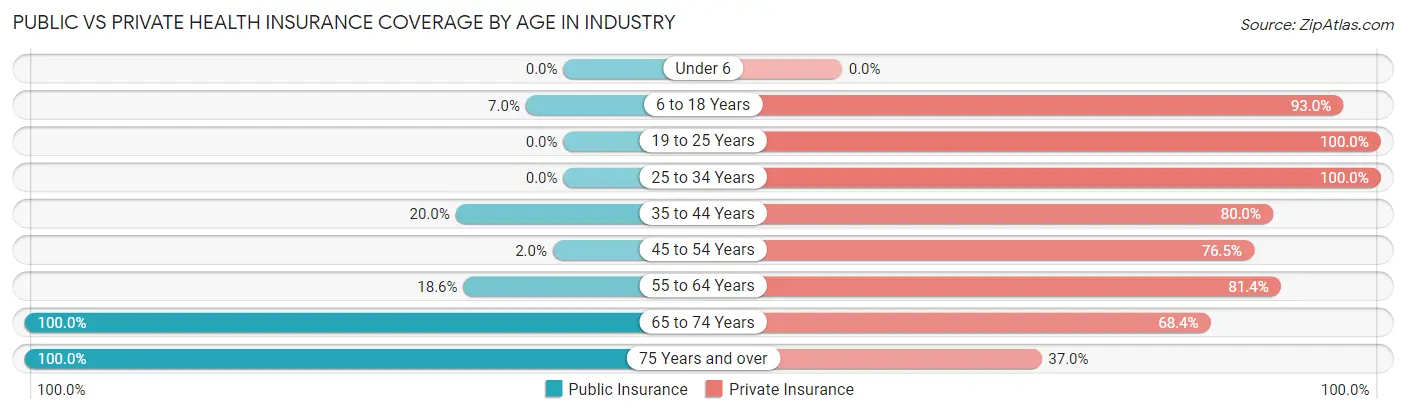
| Age Bracket | Public Insurance | Private Insurance |
| Under 6 | 0 (0.0%) | 0 (0.0%) |
| 6 to 18 Years | 3 (7.0%) | 40 (93.0%) |
| 19 to 25 Years | 0 (0.0%) | 20 (100.0%) |
| 25 to 34 Years | 0 (0.0%) | 4 (100.0%) |
| 35 to 44 Years | 3 (20.0%) | 12 (80.0%) |
| 45 to 54 Years | 1 (2.0%) | 39 (76.5%) |
| 55 to 64 Years | 18 (18.6%) | 79 (81.4%) |
| 65 to 74 Years | 19 (100.0%) | 13 (68.4%) |
| 75 Years and over | 27 (100.0%) | 10 (37.0%) |
| Total | 71 (25.7%) | 217 (78.6%) |
Disability Status by Sex by Age in Industry
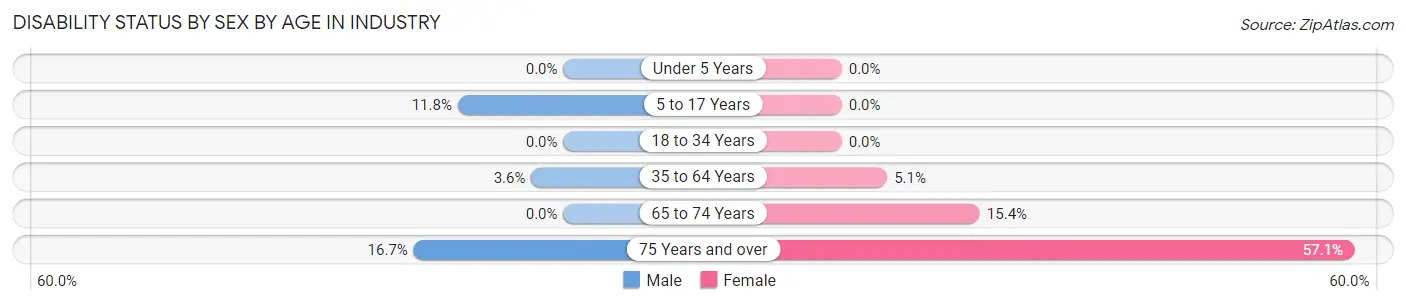
| Age Bracket | Male | Female |
| Under 5 Years | 0 (0.0%) | 0 (0.0%) |
| 5 to 17 Years | 2 (11.8%) | 0 (0.0%) |
| 18 to 34 Years | 0 (0.0%) | 0 (0.0%) |
| 35 to 64 Years | 3 (3.6%) | 4 (5.1%) |
| 65 to 74 Years | 0 (0.0%) | 2 (15.4%) |
| 75 Years and over | 1 (16.7%) | 12 (57.1%) |
Disability Class by Sex by Age in Industry
Disability Class: Hearing Difficulty
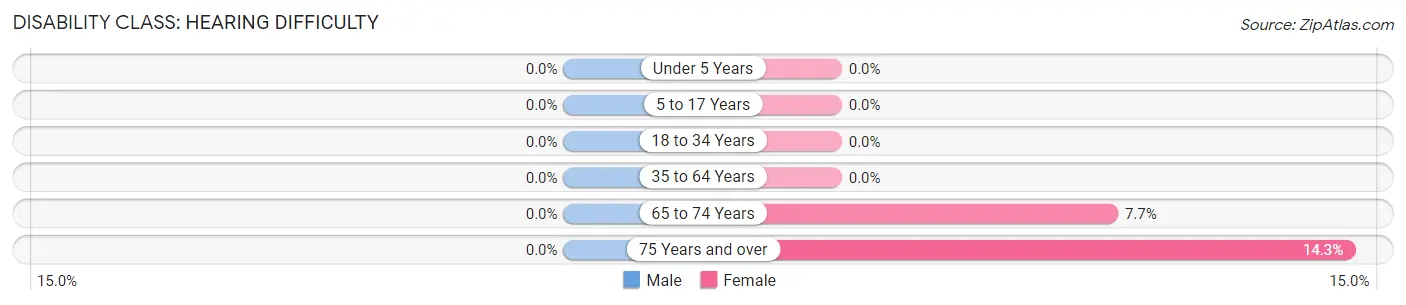
| Age Bracket | Male | Female |
| Under 5 Years | 0 (0.0%) | 0 (0.0%) |
| 5 to 17 Years | 0 (0.0%) | 0 (0.0%) |
| 18 to 34 Years | 0 (0.0%) | 0 (0.0%) |
| 35 to 64 Years | 0 (0.0%) | 0 (0.0%) |
| 65 to 74 Years | 0 (0.0%) | 1 (7.7%) |
| 75 Years and over | 0 (0.0%) | 3 (14.3%) |
Disability Class: Vision Difficulty
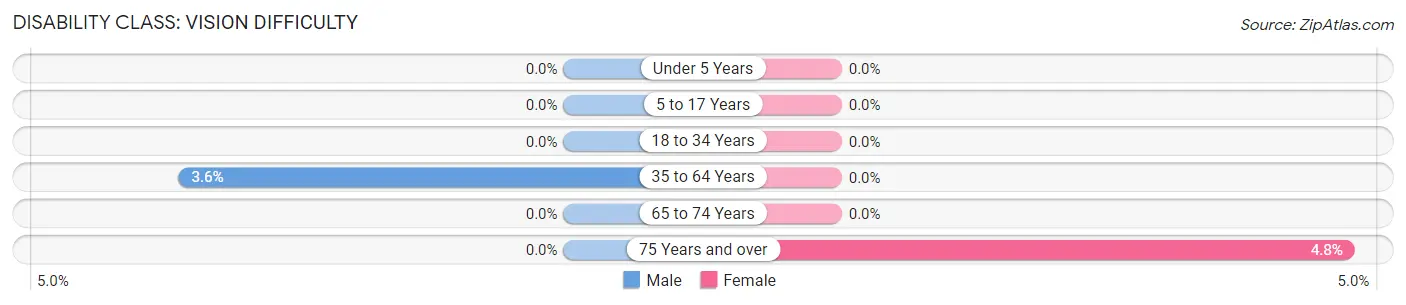
| Age Bracket | Male | Female |
| Under 5 Years | 0 (0.0%) | 0 (0.0%) |
| 5 to 17 Years | 0 (0.0%) | 0 (0.0%) |
| 18 to 34 Years | 0 (0.0%) | 0 (0.0%) |
| 35 to 64 Years | 3 (3.6%) | 0 (0.0%) |
| 65 to 74 Years | 0 (0.0%) | 0 (0.0%) |
| 75 Years and over | 0 (0.0%) | 1 (4.8%) |
Disability Class: Cognitive Difficulty
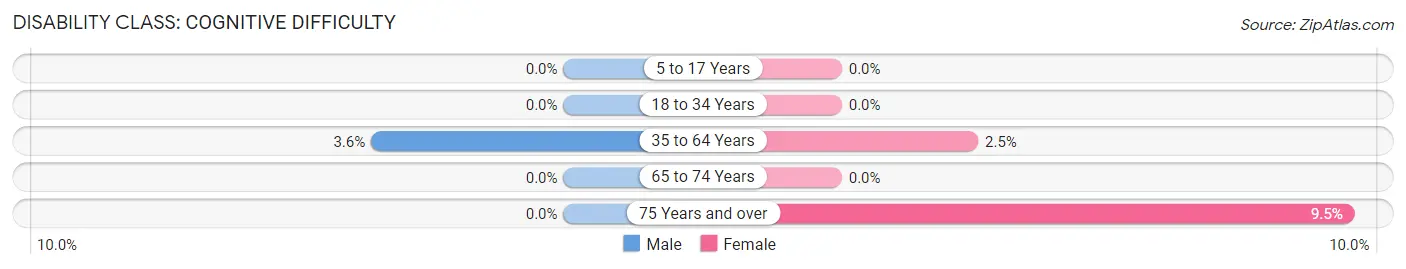
| Age Bracket | Male | Female |
| 5 to 17 Years | 0 (0.0%) | 0 (0.0%) |
| 18 to 34 Years | 0 (0.0%) | 0 (0.0%) |
| 35 to 64 Years | 3 (3.6%) | 2 (2.5%) |
| 65 to 74 Years | 0 (0.0%) | 0 (0.0%) |
| 75 Years and over | 0 (0.0%) | 2 (9.5%) |
Disability Class: Ambulatory Difficulty
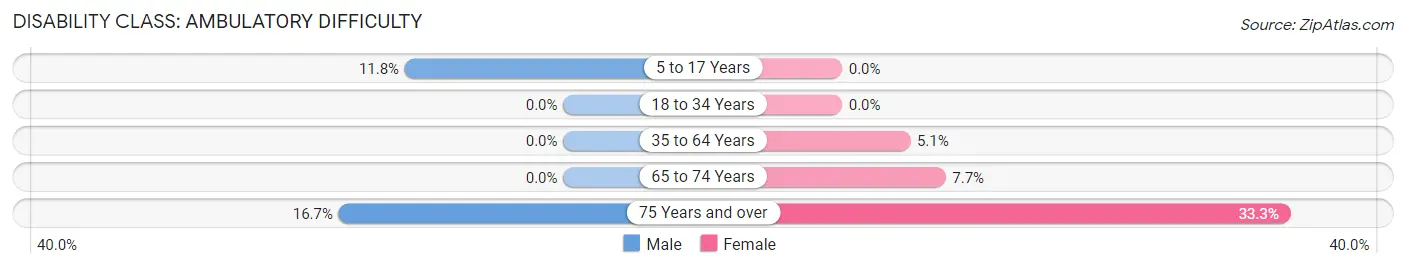
| Age Bracket | Male | Female |
| 5 to 17 Years | 2 (11.8%) | 0 (0.0%) |
| 18 to 34 Years | 0 (0.0%) | 0 (0.0%) |
| 35 to 64 Years | 0 (0.0%) | 4 (5.1%) |
| 65 to 74 Years | 0 (0.0%) | 1 (7.7%) |
| 75 Years and over | 1 (16.7%) | 7 (33.3%) |
Disability Class: Self-Care Difficulty
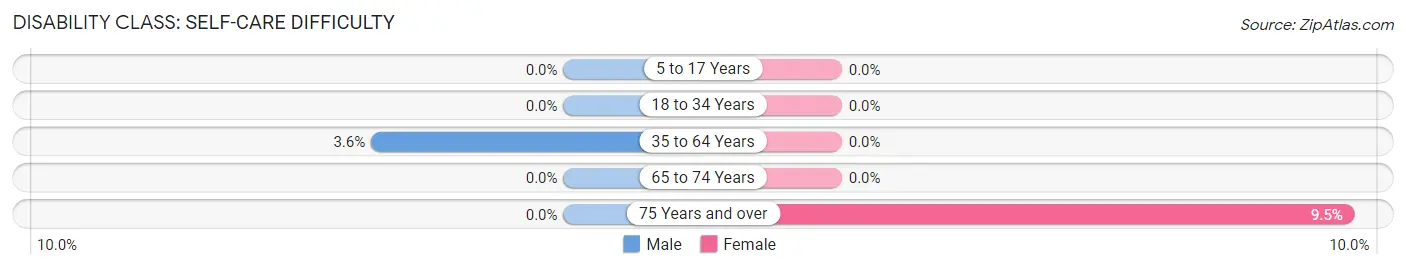
| Age Bracket | Male | Female |
| 5 to 17 Years | 0 (0.0%) | 0 (0.0%) |
| 18 to 34 Years | 0 (0.0%) | 0 (0.0%) |
| 35 to 64 Years | 3 (3.6%) | 0 (0.0%) |
| 65 to 74 Years | 0 (0.0%) | 0 (0.0%) |
| 75 Years and over | 0 (0.0%) | 2 (9.5%) |
Technology Access in Industry
Computing Device Access in Industry
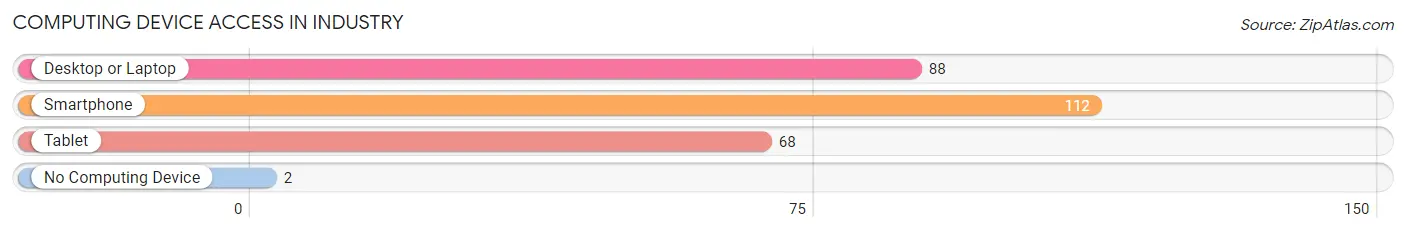
| Device Type | # Households | % Households |
| Desktop or Laptop | 88 | 75.9% |
| Smartphone | 112 | 96.6% |
| Tablet | 68 | 58.6% |
| No Computing Device | 2 | 1.7% |
| Total | 116 | 100.0% |
Internet Access in Industry
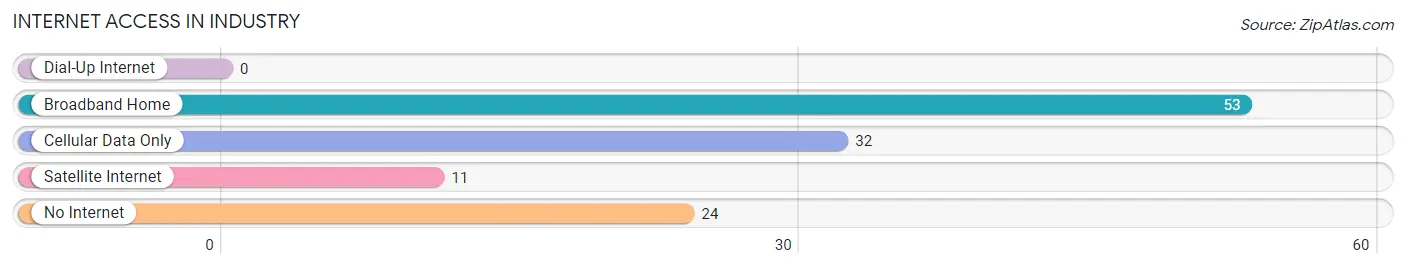
| Internet Type | # Households | % Households |
| Dial-Up Internet | 0 | 0.0% |
| Broadband Home | 53 | 45.7% |
| Cellular Data Only | 32 | 27.6% |
| Satellite Internet | 11 | 9.5% |
| No Internet | 24 | 20.7% |
| Total | 116 | 100.0% |
Industry Summary
Industry, Texas is a small town located in Austin County, Texas. It is situated about 50 miles west of Houston and is part of the Greater Houston metropolitan area. The town was founded in 1873 and has a population of approximately 1,000 people.
Industry is located in the rolling hills of Austin County, which is part of the Gulf Coastal Plain. The area is characterized by flat to gently rolling terrain, with elevations ranging from 200 to 500 feet above sea level. The climate is humid subtropical, with hot summers and mild winters. The average annual temperature is around 70 degrees Fahrenheit.
The economy of Industry is largely based on agriculture. The town is home to several farms, which produce a variety of crops, including cotton, corn, soybeans, and hay. The town also has a few small businesses, including a grocery store, a hardware store, and a few restaurants.
The demographics of Industry are largely white, with a small Hispanic population. The median household income is around $35,000, and the median home value is around $90,000. The town has a low unemployment rate, and the poverty rate is below the national average.
Education is provided by the Industry Independent School District, which serves students in grades K-12. The district has two elementary schools, one middle school, and one high school. The district also offers a variety of extracurricular activities, including sports, music, and art.
Industry is a small town with a rich history and a bright future. It is a great place to live, work, and raise a family. With its friendly people, beautiful scenery, and strong economy, Industry is a great place to call home.
Common Questions
What is Per Capita Income in Industry?
Per Capita income in Industry is $38,876.
What is the Median Family Income in Industry?
Median Family Income in Industry is $75,156.
What is the Median Household income in Industry?
Median Household Income in Industry is $82,778.
What is Income or Wage Gap in Industry?
Income or Wage Gap in Industry is 6.9%.
Women in Industry earn 93.1 cents for every dollar earned by a man.
What is Inequality or Gini Index in Industry?
Inequality or Gini Index in Industry is 0.38.
What is the Total Population of Industry?
Total Population of Industry is 276.
What is the Total Male Population of Industry?
Total Male Population of Industry is 125.
What is the Total Female Population of Industry?
Total Female Population of Industry is 151.
What is the Ratio of Males per 100 Females in Industry?
There are 82.78 Males per 100 Females in Industry.
What is the Ratio of Females per 100 Males in Industry?
There are 120.80 Females per 100 Males in Industry.
What is the Median Population Age in Industry?
Median Population Age in Industry is 57.1 Years.
What is the Average Family Size in Industry
Average Family Size in Industry is 2.6 People.
What is the Average Household Size in Industry
Average Household Size in Industry is 2.4 People.
How Large is the Labor Force in Industry?
There are 143 People in the Labor Forcein in Industry.
What is the Percentage of People in the Labor Force in Industry?
57.4% of People are in the Labor Force in Industry.
What is the Unemployment Rate in Industry?
Unemployment Rate in Industry is 2.1%.