Zip Codes with the Highest Percentage of Population Employed in Real Estate, Rental & Leasing in Mabank, TX
RELATED REPORTS & OPTIONS
Real Estate, Rental & Leasing
Mabank
Compare Zip Codes
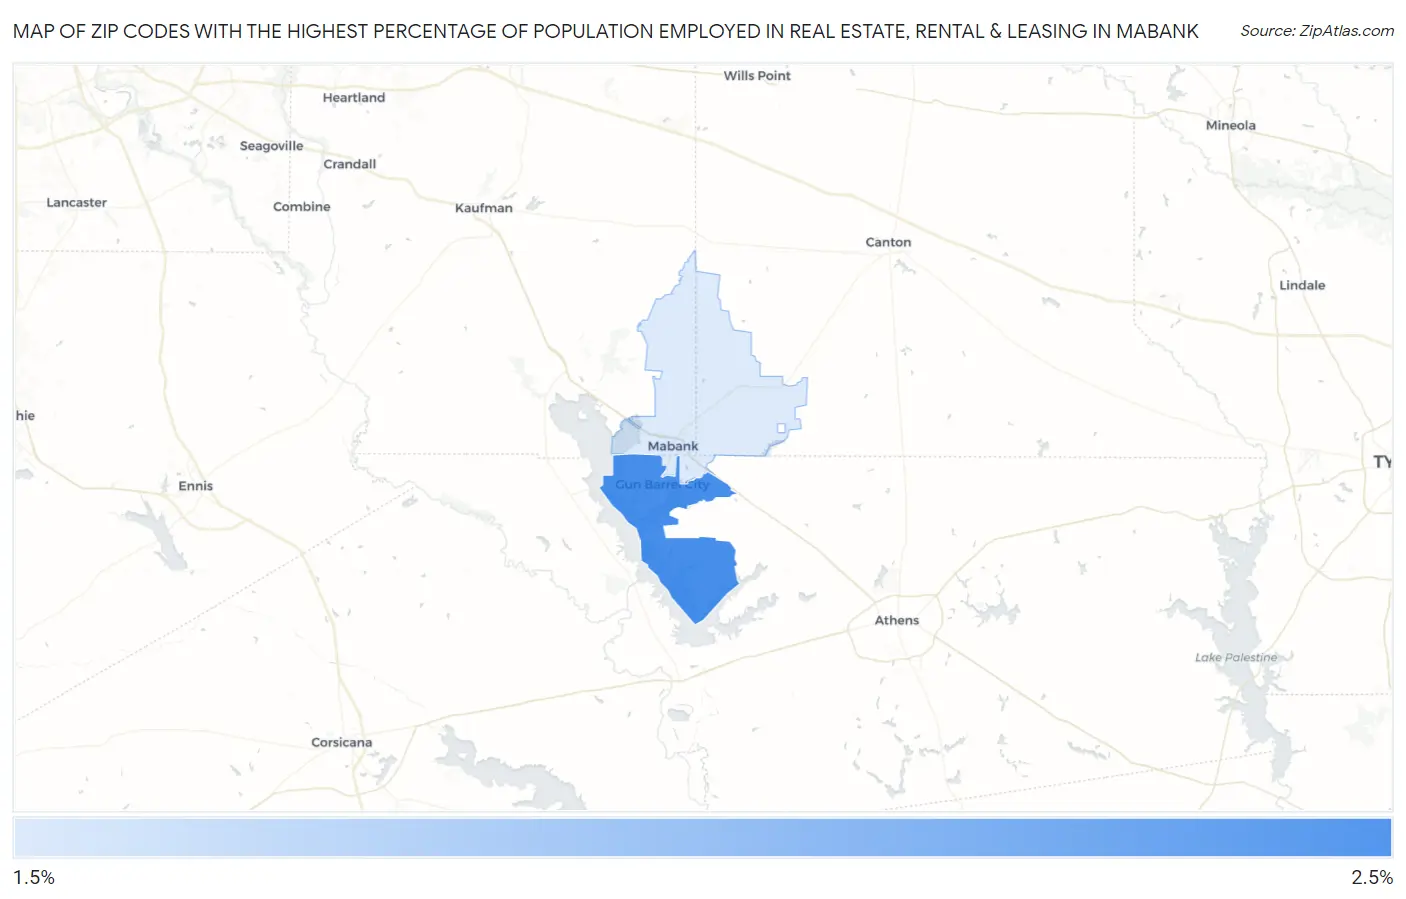
Map of Zip Codes with the Highest Percentage of Population Employed in Real Estate, Rental & Leasing in Mabank
1.6%
2.2%
Zip Codes with the Highest Percentage of Population Employed in Real Estate, Rental & Leasing in Mabank, TX
| Zip Code | % Employed | vs State | vs National | |
| 1. | 75156 | 2.2% | 2.0%(+0.159)#509 | 1.9%(+0.275)#6,982 |
| 2. | 75147 | 1.6% | 2.0%(-0.412)#752 | 1.9%(-0.296)#10,463 |
1
Common Questions
What are the Top Zip Codes with the Highest Percentage of Population Employed in Real Estate, Rental & Leasing in Mabank, TX?
Top Zip Codes with the Highest Percentage of Population Employed in Real Estate, Rental & Leasing in Mabank, TX are:
What zip code has the Highest Percentage of Population Employed in Real Estate, Rental & Leasing in Mabank, TX?
75156 has the Highest Percentage of Population Employed in Real Estate, Rental & Leasing in Mabank, TX with 2.2%.
What is the Percentage of Population Employed in Real Estate, Rental & Leasing in Mabank, TX?
Percentage of Population Employed in Real Estate, Rental & Leasing in Mabank is 2.5%.
What is the Percentage of Population Employed in Real Estate, Rental & Leasing in Texas?
Percentage of Population Employed in Real Estate, Rental & Leasing in Texas is 2.0%.
What is the Percentage of Population Employed in Real Estate, Rental & Leasing in the United States?
Percentage of Population Employed in Real Estate, Rental & Leasing in the United States is 1.9%.