Winslow, IN Map & Demographics
Winslow Map
Winslow Overview
$27,678
PER CAPITA INCOME
$58,750
AVG FAMILY INCOME
$47,143
AVG HOUSEHOLD INCOME
17.8%
WAGE / INCOME GAP [ % ]
82.2¢/ $1
WAGE / INCOME GAP [ $ ]
0.39
INEQUALITY / GINI INDEX
729
TOTAL POPULATION
392
MALE POPULATION
337
FEMALE POPULATION
116.32
MALES / 100 FEMALES
85.97
FEMALES / 100 MALES
43.8
MEDIAN AGE
2.8
AVG FAMILY SIZE
2.1
AVG HOUSEHOLD SIZE
295
LABOR FORCE [ PEOPLE ]
47.0%
PERCENT IN LABOR FORCE
5.4%
UNEMPLOYMENT RATE
Winslow Zip Codes
Winslow Area Codes
Income in Winslow
Income Overview in Winslow
Per Capita Income in Winslow is $27,678, while median incomes of families and households are $58,750 and $47,143 respectively.
| Characteristic | Number | Measure |
| Per Capita Income | 729 | $27,678 |
| Median Family Income | 179 | $58,750 |
| Mean Family Income | 179 | $69,135 |
| Median Household Income | 346 | $47,143 |
| Mean Household Income | 346 | $62,474 |
| Income Deficit | 179 | $0 |
| Wage / Income Gap (%) | 729 | 17.78% |
| Wage / Income Gap ($) | 729 | 82.22¢ per $1 |
| Gini / Inequality Index | 729 | 0.39 |
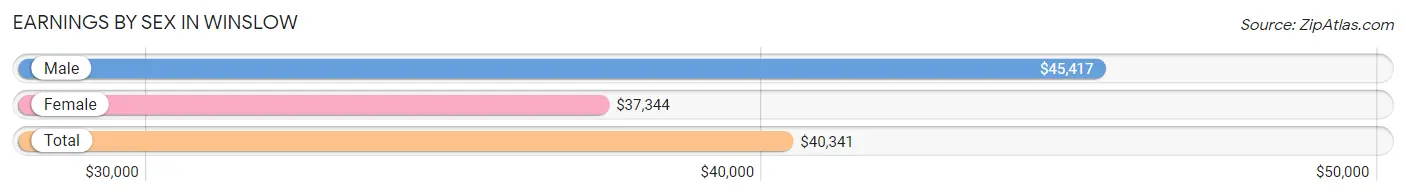
Earnings by Sex in Winslow
Average Earnings in Winslow are $40,341, $45,417 for men and $37,344 for women, a difference of 17.8%.
| Sex | Number | Average Earnings |
| Male | 200 (60.8%) | $45,417 |
| Female | 129 (39.2%) | $37,344 |
| Total | 329 (100.0%) | $40,341 |
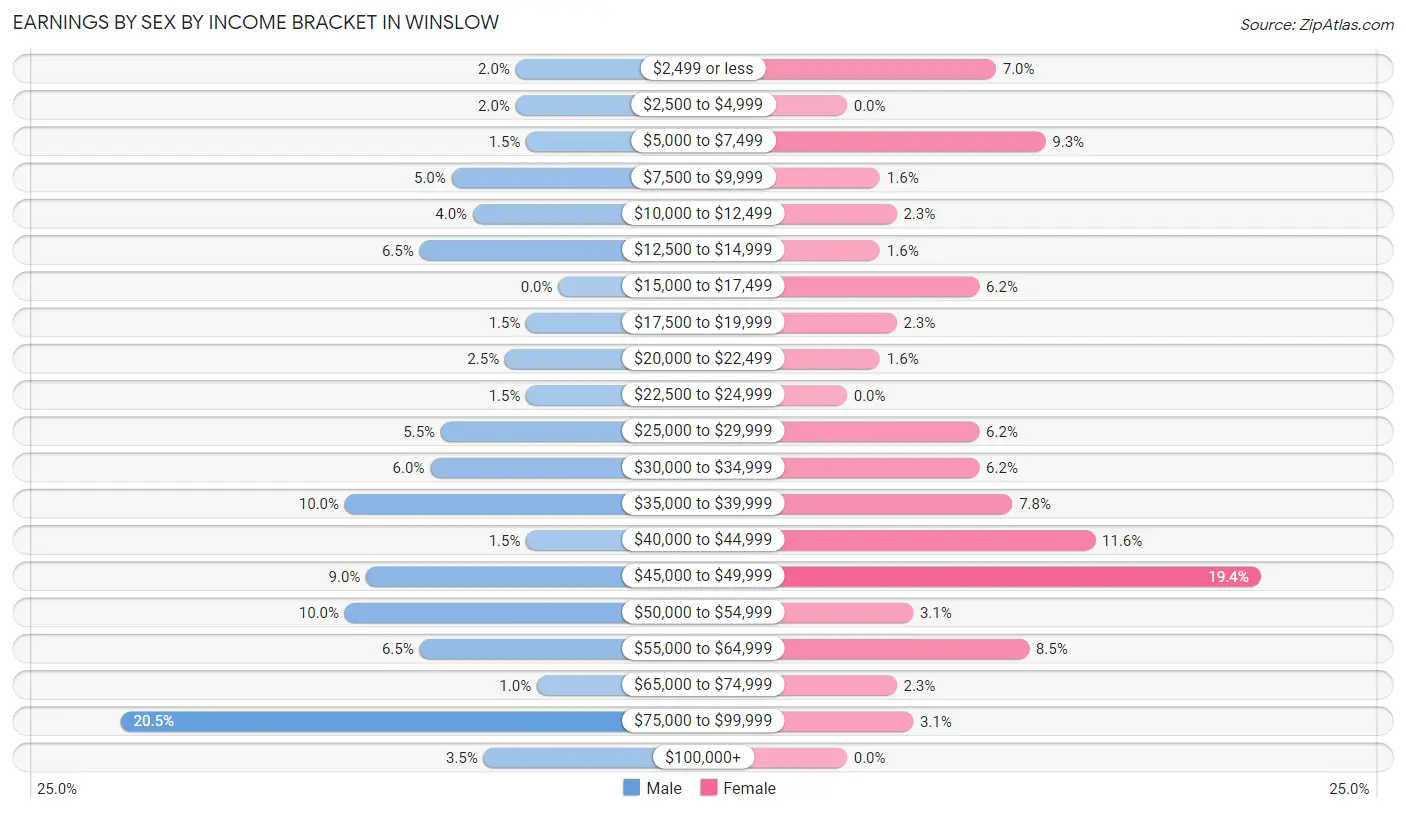
Earnings by Sex by Income Bracket in Winslow
The most common earnings brackets in Winslow are $75,000 to $99,999 for men (41 | 20.5%) and $45,000 to $49,999 for women (25 | 19.4%).
| Income | Male | Female |
| $2,499 or less | 4 (2.0%) | 9 (7.0%) |
| $2,500 to $4,999 | 4 (2.0%) | 0 (0.0%) |
| $5,000 to $7,499 | 3 (1.5%) | 12 (9.3%) |
| $7,500 to $9,999 | 10 (5.0%) | 2 (1.5%) |
| $10,000 to $12,499 | 8 (4.0%) | 3 (2.3%) |
| $12,500 to $14,999 | 13 (6.5%) | 2 (1.5%) |
| $15,000 to $17,499 | 0 (0.0%) | 8 (6.2%) |
| $17,500 to $19,999 | 3 (1.5%) | 3 (2.3%) |
| $20,000 to $22,499 | 5 (2.5%) | 2 (1.5%) |
| $22,500 to $24,999 | 3 (1.5%) | 0 (0.0%) |
| $25,000 to $29,999 | 11 (5.5%) | 8 (6.2%) |
| $30,000 to $34,999 | 12 (6.0%) | 8 (6.2%) |
| $35,000 to $39,999 | 20 (10.0%) | 10 (7.7%) |
| $40,000 to $44,999 | 3 (1.5%) | 15 (11.6%) |
| $45,000 to $49,999 | 18 (9.0%) | 25 (19.4%) |
| $50,000 to $54,999 | 20 (10.0%) | 4 (3.1%) |
| $55,000 to $64,999 | 13 (6.5%) | 11 (8.5%) |
| $65,000 to $74,999 | 2 (1.0%) | 3 (2.3%) |
| $75,000 to $99,999 | 41 (20.5%) | 4 (3.1%) |
| $100,000+ | 7 (3.5%) | 0 (0.0%) |
| Total | 200 (100.0%) | 129 (100.0%) |
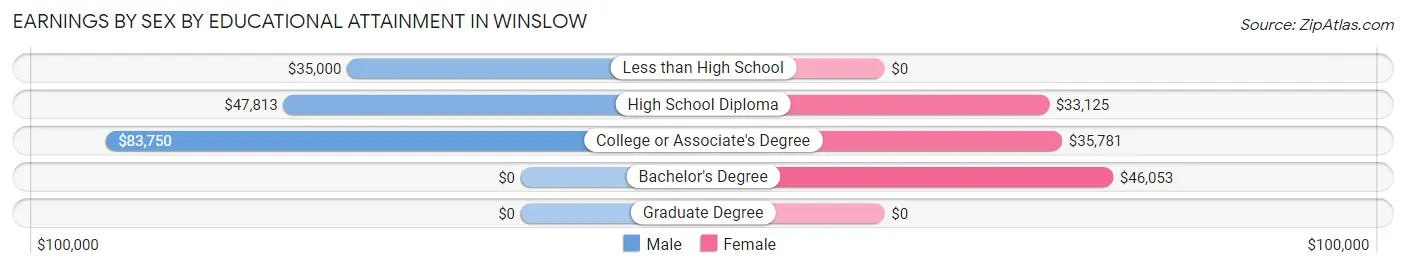
Earnings by Sex by Educational Attainment in Winslow
Average earnings in Winslow are $49,063 for men and $40,781 for women, a difference of 16.9%. Men with an educational attainment of college or associate's degree enjoy the highest average annual earnings of $83,750, while those with less than high school education earn the least with $35,000. Women with an educational attainment of bachelor's degree earn the most with the average annual earnings of $46,053, while those with high school diploma education have the smallest earnings of $33,125.
| Educational Attainment | Male Income | Female Income |
| Less than High School | $35,000 | $0 |
| High School Diploma | $47,813 | $33,125 |
| College or Associate's Degree | $83,750 | $35,781 |
| Bachelor's Degree | - | - |
| Graduate Degree | - | - |
| Total | $49,063 | $40,781 |
Family Income in Winslow
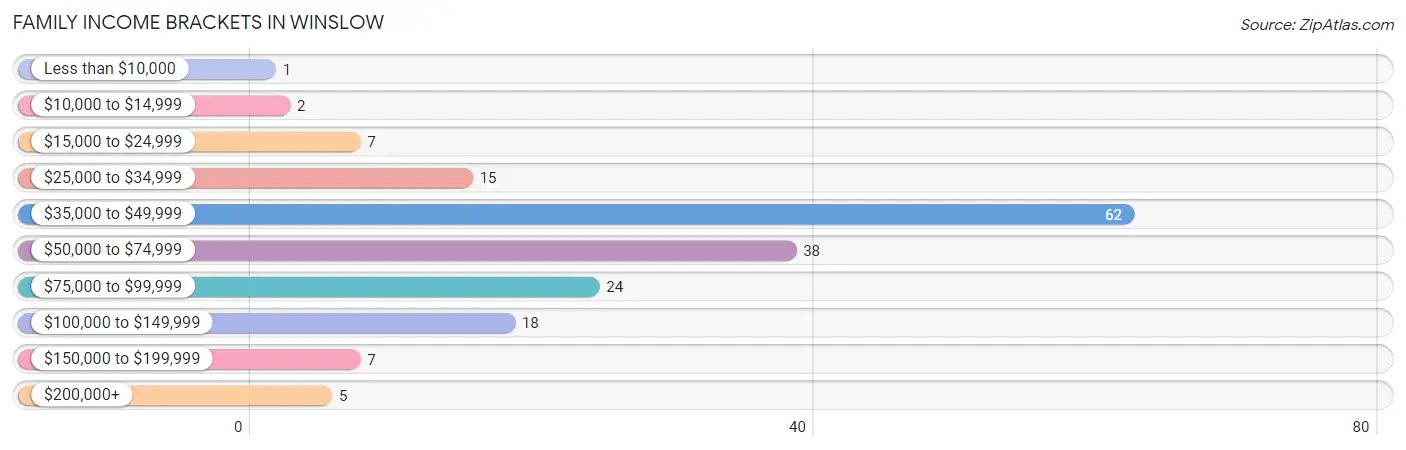
Family Income Brackets in Winslow
According to the Winslow family income data, there are 62 families falling into the $35,000 to $49,999 income range, which is the most common income bracket and makes up 34.6% of all families. Conversely, the less than $10,000 income bracket is the least frequent group with only 1 families (0.6%) belonging to this category.
| Income Bracket | # Families | % Families |
| Less than $10,000 | 1 | 0.6% |
| $10,000 to $14,999 | 2 | 1.1% |
| $15,000 to $24,999 | 7 | 3.9% |
| $25,000 to $34,999 | 15 | 8.4% |
| $35,000 to $49,999 | 62 | 34.6% |
| $50,000 to $74,999 | 38 | 21.2% |
| $75,000 to $99,999 | 24 | 13.4% |
| $100,000 to $149,999 | 18 | 10.1% |
| $150,000 to $199,999 | 7 | 3.9% |
| $200,000+ | 5 | 2.8% |
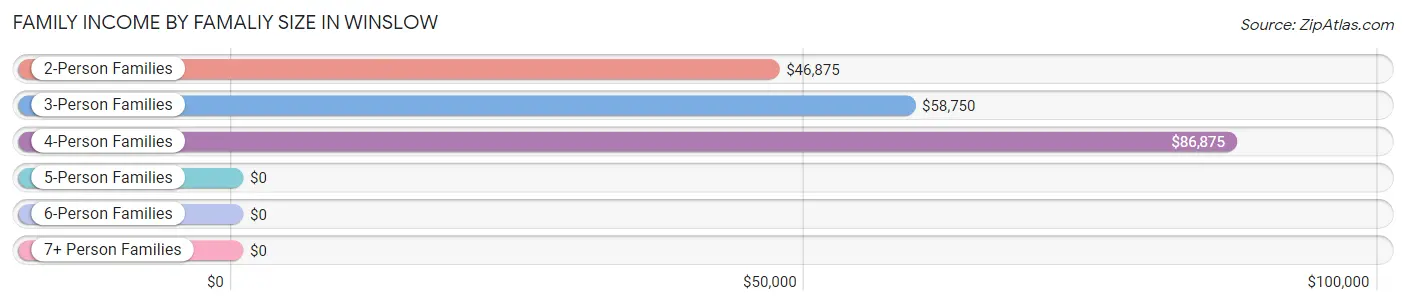
Family Income by Famaliy Size in Winslow
4-person families (26 | 14.5%) account for the highest median family income in Winslow with $86,875 per family, while 2-person families (79 | 44.1%) have the highest median income of $23,438 per family member.
| Income Bracket | # Families | Median Income |
| 2-Person Families | 79 (44.1%) | $46,875 |
| 3-Person Families | 67 (37.4%) | $58,750 |
| 4-Person Families | 26 (14.5%) | $86,875 |
| 5-Person Families | 4 (2.2%) | $0 |
| 6-Person Families | 0 (0.0%) | $0 |
| 7+ Person Families | 3 (1.7%) | $0 |
| Total | 179 (100.0%) | $58,750 |
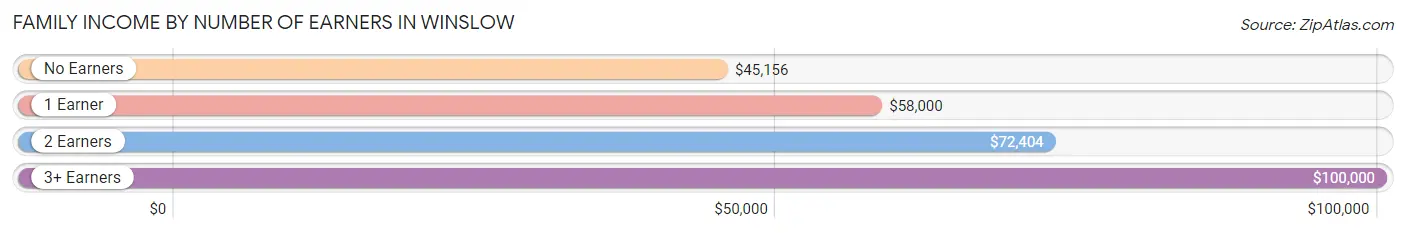
Family Income by Number of Earners in Winslow
The median family income in Winslow is $58,750, with families comprising 3+ earners (10) having the highest median family income of $100,000, while families with no earners (50) have the lowest median family income of $45,156, accounting for 5.6% and 27.9% of families, respectively.
| Number of Earners | # Families | Median Income |
| No Earners | 50 (27.9%) | $45,156 |
| 1 Earner | 52 (29.0%) | $58,000 |
| 2 Earners | 67 (37.4%) | $72,404 |
| 3+ Earners | 10 (5.6%) | $100,000 |
| Total | 179 (100.0%) | $58,750 |
Household Income in Winslow
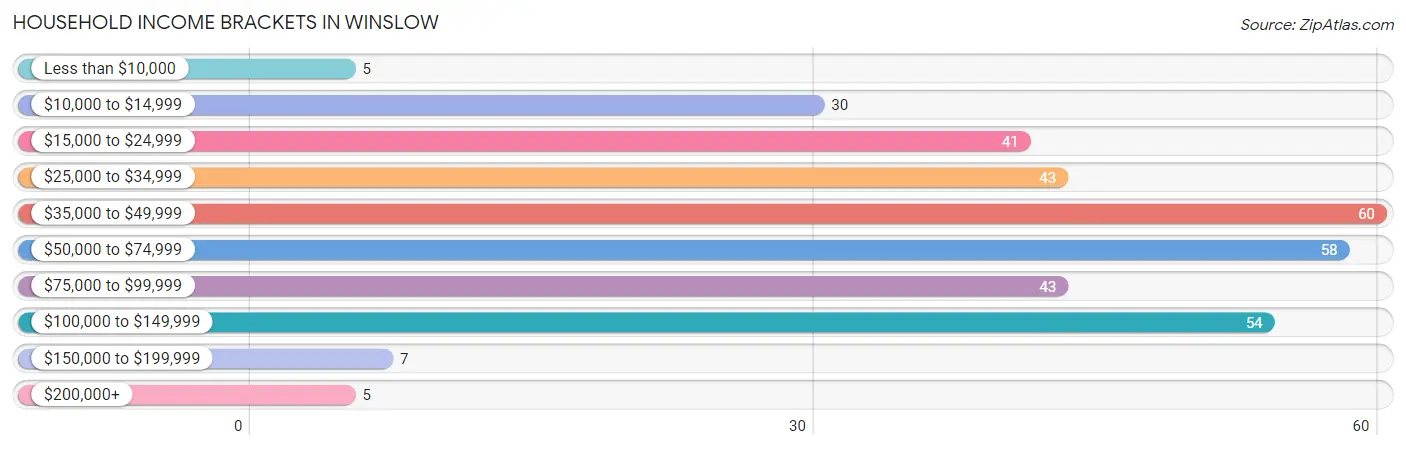
Household Income Brackets in Winslow
With 60 households falling in the category, the $35,000 to $49,999 income range is the most frequent in Winslow, accounting for 17.3% of all households. In contrast, only 5 households (1.5%) fall into the less than $10,000 income bracket, making it the least populous group.
| Income Bracket | # Households | % Households |
| Less than $10,000 | 5 | 1.4% |
| $10,000 to $14,999 | 30 | 8.7% |
| $15,000 to $24,999 | 41 | 11.8% |
| $25,000 to $34,999 | 43 | 12.4% |
| $35,000 to $49,999 | 60 | 17.3% |
| $50,000 to $74,999 | 58 | 16.8% |
| $75,000 to $99,999 | 43 | 12.4% |
| $100,000 to $149,999 | 54 | 15.6% |
| $150,000 to $199,999 | 7 | 2.0% |
| $200,000+ | 5 | 1.4% |
Household Income by Householder Age in Winslow
The median household income in Winslow is $47,143, with the highest median household income of $80,938 found in the 25 to 44 years age bracket for the primary householder. A total of 99 households (28.6%) fall into this category. Meanwhile, the 15 to 24 years age bracket for the primary householder has the lowest median household income of $0, with 10 households (2.9%) in this group.
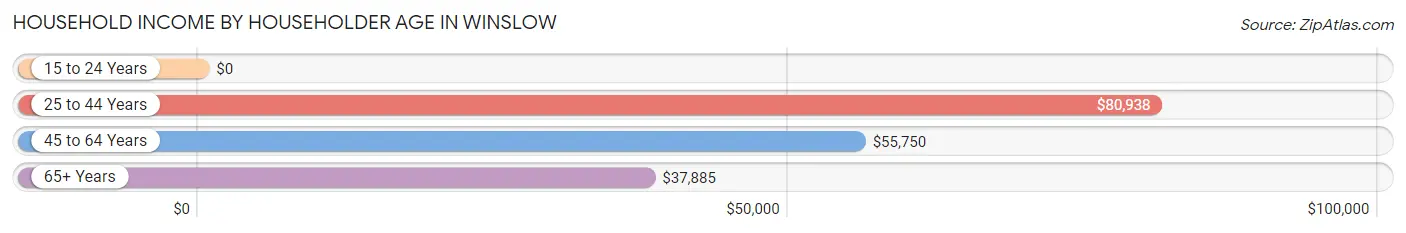
| Income Bracket | # Households | Median Income |
| 15 to 24 Years | 10 (2.9%) | $0 |
| 25 to 44 Years | 99 (28.6%) | $80,938 |
| 45 to 64 Years | 97 (28.0%) | $55,750 |
| 65+ Years | 140 (40.5%) | $37,885 |
| Total | 346 (100.0%) | $47,143 |
Poverty in Winslow
Income Below Poverty by Sex and Age in Winslow
With 15.2% poverty level for males and 11.7% for females among the residents of Winslow, under 5 year old males and under 5 year old females are the most vulnerable to poverty, with 6 males (50.0%) and 3 females (37.5%) in their respective age groups living below the poverty level.
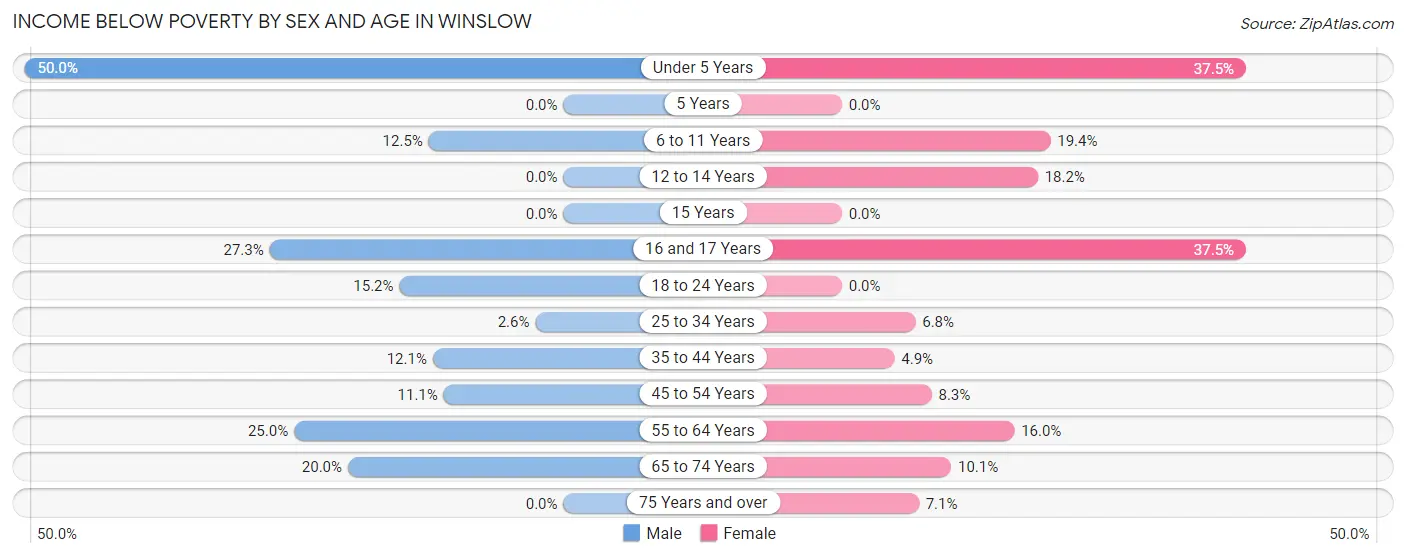
| Age Bracket | Male | Female |
| Under 5 Years | 6 (50.0%) | 3 (37.5%) |
| 5 Years | 0 (0.0%) | 0 (0.0%) |
| 6 to 11 Years | 2 (12.5%) | 6 (19.4%) |
| 12 to 14 Years | 0 (0.0%) | 2 (18.2%) |
| 15 Years | 0 (0.0%) | 0 (0.0%) |
| 16 and 17 Years | 3 (27.3%) | 3 (37.5%) |
| 18 to 24 Years | 7 (15.2%) | 0 (0.0%) |
| 25 to 34 Years | 2 (2.6%) | 3 (6.8%) |
| 35 to 44 Years | 4 (12.1%) | 2 (4.9%) |
| 45 to 54 Years | 3 (11.1%) | 3 (8.3%) |
| 55 to 64 Years | 17 (25.0%) | 8 (16.0%) |
| 65 to 74 Years | 15 (20.0%) | 7 (10.1%) |
| 75 Years and over | 0 (0.0%) | 2 (7.1%) |
| Total | 59 (15.2%) | 39 (11.7%) |
Income Above Poverty by Sex and Age in Winslow
According to the poverty statistics in Winslow, males aged 5 years and females aged 5 years are the age groups that are most secure financially, with 100.0% of males and 100.0% of females in these age groups living above the poverty line.
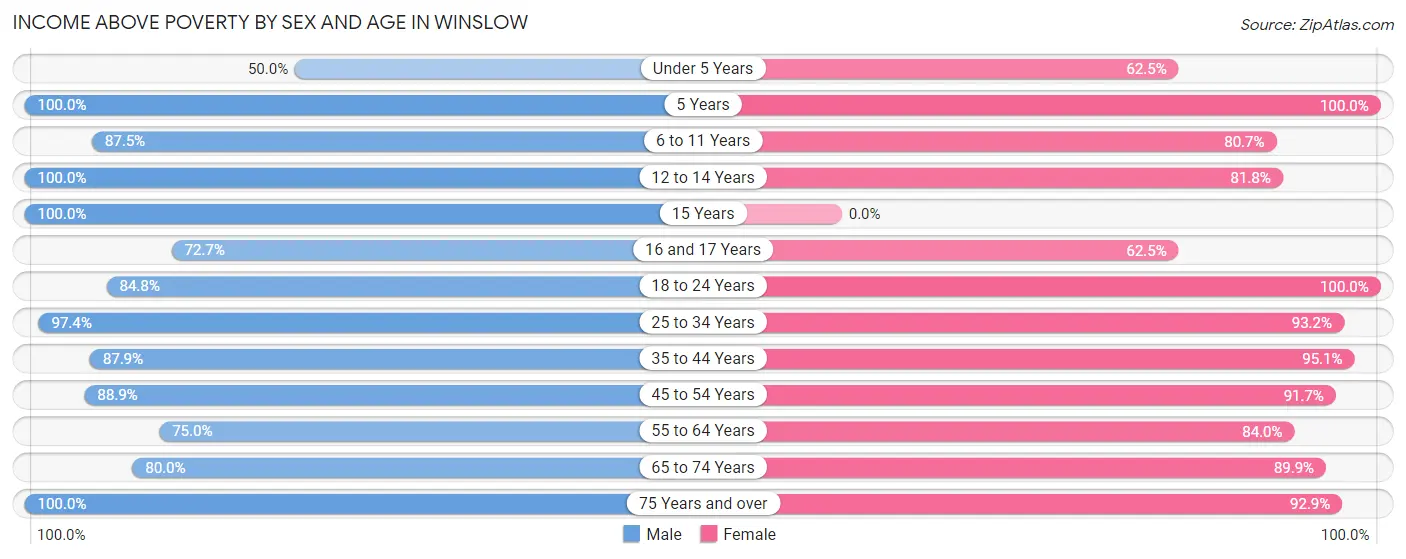
| Age Bracket | Male | Female |
| Under 5 Years | 6 (50.0%) | 5 (62.5%) |
| 5 Years | 10 (100.0%) | 1 (100.0%) |
| 6 to 11 Years | 14 (87.5%) | 25 (80.6%) |
| 12 to 14 Years | 1 (100.0%) | 9 (81.8%) |
| 15 Years | 4 (100.0%) | 0 (0.0%) |
| 16 and 17 Years | 8 (72.7%) | 5 (62.5%) |
| 18 to 24 Years | 39 (84.8%) | 5 (100.0%) |
| 25 to 34 Years | 75 (97.4%) | 41 (93.2%) |
| 35 to 44 Years | 29 (87.9%) | 39 (95.1%) |
| 45 to 54 Years | 24 (88.9%) | 33 (91.7%) |
| 55 to 64 Years | 51 (75.0%) | 42 (84.0%) |
| 65 to 74 Years | 60 (80.0%) | 62 (89.9%) |
| 75 Years and over | 9 (100.0%) | 26 (92.9%) |
| Total | 330 (84.8%) | 293 (88.2%) |
Income Below Poverty Among Married-Couple Families in Winslow
The poverty statistics for married-couple families in Winslow show that 4.5% or 6 of the total 132 families live below the poverty line. Families with 5 or more children have the highest poverty rate of 100.0%, comprising of 2 families. On the other hand, families with no children have the lowest poverty rate of 0.0%, which includes 0 families.
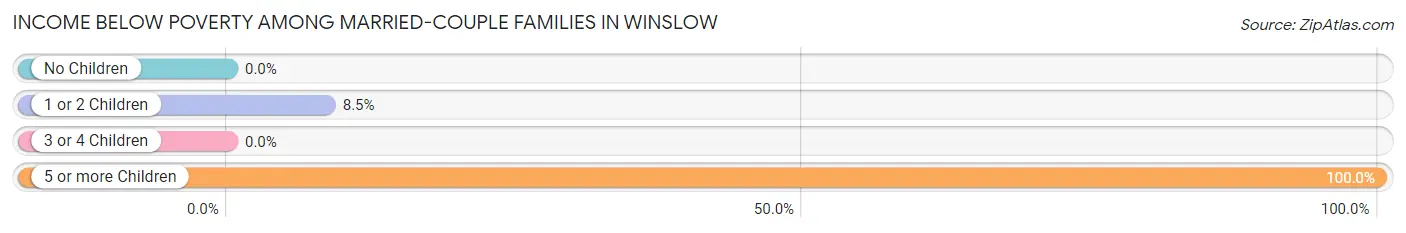
| Children | Above Poverty | Below Poverty |
| No Children | 83 (100.0%) | 0 (0.0%) |
| 1 or 2 Children | 43 (91.5%) | 4 (8.5%) |
| 3 or 4 Children | 0 (0.0%) | 0 (0.0%) |
| 5 or more Children | 0 (0.0%) | 2 (100.0%) |
| Total | 126 (95.5%) | 6 (4.5%) |
Income Below Poverty Among Single-Parent Households in Winslow
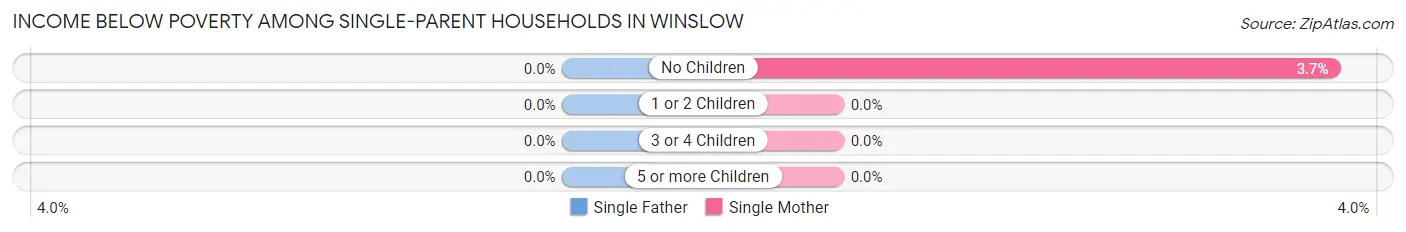
| Children | Single Father | Single Mother |
| No Children | 0 (0.0%) | 1 (3.7%) |
| 1 or 2 Children | 0 (0.0%) | 0 (0.0%) |
| 3 or 4 Children | 0 (0.0%) | 0 (0.0%) |
| 5 or more Children | 0 (0.0%) | 0 (0.0%) |
| Total | 0 (0.0%) | 1 (2.3%) |
Income Below Poverty Among Married-Couple vs Single-Parent Households in Winslow
The poverty data for Winslow shows that 6 of the married-couple family households (4.5%) and 1 of the single-parent households (2.1%) are living below the poverty level. Within the married-couple family households, those with 5 or more children have the highest poverty rate, with 2 households (100.0%) falling below the poverty line. Among the single-parent households, those with no children have the highest poverty rate, with 1 household (3.2%) living below poverty.
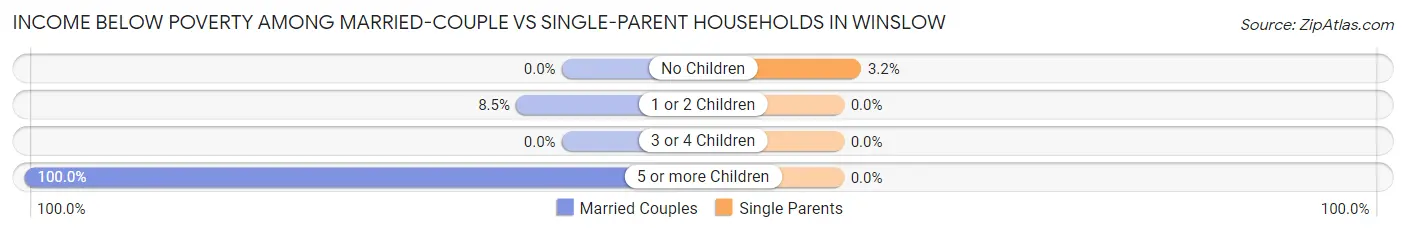
| Children | Married-Couple Families | Single-Parent Households |
| No Children | 0 (0.0%) | 1 (3.2%) |
| 1 or 2 Children | 4 (8.5%) | 0 (0.0%) |
| 3 or 4 Children | 0 (0.0%) | 0 (0.0%) |
| 5 or more Children | 2 (100.0%) | 0 (0.0%) |
| Total | 6 (4.5%) | 1 (2.1%) |
Race in Winslow
The most populous races in Winslow are White / Caucasian (712 | 97.7%), and Two or more Races (17 | 2.3%).
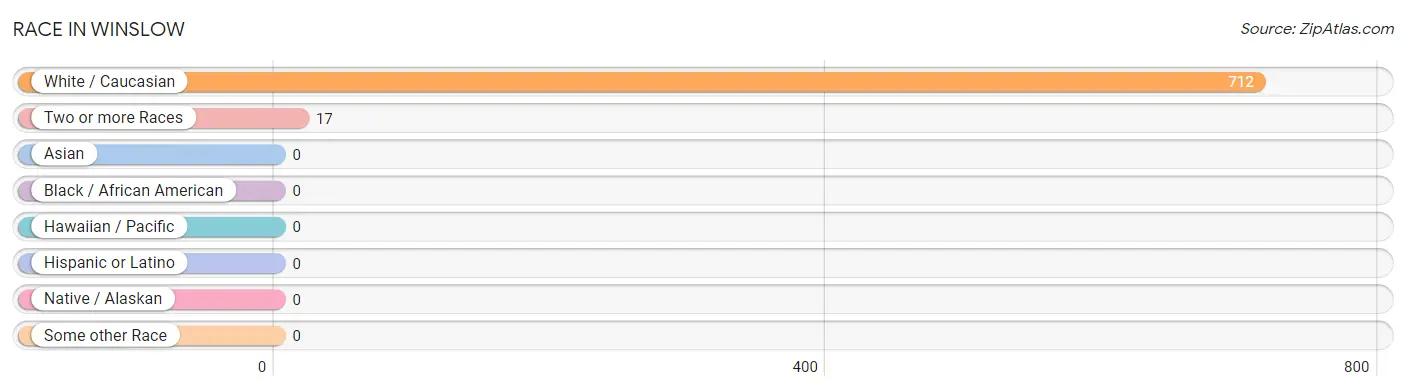
| Race | # Population | % Population |
| Asian | 0 | 0.0% |
| Black / African American | 0 | 0.0% |
| Hawaiian / Pacific | 0 | 0.0% |
| Hispanic or Latino | 0 | 0.0% |
| Native / Alaskan | 0 | 0.0% |
| White / Caucasian | 712 | 97.7% |
| Two or more Races | 17 | 2.3% |
| Some other Race | 0 | 0.0% |
| Total | 729 | 100.0% |
Ancestry in Winslow
The most populous ancestries reported in Winslow are German (200 | 27.4%), English (182 | 25.0%), Irish (132 | 18.1%), American (37 | 5.1%), and Croatian (12 | 1.7%), together accounting for 77.2% of all Winslow residents.
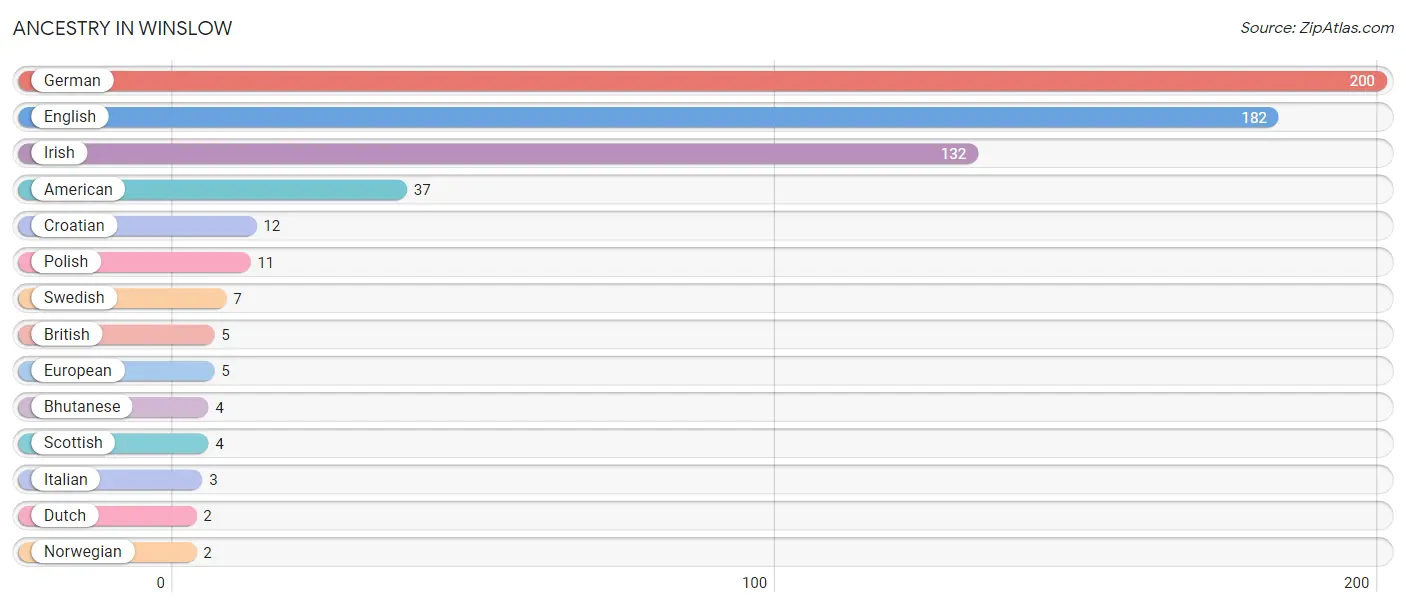
| Ancestry | # Population | % Population |
| American | 37 | 5.1% |
| Bhutanese | 4 | 0.5% |
| British | 5 | 0.7% |
| Croatian | 12 | 1.7% |
| Dutch | 2 | 0.3% |
| English | 182 | 25.0% |
| European | 5 | 0.7% |
| German | 200 | 27.4% |
| Irish | 132 | 18.1% |
| Italian | 3 | 0.4% |
| Norwegian | 2 | 0.3% |
| Polish | 11 | 1.5% |
| Scottish | 4 | 0.5% |
| Swedish | 7 | 1.0% | View All 14 Rows |
Immigrants in Winslow

| Immigration Origin | # Population | % Population | View All 0 Rows |
Sex and Age in Winslow
Sex and Age in Winslow
The most populous age groups in Winslow are 25 to 29 Years (53 | 13.5%) for men and 70 to 74 Years (36 | 10.7%) for women.
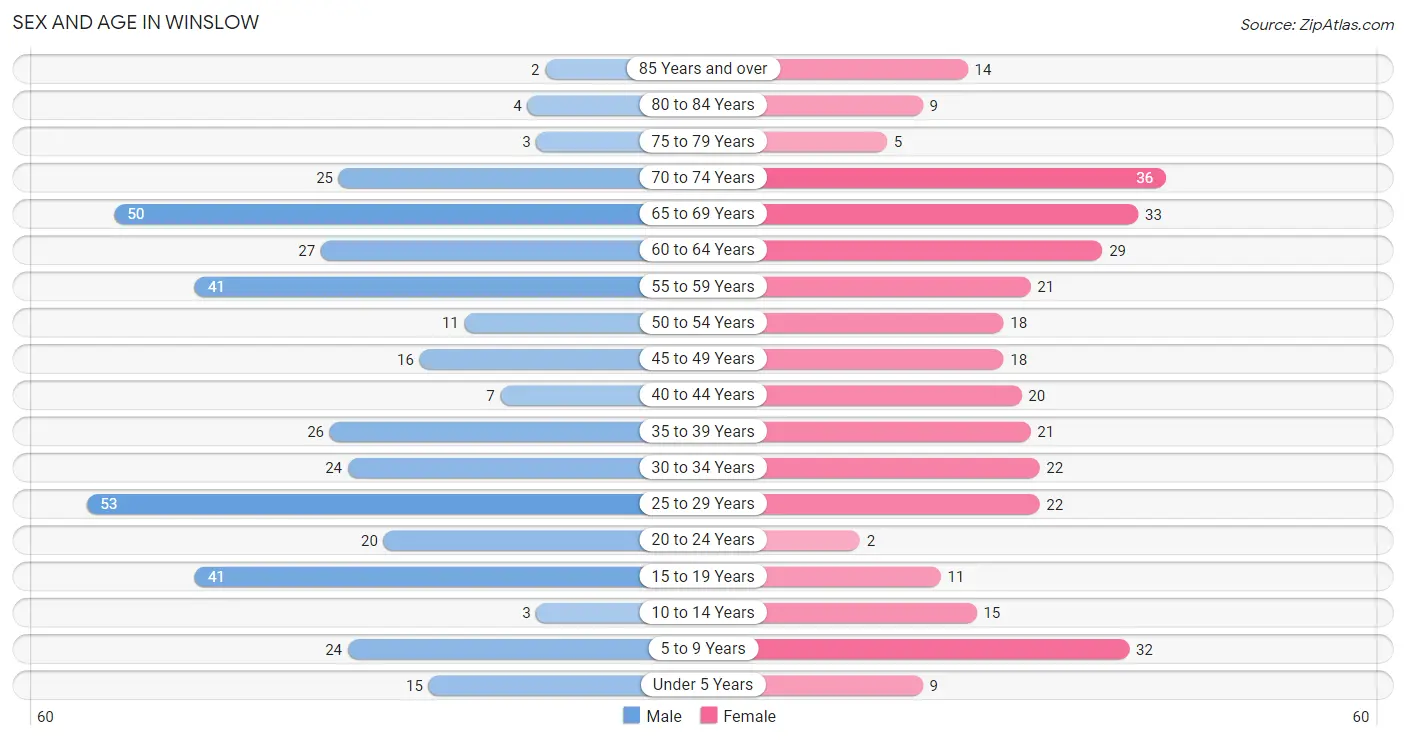
| Age Bracket | Male | Female |
| Under 5 Years | 15 (3.8%) | 9 (2.7%) |
| 5 to 9 Years | 24 (6.1%) | 32 (9.5%) |
| 10 to 14 Years | 3 (0.8%) | 15 (4.4%) |
| 15 to 19 Years | 41 (10.5%) | 11 (3.3%) |
| 20 to 24 Years | 20 (5.1%) | 2 (0.6%) |
| 25 to 29 Years | 53 (13.5%) | 22 (6.5%) |
| 30 to 34 Years | 24 (6.1%) | 22 (6.5%) |
| 35 to 39 Years | 26 (6.6%) | 21 (6.2%) |
| 40 to 44 Years | 7 (1.8%) | 20 (5.9%) |
| 45 to 49 Years | 16 (4.1%) | 18 (5.3%) |
| 50 to 54 Years | 11 (2.8%) | 18 (5.3%) |
| 55 to 59 Years | 41 (10.5%) | 21 (6.2%) |
| 60 to 64 Years | 27 (6.9%) | 29 (8.6%) |
| 65 to 69 Years | 50 (12.8%) | 33 (9.8%) |
| 70 to 74 Years | 25 (6.4%) | 36 (10.7%) |
| 75 to 79 Years | 3 (0.8%) | 5 (1.5%) |
| 80 to 84 Years | 4 (1.0%) | 9 (2.7%) |
| 85 Years and over | 2 (0.5%) | 14 (4.2%) |
| Total | 392 (100.0%) | 337 (100.0%) |
Families and Households in Winslow
Median Family Size in Winslow
The median family size in Winslow is 2.78 persons per family, with single female/mother families (43 | 24.0%) accounting for the largest median family size of 2.86 persons per family. On the other hand, single male/father families (4 | 2.2%) represent the smallest median family size with 2.00 persons per family.
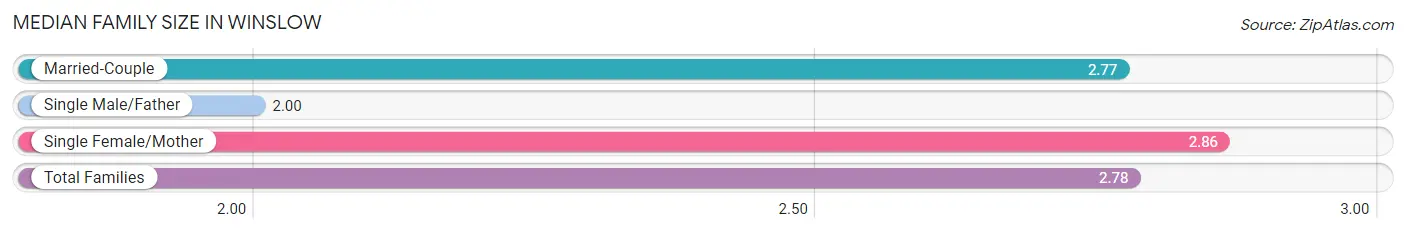
| Family Type | # Families | Family Size |
| Married-Couple | 132 (73.7%) | 2.77 |
| Single Male/Father | 4 (2.2%) | 2.00 |
| Single Female/Mother | 43 (24.0%) | 2.86 |
| Total Families | 179 (100.0%) | 2.78 |
Median Household Size in Winslow
The median household size in Winslow is 2.09 persons per household, with single female/mother households (43 | 12.4%) accounting for the largest median household size of 3.09 persons per household. non-family households (167 | 48.3%) represent the smallest median household size with 1.23 persons per household.
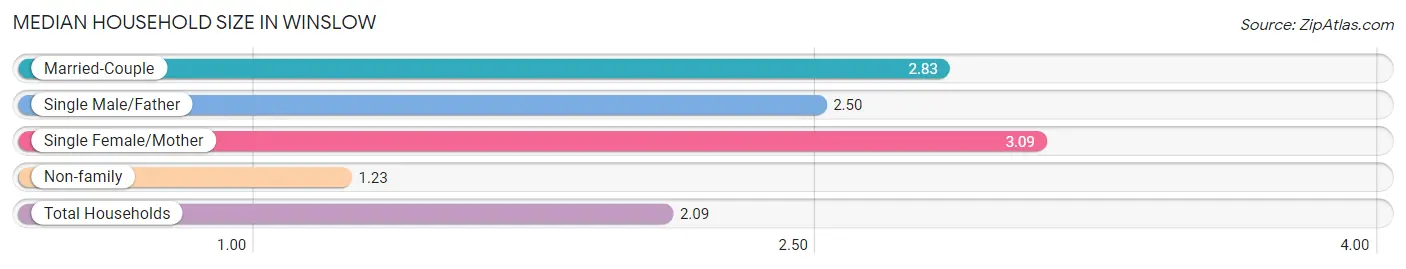
| Household Type | # Households | Household Size |
| Married-Couple | 132 (38.2%) | 2.83 |
| Single Male/Father | 4 (1.2%) | 2.50 |
| Single Female/Mother | 43 (12.4%) | 3.09 |
| Non-family | 167 (48.3%) | 1.23 |
| Total Households | 346 (100.0%) | 2.09 |
Household Size by Marriage Status in Winslow
Out of a total of 346 households in Winslow, 179 (51.7%) are family households, while 167 (48.3%) are nonfamily households. The most numerous type of family households are 3-person households, comprising 71, and the most common type of nonfamily households are 1-person households, comprising 118.
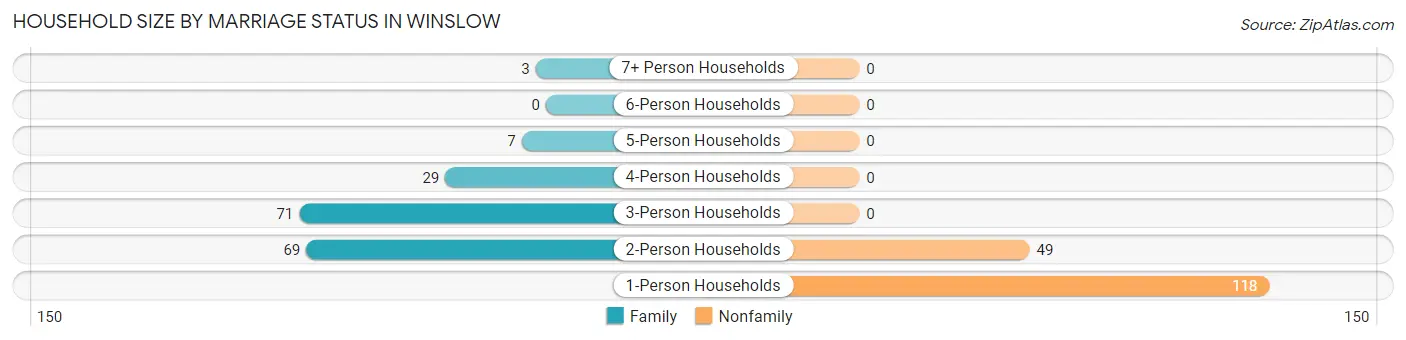
| Household Size | Family Households | Nonfamily Households |
| 1-Person Households | - | 118 (34.1%) |
| 2-Person Households | 69 (19.9%) | 49 (14.2%) |
| 3-Person Households | 71 (20.5%) | 0 (0.0%) |
| 4-Person Households | 29 (8.4%) | 0 (0.0%) |
| 5-Person Households | 7 (2.0%) | 0 (0.0%) |
| 6-Person Households | 0 (0.0%) | 0 (0.0%) |
| 7+ Person Households | 3 (0.9%) | 0 (0.0%) |
| Total | 179 (51.7%) | 167 (48.3%) |
Female Fertility in Winslow
Fertility by Age in Winslow
Average fertility rate in Winslow is 17.0 births per 1,000 women. Women in the age bracket of 20 to 34 years have the highest fertility rate with 43.0 births per 1,000 women. Women in the age bracket of 20 to 34 years acount for 100.0% of all women with births.
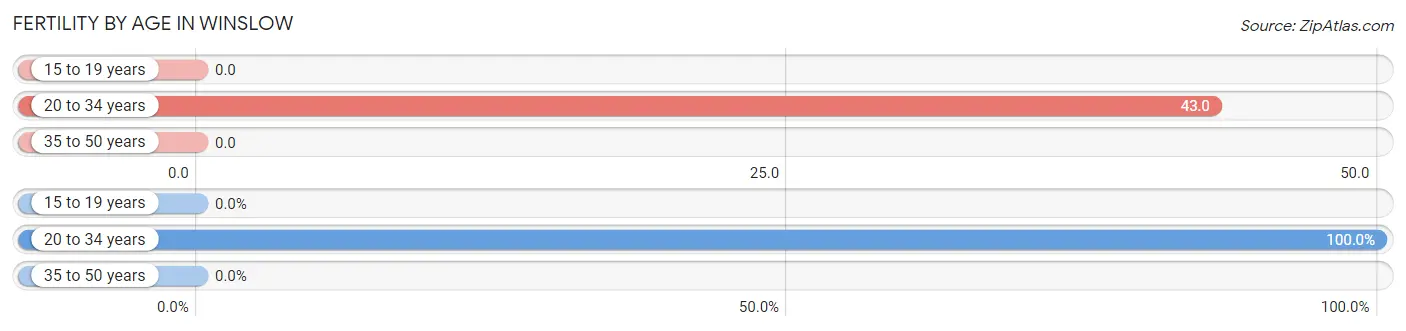
| Age Bracket | Women with Births | Births / 1,000 Women |
| 15 to 19 years | 0 (0.0%) | 0.0 |
| 20 to 34 years | 2 (100.0%) | 43.0 |
| 35 to 50 years | 0 (0.0%) | 0.0 |
| Total | 2 (100.0%) | 17.0 |
Fertility by Age by Marriage Status in Winslow
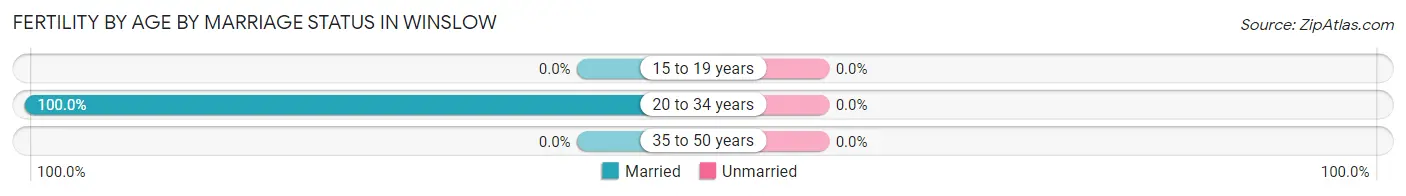
| Age Bracket | Married | Unmarried |
| 15 to 19 years | 0 (0.0%) | 0 (0.0%) |
| 20 to 34 years | 2 (100.0%) | 0 (0.0%) |
| 35 to 50 years | 0 (0.0%) | 0 (0.0%) |
| Total | 2 (100.0%) | 0 (0.0%) |
Fertility by Education in Winslow
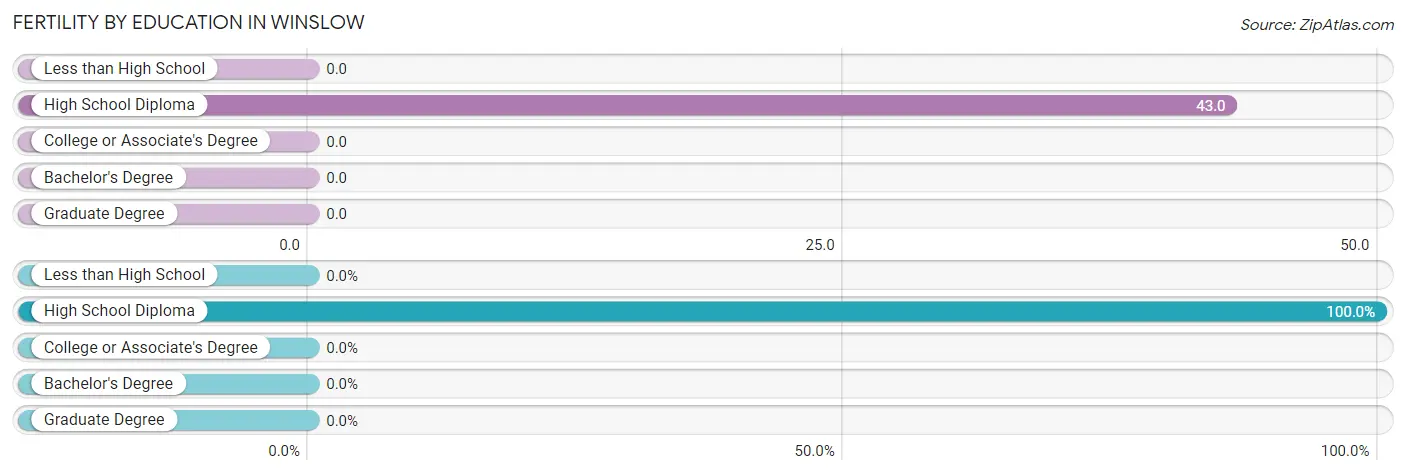
| Educational Attainment | Women with Births | Births / 1,000 Women |
| Less than High School | 0 (0.0%) | 0.0 |
| High School Diploma | 2 (100.0%) | 43.0 |
| College or Associate's Degree | 0 (0.0%) | 0.0 |
| Bachelor's Degree | 0 (0.0%) | 0.0 |
| Graduate Degree | 0 (0.0%) | 0.0 |
| Total | 2 (100.0%) | 17.0 |
Fertility by Education by Marriage Status in Winslow
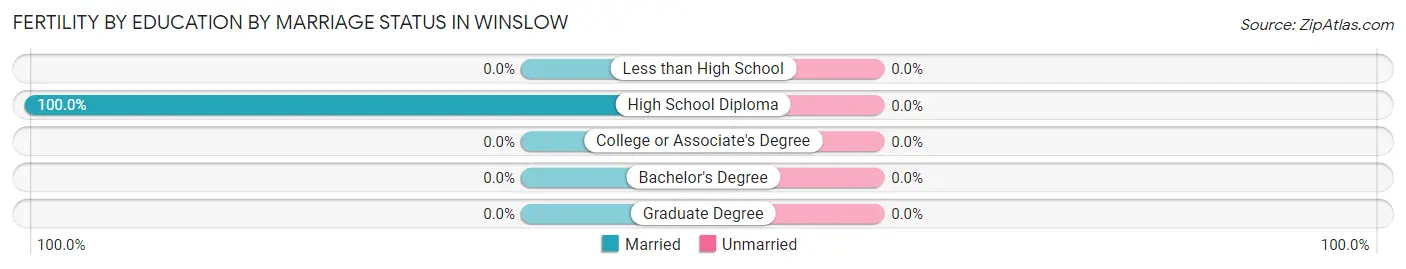
| Educational Attainment | Married | Unmarried |
| Less than High School | 0 (0.0%) | 0 (0.0%) |
| High School Diploma | 2 (100.0%) | 0 (0.0%) |
| College or Associate's Degree | 0 (0.0%) | 0 (0.0%) |
| Bachelor's Degree | 0 (0.0%) | 0 (0.0%) |
| Graduate Degree | 0 (0.0%) | 0 (0.0%) |
| Total | 2 (100.0%) | 0 (0.0%) |
Employment Characteristics in Winslow
Employment by Class of Employer in Winslow
Among the 275 employed individuals in Winslow, private company employees (236 | 85.8%), state government employees (12 | 4.4%), and not-for-profit organizations (11 | 4.0%) make up the most common classes of employment.
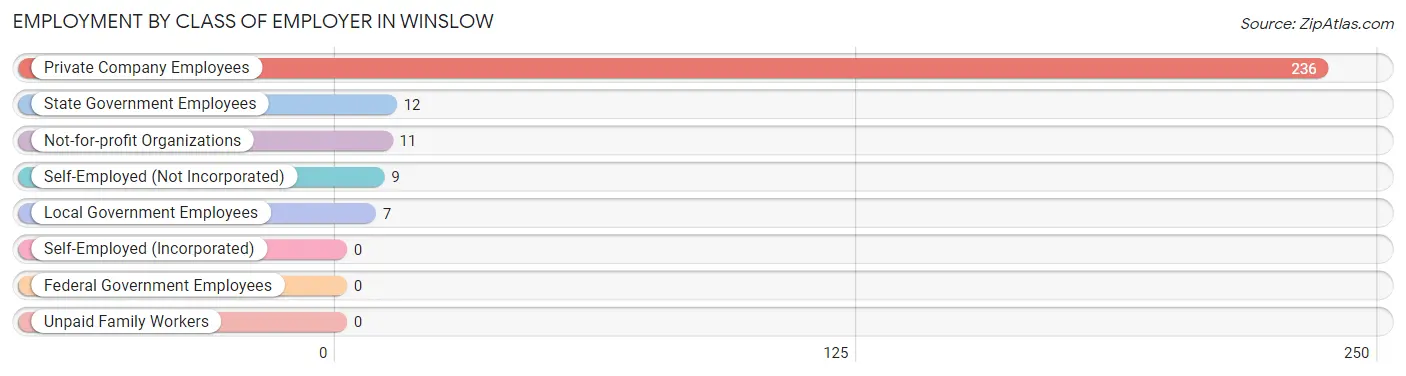
| Employer Class | # Employees | % Employees |
| Private Company Employees | 236 | 85.8% |
| Self-Employed (Incorporated) | 0 | 0.0% |
| Self-Employed (Not Incorporated) | 9 | 3.3% |
| Not-for-profit Organizations | 11 | 4.0% |
| Local Government Employees | 7 | 2.5% |
| State Government Employees | 12 | 4.4% |
| Federal Government Employees | 0 | 0.0% |
| Unpaid Family Workers | 0 | 0.0% |
| Total | 275 | 100.0% |
Employment Status by Age in Winslow
According to the labor force statistics for Winslow, out of the total population over 16 years of age (627), 47.0% or 295 individuals are in the labor force, with 5.4% or 16 of them unemployed. The age group with the highest labor force participation rate is 35 to 44 years, with 82.4% or 61 individuals in the labor force. Within the labor force, the 20 to 24 years age range has the highest percentage of unemployed individuals, with 46.2% or 6 of them being unemployed.
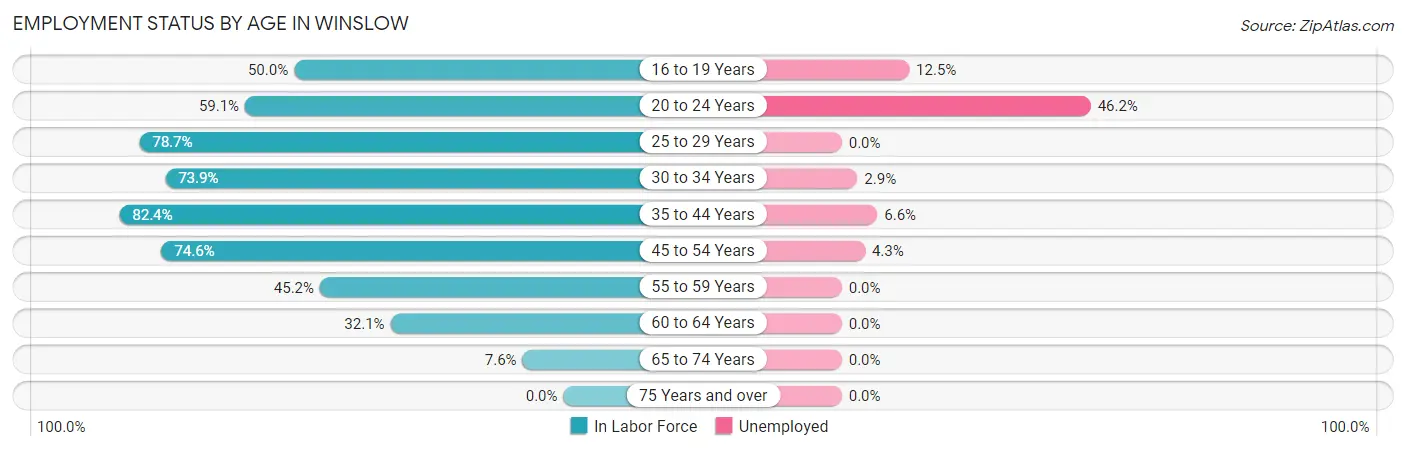
| Age Bracket | In Labor Force | Unemployed |
| 16 to 19 Years | 24 (50.0%) | 3 (12.5%) |
| 20 to 24 Years | 13 (59.1%) | 6 (46.2%) |
| 25 to 29 Years | 59 (78.7%) | 0 (0.0%) |
| 30 to 34 Years | 34 (73.9%) | 1 (2.9%) |
| 35 to 44 Years | 61 (82.4%) | 4 (6.6%) |
| 45 to 54 Years | 47 (74.6%) | 2 (4.3%) |
| 55 to 59 Years | 28 (45.2%) | 0 (0.0%) |
| 60 to 64 Years | 18 (32.1%) | 0 (0.0%) |
| 65 to 74 Years | 11 (7.6%) | 0 (0.0%) |
| 75 Years and over | 0 (0.0%) | 0 (0.0%) |
| Total | 295 (47.0%) | 16 (5.4%) |
Employment Status by Educational Attainment in Winslow
According to labor force statistics for Winslow, 65.7% of individuals (247) out of the total population between 25 and 64 years of age (376) are in the labor force, with 2.8% or 7 of them being unemployed. The group with the highest labor force participation rate are those with the educational attainment of bachelor's degree or higher, with 88.2% or 30 individuals in the labor force. Within the labor force, individuals with high school diploma education have the highest percentage of unemployment, with 4.7% or 5 of them being unemployed.
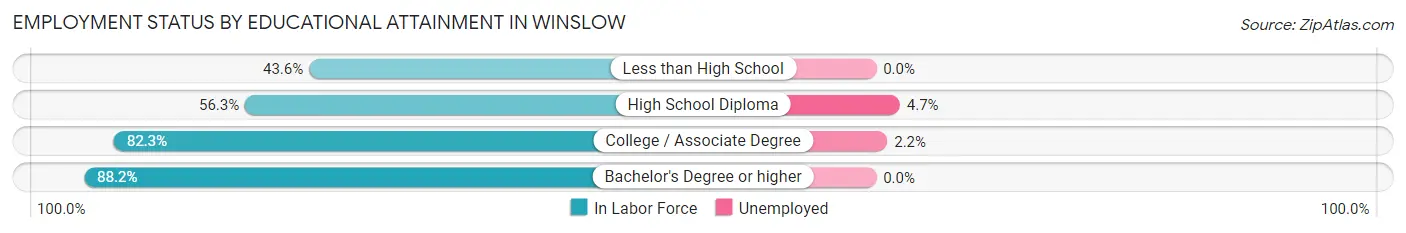
| Educational Attainment | In Labor Force | Unemployed |
| Less than High School | 17 (43.6%) | 0 (0.0%) |
| High School Diploma | 107 (56.3%) | 9 (4.7%) |
| College / Associate Degree | 93 (82.3%) | 2 (2.2%) |
| Bachelor's Degree or higher | 30 (88.2%) | 0 (0.0%) |
| Total | 247 (65.7%) | 11 (2.8%) |
Employment Occupations by Sex in Winslow
Management, Business, Science and Arts Occupations
The most common Management, Business, Science and Arts occupations in Winslow are Management (26 | 9.3%), Community & Social Service (4 | 1.4%), Education Instruction & Library (4 | 1.4%), Computers, Engineering & Science (2 | 0.7%), and Life, Physical & Social Science (2 | 0.7%).
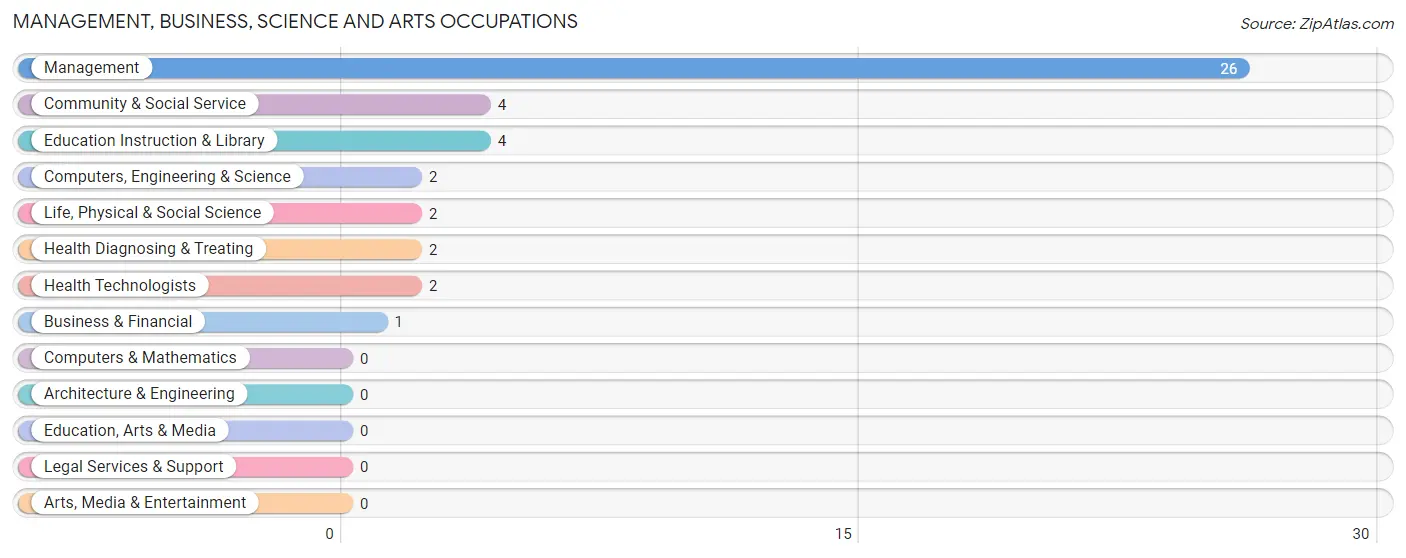
Management, Business, Science and Arts Occupations by Sex
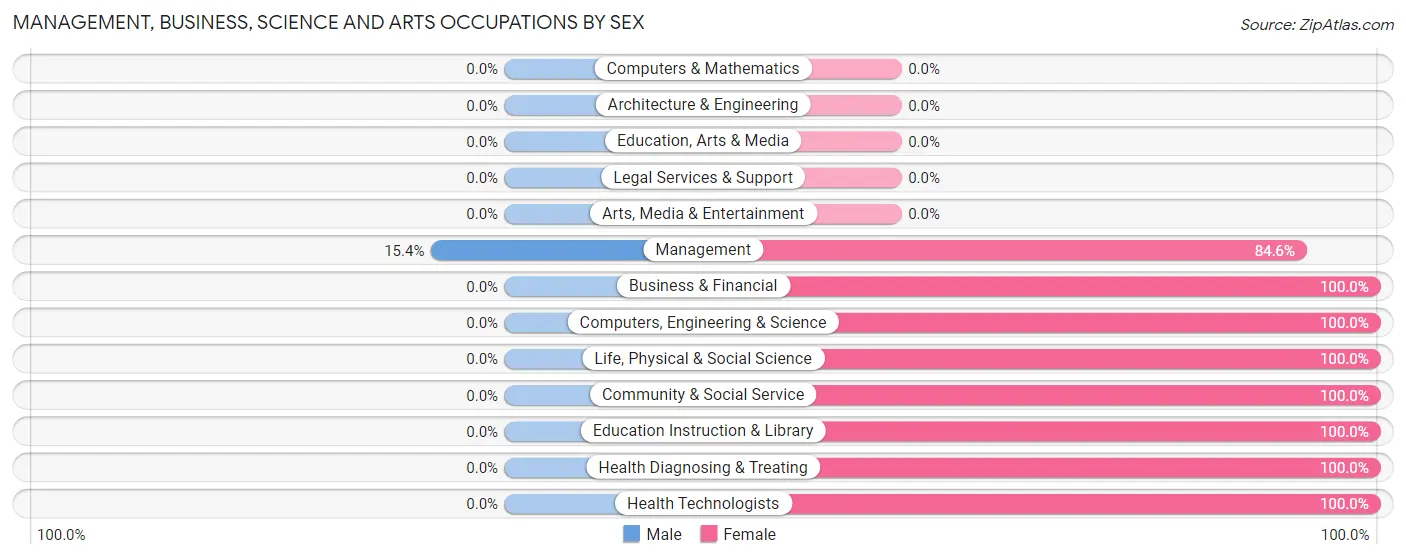
| Occupation | Male | Female |
| Management | 4 (15.4%) | 22 (84.6%) |
| Business & Financial | 0 (0.0%) | 1 (100.0%) |
| Computers, Engineering & Science | 0 (0.0%) | 2 (100.0%) |
| Computers & Mathematics | 0 (0.0%) | 0 (0.0%) |
| Architecture & Engineering | 0 (0.0%) | 0 (0.0%) |
| Life, Physical & Social Science | 0 (0.0%) | 2 (100.0%) |
| Community & Social Service | 0 (0.0%) | 4 (100.0%) |
| Education, Arts & Media | 0 (0.0%) | 0 (0.0%) |
| Legal Services & Support | 0 (0.0%) | 0 (0.0%) |
| Education Instruction & Library | 0 (0.0%) | 4 (100.0%) |
| Arts, Media & Entertainment | 0 (0.0%) | 0 (0.0%) |
| Health Diagnosing & Treating | 0 (0.0%) | 2 (100.0%) |
| Health Technologists | 0 (0.0%) | 2 (100.0%) |
| Total (Category) | 4 (11.4%) | 31 (88.6%) |
| Total (Overall) | 162 (58.1%) | 117 (41.9%) |
Services Occupations
The most common Services occupations in Winslow are Cleaning & Maintenance (15 | 5.4%), Food Preparation & Serving (12 | 4.3%), Personal Care & Service (10 | 3.6%), and Healthcare Support (5 | 1.8%).

Services Occupations by Sex
Within the Services occupations in Winslow, the most male-oriented occupations are Cleaning & Maintenance (86.7%), and Food Preparation & Serving (16.7%), while the most female-oriented occupations are Healthcare Support (100.0%), Personal Care & Service (100.0%), and Food Preparation & Serving (83.3%).
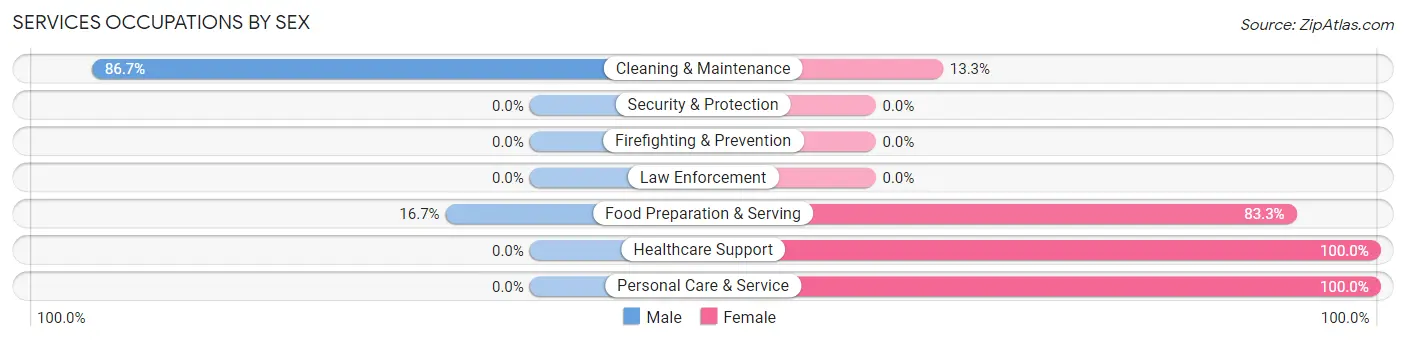
| Occupation | Male | Female |
| Healthcare Support | 0 (0.0%) | 5 (100.0%) |
| Security & Protection | 0 (0.0%) | 0 (0.0%) |
| Firefighting & Prevention | 0 (0.0%) | 0 (0.0%) |
| Law Enforcement | 0 (0.0%) | 0 (0.0%) |
| Food Preparation & Serving | 2 (16.7%) | 10 (83.3%) |
| Cleaning & Maintenance | 13 (86.7%) | 2 (13.3%) |
| Personal Care & Service | 0 (0.0%) | 10 (100.0%) |
| Total (Category) | 15 (35.7%) | 27 (64.3%) |
| Total (Overall) | 162 (58.1%) | 117 (41.9%) |
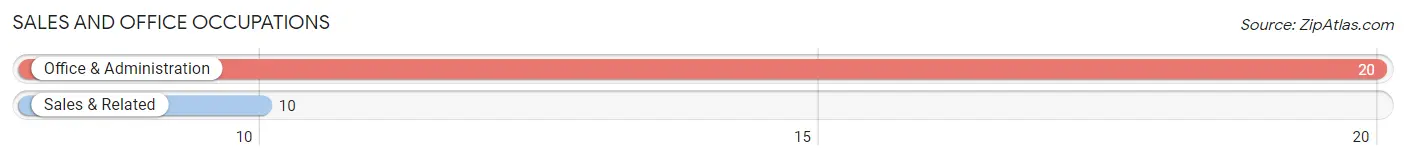
Sales and Office Occupations
The most common Sales and Office occupations in Winslow are Office & Administration (20 | 7.2%), and Sales & Related (10 | 3.6%).
Sales and Office Occupations by Sex
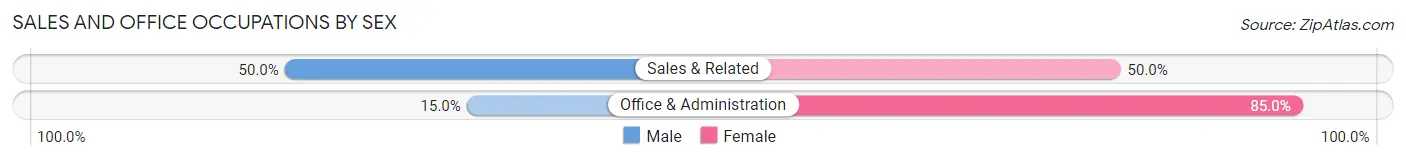
| Occupation | Male | Female |
| Sales & Related | 5 (50.0%) | 5 (50.0%) |
| Office & Administration | 3 (15.0%) | 17 (85.0%) |
| Total (Category) | 8 (26.7%) | 22 (73.3%) |
| Total (Overall) | 162 (58.1%) | 117 (41.9%) |
Natural Resources, Construction and Maintenance Occupations
The most common Natural Resources, Construction and Maintenance occupations in Winslow are Installation, Maintenance & Repair (39 | 14.0%), Construction & Extraction (6 | 2.1%), and Farming, Fishing & Forestry (2 | 0.7%).
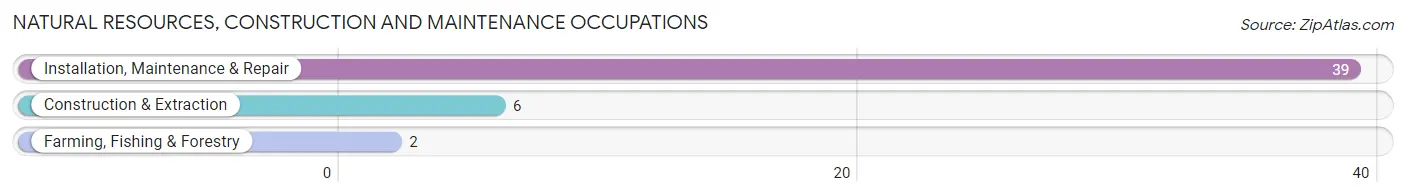
Natural Resources, Construction and Maintenance Occupations by Sex
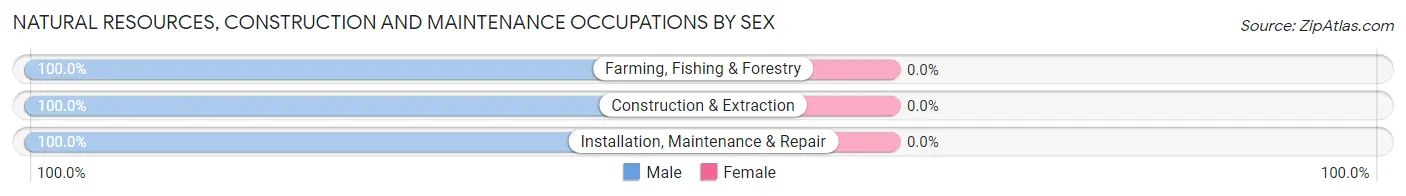
| Occupation | Male | Female |
| Farming, Fishing & Forestry | 2 (100.0%) | 0 (0.0%) |
| Construction & Extraction | 6 (100.0%) | 0 (0.0%) |
| Installation, Maintenance & Repair | 39 (100.0%) | 0 (0.0%) |
| Total (Category) | 47 (100.0%) | 0 (0.0%) |
| Total (Overall) | 162 (58.1%) | 117 (41.9%) |
Production, Transportation and Moving Occupations
The most common Production, Transportation and Moving occupations in Winslow are Production (87 | 31.2%), Material Moving (20 | 7.2%), and Transportation (18 | 6.5%).
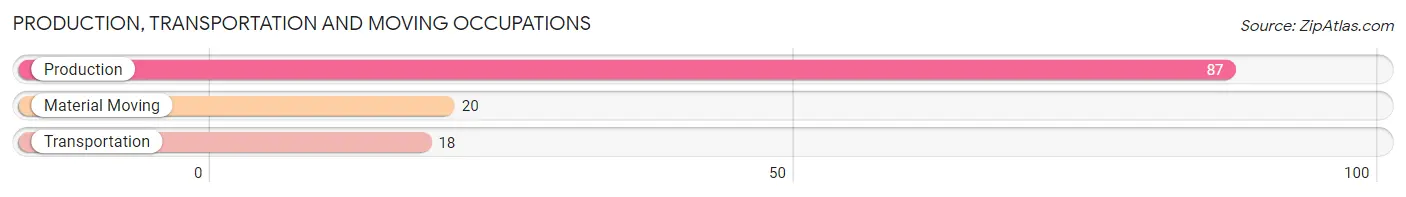
Production, Transportation and Moving Occupations by Sex
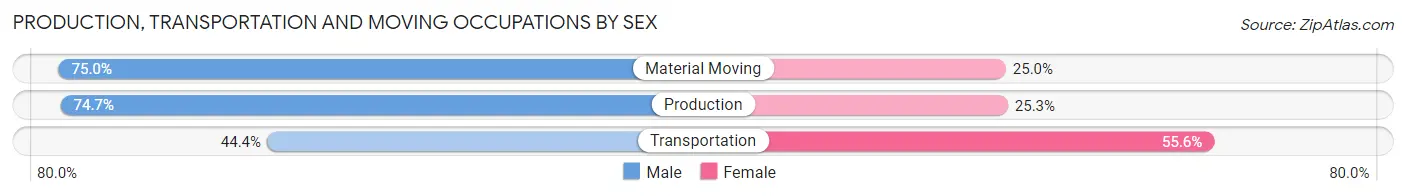
| Occupation | Male | Female |
| Production | 65 (74.7%) | 22 (25.3%) |
| Transportation | 8 (44.4%) | 10 (55.6%) |
| Material Moving | 15 (75.0%) | 5 (25.0%) |
| Total (Category) | 88 (70.4%) | 37 (29.6%) |
| Total (Overall) | 162 (58.1%) | 117 (41.9%) |
Employment Industries by Sex in Winslow
Employment Industries in Winslow
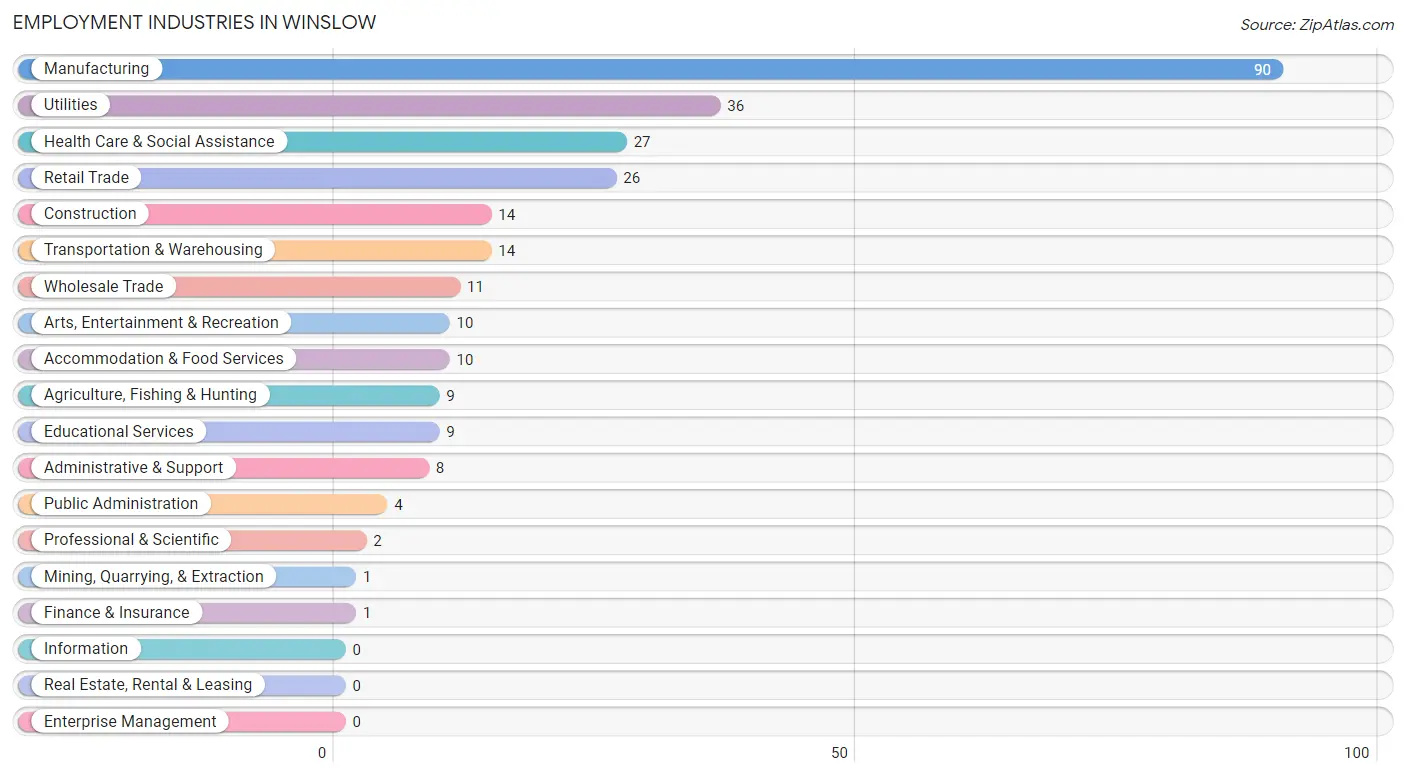
The major employment industries in Winslow include Manufacturing (90 | 32.3%), Utilities (36 | 12.9%), Health Care & Social Assistance (27 | 9.7%), Retail Trade (26 | 9.3%), and Construction (14 | 5.0%).
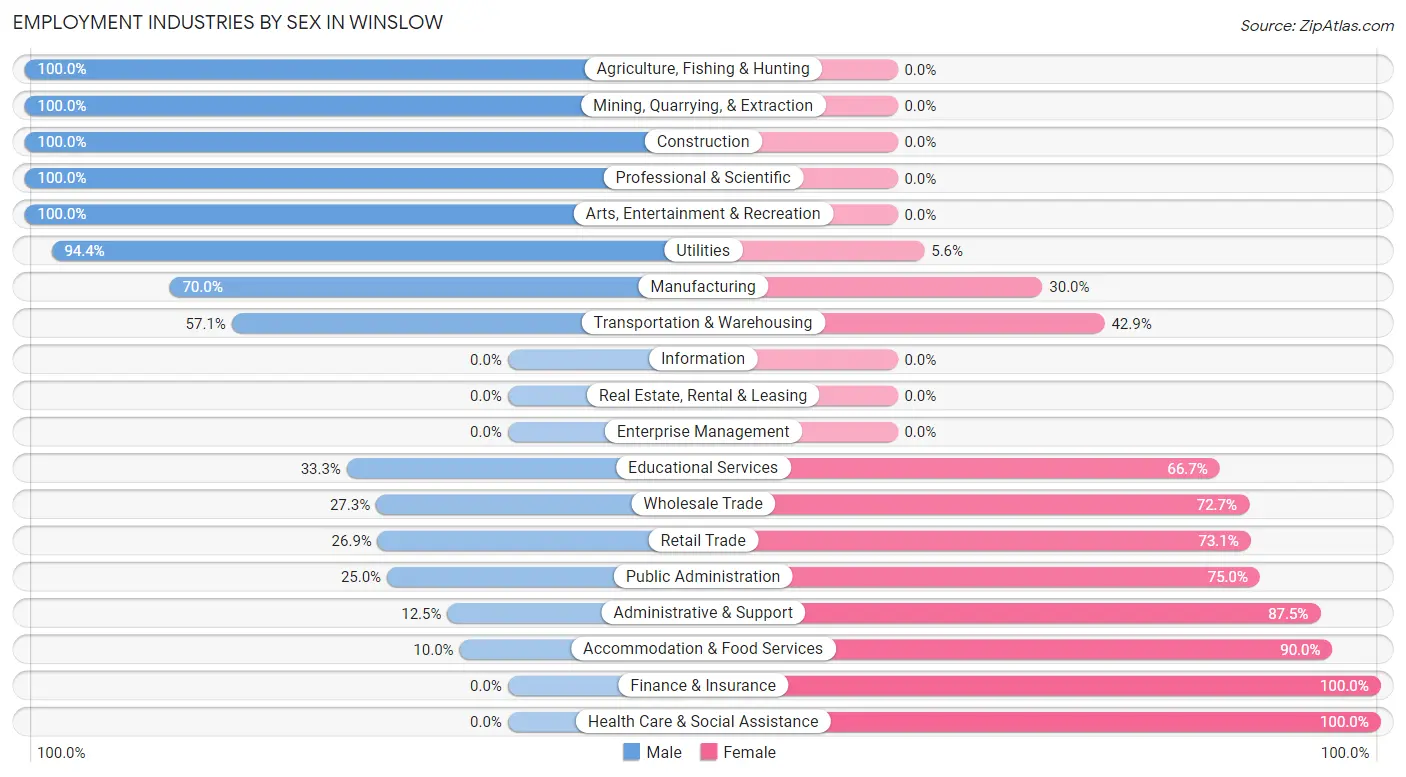
Employment Industries by Sex in Winslow
The Winslow industries that see more men than women are Agriculture, Fishing & Hunting (100.0%), Mining, Quarrying, & Extraction (100.0%), and Construction (100.0%), whereas the industries that tend to have a higher number of women are Finance & Insurance (100.0%), Health Care & Social Assistance (100.0%), and Accommodation & Food Services (90.0%).
| Industry | Male | Female |
| Agriculture, Fishing & Hunting | 9 (100.0%) | 0 (0.0%) |
| Mining, Quarrying, & Extraction | 1 (100.0%) | 0 (0.0%) |
| Construction | 14 (100.0%) | 0 (0.0%) |
| Manufacturing | 63 (70.0%) | 27 (30.0%) |
| Wholesale Trade | 3 (27.3%) | 8 (72.7%) |
| Retail Trade | 7 (26.9%) | 19 (73.1%) |
| Transportation & Warehousing | 8 (57.1%) | 6 (42.9%) |
| Utilities | 34 (94.4%) | 2 (5.6%) |
| Information | 0 (0.0%) | 0 (0.0%) |
| Finance & Insurance | 0 (0.0%) | 1 (100.0%) |
| Real Estate, Rental & Leasing | 0 (0.0%) | 0 (0.0%) |
| Professional & Scientific | 2 (100.0%) | 0 (0.0%) |
| Enterprise Management | 0 (0.0%) | 0 (0.0%) |
| Administrative & Support | 1 (12.5%) | 7 (87.5%) |
| Educational Services | 3 (33.3%) | 6 (66.7%) |
| Health Care & Social Assistance | 0 (0.0%) | 27 (100.0%) |
| Arts, Entertainment & Recreation | 10 (100.0%) | 0 (0.0%) |
| Accommodation & Food Services | 1 (10.0%) | 9 (90.0%) |
| Public Administration | 1 (25.0%) | 3 (75.0%) |
| Total | 162 (58.1%) | 117 (41.9%) |
Education in Winslow
School Enrollment in Winslow
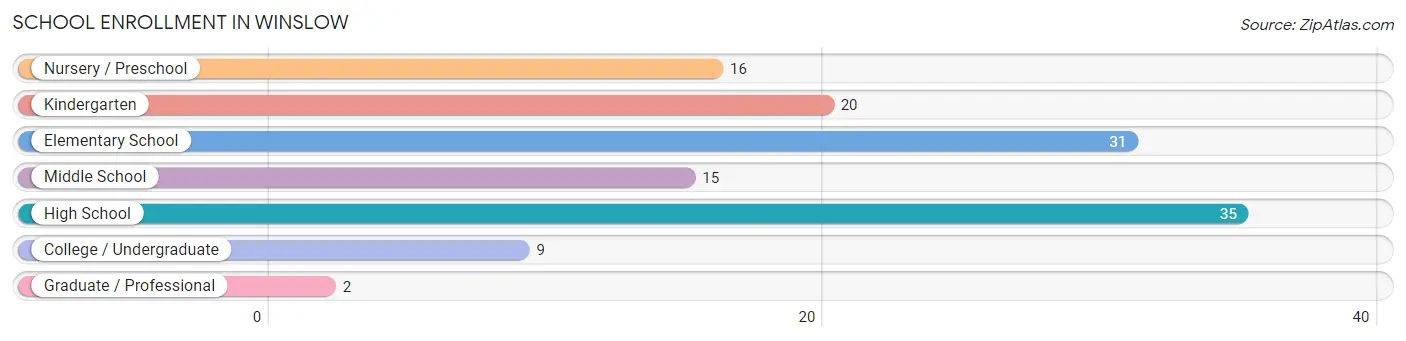
The most common levels of schooling among the 128 students in Winslow are high school (35 | 27.3%), elementary school (31 | 24.2%), and kindergarten (20 | 15.6%).
| School Level | # Students | % Students |
| Nursery / Preschool | 16 | 12.5% |
| Kindergarten | 20 | 15.6% |
| Elementary School | 31 | 24.2% |
| Middle School | 15 | 11.7% |
| High School | 35 | 27.3% |
| College / Undergraduate | 9 | 7.0% |
| Graduate / Professional | 2 | 1.6% |
| Total | 128 | 100.0% |
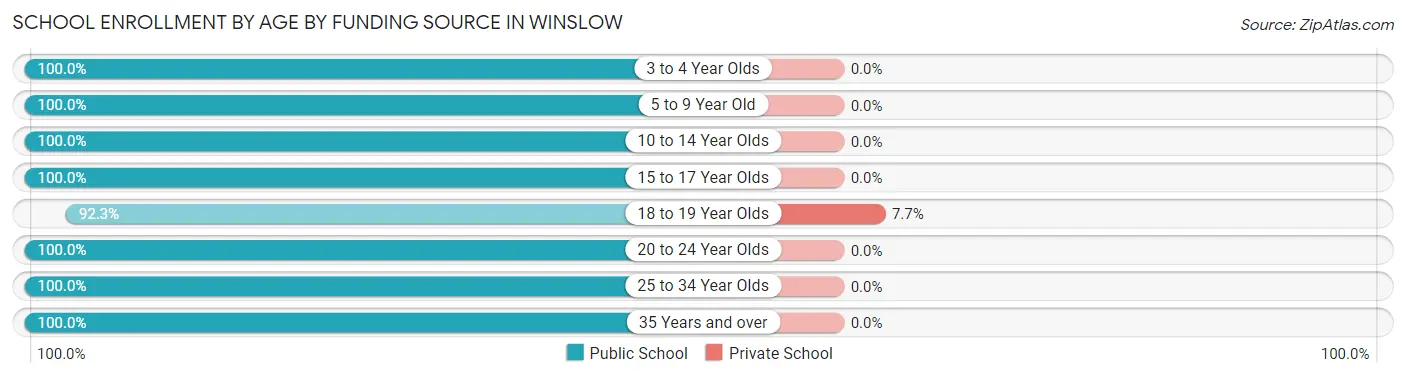
School Enrollment by Age by Funding Source in Winslow
Out of a total of 128 students who are enrolled in schools in Winslow, 1 (0.8%) attend a private institution, while the remaining 127 (99.2%) are enrolled in public schools. The age group of 18 to 19 year olds has the highest likelihood of being enrolled in private schools, with 1 (7.7% in the age bracket) enrolled. Conversely, the age group of 3 to 4 year olds has the lowest likelihood of being enrolled in a private school, with 8 (100.0% in the age bracket) attending a public institution.
| Age Bracket | Public School | Private School |
| 3 to 4 Year Olds | 8 (100.0%) | 0 (0.0%) |
| 5 to 9 Year Old | 56 (100.0%) | 0 (0.0%) |
| 10 to 14 Year Olds | 18 (100.0%) | 0 (0.0%) |
| 15 to 17 Year Olds | 23 (100.0%) | 0 (0.0%) |
| 18 to 19 Year Olds | 12 (92.3%) | 1 (7.7%) |
| 20 to 24 Year Olds | 2 (100.0%) | 0 (0.0%) |
| 25 to 34 Year Olds | 6 (100.0%) | 0 (0.0%) |
| 35 Years and over | 2 (100.0%) | 0 (0.0%) |
| Total | 127 (99.2%) | 1 (0.8%) |
Educational Attainment by Field of Study in Winslow
Arts & humanities (17 | 32.7%), business (13 | 25.0%), education (12 | 23.1%), computers & mathematics (6 | 11.5%), and communications (2 | 3.8%) are the most common fields of study among 52 individuals in Winslow who have obtained a bachelor's degree or higher.
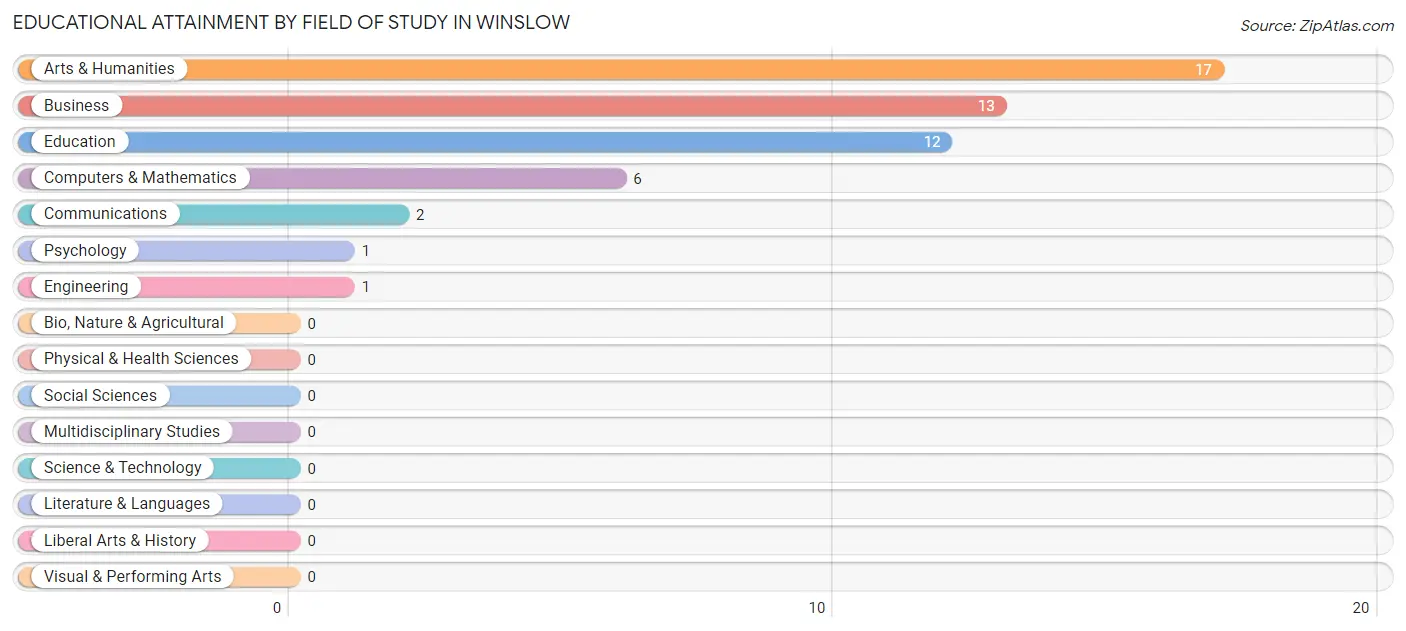
| Field of Study | # Graduates | % Graduates |
| Computers & Mathematics | 6 | 11.5% |
| Bio, Nature & Agricultural | 0 | 0.0% |
| Physical & Health Sciences | 0 | 0.0% |
| Psychology | 1 | 1.9% |
| Social Sciences | 0 | 0.0% |
| Engineering | 1 | 1.9% |
| Multidisciplinary Studies | 0 | 0.0% |
| Science & Technology | 0 | 0.0% |
| Business | 13 | 25.0% |
| Education | 12 | 23.1% |
| Literature & Languages | 0 | 0.0% |
| Liberal Arts & History | 0 | 0.0% |
| Visual & Performing Arts | 0 | 0.0% |
| Communications | 2 | 3.8% |
| Arts & Humanities | 17 | 32.7% |
| Total | 52 | 100.0% |
Transportation & Commute in Winslow
Vehicle Availability by Sex in Winslow
The most prevalent vehicle ownership categories in Winslow are males with 2 vehicles (70, accounting for 44.9%) and females with 2 vehicles (44, making up 59.8%).
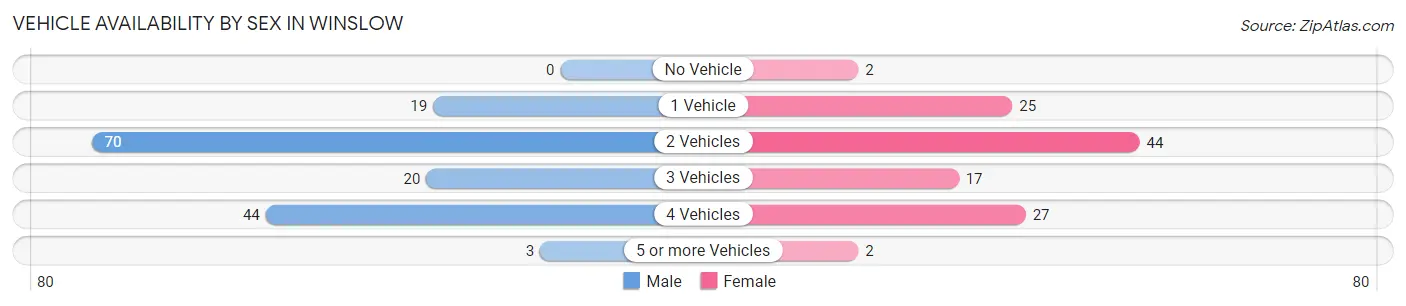
| Vehicles Available | Male | Female |
| No Vehicle | 0 (0.0%) | 2 (1.7%) |
| 1 Vehicle | 19 (12.2%) | 25 (21.4%) |
| 2 Vehicles | 70 (44.9%) | 44 (37.6%) |
| 3 Vehicles | 20 (12.8%) | 17 (14.5%) |
| 4 Vehicles | 44 (28.2%) | 27 (23.1%) |
| 5 or more Vehicles | 3 (1.9%) | 2 (1.7%) |
| Total | 156 (100.0%) | 117 (100.0%) |
Commute Time in Winslow
The most frequently occuring commute durations in Winslow are 30 to 34 minutes (53 commuters, 20.2%), 45 to 59 minutes (40 commuters, 15.2%), and 5 to 9 minutes (37 commuters, 14.1%).
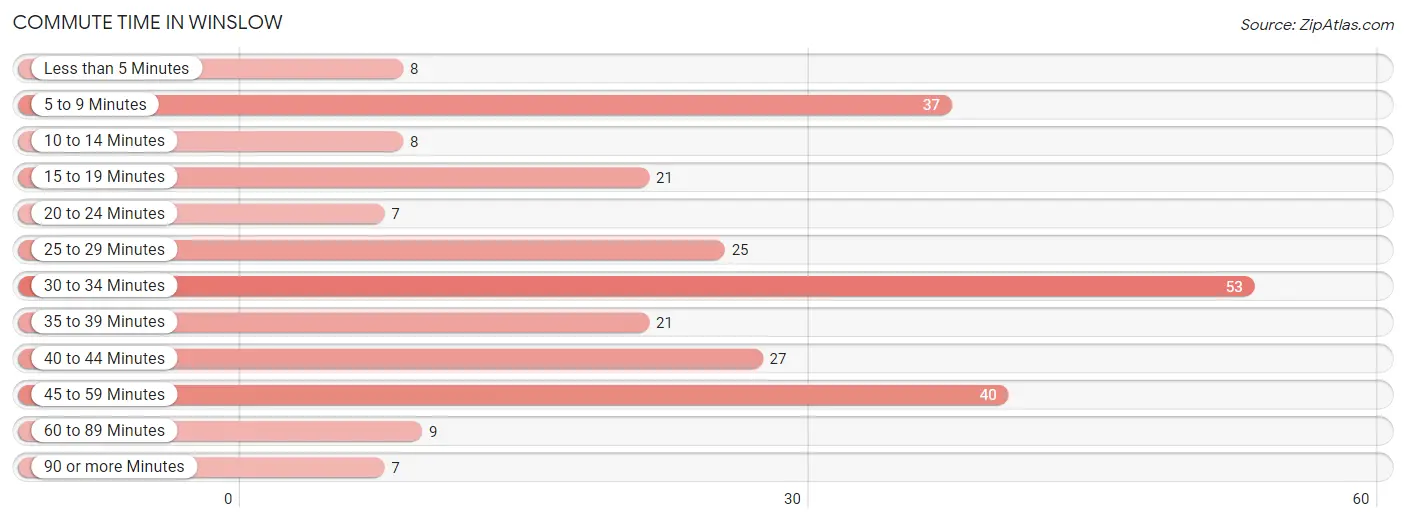
| Commute Time | # Commuters | % Commuters |
| Less than 5 Minutes | 8 | 3.0% |
| 5 to 9 Minutes | 37 | 14.1% |
| 10 to 14 Minutes | 8 | 3.0% |
| 15 to 19 Minutes | 21 | 8.0% |
| 20 to 24 Minutes | 7 | 2.7% |
| 25 to 29 Minutes | 25 | 9.5% |
| 30 to 34 Minutes | 53 | 20.2% |
| 35 to 39 Minutes | 21 | 8.0% |
| 40 to 44 Minutes | 27 | 10.3% |
| 45 to 59 Minutes | 40 | 15.2% |
| 60 to 89 Minutes | 9 | 3.4% |
| 90 or more Minutes | 7 | 2.7% |
Commute Time by Sex in Winslow
The most common commute times in Winslow are 45 to 59 minutes (36 commuters, 23.5%) for males and 5 to 9 minutes (32 commuters, 29.1%) for females.
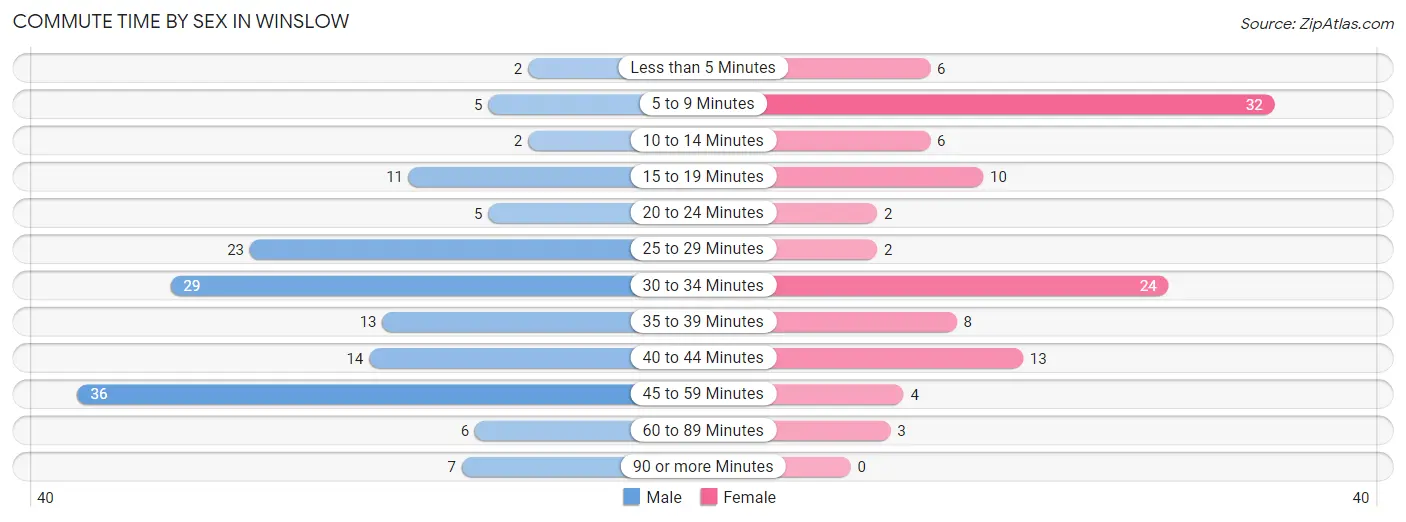
| Commute Time | Male | Female |
| Less than 5 Minutes | 2 (1.3%) | 6 (5.4%) |
| 5 to 9 Minutes | 5 (3.3%) | 32 (29.1%) |
| 10 to 14 Minutes | 2 (1.3%) | 6 (5.4%) |
| 15 to 19 Minutes | 11 (7.2%) | 10 (9.1%) |
| 20 to 24 Minutes | 5 (3.3%) | 2 (1.8%) |
| 25 to 29 Minutes | 23 (15.0%) | 2 (1.8%) |
| 30 to 34 Minutes | 29 (19.0%) | 24 (21.8%) |
| 35 to 39 Minutes | 13 (8.5%) | 8 (7.3%) |
| 40 to 44 Minutes | 14 (9.1%) | 13 (11.8%) |
| 45 to 59 Minutes | 36 (23.5%) | 4 (3.6%) |
| 60 to 89 Minutes | 6 (3.9%) | 3 (2.7%) |
| 90 or more Minutes | 7 (4.6%) | 0 (0.0%) |
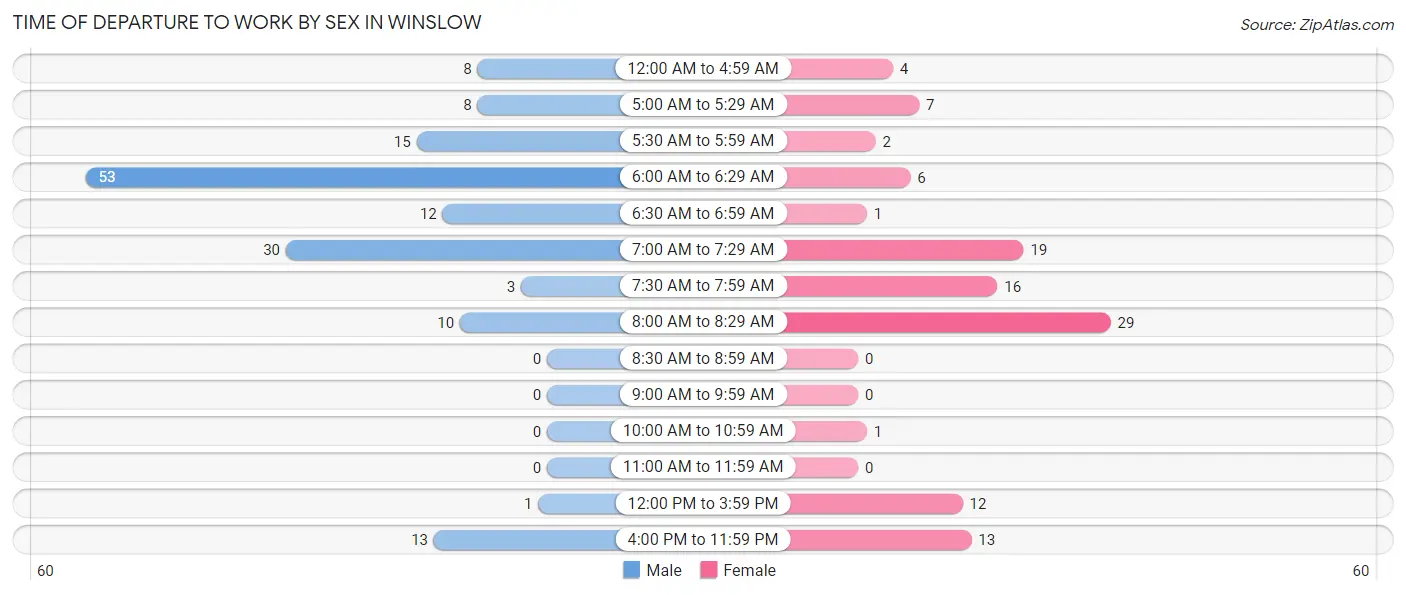
Time of Departure to Work by Sex in Winslow
The most frequent times of departure to work in Winslow are 6:00 AM to 6:29 AM (53, 34.6%) for males and 8:00 AM to 8:29 AM (29, 26.4%) for females.
| Time of Departure | Male | Female |
| 12:00 AM to 4:59 AM | 8 (5.2%) | 4 (3.6%) |
| 5:00 AM to 5:29 AM | 8 (5.2%) | 7 (6.4%) |
| 5:30 AM to 5:59 AM | 15 (9.8%) | 2 (1.8%) |
| 6:00 AM to 6:29 AM | 53 (34.6%) | 6 (5.4%) |
| 6:30 AM to 6:59 AM | 12 (7.8%) | 1 (0.9%) |
| 7:00 AM to 7:29 AM | 30 (19.6%) | 19 (17.3%) |
| 7:30 AM to 7:59 AM | 3 (2.0%) | 16 (14.5%) |
| 8:00 AM to 8:29 AM | 10 (6.5%) | 29 (26.4%) |
| 8:30 AM to 8:59 AM | 0 (0.0%) | 0 (0.0%) |
| 9:00 AM to 9:59 AM | 0 (0.0%) | 0 (0.0%) |
| 10:00 AM to 10:59 AM | 0 (0.0%) | 1 (0.9%) |
| 11:00 AM to 11:59 AM | 0 (0.0%) | 0 (0.0%) |
| 12:00 PM to 3:59 PM | 1 (0.6%) | 12 (10.9%) |
| 4:00 PM to 11:59 PM | 13 (8.5%) | 13 (11.8%) |
| Total | 153 (100.0%) | 110 (100.0%) |
Housing Occupancy in Winslow
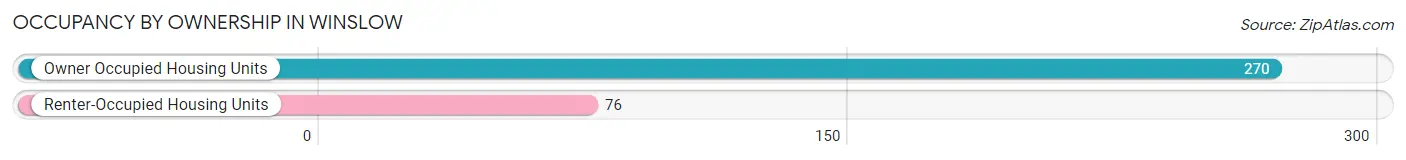
Occupancy by Ownership in Winslow
Of the total 346 dwellings in Winslow, owner-occupied units account for 270 (78.0%), while renter-occupied units make up 76 (22.0%).
| Occupancy | # Housing Units | % Housing Units |
| Owner Occupied Housing Units | 270 | 78.0% |
| Renter-Occupied Housing Units | 76 | 22.0% |
| Total Occupied Housing Units | 346 | 100.0% |
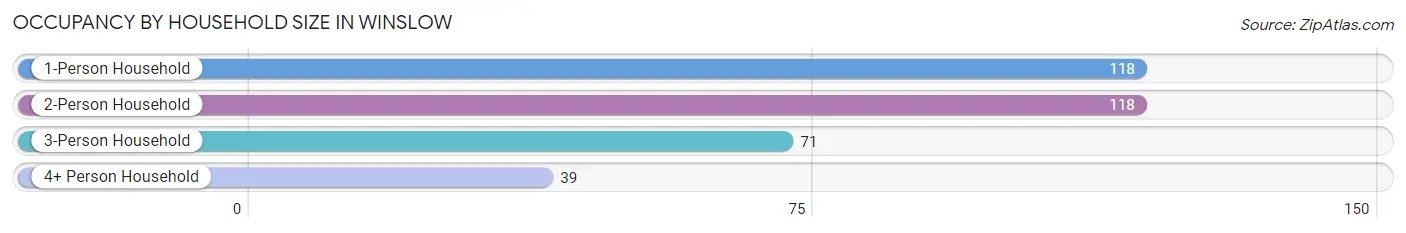
Occupancy by Household Size in Winslow
| Household Size | # Housing Units | % Housing Units |
| 1-Person Household | 118 | 34.1% |
| 2-Person Household | 118 | 34.1% |
| 3-Person Household | 71 | 20.5% |
| 4+ Person Household | 39 | 11.3% |
| Total Housing Units | 346 | 100.0% |
Occupancy by Ownership by Household Size in Winslow
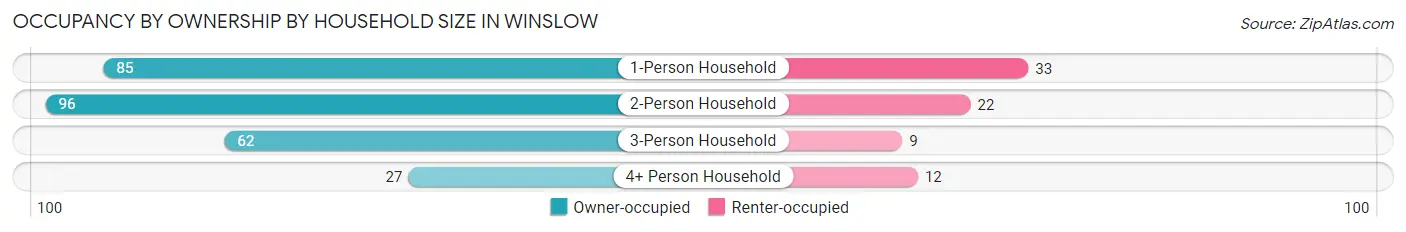
| Household Size | Owner-occupied | Renter-occupied |
| 1-Person Household | 85 (72.0%) | 33 (28.0%) |
| 2-Person Household | 96 (81.4%) | 22 (18.6%) |
| 3-Person Household | 62 (87.3%) | 9 (12.7%) |
| 4+ Person Household | 27 (69.2%) | 12 (30.8%) |
| Total Housing Units | 270 (78.0%) | 76 (22.0%) |
Occupancy by Educational Attainment in Winslow
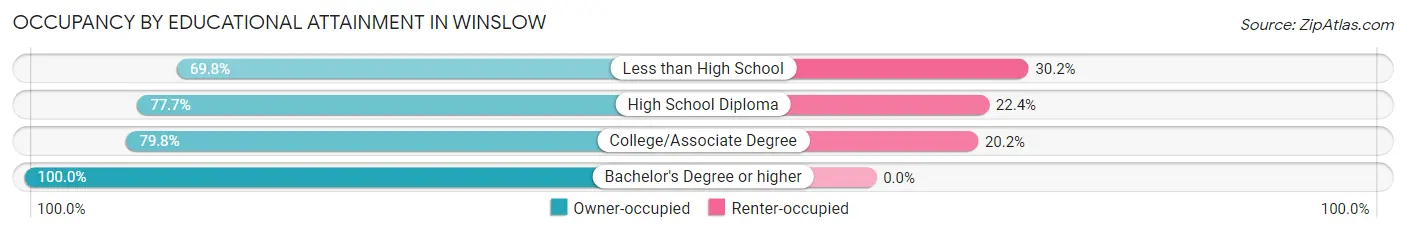
| Household Size | Owner-occupied | Renter-occupied |
| Less than High School | 37 (69.8%) | 16 (30.2%) |
| High School Diploma | 132 (77.6%) | 38 (22.4%) |
| College/Associate Degree | 87 (79.8%) | 22 (20.2%) |
| Bachelor's Degree or higher | 14 (100.0%) | 0 (0.0%) |
Occupancy by Age of Householder in Winslow
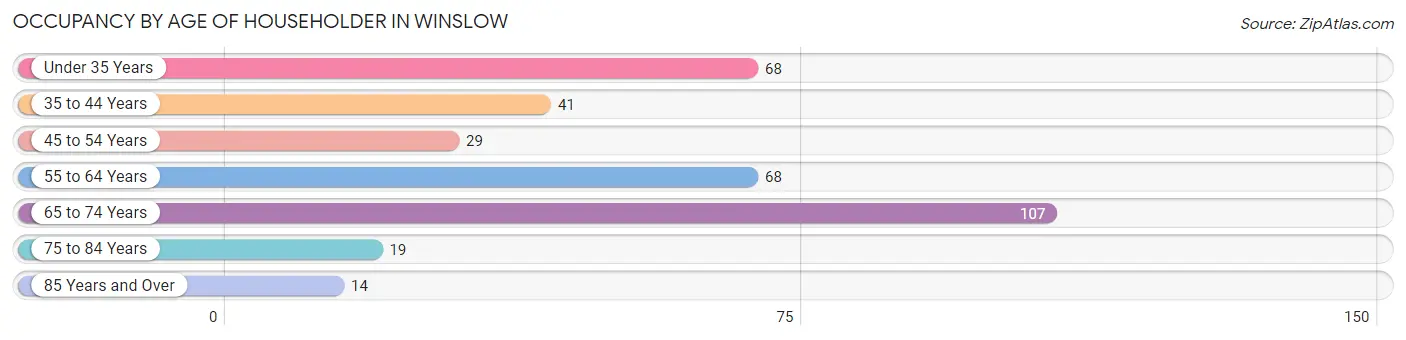
| Age Bracket | # Households | % Households |
| Under 35 Years | 68 | 19.7% |
| 35 to 44 Years | 41 | 11.8% |
| 45 to 54 Years | 29 | 8.4% |
| 55 to 64 Years | 68 | 19.7% |
| 65 to 74 Years | 107 | 30.9% |
| 75 to 84 Years | 19 | 5.5% |
| 85 Years and Over | 14 | 4.1% |
| Total | 346 | 100.0% |
Housing Finances in Winslow
Median Income by Occupancy in Winslow
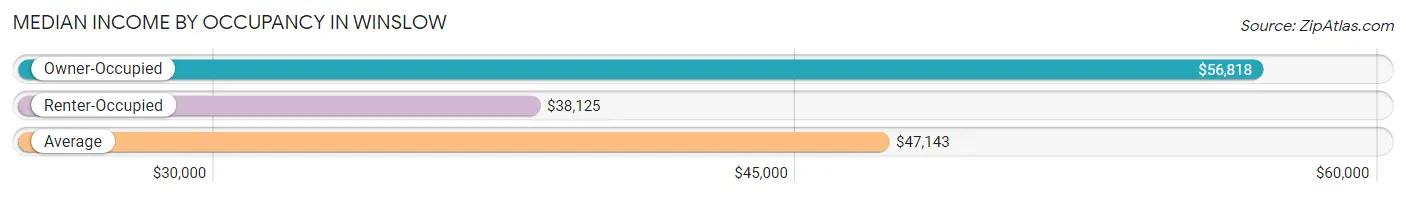
| Occupancy Type | # Households | Median Income |
| Owner-Occupied | 270 (78.0%) | $56,818 |
| Renter-Occupied | 76 (22.0%) | $38,125 |
| Average | 346 (100.0%) | $47,143 |
Occupancy by Householder Income Bracket in Winslow
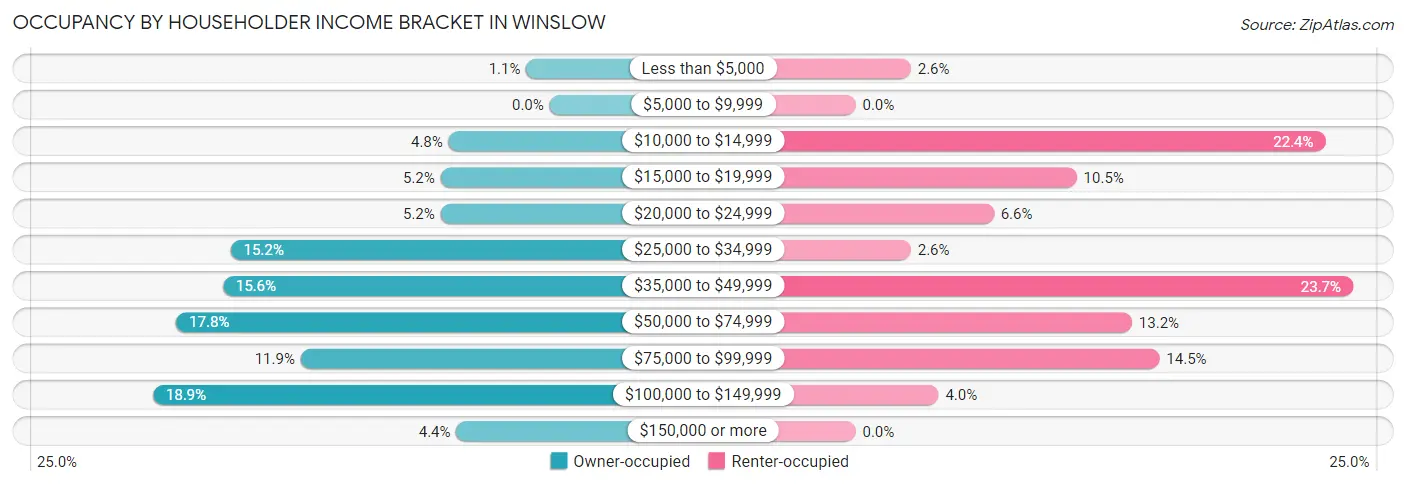
| Income Bracket | Owner-occupied | Renter-occupied |
| Less than $5,000 | 3 (1.1%) | 2 (2.6%) |
| $5,000 to $9,999 | 0 (0.0%) | 0 (0.0%) |
| $10,000 to $14,999 | 13 (4.8%) | 17 (22.4%) |
| $15,000 to $19,999 | 14 (5.2%) | 8 (10.5%) |
| $20,000 to $24,999 | 14 (5.2%) | 5 (6.6%) |
| $25,000 to $34,999 | 41 (15.2%) | 2 (2.6%) |
| $35,000 to $49,999 | 42 (15.6%) | 18 (23.7%) |
| $50,000 to $74,999 | 48 (17.8%) | 10 (13.2%) |
| $75,000 to $99,999 | 32 (11.8%) | 11 (14.5%) |
| $100,000 to $149,999 | 51 (18.9%) | 3 (4.0%) |
| $150,000 or more | 12 (4.4%) | 0 (0.0%) |
| Total | 270 (100.0%) | 76 (100.0%) |
Monthly Housing Cost Tiers in Winslow
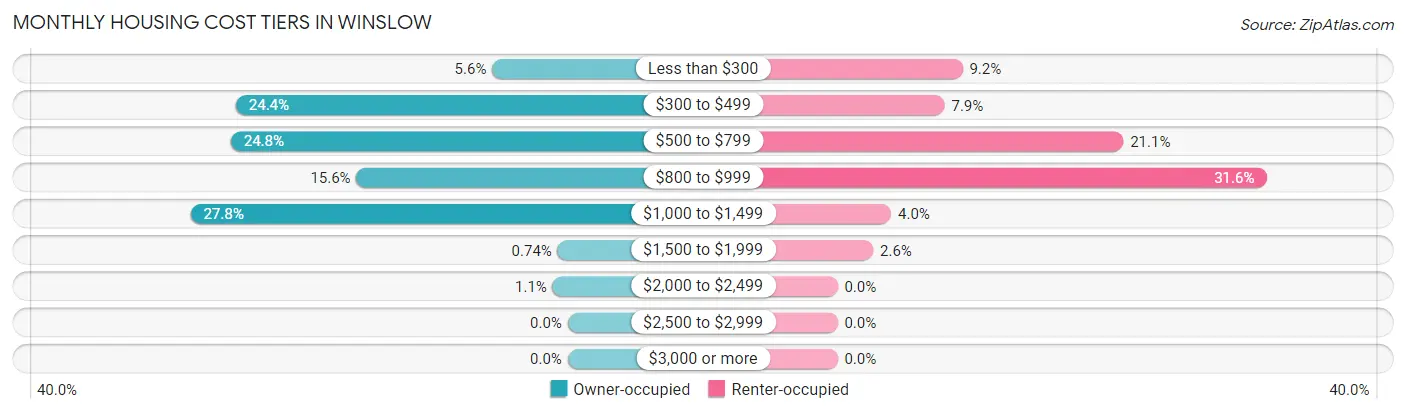
| Monthly Cost | Owner-occupied | Renter-occupied |
| Less than $300 | 15 (5.6%) | 7 (9.2%) |
| $300 to $499 | 66 (24.4%) | 6 (7.9%) |
| $500 to $799 | 67 (24.8%) | 16 (21.0%) |
| $800 to $999 | 42 (15.6%) | 24 (31.6%) |
| $1,000 to $1,499 | 75 (27.8%) | 3 (4.0%) |
| $1,500 to $1,999 | 2 (0.7%) | 2 (2.6%) |
| $2,000 to $2,499 | 3 (1.1%) | 0 (0.0%) |
| $2,500 to $2,999 | 0 (0.0%) | 0 (0.0%) |
| $3,000 or more | 0 (0.0%) | 0 (0.0%) |
| Total | 270 (100.0%) | 76 (100.0%) |
Physical Housing Characteristics in Winslow
Housing Structures in Winslow
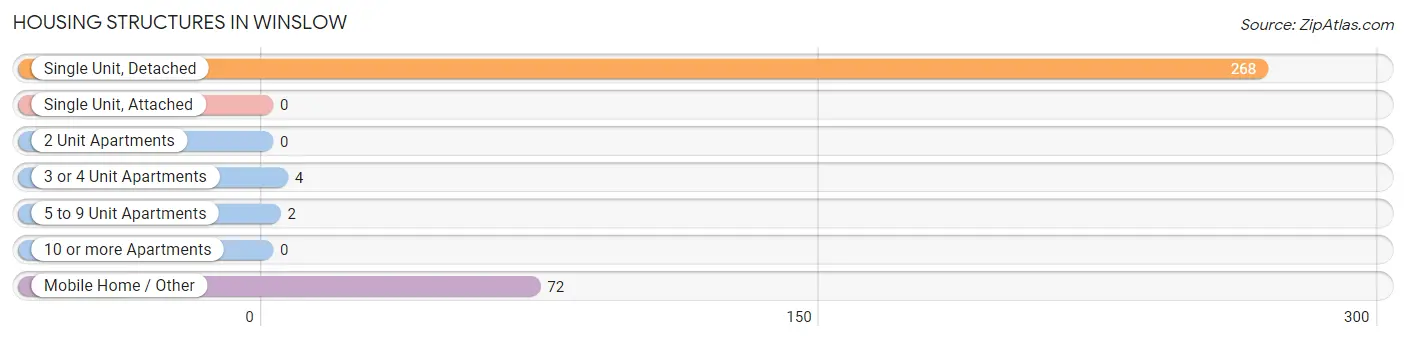
| Structure Type | # Housing Units | % Housing Units |
| Single Unit, Detached | 268 | 77.5% |
| Single Unit, Attached | 0 | 0.0% |
| 2 Unit Apartments | 0 | 0.0% |
| 3 or 4 Unit Apartments | 4 | 1.2% |
| 5 to 9 Unit Apartments | 2 | 0.6% |
| 10 or more Apartments | 0 | 0.0% |
| Mobile Home / Other | 72 | 20.8% |
| Total | 346 | 100.0% |
Housing Structures by Occupancy in Winslow
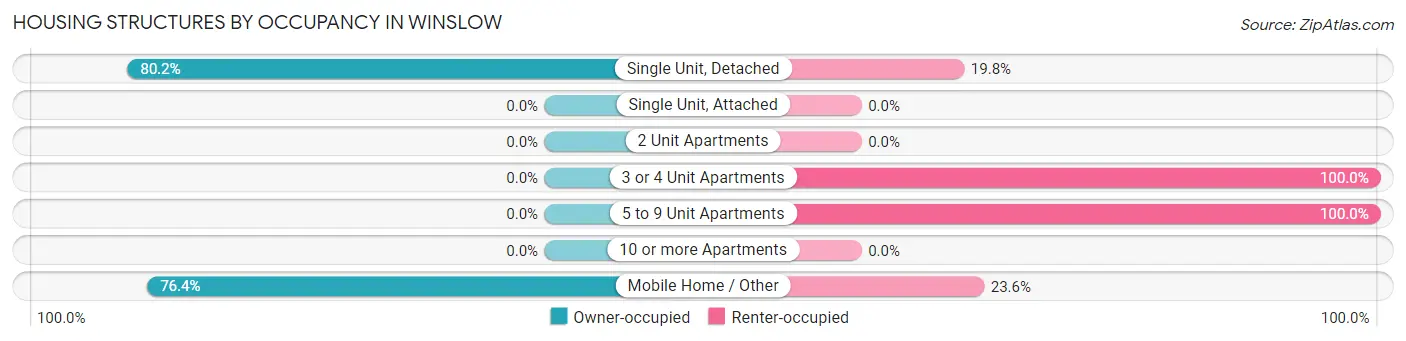
| Structure Type | Owner-occupied | Renter-occupied |
| Single Unit, Detached | 215 (80.2%) | 53 (19.8%) |
| Single Unit, Attached | 0 (0.0%) | 0 (0.0%) |
| 2 Unit Apartments | 0 (0.0%) | 0 (0.0%) |
| 3 or 4 Unit Apartments | 0 (0.0%) | 4 (100.0%) |
| 5 to 9 Unit Apartments | 0 (0.0%) | 2 (100.0%) |
| 10 or more Apartments | 0 (0.0%) | 0 (0.0%) |
| Mobile Home / Other | 55 (76.4%) | 17 (23.6%) |
| Total | 270 (78.0%) | 76 (22.0%) |
Housing Structures by Number of Rooms in Winslow
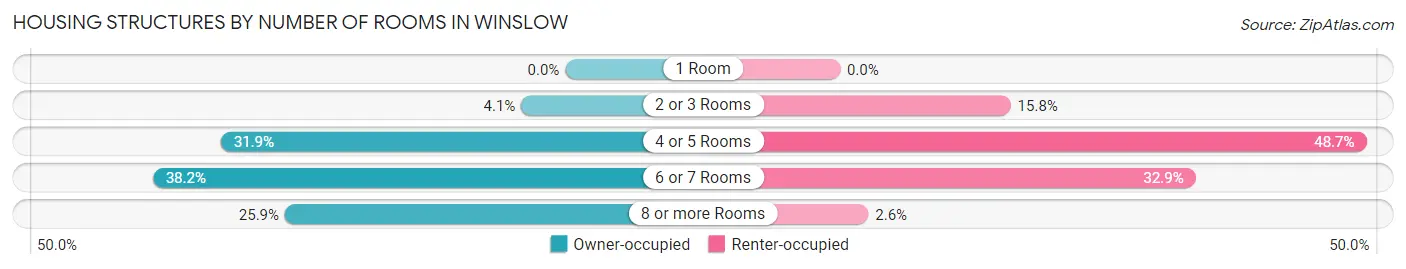
| Number of Rooms | Owner-occupied | Renter-occupied |
| 1 Room | 0 (0.0%) | 0 (0.0%) |
| 2 or 3 Rooms | 11 (4.1%) | 12 (15.8%) |
| 4 or 5 Rooms | 86 (31.9%) | 37 (48.7%) |
| 6 or 7 Rooms | 103 (38.2%) | 25 (32.9%) |
| 8 or more Rooms | 70 (25.9%) | 2 (2.6%) |
| Total | 270 (100.0%) | 76 (100.0%) |
Housing Structure by Heating Type in Winslow
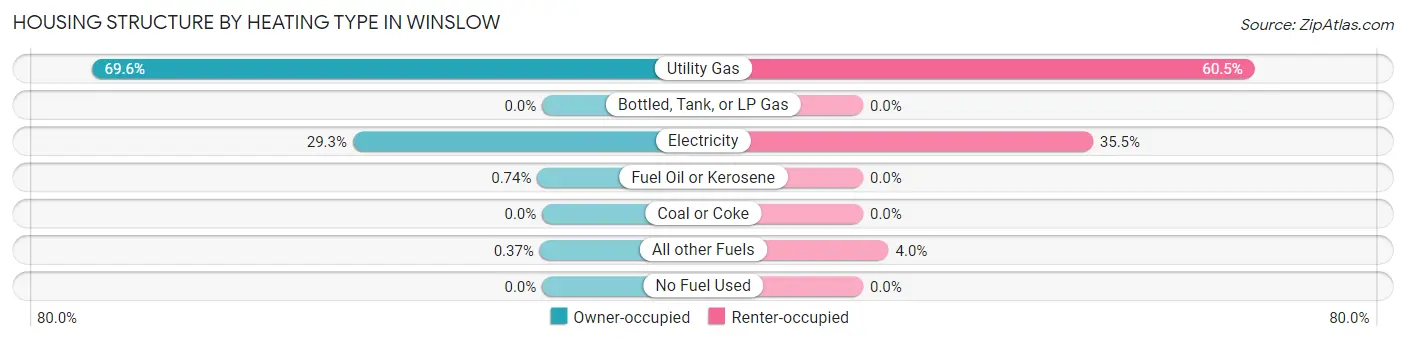
| Heating Type | Owner-occupied | Renter-occupied |
| Utility Gas | 188 (69.6%) | 46 (60.5%) |
| Bottled, Tank, or LP Gas | 0 (0.0%) | 0 (0.0%) |
| Electricity | 79 (29.3%) | 27 (35.5%) |
| Fuel Oil or Kerosene | 2 (0.7%) | 0 (0.0%) |
| Coal or Coke | 0 (0.0%) | 0 (0.0%) |
| All other Fuels | 1 (0.4%) | 3 (4.0%) |
| No Fuel Used | 0 (0.0%) | 0 (0.0%) |
| Total | 270 (100.0%) | 76 (100.0%) |
Household Vehicle Usage in Winslow
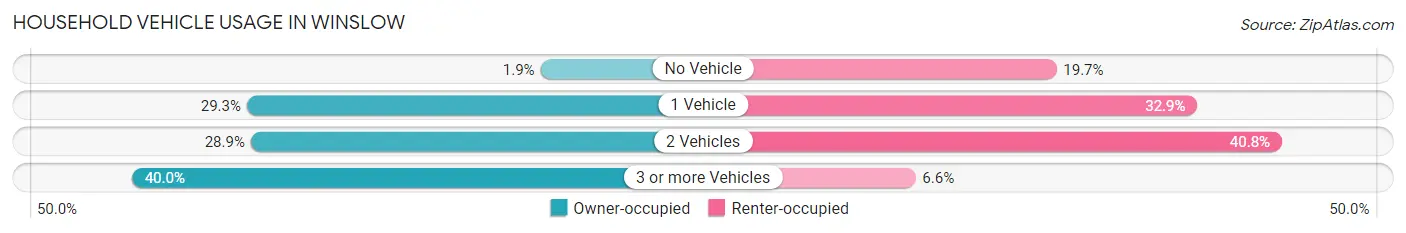
| Vehicles per Household | Owner-occupied | Renter-occupied |
| No Vehicle | 5 (1.8%) | 15 (19.7%) |
| 1 Vehicle | 79 (29.3%) | 25 (32.9%) |
| 2 Vehicles | 78 (28.9%) | 31 (40.8%) |
| 3 or more Vehicles | 108 (40.0%) | 5 (6.6%) |
| Total | 270 (100.0%) | 76 (100.0%) |
Real Estate & Mortgages in Winslow
Real Estate and Mortgage Overview in Winslow
| Characteristic | Without Mortgage | With Mortgage |
| Housing Units | 135 | 135 |
| Median Property Value | $43,900 | $92,700 |
| Median Household Income | $34,375 | $12 |
| Monthly Housing Costs | $485 | $0 |
| Real Estate Taxes | $431 | $30 |
Property Value by Mortgage Status in Winslow
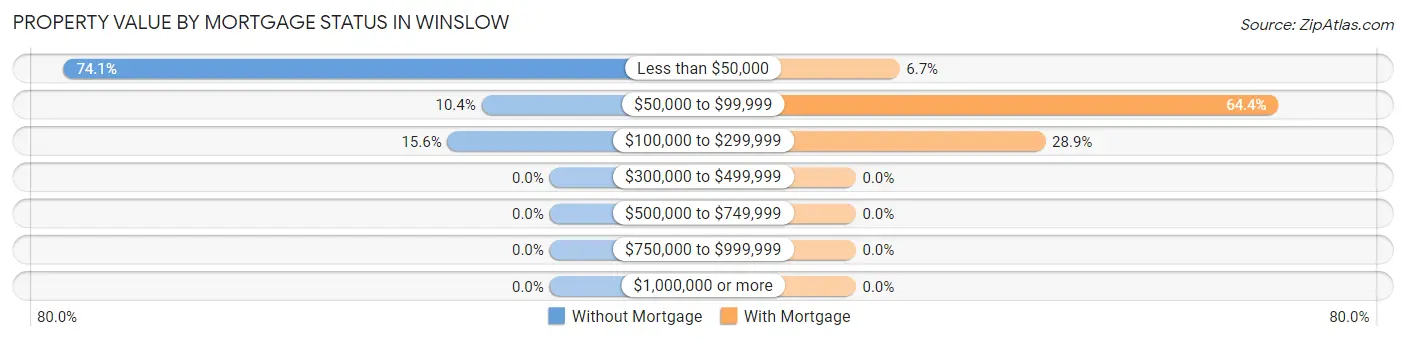
| Property Value | Without Mortgage | With Mortgage |
| Less than $50,000 | 100 (74.1%) | 9 (6.7%) |
| $50,000 to $99,999 | 14 (10.4%) | 87 (64.4%) |
| $100,000 to $299,999 | 21 (15.6%) | 39 (28.9%) |
| $300,000 to $499,999 | 0 (0.0%) | 0 (0.0%) |
| $500,000 to $749,999 | 0 (0.0%) | 0 (0.0%) |
| $750,000 to $999,999 | 0 (0.0%) | 0 (0.0%) |
| $1,000,000 or more | 0 (0.0%) | 0 (0.0%) |
| Total | 135 (100.0%) | 135 (100.0%) |
Household Income by Mortgage Status in Winslow
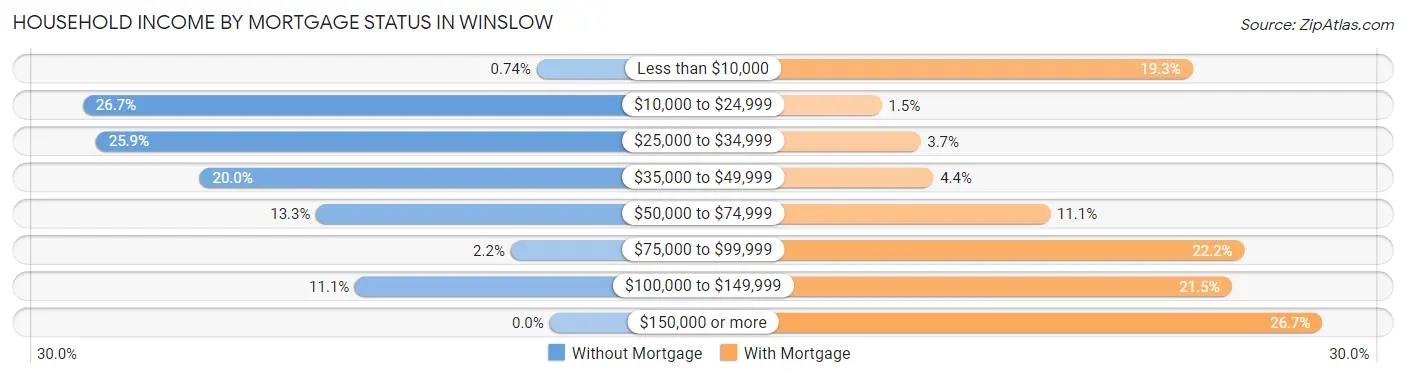
| Household Income | Without Mortgage | With Mortgage |
| Less than $10,000 | 1 (0.7%) | 26 (19.3%) |
| $10,000 to $24,999 | 36 (26.7%) | 2 (1.5%) |
| $25,000 to $34,999 | 35 (25.9%) | 5 (3.7%) |
| $35,000 to $49,999 | 27 (20.0%) | 6 (4.4%) |
| $50,000 to $74,999 | 18 (13.3%) | 15 (11.1%) |
| $75,000 to $99,999 | 3 (2.2%) | 30 (22.2%) |
| $100,000 to $149,999 | 15 (11.1%) | 29 (21.5%) |
| $150,000 or more | 0 (0.0%) | 36 (26.7%) |
| Total | 135 (100.0%) | 135 (100.0%) |
Property Value to Household Income Ratio in Winslow
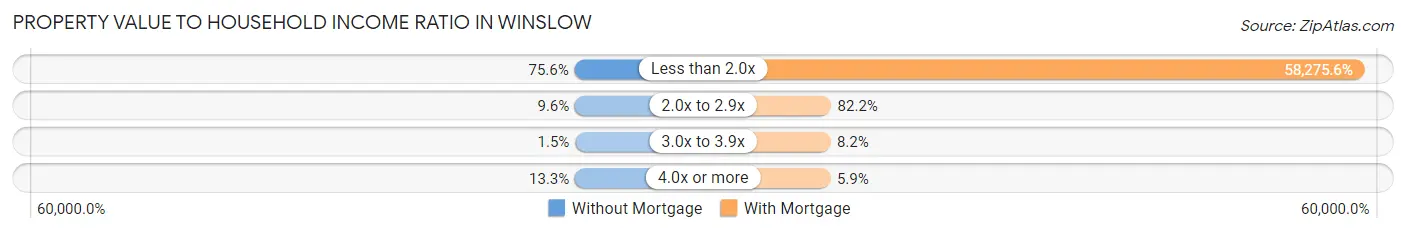
| Value-to-Income Ratio | Without Mortgage | With Mortgage |
| Less than 2.0x | 102 (75.6%) | 78,672 (58,275.6%) |
| 2.0x to 2.9x | 13 (9.6%) | 111 (82.2%) |
| 3.0x to 3.9x | 2 (1.5%) | 11 (8.2%) |
| 4.0x or more | 18 (13.3%) | 8 (5.9%) |
| Total | 135 (100.0%) | 135 (100.0%) |
Real Estate Taxes by Mortgage Status in Winslow
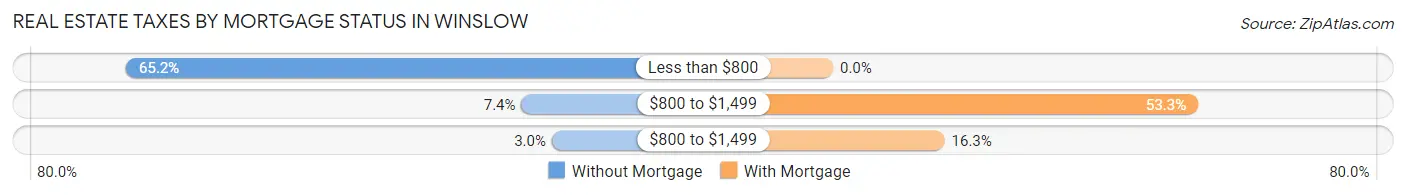
| Property Taxes | Without Mortgage | With Mortgage |
| Less than $800 | 88 (65.2%) | 0 (0.0%) |
| $800 to $1,499 | 10 (7.4%) | 72 (53.3%) |
| $800 to $1,499 | 4 (3.0%) | 22 (16.3%) |
| Total | 135 (100.0%) | 135 (100.0%) |
Health & Disability in Winslow
Health Insurance Coverage by Age in Winslow
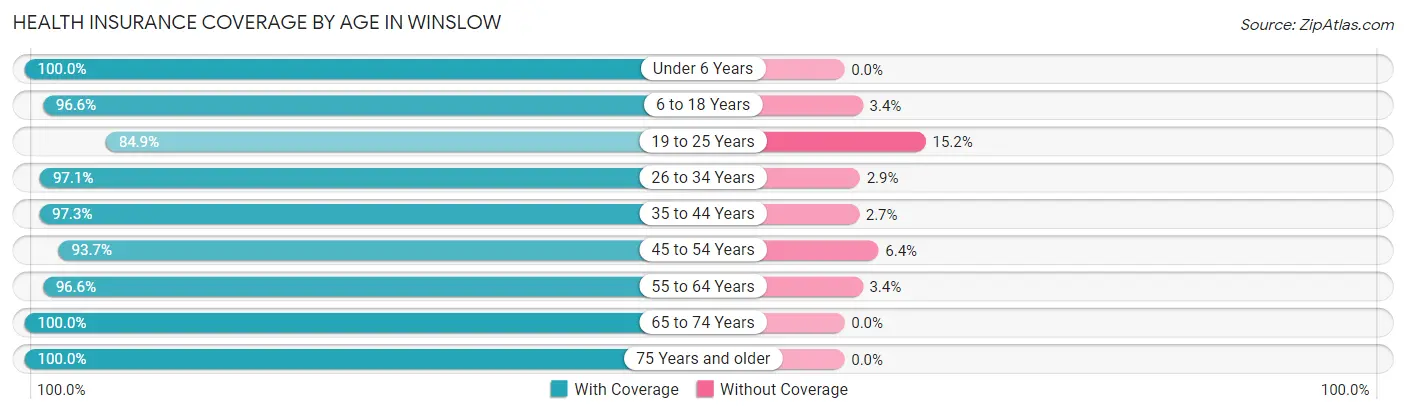
| Age Bracket | With Coverage | Without Coverage |
| Under 6 Years | 35 (100.0%) | 0 (0.0%) |
| 6 to 18 Years | 85 (96.6%) | 3 (3.4%) |
| 19 to 25 Years | 56 (84.9%) | 10 (15.1%) |
| 26 to 34 Years | 101 (97.1%) | 3 (2.9%) |
| 35 to 44 Years | 72 (97.3%) | 2 (2.7%) |
| 45 to 54 Years | 59 (93.6%) | 4 (6.4%) |
| 55 to 64 Years | 114 (96.6%) | 4 (3.4%) |
| 65 to 74 Years | 144 (100.0%) | 0 (0.0%) |
| 75 Years and older | 37 (100.0%) | 0 (0.0%) |
| Total | 703 (96.4%) | 26 (3.6%) |
Health Insurance Coverage by Citizenship Status in Winslow
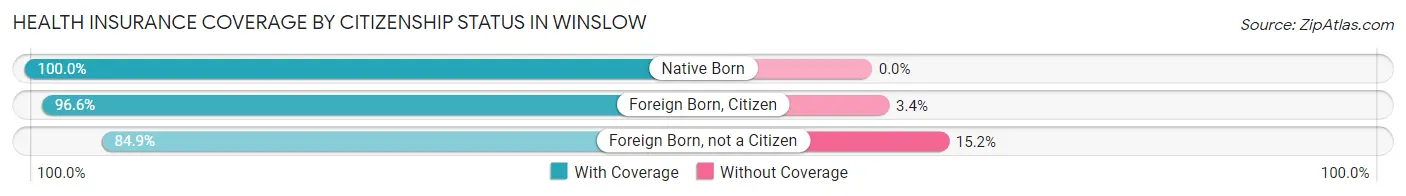
| Citizenship Status | With Coverage | Without Coverage |
| Native Born | 35 (100.0%) | 0 (0.0%) |
| Foreign Born, Citizen | 85 (96.6%) | 3 (3.4%) |
| Foreign Born, not a Citizen | 56 (84.9%) | 10 (15.1%) |
Health Insurance Coverage by Household Income in Winslow
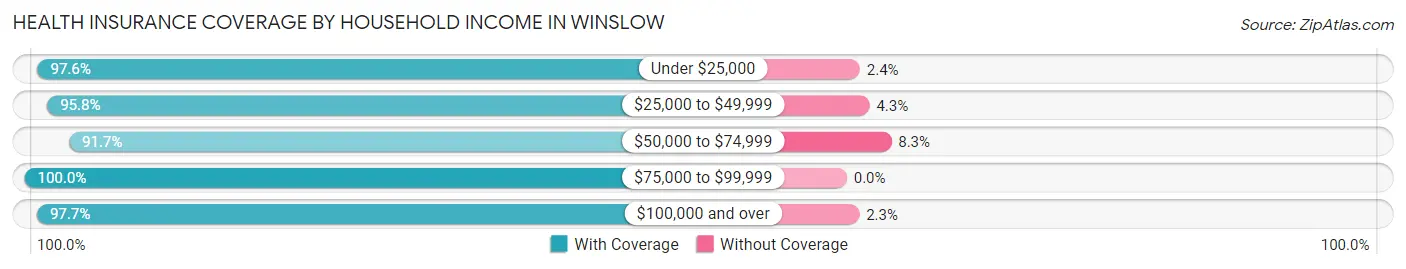
| Household Income | With Coverage | Without Coverage |
| Under $25,000 | 120 (97.6%) | 3 (2.4%) |
| $25,000 to $49,999 | 203 (95.8%) | 9 (4.3%) |
| $50,000 to $74,999 | 110 (91.7%) | 10 (8.3%) |
| $75,000 to $99,999 | 95 (100.0%) | 0 (0.0%) |
| $100,000 and over | 168 (97.7%) | 4 (2.3%) |
Public vs Private Health Insurance Coverage by Age in Winslow
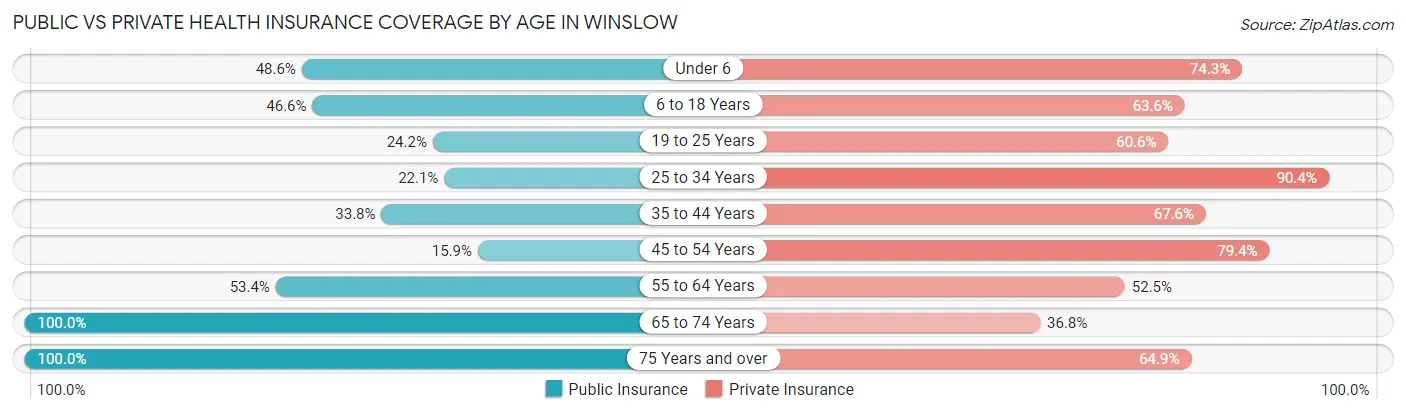
| Age Bracket | Public Insurance | Private Insurance |
| Under 6 | 17 (48.6%) | 26 (74.3%) |
| 6 to 18 Years | 41 (46.6%) | 56 (63.6%) |
| 19 to 25 Years | 16 (24.2%) | 40 (60.6%) |
| 25 to 34 Years | 23 (22.1%) | 94 (90.4%) |
| 35 to 44 Years | 25 (33.8%) | 50 (67.6%) |
| 45 to 54 Years | 10 (15.9%) | 50 (79.4%) |
| 55 to 64 Years | 63 (53.4%) | 62 (52.5%) |
| 65 to 74 Years | 144 (100.0%) | 53 (36.8%) |
| 75 Years and over | 37 (100.0%) | 24 (64.9%) |
| Total | 376 (51.6%) | 455 (62.4%) |
Disability Status by Sex by Age in Winslow
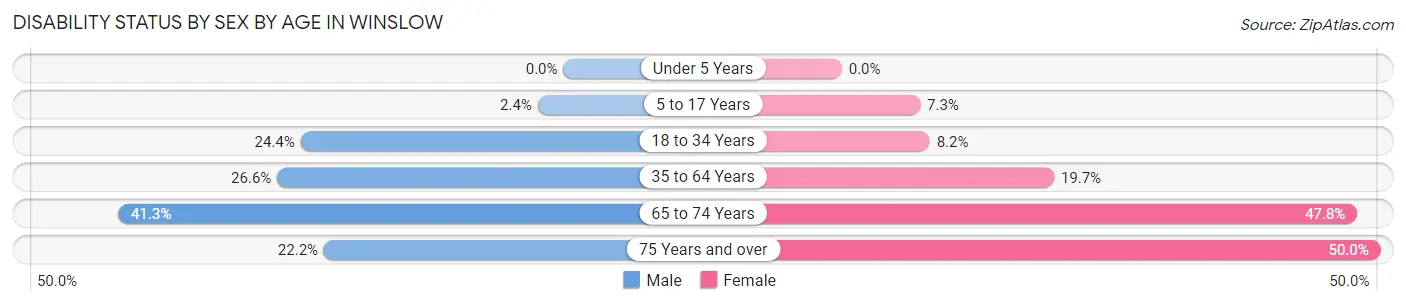
| Age Bracket | Male | Female |
| Under 5 Years | 0 (0.0%) | 0 (0.0%) |
| 5 to 17 Years | 1 (2.4%) | 4 (7.3%) |
| 18 to 34 Years | 30 (24.4%) | 4 (8.2%) |
| 35 to 64 Years | 34 (26.6%) | 25 (19.7%) |
| 65 to 74 Years | 31 (41.3%) | 33 (47.8%) |
| 75 Years and over | 2 (22.2%) | 14 (50.0%) |
Disability Class by Sex by Age in Winslow
Disability Class: Hearing Difficulty
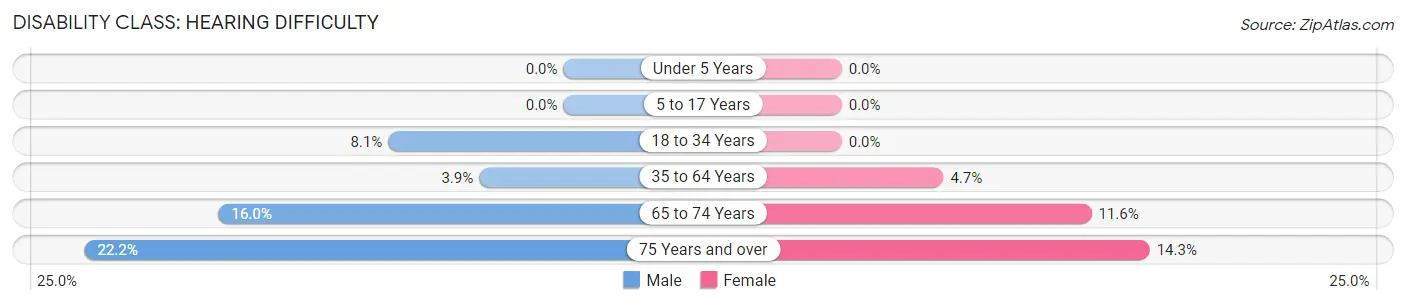
| Age Bracket | Male | Female |
| Under 5 Years | 0 (0.0%) | 0 (0.0%) |
| 5 to 17 Years | 0 (0.0%) | 0 (0.0%) |
| 18 to 34 Years | 10 (8.1%) | 0 (0.0%) |
| 35 to 64 Years | 5 (3.9%) | 6 (4.7%) |
| 65 to 74 Years | 12 (16.0%) | 8 (11.6%) |
| 75 Years and over | 2 (22.2%) | 4 (14.3%) |
Disability Class: Vision Difficulty
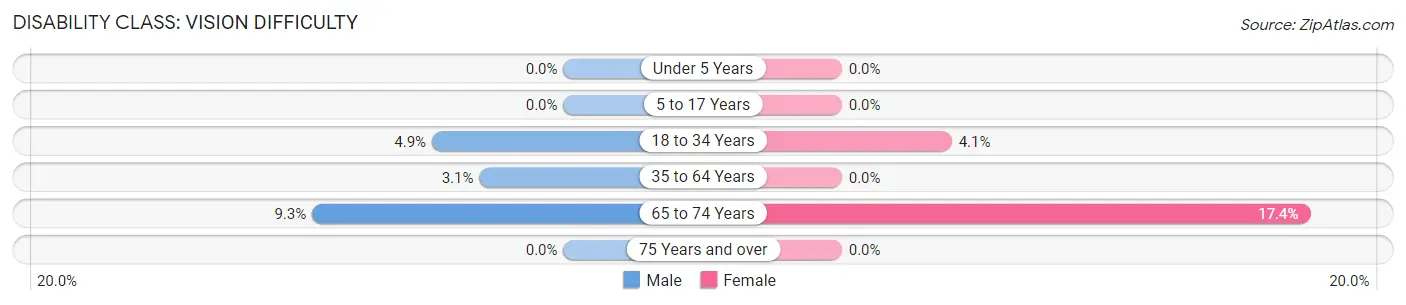
| Age Bracket | Male | Female |
| Under 5 Years | 0 (0.0%) | 0 (0.0%) |
| 5 to 17 Years | 0 (0.0%) | 0 (0.0%) |
| 18 to 34 Years | 6 (4.9%) | 2 (4.1%) |
| 35 to 64 Years | 4 (3.1%) | 0 (0.0%) |
| 65 to 74 Years | 7 (9.3%) | 12 (17.4%) |
| 75 Years and over | 0 (0.0%) | 0 (0.0%) |
Disability Class: Cognitive Difficulty
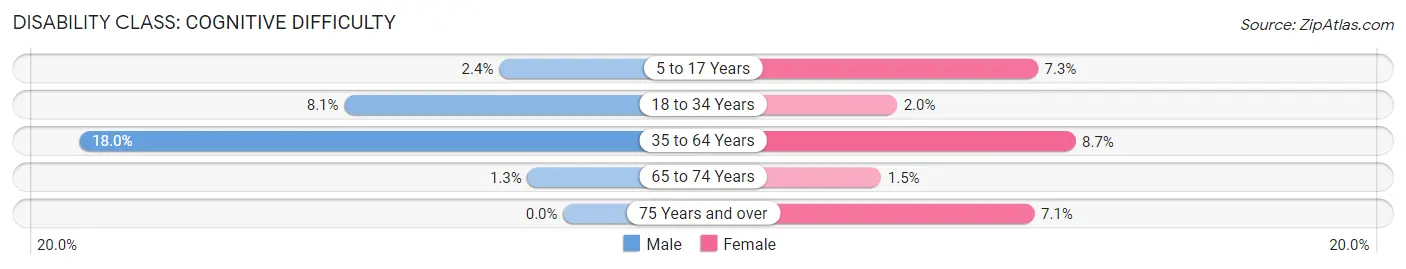
| Age Bracket | Male | Female |
| 5 to 17 Years | 1 (2.4%) | 4 (7.3%) |
| 18 to 34 Years | 10 (8.1%) | 1 (2.0%) |
| 35 to 64 Years | 23 (18.0%) | 11 (8.7%) |
| 65 to 74 Years | 1 (1.3%) | 1 (1.5%) |
| 75 Years and over | 0 (0.0%) | 2 (7.1%) |
Disability Class: Ambulatory Difficulty
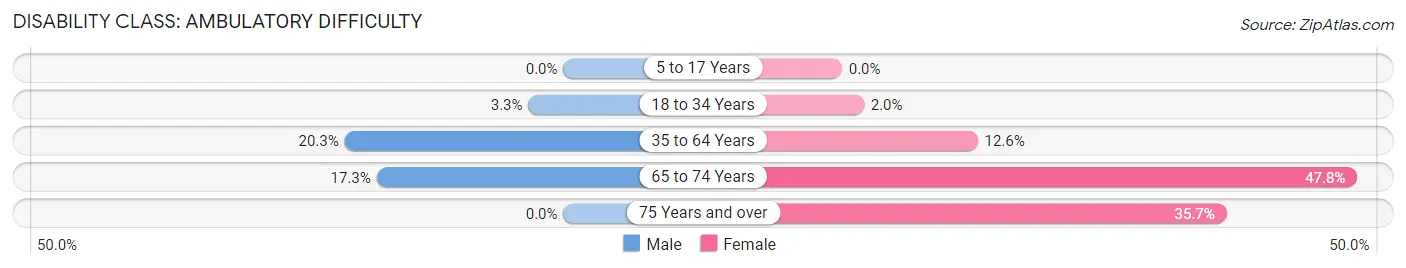
| Age Bracket | Male | Female |
| 5 to 17 Years | 0 (0.0%) | 0 (0.0%) |
| 18 to 34 Years | 4 (3.3%) | 1 (2.0%) |
| 35 to 64 Years | 26 (20.3%) | 16 (12.6%) |
| 65 to 74 Years | 13 (17.3%) | 33 (47.8%) |
| 75 Years and over | 0 (0.0%) | 10 (35.7%) |
Disability Class: Self-Care Difficulty
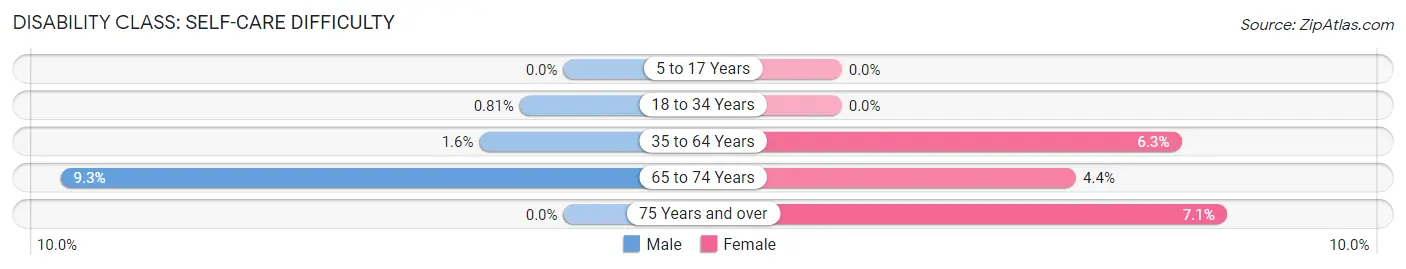
| Age Bracket | Male | Female |
| 5 to 17 Years | 0 (0.0%) | 0 (0.0%) |
| 18 to 34 Years | 1 (0.8%) | 0 (0.0%) |
| 35 to 64 Years | 2 (1.6%) | 8 (6.3%) |
| 65 to 74 Years | 7 (9.3%) | 3 (4.3%) |
| 75 Years and over | 0 (0.0%) | 2 (7.1%) |
Technology Access in Winslow
Computing Device Access in Winslow
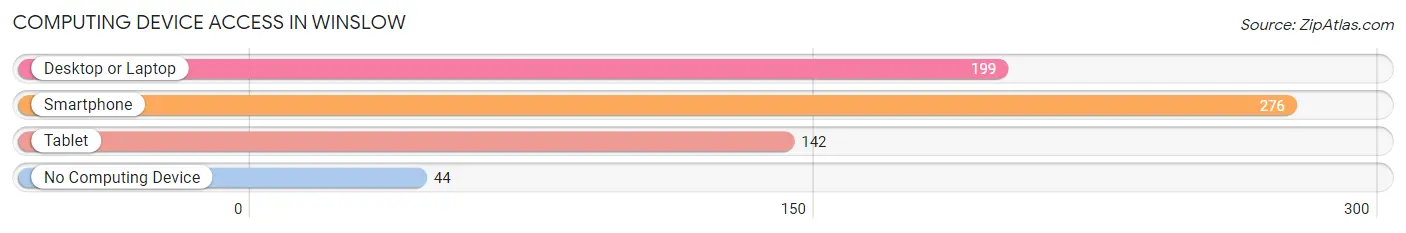
| Device Type | # Households | % Households |
| Desktop or Laptop | 199 | 57.5% |
| Smartphone | 276 | 79.8% |
| Tablet | 142 | 41.0% |
| No Computing Device | 44 | 12.7% |
| Total | 346 | 100.0% |
Internet Access in Winslow
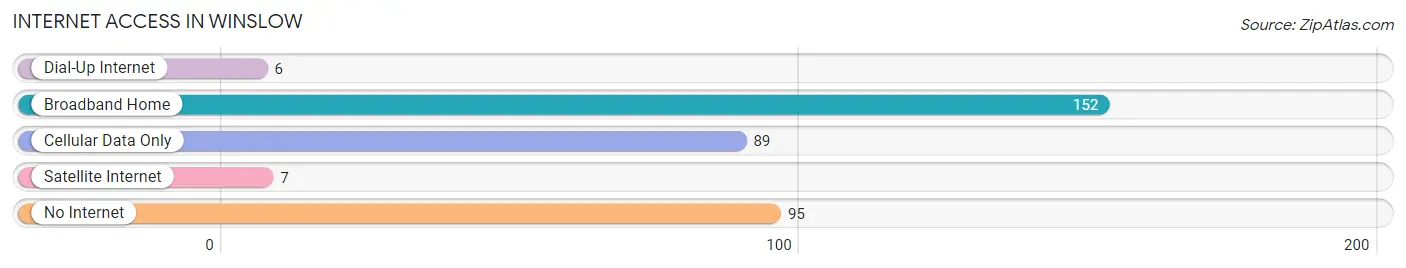
| Internet Type | # Households | % Households |
| Dial-Up Internet | 6 | 1.7% |
| Broadband Home | 152 | 43.9% |
| Cellular Data Only | 89 | 25.7% |
| Satellite Internet | 7 | 2.0% |
| No Internet | 95 | 27.5% |
| Total | 346 | 100.0% |
Winslow Summary
Winslow is a small town located in Pike County, Indiana, United States. It is situated on the banks of the White River, approximately 20 miles east of Evansville. The town was founded in 1837 and has a population of approximately 1,500 people.
History
Winslow was founded in 1837 by William Winslow, a settler from Ohio. The town was originally known as Winslow’s Landing, and was a popular stop for steamboats traveling up and down the White River. In 1845, the town was officially incorporated as Winslow.
During the Civil War, Winslow was a major supply center for the Union Army. The town was also the site of a major battle in 1863, when Confederate forces attempted to capture the town. The Union forces were able to repel the attack and the town remained in Union hands.
In the late 19th century, Winslow was a major center for the lumber industry. The town was home to several sawmills and lumber yards, and the town’s economy was largely dependent on the lumber industry.
Geography
Winslow is located in the southwestern corner of Indiana, approximately 20 miles east of Evansville. The town is situated on the banks of the White River, and is surrounded by rolling hills and farmland. The town is located in a temperate climate, with hot summers and cold winters.
Economy
Winslow’s economy is largely based on agriculture and tourism. The town is home to several farms, and the surrounding area is known for its production of corn, soybeans, and wheat. The town is also home to several small businesses, including restaurants, shops, and a few manufacturing plants.
Tourism is also an important part of the local economy. The town is home to several historic sites, including the Winslow House, a 19th century mansion, and the Winslow War Memorial, which honors the town’s Civil War veterans. The town is also home to several parks and recreational areas, including the White River State Park.
Demographics
As of the 2010 census, Winslow had a population of 1,500 people. The town is predominantly white, with approximately 95% of the population identifying as Caucasian. The town also has a small Hispanic population, with approximately 4% of the population identifying as Hispanic or Latino. The median household income in Winslow is $37,000, and the median home value is $90,000.
Conclusion
Winslow is a small town located in Pike County, Indiana. The town was founded in 1837 and has a population of approximately 1,500 people. The town’s economy is largely based on agriculture and tourism, and the town is home to several historic sites and recreational areas. The town is predominantly white, with approximately 95% of the population identifying as Caucasian. The median household income in Winslow is $37,000, and the median home value is $90,000.
Common Questions
What is Per Capita Income in Winslow?
Per Capita income in Winslow is $27,678.
What is the Median Family Income in Winslow?
Median Family Income in Winslow is $58,750.
What is the Median Household income in Winslow?
Median Household Income in Winslow is $47,143.
What is Income or Wage Gap in Winslow?
Income or Wage Gap in Winslow is 17.8%.
Women in Winslow earn 82.2 cents for every dollar earned by a man.
What is Inequality or Gini Index in Winslow?
Inequality or Gini Index in Winslow is 0.39.
What is the Total Population of Winslow?
Total Population of Winslow is 729.
What is the Total Male Population of Winslow?
Total Male Population of Winslow is 392.
What is the Total Female Population of Winslow?
Total Female Population of Winslow is 337.
What is the Ratio of Males per 100 Females in Winslow?
There are 116.32 Males per 100 Females in Winslow.
What is the Ratio of Females per 100 Males in Winslow?
There are 85.97 Females per 100 Males in Winslow.
What is the Median Population Age in Winslow?
Median Population Age in Winslow is 43.8 Years.
What is the Average Family Size in Winslow
Average Family Size in Winslow is 2.8 People.
What is the Average Household Size in Winslow
Average Household Size in Winslow is 2.1 People.
How Large is the Labor Force in Winslow?
There are 295 People in the Labor Forcein in Winslow.
What is the Percentage of People in the Labor Force in Winslow?
47.0% of People are in the Labor Force in Winslow.
What is the Unemployment Rate in Winslow?
Unemployment Rate in Winslow is 5.4%.