Dunlap, IN Map & Demographics
Dunlap Map
Dunlap Overview
$32,965
PER CAPITA INCOME
$92,565
AVG FAMILY INCOME
$82,368
AVG HOUSEHOLD INCOME
38.3%
WAGE / INCOME GAP [ % ]
61.7¢/ $1
WAGE / INCOME GAP [ $ ]
0.40
INEQUALITY / GINI INDEX
6,799
TOTAL POPULATION
3,358
MALE POPULATION
3,441
FEMALE POPULATION
97.59
MALES / 100 FEMALES
102.47
FEMALES / 100 MALES
36.8
MEDIAN AGE
3.7
AVG FAMILY SIZE
3.3
AVG HOUSEHOLD SIZE
3,422
LABOR FORCE [ PEOPLE ]
64.5%
PERCENT IN LABOR FORCE
2.9%
UNEMPLOYMENT RATE
Income in Dunlap
Income Overview in Dunlap
Per Capita Income in Dunlap is $32,965, while median incomes of families and households are $92,565 and $82,368 respectively.
| Characteristic | Number | Measure |
| Per Capita Income | 6,799 | $32,965 |
| Median Family Income | 1,630 | $92,565 |
| Mean Family Income | 1,630 | $109,951 |
| Median Household Income | 2,058 | $82,368 |
| Mean Household Income | 2,058 | $101,893 |
| Income Deficit | 1,630 | $0 |
| Wage / Income Gap (%) | 6,799 | 38.32% |
| Wage / Income Gap ($) | 6,799 | 61.68¢ per $1 |
| Gini / Inequality Index | 6,799 | 0.40 |
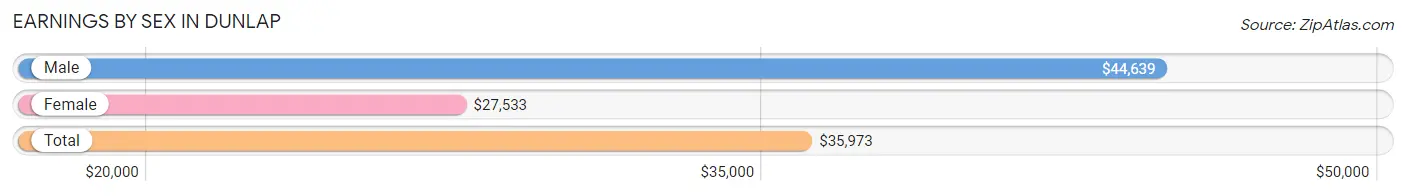
Earnings by Sex in Dunlap
Average Earnings in Dunlap are $35,973, $44,639 for men and $27,533 for women, a difference of 38.3%.
| Sex | Number | Average Earnings |
| Male | 1,999 (55.2%) | $44,639 |
| Female | 1,620 (44.8%) | $27,533 |
| Total | 3,619 (100.0%) | $35,973 |
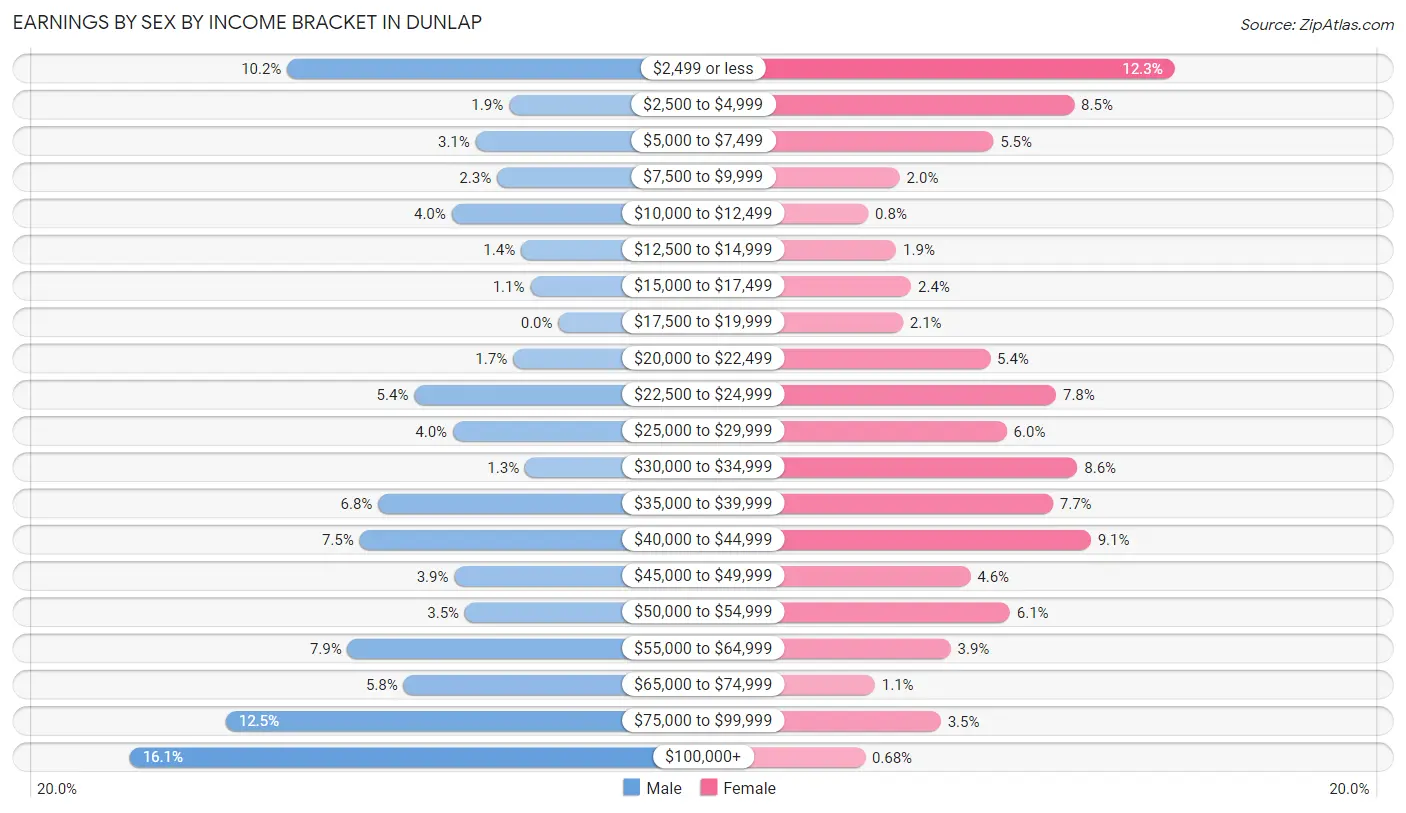
Earnings by Sex by Income Bracket in Dunlap
The most common earnings brackets in Dunlap are $100,000+ for men (321 | 16.1%) and $2,499 or less for women (199 | 12.3%).
| Income | Male | Female |
| $2,499 or less | 203 (10.2%) | 199 (12.3%) |
| $2,500 to $4,999 | 37 (1.8%) | 138 (8.5%) |
| $5,000 to $7,499 | 62 (3.1%) | 89 (5.5%) |
| $7,500 to $9,999 | 46 (2.3%) | 32 (2.0%) |
| $10,000 to $12,499 | 80 (4.0%) | 13 (0.8%) |
| $12,500 to $14,999 | 28 (1.4%) | 30 (1.8%) |
| $15,000 to $17,499 | 21 (1.1%) | 39 (2.4%) |
| $17,500 to $19,999 | 0 (0.0%) | 34 (2.1%) |
| $20,000 to $22,499 | 34 (1.7%) | 87 (5.4%) |
| $22,500 to $24,999 | 108 (5.4%) | 127 (7.8%) |
| $25,000 to $29,999 | 79 (4.0%) | 97 (6.0%) |
| $30,000 to $34,999 | 25 (1.3%) | 140 (8.6%) |
| $35,000 to $39,999 | 135 (6.8%) | 125 (7.7%) |
| $40,000 to $44,999 | 149 (7.4%) | 148 (9.1%) |
| $45,000 to $49,999 | 78 (3.9%) | 75 (4.6%) |
| $50,000 to $54,999 | 70 (3.5%) | 99 (6.1%) |
| $55,000 to $64,999 | 158 (7.9%) | 63 (3.9%) |
| $65,000 to $74,999 | 116 (5.8%) | 17 (1.1%) |
| $75,000 to $99,999 | 249 (12.5%) | 57 (3.5%) |
| $100,000+ | 321 (16.1%) | 11 (0.7%) |
| Total | 1,999 (100.0%) | 1,620 (100.0%) |
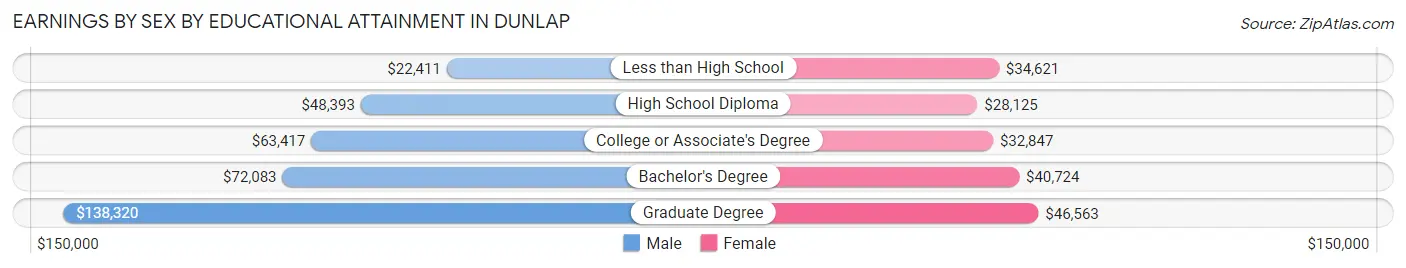
Earnings by Sex by Educational Attainment in Dunlap
Average earnings in Dunlap are $56,125 for men and $33,134 for women, a difference of 41.0%. Men with an educational attainment of graduate degree enjoy the highest average annual earnings of $138,320, while those with less than high school education earn the least with $22,411. Women with an educational attainment of graduate degree earn the most with the average annual earnings of $46,563, while those with high school diploma education have the smallest earnings of $28,125.
| Educational Attainment | Male Income | Female Income |
| Less than High School | $22,411 | $34,621 |
| High School Diploma | $48,393 | $28,125 |
| College or Associate's Degree | $63,417 | $32,847 |
| Bachelor's Degree | $72,083 | $40,724 |
| Graduate Degree | $138,320 | $46,563 |
| Total | $56,125 | $33,134 |
Family Income in Dunlap
Family Income Brackets in Dunlap
According to the Dunlap family income data, there are 412 families falling into the $100,000 to $149,999 income range, which is the most common income bracket and makes up 25.3% of all families.
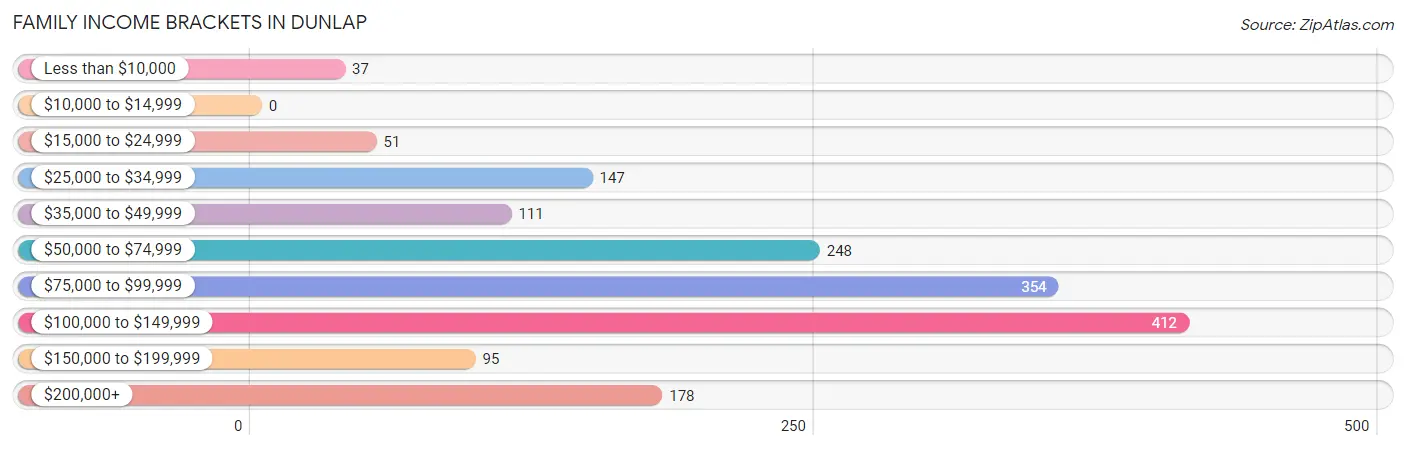
| Income Bracket | # Families | % Families |
| Less than $10,000 | 37 | 2.3% |
| $10,000 to $14,999 | 0 | 0.0% |
| $15,000 to $24,999 | 51 | 3.1% |
| $25,000 to $34,999 | 147 | 9.0% |
| $35,000 to $49,999 | 111 | 6.8% |
| $50,000 to $74,999 | 248 | 15.2% |
| $75,000 to $99,999 | 354 | 21.7% |
| $100,000 to $149,999 | 412 | 25.3% |
| $150,000 to $199,999 | 95 | 5.8% |
| $200,000+ | 178 | 10.9% |
Family Income by Famaliy Size in Dunlap
5-person families (205 | 12.6%) account for the highest median family income in Dunlap with $138,945 per family, while 2-person families (763 | 46.8%) have the highest median income of $42,410 per family member.
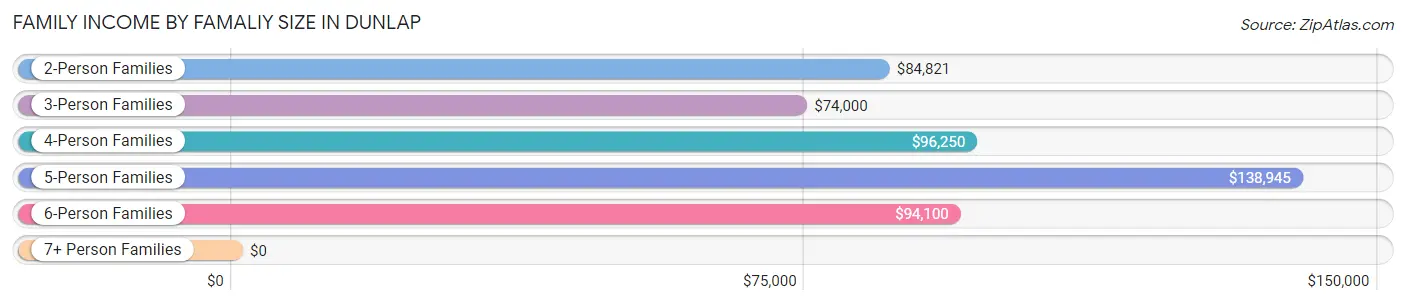
| Income Bracket | # Families | Median Income |
| 2-Person Families | 763 (46.8%) | $84,821 |
| 3-Person Families | 300 (18.4%) | $74,000 |
| 4-Person Families | 258 (15.8%) | $96,250 |
| 5-Person Families | 205 (12.6%) | $138,945 |
| 6-Person Families | 60 (3.7%) | $94,100 |
| 7+ Person Families | 44 (2.7%) | $0 |
| Total | 1,630 (100.0%) | $92,565 |
Family Income by Number of Earners in Dunlap
The median family income in Dunlap is $92,565, with families comprising 3+ earners (337) having the highest median family income of $115,509, while families with no earners (315) have the lowest median family income of $40,625, accounting for 20.7% and 19.3% of families, respectively.
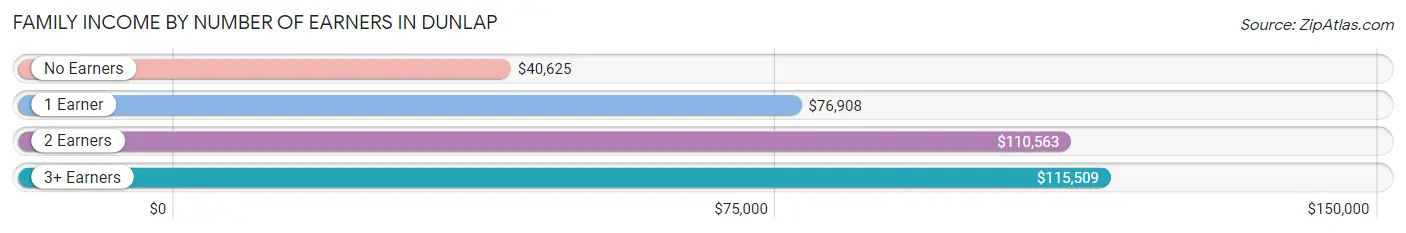
| Number of Earners | # Families | Median Income |
| No Earners | 315 (19.3%) | $40,625 |
| 1 Earner | 309 (19.0%) | $76,908 |
| 2 Earners | 669 (41.0%) | $110,563 |
| 3+ Earners | 337 (20.7%) | $115,509 |
| Total | 1,630 (100.0%) | $92,565 |
Household Income in Dunlap
Household Income Brackets in Dunlap
With 414 households falling in the category, the $75,000 to $99,999 income range is the most frequent in Dunlap, accounting for 20.1% of all households.
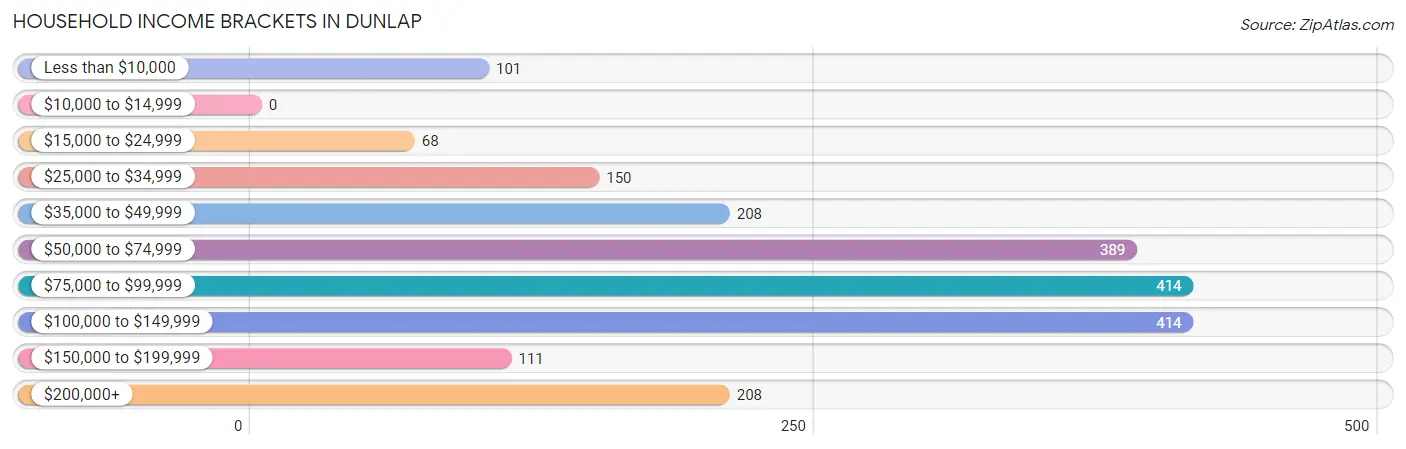
| Income Bracket | # Households | % Households |
| Less than $10,000 | 101 | 4.9% |
| $10,000 to $14,999 | 0 | 0.0% |
| $15,000 to $24,999 | 68 | 3.3% |
| $25,000 to $34,999 | 150 | 7.3% |
| $35,000 to $49,999 | 208 | 10.1% |
| $50,000 to $74,999 | 389 | 18.9% |
| $75,000 to $99,999 | 414 | 20.1% |
| $100,000 to $149,999 | 414 | 20.1% |
| $150,000 to $199,999 | 111 | 5.4% |
| $200,000+ | 208 | 10.1% |
Household Income by Householder Age in Dunlap
The median household income in Dunlap is $82,368, with the highest median household income of $92,284 found in the 25 to 44 years age bracket for the primary householder. A total of 497 households (24.1%) fall into this category.
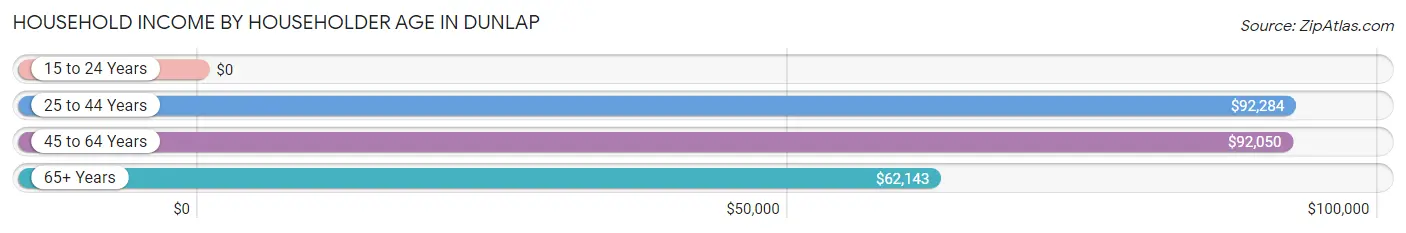
| Income Bracket | # Households | Median Income |
| 15 to 24 Years | 0 (0.0%) | $0 |
| 25 to 44 Years | 497 (24.1%) | $92,284 |
| 45 to 64 Years | 945 (45.9%) | $92,050 |
| 65+ Years | 616 (29.9%) | $62,143 |
| Total | 2,058 (100.0%) | $82,368 |
Poverty in Dunlap
Income Below Poverty by Sex and Age in Dunlap
With 5.9% poverty level for males and 9.7% for females among the residents of Dunlap, 12 to 14 year old males and 45 to 54 year old females are the most vulnerable to poverty, with 71 males (50.3%) and 140 females (33.4%) in their respective age groups living below the poverty level.
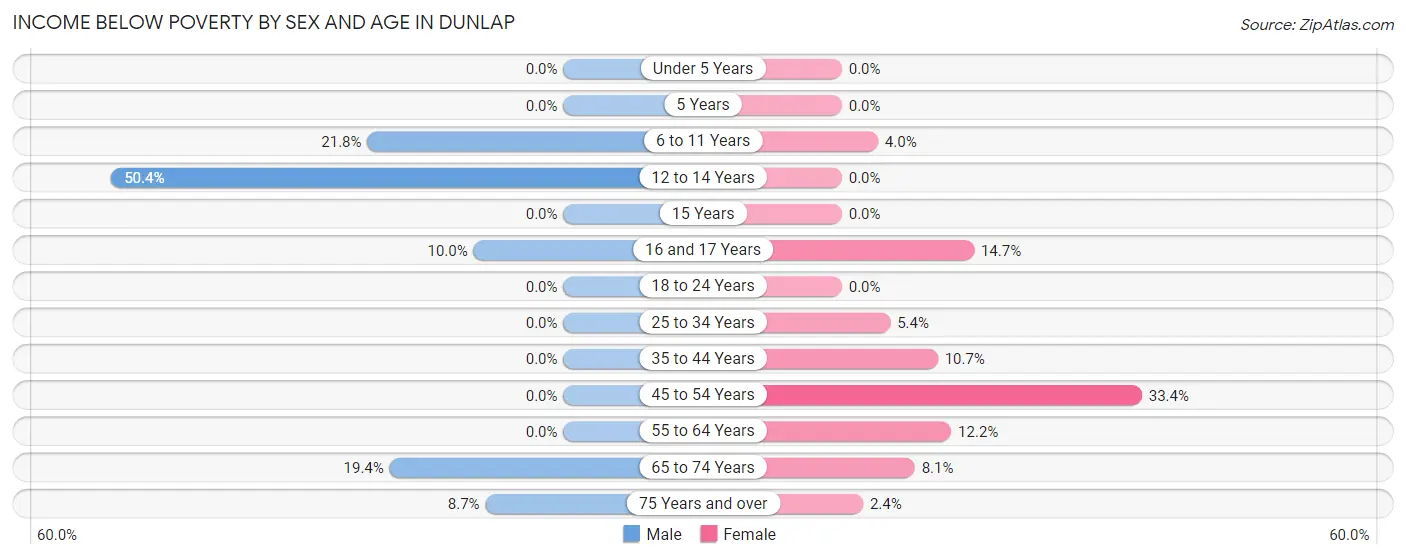
| Age Bracket | Male | Female |
| Under 5 Years | 0 (0.0%) | 0 (0.0%) |
| 5 Years | 0 (0.0%) | 0 (0.0%) |
| 6 to 11 Years | 43 (21.8%) | 8 (4.0%) |
| 12 to 14 Years | 71 (50.3%) | 0 (0.0%) |
| 15 Years | 0 (0.0%) | 0 (0.0%) |
| 16 and 17 Years | 10 (10.0%) | 29 (14.7%) |
| 18 to 24 Years | 0 (0.0%) | 0 (0.0%) |
| 25 to 34 Years | 0 (0.0%) | 27 (5.4%) |
| 35 to 44 Years | 0 (0.0%) | 30 (10.7%) |
| 45 to 54 Years | 0 (0.0%) | 140 (33.4%) |
| 55 to 64 Years | 0 (0.0%) | 57 (12.2%) |
| 65 to 74 Years | 54 (19.4%) | 28 (8.1%) |
| 75 Years and over | 19 (8.7%) | 7 (2.4%) |
| Total | 197 (5.9%) | 326 (9.7%) |
Income Above Poverty by Sex and Age in Dunlap
According to the poverty statistics in Dunlap, males aged under 5 years and females aged under 5 years are the age groups that are most secure financially, with 100.0% of males and 100.0% of females in these age groups living above the poverty line.
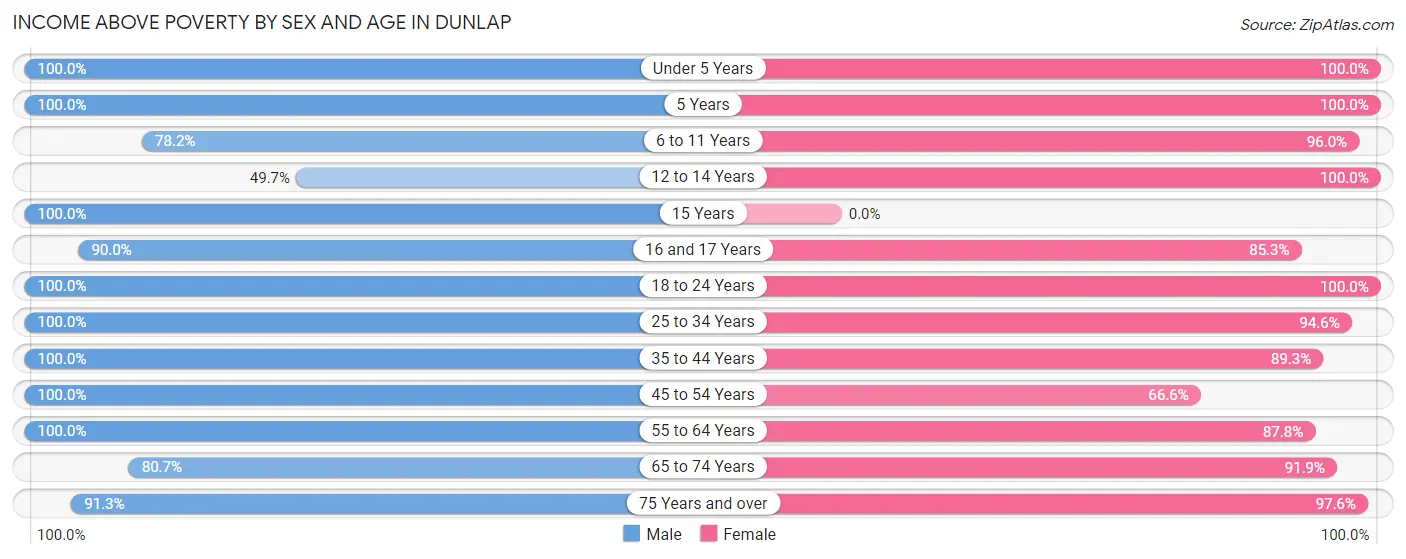
| Age Bracket | Male | Female |
| Under 5 Years | 270 (100.0%) | 263 (100.0%) |
| 5 Years | 46 (100.0%) | 97 (100.0%) |
| 6 to 11 Years | 154 (78.2%) | 191 (96.0%) |
| 12 to 14 Years | 70 (49.6%) | 106 (100.0%) |
| 15 Years | 73 (100.0%) | 0 (0.0%) |
| 16 and 17 Years | 90 (90.0%) | 168 (85.3%) |
| 18 to 24 Years | 412 (100.0%) | 195 (100.0%) |
| 25 to 34 Years | 391 (100.0%) | 474 (94.6%) |
| 35 to 44 Years | 377 (100.0%) | 251 (89.3%) |
| 45 to 54 Years | 344 (100.0%) | 279 (66.6%) |
| 55 to 64 Years | 481 (100.0%) | 411 (87.8%) |
| 65 to 74 Years | 225 (80.6%) | 317 (91.9%) |
| 75 Years and over | 200 (91.3%) | 289 (97.6%) |
| Total | 3,133 (94.1%) | 3,041 (90.3%) |
Income Below Poverty Among Married-Couple Families in Dunlap
The poverty statistics for married-couple families in Dunlap show that 3.9% or 54 of the total 1,395 families live below the poverty line. Families with 1 or 2 children have the highest poverty rate of 8.5%, comprising of 35 families. On the other hand, families with 3 or 4 children have the lowest poverty rate of 0.0%, which includes 0 families.
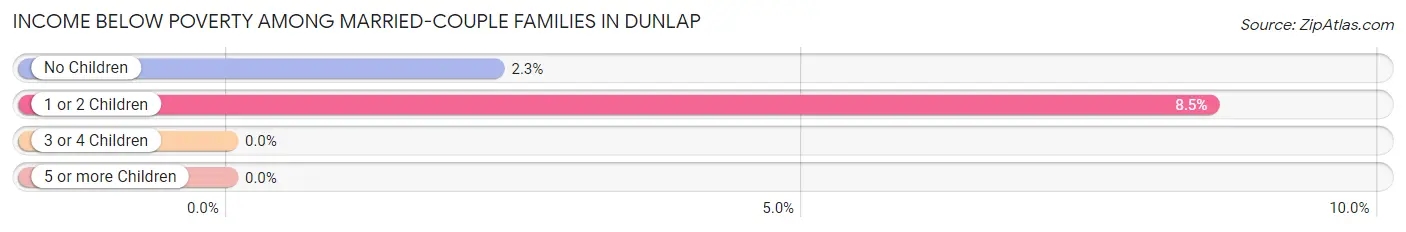
| Children | Above Poverty | Below Poverty |
| No Children | 801 (97.7%) | 19 (2.3%) |
| 1 or 2 Children | 375 (91.5%) | 35 (8.5%) |
| 3 or 4 Children | 165 (100.0%) | 0 (0.0%) |
| 5 or more Children | 0 (0.0%) | 0 (0.0%) |
| Total | 1,341 (96.1%) | 54 (3.9%) |
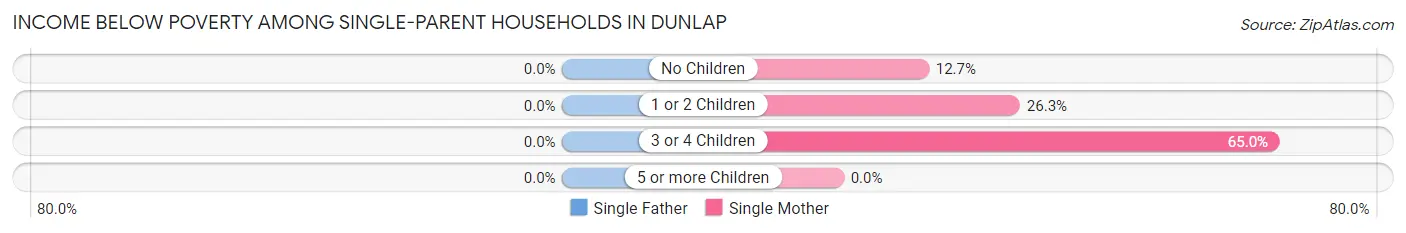
Income Below Poverty Among Single-Parent Households in Dunlap
| Children | Single Father | Single Mother |
| No Children | 0 (0.0%) | 9 (12.7%) |
| 1 or 2 Children | 0 (0.0%) | 26 (26.3%) |
| 3 or 4 Children | 0 (0.0%) | 13 (65.0%) |
| 5 or more Children | 0 (0.0%) | 0 (0.0%) |
| Total | 0 (0.0%) | 48 (25.3%) |
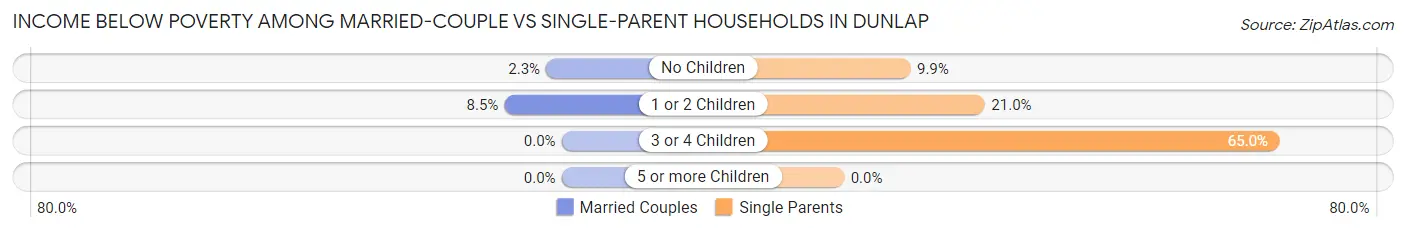
Income Below Poverty Among Married-Couple vs Single-Parent Households in Dunlap
The poverty data for Dunlap shows that 54 of the married-couple family households (3.9%) and 48 of the single-parent households (20.4%) are living below the poverty level. Within the married-couple family households, those with 1 or 2 children have the highest poverty rate, with 35 households (8.5%) falling below the poverty line. Among the single-parent households, those with 3 or 4 children have the highest poverty rate, with 13 household (65.0%) living below poverty.
| Children | Married-Couple Families | Single-Parent Households |
| No Children | 19 (2.3%) | 9 (9.9%) |
| 1 or 2 Children | 35 (8.5%) | 26 (21.0%) |
| 3 or 4 Children | 0 (0.0%) | 13 (65.0%) |
| 5 or more Children | 0 (0.0%) | 0 (0.0%) |
| Total | 54 (3.9%) | 48 (20.4%) |
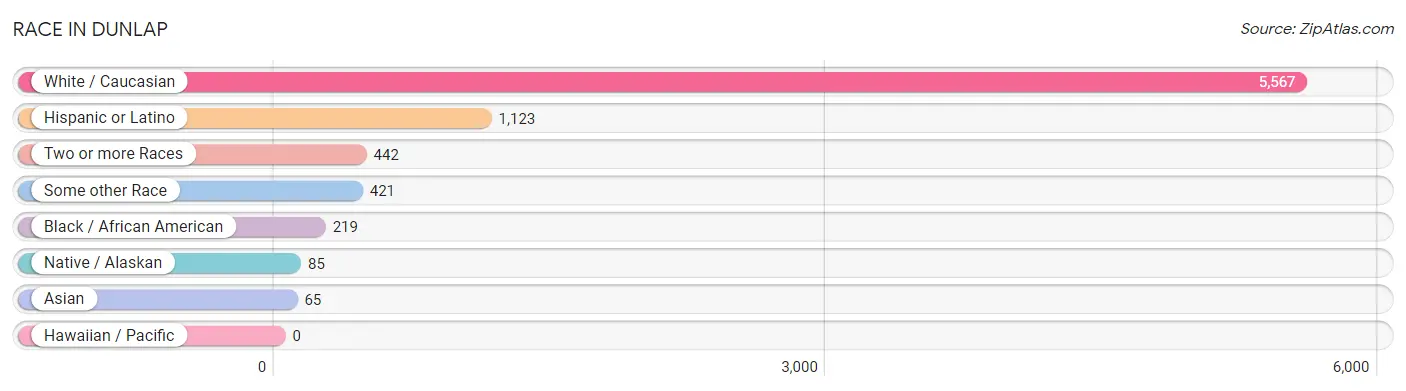
Race in Dunlap
The most populous races in Dunlap are White / Caucasian (5,567 | 81.9%), Hispanic or Latino (1,123 | 16.5%), and Two or more Races (442 | 6.5%).
| Race | # Population | % Population |
| Asian | 65 | 1.0% |
| Black / African American | 219 | 3.2% |
| Hawaiian / Pacific | 0 | 0.0% |
| Hispanic or Latino | 1,123 | 16.5% |
| Native / Alaskan | 85 | 1.3% |
| White / Caucasian | 5,567 | 81.9% |
| Two or more Races | 442 | 6.5% |
| Some other Race | 421 | 6.2% |
| Total | 6,799 | 100.0% |
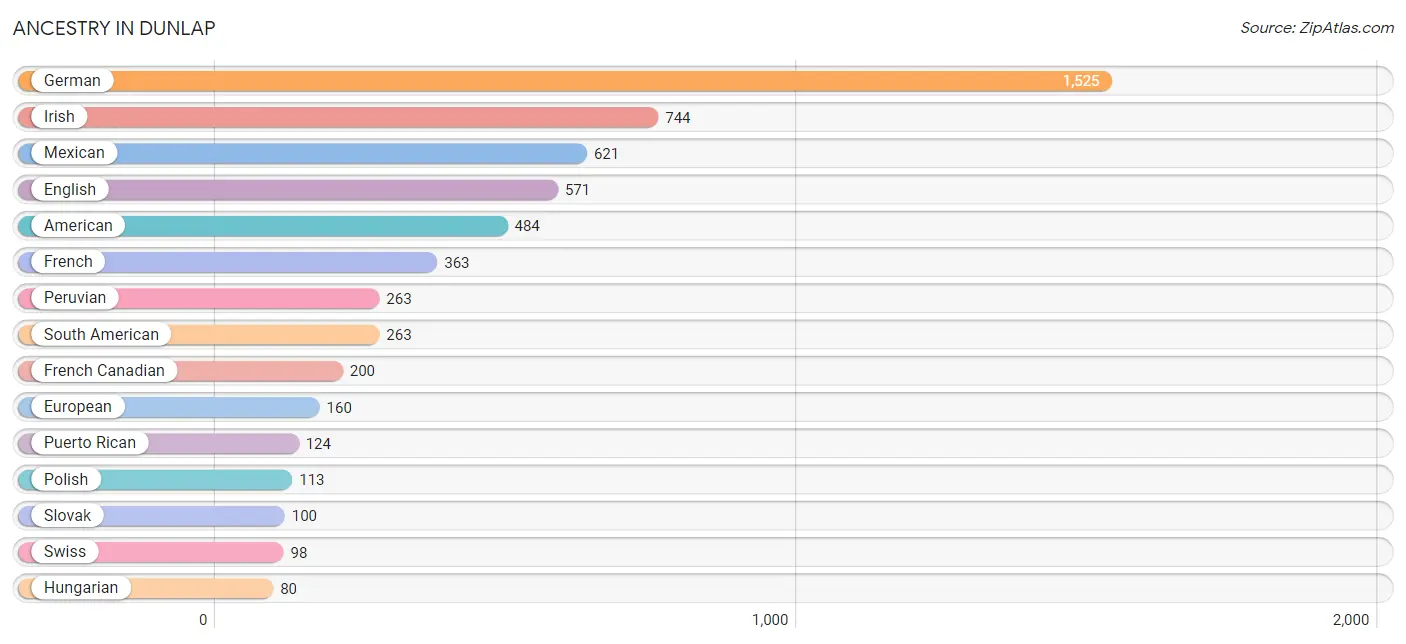
Ancestry in Dunlap
The most populous ancestries reported in Dunlap are German (1,525 | 22.4%), Irish (744 | 10.9%), Mexican (621 | 9.1%), English (571 | 8.4%), and American (484 | 7.1%), together accounting for 58.0% of all Dunlap residents.
| Ancestry | # Population | % Population |
| African | 22 | 0.3% |
| American | 484 | 7.1% |
| Arab | 26 | 0.4% |
| Belgian | 34 | 0.5% |
| Bhutanese | 15 | 0.2% |
| Blackfeet | 1 | 0.0% |
| British | 10 | 0.2% |
| Canadian | 20 | 0.3% |
| Central American | 49 | 0.7% |
| Cherokee | 23 | 0.3% |
| Czechoslovakian | 12 | 0.2% |
| Dutch | 73 | 1.1% |
| English | 571 | 8.4% |
| European | 160 | 2.4% |
| French | 363 | 5.3% |
| French Canadian | 200 | 2.9% |
| German | 1,525 | 22.4% |
| Hungarian | 80 | 1.2% |
| Indian (Asian) | 31 | 0.5% |
| Irish | 744 | 10.9% |
| Italian | 18 | 0.3% |
| Korean | 10 | 0.2% |
| Malaysian | 43 | 0.6% |
| Mexican | 621 | 9.1% |
| Mexican American Indian | 62 | 0.9% |
| Norwegian | 71 | 1.0% |
| Pakistani | 74 | 1.1% |
| Pennsylvania German | 15 | 0.2% |
| Peruvian | 263 | 3.9% |
| Polish | 113 | 1.7% |
| Puerto Rican | 124 | 1.8% |
| Russian | 53 | 0.8% |
| Salvadoran | 49 | 0.7% |
| Scotch-Irish | 14 | 0.2% |
| Scottish | 34 | 0.5% |
| Slovak | 100 | 1.5% |
| South American | 263 | 3.9% |
| Subsaharan African | 22 | 0.3% |
| Swiss | 98 | 1.4% |
| Vietnamese | 22 | 0.3% | View All 40 Rows |
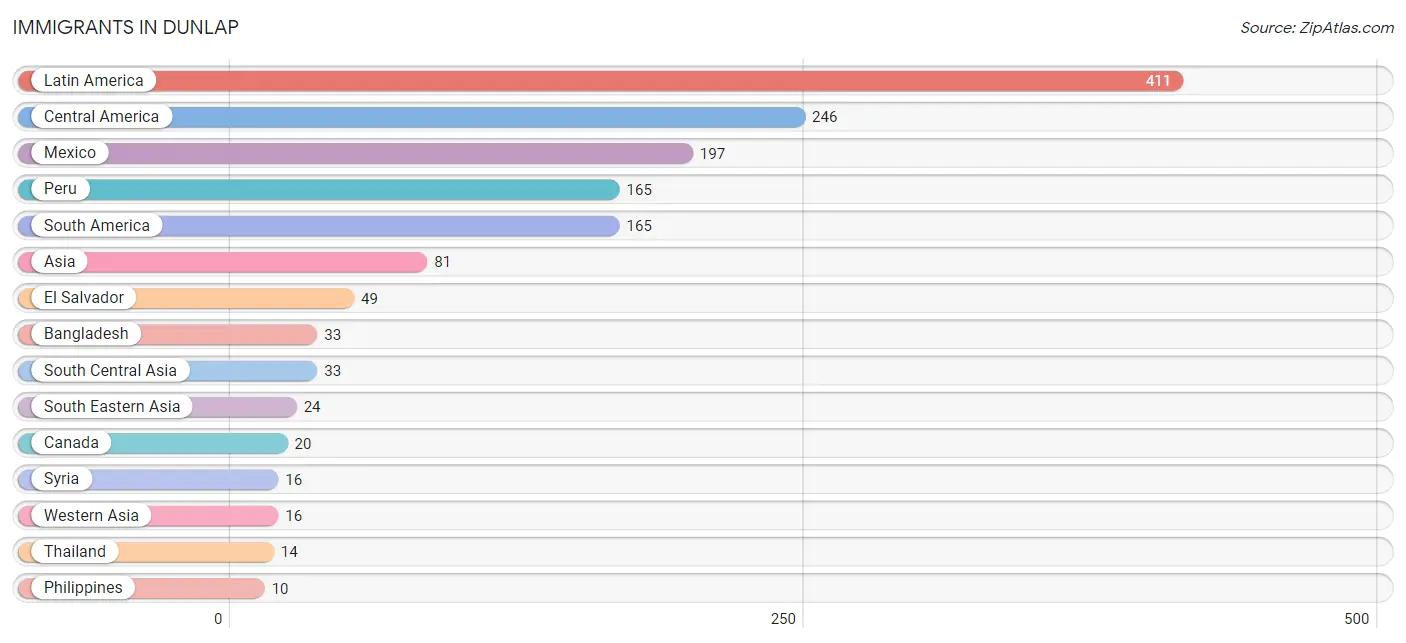
Immigrants in Dunlap
The most numerous immigrant groups reported in Dunlap came from Latin America (411 | 6.0%), Central America (246 | 3.6%), Mexico (197 | 2.9%), Peru (165 | 2.4%), and South America (165 | 2.4%), together accounting for 17.4% of all Dunlap residents.
| Immigration Origin | # Population | % Population |
| Asia | 81 | 1.2% |
| Bangladesh | 33 | 0.5% |
| Canada | 20 | 0.3% |
| Central America | 246 | 3.6% |
| Eastern Asia | 8 | 0.1% |
| El Salvador | 49 | 0.7% |
| Japan | 8 | 0.1% |
| Latin America | 411 | 6.0% |
| Mexico | 197 | 2.9% |
| Peru | 165 | 2.4% |
| Philippines | 10 | 0.2% |
| South America | 165 | 2.4% |
| South Central Asia | 33 | 0.5% |
| South Eastern Asia | 24 | 0.4% |
| Syria | 16 | 0.2% |
| Thailand | 14 | 0.2% |
| Western Asia | 16 | 0.2% | View All 17 Rows |
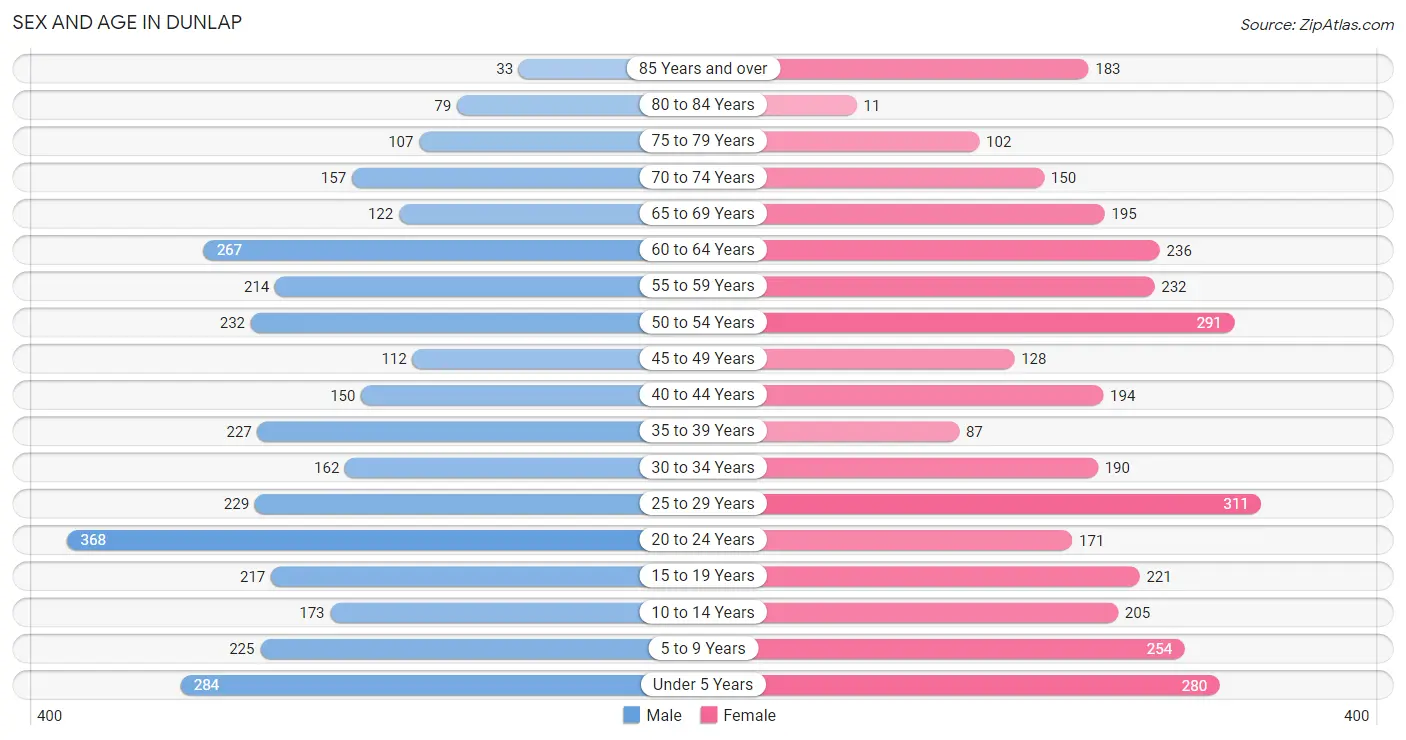
Sex and Age in Dunlap
Sex and Age in Dunlap
The most populous age groups in Dunlap are 20 to 24 Years (368 | 11.0%) for men and 25 to 29 Years (311 | 9.0%) for women.
| Age Bracket | Male | Female |
| Under 5 Years | 284 (8.5%) | 280 (8.1%) |
| 5 to 9 Years | 225 (6.7%) | 254 (7.4%) |
| 10 to 14 Years | 173 (5.1%) | 205 (6.0%) |
| 15 to 19 Years | 217 (6.5%) | 221 (6.4%) |
| 20 to 24 Years | 368 (11.0%) | 171 (5.0%) |
| 25 to 29 Years | 229 (6.8%) | 311 (9.0%) |
| 30 to 34 Years | 162 (4.8%) | 190 (5.5%) |
| 35 to 39 Years | 227 (6.8%) | 87 (2.5%) |
| 40 to 44 Years | 150 (4.5%) | 194 (5.6%) |
| 45 to 49 Years | 112 (3.3%) | 128 (3.7%) |
| 50 to 54 Years | 232 (6.9%) | 291 (8.5%) |
| 55 to 59 Years | 214 (6.4%) | 232 (6.7%) |
| 60 to 64 Years | 267 (8.0%) | 236 (6.9%) |
| 65 to 69 Years | 122 (3.6%) | 195 (5.7%) |
| 70 to 74 Years | 157 (4.7%) | 150 (4.4%) |
| 75 to 79 Years | 107 (3.2%) | 102 (3.0%) |
| 80 to 84 Years | 79 (2.4%) | 11 (0.3%) |
| 85 Years and over | 33 (1.0%) | 183 (5.3%) |
| Total | 3,358 (100.0%) | 3,441 (100.0%) |
Families and Households in Dunlap
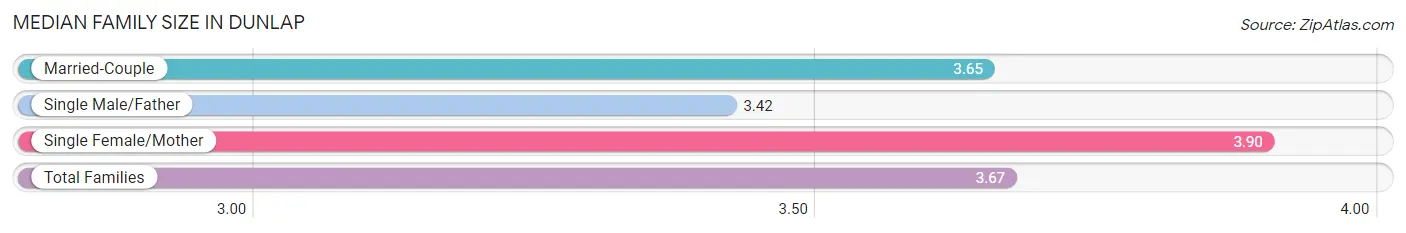
Median Family Size in Dunlap
The median family size in Dunlap is 3.67 persons per family, with single female/mother families (190 | 11.7%) accounting for the largest median family size of 3.9 persons per family. On the other hand, single male/father families (45 | 2.8%) represent the smallest median family size with 3.42 persons per family.
| Family Type | # Families | Family Size |
| Married-Couple | 1,395 (85.6%) | 3.65 |
| Single Male/Father | 45 (2.8%) | 3.42 |
| Single Female/Mother | 190 (11.7%) | 3.90 |
| Total Families | 1,630 (100.0%) | 3.67 |
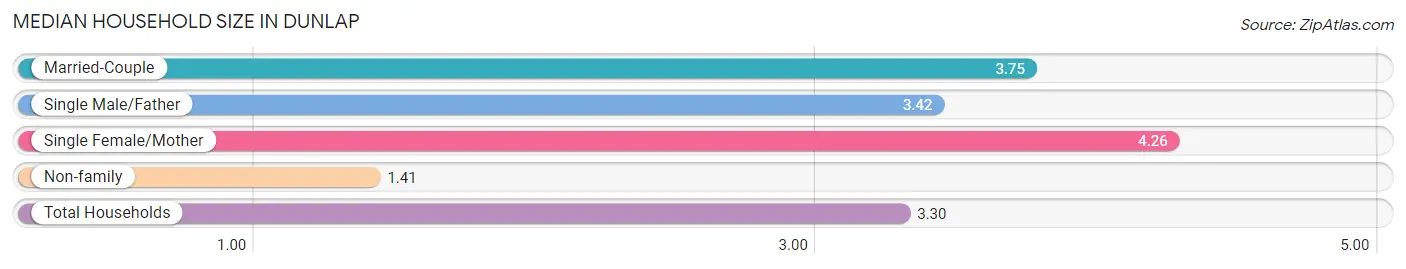
Median Household Size in Dunlap
The median household size in Dunlap is 3.30 persons per household, with single female/mother households (190 | 9.2%) accounting for the largest median household size of 4.26 persons per household. non-family households (428 | 20.8%) represent the smallest median household size with 1.41 persons per household.
| Household Type | # Households | Household Size |
| Married-Couple | 1,395 (67.8%) | 3.75 |
| Single Male/Father | 45 (2.2%) | 3.42 |
| Single Female/Mother | 190 (9.2%) | 4.26 |
| Non-family | 428 (20.8%) | 1.41 |
| Total Households | 2,058 (100.0%) | 3.30 |
Household Size by Marriage Status in Dunlap
Out of a total of 2,058 households in Dunlap, 1,630 (79.2%) are family households, while 428 (20.8%) are nonfamily households. The most numerous type of family households are 2-person households, comprising 754, and the most common type of nonfamily households are 1-person households, comprising 330.
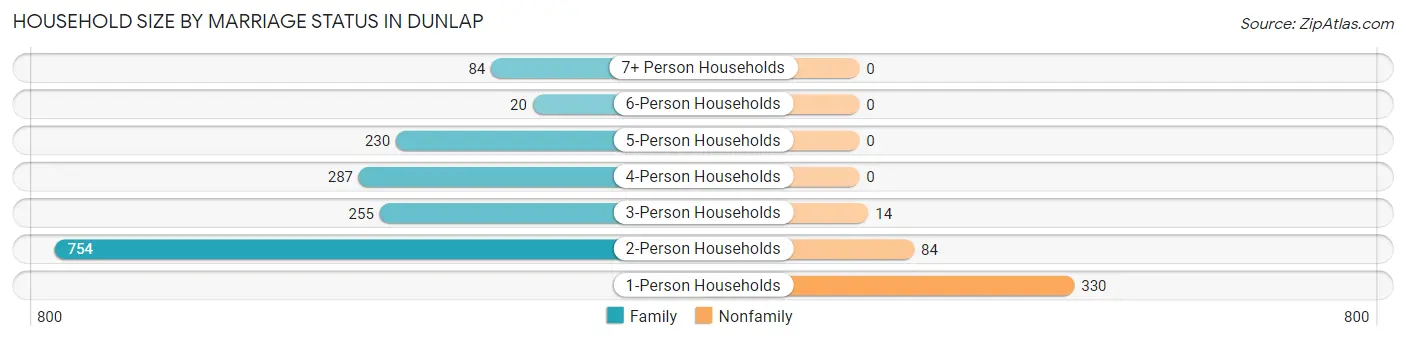
| Household Size | Family Households | Nonfamily Households |
| 1-Person Households | - | 330 (16.0%) |
| 2-Person Households | 754 (36.6%) | 84 (4.1%) |
| 3-Person Households | 255 (12.4%) | 14 (0.7%) |
| 4-Person Households | 287 (14.0%) | 0 (0.0%) |
| 5-Person Households | 230 (11.2%) | 0 (0.0%) |
| 6-Person Households | 20 (1.0%) | 0 (0.0%) |
| 7+ Person Households | 84 (4.1%) | 0 (0.0%) |
| Total | 1,630 (79.2%) | 428 (20.8%) |
Female Fertility in Dunlap
Fertility by Age in Dunlap
Average fertility rate in Dunlap is 57.0 births per 1,000 women. Women in the age bracket of 35 to 50 years have the highest fertility rate with 81.0 births per 1,000 women. Women in the age bracket of 20 to 34 years acount for 54.7% of all women with births.
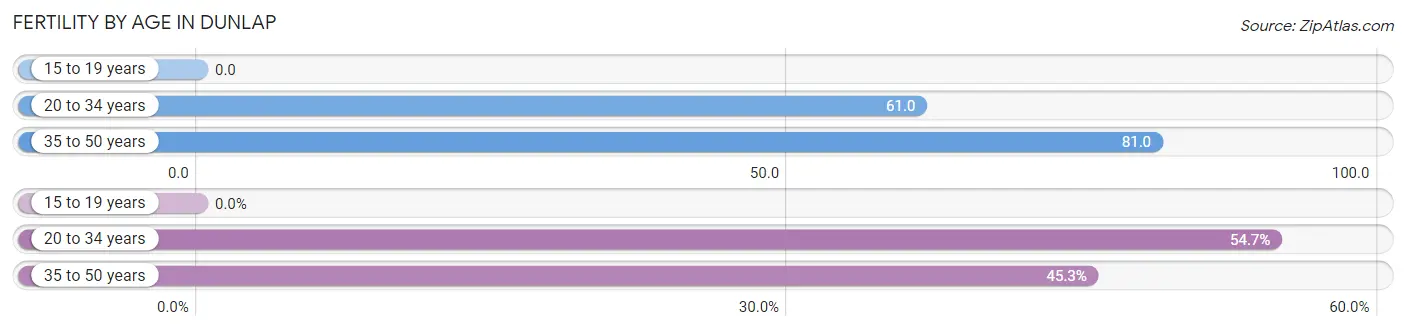
| Age Bracket | Women with Births | Births / 1,000 Women |
| 15 to 19 years | 0 (0.0%) | 0.0 |
| 20 to 34 years | 41 (54.7%) | 61.0 |
| 35 to 50 years | 34 (45.3%) | 81.0 |
| Total | 75 (100.0%) | 57.0 |
Fertility by Age by Marriage Status in Dunlap
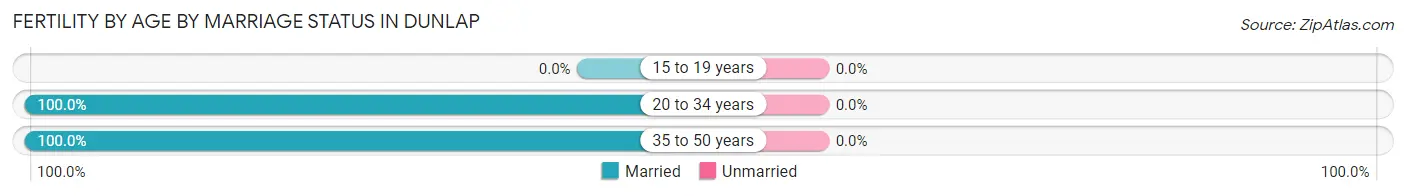
| Age Bracket | Married | Unmarried |
| 15 to 19 years | 0 (0.0%) | 0 (0.0%) |
| 20 to 34 years | 41 (100.0%) | 0 (0.0%) |
| 35 to 50 years | 34 (100.0%) | 0 (0.0%) |
| Total | 75 (100.0%) | 0 (0.0%) |
Fertility by Education in Dunlap
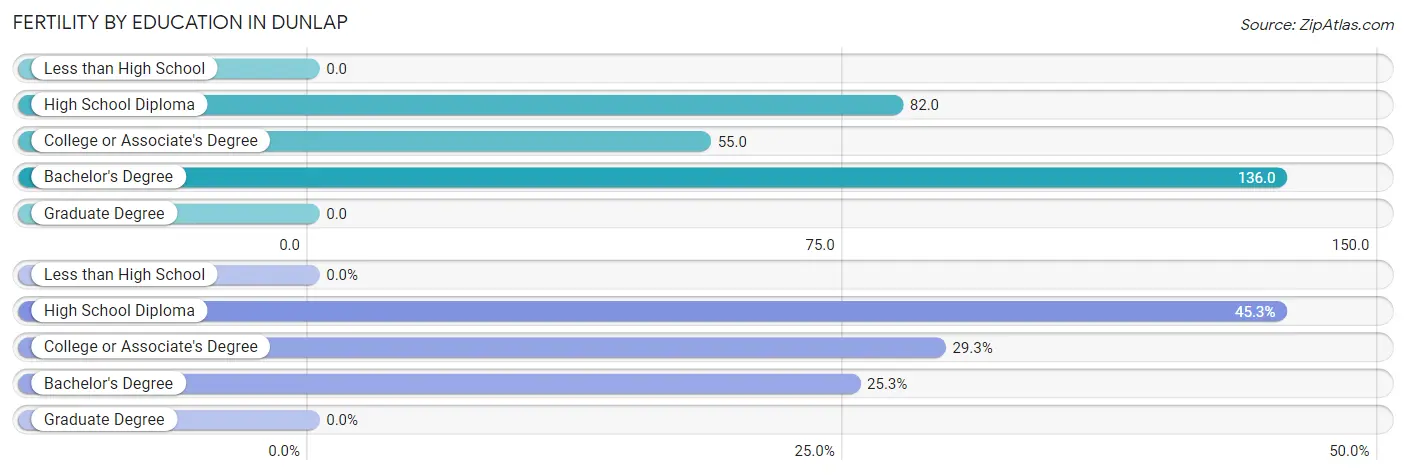
| Educational Attainment | Women with Births | Births / 1,000 Women |
| Less than High School | 0 (0.0%) | 0.0 |
| High School Diploma | 34 (45.3%) | 82.0 |
| College or Associate's Degree | 22 (29.3%) | 55.0 |
| Bachelor's Degree | 19 (25.3%) | 136.0 |
| Graduate Degree | 0 (0.0%) | 0.0 |
| Total | 75 (100.0%) | 57.0 |
Fertility by Education by Marriage Status in Dunlap
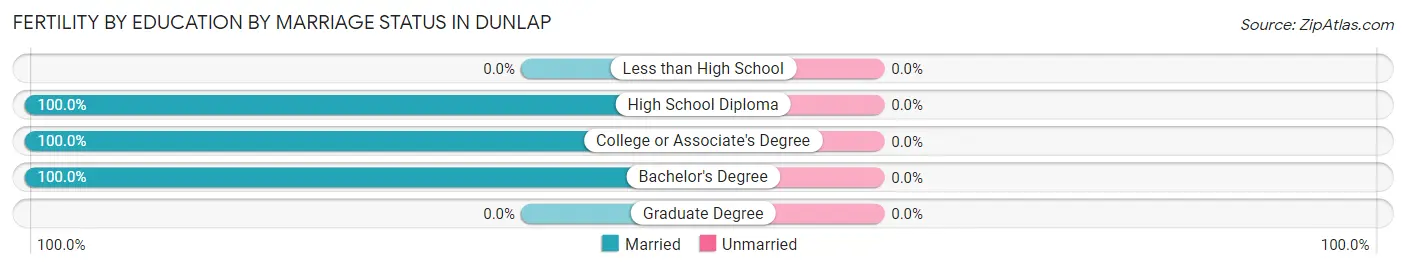
| Educational Attainment | Married | Unmarried |
| Less than High School | 0 (0.0%) | 0 (0.0%) |
| High School Diploma | 34 (100.0%) | 0 (0.0%) |
| College or Associate's Degree | 22 (100.0%) | 0 (0.0%) |
| Bachelor's Degree | 19 (100.0%) | 0 (0.0%) |
| Graduate Degree | 0 (0.0%) | 0 (0.0%) |
| Total | 75 (100.0%) | 0 (0.0%) |
Employment Characteristics in Dunlap
Employment by Class of Employer in Dunlap
Among the 3,106 employed individuals in Dunlap, private company employees (2,236 | 72.0%), not-for-profit organizations (293 | 9.4%), and self-employed (not incorporated) (260 | 8.4%) make up the most common classes of employment.
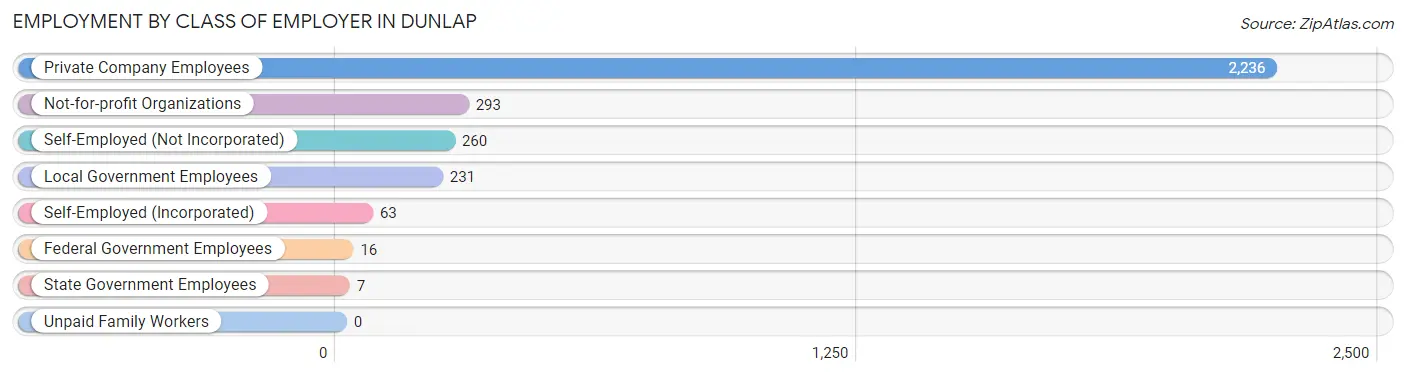
| Employer Class | # Employees | % Employees |
| Private Company Employees | 2,236 | 72.0% |
| Self-Employed (Incorporated) | 63 | 2.0% |
| Self-Employed (Not Incorporated) | 260 | 8.4% |
| Not-for-profit Organizations | 293 | 9.4% |
| Local Government Employees | 231 | 7.4% |
| State Government Employees | 7 | 0.2% |
| Federal Government Employees | 16 | 0.5% |
| Unpaid Family Workers | 0 | 0.0% |
| Total | 3,106 | 100.0% |
Employment Status by Age in Dunlap
According to the labor force statistics for Dunlap, out of the total population over 16 years of age (5,305), 64.5% or 3,422 individuals are in the labor force, with 2.9% or 99 of them unemployed. The age group with the highest labor force participation rate is 45 to 54 years, with 85.8% or 655 individuals in the labor force. Within the labor force, the 55 to 59 years age range has the highest percentage of unemployed individuals, with 12.3% or 37 of them being unemployed.
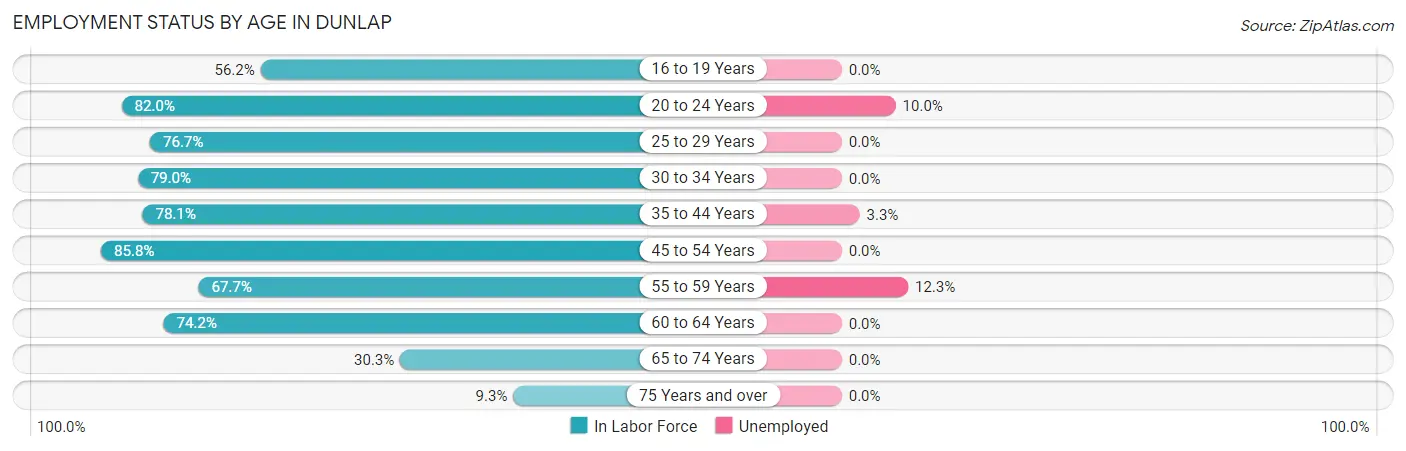
| Age Bracket | In Labor Force | Unemployed |
| 16 to 19 Years | 205 (56.2%) | 0 (0.0%) |
| 20 to 24 Years | 442 (82.0%) | 44 (10.0%) |
| 25 to 29 Years | 414 (76.7%) | 0 (0.0%) |
| 30 to 34 Years | 278 (79.0%) | 0 (0.0%) |
| 35 to 44 Years | 514 (78.1%) | 17 (3.3%) |
| 45 to 54 Years | 655 (85.8%) | 0 (0.0%) |
| 55 to 59 Years | 302 (67.7%) | 37 (12.3%) |
| 60 to 64 Years | 373 (74.2%) | 0 (0.0%) |
| 65 to 74 Years | 189 (30.3%) | 0 (0.0%) |
| 75 Years and over | 48 (9.3%) | 0 (0.0%) |
| Total | 3,422 (64.5%) | 99 (2.9%) |
Employment Status by Educational Attainment in Dunlap
According to labor force statistics for Dunlap, 77.7% of individuals (2,535) out of the total population between 25 and 64 years of age (3,262) are in the labor force, with 2.1% or 53 of them being unemployed. The group with the highest labor force participation rate are those with the educational attainment of bachelor's degree or higher, with 82.8% or 483 individuals in the labor force. Within the labor force, individuals with less than high school education have the highest percentage of unemployment, with 6.3% or 16 of them being unemployed.
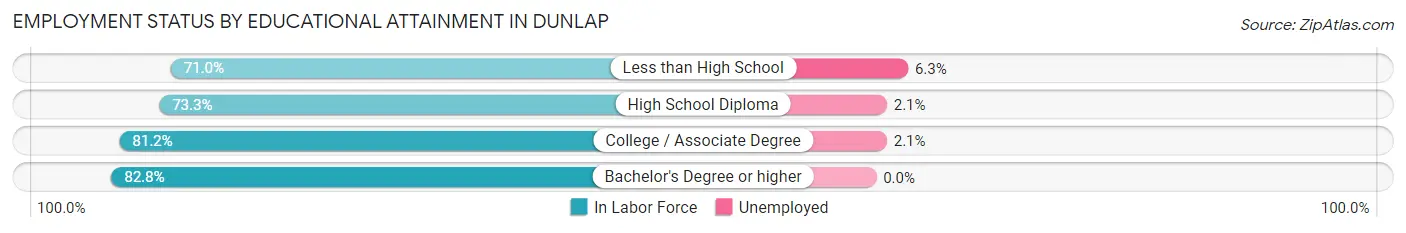
| Educational Attainment | In Labor Force | Unemployed |
| Less than High School | 252 (71.0%) | 22 (6.3%) |
| High School Diploma | 797 (73.3%) | 23 (2.1%) |
| College / Associate Degree | 1,004 (81.2%) | 26 (2.1%) |
| Bachelor's Degree or higher | 483 (82.8%) | 0 (0.0%) |
| Total | 2,535 (77.7%) | 69 (2.1%) |
Employment Occupations by Sex in Dunlap
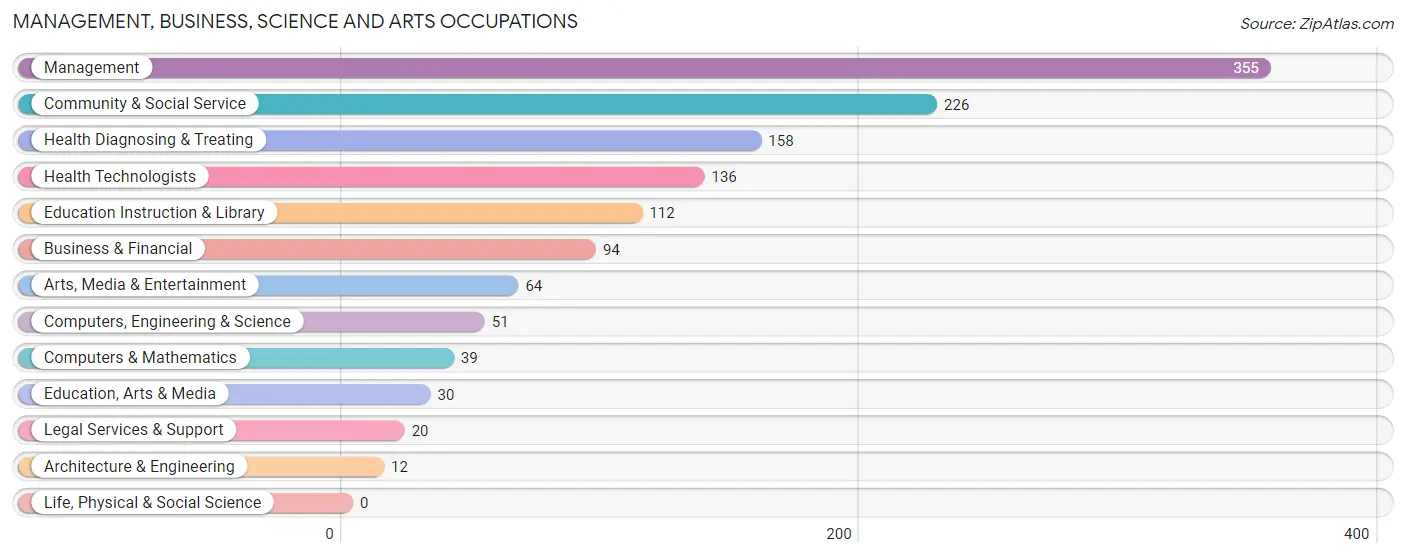
Management, Business, Science and Arts Occupations
The most common Management, Business, Science and Arts occupations in Dunlap are Management (355 | 10.7%), Community & Social Service (226 | 6.8%), Health Diagnosing & Treating (158 | 4.8%), Health Technologists (136 | 4.1%), and Education Instruction & Library (112 | 3.4%).
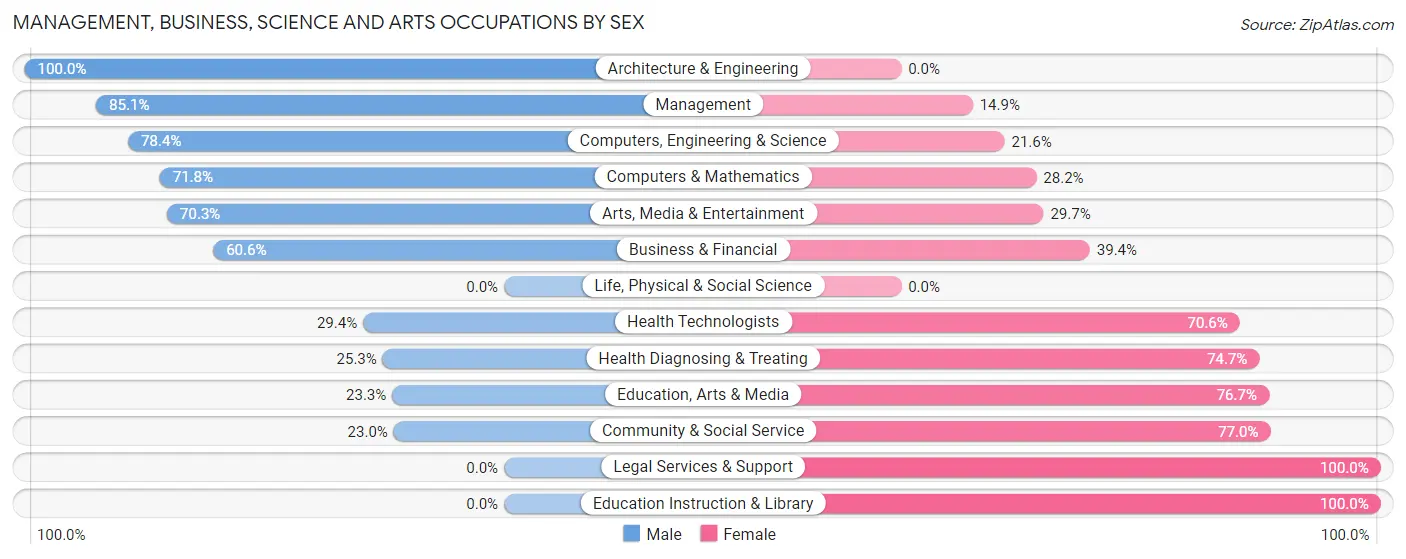
Management, Business, Science and Arts Occupations by Sex
Within the Management, Business, Science and Arts occupations in Dunlap, the most male-oriented occupations are Architecture & Engineering (100.0%), Management (85.1%), and Computers, Engineering & Science (78.4%), while the most female-oriented occupations are Legal Services & Support (100.0%), Education Instruction & Library (100.0%), and Community & Social Service (77.0%).
| Occupation | Male | Female |
| Management | 302 (85.1%) | 53 (14.9%) |
| Business & Financial | 57 (60.6%) | 37 (39.4%) |
| Computers, Engineering & Science | 40 (78.4%) | 11 (21.6%) |
| Computers & Mathematics | 28 (71.8%) | 11 (28.2%) |
| Architecture & Engineering | 12 (100.0%) | 0 (0.0%) |
| Life, Physical & Social Science | 0 (0.0%) | 0 (0.0%) |
| Community & Social Service | 52 (23.0%) | 174 (77.0%) |
| Education, Arts & Media | 7 (23.3%) | 23 (76.7%) |
| Legal Services & Support | 0 (0.0%) | 20 (100.0%) |
| Education Instruction & Library | 0 (0.0%) | 112 (100.0%) |
| Arts, Media & Entertainment | 45 (70.3%) | 19 (29.7%) |
| Health Diagnosing & Treating | 40 (25.3%) | 118 (74.7%) |
| Health Technologists | 40 (29.4%) | 96 (70.6%) |
| Total (Category) | 491 (55.5%) | 393 (44.5%) |
| Total (Overall) | 1,866 (56.2%) | 1,456 (43.8%) |
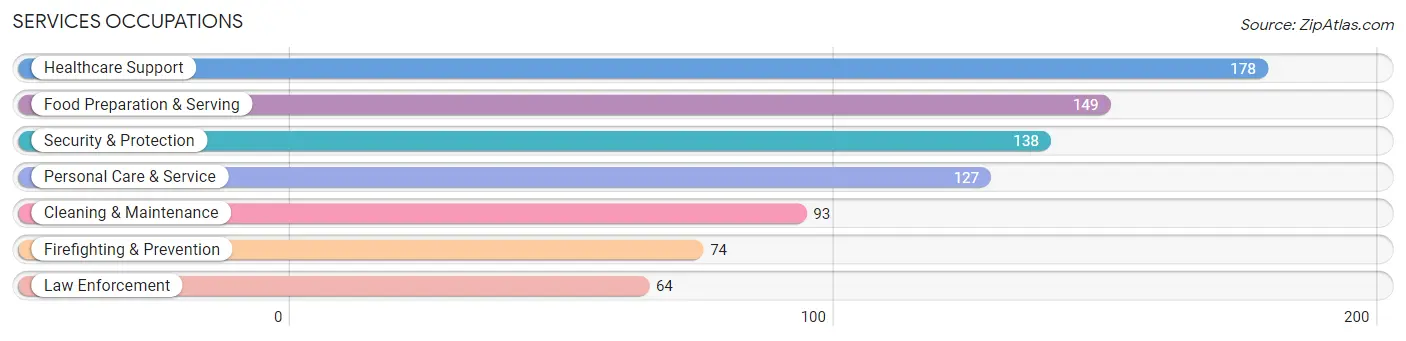
Services Occupations
The most common Services occupations in Dunlap are Healthcare Support (178 | 5.4%), Food Preparation & Serving (149 | 4.5%), Security & Protection (138 | 4.2%), Personal Care & Service (127 | 3.8%), and Cleaning & Maintenance (93 | 2.8%).
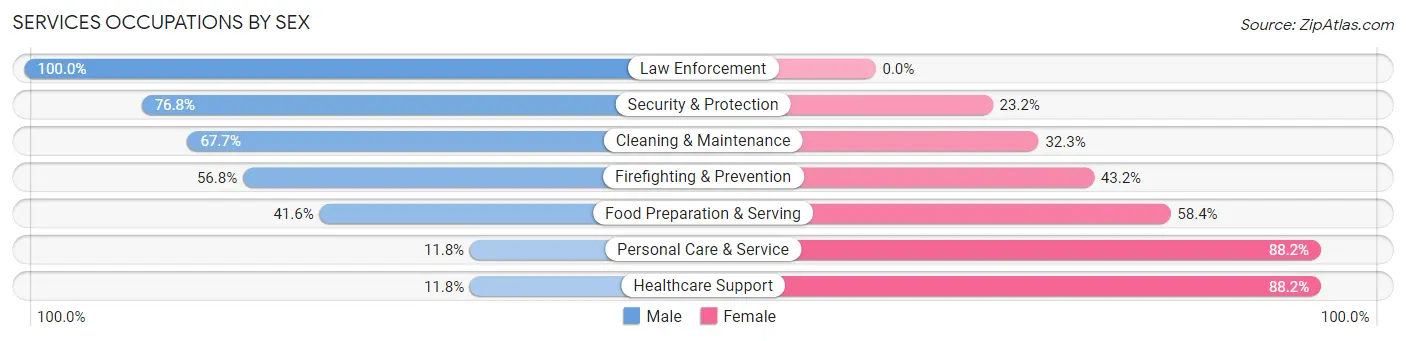
Services Occupations by Sex
Within the Services occupations in Dunlap, the most male-oriented occupations are Law Enforcement (100.0%), Security & Protection (76.8%), and Cleaning & Maintenance (67.7%), while the most female-oriented occupations are Healthcare Support (88.2%), Personal Care & Service (88.2%), and Food Preparation & Serving (58.4%).
| Occupation | Male | Female |
| Healthcare Support | 21 (11.8%) | 157 (88.2%) |
| Security & Protection | 106 (76.8%) | 32 (23.2%) |
| Firefighting & Prevention | 42 (56.8%) | 32 (43.2%) |
| Law Enforcement | 64 (100.0%) | 0 (0.0%) |
| Food Preparation & Serving | 62 (41.6%) | 87 (58.4%) |
| Cleaning & Maintenance | 63 (67.7%) | 30 (32.3%) |
| Personal Care & Service | 15 (11.8%) | 112 (88.2%) |
| Total (Category) | 267 (39.0%) | 418 (61.0%) |
| Total (Overall) | 1,866 (56.2%) | 1,456 (43.8%) |
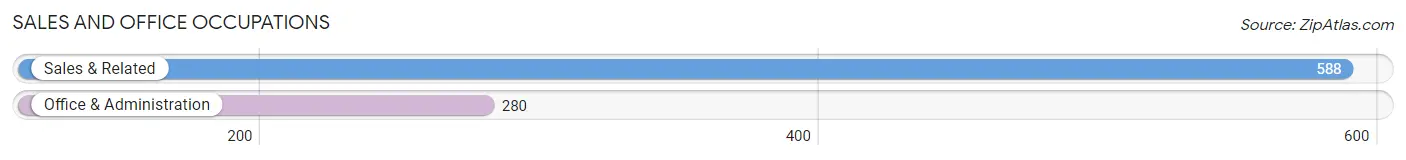
Sales and Office Occupations
The most common Sales and Office occupations in Dunlap are Sales & Related (588 | 17.7%), and Office & Administration (280 | 8.4%).
Sales and Office Occupations by Sex
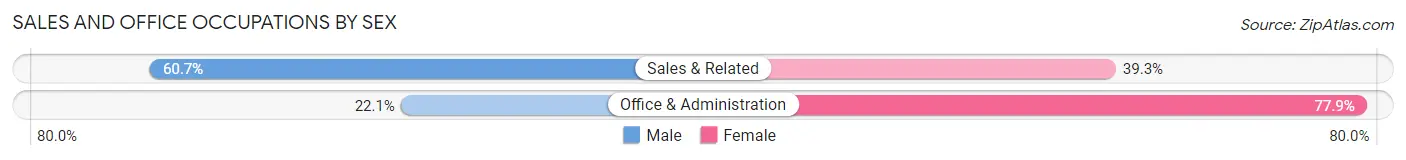
| Occupation | Male | Female |
| Sales & Related | 357 (60.7%) | 231 (39.3%) |
| Office & Administration | 62 (22.1%) | 218 (77.9%) |
| Total (Category) | 419 (48.3%) | 449 (51.7%) |
| Total (Overall) | 1,866 (56.2%) | 1,456 (43.8%) |
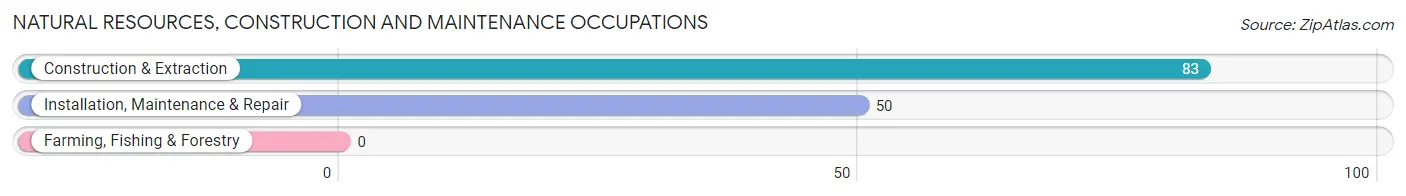
Natural Resources, Construction and Maintenance Occupations
The most common Natural Resources, Construction and Maintenance occupations in Dunlap are Construction & Extraction (83 | 2.5%), and Installation, Maintenance & Repair (50 | 1.5%).
Natural Resources, Construction and Maintenance Occupations by Sex
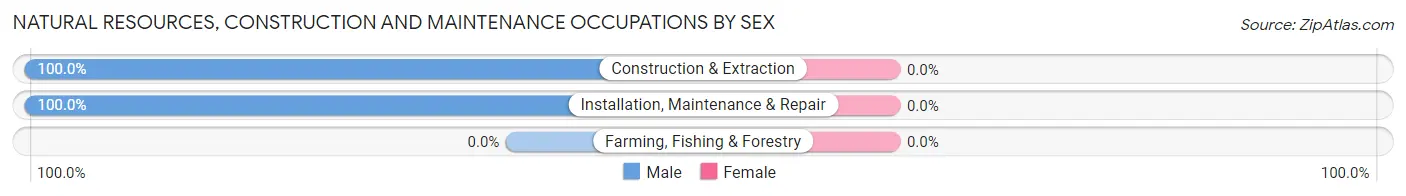
| Occupation | Male | Female |
| Farming, Fishing & Forestry | 0 (0.0%) | 0 (0.0%) |
| Construction & Extraction | 83 (100.0%) | 0 (0.0%) |
| Installation, Maintenance & Repair | 50 (100.0%) | 0 (0.0%) |
| Total (Category) | 133 (100.0%) | 0 (0.0%) |
| Total (Overall) | 1,866 (56.2%) | 1,456 (43.8%) |
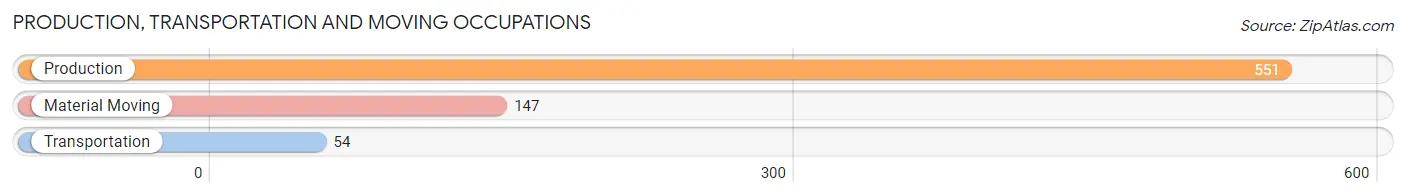
Production, Transportation and Moving Occupations
The most common Production, Transportation and Moving occupations in Dunlap are Production (551 | 16.6%), Material Moving (147 | 4.4%), and Transportation (54 | 1.6%).
Production, Transportation and Moving Occupations by Sex
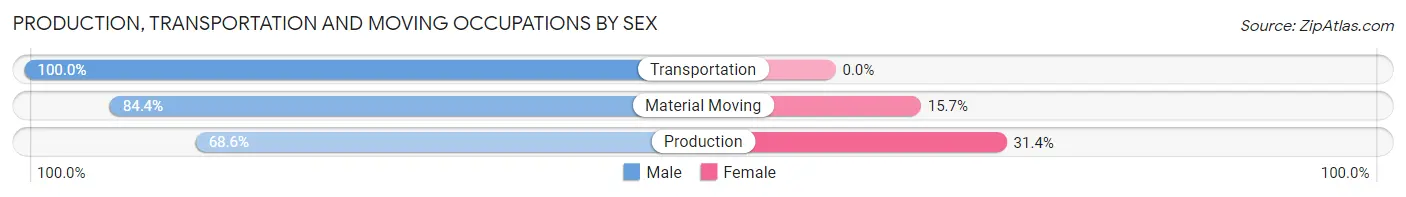
| Occupation | Male | Female |
| Production | 378 (68.6%) | 173 (31.4%) |
| Transportation | 54 (100.0%) | 0 (0.0%) |
| Material Moving | 124 (84.4%) | 23 (15.7%) |
| Total (Category) | 556 (73.9%) | 196 (26.1%) |
| Total (Overall) | 1,866 (56.2%) | 1,456 (43.8%) |
Employment Industries by Sex in Dunlap
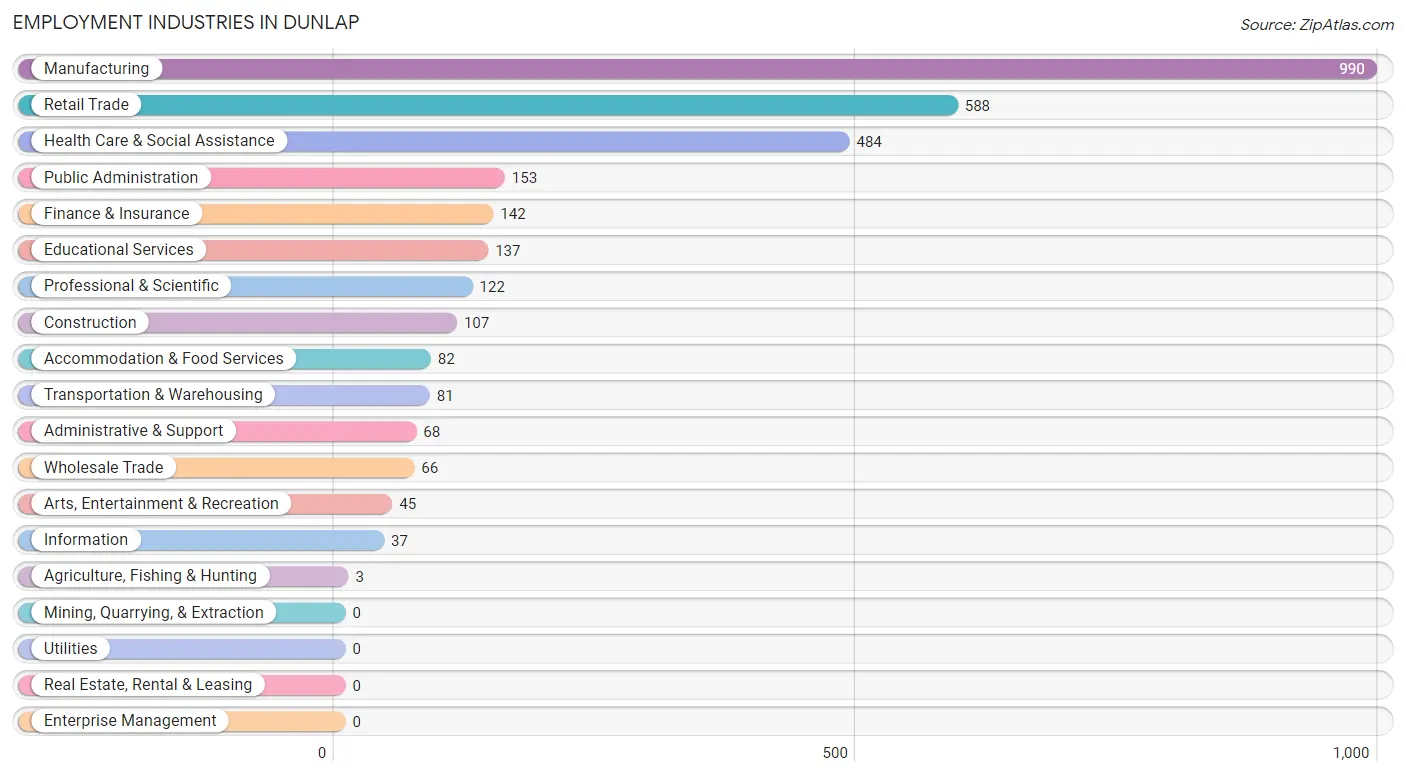
Employment Industries in Dunlap
The major employment industries in Dunlap include Manufacturing (990 | 29.8%), Retail Trade (588 | 17.7%), Health Care & Social Assistance (484 | 14.6%), Public Administration (153 | 4.6%), and Finance & Insurance (142 | 4.3%).
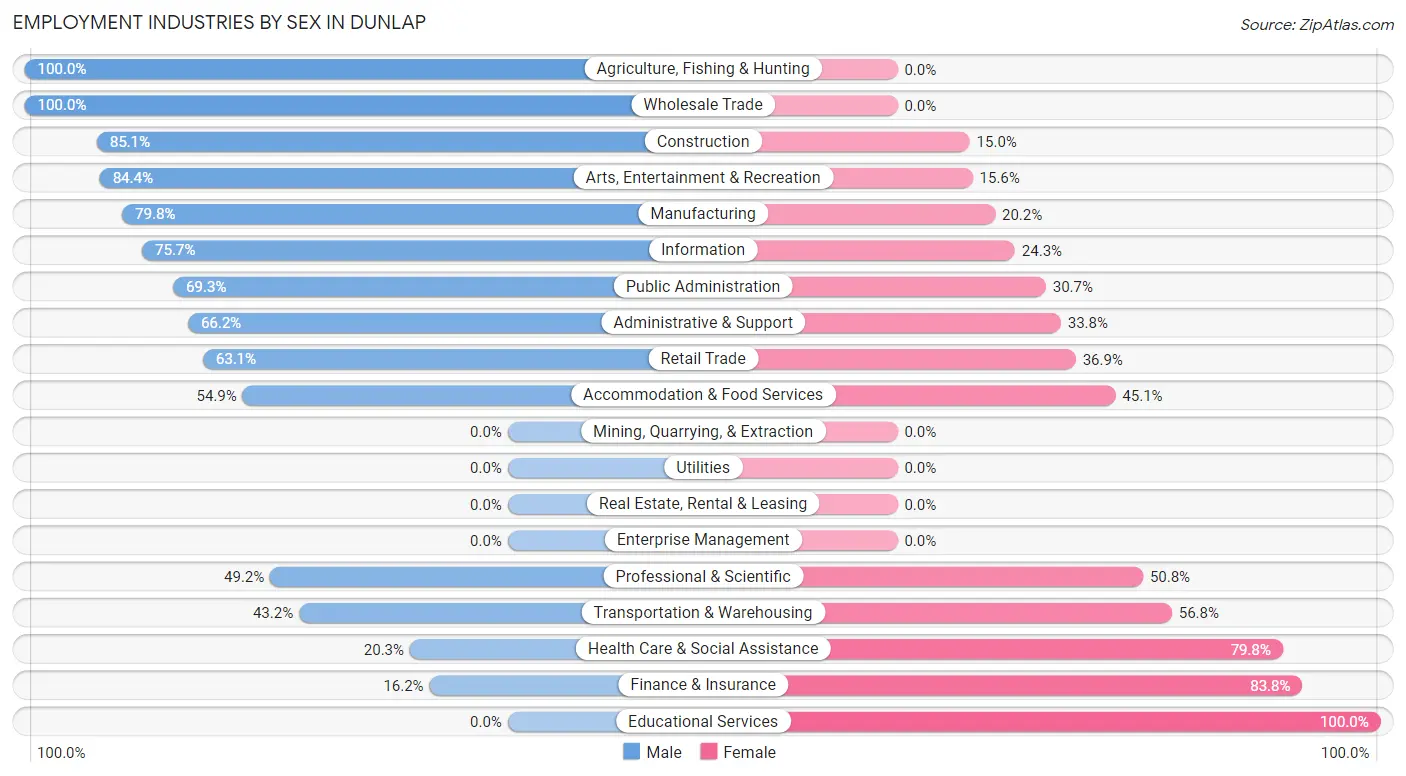
Employment Industries by Sex in Dunlap
The Dunlap industries that see more men than women are Agriculture, Fishing & Hunting (100.0%), Wholesale Trade (100.0%), and Construction (85.1%), whereas the industries that tend to have a higher number of women are Educational Services (100.0%), Finance & Insurance (83.8%), and Health Care & Social Assistance (79.7%).
| Industry | Male | Female |
| Agriculture, Fishing & Hunting | 3 (100.0%) | 0 (0.0%) |
| Mining, Quarrying, & Extraction | 0 (0.0%) | 0 (0.0%) |
| Construction | 91 (85.1%) | 16 (14.9%) |
| Manufacturing | 790 (79.8%) | 200 (20.2%) |
| Wholesale Trade | 66 (100.0%) | 0 (0.0%) |
| Retail Trade | 371 (63.1%) | 217 (36.9%) |
| Transportation & Warehousing | 35 (43.2%) | 46 (56.8%) |
| Utilities | 0 (0.0%) | 0 (0.0%) |
| Information | 28 (75.7%) | 9 (24.3%) |
| Finance & Insurance | 23 (16.2%) | 119 (83.8%) |
| Real Estate, Rental & Leasing | 0 (0.0%) | 0 (0.0%) |
| Professional & Scientific | 60 (49.2%) | 62 (50.8%) |
| Enterprise Management | 0 (0.0%) | 0 (0.0%) |
| Administrative & Support | 45 (66.2%) | 23 (33.8%) |
| Educational Services | 0 (0.0%) | 137 (100.0%) |
| Health Care & Social Assistance | 98 (20.3%) | 386 (79.7%) |
| Arts, Entertainment & Recreation | 38 (84.4%) | 7 (15.6%) |
| Accommodation & Food Services | 45 (54.9%) | 37 (45.1%) |
| Public Administration | 106 (69.3%) | 47 (30.7%) |
| Total | 1,866 (56.2%) | 1,456 (43.8%) |
Education in Dunlap
School Enrollment in Dunlap
The most common levels of schooling among the 1,577 students in Dunlap are high school (443 | 28.1%), middle school (333 | 21.1%), and elementary school (290 | 18.4%).
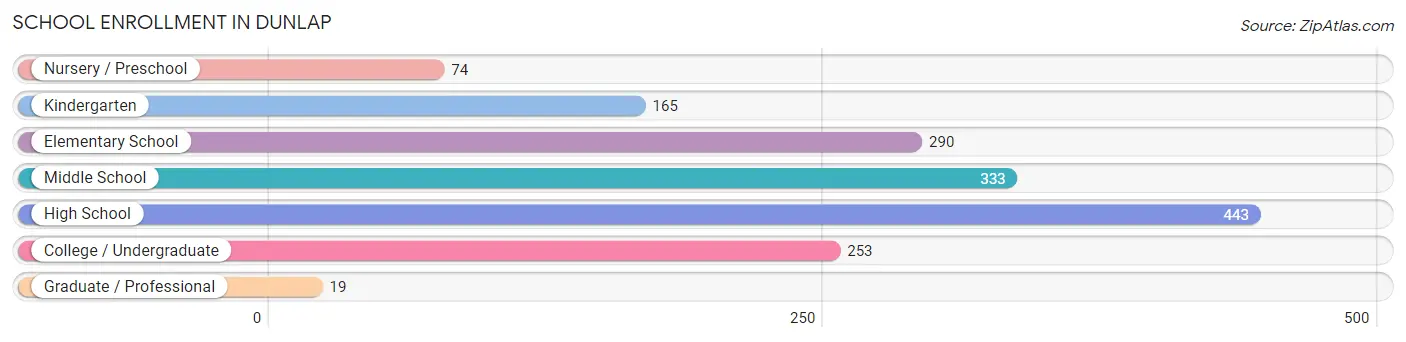
| School Level | # Students | % Students |
| Nursery / Preschool | 74 | 4.7% |
| Kindergarten | 165 | 10.5% |
| Elementary School | 290 | 18.4% |
| Middle School | 333 | 21.1% |
| High School | 443 | 28.1% |
| College / Undergraduate | 253 | 16.0% |
| Graduate / Professional | 19 | 1.2% |
| Total | 1,577 | 100.0% |
School Enrollment by Age by Funding Source in Dunlap
Out of a total of 1,577 students who are enrolled in schools in Dunlap, 214 (13.6%) attend a private institution, while the remaining 1,363 (86.4%) are enrolled in public schools. The age group of 3 to 4 year olds has the highest likelihood of being enrolled in private schools, with 31 (100.0% in the age bracket) enrolled. Conversely, the age group of 10 to 14 year olds has the lowest likelihood of being enrolled in a private school, with 378 (100.0% in the age bracket) attending a public institution.
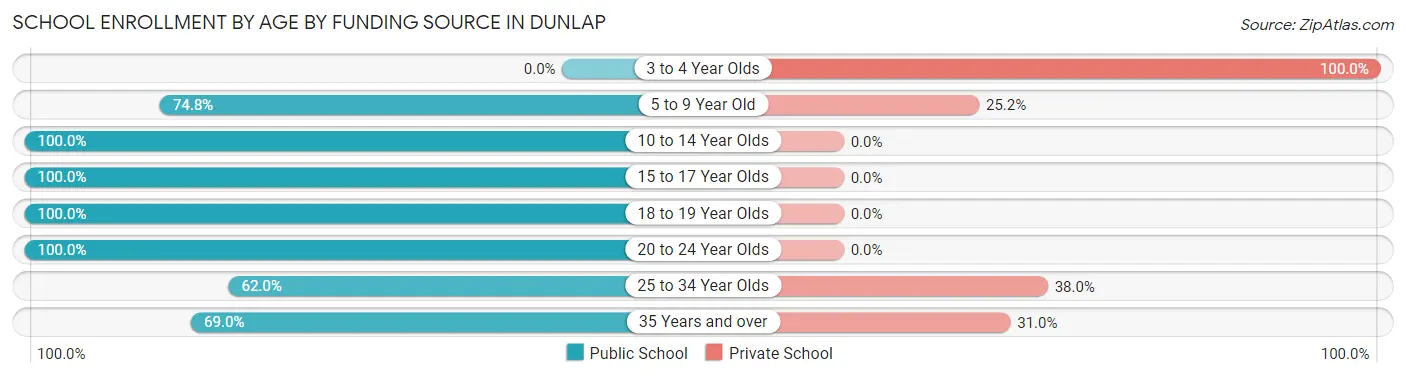
| Age Bracket | Public School | Private School |
| 3 to 4 Year Olds | 0 (0.0%) | 31 (100.0%) |
| 5 to 9 Year Old | 353 (74.8%) | 119 (25.2%) |
| 10 to 14 Year Olds | 378 (100.0%) | 0 (0.0%) |
| 15 to 17 Year Olds | 370 (100.0%) | 0 (0.0%) |
| 18 to 19 Year Olds | 24 (100.0%) | 0 (0.0%) |
| 20 to 24 Year Olds | 107 (100.0%) | 0 (0.0%) |
| 25 to 34 Year Olds | 31 (62.0%) | 19 (38.0%) |
| 35 Years and over | 100 (69.0%) | 45 (31.0%) |
| Total | 1,363 (86.4%) | 214 (13.6%) |
Educational Attainment by Field of Study in Dunlap
Education (365 | 37.7%), science & technology (142 | 14.7%), business (99 | 10.2%), arts & humanities (89 | 9.2%), and bio, nature & agricultural (88 | 9.1%) are the most common fields of study among 968 individuals in Dunlap who have obtained a bachelor's degree or higher.
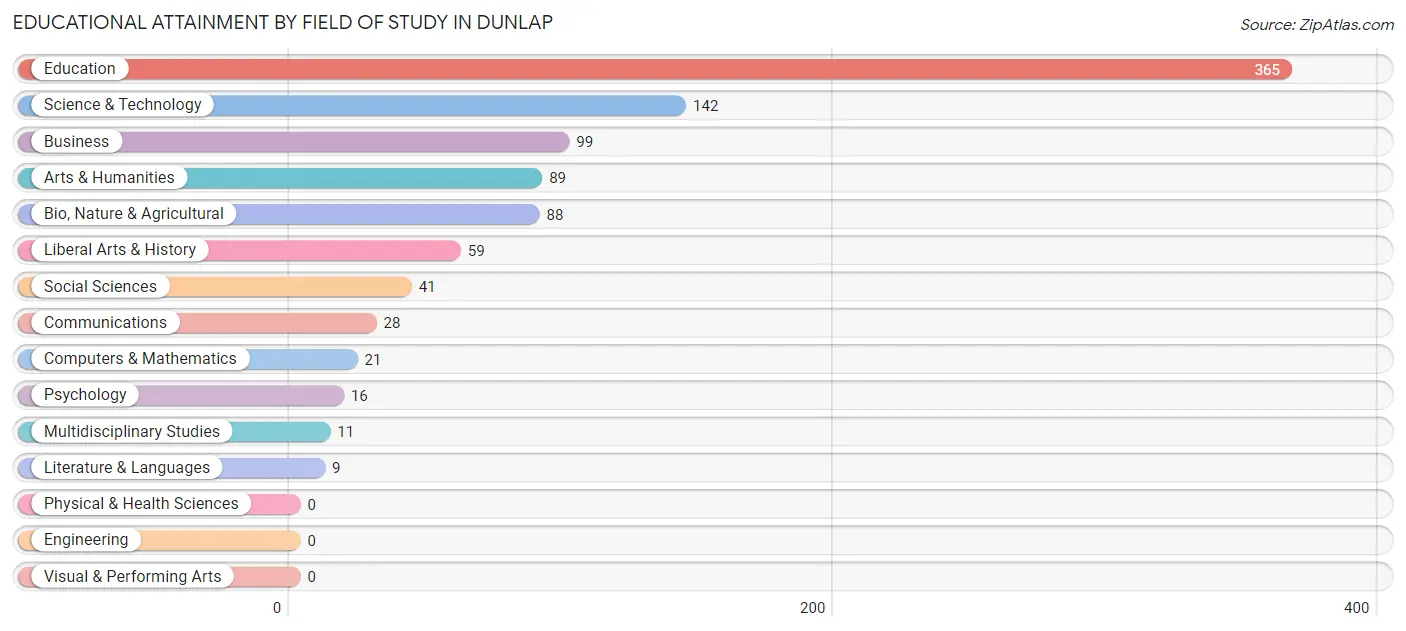
| Field of Study | # Graduates | % Graduates |
| Computers & Mathematics | 21 | 2.2% |
| Bio, Nature & Agricultural | 88 | 9.1% |
| Physical & Health Sciences | 0 | 0.0% |
| Psychology | 16 | 1.7% |
| Social Sciences | 41 | 4.2% |
| Engineering | 0 | 0.0% |
| Multidisciplinary Studies | 11 | 1.1% |
| Science & Technology | 142 | 14.7% |
| Business | 99 | 10.2% |
| Education | 365 | 37.7% |
| Literature & Languages | 9 | 0.9% |
| Liberal Arts & History | 59 | 6.1% |
| Visual & Performing Arts | 0 | 0.0% |
| Communications | 28 | 2.9% |
| Arts & Humanities | 89 | 9.2% |
| Total | 968 | 100.0% |
Transportation & Commute in Dunlap
Vehicle Availability by Sex in Dunlap
The most prevalent vehicle ownership categories in Dunlap are males with 2 vehicles (644, accounting for 37.1%) and females with 2 vehicles (608, making up 47.0%).
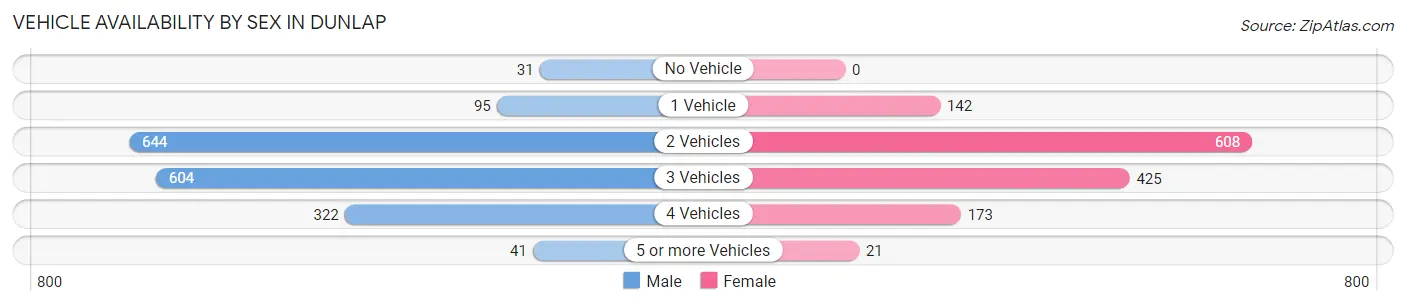
| Vehicles Available | Male | Female |
| No Vehicle | 31 (1.8%) | 0 (0.0%) |
| 1 Vehicle | 95 (5.5%) | 142 (10.4%) |
| 2 Vehicles | 644 (37.1%) | 608 (44.4%) |
| 3 Vehicles | 604 (34.8%) | 425 (31.0%) |
| 4 Vehicles | 322 (18.5%) | 173 (12.6%) |
| 5 or more Vehicles | 41 (2.4%) | 21 (1.5%) |
| Total | 1,737 (100.0%) | 1,369 (100.0%) |
Commute Time in Dunlap
The most frequently occuring commute durations in Dunlap are 15 to 19 minutes (505 commuters, 17.0%), 20 to 24 minutes (487 commuters, 16.4%), and 30 to 34 minutes (485 commuters, 16.3%).
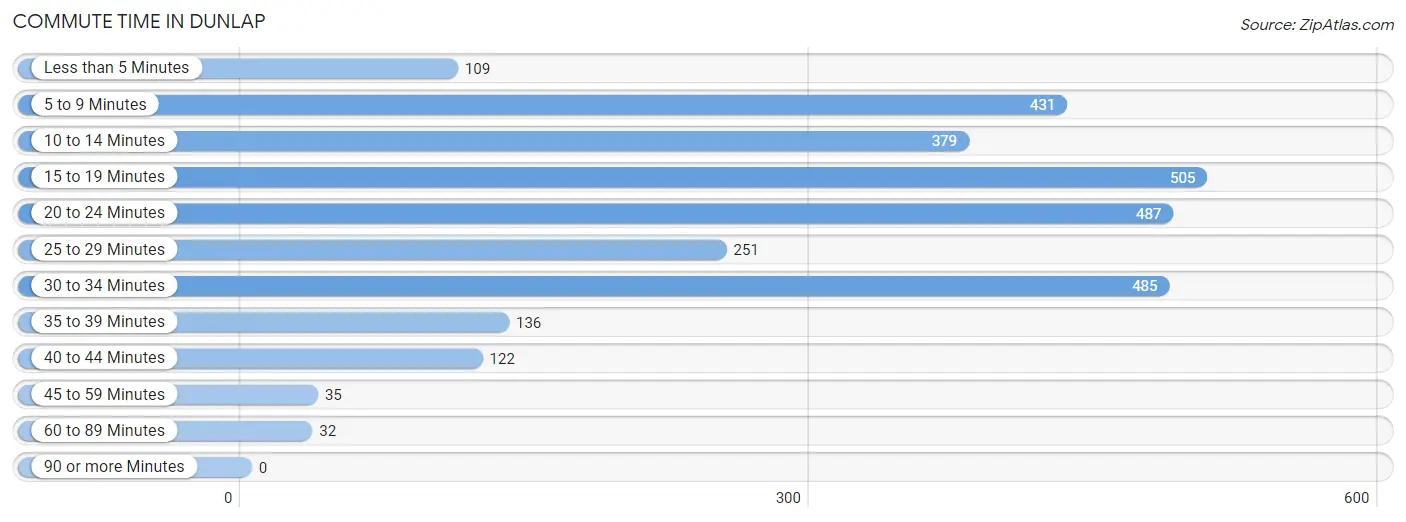
| Commute Time | # Commuters | % Commuters |
| Less than 5 Minutes | 109 | 3.7% |
| 5 to 9 Minutes | 431 | 14.5% |
| 10 to 14 Minutes | 379 | 12.8% |
| 15 to 19 Minutes | 505 | 17.0% |
| 20 to 24 Minutes | 487 | 16.4% |
| 25 to 29 Minutes | 251 | 8.5% |
| 30 to 34 Minutes | 485 | 16.3% |
| 35 to 39 Minutes | 136 | 4.6% |
| 40 to 44 Minutes | 122 | 4.1% |
| 45 to 59 Minutes | 35 | 1.2% |
| 60 to 89 Minutes | 32 | 1.1% |
| 90 or more Minutes | 0 | 0.0% |
Commute Time by Sex in Dunlap
The most common commute times in Dunlap are 30 to 34 minutes (406 commuters, 24.6%) for males and 15 to 19 minutes (300 commuters, 22.7%) for females.
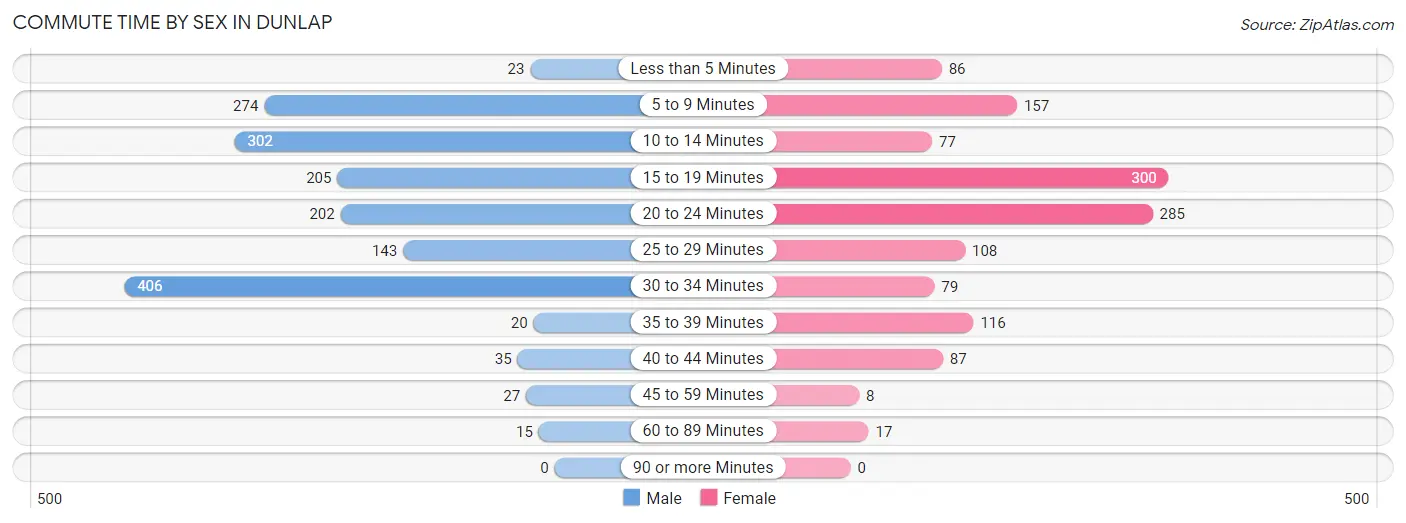
| Commute Time | Male | Female |
| Less than 5 Minutes | 23 (1.4%) | 86 (6.5%) |
| 5 to 9 Minutes | 274 (16.6%) | 157 (11.9%) |
| 10 to 14 Minutes | 302 (18.3%) | 77 (5.8%) |
| 15 to 19 Minutes | 205 (12.4%) | 300 (22.7%) |
| 20 to 24 Minutes | 202 (12.2%) | 285 (21.6%) |
| 25 to 29 Minutes | 143 (8.7%) | 108 (8.2%) |
| 30 to 34 Minutes | 406 (24.6%) | 79 (6.0%) |
| 35 to 39 Minutes | 20 (1.2%) | 116 (8.8%) |
| 40 to 44 Minutes | 35 (2.1%) | 87 (6.6%) |
| 45 to 59 Minutes | 27 (1.6%) | 8 (0.6%) |
| 60 to 89 Minutes | 15 (0.9%) | 17 (1.3%) |
| 90 or more Minutes | 0 (0.0%) | 0 (0.0%) |
Time of Departure to Work by Sex in Dunlap
The most frequent times of departure to work in Dunlap are 12:00 AM to 4:59 AM (345, 20.9%) for males and 7:30 AM to 7:59 AM (226, 17.1%) for females.
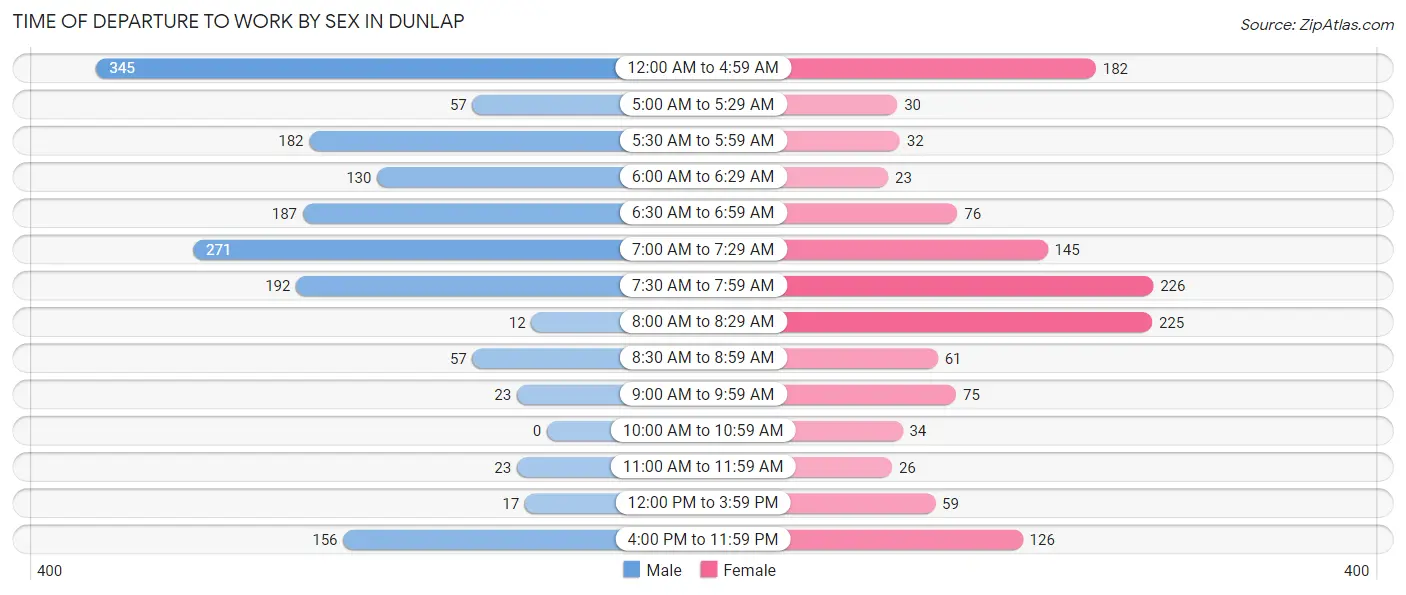
| Time of Departure | Male | Female |
| 12:00 AM to 4:59 AM | 345 (20.9%) | 182 (13.8%) |
| 5:00 AM to 5:29 AM | 57 (3.5%) | 30 (2.3%) |
| 5:30 AM to 5:59 AM | 182 (11.0%) | 32 (2.4%) |
| 6:00 AM to 6:29 AM | 130 (7.9%) | 23 (1.7%) |
| 6:30 AM to 6:59 AM | 187 (11.3%) | 76 (5.8%) |
| 7:00 AM to 7:29 AM | 271 (16.4%) | 145 (11.0%) |
| 7:30 AM to 7:59 AM | 192 (11.6%) | 226 (17.1%) |
| 8:00 AM to 8:29 AM | 12 (0.7%) | 225 (17.1%) |
| 8:30 AM to 8:59 AM | 57 (3.5%) | 61 (4.6%) |
| 9:00 AM to 9:59 AM | 23 (1.4%) | 75 (5.7%) |
| 10:00 AM to 10:59 AM | 0 (0.0%) | 34 (2.6%) |
| 11:00 AM to 11:59 AM | 23 (1.4%) | 26 (2.0%) |
| 12:00 PM to 3:59 PM | 17 (1.0%) | 59 (4.5%) |
| 4:00 PM to 11:59 PM | 156 (9.4%) | 126 (9.6%) |
| Total | 1,652 (100.0%) | 1,320 (100.0%) |
Housing Occupancy in Dunlap
Occupancy by Ownership in Dunlap
Of the total 2,058 dwellings in Dunlap, owner-occupied units account for 1,898 (92.2%), while renter-occupied units make up 160 (7.8%).
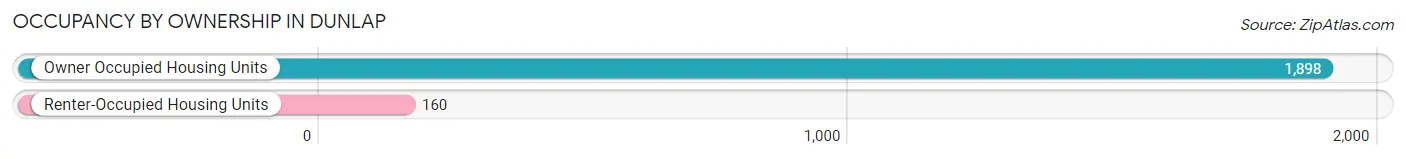
| Occupancy | # Housing Units | % Housing Units |
| Owner Occupied Housing Units | 1,898 | 92.2% |
| Renter-Occupied Housing Units | 160 | 7.8% |
| Total Occupied Housing Units | 2,058 | 100.0% |
Occupancy by Household Size in Dunlap
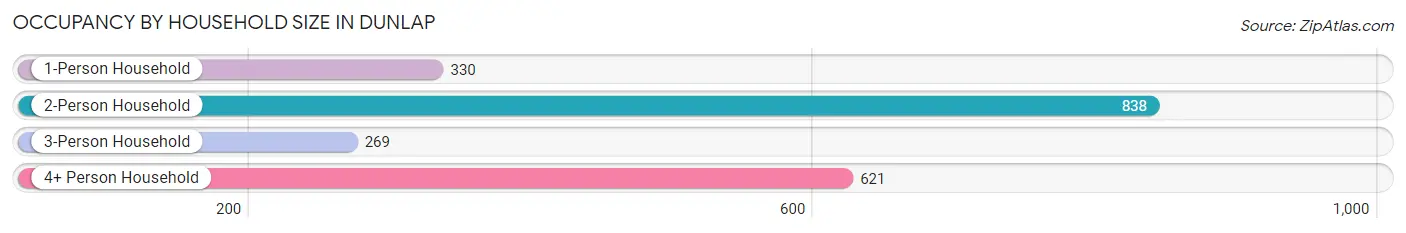
| Household Size | # Housing Units | % Housing Units |
| 1-Person Household | 330 | 16.0% |
| 2-Person Household | 838 | 40.7% |
| 3-Person Household | 269 | 13.1% |
| 4+ Person Household | 621 | 30.2% |
| Total Housing Units | 2,058 | 100.0% |
Occupancy by Ownership by Household Size in Dunlap
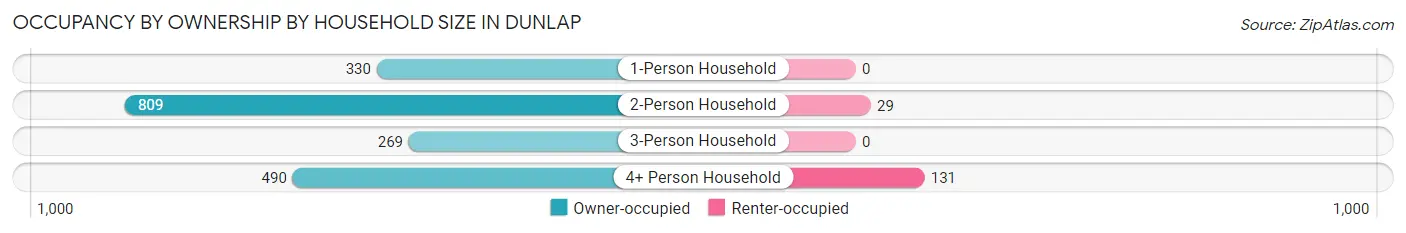
| Household Size | Owner-occupied | Renter-occupied |
| 1-Person Household | 330 (100.0%) | 0 (0.0%) |
| 2-Person Household | 809 (96.5%) | 29 (3.5%) |
| 3-Person Household | 269 (100.0%) | 0 (0.0%) |
| 4+ Person Household | 490 (78.9%) | 131 (21.1%) |
| Total Housing Units | 1,898 (92.2%) | 160 (7.8%) |
Occupancy by Educational Attainment in Dunlap
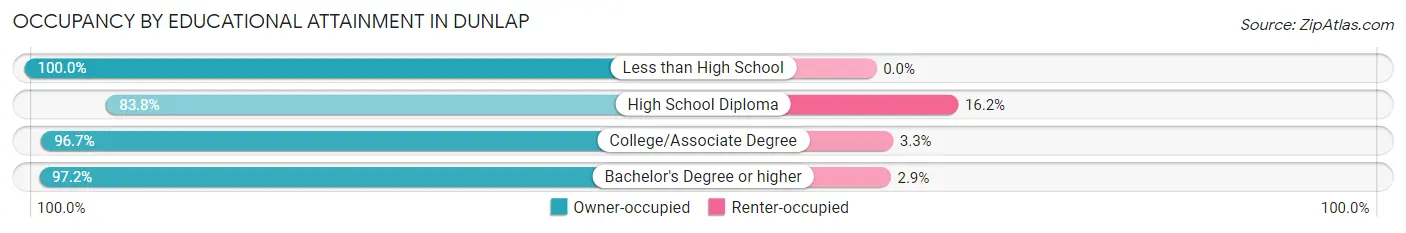
| Household Size | Owner-occupied | Renter-occupied |
| Less than High School | 151 (100.0%) | 0 (0.0%) |
| High School Diploma | 646 (83.8%) | 125 (16.2%) |
| College/Associate Degree | 556 (96.7%) | 19 (3.3%) |
| Bachelor's Degree or higher | 545 (97.2%) | 16 (2.9%) |
Occupancy by Age of Householder in Dunlap
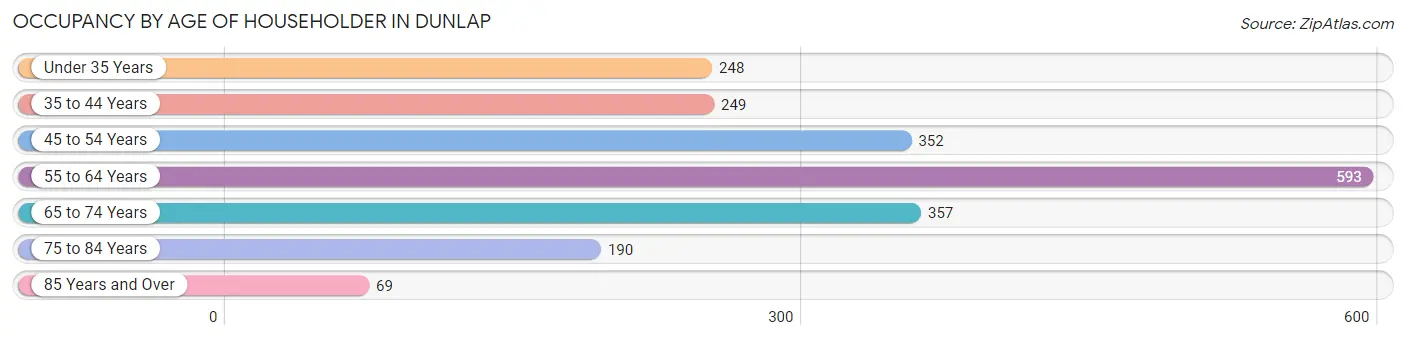
| Age Bracket | # Households | % Households |
| Under 35 Years | 248 | 12.0% |
| 35 to 44 Years | 249 | 12.1% |
| 45 to 54 Years | 352 | 17.1% |
| 55 to 64 Years | 593 | 28.8% |
| 65 to 74 Years | 357 | 17.3% |
| 75 to 84 Years | 190 | 9.2% |
| 85 Years and Over | 69 | 3.4% |
| Total | 2,058 | 100.0% |
Housing Finances in Dunlap
Median Income by Occupancy in Dunlap
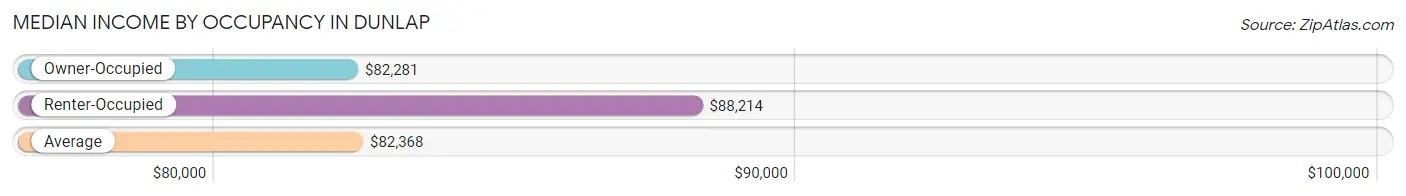
| Occupancy Type | # Households | Median Income |
| Owner-Occupied | 1,898 (92.2%) | $82,281 |
| Renter-Occupied | 160 (7.8%) | $88,214 |
| Average | 2,058 (100.0%) | $82,368 |
Occupancy by Householder Income Bracket in Dunlap
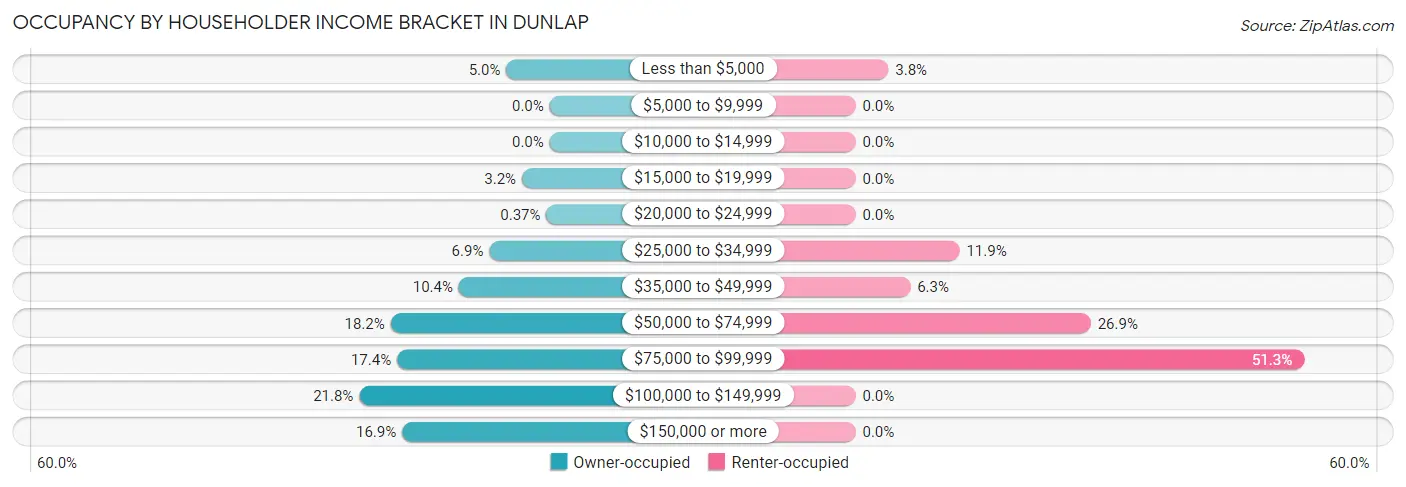
| Income Bracket | Owner-occupied | Renter-occupied |
| Less than $5,000 | 94 (5.0%) | 6 (3.7%) |
| $5,000 to $9,999 | 0 (0.0%) | 0 (0.0%) |
| $10,000 to $14,999 | 0 (0.0%) | 0 (0.0%) |
| $15,000 to $19,999 | 60 (3.2%) | 0 (0.0%) |
| $20,000 to $24,999 | 7 (0.4%) | 0 (0.0%) |
| $25,000 to $34,999 | 131 (6.9%) | 19 (11.9%) |
| $35,000 to $49,999 | 197 (10.4%) | 10 (6.2%) |
| $50,000 to $74,999 | 345 (18.2%) | 43 (26.9%) |
| $75,000 to $99,999 | 331 (17.4%) | 82 (51.2%) |
| $100,000 to $149,999 | 413 (21.8%) | 0 (0.0%) |
| $150,000 or more | 320 (16.9%) | 0 (0.0%) |
| Total | 1,898 (100.0%) | 160 (100.0%) |
Monthly Housing Cost Tiers in Dunlap
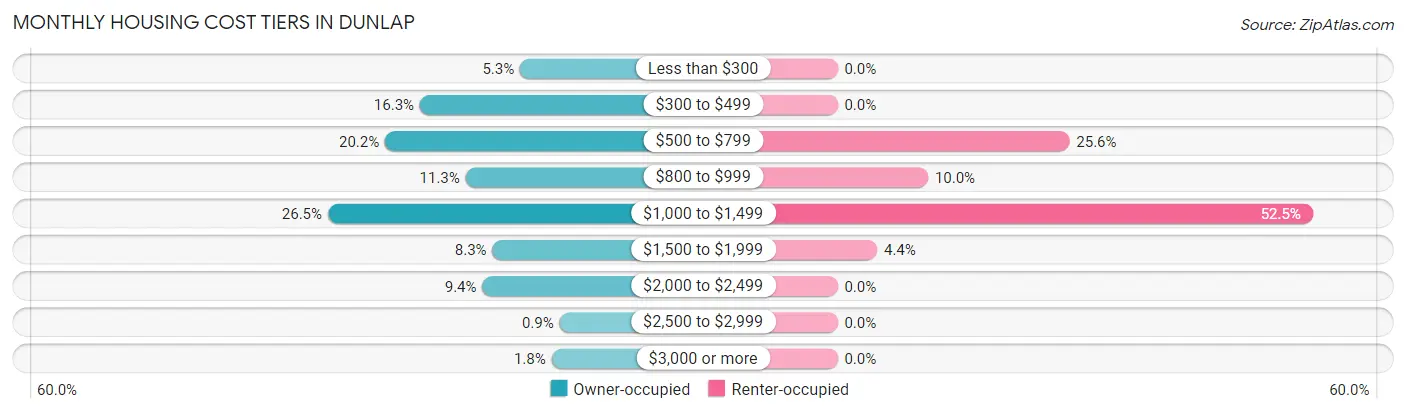
| Monthly Cost | Owner-occupied | Renter-occupied |
| Less than $300 | 100 (5.3%) | 0 (0.0%) |
| $300 to $499 | 310 (16.3%) | 0 (0.0%) |
| $500 to $799 | 383 (20.2%) | 41 (25.6%) |
| $800 to $999 | 214 (11.3%) | 16 (10.0%) |
| $1,000 to $1,499 | 503 (26.5%) | 84 (52.5%) |
| $1,500 to $1,999 | 158 (8.3%) | 7 (4.4%) |
| $2,000 to $2,499 | 179 (9.4%) | 0 (0.0%) |
| $2,500 to $2,999 | 17 (0.9%) | 0 (0.0%) |
| $3,000 or more | 34 (1.8%) | 0 (0.0%) |
| Total | 1,898 (100.0%) | 160 (100.0%) |
Physical Housing Characteristics in Dunlap
Housing Structures in Dunlap
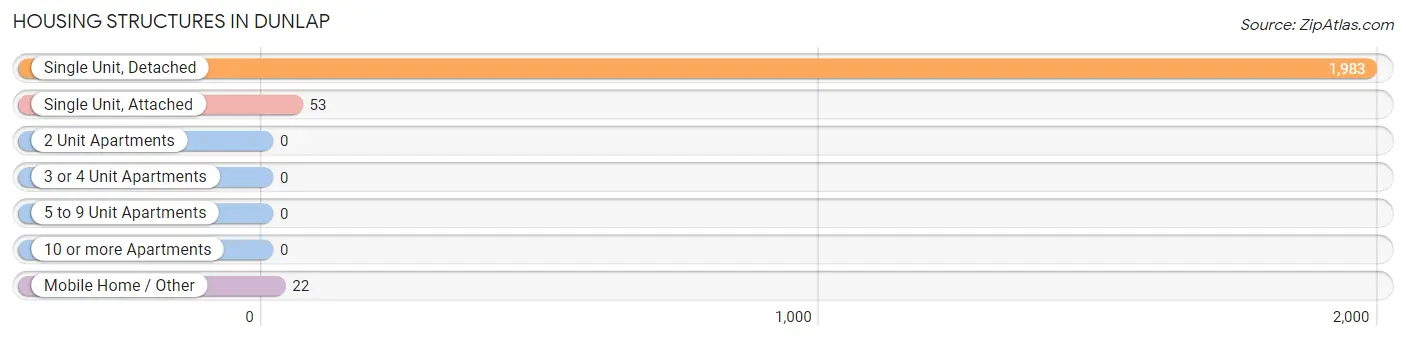
| Structure Type | # Housing Units | % Housing Units |
| Single Unit, Detached | 1,983 | 96.4% |
| Single Unit, Attached | 53 | 2.6% |
| 2 Unit Apartments | 0 | 0.0% |
| 3 or 4 Unit Apartments | 0 | 0.0% |
| 5 to 9 Unit Apartments | 0 | 0.0% |
| 10 or more Apartments | 0 | 0.0% |
| Mobile Home / Other | 22 | 1.1% |
| Total | 2,058 | 100.0% |
Housing Structures by Occupancy in Dunlap
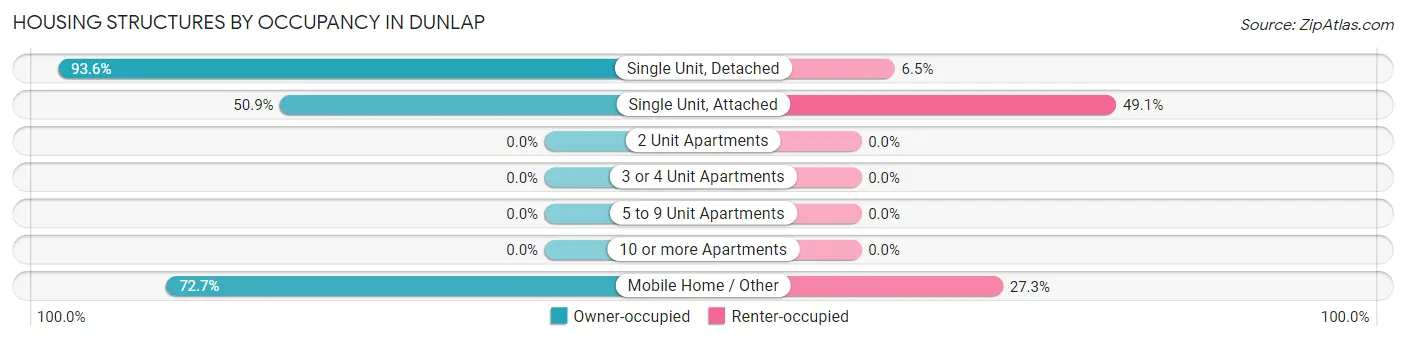
| Structure Type | Owner-occupied | Renter-occupied |
| Single Unit, Detached | 1,855 (93.5%) | 128 (6.5%) |
| Single Unit, Attached | 27 (50.9%) | 26 (49.1%) |
| 2 Unit Apartments | 0 (0.0%) | 0 (0.0%) |
| 3 or 4 Unit Apartments | 0 (0.0%) | 0 (0.0%) |
| 5 to 9 Unit Apartments | 0 (0.0%) | 0 (0.0%) |
| 10 or more Apartments | 0 (0.0%) | 0 (0.0%) |
| Mobile Home / Other | 16 (72.7%) | 6 (27.3%) |
| Total | 1,898 (92.2%) | 160 (7.8%) |
Housing Structures by Number of Rooms in Dunlap
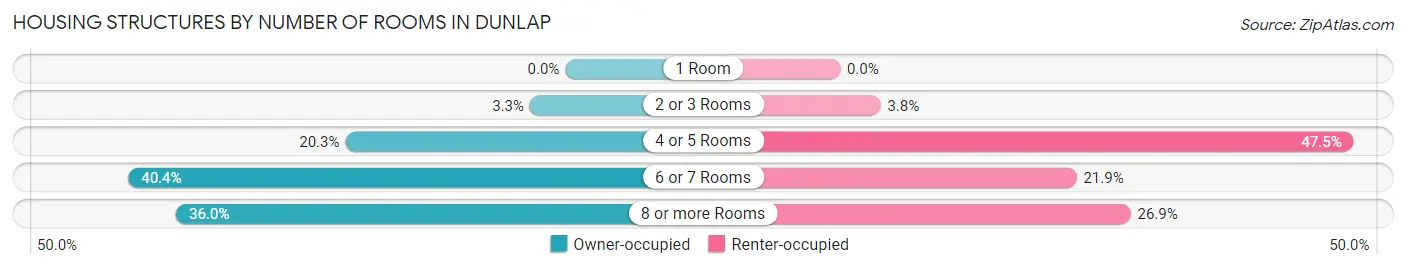
| Number of Rooms | Owner-occupied | Renter-occupied |
| 1 Room | 0 (0.0%) | 0 (0.0%) |
| 2 or 3 Rooms | 62 (3.3%) | 6 (3.7%) |
| 4 or 5 Rooms | 386 (20.3%) | 76 (47.5%) |
| 6 or 7 Rooms | 767 (40.4%) | 35 (21.9%) |
| 8 or more Rooms | 683 (36.0%) | 43 (26.9%) |
| Total | 1,898 (100.0%) | 160 (100.0%) |
Housing Structure by Heating Type in Dunlap
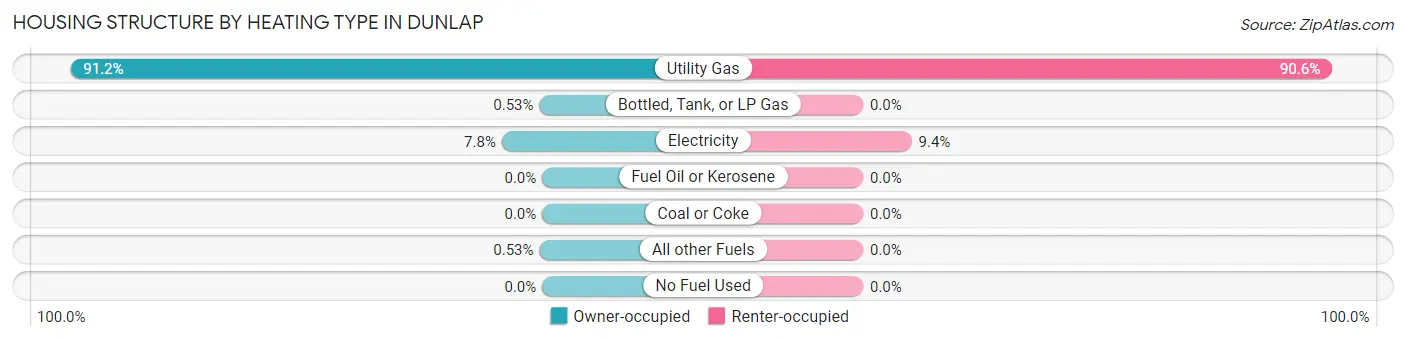
| Heating Type | Owner-occupied | Renter-occupied |
| Utility Gas | 1,730 (91.1%) | 145 (90.6%) |
| Bottled, Tank, or LP Gas | 10 (0.5%) | 0 (0.0%) |
| Electricity | 148 (7.8%) | 15 (9.4%) |
| Fuel Oil or Kerosene | 0 (0.0%) | 0 (0.0%) |
| Coal or Coke | 0 (0.0%) | 0 (0.0%) |
| All other Fuels | 10 (0.5%) | 0 (0.0%) |
| No Fuel Used | 0 (0.0%) | 0 (0.0%) |
| Total | 1,898 (100.0%) | 160 (100.0%) |
Household Vehicle Usage in Dunlap
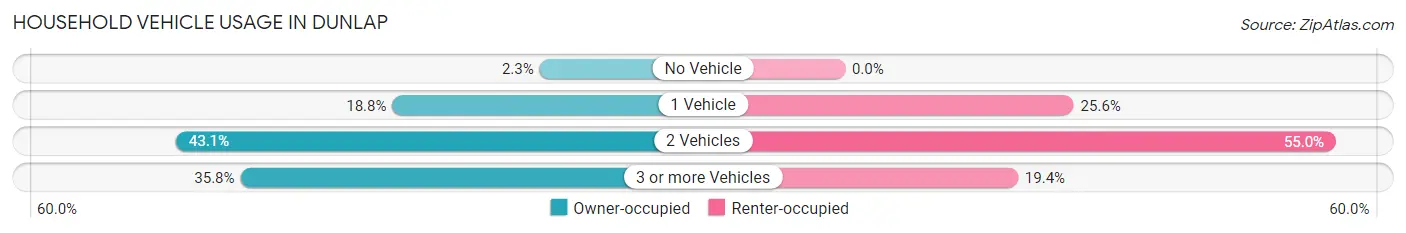
| Vehicles per Household | Owner-occupied | Renter-occupied |
| No Vehicle | 44 (2.3%) | 0 (0.0%) |
| 1 Vehicle | 357 (18.8%) | 41 (25.6%) |
| 2 Vehicles | 817 (43.0%) | 88 (55.0%) |
| 3 or more Vehicles | 680 (35.8%) | 31 (19.4%) |
| Total | 1,898 (100.0%) | 160 (100.0%) |
Real Estate & Mortgages in Dunlap
Real Estate and Mortgage Overview in Dunlap
| Characteristic | Without Mortgage | With Mortgage |
| Housing Units | 719 | 1,179 |
| Median Property Value | $199,200 | $187,900 |
| Median Household Income | $70,972 | $155 |
| Monthly Housing Costs | $481 | $34 |
| Real Estate Taxes | $1,992 | $37 |
Property Value by Mortgage Status in Dunlap
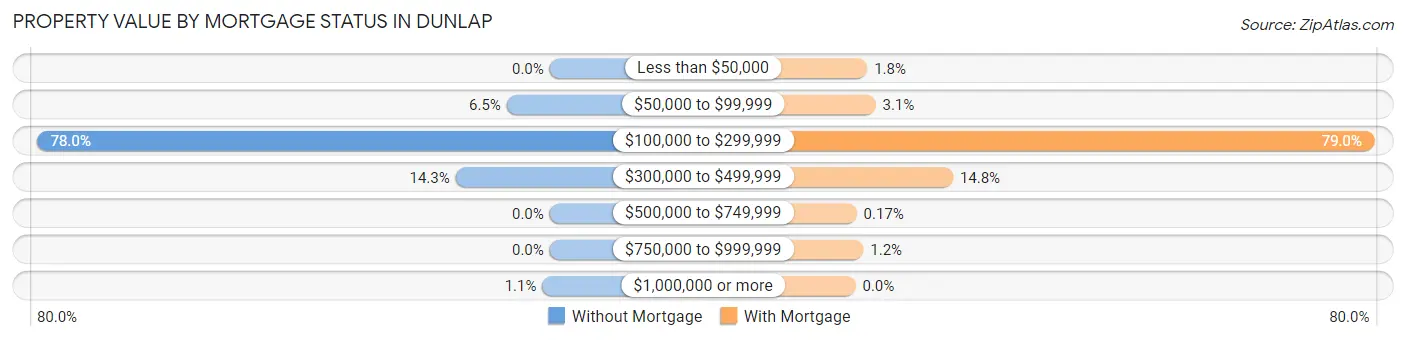
| Property Value | Without Mortgage | With Mortgage |
| Less than $50,000 | 0 (0.0%) | 21 (1.8%) |
| $50,000 to $99,999 | 47 (6.5%) | 36 (3.0%) |
| $100,000 to $299,999 | 561 (78.0%) | 931 (79.0%) |
| $300,000 to $499,999 | 103 (14.3%) | 175 (14.8%) |
| $500,000 to $749,999 | 0 (0.0%) | 2 (0.2%) |
| $750,000 to $999,999 | 0 (0.0%) | 14 (1.2%) |
| $1,000,000 or more | 8 (1.1%) | 0 (0.0%) |
| Total | 719 (100.0%) | 1,179 (100.0%) |
Household Income by Mortgage Status in Dunlap
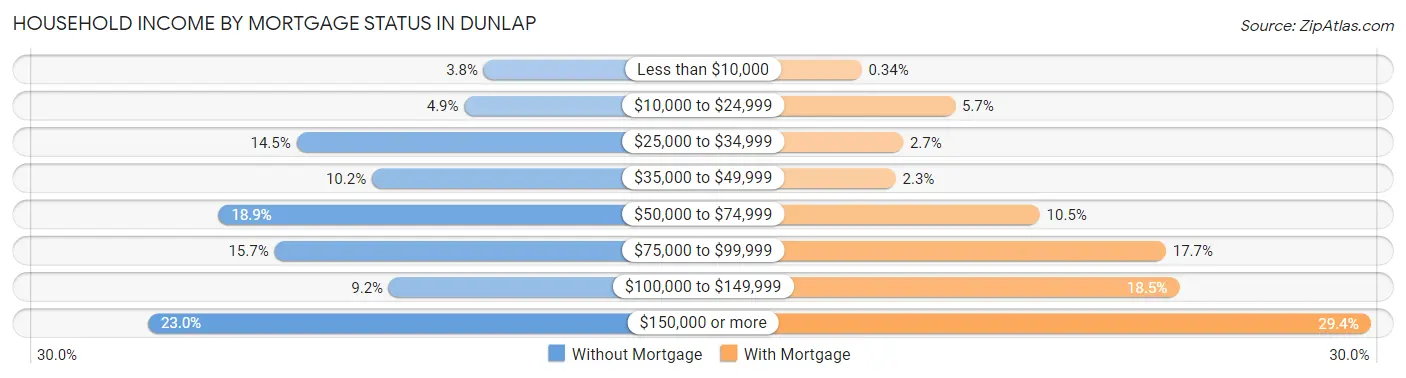
| Household Income | Without Mortgage | With Mortgage |
| Less than $10,000 | 27 (3.8%) | 4 (0.3%) |
| $10,000 to $24,999 | 35 (4.9%) | 67 (5.7%) |
| $25,000 to $34,999 | 104 (14.5%) | 32 (2.7%) |
| $35,000 to $49,999 | 73 (10.2%) | 27 (2.3%) |
| $50,000 to $74,999 | 136 (18.9%) | 124 (10.5%) |
| $75,000 to $99,999 | 113 (15.7%) | 209 (17.7%) |
| $100,000 to $149,999 | 66 (9.2%) | 218 (18.5%) |
| $150,000 or more | 165 (23.0%) | 347 (29.4%) |
| Total | 719 (100.0%) | 1,179 (100.0%) |
Property Value to Household Income Ratio in Dunlap
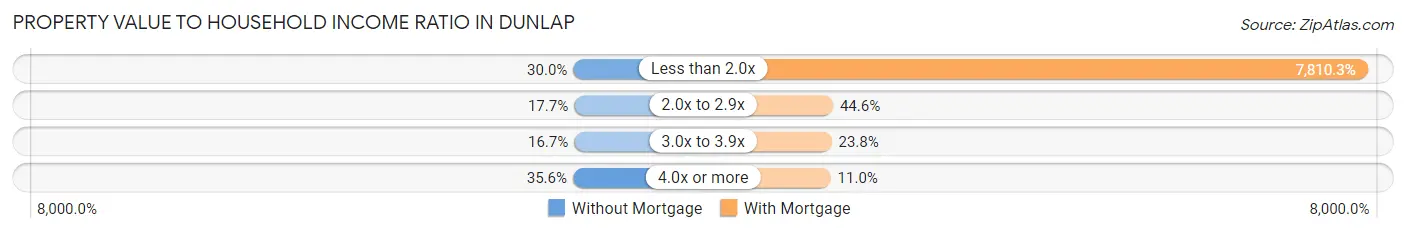
| Value-to-Income Ratio | Without Mortgage | With Mortgage |
| Less than 2.0x | 216 (30.0%) | 92,083 (7,810.3%) |
| 2.0x to 2.9x | 127 (17.7%) | 526 (44.6%) |
| 3.0x to 3.9x | 120 (16.7%) | 281 (23.8%) |
| 4.0x or more | 256 (35.6%) | 130 (11.0%) |
| Total | 719 (100.0%) | 1,179 (100.0%) |
Real Estate Taxes by Mortgage Status in Dunlap
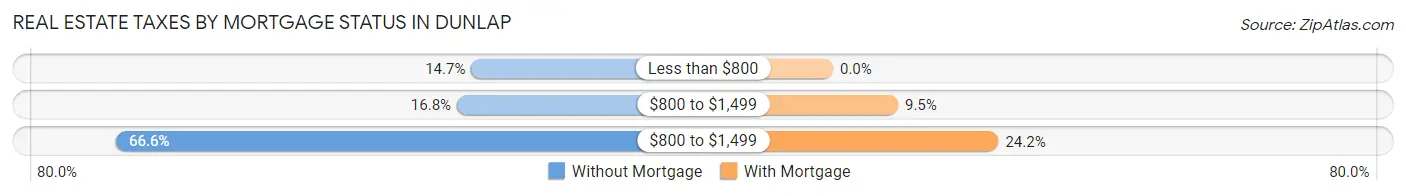
| Property Taxes | Without Mortgage | With Mortgage |
| Less than $800 | 106 (14.7%) | 0 (0.0%) |
| $800 to $1,499 | 121 (16.8%) | 112 (9.5%) |
| $800 to $1,499 | 479 (66.6%) | 285 (24.2%) |
| Total | 719 (100.0%) | 1,179 (100.0%) |
Health & Disability in Dunlap
Health Insurance Coverage by Age in Dunlap
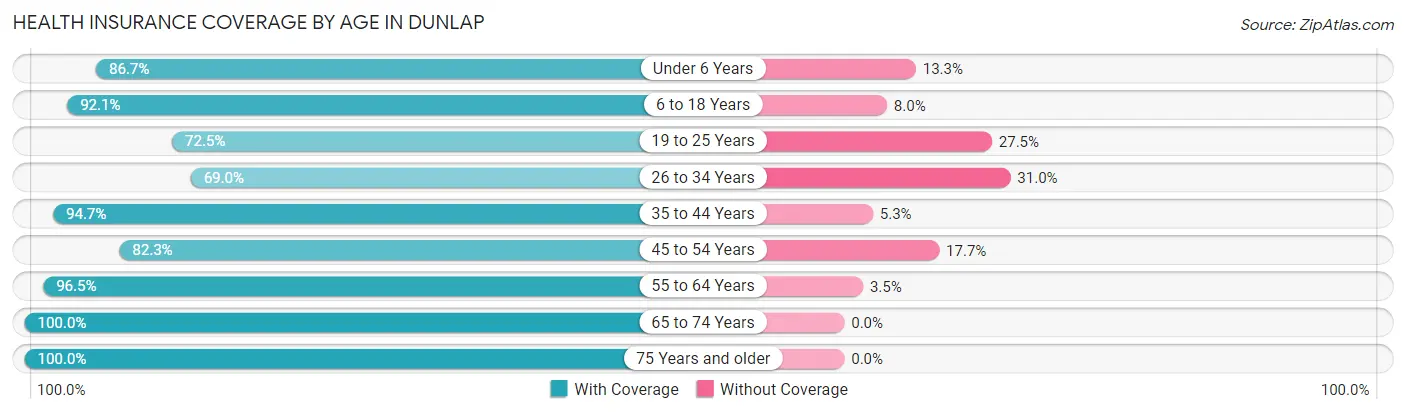
| Age Bracket | With Coverage | Without Coverage |
| Under 6 Years | 637 (86.7%) | 98 (13.3%) |
| 6 to 18 Years | 972 (92.0%) | 84 (8.0%) |
| 19 to 25 Years | 511 (72.5%) | 194 (27.5%) |
| 26 to 34 Years | 548 (69.0%) | 246 (31.0%) |
| 35 to 44 Years | 623 (94.7%) | 35 (5.3%) |
| 45 to 54 Years | 628 (82.3%) | 135 (17.7%) |
| 55 to 64 Years | 916 (96.5%) | 33 (3.5%) |
| 65 to 74 Years | 624 (100.0%) | 0 (0.0%) |
| 75 Years and older | 515 (100.0%) | 0 (0.0%) |
| Total | 5,974 (87.9%) | 825 (12.1%) |
Health Insurance Coverage by Citizenship Status in Dunlap
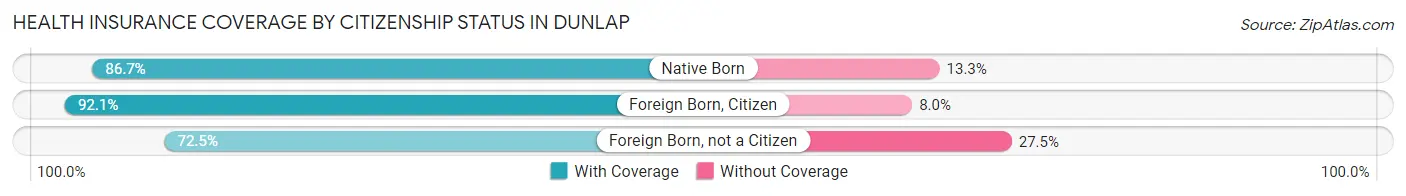
| Citizenship Status | With Coverage | Without Coverage |
| Native Born | 637 (86.7%) | 98 (13.3%) |
| Foreign Born, Citizen | 972 (92.0%) | 84 (8.0%) |
| Foreign Born, not a Citizen | 511 (72.5%) | 194 (27.5%) |
Health Insurance Coverage by Household Income in Dunlap
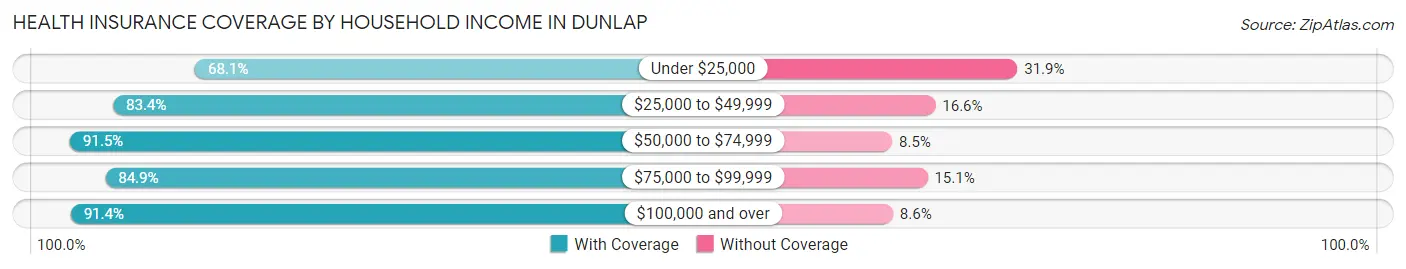
| Household Income | With Coverage | Without Coverage |
| Under $25,000 | 228 (68.1%) | 107 (31.9%) |
| $25,000 to $49,999 | 518 (83.4%) | 103 (16.6%) |
| $50,000 to $74,999 | 1,132 (91.5%) | 105 (8.5%) |
| $75,000 to $99,999 | 1,471 (84.9%) | 262 (15.1%) |
| $100,000 and over | 2,624 (91.4%) | 248 (8.6%) |
Public vs Private Health Insurance Coverage by Age in Dunlap
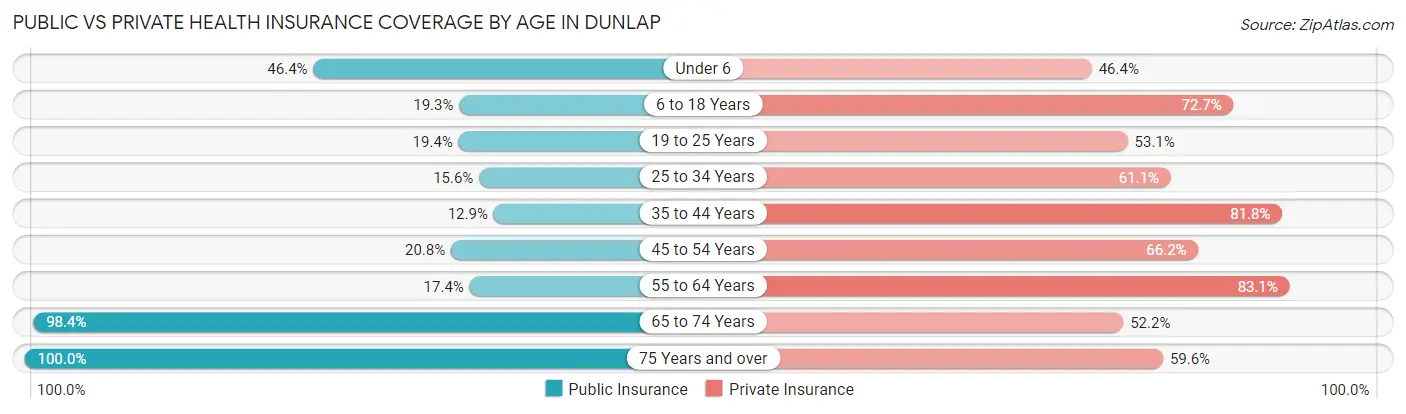
| Age Bracket | Public Insurance | Private Insurance |
| Under 6 | 341 (46.4%) | 341 (46.4%) |
| 6 to 18 Years | 204 (19.3%) | 768 (72.7%) |
| 19 to 25 Years | 137 (19.4%) | 374 (53.0%) |
| 25 to 34 Years | 124 (15.6%) | 485 (61.1%) |
| 35 to 44 Years | 85 (12.9%) | 538 (81.8%) |
| 45 to 54 Years | 159 (20.8%) | 505 (66.2%) |
| 55 to 64 Years | 165 (17.4%) | 789 (83.1%) |
| 65 to 74 Years | 614 (98.4%) | 326 (52.2%) |
| 75 Years and over | 515 (100.0%) | 307 (59.6%) |
| Total | 2,344 (34.5%) | 4,433 (65.2%) |
Disability Status by Sex by Age in Dunlap
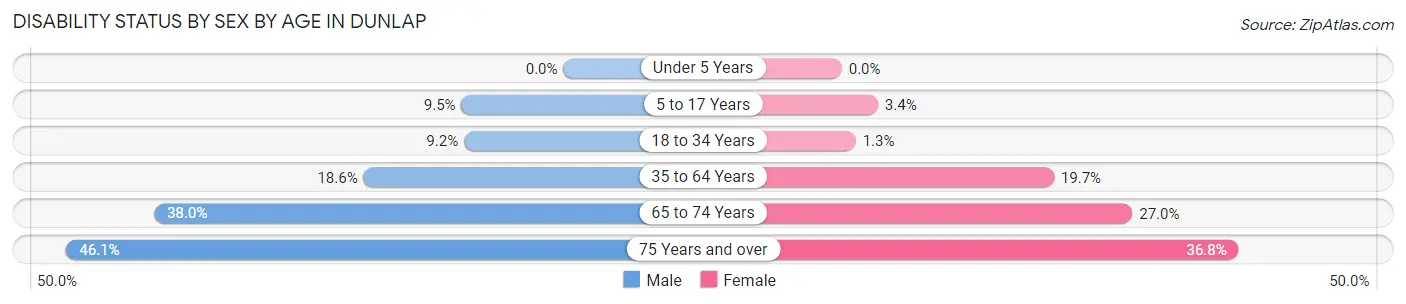
| Age Bracket | Male | Female |
| Under 5 Years | 0 (0.0%) | 0 (0.0%) |
| 5 to 17 Years | 54 (9.5%) | 22 (3.4%) |
| 18 to 34 Years | 74 (9.2%) | 9 (1.3%) |
| 35 to 64 Years | 223 (18.5%) | 230 (19.7%) |
| 65 to 74 Years | 106 (38.0%) | 93 (27.0%) |
| 75 Years and over | 101 (46.1%) | 109 (36.8%) |
Disability Class by Sex by Age in Dunlap
Disability Class: Hearing Difficulty
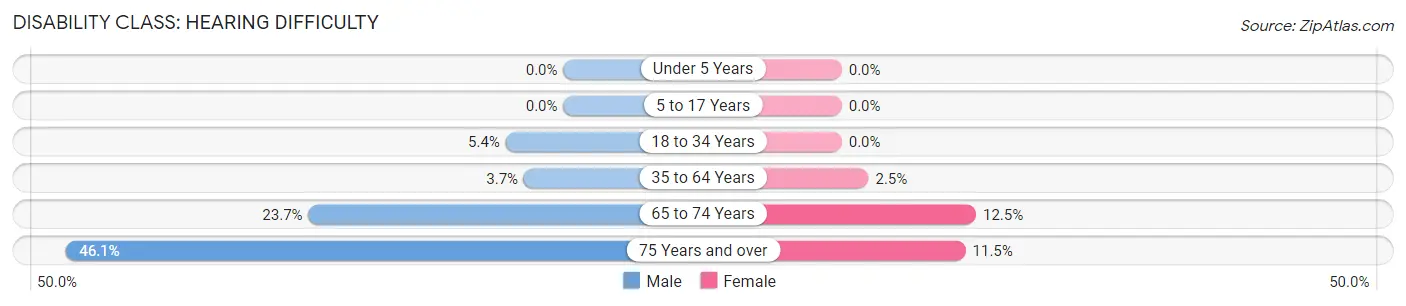
| Age Bracket | Male | Female |
| Under 5 Years | 0 (0.0%) | 0 (0.0%) |
| 5 to 17 Years | 0 (0.0%) | 0 (0.0%) |
| 18 to 34 Years | 43 (5.3%) | 0 (0.0%) |
| 35 to 64 Years | 44 (3.7%) | 29 (2.5%) |
| 65 to 74 Years | 66 (23.7%) | 43 (12.5%) |
| 75 Years and over | 101 (46.1%) | 34 (11.5%) |
Disability Class: Vision Difficulty
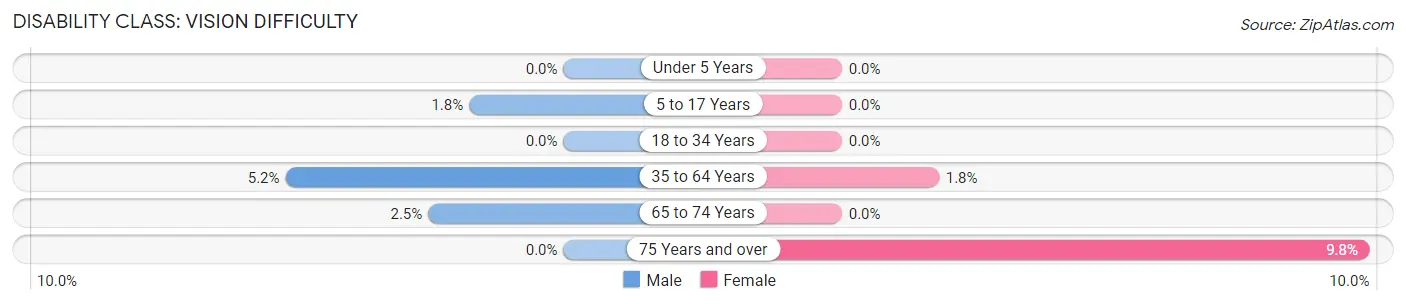
| Age Bracket | Male | Female |
| Under 5 Years | 0 (0.0%) | 0 (0.0%) |
| 5 to 17 Years | 10 (1.8%) | 0 (0.0%) |
| 18 to 34 Years | 0 (0.0%) | 0 (0.0%) |
| 35 to 64 Years | 62 (5.2%) | 21 (1.8%) |
| 65 to 74 Years | 7 (2.5%) | 0 (0.0%) |
| 75 Years and over | 0 (0.0%) | 29 (9.8%) |
Disability Class: Cognitive Difficulty
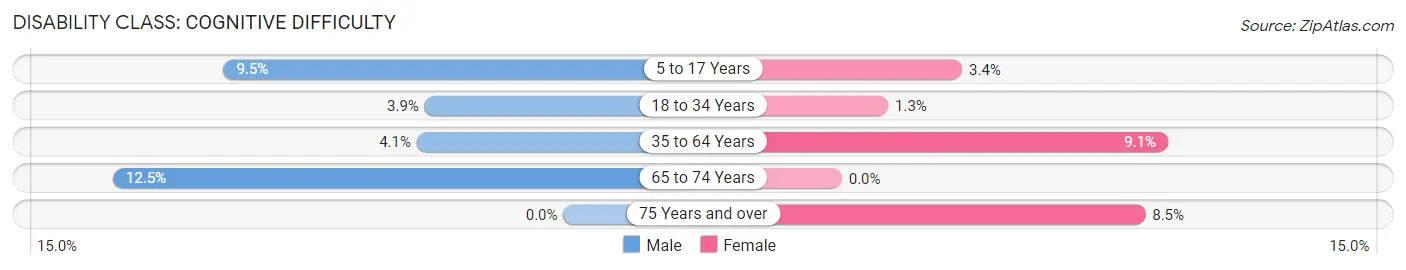
| Age Bracket | Male | Female |
| 5 to 17 Years | 54 (9.5%) | 22 (3.4%) |
| 18 to 34 Years | 31 (3.9%) | 9 (1.3%) |
| 35 to 64 Years | 49 (4.1%) | 106 (9.1%) |
| 65 to 74 Years | 35 (12.5%) | 0 (0.0%) |
| 75 Years and over | 0 (0.0%) | 25 (8.5%) |
Disability Class: Ambulatory Difficulty
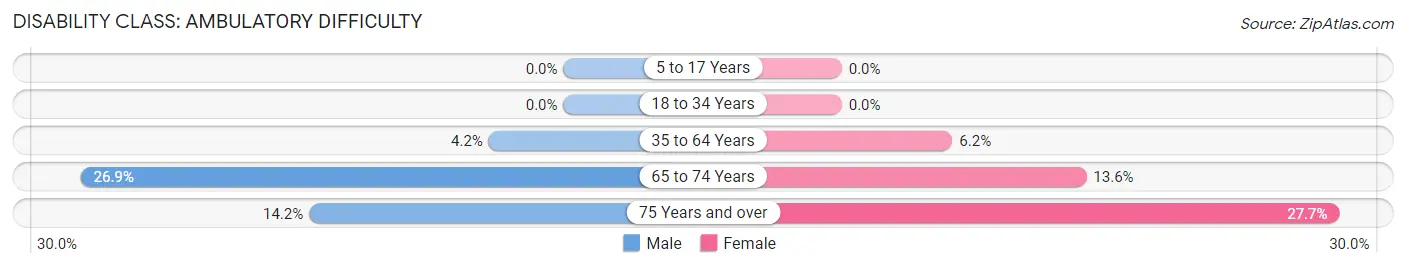
| Age Bracket | Male | Female |
| 5 to 17 Years | 0 (0.0%) | 0 (0.0%) |
| 18 to 34 Years | 0 (0.0%) | 0 (0.0%) |
| 35 to 64 Years | 50 (4.2%) | 72 (6.2%) |
| 65 to 74 Years | 75 (26.9%) | 47 (13.6%) |
| 75 Years and over | 31 (14.2%) | 82 (27.7%) |
Disability Class: Self-Care Difficulty
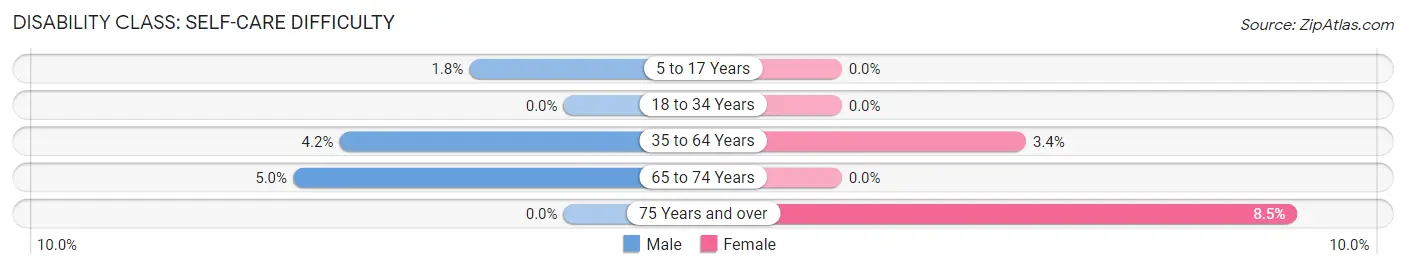
| Age Bracket | Male | Female |
| 5 to 17 Years | 10 (1.8%) | 0 (0.0%) |
| 18 to 34 Years | 0 (0.0%) | 0 (0.0%) |
| 35 to 64 Years | 50 (4.2%) | 40 (3.4%) |
| 65 to 74 Years | 14 (5.0%) | 0 (0.0%) |
| 75 Years and over | 0 (0.0%) | 25 (8.5%) |
Technology Access in Dunlap
Computing Device Access in Dunlap
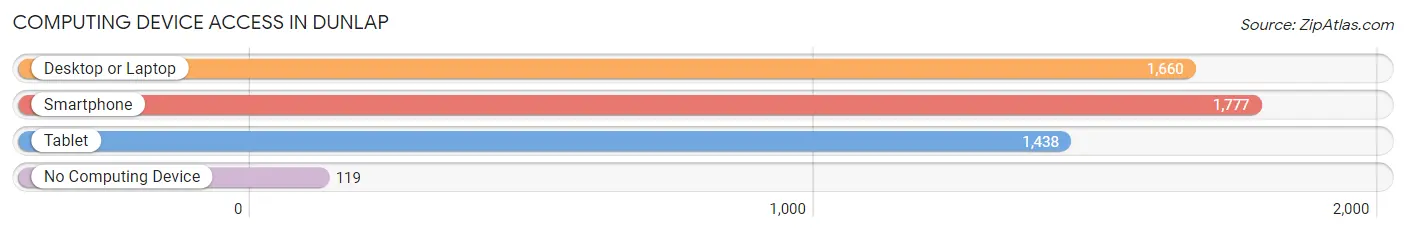
| Device Type | # Households | % Households |
| Desktop or Laptop | 1,660 | 80.7% |
| Smartphone | 1,777 | 86.4% |
| Tablet | 1,438 | 69.9% |
| No Computing Device | 119 | 5.8% |
| Total | 2,058 | 100.0% |
Internet Access in Dunlap
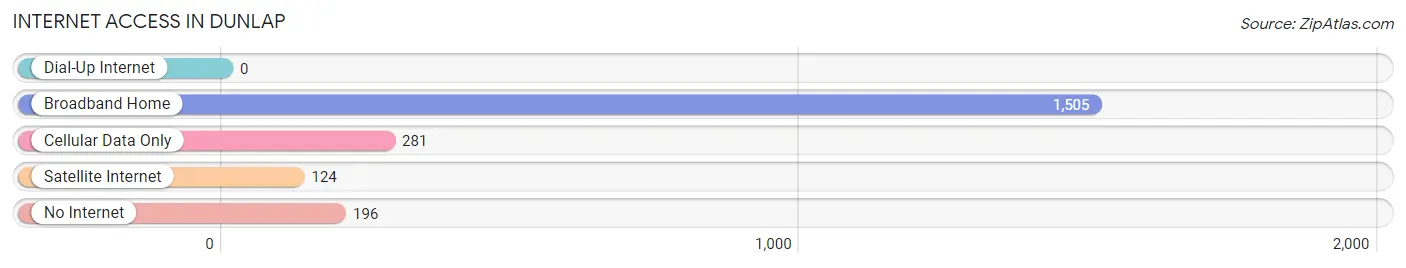
| Internet Type | # Households | % Households |
| Dial-Up Internet | 0 | 0.0% |
| Broadband Home | 1,505 | 73.1% |
| Cellular Data Only | 281 | 13.7% |
| Satellite Internet | 124 | 6.0% |
| No Internet | 196 | 9.5% |
| Total | 2,058 | 100.0% |
Dunlap Summary
History
The small town of Dunlap, Indiana is located in the northern part of the state, in the county of Elkhart. It is a small, rural community with a population of just over 1,000 people. The town was founded in 1837 by a group of settlers from Ohio, led by John Dunlap. The town was named after him, and it has remained a small, rural community ever since.
The town was originally a farming community, and it was known for its production of corn, wheat, and other grains. In the late 19th century, the town began to diversify its economy, and it became a center for manufacturing. The town was home to several factories, including a furniture factory, a canning factory, and a paper mill.
In the early 20th century, the town began to experience a decline in its economy. The factories began to close, and the population began to decline. However, in the late 20th century, the town began to experience a resurgence. The town was revitalized by the opening of a new industrial park, which brought in new businesses and jobs.
Geography
Dunlap is located in the northern part of Elkhart County, Indiana. It is situated on the banks of the Elkhart River, and it is surrounded by rolling hills and farmland. The town is located about 25 miles north of South Bend, and it is about an hour’s drive from both Chicago and Indianapolis.
The town is located in a temperate climate, with hot summers and cold winters. The average temperature in the summer is around 75 degrees Fahrenheit, and the average temperature in the winter is around 25 degrees Fahrenheit. The town receives an average of 40 inches of precipitation per year.
Economy
The economy of Dunlap is largely based on agriculture and manufacturing. The town is home to several factories, including a furniture factory, a canning factory, and a paper mill. The town is also home to several small businesses, including restaurants, shops, and other services.
The town is also home to a number of tourist attractions, including a golf course, a museum, and a historic district. The town is also home to a number of festivals and events, including the annual Dunlap Days Festival.
Demographics
As of the 2010 census, the population of Dunlap was 1,072. The town is predominantly white, with a population that is 97.3% white. The town also has a small Hispanic population, which makes up 1.2% of the population. The median household income in the town is $41,250, and the median home value is $117,000.
The town is served by the Dunlap Community School District, which includes one elementary school, one middle school, and one high school. The town is also home to a branch of the Elkhart Public Library.
Conclusion
Dunlap, Indiana is a small, rural town located in the northern part of Elkhart County. The town was founded in 1837, and it has remained a small, rural community ever since. The town is home to several factories, small businesses, and tourist attractions. The town is predominantly white, with a population that is 97.3% white. The town is served by the Dunlap Community School District, and it is home to a branch of the Elkhart Public Library.
Common Questions
What is Per Capita Income in Dunlap?
Per Capita income in Dunlap is $32,965.
What is the Median Family Income in Dunlap?
Median Family Income in Dunlap is $92,565.
What is the Median Household income in Dunlap?
Median Household Income in Dunlap is $82,368.
What is Income or Wage Gap in Dunlap?
Income or Wage Gap in Dunlap is 38.3%.
Women in Dunlap earn 61.7 cents for every dollar earned by a man.
What is Inequality or Gini Index in Dunlap?
Inequality or Gini Index in Dunlap is 0.40.
What is the Total Population of Dunlap?
Total Population of Dunlap is 6,799.
What is the Total Male Population of Dunlap?
Total Male Population of Dunlap is 3,358.
What is the Total Female Population of Dunlap?
Total Female Population of Dunlap is 3,441.
What is the Ratio of Males per 100 Females in Dunlap?
There are 97.59 Males per 100 Females in Dunlap.
What is the Ratio of Females per 100 Males in Dunlap?
There are 102.47 Females per 100 Males in Dunlap.
What is the Median Population Age in Dunlap?
Median Population Age in Dunlap is 36.8 Years.
What is the Average Family Size in Dunlap
Average Family Size in Dunlap is 3.7 People.
What is the Average Household Size in Dunlap
Average Household Size in Dunlap is 3.3 People.
How Large is the Labor Force in Dunlap?
There are 3,422 People in the Labor Forcein in Dunlap.
What is the Percentage of People in the Labor Force in Dunlap?
64.5% of People are in the Labor Force in Dunlap.
What is the Unemployment Rate in Dunlap?
Unemployment Rate in Dunlap is 2.9%.