Syracuse, IN Map & Demographics
Syracuse Map
Syracuse Overview
$35,016
PER CAPITA INCOME
$70,735
AVG FAMILY INCOME
$66,027
AVG HOUSEHOLD INCOME
40.8%
WAGE / INCOME GAP [ % ]
59.2¢/ $1
WAGE / INCOME GAP [ $ ]
0.36
INEQUALITY / GINI INDEX
3,081
TOTAL POPULATION
1,529
MALE POPULATION
1,552
FEMALE POPULATION
98.52
MALES / 100 FEMALES
101.50
FEMALES / 100 MALES
45.3
MEDIAN AGE
2.6
AVG FAMILY SIZE
2.1
AVG HOUSEHOLD SIZE
1,962
LABOR FORCE [ PEOPLE ]
70.9%
PERCENT IN LABOR FORCE
3.4%
UNEMPLOYMENT RATE
Syracuse Zip Codes
Syracuse Area Codes
Income in Syracuse
Income Overview in Syracuse
Per Capita Income in Syracuse is $35,016, while median incomes of families and households are $70,735 and $66,027 respectively.
| Characteristic | Number | Measure |
| Per Capita Income | 3,081 | $35,016 |
| Median Family Income | 900 | $70,735 |
| Mean Family Income | 900 | $82,288 |
| Median Household Income | 1,447 | $66,027 |
| Mean Household Income | 1,447 | $72,628 |
| Income Deficit | 900 | $0 |
| Wage / Income Gap (%) | 3,081 | 40.77% |
| Wage / Income Gap ($) | 3,081 | 59.23¢ per $1 |
| Gini / Inequality Index | 3,081 | 0.36 |
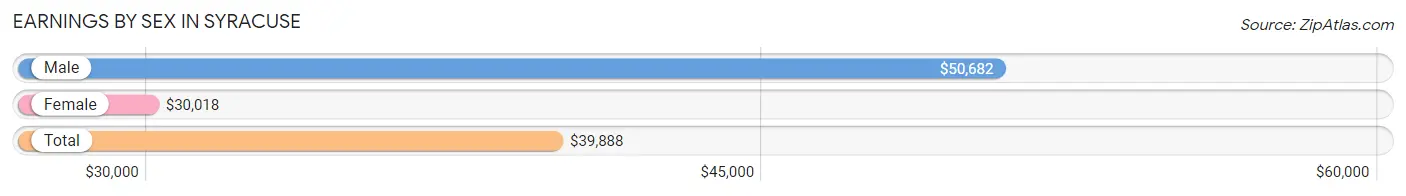
Earnings by Sex in Syracuse
Average Earnings in Syracuse are $39,888, $50,682 for men and $30,018 for women, a difference of 40.8%.
| Sex | Number | Average Earnings |
| Male | 1,070 (53.2%) | $50,682 |
| Female | 941 (46.8%) | $30,018 |
| Total | 2,011 (100.0%) | $39,888 |
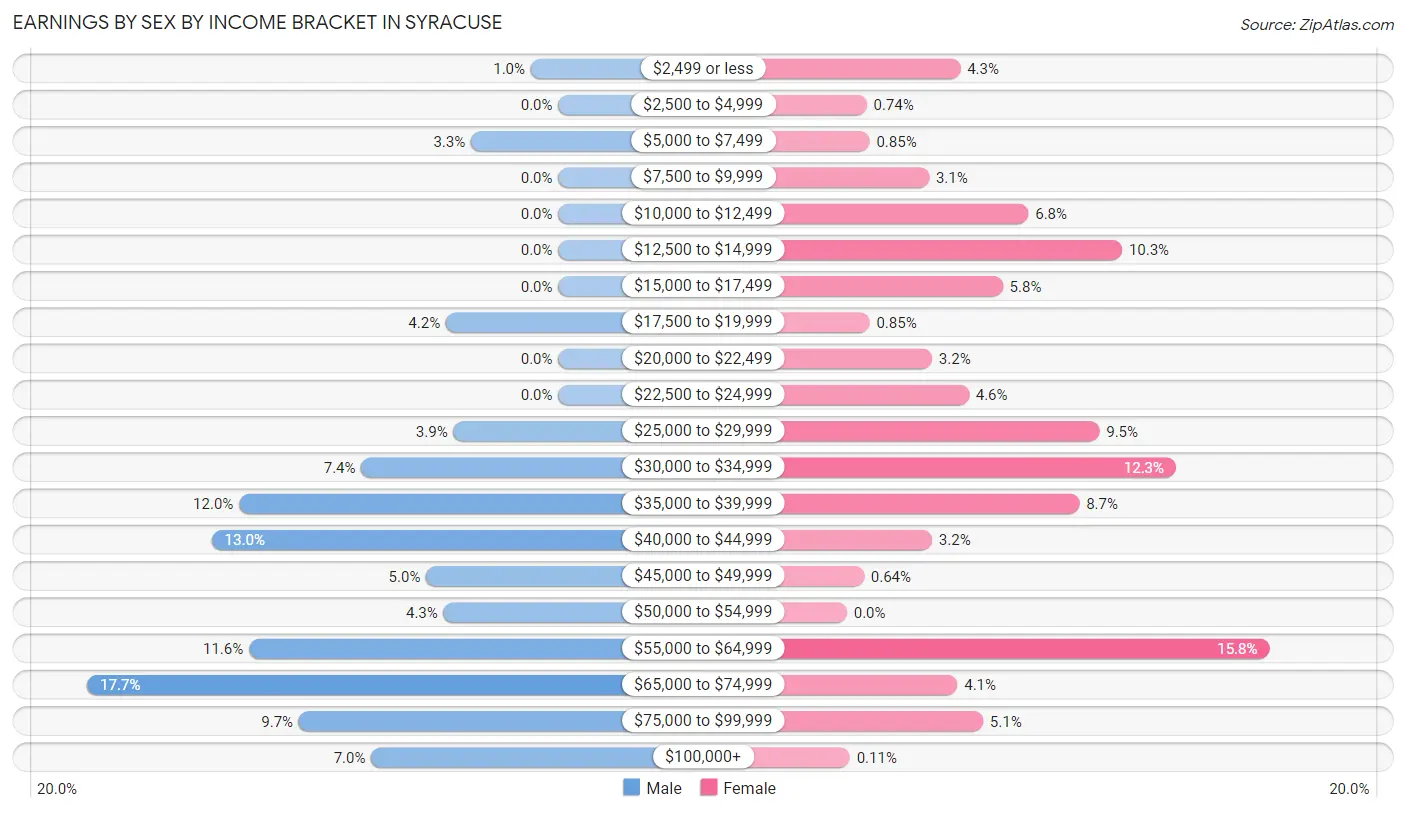
Earnings by Sex by Income Bracket in Syracuse
The most common earnings brackets in Syracuse are $65,000 to $74,999 for men (189 | 17.7%) and $55,000 to $64,999 for women (149 | 15.8%).
| Income | Male | Female |
| $2,499 or less | 11 (1.0%) | 40 (4.3%) |
| $2,500 to $4,999 | 0 (0.0%) | 7 (0.7%) |
| $5,000 to $7,499 | 35 (3.3%) | 8 (0.9%) |
| $7,500 to $9,999 | 0 (0.0%) | 29 (3.1%) |
| $10,000 to $12,499 | 0 (0.0%) | 64 (6.8%) |
| $12,500 to $14,999 | 0 (0.0%) | 97 (10.3%) |
| $15,000 to $17,499 | 0 (0.0%) | 55 (5.8%) |
| $17,500 to $19,999 | 45 (4.2%) | 8 (0.9%) |
| $20,000 to $22,499 | 0 (0.0%) | 30 (3.2%) |
| $22,500 to $24,999 | 0 (0.0%) | 43 (4.6%) |
| $25,000 to $29,999 | 42 (3.9%) | 89 (9.5%) |
| $30,000 to $34,999 | 79 (7.4%) | 116 (12.3%) |
| $35,000 to $39,999 | 128 (12.0%) | 82 (8.7%) |
| $40,000 to $44,999 | 139 (13.0%) | 30 (3.2%) |
| $45,000 to $49,999 | 53 (5.0%) | 6 (0.6%) |
| $50,000 to $54,999 | 46 (4.3%) | 0 (0.0%) |
| $55,000 to $64,999 | 124 (11.6%) | 149 (15.8%) |
| $65,000 to $74,999 | 189 (17.7%) | 39 (4.1%) |
| $75,000 to $99,999 | 104 (9.7%) | 48 (5.1%) |
| $100,000+ | 75 (7.0%) | 1 (0.1%) |
| Total | 1,070 (100.0%) | 941 (100.0%) |
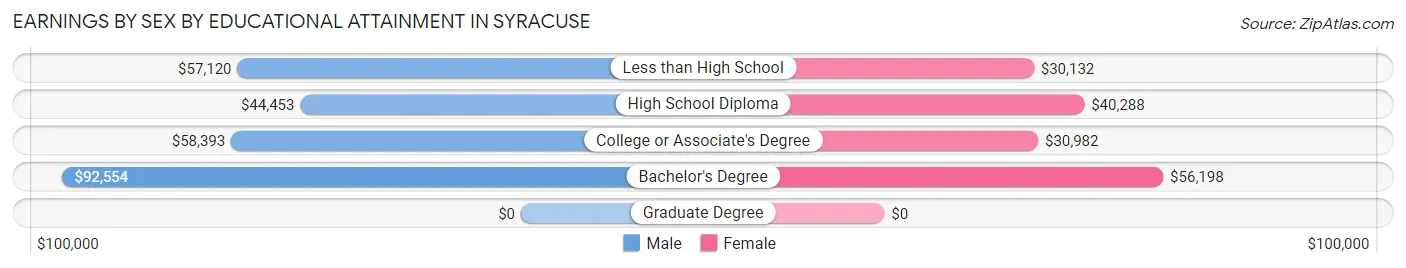
Earnings by Sex by Educational Attainment in Syracuse
Average earnings in Syracuse are $56,552 for men and $32,995 for women, a difference of 41.7%. Men with an educational attainment of bachelor's degree enjoy the highest average annual earnings of $92,554, while those with high school diploma education earn the least with $44,453. Women with an educational attainment of bachelor's degree earn the most with the average annual earnings of $56,198, while those with less than high school education have the smallest earnings of $30,132.
| Educational Attainment | Male Income | Female Income |
| Less than High School | $57,120 | $30,132 |
| High School Diploma | $44,453 | $40,288 |
| College or Associate's Degree | $58,393 | $30,982 |
| Bachelor's Degree | $92,554 | $56,198 |
| Graduate Degree | - | - |
| Total | $56,552 | $32,995 |
Family Income in Syracuse
Family Income Brackets in Syracuse
According to the Syracuse family income data, there are 265 families falling into the $50,000 to $74,999 income range, which is the most common income bracket and makes up 29.4% of all families.
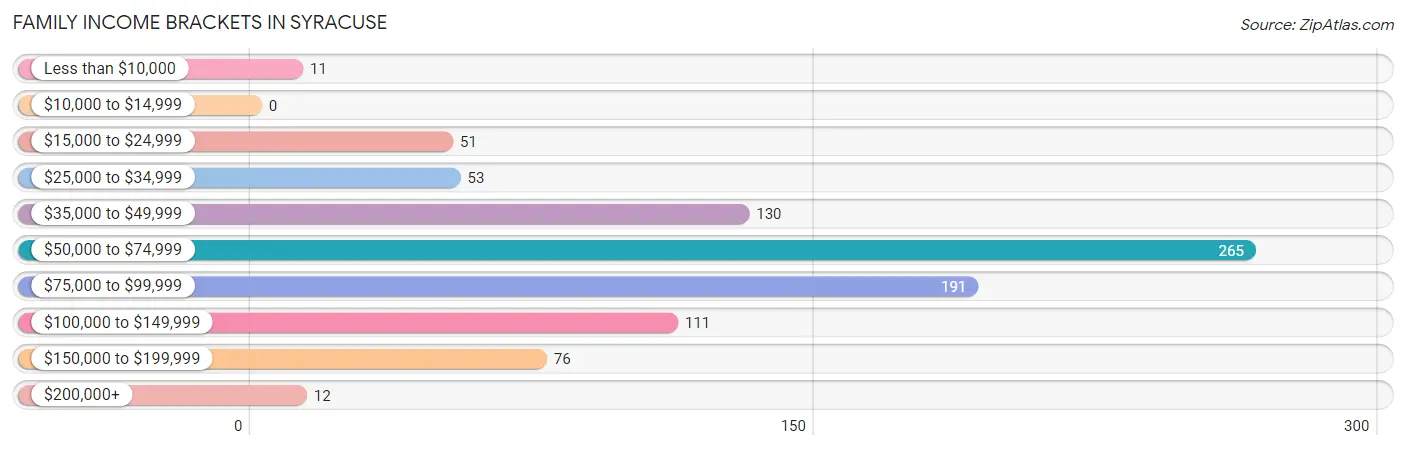
| Income Bracket | # Families | % Families |
| Less than $10,000 | 11 | 1.2% |
| $10,000 to $14,999 | 0 | 0.0% |
| $15,000 to $24,999 | 51 | 5.7% |
| $25,000 to $34,999 | 53 | 5.9% |
| $35,000 to $49,999 | 130 | 14.4% |
| $50,000 to $74,999 | 265 | 29.4% |
| $75,000 to $99,999 | 191 | 21.2% |
| $100,000 to $149,999 | 111 | 12.3% |
| $150,000 to $199,999 | 76 | 8.4% |
| $200,000+ | 12 | 1.3% |
Family Income by Famaliy Size in Syracuse
4-person families (52 | 5.8%) account for the highest median family income in Syracuse with $167,717 per family, while 4-person families (52 | 5.8%) have the highest median income of $41,929 per family member.
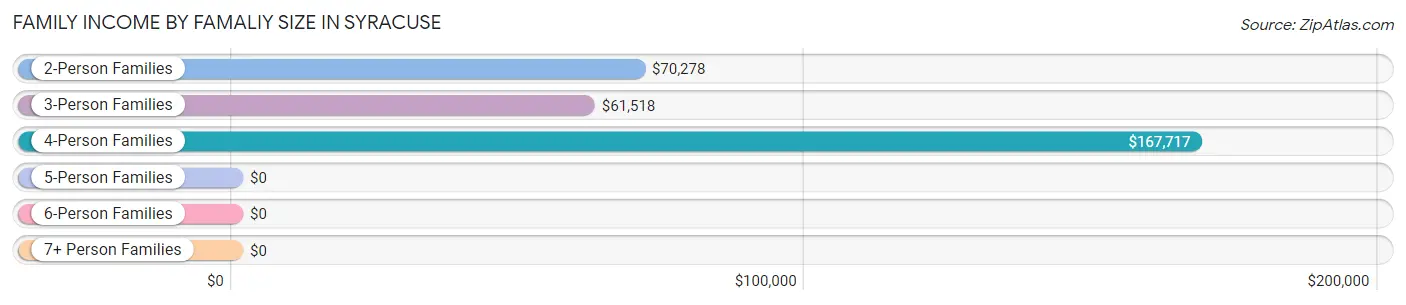
| Income Bracket | # Families | Median Income |
| 2-Person Families | 570 (63.3%) | $70,278 |
| 3-Person Families | 248 (27.6%) | $61,518 |
| 4-Person Families | 52 (5.8%) | $167,717 |
| 5-Person Families | 30 (3.3%) | $0 |
| 6-Person Families | 0 (0.0%) | $0 |
| 7+ Person Families | 0 (0.0%) | $0 |
| Total | 900 (100.0%) | $70,735 |
Family Income by Number of Earners in Syracuse
The median family income in Syracuse is $70,735, with families comprising 2 earners (493) having the highest median family income of $95,355, while families with no earners (94) have the lowest median family income of $39,125, accounting for 54.8% and 10.4% of families, respectively.
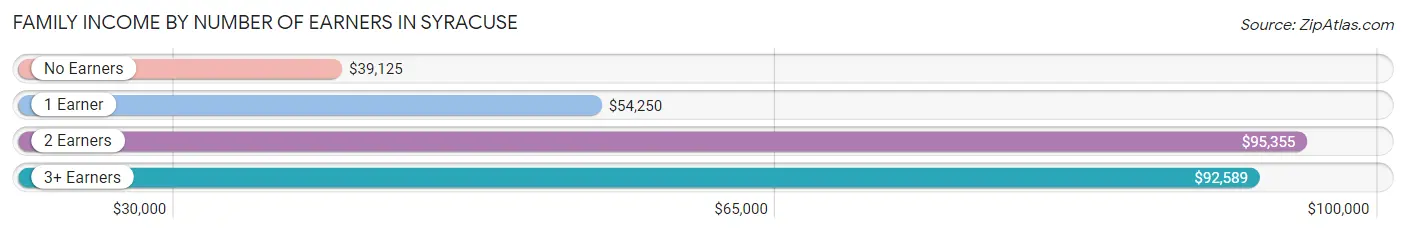
| Number of Earners | # Families | Median Income |
| No Earners | 94 (10.4%) | $39,125 |
| 1 Earner | 242 (26.9%) | $54,250 |
| 2 Earners | 493 (54.8%) | $95,355 |
| 3+ Earners | 71 (7.9%) | $92,589 |
| Total | 900 (100.0%) | $70,735 |
Household Income in Syracuse
Household Income Brackets in Syracuse
With 428 households falling in the category, the $50,000 to $74,999 income range is the most frequent in Syracuse, accounting for 29.6% of all households. In contrast, only 12 households (0.8%) fall into the $200,000+ income bracket, making it the least populous group.
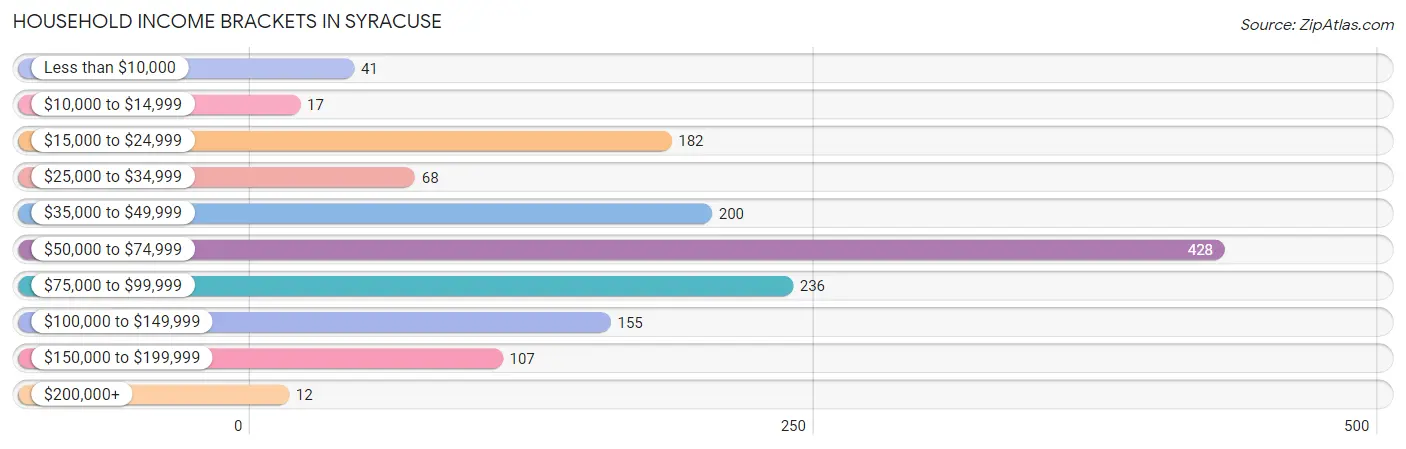
| Income Bracket | # Households | % Households |
| Less than $10,000 | 41 | 2.8% |
| $10,000 to $14,999 | 17 | 1.2% |
| $15,000 to $24,999 | 182 | 12.6% |
| $25,000 to $34,999 | 68 | 4.7% |
| $35,000 to $49,999 | 200 | 13.8% |
| $50,000 to $74,999 | 428 | 29.6% |
| $75,000 to $99,999 | 236 | 16.3% |
| $100,000 to $149,999 | 155 | 10.7% |
| $150,000 to $199,999 | 107 | 7.4% |
| $200,000+ | 12 | 0.8% |
Household Income by Householder Age in Syracuse
The median household income in Syracuse is $66,027, with the highest median household income of $78,309 found in the 45 to 64 years age bracket for the primary householder. A total of 569 households (39.3%) fall into this category. Meanwhile, the 65+ years age bracket for the primary householder has the lowest median household income of $26,875, with 342 households (23.6%) in this group.
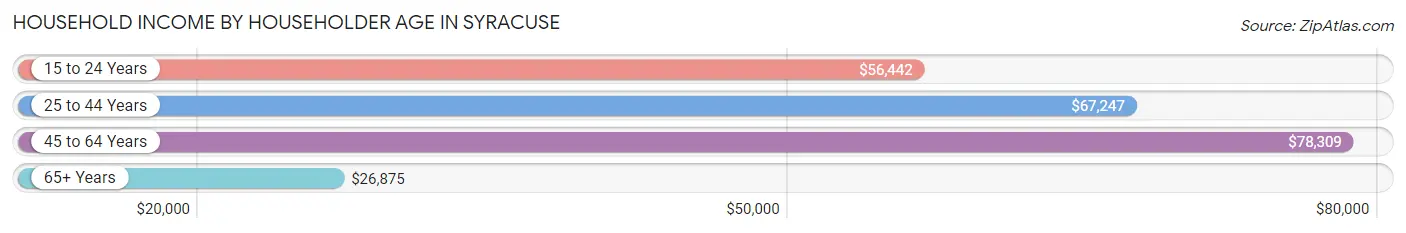
| Income Bracket | # Households | Median Income |
| 15 to 24 Years | 105 (7.3%) | $56,442 |
| 25 to 44 Years | 431 (29.8%) | $67,247 |
| 45 to 64 Years | 569 (39.3%) | $78,309 |
| 65+ Years | 342 (23.6%) | $26,875 |
| Total | 1,447 (100.0%) | $66,027 |
Poverty in Syracuse
Income Below Poverty by Sex and Age in Syracuse
With 3.7% poverty level for males and 11.2% for females among the residents of Syracuse, 65 to 74 year old males and 25 to 34 year old females are the most vulnerable to poverty, with 41 males (27.2%) and 37 females (25.3%) in their respective age groups living below the poverty level.
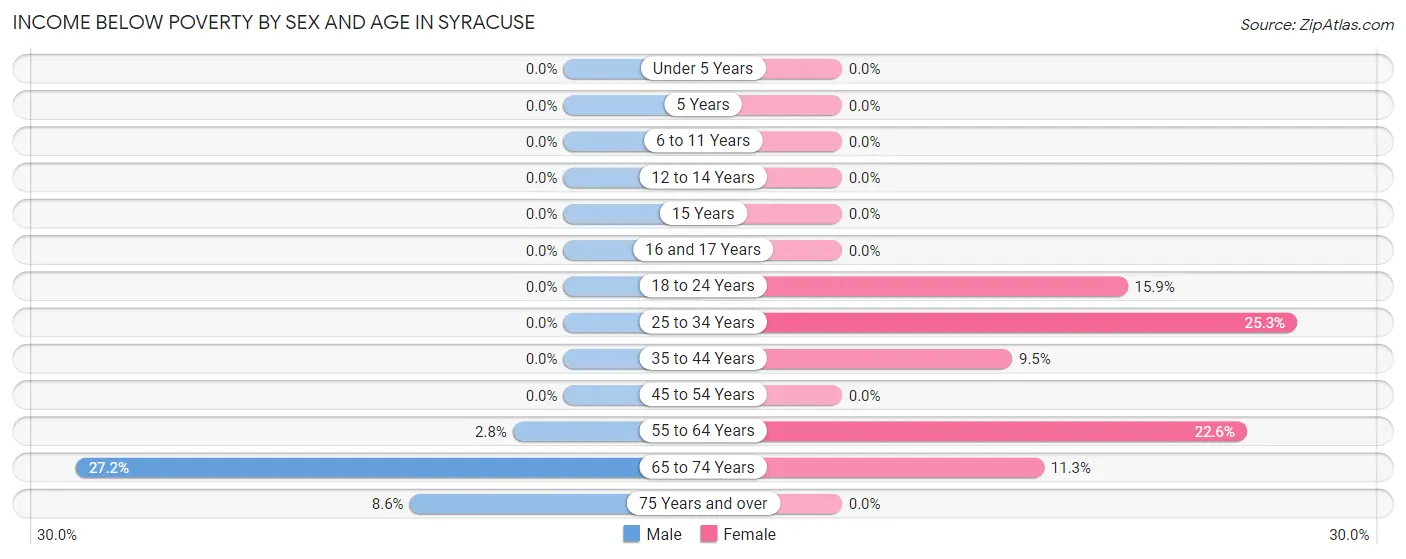
| Age Bracket | Male | Female |
| Under 5 Years | 0 (0.0%) | 0 (0.0%) |
| 5 Years | 0 (0.0%) | 0 (0.0%) |
| 6 to 11 Years | 0 (0.0%) | 0 (0.0%) |
| 12 to 14 Years | 0 (0.0%) | 0 (0.0%) |
| 15 Years | 0 (0.0%) | 0 (0.0%) |
| 16 and 17 Years | 0 (0.0%) | 0 (0.0%) |
| 18 to 24 Years | 0 (0.0%) | 21 (15.9%) |
| 25 to 34 Years | 0 (0.0%) | 37 (25.3%) |
| 35 to 44 Years | 0 (0.0%) | 22 (9.5%) |
| 45 to 54 Years | 0 (0.0%) | 0 (0.0%) |
| 55 to 64 Years | 7 (2.8%) | 76 (22.6%) |
| 65 to 74 Years | 41 (27.2%) | 18 (11.3%) |
| 75 Years and over | 9 (8.6%) | 0 (0.0%) |
| Total | 57 (3.7%) | 174 (11.2%) |
Income Above Poverty by Sex and Age in Syracuse
According to the poverty statistics in Syracuse, males aged under 5 years and females aged under 5 years are the age groups that are most secure financially, with 100.0% of males and 100.0% of females in these age groups living above the poverty line.
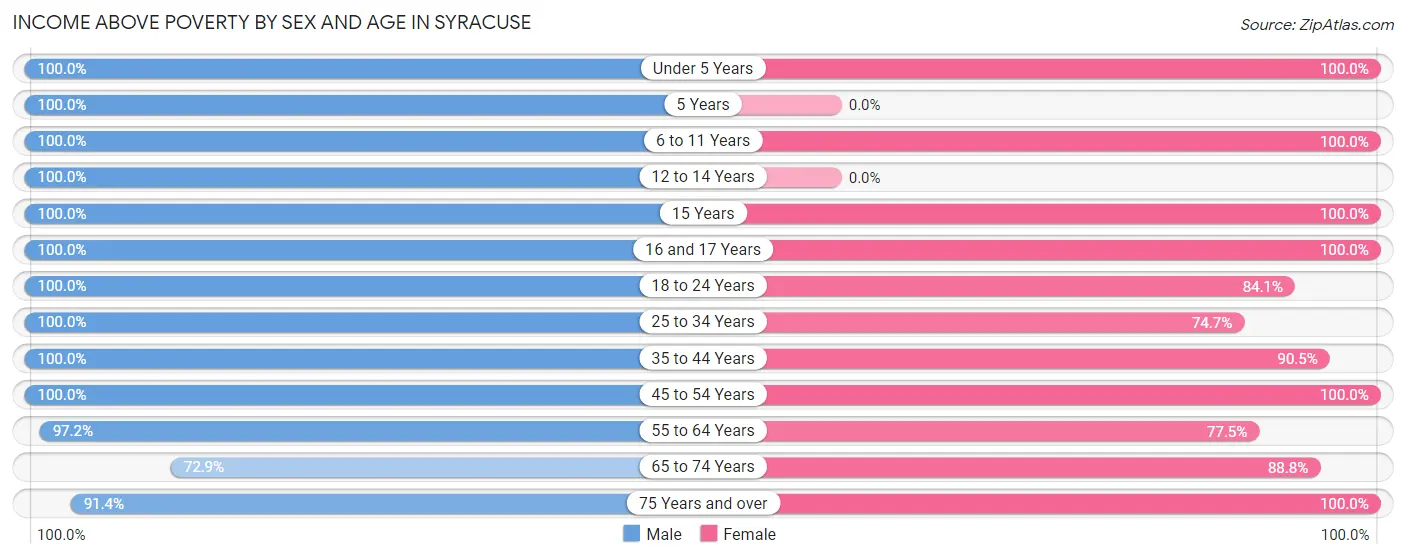
| Age Bracket | Male | Female |
| Under 5 Years | 13 (100.0%) | 50 (100.0%) |
| 5 Years | 8 (100.0%) | 0 (0.0%) |
| 6 to 11 Years | 63 (100.0%) | 66 (100.0%) |
| 12 to 14 Years | 64 (100.0%) | 0 (0.0%) |
| 15 Years | 14 (100.0%) | 36 (100.0%) |
| 16 and 17 Years | 64 (100.0%) | 55 (100.0%) |
| 18 to 24 Years | 178 (100.0%) | 111 (84.1%) |
| 25 to 34 Years | 266 (100.0%) | 109 (74.7%) |
| 35 to 44 Years | 130 (100.0%) | 210 (90.5%) |
| 45 to 54 Years | 214 (100.0%) | 246 (100.0%) |
| 55 to 64 Years | 241 (97.2%) | 261 (77.4%) |
| 65 to 74 Years | 110 (72.9%) | 142 (88.7%) |
| 75 Years and over | 96 (91.4%) | 92 (100.0%) |
| Total | 1,461 (96.3%) | 1,378 (88.8%) |
Income Below Poverty Among Married-Couple Families in Syracuse
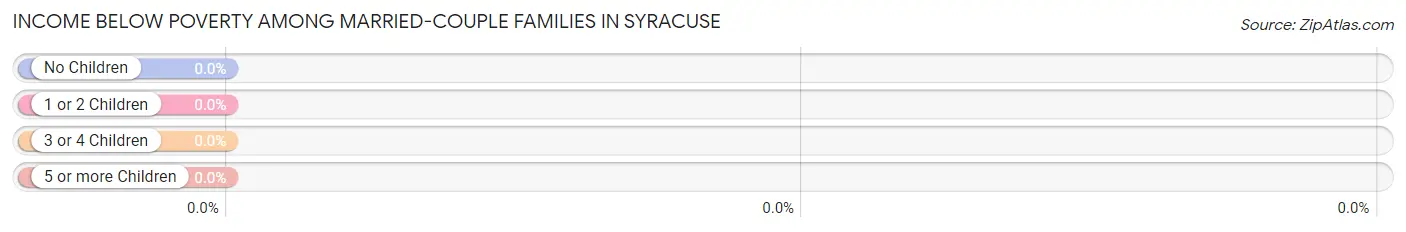
| Children | Above Poverty | Below Poverty |
| No Children | 439 (100.0%) | 0 (0.0%) |
| 1 or 2 Children | 133 (100.0%) | 0 (0.0%) |
| 3 or 4 Children | 16 (100.0%) | 0 (0.0%) |
| 5 or more Children | 0 (0.0%) | 0 (0.0%) |
| Total | 588 (100.0%) | 0 (0.0%) |
Income Below Poverty Among Single-Parent Households in Syracuse
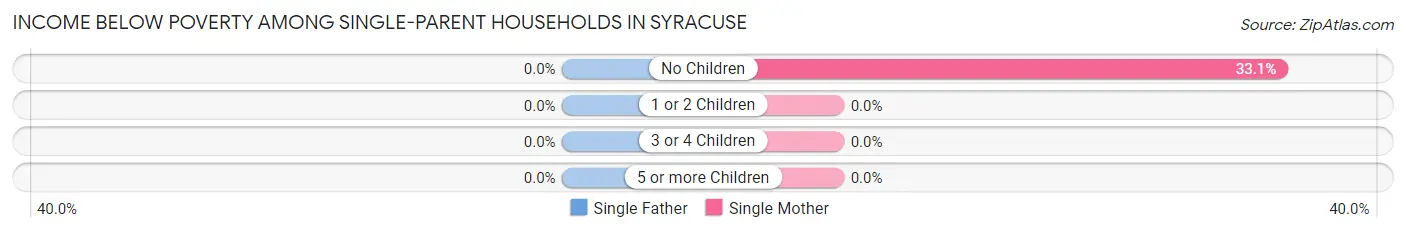
| Children | Single Father | Single Mother |
| No Children | 0 (0.0%) | 48 (33.1%) |
| 1 or 2 Children | 0 (0.0%) | 0 (0.0%) |
| 3 or 4 Children | 0 (0.0%) | 0 (0.0%) |
| 5 or more Children | 0 (0.0%) | 0 (0.0%) |
| Total | 0 (0.0%) | 48 (23.9%) |
Income Below Poverty Among Married-Couple vs Single-Parent Households in Syracuse
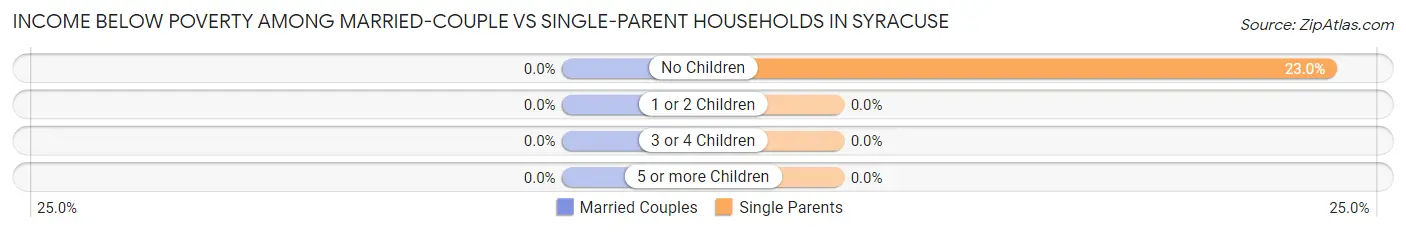
| Children | Married-Couple Families | Single-Parent Households |
| No Children | 0 (0.0%) | 48 (23.0%) |
| 1 or 2 Children | 0 (0.0%) | 0 (0.0%) |
| 3 or 4 Children | 0 (0.0%) | 0 (0.0%) |
| 5 or more Children | 0 (0.0%) | 0 (0.0%) |
| Total | 0 (0.0%) | 48 (15.4%) |
Race in Syracuse
The most populous races in Syracuse are White / Caucasian (2,678 | 86.9%), Some other Race (275 | 8.9%), and Hispanic or Latino (199 | 6.5%).
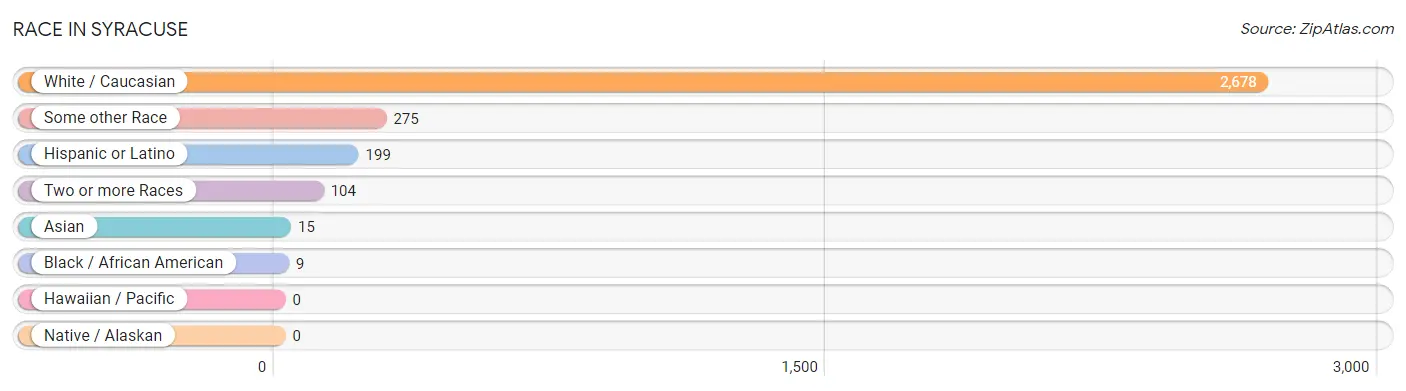
| Race | # Population | % Population |
| Asian | 15 | 0.5% |
| Black / African American | 9 | 0.3% |
| Hawaiian / Pacific | 0 | 0.0% |
| Hispanic or Latino | 199 | 6.5% |
| Native / Alaskan | 0 | 0.0% |
| White / Caucasian | 2,678 | 86.9% |
| Two or more Races | 104 | 3.4% |
| Some other Race | 275 | 8.9% |
| Total | 3,081 | 100.0% |
Ancestry in Syracuse
The most populous ancestries reported in Syracuse are German (641 | 20.8%), English (442 | 14.3%), Irish (307 | 10.0%), American (195 | 6.3%), and French (149 | 4.8%), together accounting for 56.3% of all Syracuse residents.
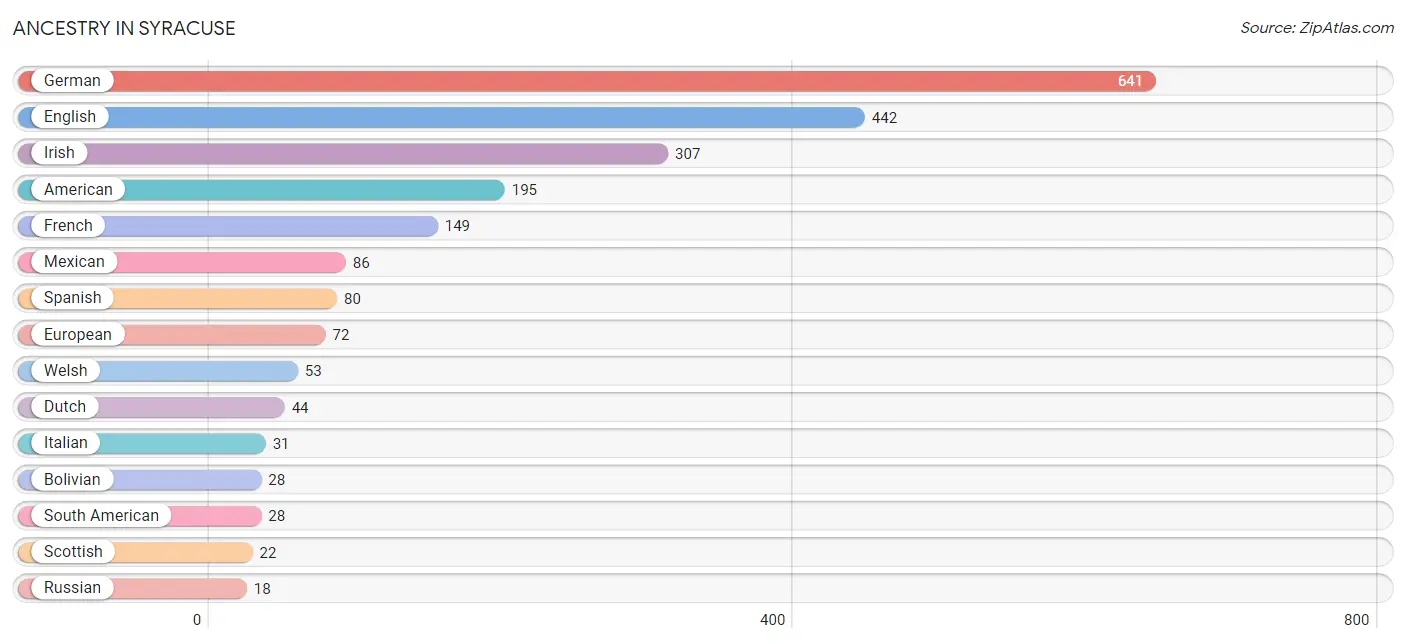
| Ancestry | # Population | % Population |
| American | 195 | 6.3% |
| Bolivian | 28 | 0.9% |
| Dutch | 44 | 1.4% |
| English | 442 | 14.3% |
| European | 72 | 2.3% |
| French | 149 | 4.8% |
| German | 641 | 20.8% |
| Greek | 10 | 0.3% |
| Indonesian | 15 | 0.5% |
| Irish | 307 | 10.0% |
| Italian | 31 | 1.0% |
| Lithuanian | 9 | 0.3% |
| Mexican | 86 | 2.8% |
| Russian | 18 | 0.6% |
| Scandinavian | 13 | 0.4% |
| Scottish | 22 | 0.7% |
| South American | 28 | 0.9% |
| Spanish | 80 | 2.6% |
| Swiss | 10 | 0.3% |
| Welsh | 53 | 1.7% | View All 20 Rows |
Immigrants in Syracuse
The most numerous immigrant groups reported in Syracuse came from Asia (189 | 6.1%), India (174 | 5.7%), South Central Asia (174 | 5.7%), Bolivia (28 | 0.9%), and Latin America (28 | 0.9%), together accounting for 19.3% of all Syracuse residents.
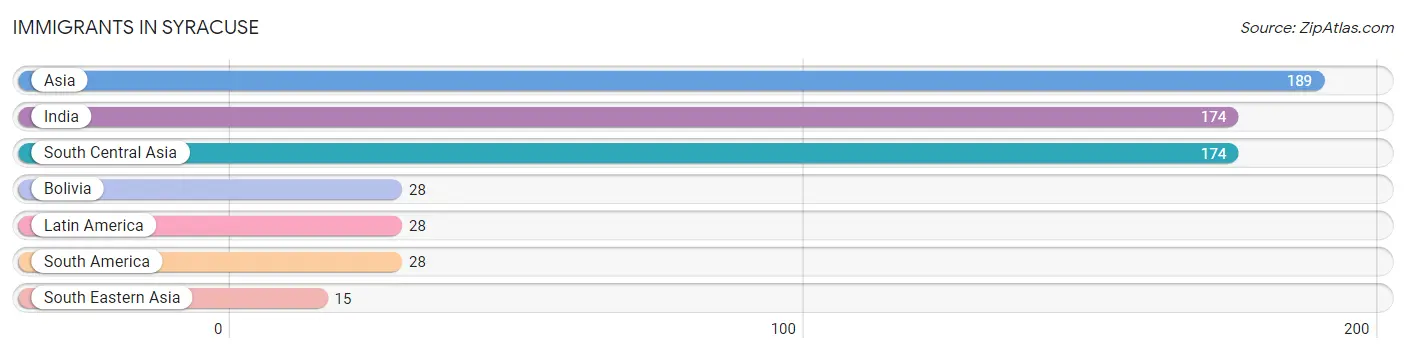
| Immigration Origin | # Population | % Population |
| Asia | 189 | 6.1% |
| Bolivia | 28 | 0.9% |
| India | 174 | 5.7% |
| Latin America | 28 | 0.9% |
| South America | 28 | 0.9% |
| South Central Asia | 174 | 5.7% |
| South Eastern Asia | 15 | 0.5% | View All 7 Rows |
Sex and Age in Syracuse
Sex and Age in Syracuse
The most populous age groups in Syracuse are 25 to 29 Years (170 | 11.1%) for men and 60 to 64 Years (227 | 14.6%) for women.
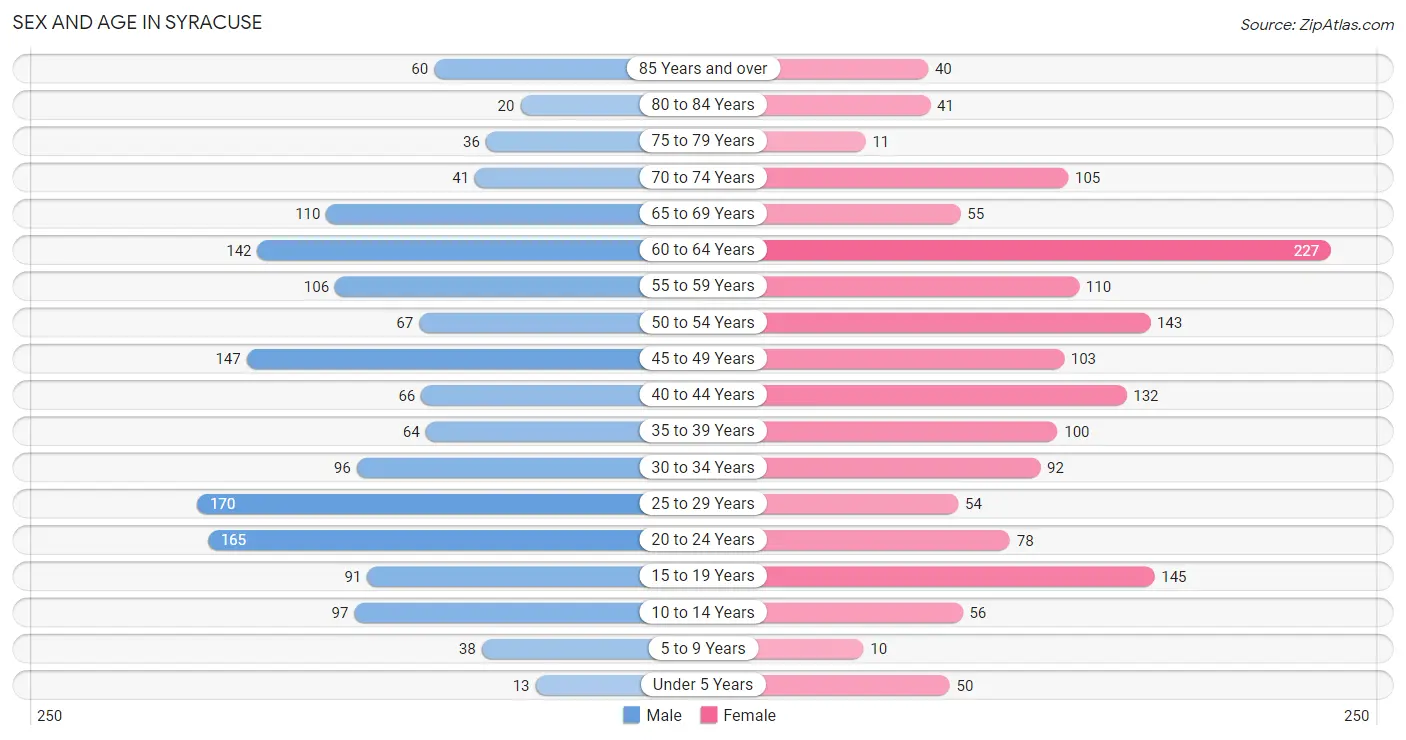
| Age Bracket | Male | Female |
| Under 5 Years | 13 (0.9%) | 50 (3.2%) |
| 5 to 9 Years | 38 (2.5%) | 10 (0.6%) |
| 10 to 14 Years | 97 (6.3%) | 56 (3.6%) |
| 15 to 19 Years | 91 (5.9%) | 145 (9.3%) |
| 20 to 24 Years | 165 (10.8%) | 78 (5.0%) |
| 25 to 29 Years | 170 (11.1%) | 54 (3.5%) |
| 30 to 34 Years | 96 (6.3%) | 92 (5.9%) |
| 35 to 39 Years | 64 (4.2%) | 100 (6.4%) |
| 40 to 44 Years | 66 (4.3%) | 132 (8.5%) |
| 45 to 49 Years | 147 (9.6%) | 103 (6.6%) |
| 50 to 54 Years | 67 (4.4%) | 143 (9.2%) |
| 55 to 59 Years | 106 (6.9%) | 110 (7.1%) |
| 60 to 64 Years | 142 (9.3%) | 227 (14.6%) |
| 65 to 69 Years | 110 (7.2%) | 55 (3.5%) |
| 70 to 74 Years | 41 (2.7%) | 105 (6.8%) |
| 75 to 79 Years | 36 (2.4%) | 11 (0.7%) |
| 80 to 84 Years | 20 (1.3%) | 41 (2.6%) |
| 85 Years and over | 60 (3.9%) | 40 (2.6%) |
| Total | 1,529 (100.0%) | 1,552 (100.0%) |
Families and Households in Syracuse
Median Family Size in Syracuse
The median family size in Syracuse is 2.59 persons per family, with single female/mother families (201 | 22.3%) accounting for the largest median family size of 2.68 persons per family. On the other hand, single male/father families (111 | 12.3%) represent the smallest median family size with 2.40 persons per family.
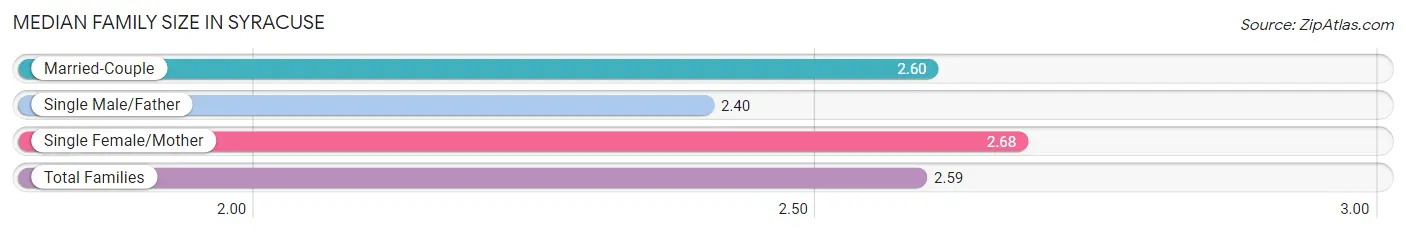
| Family Type | # Families | Family Size |
| Married-Couple | 588 (65.3%) | 2.60 |
| Single Male/Father | 111 (12.3%) | 2.40 |
| Single Female/Mother | 201 (22.3%) | 2.68 |
| Total Families | 900 (100.0%) | 2.59 |
Median Household Size in Syracuse
The median household size in Syracuse is 2.12 persons per household, with single female/mother households (201 | 13.9%) accounting for the largest median household size of 3.09 persons per household. non-family households (547 | 37.8%) represent the smallest median household size with 1.16 persons per household.
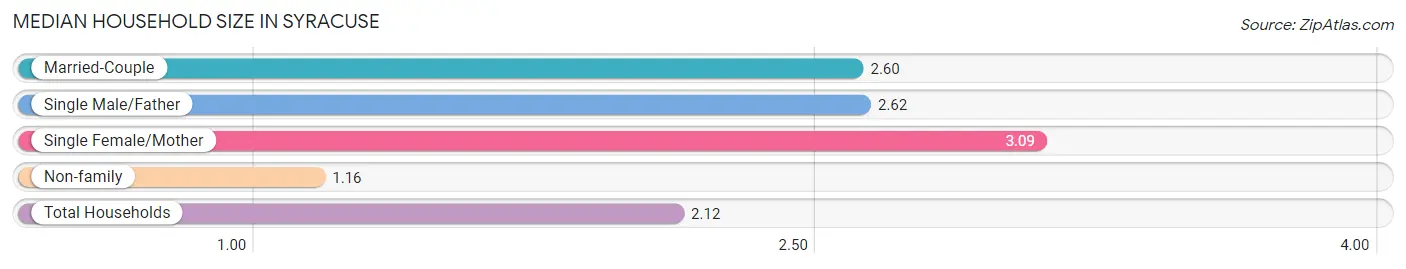
| Household Type | # Households | Household Size |
| Married-Couple | 588 (40.6%) | 2.60 |
| Single Male/Father | 111 (7.7%) | 2.62 |
| Single Female/Mother | 201 (13.9%) | 3.09 |
| Non-family | 547 (37.8%) | 1.16 |
| Total Households | 1,447 (100.0%) | 2.12 |
Household Size by Marriage Status in Syracuse
Out of a total of 1,447 households in Syracuse, 900 (62.2%) are family households, while 547 (37.8%) are nonfamily households. The most numerous type of family households are 2-person households, comprising 551, and the most common type of nonfamily households are 1-person households, comprising 456.
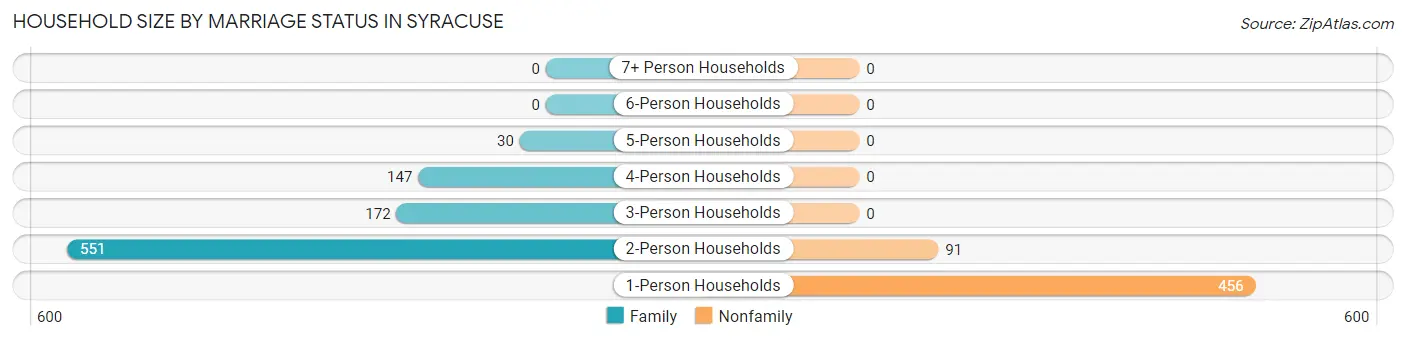
| Household Size | Family Households | Nonfamily Households |
| 1-Person Households | - | 456 (31.5%) |
| 2-Person Households | 551 (38.1%) | 91 (6.3%) |
| 3-Person Households | 172 (11.9%) | 0 (0.0%) |
| 4-Person Households | 147 (10.2%) | 0 (0.0%) |
| 5-Person Households | 30 (2.1%) | 0 (0.0%) |
| 6-Person Households | 0 (0.0%) | 0 (0.0%) |
| 7+ Person Households | 0 (0.0%) | 0 (0.0%) |
| Total | 900 (62.2%) | 547 (37.8%) |
Female Fertility in Syracuse
Fertility by Age in Syracuse
Average fertility rate in Syracuse is 28.0 births per 1,000 women. Women in the age bracket of 20 to 34 years have the highest fertility rate with 94.0 births per 1,000 women. Women in the age bracket of 20 to 34 years acount for 100.0% of all women with births.
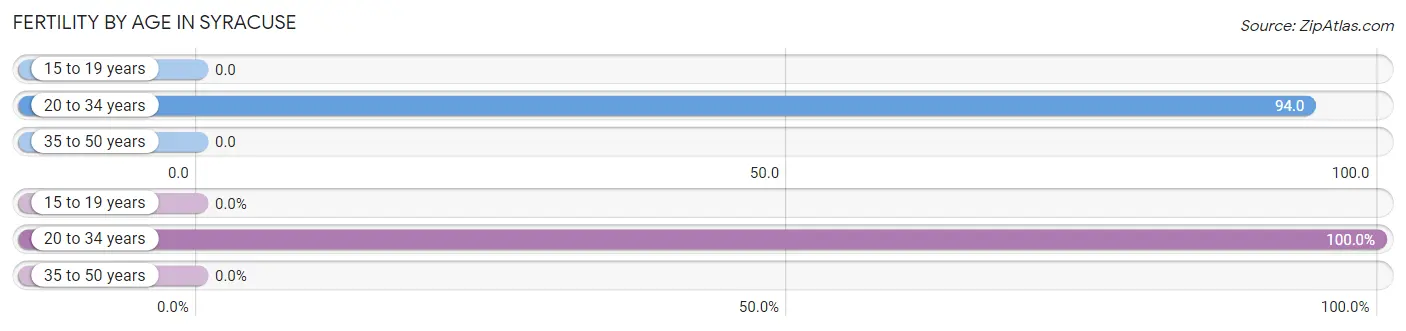
| Age Bracket | Women with Births | Births / 1,000 Women |
| 15 to 19 years | 0 (0.0%) | 0.0 |
| 20 to 34 years | 21 (100.0%) | 94.0 |
| 35 to 50 years | 0 (0.0%) | 0.0 |
| Total | 21 (100.0%) | 28.0 |
Fertility by Age by Marriage Status in Syracuse
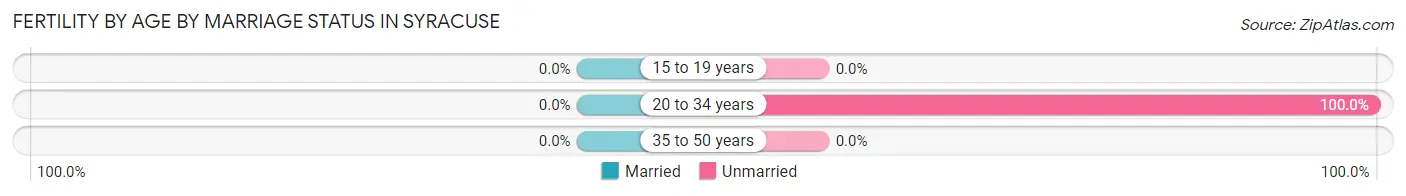
| Age Bracket | Married | Unmarried |
| 15 to 19 years | 0 (0.0%) | 0 (0.0%) |
| 20 to 34 years | 0 (0.0%) | 21 (100.0%) |
| 35 to 50 years | 0 (0.0%) | 0 (0.0%) |
| Total | 0 (0.0%) | 21 (100.0%) |
Fertility by Education in Syracuse
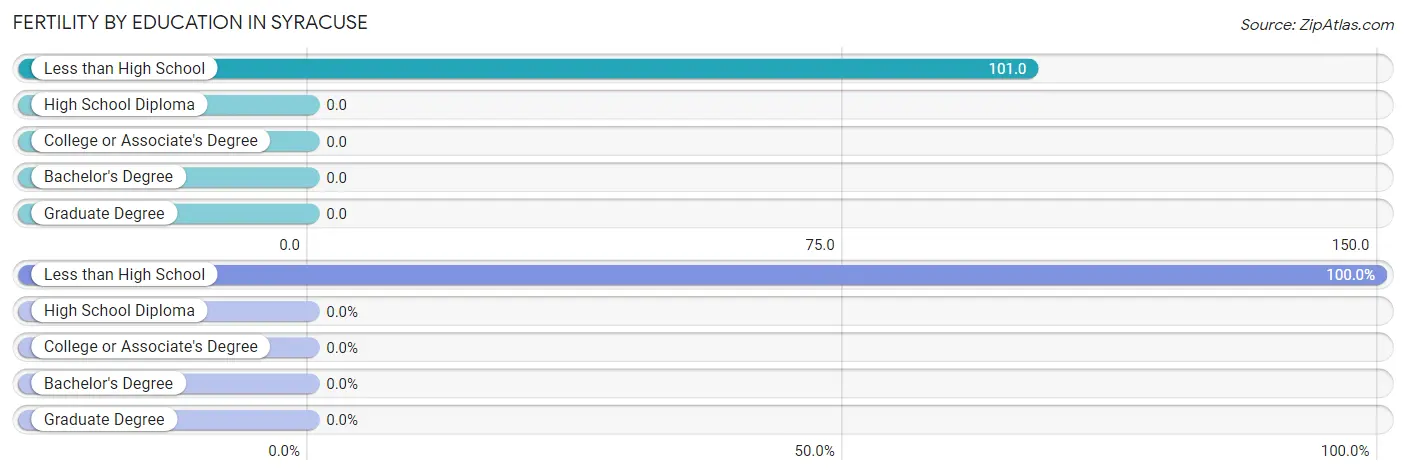
| Educational Attainment | Women with Births | Births / 1,000 Women |
| Less than High School | 21 (100.0%) | 101.0 |
| High School Diploma | 0 (0.0%) | 0.0 |
| College or Associate's Degree | 0 (0.0%) | 0.0 |
| Bachelor's Degree | 0 (0.0%) | 0.0 |
| Graduate Degree | 0 (0.0%) | 0.0 |
| Total | 21 (100.0%) | 28.0 |
Fertility by Education by Marriage Status in Syracuse
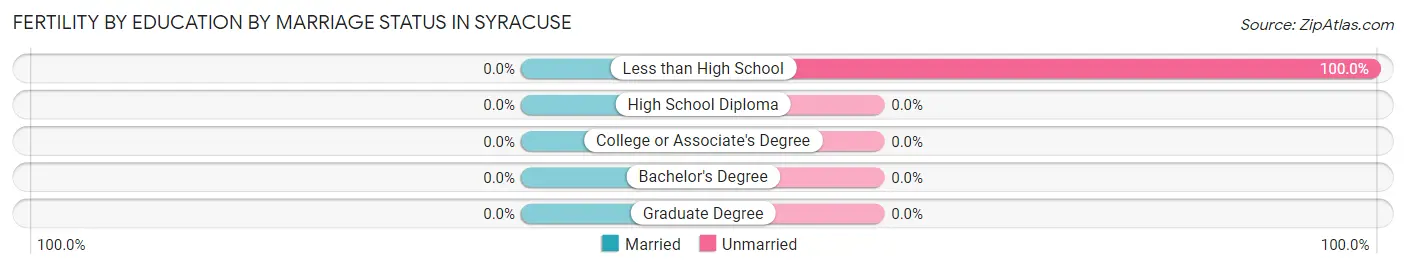
| Educational Attainment | Married | Unmarried |
| Less than High School | 0 (0.0%) | 21 (100.0%) |
| High School Diploma | 0 (0.0%) | 0 (0.0%) |
| College or Associate's Degree | 0 (0.0%) | 0 (0.0%) |
| Bachelor's Degree | 0 (0.0%) | 0 (0.0%) |
| Graduate Degree | 0 (0.0%) | 0 (0.0%) |
| Total | 0 (0.0%) | 21 (100.0%) |
Employment Characteristics in Syracuse
Employment by Class of Employer in Syracuse
Among the 1,828 employed individuals in Syracuse, private company employees (1,459 | 79.8%), self-employed (not incorporated) (143 | 7.8%), and local government employees (85 | 4.6%) make up the most common classes of employment.
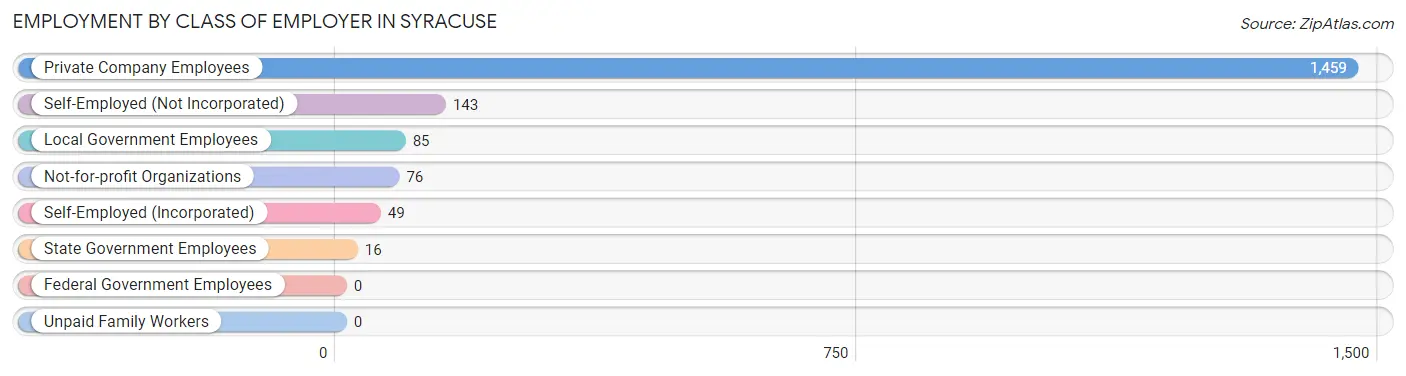
| Employer Class | # Employees | % Employees |
| Private Company Employees | 1,459 | 79.8% |
| Self-Employed (Incorporated) | 49 | 2.7% |
| Self-Employed (Not Incorporated) | 143 | 7.8% |
| Not-for-profit Organizations | 76 | 4.2% |
| Local Government Employees | 85 | 4.6% |
| State Government Employees | 16 | 0.9% |
| Federal Government Employees | 0 | 0.0% |
| Unpaid Family Workers | 0 | 0.0% |
| Total | 1,828 | 100.0% |
Employment Status by Age in Syracuse
According to the labor force statistics for Syracuse, out of the total population over 16 years of age (2,767), 70.9% or 1,962 individuals are in the labor force, with 3.4% or 67 of them unemployed. The age group with the highest labor force participation rate is 20 to 24 years, with 100.0% or 243 individuals in the labor force. Within the labor force, the 20 to 24 years age range has the highest percentage of unemployed individuals, with 8.6% or 21 of them being unemployed.
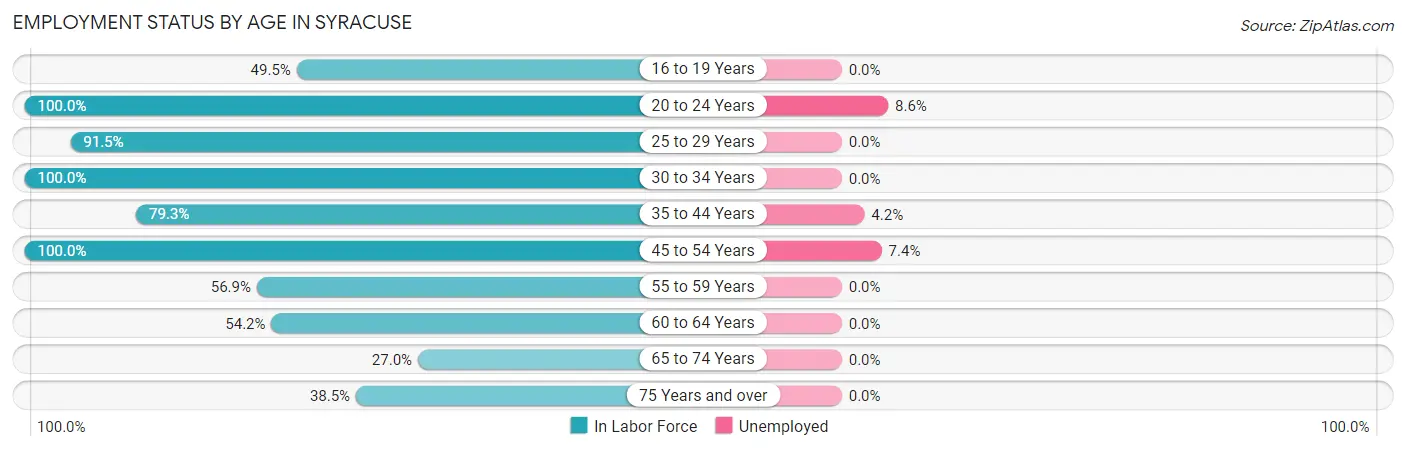
| Age Bracket | In Labor Force | Unemployed |
| 16 to 19 Years | 92 (49.5%) | 0 (0.0%) |
| 20 to 24 Years | 243 (100.0%) | 21 (8.6%) |
| 25 to 29 Years | 205 (91.5%) | 0 (0.0%) |
| 30 to 34 Years | 188 (100.0%) | 0 (0.0%) |
| 35 to 44 Years | 287 (79.3%) | 12 (4.2%) |
| 45 to 54 Years | 460 (100.0%) | 34 (7.4%) |
| 55 to 59 Years | 123 (56.9%) | 0 (0.0%) |
| 60 to 64 Years | 200 (54.2%) | 0 (0.0%) |
| 65 to 74 Years | 84 (27.0%) | 0 (0.0%) |
| 75 Years and over | 80 (38.5%) | 0 (0.0%) |
| Total | 1,962 (70.9%) | 67 (3.4%) |
Employment Status by Educational Attainment in Syracuse
According to labor force statistics for Syracuse, 80.4% of individuals (1,462) out of the total population between 25 and 64 years of age (1,819) are in the labor force, with 3.1% or 45 of them being unemployed. The group with the highest labor force participation rate are those with the educational attainment of college / associate degree, with 88.1% or 376 individuals in the labor force. Within the labor force, individuals with high school diploma education have the highest percentage of unemployment, with 5.8% or 34 of them being unemployed.
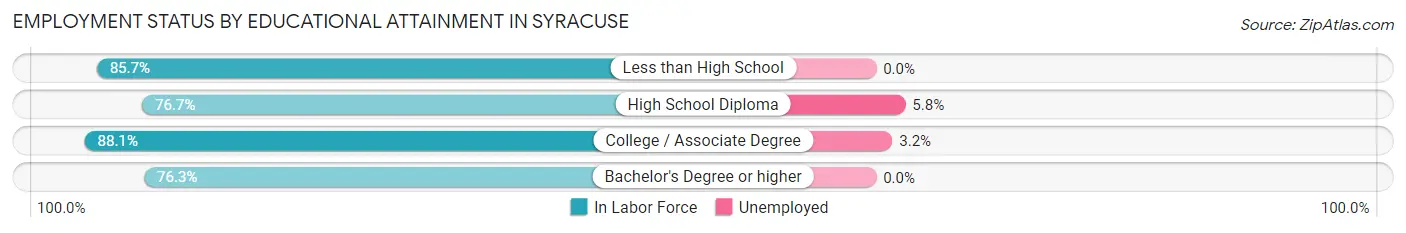
| Educational Attainment | In Labor Force | Unemployed |
| Less than High School | 203 (85.7%) | 0 (0.0%) |
| High School Diploma | 588 (76.7%) | 44 (5.8%) |
| College / Associate Degree | 376 (88.1%) | 14 (3.2%) |
| Bachelor's Degree or higher | 296 (76.3%) | 0 (0.0%) |
| Total | 1,462 (80.4%) | 56 (3.1%) |
Employment Occupations by Sex in Syracuse
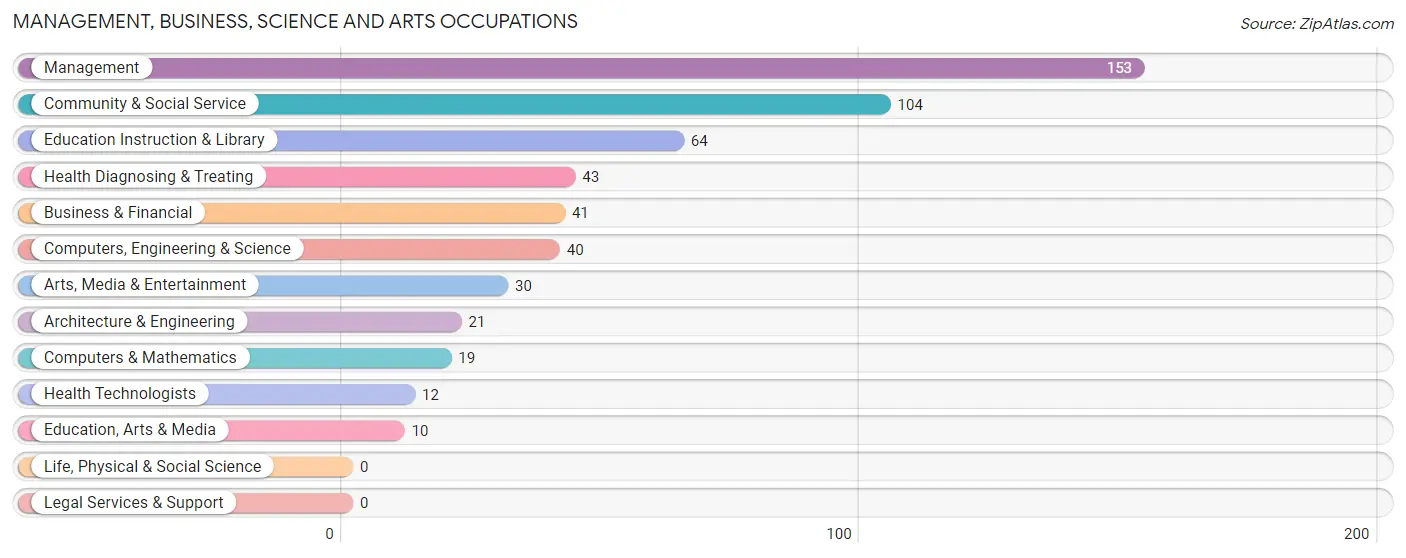
Management, Business, Science and Arts Occupations
The most common Management, Business, Science and Arts occupations in Syracuse are Management (153 | 8.1%), Community & Social Service (104 | 5.5%), Education Instruction & Library (64 | 3.4%), Health Diagnosing & Treating (43 | 2.3%), and Business & Financial (41 | 2.2%).
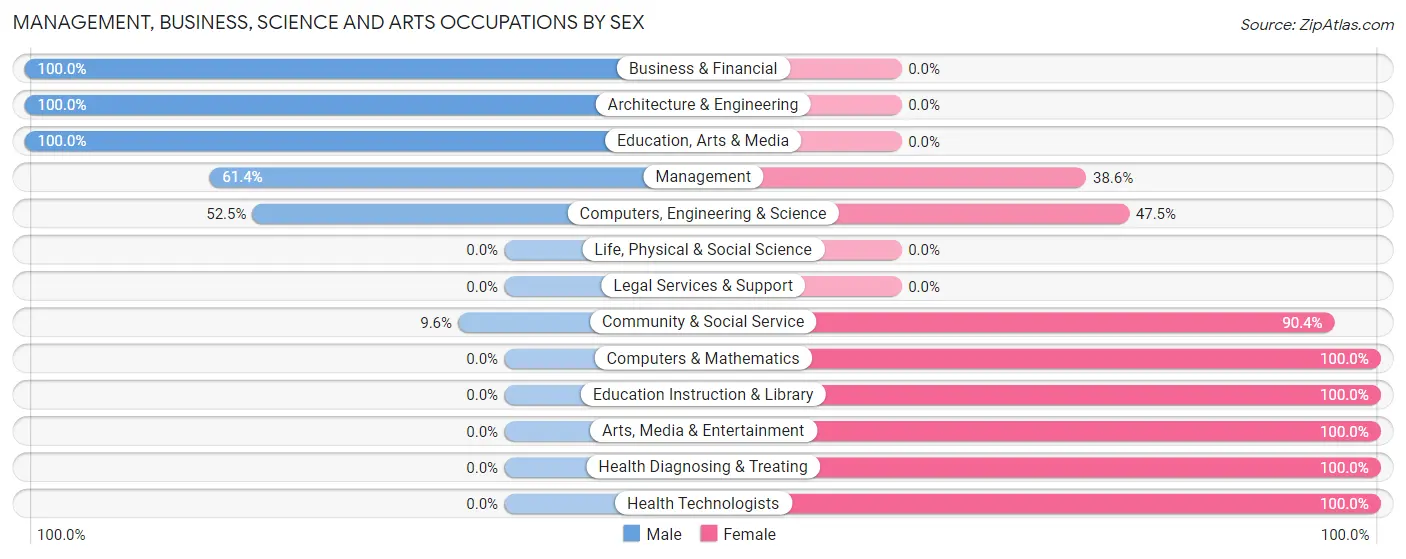
Management, Business, Science and Arts Occupations by Sex
Within the Management, Business, Science and Arts occupations in Syracuse, the most male-oriented occupations are Business & Financial (100.0%), Architecture & Engineering (100.0%), and Education, Arts & Media (100.0%), while the most female-oriented occupations are Computers & Mathematics (100.0%), Education Instruction & Library (100.0%), and Arts, Media & Entertainment (100.0%).
| Occupation | Male | Female |
| Management | 94 (61.4%) | 59 (38.6%) |
| Business & Financial | 41 (100.0%) | 0 (0.0%) |
| Computers, Engineering & Science | 21 (52.5%) | 19 (47.5%) |
| Computers & Mathematics | 0 (0.0%) | 19 (100.0%) |
| Architecture & Engineering | 21 (100.0%) | 0 (0.0%) |
| Life, Physical & Social Science | 0 (0.0%) | 0 (0.0%) |
| Community & Social Service | 10 (9.6%) | 94 (90.4%) |
| Education, Arts & Media | 10 (100.0%) | 0 (0.0%) |
| Legal Services & Support | 0 (0.0%) | 0 (0.0%) |
| Education Instruction & Library | 0 (0.0%) | 64 (100.0%) |
| Arts, Media & Entertainment | 0 (0.0%) | 30 (100.0%) |
| Health Diagnosing & Treating | 0 (0.0%) | 43 (100.0%) |
| Health Technologists | 0 (0.0%) | 12 (100.0%) |
| Total (Category) | 166 (43.6%) | 215 (56.4%) |
| Total (Overall) | 1,015 (53.6%) | 880 (46.4%) |
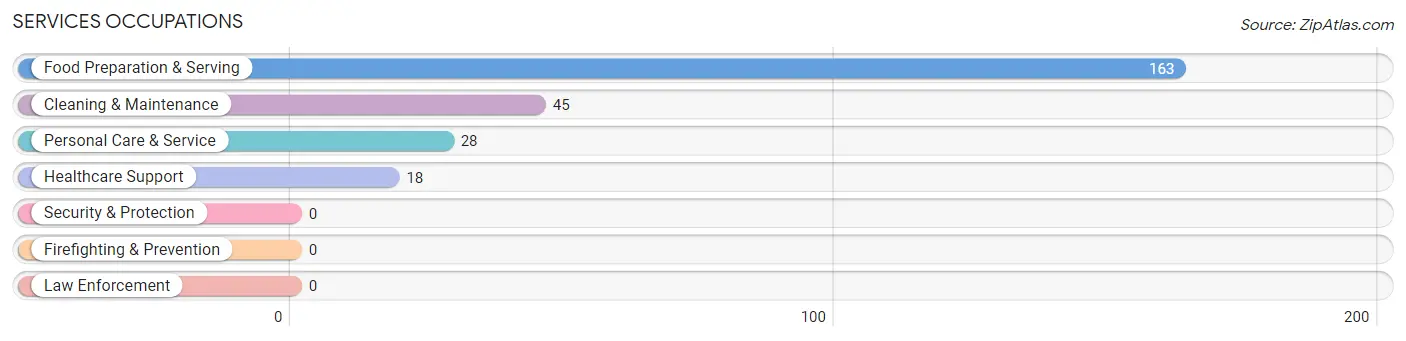
Services Occupations
The most common Services occupations in Syracuse are Food Preparation & Serving (163 | 8.6%), Cleaning & Maintenance (45 | 2.4%), Personal Care & Service (28 | 1.5%), and Healthcare Support (18 | 0.9%).
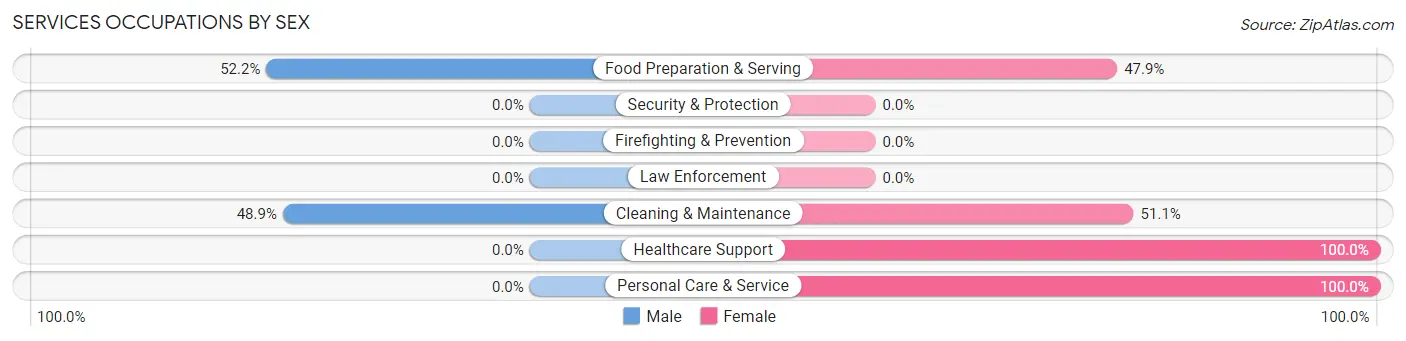
Services Occupations by Sex
Within the Services occupations in Syracuse, the most male-oriented occupations are Food Preparation & Serving (52.1%), and Cleaning & Maintenance (48.9%), while the most female-oriented occupations are Healthcare Support (100.0%), Personal Care & Service (100.0%), and Cleaning & Maintenance (51.1%).
| Occupation | Male | Female |
| Healthcare Support | 0 (0.0%) | 18 (100.0%) |
| Security & Protection | 0 (0.0%) | 0 (0.0%) |
| Firefighting & Prevention | 0 (0.0%) | 0 (0.0%) |
| Law Enforcement | 0 (0.0%) | 0 (0.0%) |
| Food Preparation & Serving | 85 (52.1%) | 78 (47.8%) |
| Cleaning & Maintenance | 22 (48.9%) | 23 (51.1%) |
| Personal Care & Service | 0 (0.0%) | 28 (100.0%) |
| Total (Category) | 107 (42.1%) | 147 (57.9%) |
| Total (Overall) | 1,015 (53.6%) | 880 (46.4%) |
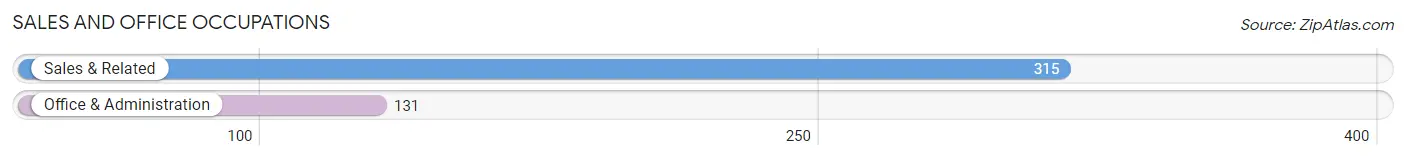
Sales and Office Occupations
The most common Sales and Office occupations in Syracuse are Sales & Related (315 | 16.6%), and Office & Administration (131 | 6.9%).
Sales and Office Occupations by Sex
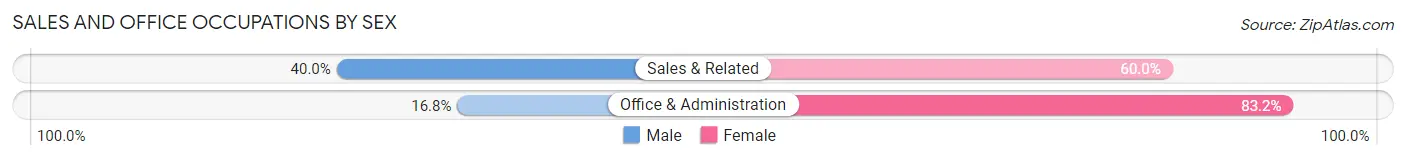
| Occupation | Male | Female |
| Sales & Related | 126 (40.0%) | 189 (60.0%) |
| Office & Administration | 22 (16.8%) | 109 (83.2%) |
| Total (Category) | 148 (33.2%) | 298 (66.8%) |
| Total (Overall) | 1,015 (53.6%) | 880 (46.4%) |
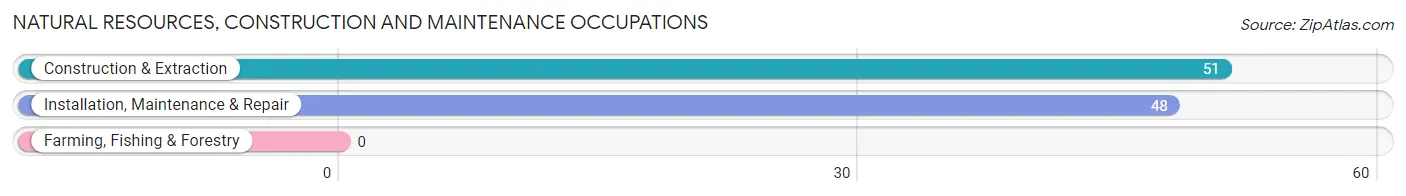
Natural Resources, Construction and Maintenance Occupations
The most common Natural Resources, Construction and Maintenance occupations in Syracuse are Construction & Extraction (51 | 2.7%), and Installation, Maintenance & Repair (48 | 2.5%).
Natural Resources, Construction and Maintenance Occupations by Sex
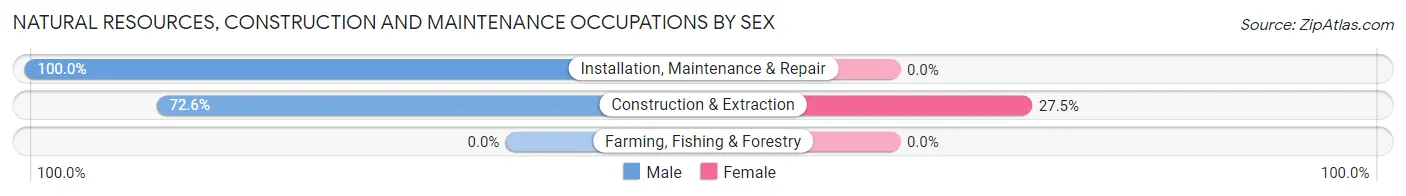
| Occupation | Male | Female |
| Farming, Fishing & Forestry | 0 (0.0%) | 0 (0.0%) |
| Construction & Extraction | 37 (72.6%) | 14 (27.5%) |
| Installation, Maintenance & Repair | 48 (100.0%) | 0 (0.0%) |
| Total (Category) | 85 (85.9%) | 14 (14.1%) |
| Total (Overall) | 1,015 (53.6%) | 880 (46.4%) |
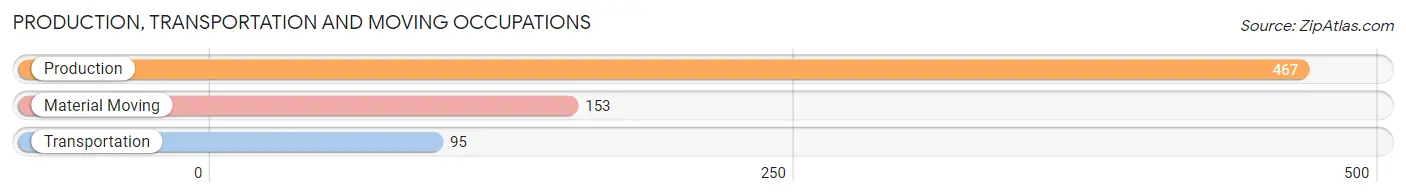
Production, Transportation and Moving Occupations
The most common Production, Transportation and Moving occupations in Syracuse are Production (467 | 24.6%), Material Moving (153 | 8.1%), and Transportation (95 | 5.0%).
Production, Transportation and Moving Occupations by Sex
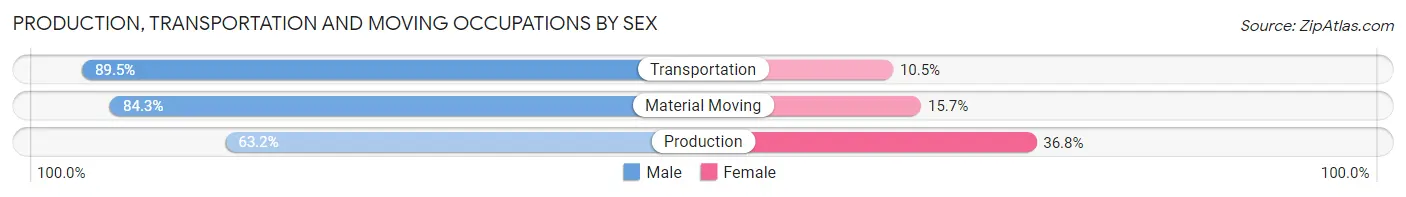
| Occupation | Male | Female |
| Production | 295 (63.2%) | 172 (36.8%) |
| Transportation | 85 (89.5%) | 10 (10.5%) |
| Material Moving | 129 (84.3%) | 24 (15.7%) |
| Total (Category) | 509 (71.2%) | 206 (28.8%) |
| Total (Overall) | 1,015 (53.6%) | 880 (46.4%) |
Employment Industries by Sex in Syracuse
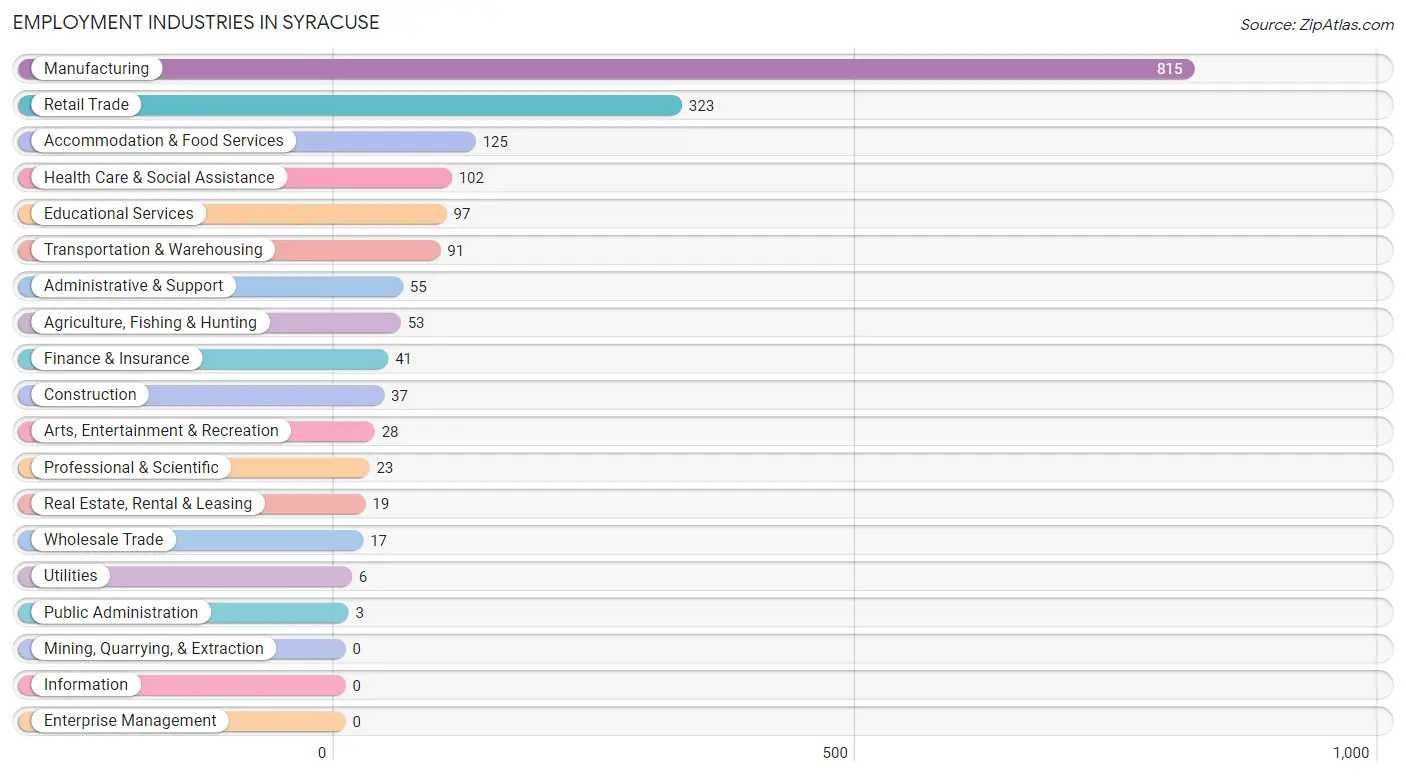
Employment Industries in Syracuse
The major employment industries in Syracuse include Manufacturing (815 | 43.0%), Retail Trade (323 | 17.0%), Accommodation & Food Services (125 | 6.6%), Health Care & Social Assistance (102 | 5.4%), and Educational Services (97 | 5.1%).
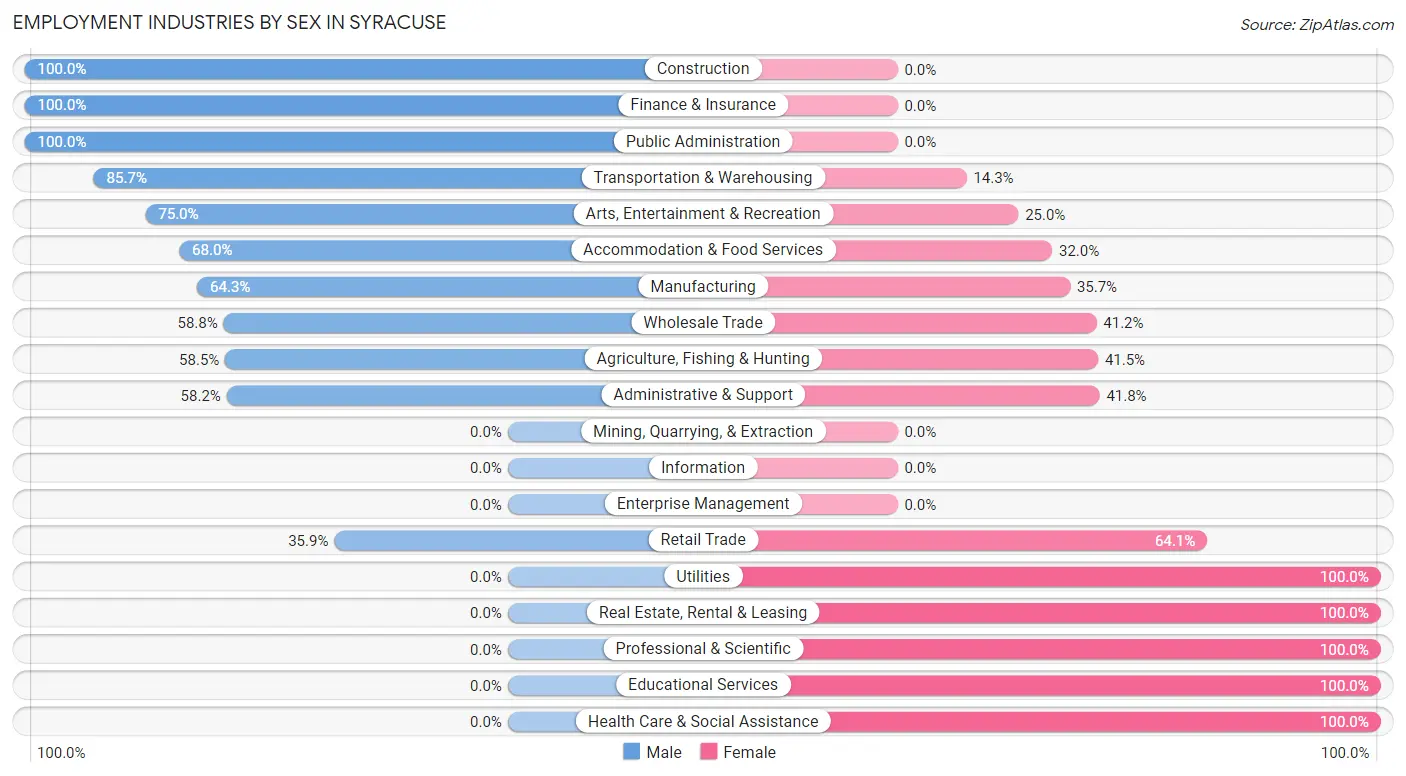
Employment Industries by Sex in Syracuse
The Syracuse industries that see more men than women are Construction (100.0%), Finance & Insurance (100.0%), and Public Administration (100.0%), whereas the industries that tend to have a higher number of women are Utilities (100.0%), Real Estate, Rental & Leasing (100.0%), and Professional & Scientific (100.0%).
| Industry | Male | Female |
| Agriculture, Fishing & Hunting | 31 (58.5%) | 22 (41.5%) |
| Mining, Quarrying, & Extraction | 0 (0.0%) | 0 (0.0%) |
| Construction | 37 (100.0%) | 0 (0.0%) |
| Manufacturing | 524 (64.3%) | 291 (35.7%) |
| Wholesale Trade | 10 (58.8%) | 7 (41.2%) |
| Retail Trade | 116 (35.9%) | 207 (64.1%) |
| Transportation & Warehousing | 78 (85.7%) | 13 (14.3%) |
| Utilities | 0 (0.0%) | 6 (100.0%) |
| Information | 0 (0.0%) | 0 (0.0%) |
| Finance & Insurance | 41 (100.0%) | 0 (0.0%) |
| Real Estate, Rental & Leasing | 0 (0.0%) | 19 (100.0%) |
| Professional & Scientific | 0 (0.0%) | 23 (100.0%) |
| Enterprise Management | 0 (0.0%) | 0 (0.0%) |
| Administrative & Support | 32 (58.2%) | 23 (41.8%) |
| Educational Services | 0 (0.0%) | 97 (100.0%) |
| Health Care & Social Assistance | 0 (0.0%) | 102 (100.0%) |
| Arts, Entertainment & Recreation | 21 (75.0%) | 7 (25.0%) |
| Accommodation & Food Services | 85 (68.0%) | 40 (32.0%) |
| Public Administration | 3 (100.0%) | 0 (0.0%) |
| Total | 1,015 (53.6%) | 880 (46.4%) |
Education in Syracuse
School Enrollment in Syracuse
The most common levels of schooling among the 457 students in Syracuse are high school (150 | 32.8%), middle school (123 | 26.9%), and college / undergraduate (75 | 16.4%).
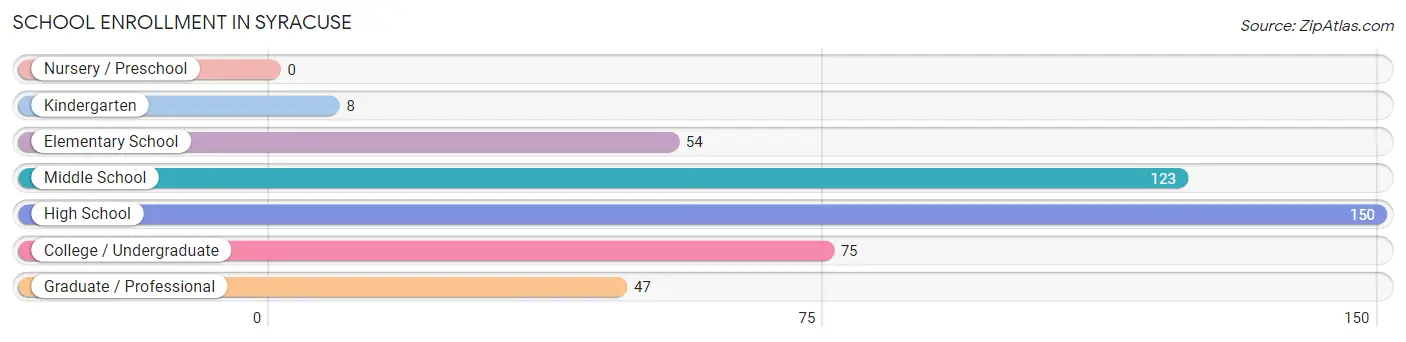
| School Level | # Students | % Students |
| Nursery / Preschool | 0 | 0.0% |
| Kindergarten | 8 | 1.8% |
| Elementary School | 54 | 11.8% |
| Middle School | 123 | 26.9% |
| High School | 150 | 32.8% |
| College / Undergraduate | 75 | 16.4% |
| Graduate / Professional | 47 | 10.3% |
| Total | 457 | 100.0% |
School Enrollment by Age by Funding Source in Syracuse
Out of a total of 457 students who are enrolled in schools in Syracuse, 67 (14.7%) attend a private institution, while the remaining 390 (85.3%) are enrolled in public schools. The age group of 25 to 34 year olds has the highest likelihood of being enrolled in private schools, with 28 (59.6% in the age bracket) enrolled. Conversely, the age group of 5 to 9 year old has the lowest likelihood of being enrolled in a private school, with 32 (100.0% in the age bracket) attending a public institution.
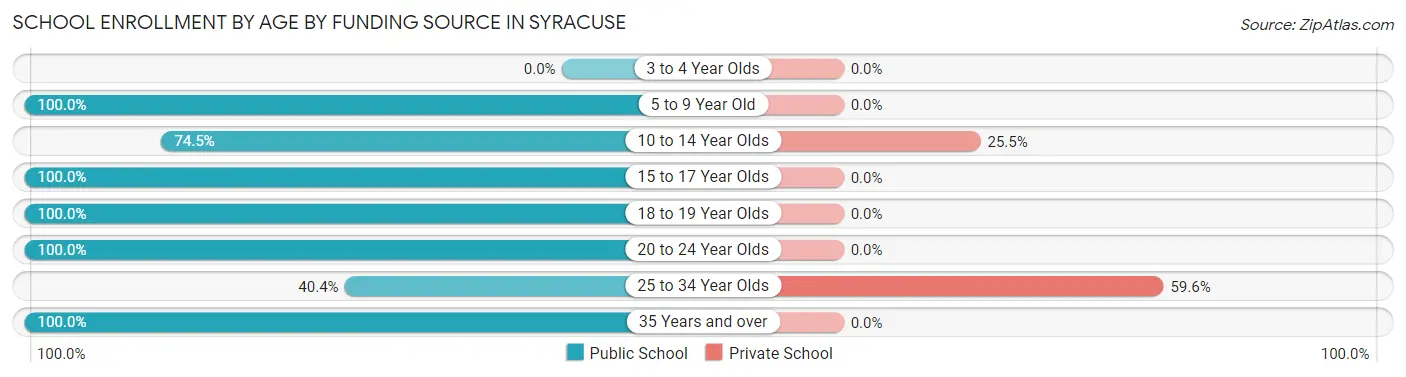
| Age Bracket | Public School | Private School |
| 3 to 4 Year Olds | 0 (0.0%) | 0 (0.0%) |
| 5 to 9 Year Old | 32 (100.0%) | 0 (0.0%) |
| 10 to 14 Year Olds | 114 (74.5%) | 39 (25.5%) |
| 15 to 17 Year Olds | 150 (100.0%) | 0 (0.0%) |
| 18 to 19 Year Olds | 50 (100.0%) | 0 (0.0%) |
| 20 to 24 Year Olds | 11 (100.0%) | 0 (0.0%) |
| 25 to 34 Year Olds | 19 (40.4%) | 28 (59.6%) |
| 35 Years and over | 14 (100.0%) | 0 (0.0%) |
| Total | 390 (85.3%) | 67 (14.7%) |
Educational Attainment by Field of Study in Syracuse
Education (208 | 36.8%), business (113 | 20.0%), arts & humanities (72 | 12.7%), liberal arts & history (60 | 10.6%), and visual & performing arts (27 | 4.8%) are the most common fields of study among 565 individuals in Syracuse who have obtained a bachelor's degree or higher.
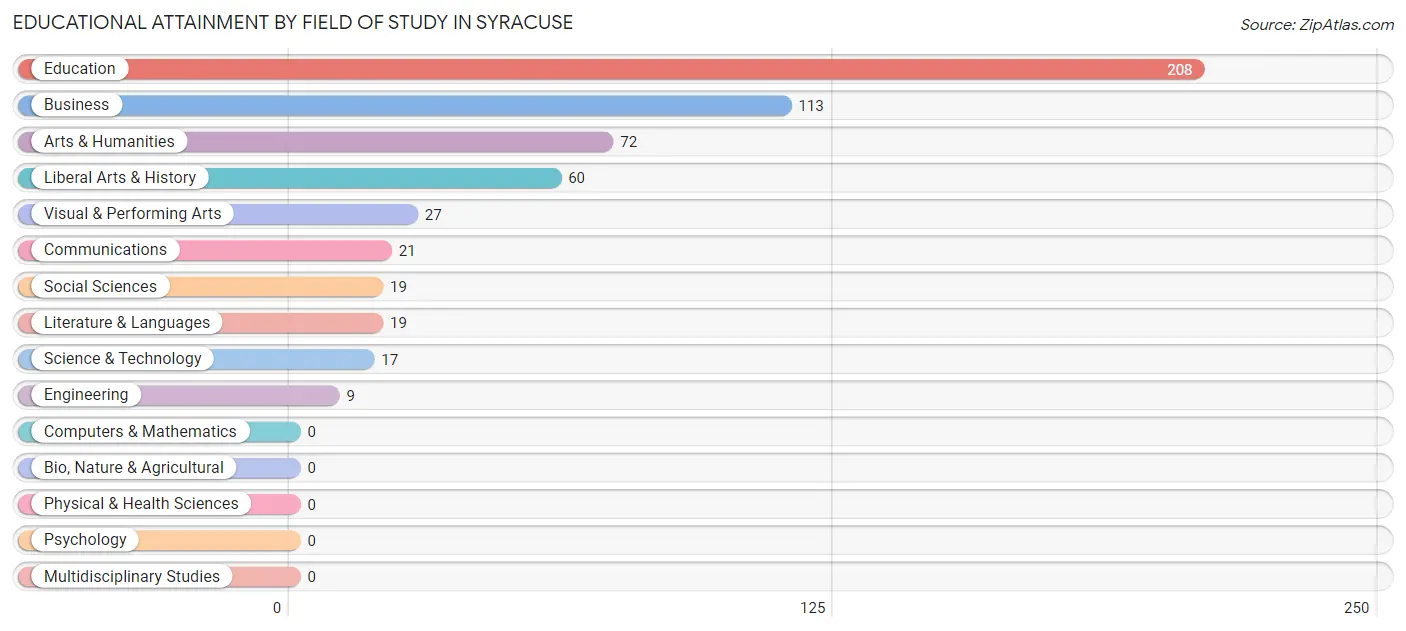
| Field of Study | # Graduates | % Graduates |
| Computers & Mathematics | 0 | 0.0% |
| Bio, Nature & Agricultural | 0 | 0.0% |
| Physical & Health Sciences | 0 | 0.0% |
| Psychology | 0 | 0.0% |
| Social Sciences | 19 | 3.4% |
| Engineering | 9 | 1.6% |
| Multidisciplinary Studies | 0 | 0.0% |
| Science & Technology | 17 | 3.0% |
| Business | 113 | 20.0% |
| Education | 208 | 36.8% |
| Literature & Languages | 19 | 3.4% |
| Liberal Arts & History | 60 | 10.6% |
| Visual & Performing Arts | 27 | 4.8% |
| Communications | 21 | 3.7% |
| Arts & Humanities | 72 | 12.7% |
| Total | 565 | 100.0% |
Transportation & Commute in Syracuse
Vehicle Availability by Sex in Syracuse
The most prevalent vehicle ownership categories in Syracuse are males with 2 vehicles (346, accounting for 35.6%) and females with 2 vehicles (252, making up 40.4%).
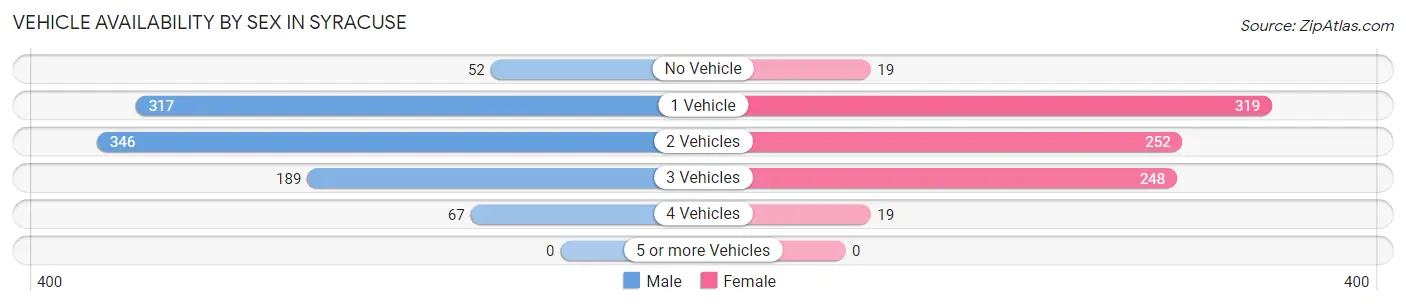
| Vehicles Available | Male | Female |
| No Vehicle | 52 (5.4%) | 19 (2.2%) |
| 1 Vehicle | 317 (32.7%) | 319 (37.2%) |
| 2 Vehicles | 346 (35.6%) | 252 (29.4%) |
| 3 Vehicles | 189 (19.5%) | 248 (28.9%) |
| 4 Vehicles | 67 (6.9%) | 19 (2.2%) |
| 5 or more Vehicles | 0 (0.0%) | 0 (0.0%) |
| Total | 971 (100.0%) | 857 (100.0%) |
Commute Time in Syracuse
The most frequently occuring commute durations in Syracuse are less than 5 minutes (340 commuters, 19.0%), 5 to 9 minutes (297 commuters, 16.6%), and 20 to 24 minutes (264 commuters, 14.8%).
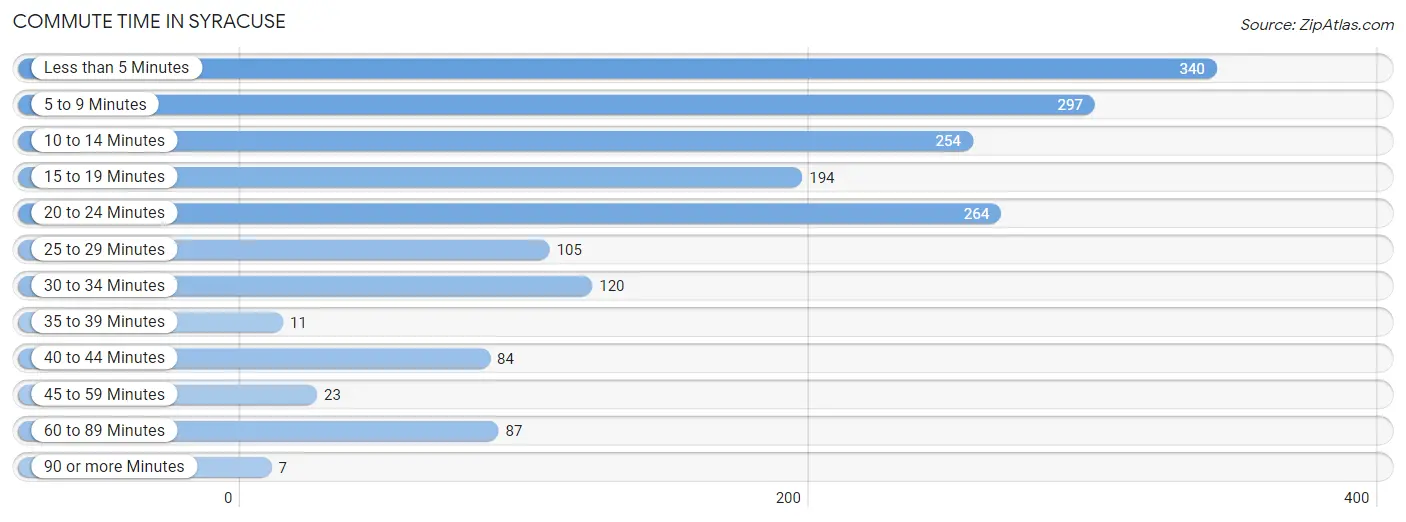
| Commute Time | # Commuters | % Commuters |
| Less than 5 Minutes | 340 | 19.0% |
| 5 to 9 Minutes | 297 | 16.6% |
| 10 to 14 Minutes | 254 | 14.2% |
| 15 to 19 Minutes | 194 | 10.9% |
| 20 to 24 Minutes | 264 | 14.8% |
| 25 to 29 Minutes | 105 | 5.9% |
| 30 to 34 Minutes | 120 | 6.7% |
| 35 to 39 Minutes | 11 | 0.6% |
| 40 to 44 Minutes | 84 | 4.7% |
| 45 to 59 Minutes | 23 | 1.3% |
| 60 to 89 Minutes | 87 | 4.9% |
| 90 or more Minutes | 7 | 0.4% |
Commute Time by Sex in Syracuse
The most common commute times in Syracuse are 5 to 9 minutes (192 commuters, 20.0%) for males and 20 to 24 minutes (206 commuters, 24.9%) for females.
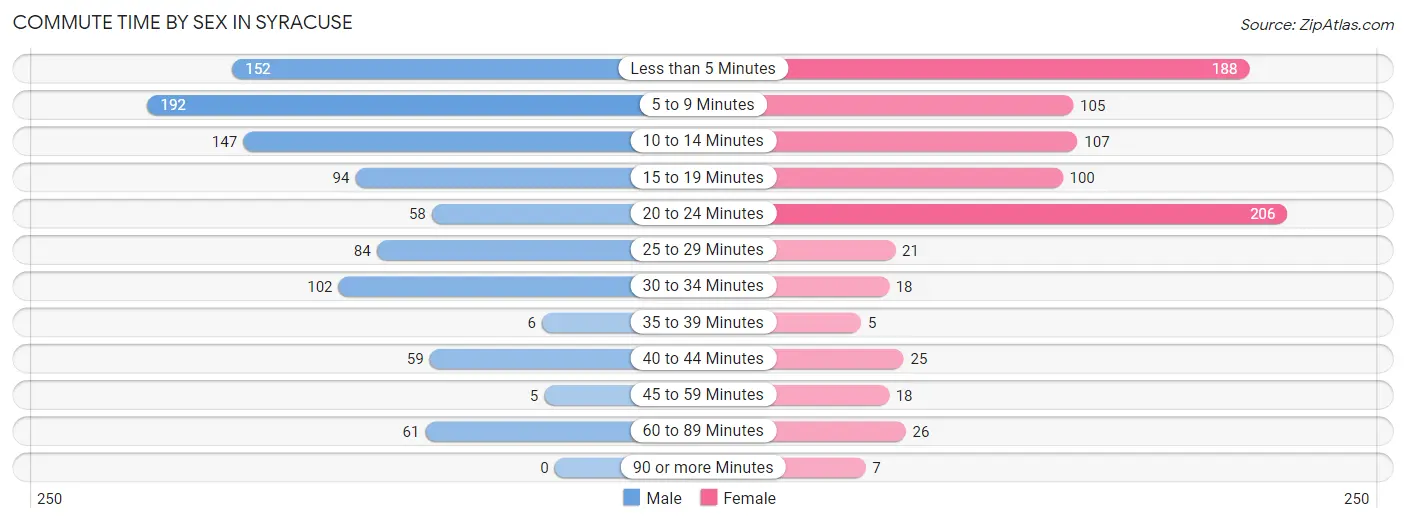
| Commute Time | Male | Female |
| Less than 5 Minutes | 152 (15.8%) | 188 (22.8%) |
| 5 to 9 Minutes | 192 (20.0%) | 105 (12.7%) |
| 10 to 14 Minutes | 147 (15.3%) | 107 (13.0%) |
| 15 to 19 Minutes | 94 (9.8%) | 100 (12.1%) |
| 20 to 24 Minutes | 58 (6.0%) | 206 (24.9%) |
| 25 to 29 Minutes | 84 (8.7%) | 21 (2.5%) |
| 30 to 34 Minutes | 102 (10.6%) | 18 (2.2%) |
| 35 to 39 Minutes | 6 (0.6%) | 5 (0.6%) |
| 40 to 44 Minutes | 59 (6.1%) | 25 (3.0%) |
| 45 to 59 Minutes | 5 (0.5%) | 18 (2.2%) |
| 60 to 89 Minutes | 61 (6.4%) | 26 (3.2%) |
| 90 or more Minutes | 0 (0.0%) | 7 (0.9%) |
Time of Departure to Work by Sex in Syracuse
The most frequent times of departure to work in Syracuse are 12:00 AM to 4:59 AM (279, 29.1%) for males and 7:00 AM to 7:29 AM (214, 25.9%) for females.
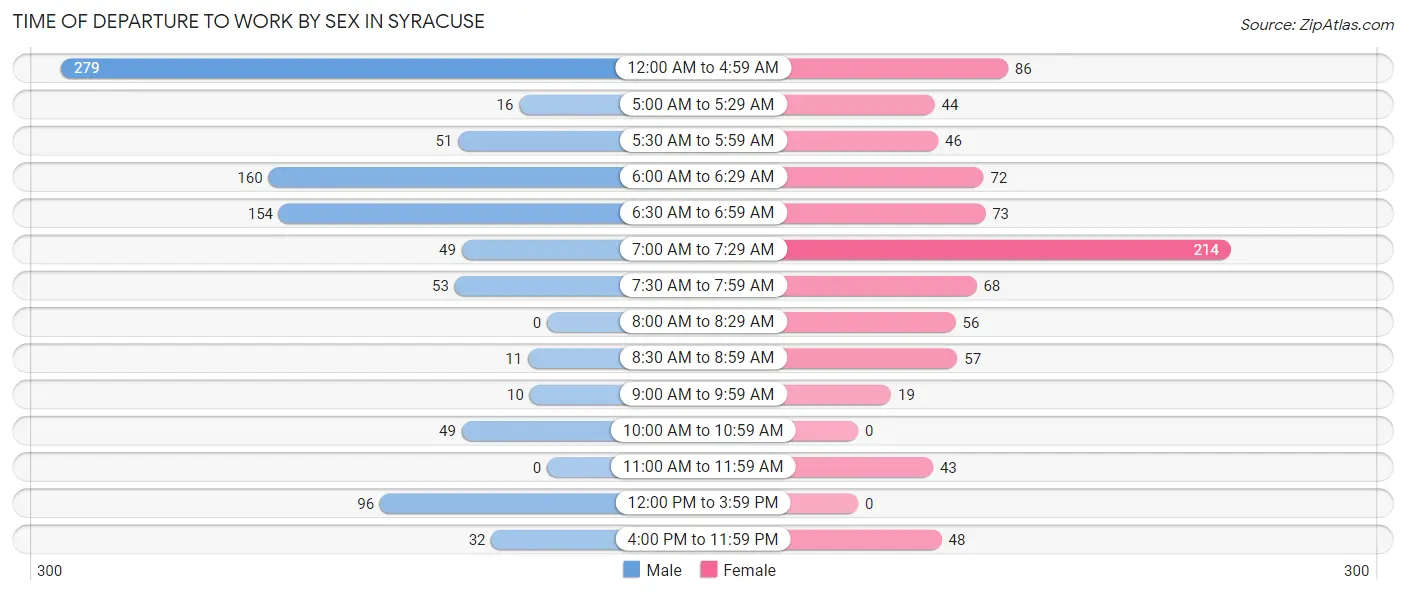
| Time of Departure | Male | Female |
| 12:00 AM to 4:59 AM | 279 (29.1%) | 86 (10.4%) |
| 5:00 AM to 5:29 AM | 16 (1.7%) | 44 (5.3%) |
| 5:30 AM to 5:59 AM | 51 (5.3%) | 46 (5.6%) |
| 6:00 AM to 6:29 AM | 160 (16.7%) | 72 (8.7%) |
| 6:30 AM to 6:59 AM | 154 (16.0%) | 73 (8.8%) |
| 7:00 AM to 7:29 AM | 49 (5.1%) | 214 (25.9%) |
| 7:30 AM to 7:59 AM | 53 (5.5%) | 68 (8.2%) |
| 8:00 AM to 8:29 AM | 0 (0.0%) | 56 (6.8%) |
| 8:30 AM to 8:59 AM | 11 (1.1%) | 57 (6.9%) |
| 9:00 AM to 9:59 AM | 10 (1.0%) | 19 (2.3%) |
| 10:00 AM to 10:59 AM | 49 (5.1%) | 0 (0.0%) |
| 11:00 AM to 11:59 AM | 0 (0.0%) | 43 (5.2%) |
| 12:00 PM to 3:59 PM | 96 (10.0%) | 0 (0.0%) |
| 4:00 PM to 11:59 PM | 32 (3.3%) | 48 (5.8%) |
| Total | 960 (100.0%) | 826 (100.0%) |
Housing Occupancy in Syracuse
Occupancy by Ownership in Syracuse
Of the total 1,447 dwellings in Syracuse, owner-occupied units account for 915 (63.2%), while renter-occupied units make up 532 (36.8%).
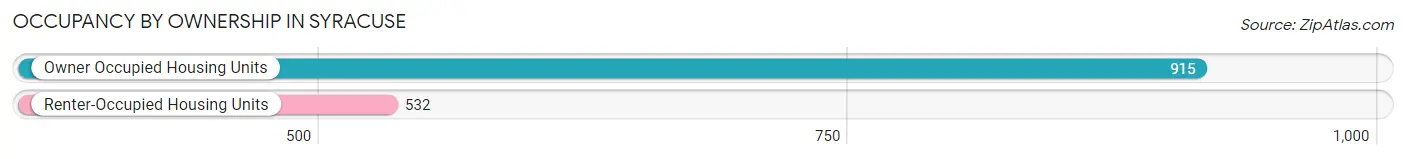
| Occupancy | # Housing Units | % Housing Units |
| Owner Occupied Housing Units | 915 | 63.2% |
| Renter-Occupied Housing Units | 532 | 36.8% |
| Total Occupied Housing Units | 1,447 | 100.0% |
Occupancy by Household Size in Syracuse
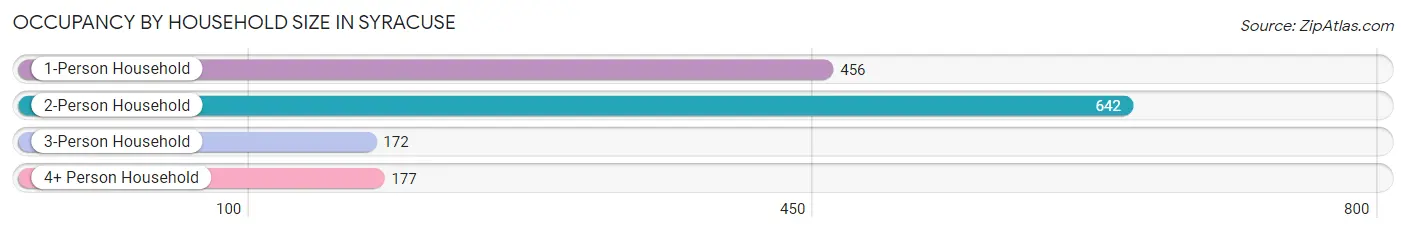
| Household Size | # Housing Units | % Housing Units |
| 1-Person Household | 456 | 31.5% |
| 2-Person Household | 642 | 44.4% |
| 3-Person Household | 172 | 11.9% |
| 4+ Person Household | 177 | 12.2% |
| Total Housing Units | 1,447 | 100.0% |
Occupancy by Ownership by Household Size in Syracuse
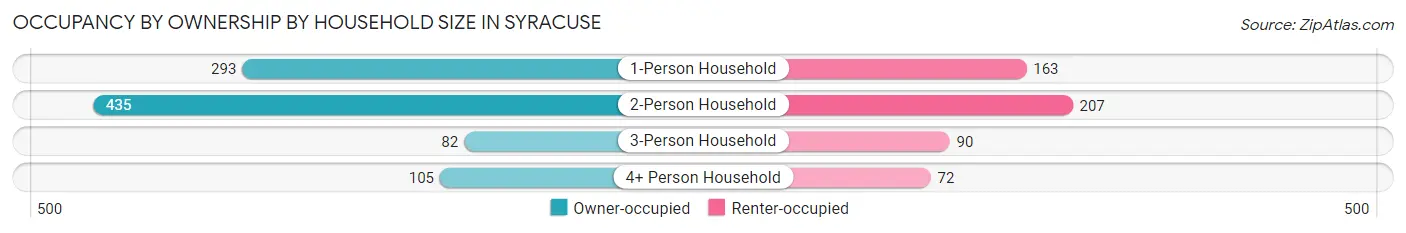
| Household Size | Owner-occupied | Renter-occupied |
| 1-Person Household | 293 (64.2%) | 163 (35.7%) |
| 2-Person Household | 435 (67.8%) | 207 (32.2%) |
| 3-Person Household | 82 (47.7%) | 90 (52.3%) |
| 4+ Person Household | 105 (59.3%) | 72 (40.7%) |
| Total Housing Units | 915 (63.2%) | 532 (36.8%) |
Occupancy by Educational Attainment in Syracuse
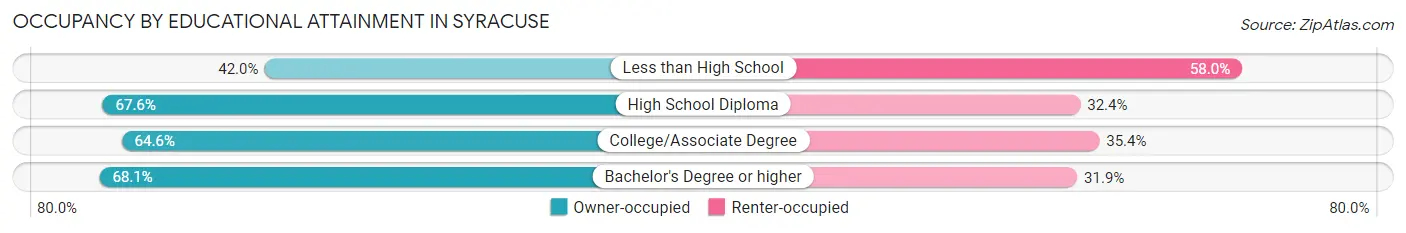
| Household Size | Owner-occupied | Renter-occupied |
| Less than High School | 89 (42.0%) | 123 (58.0%) |
| High School Diploma | 378 (67.6%) | 181 (32.4%) |
| College/Associate Degree | 230 (64.6%) | 126 (35.4%) |
| Bachelor's Degree or higher | 218 (68.1%) | 102 (31.9%) |
Occupancy by Age of Householder in Syracuse
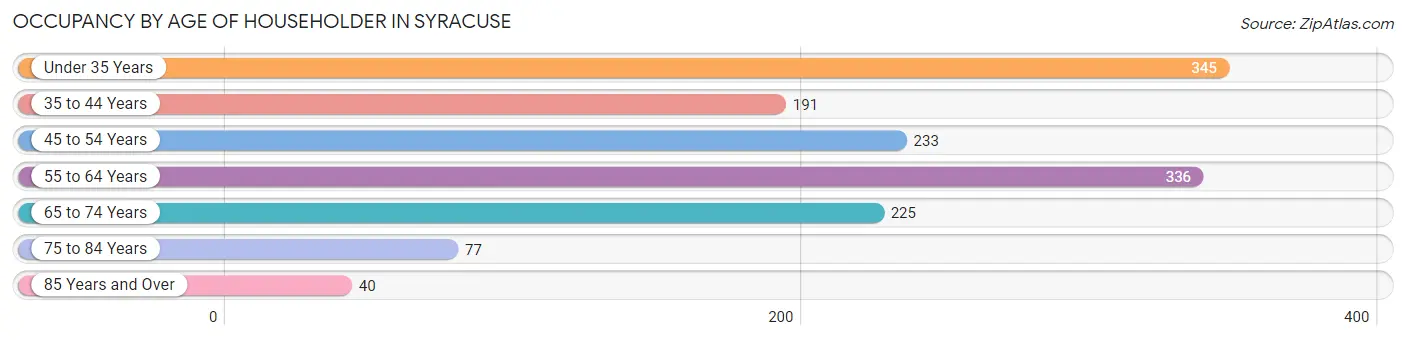
| Age Bracket | # Households | % Households |
| Under 35 Years | 345 | 23.8% |
| 35 to 44 Years | 191 | 13.2% |
| 45 to 54 Years | 233 | 16.1% |
| 55 to 64 Years | 336 | 23.2% |
| 65 to 74 Years | 225 | 15.5% |
| 75 to 84 Years | 77 | 5.3% |
| 85 Years and Over | 40 | 2.8% |
| Total | 1,447 | 100.0% |
Housing Finances in Syracuse
Median Income by Occupancy in Syracuse
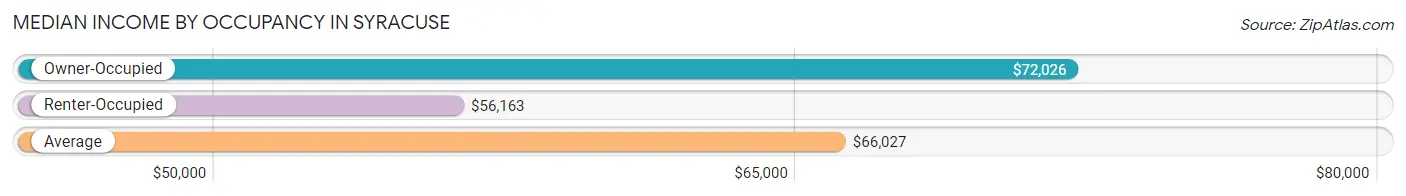
| Occupancy Type | # Households | Median Income |
| Owner-Occupied | 915 (63.2%) | $72,026 |
| Renter-Occupied | 532 (36.8%) | $56,163 |
| Average | 1,447 (100.0%) | $66,027 |
Occupancy by Householder Income Bracket in Syracuse
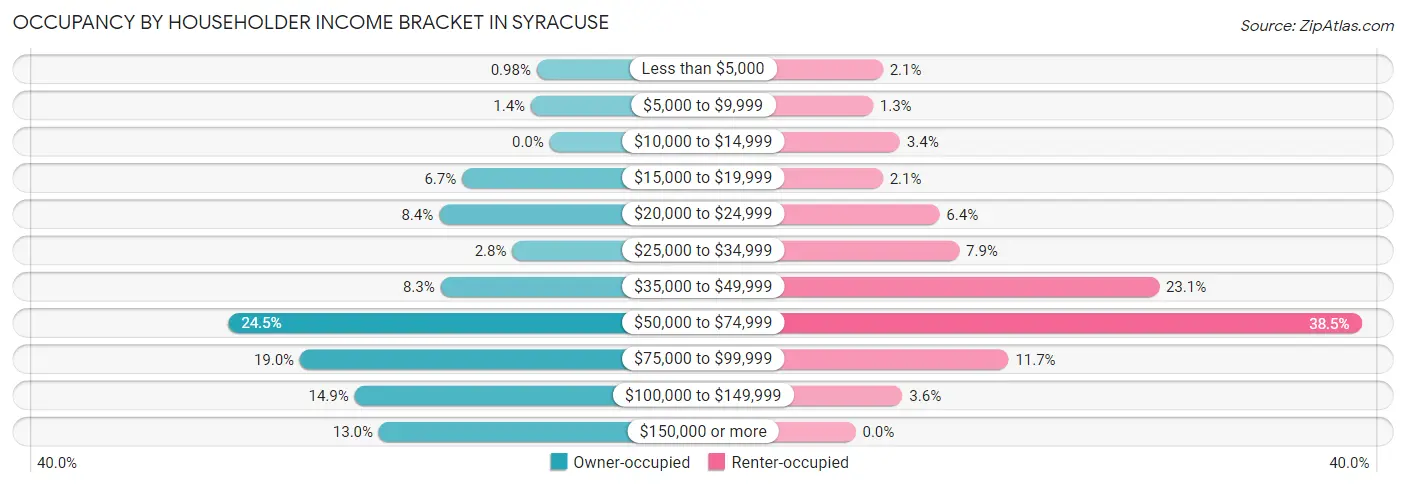
| Income Bracket | Owner-occupied | Renter-occupied |
| Less than $5,000 | 9 (1.0%) | 11 (2.1%) |
| $5,000 to $9,999 | 13 (1.4%) | 7 (1.3%) |
| $10,000 to $14,999 | 0 (0.0%) | 18 (3.4%) |
| $15,000 to $19,999 | 61 (6.7%) | 11 (2.1%) |
| $20,000 to $24,999 | 77 (8.4%) | 34 (6.4%) |
| $25,000 to $34,999 | 26 (2.8%) | 42 (7.9%) |
| $35,000 to $49,999 | 76 (8.3%) | 123 (23.1%) |
| $50,000 to $74,999 | 224 (24.5%) | 205 (38.5%) |
| $75,000 to $99,999 | 174 (19.0%) | 62 (11.7%) |
| $100,000 to $149,999 | 136 (14.9%) | 19 (3.6%) |
| $150,000 or more | 119 (13.0%) | 0 (0.0%) |
| Total | 915 (100.0%) | 532 (100.0%) |
Monthly Housing Cost Tiers in Syracuse
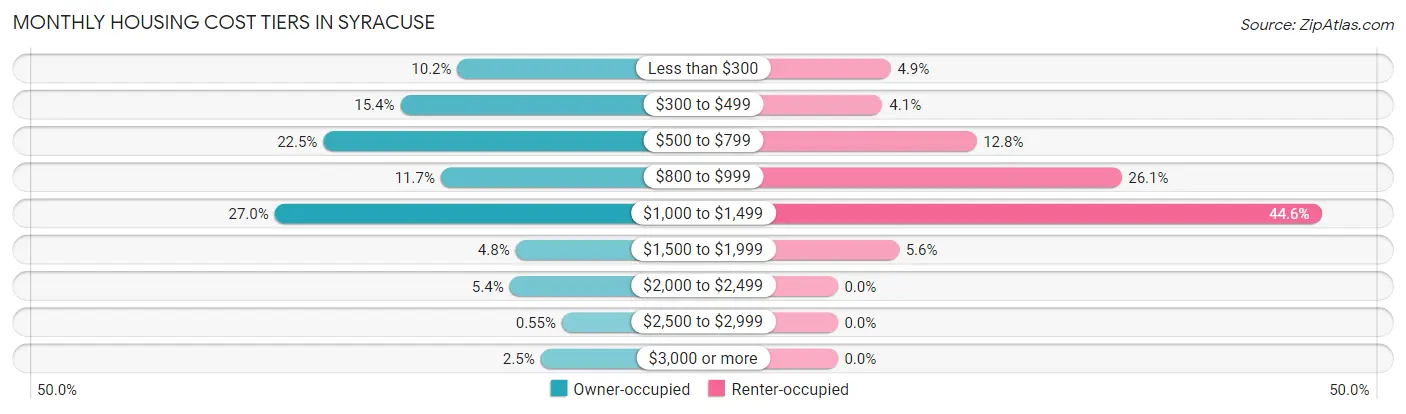
| Monthly Cost | Owner-occupied | Renter-occupied |
| Less than $300 | 93 (10.2%) | 26 (4.9%) |
| $300 to $499 | 141 (15.4%) | 22 (4.1%) |
| $500 to $799 | 206 (22.5%) | 68 (12.8%) |
| $800 to $999 | 107 (11.7%) | 139 (26.1%) |
| $1,000 to $1,499 | 247 (27.0%) | 237 (44.6%) |
| $1,500 to $1,999 | 44 (4.8%) | 30 (5.6%) |
| $2,000 to $2,499 | 49 (5.4%) | 0 (0.0%) |
| $2,500 to $2,999 | 5 (0.5%) | 0 (0.0%) |
| $3,000 or more | 23 (2.5%) | 0 (0.0%) |
| Total | 915 (100.0%) | 532 (100.0%) |
Physical Housing Characteristics in Syracuse
Housing Structures in Syracuse
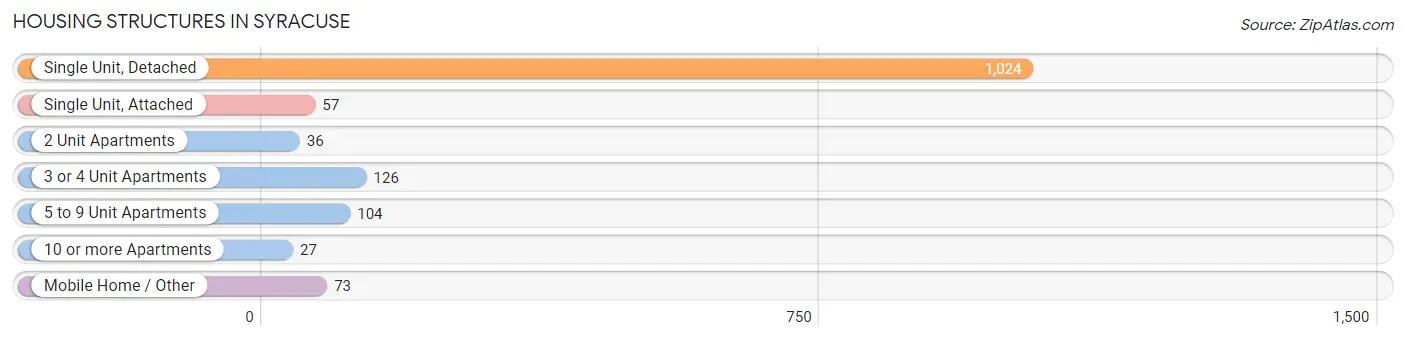
| Structure Type | # Housing Units | % Housing Units |
| Single Unit, Detached | 1,024 | 70.8% |
| Single Unit, Attached | 57 | 3.9% |
| 2 Unit Apartments | 36 | 2.5% |
| 3 or 4 Unit Apartments | 126 | 8.7% |
| 5 to 9 Unit Apartments | 104 | 7.2% |
| 10 or more Apartments | 27 | 1.9% |
| Mobile Home / Other | 73 | 5.0% |
| Total | 1,447 | 100.0% |
Housing Structures by Occupancy in Syracuse
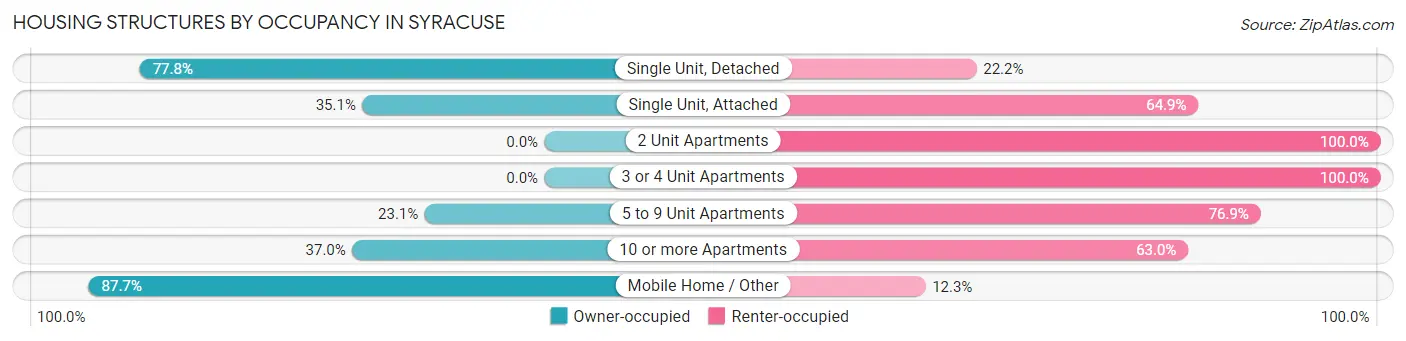
| Structure Type | Owner-occupied | Renter-occupied |
| Single Unit, Detached | 797 (77.8%) | 227 (22.2%) |
| Single Unit, Attached | 20 (35.1%) | 37 (64.9%) |
| 2 Unit Apartments | 0 (0.0%) | 36 (100.0%) |
| 3 or 4 Unit Apartments | 0 (0.0%) | 126 (100.0%) |
| 5 to 9 Unit Apartments | 24 (23.1%) | 80 (76.9%) |
| 10 or more Apartments | 10 (37.0%) | 17 (63.0%) |
| Mobile Home / Other | 64 (87.7%) | 9 (12.3%) |
| Total | 915 (63.2%) | 532 (36.8%) |
Housing Structures by Number of Rooms in Syracuse
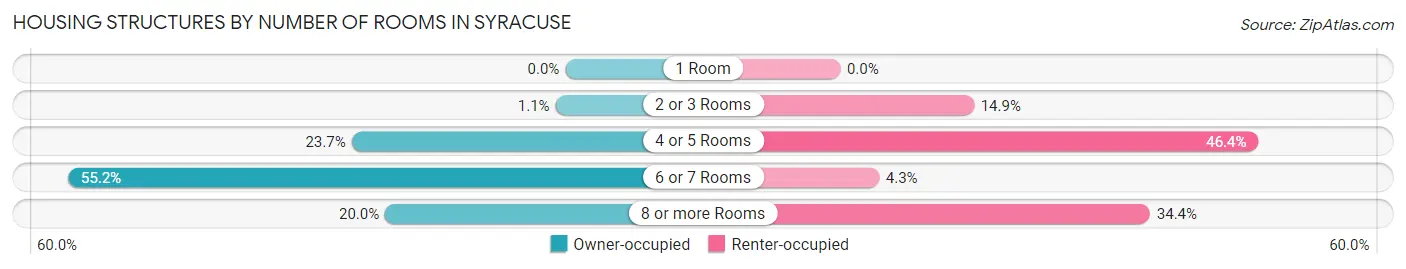
| Number of Rooms | Owner-occupied | Renter-occupied |
| 1 Room | 0 (0.0%) | 0 (0.0%) |
| 2 or 3 Rooms | 10 (1.1%) | 79 (14.8%) |
| 4 or 5 Rooms | 217 (23.7%) | 247 (46.4%) |
| 6 or 7 Rooms | 505 (55.2%) | 23 (4.3%) |
| 8 or more Rooms | 183 (20.0%) | 183 (34.4%) |
| Total | 915 (100.0%) | 532 (100.0%) |
Housing Structure by Heating Type in Syracuse
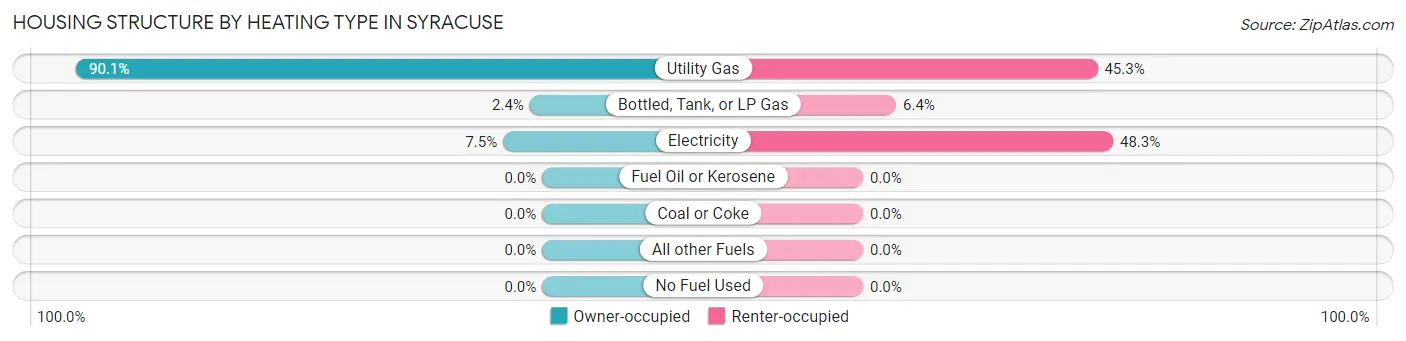
| Heating Type | Owner-occupied | Renter-occupied |
| Utility Gas | 824 (90.0%) | 241 (45.3%) |
| Bottled, Tank, or LP Gas | 22 (2.4%) | 34 (6.4%) |
| Electricity | 69 (7.5%) | 257 (48.3%) |
| Fuel Oil or Kerosene | 0 (0.0%) | 0 (0.0%) |
| Coal or Coke | 0 (0.0%) | 0 (0.0%) |
| All other Fuels | 0 (0.0%) | 0 (0.0%) |
| No Fuel Used | 0 (0.0%) | 0 (0.0%) |
| Total | 915 (100.0%) | 532 (100.0%) |
Household Vehicle Usage in Syracuse
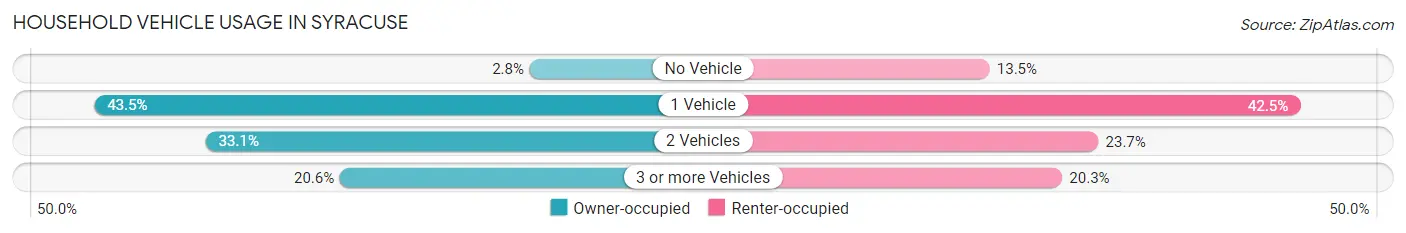
| Vehicles per Household | Owner-occupied | Renter-occupied |
| No Vehicle | 26 (2.8%) | 72 (13.5%) |
| 1 Vehicle | 398 (43.5%) | 226 (42.5%) |
| 2 Vehicles | 303 (33.1%) | 126 (23.7%) |
| 3 or more Vehicles | 188 (20.5%) | 108 (20.3%) |
| Total | 915 (100.0%) | 532 (100.0%) |
Real Estate & Mortgages in Syracuse
Real Estate and Mortgage Overview in Syracuse
| Characteristic | Without Mortgage | With Mortgage |
| Housing Units | 356 | 559 |
| Median Property Value | $109,200 | $180,900 |
| Median Household Income | $54,563 | $107 |
| Monthly Housing Costs | $416 | $23 |
| Real Estate Taxes | $639 | $24 |
Property Value by Mortgage Status in Syracuse
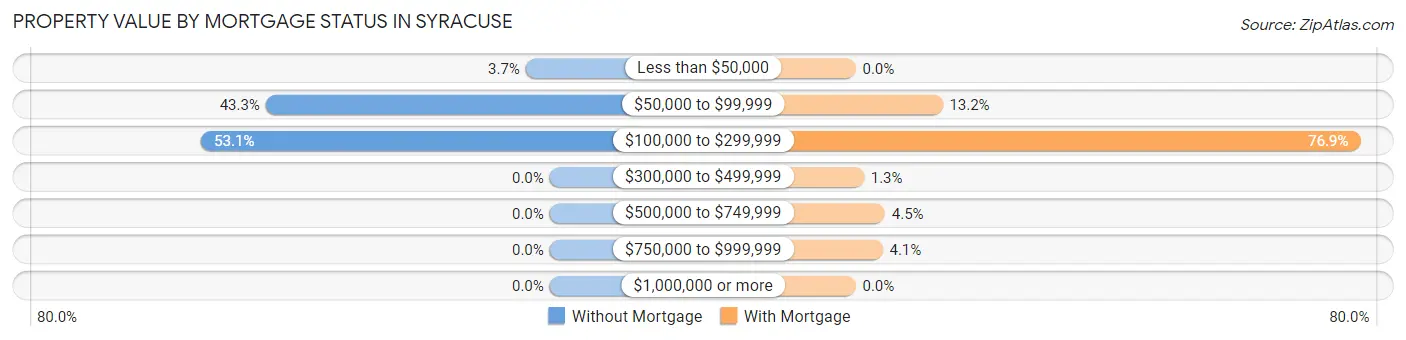
| Property Value | Without Mortgage | With Mortgage |
| Less than $50,000 | 13 (3.6%) | 0 (0.0%) |
| $50,000 to $99,999 | 154 (43.3%) | 74 (13.2%) |
| $100,000 to $299,999 | 189 (53.1%) | 430 (76.9%) |
| $300,000 to $499,999 | 0 (0.0%) | 7 (1.3%) |
| $500,000 to $749,999 | 0 (0.0%) | 25 (4.5%) |
| $750,000 to $999,999 | 0 (0.0%) | 23 (4.1%) |
| $1,000,000 or more | 0 (0.0%) | 0 (0.0%) |
| Total | 356 (100.0%) | 559 (100.0%) |
Household Income by Mortgage Status in Syracuse
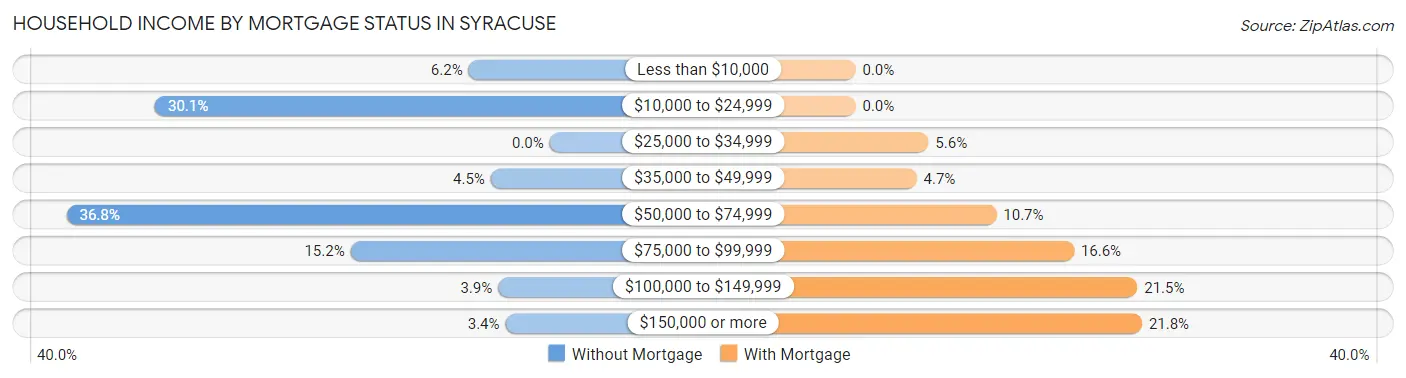
| Household Income | Without Mortgage | With Mortgage |
| Less than $10,000 | 22 (6.2%) | 0 (0.0%) |
| $10,000 to $24,999 | 107 (30.1%) | 0 (0.0%) |
| $25,000 to $34,999 | 0 (0.0%) | 31 (5.6%) |
| $35,000 to $49,999 | 16 (4.5%) | 26 (4.6%) |
| $50,000 to $74,999 | 131 (36.8%) | 60 (10.7%) |
| $75,000 to $99,999 | 54 (15.2%) | 93 (16.6%) |
| $100,000 to $149,999 | 14 (3.9%) | 120 (21.5%) |
| $150,000 or more | 12 (3.4%) | 122 (21.8%) |
| Total | 356 (100.0%) | 559 (100.0%) |
Property Value to Household Income Ratio in Syracuse
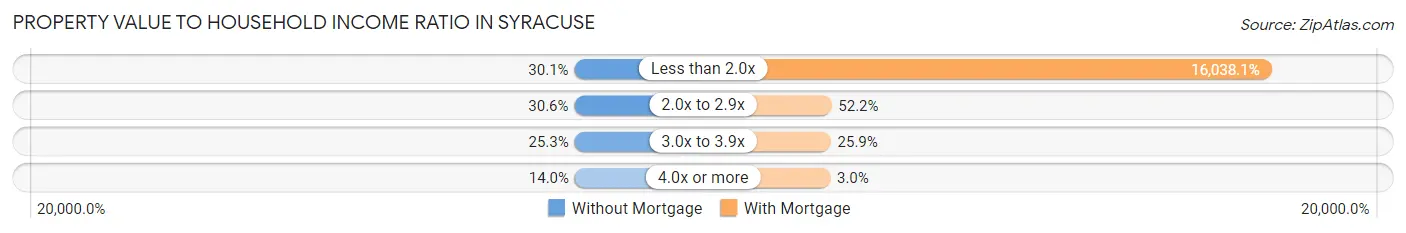
| Value-to-Income Ratio | Without Mortgage | With Mortgage |
| Less than 2.0x | 107 (30.1%) | 89,653 (16,038.1%) |
| 2.0x to 2.9x | 109 (30.6%) | 292 (52.2%) |
| 3.0x to 3.9x | 90 (25.3%) | 145 (25.9%) |
| 4.0x or more | 50 (14.0%) | 17 (3.0%) |
| Total | 356 (100.0%) | 559 (100.0%) |
Real Estate Taxes by Mortgage Status in Syracuse
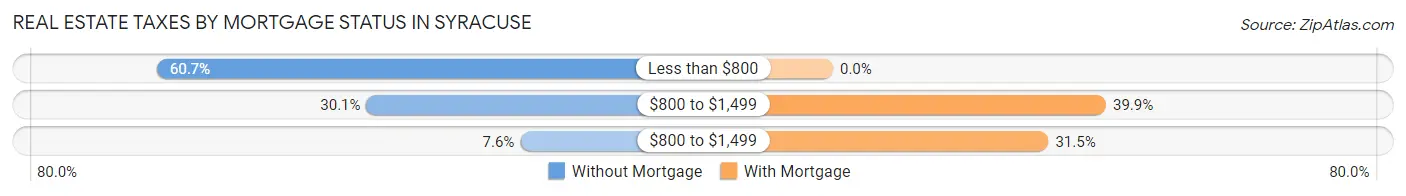
| Property Taxes | Without Mortgage | With Mortgage |
| Less than $800 | 216 (60.7%) | 0 (0.0%) |
| $800 to $1,499 | 107 (30.1%) | 223 (39.9%) |
| $800 to $1,499 | 27 (7.6%) | 176 (31.5%) |
| Total | 356 (100.0%) | 559 (100.0%) |
Health & Disability in Syracuse
Health Insurance Coverage by Age in Syracuse
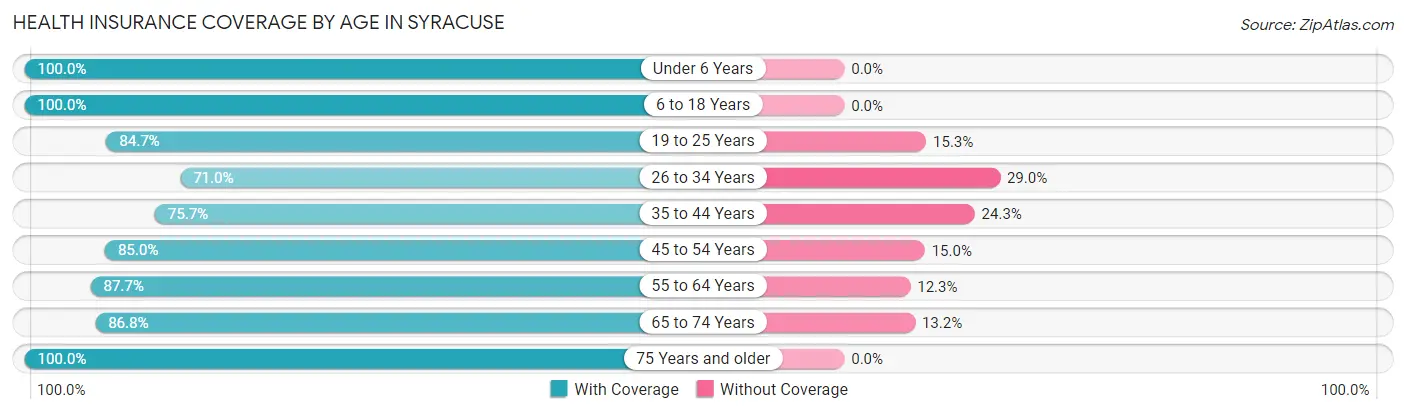
| Age Bracket | With Coverage | Without Coverage |
| Under 6 Years | 71 (100.0%) | 0 (0.0%) |
| 6 to 18 Years | 391 (100.0%) | 0 (0.0%) |
| 19 to 25 Years | 272 (84.7%) | 49 (15.3%) |
| 26 to 34 Years | 264 (71.0%) | 108 (29.0%) |
| 35 to 44 Years | 274 (75.7%) | 88 (24.3%) |
| 45 to 54 Years | 391 (85.0%) | 69 (15.0%) |
| 55 to 64 Years | 513 (87.7%) | 72 (12.3%) |
| 65 to 74 Years | 270 (86.8%) | 41 (13.2%) |
| 75 Years and older | 197 (100.0%) | 0 (0.0%) |
| Total | 2,643 (86.1%) | 427 (13.9%) |
Health Insurance Coverage by Citizenship Status in Syracuse
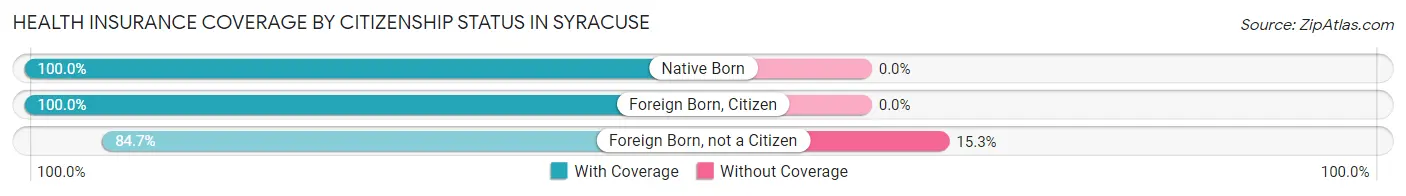
| Citizenship Status | With Coverage | Without Coverage |
| Native Born | 71 (100.0%) | 0 (0.0%) |
| Foreign Born, Citizen | 391 (100.0%) | 0 (0.0%) |
| Foreign Born, not a Citizen | 272 (84.7%) | 49 (15.3%) |
Health Insurance Coverage by Household Income in Syracuse
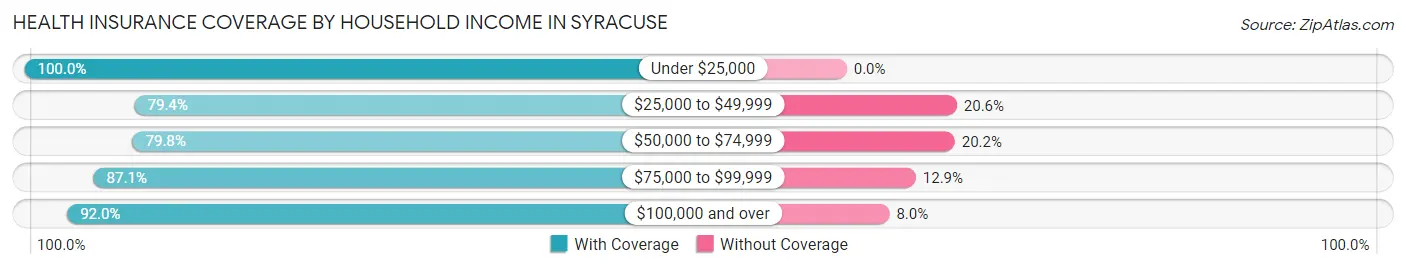
| Household Income | With Coverage | Without Coverage |
| Under $25,000 | 284 (100.0%) | 0 (0.0%) |
| $25,000 to $49,999 | 358 (79.4%) | 93 (20.6%) |
| $50,000 to $74,999 | 741 (79.8%) | 188 (20.2%) |
| $75,000 to $99,999 | 592 (87.1%) | 88 (12.9%) |
| $100,000 and over | 668 (92.0%) | 58 (8.0%) |
Public vs Private Health Insurance Coverage by Age in Syracuse
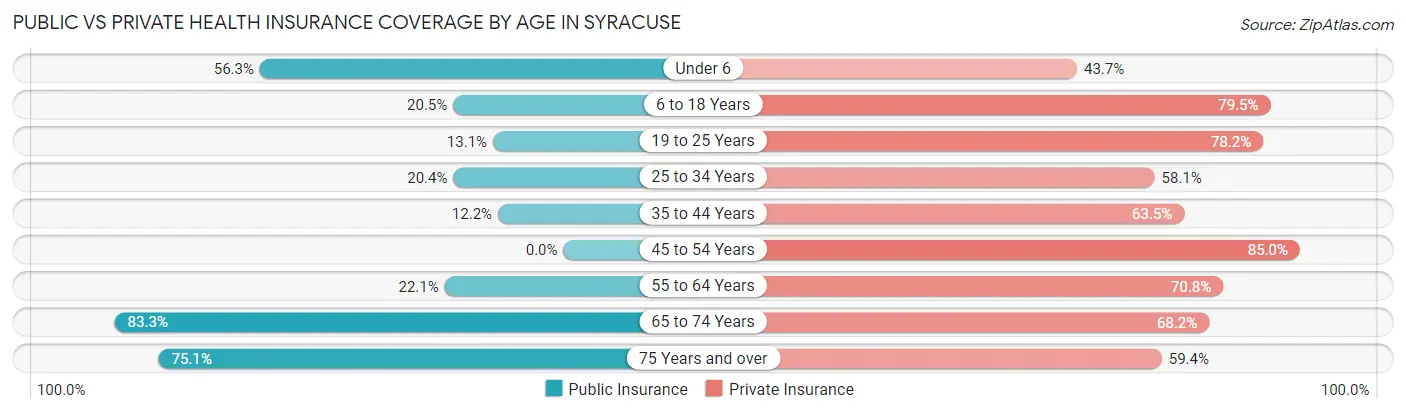
| Age Bracket | Public Insurance | Private Insurance |
| Under 6 | 40 (56.3%) | 31 (43.7%) |
| 6 to 18 Years | 80 (20.5%) | 311 (79.5%) |
| 19 to 25 Years | 42 (13.1%) | 251 (78.2%) |
| 25 to 34 Years | 76 (20.4%) | 216 (58.1%) |
| 35 to 44 Years | 44 (12.1%) | 230 (63.5%) |
| 45 to 54 Years | 0 (0.0%) | 391 (85.0%) |
| 55 to 64 Years | 129 (22.1%) | 414 (70.8%) |
| 65 to 74 Years | 259 (83.3%) | 212 (68.2%) |
| 75 Years and over | 148 (75.1%) | 117 (59.4%) |
| Total | 818 (26.6%) | 2,173 (70.8%) |
Disability Status by Sex by Age in Syracuse
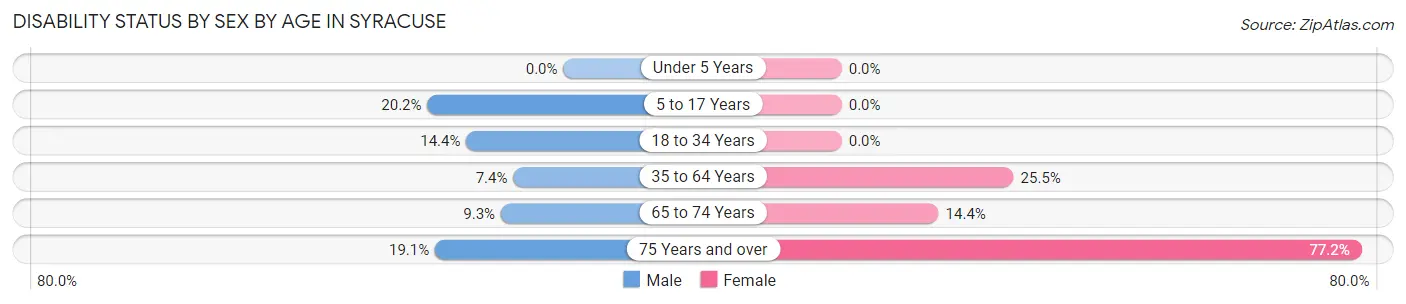
| Age Bracket | Male | Female |
| Under 5 Years | 0 (0.0%) | 0 (0.0%) |
| 5 to 17 Years | 43 (20.2%) | 0 (0.0%) |
| 18 to 34 Years | 64 (14.4%) | 0 (0.0%) |
| 35 to 64 Years | 44 (7.4%) | 208 (25.5%) |
| 65 to 74 Years | 14 (9.3%) | 23 (14.4%) |
| 75 Years and over | 20 (19.1%) | 71 (77.2%) |
Disability Class by Sex by Age in Syracuse
Disability Class: Hearing Difficulty
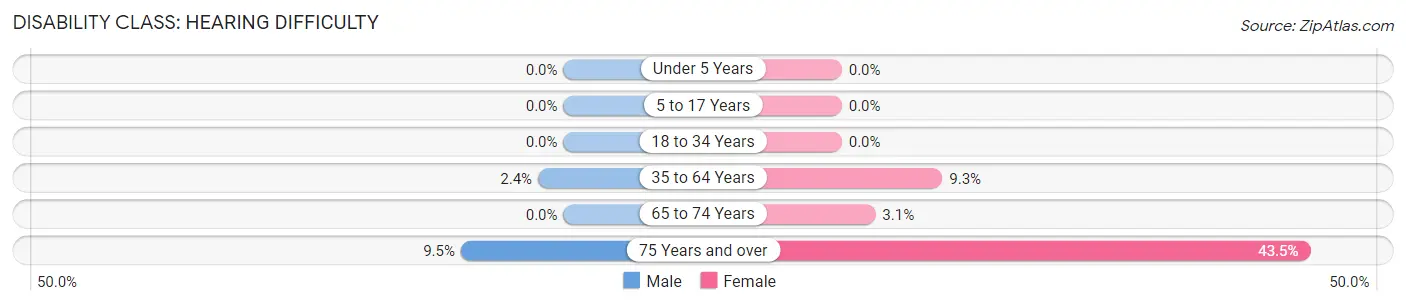
| Age Bracket | Male | Female |
| Under 5 Years | 0 (0.0%) | 0 (0.0%) |
| 5 to 17 Years | 0 (0.0%) | 0 (0.0%) |
| 18 to 34 Years | 0 (0.0%) | 0 (0.0%) |
| 35 to 64 Years | 14 (2.4%) | 76 (9.3%) |
| 65 to 74 Years | 0 (0.0%) | 5 (3.1%) |
| 75 Years and over | 10 (9.5%) | 40 (43.5%) |
Disability Class: Vision Difficulty
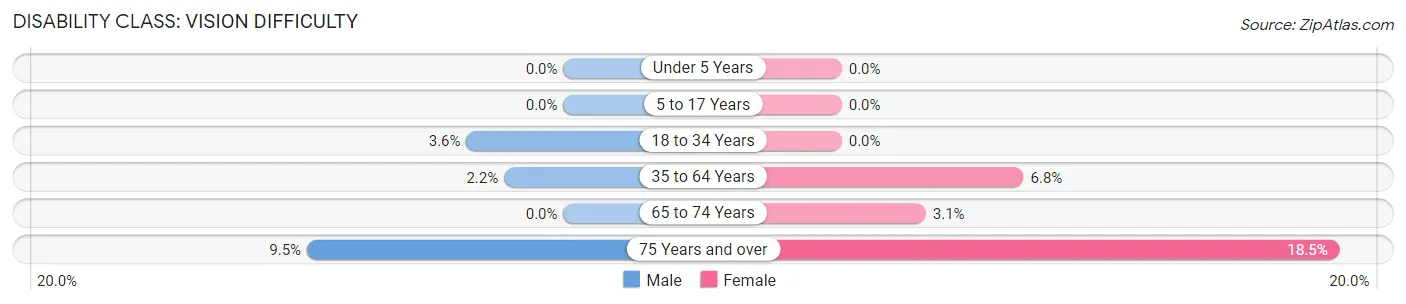
| Age Bracket | Male | Female |
| Under 5 Years | 0 (0.0%) | 0 (0.0%) |
| 5 to 17 Years | 0 (0.0%) | 0 (0.0%) |
| 18 to 34 Years | 16 (3.6%) | 0 (0.0%) |
| 35 to 64 Years | 13 (2.2%) | 55 (6.8%) |
| 65 to 74 Years | 0 (0.0%) | 5 (3.1%) |
| 75 Years and over | 10 (9.5%) | 17 (18.5%) |
Disability Class: Cognitive Difficulty
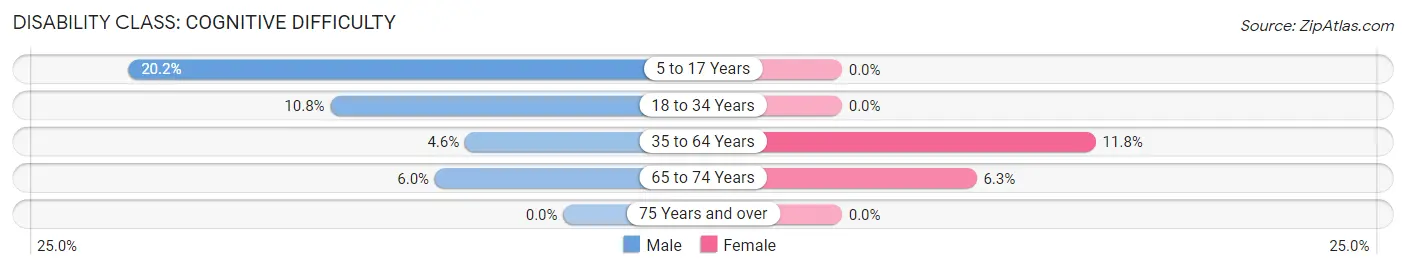
| Age Bracket | Male | Female |
| 5 to 17 Years | 43 (20.2%) | 0 (0.0%) |
| 18 to 34 Years | 48 (10.8%) | 0 (0.0%) |
| 35 to 64 Years | 27 (4.6%) | 96 (11.8%) |
| 65 to 74 Years | 9 (6.0%) | 10 (6.2%) |
| 75 Years and over | 0 (0.0%) | 0 (0.0%) |
Disability Class: Ambulatory Difficulty
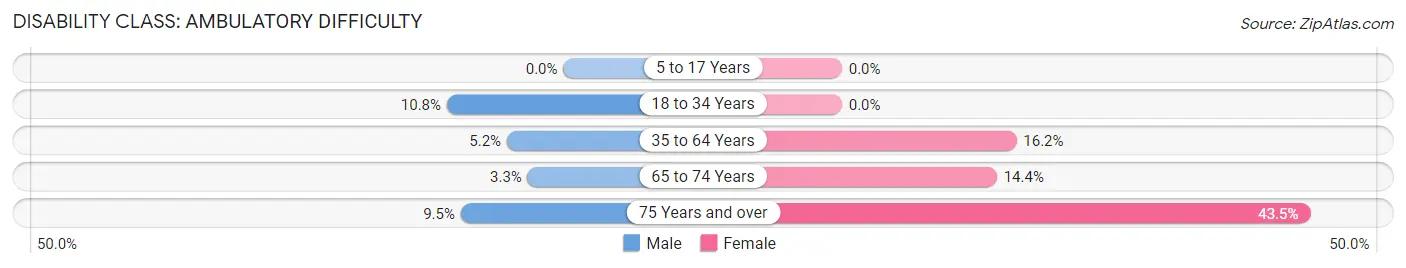
| Age Bracket | Male | Female |
| 5 to 17 Years | 0 (0.0%) | 0 (0.0%) |
| 18 to 34 Years | 48 (10.8%) | 0 (0.0%) |
| 35 to 64 Years | 31 (5.2%) | 132 (16.2%) |
| 65 to 74 Years | 5 (3.3%) | 23 (14.4%) |
| 75 Years and over | 10 (9.5%) | 40 (43.5%) |
Disability Class: Self-Care Difficulty
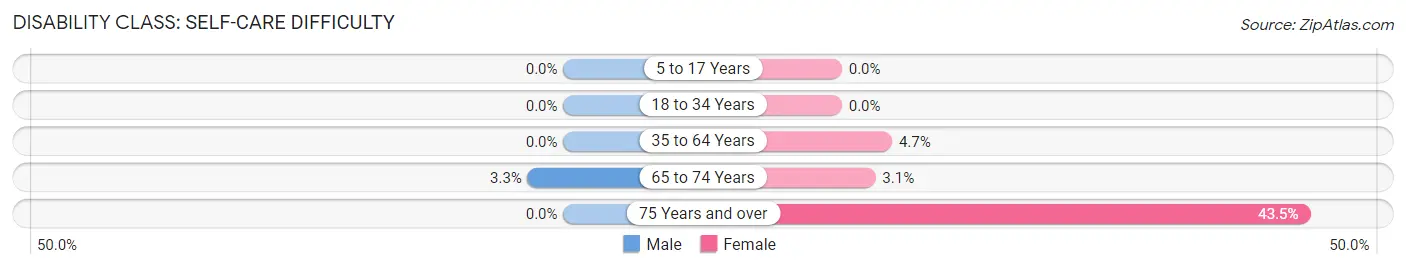
| Age Bracket | Male | Female |
| 5 to 17 Years | 0 (0.0%) | 0 (0.0%) |
| 18 to 34 Years | 0 (0.0%) | 0 (0.0%) |
| 35 to 64 Years | 0 (0.0%) | 38 (4.7%) |
| 65 to 74 Years | 5 (3.3%) | 5 (3.1%) |
| 75 Years and over | 0 (0.0%) | 40 (43.5%) |
Technology Access in Syracuse
Computing Device Access in Syracuse
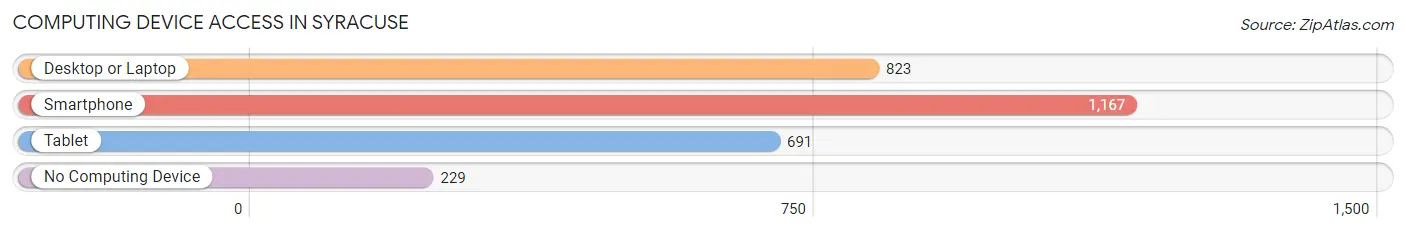
| Device Type | # Households | % Households |
| Desktop or Laptop | 823 | 56.9% |
| Smartphone | 1,167 | 80.6% |
| Tablet | 691 | 47.7% |
| No Computing Device | 229 | 15.8% |
| Total | 1,447 | 100.0% |
Internet Access in Syracuse
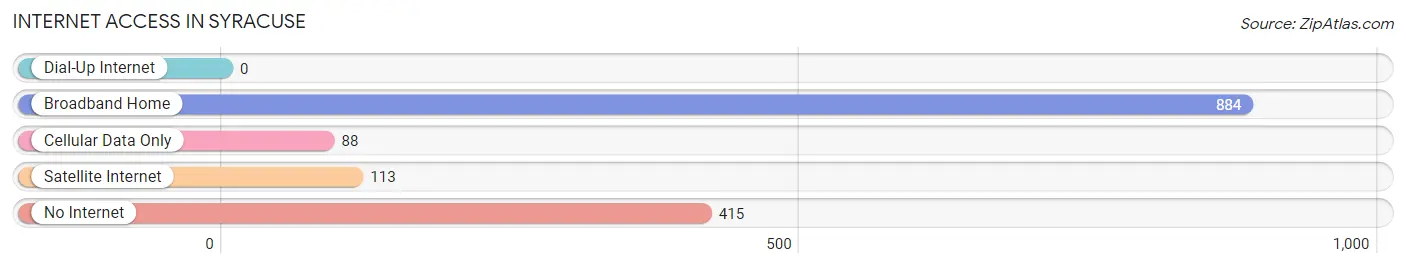
| Internet Type | # Households | % Households |
| Dial-Up Internet | 0 | 0.0% |
| Broadband Home | 884 | 61.1% |
| Cellular Data Only | 88 | 6.1% |
| Satellite Internet | 113 | 7.8% |
| No Internet | 415 | 28.7% |
| Total | 1,447 | 100.0% |
Syracuse Summary
Syracuse is a small town located in Kosciusko County, Indiana, United States. It is situated in the northern part of the state, about 20 miles south of the Michigan border. The town was founded in 1837 and has a population of approximately 2,500 people.
History
Syracuse was founded in 1837 by a group of settlers from New York. The town was named after the city of Syracuse in New York. The settlers were attracted to the area due to its fertile soil and abundant natural resources. The town quickly grew and by the mid-1800s, it had become a thriving agricultural center.
In the late 1800s, Syracuse began to diversify its economy. The town became a hub for manufacturing and industry, with several factories and mills being built in the area. The town also became a popular tourist destination, with several hotels and resorts being built in the area.
Geography
Syracuse is located in northern Indiana, about 20 miles south of the Michigan border. The town is situated in the Tippecanoe River Valley, which is surrounded by rolling hills and wooded areas. The town is located in the Central Time Zone and has a humid continental climate.
The town covers an area of 2.3 square miles and has an elevation of 845 feet. The town is located near several lakes, including Lake Wawasee, Lake Tippecanoe, and Lake Webster.
Economy
Syracuse’s economy is largely based on agriculture and manufacturing. The town is home to several factories and mills, including a paper mill, a furniture factory, and a plastics factory. The town is also home to several retail stores, restaurants, and other businesses.
The town is also home to several tourist attractions, including the Syracuse-Wawasee Historical Museum, the Syracuse-Wawasee Art Gallery, and the Syracuse-Wawasee Nature Center.
Demographics
As of the 2010 census, Syracuse had a population of 2,500 people. The town has a median household income of $41,000 and a median home value of $125,000. The town is predominantly white, with about 95% of the population being white. The town also has a small Hispanic population, with about 4% of the population being Hispanic.
Conclusion
Syracuse is a small town located in northern Indiana. The town was founded in 1837 and has a population of approximately 2,500 people. The town’s economy is largely based on agriculture and manufacturing, and it is also home to several tourist attractions. The town is predominantly white, with about 95% of the population being white.
Common Questions
What is Per Capita Income in Syracuse?
Per Capita income in Syracuse is $35,016.
What is the Median Family Income in Syracuse?
Median Family Income in Syracuse is $70,735.
What is the Median Household income in Syracuse?
Median Household Income in Syracuse is $66,027.
What is Income or Wage Gap in Syracuse?
Income or Wage Gap in Syracuse is 40.8%.
Women in Syracuse earn 59.2 cents for every dollar earned by a man.
What is Inequality or Gini Index in Syracuse?
Inequality or Gini Index in Syracuse is 0.36.
What is the Total Population of Syracuse?
Total Population of Syracuse is 3,081.
What is the Total Male Population of Syracuse?
Total Male Population of Syracuse is 1,529.
What is the Total Female Population of Syracuse?
Total Female Population of Syracuse is 1,552.
What is the Ratio of Males per 100 Females in Syracuse?
There are 98.52 Males per 100 Females in Syracuse.
What is the Ratio of Females per 100 Males in Syracuse?
There are 101.50 Females per 100 Males in Syracuse.
What is the Median Population Age in Syracuse?
Median Population Age in Syracuse is 45.3 Years.
What is the Average Family Size in Syracuse
Average Family Size in Syracuse is 2.6 People.
What is the Average Household Size in Syracuse
Average Household Size in Syracuse is 2.1 People.
How Large is the Labor Force in Syracuse?
There are 1,962 People in the Labor Forcein in Syracuse.
What is the Percentage of People in the Labor Force in Syracuse?
70.9% of People are in the Labor Force in Syracuse.
What is the Unemployment Rate in Syracuse?
Unemployment Rate in Syracuse is 3.4%.