Cedar Lake, IN Map & Demographics
Cedar Lake Map
Cedar Lake Overview
$39,906
PER CAPITA INCOME
$94,976
AVG FAMILY INCOME
$84,444
AVG HOUSEHOLD INCOME
46.5%
WAGE / INCOME GAP [ % ]
53.5¢/ $1
WAGE / INCOME GAP [ $ ]
0.43
INEQUALITY / GINI INDEX
14,215
TOTAL POPULATION
7,043
MALE POPULATION
7,172
FEMALE POPULATION
98.20
MALES / 100 FEMALES
101.83
FEMALES / 100 MALES
39.5
MEDIAN AGE
3.2
AVG FAMILY SIZE
2.7
AVG HOUSEHOLD SIZE
7,485
LABOR FORCE [ PEOPLE ]
66.4%
PERCENT IN LABOR FORCE
5.7%
UNEMPLOYMENT RATE
Cedar Lake Zip Codes
Cedar Lake Area Codes
Income in Cedar Lake
Income Overview in Cedar Lake
Per Capita Income in Cedar Lake is $39,906, while median incomes of families and households are $94,976 and $84,444 respectively.
| Characteristic | Number | Measure |
| Per Capita Income | 14,215 | $39,906 |
| Median Family Income | 3,870 | $94,976 |
| Mean Family Income | 3,870 | $119,855 |
| Median Household Income | 5,274 | $84,444 |
| Mean Household Income | 5,274 | $106,301 |
| Income Deficit | 3,870 | $0 |
| Wage / Income Gap (%) | 14,215 | 46.49% |
| Wage / Income Gap ($) | 14,215 | 53.51¢ per $1 |
| Gini / Inequality Index | 14,215 | 0.43 |
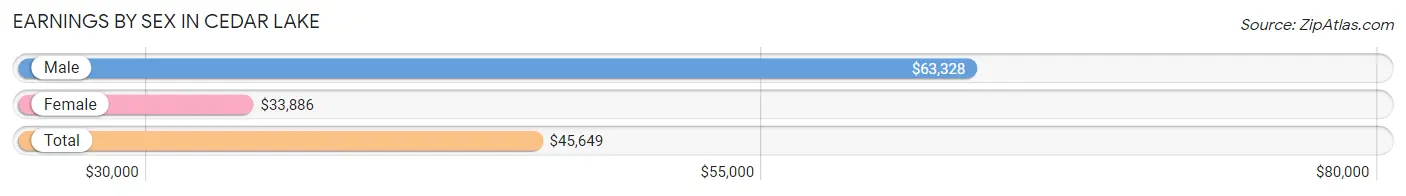
Earnings by Sex in Cedar Lake
Average Earnings in Cedar Lake are $45,649, $63,328 for men and $33,886 for women, a difference of 46.5%.
| Sex | Number | Average Earnings |
| Male | 4,089 (52.7%) | $63,328 |
| Female | 3,674 (47.3%) | $33,886 |
| Total | 7,763 (100.0%) | $45,649 |
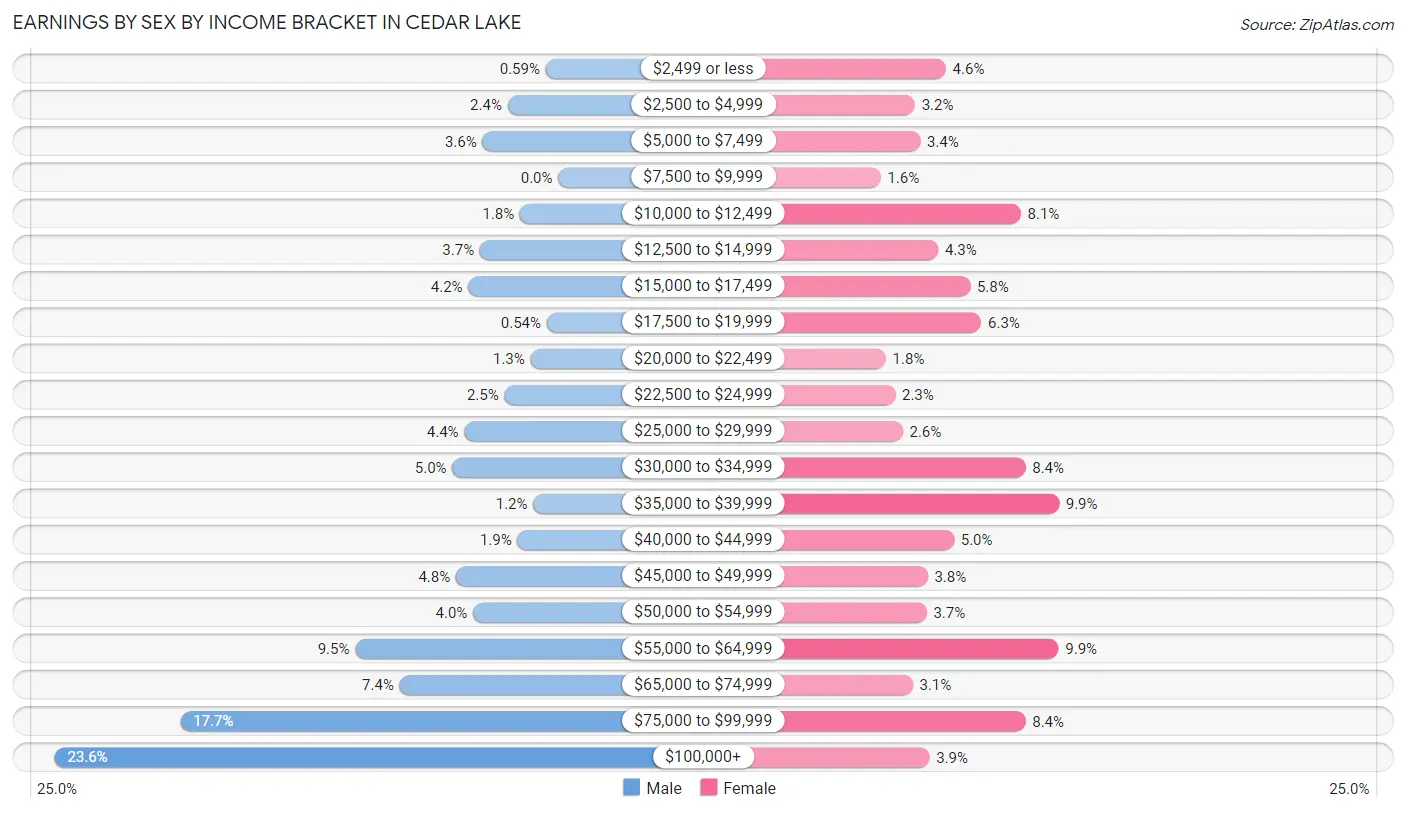
Earnings by Sex by Income Bracket in Cedar Lake
The most common earnings brackets in Cedar Lake are $100,000+ for men (965 | 23.6%) and $35,000 to $39,999 for women (365 | 9.9%).
| Income | Male | Female |
| $2,499 or less | 24 (0.6%) | 170 (4.6%) |
| $2,500 to $4,999 | 97 (2.4%) | 117 (3.2%) |
| $5,000 to $7,499 | 145 (3.5%) | 126 (3.4%) |
| $7,500 to $9,999 | 0 (0.0%) | 58 (1.6%) |
| $10,000 to $12,499 | 73 (1.8%) | 299 (8.1%) |
| $12,500 to $14,999 | 150 (3.7%) | 157 (4.3%) |
| $15,000 to $17,499 | 172 (4.2%) | 212 (5.8%) |
| $17,500 to $19,999 | 22 (0.5%) | 231 (6.3%) |
| $20,000 to $22,499 | 53 (1.3%) | 67 (1.8%) |
| $22,500 to $24,999 | 103 (2.5%) | 83 (2.3%) |
| $25,000 to $29,999 | 180 (4.4%) | 96 (2.6%) |
| $30,000 to $34,999 | 203 (5.0%) | 307 (8.4%) |
| $35,000 to $39,999 | 48 (1.2%) | 365 (9.9%) |
| $40,000 to $44,999 | 78 (1.9%) | 184 (5.0%) |
| $45,000 to $49,999 | 196 (4.8%) | 139 (3.8%) |
| $50,000 to $54,999 | 163 (4.0%) | 137 (3.7%) |
| $55,000 to $64,999 | 389 (9.5%) | 364 (9.9%) |
| $65,000 to $74,999 | 304 (7.4%) | 113 (3.1%) |
| $75,000 to $99,999 | 724 (17.7%) | 307 (8.4%) |
| $100,000+ | 965 (23.6%) | 142 (3.9%) |
| Total | 4,089 (100.0%) | 3,674 (100.0%) |
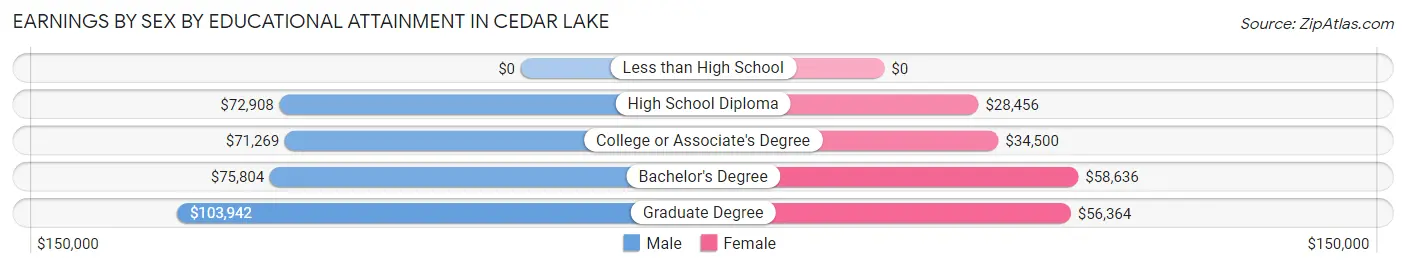
Earnings by Sex by Educational Attainment in Cedar Lake
Average earnings in Cedar Lake are $73,396 for men and $37,925 for women, a difference of 48.3%. Men with an educational attainment of graduate degree enjoy the highest average annual earnings of $103,942, while those with college or associate's degree education earn the least with $71,269. Women with an educational attainment of bachelor's degree earn the most with the average annual earnings of $58,636, while those with high school diploma education have the smallest earnings of $28,456.
| Educational Attainment | Male Income | Female Income |
| Less than High School | - | - |
| High School Diploma | $72,908 | $28,456 |
| College or Associate's Degree | $71,269 | $34,500 |
| Bachelor's Degree | $75,804 | $58,636 |
| Graduate Degree | $103,942 | $56,364 |
| Total | $73,396 | $37,925 |
Family Income in Cedar Lake
Family Income Brackets in Cedar Lake
According to the Cedar Lake family income data, there are 890 families falling into the $100,000 to $149,999 income range, which is the most common income bracket and makes up 23.0% of all families. Conversely, the $10,000 to $14,999 income bracket is the least frequent group with only 31 families (0.8%) belonging to this category.
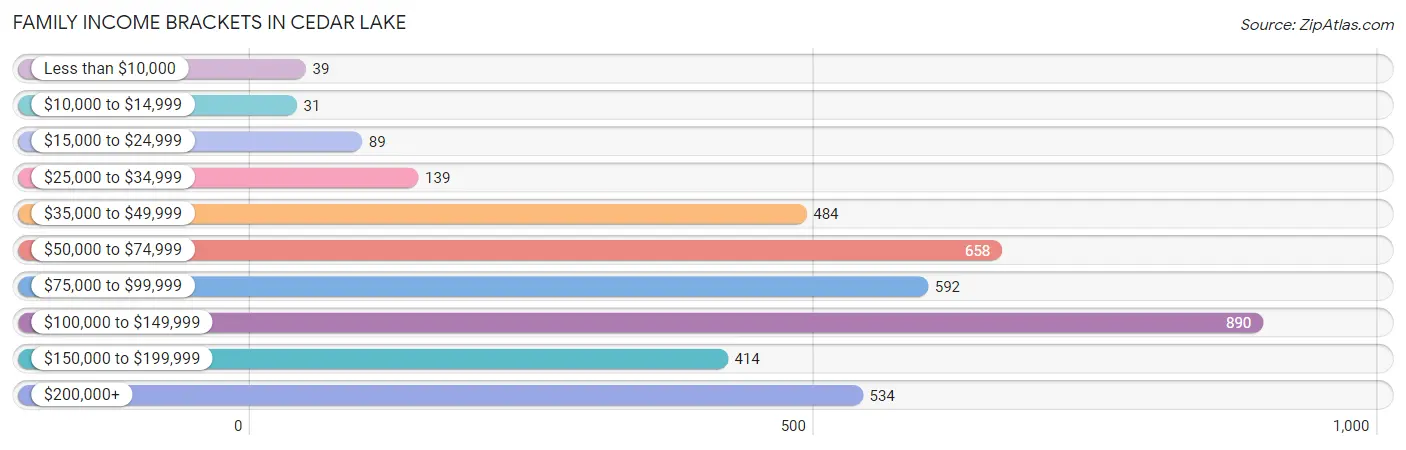
| Income Bracket | # Families | % Families |
| Less than $10,000 | 39 | 1.0% |
| $10,000 to $14,999 | 31 | 0.8% |
| $15,000 to $24,999 | 89 | 2.3% |
| $25,000 to $34,999 | 139 | 3.6% |
| $35,000 to $49,999 | 484 | 12.5% |
| $50,000 to $74,999 | 658 | 17.0% |
| $75,000 to $99,999 | 592 | 15.3% |
| $100,000 to $149,999 | 890 | 23.0% |
| $150,000 to $199,999 | 414 | 10.7% |
| $200,000+ | 534 | 13.8% |
Family Income by Famaliy Size in Cedar Lake
7+ person families (30 | 0.8%) account for the highest median family income in Cedar Lake with $183,026 per family, while 2-person families (1,853 | 47.9%) have the highest median income of $39,672 per family member.
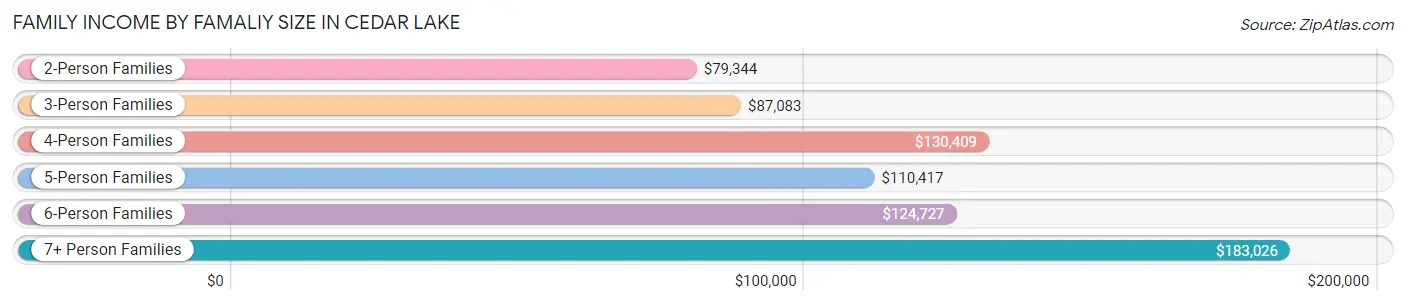
| Income Bracket | # Families | Median Income |
| 2-Person Families | 1,853 (47.9%) | $79,344 |
| 3-Person Families | 752 (19.4%) | $87,083 |
| 4-Person Families | 721 (18.6%) | $130,409 |
| 5-Person Families | 326 (8.4%) | $110,417 |
| 6-Person Families | 188 (4.9%) | $124,727 |
| 7+ Person Families | 30 (0.8%) | $183,026 |
| Total | 3,870 (100.0%) | $94,976 |
Family Income by Number of Earners in Cedar Lake
The median family income in Cedar Lake is $94,976, with families comprising 3+ earners (567) having the highest median family income of $162,408, while families with no earners (610) have the lowest median family income of $52,500, accounting for 14.6% and 15.8% of families, respectively.
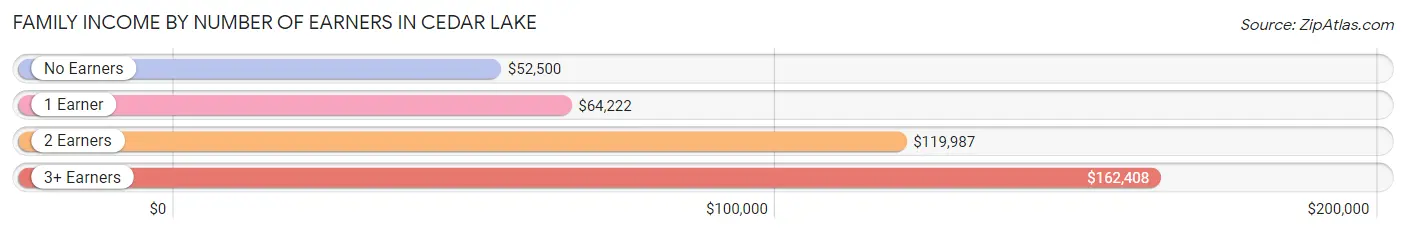
| Number of Earners | # Families | Median Income |
| No Earners | 610 (15.8%) | $52,500 |
| 1 Earner | 1,132 (29.2%) | $64,222 |
| 2 Earners | 1,561 (40.3%) | $119,987 |
| 3+ Earners | 567 (14.6%) | $162,408 |
| Total | 3,870 (100.0%) | $94,976 |
Household Income in Cedar Lake
Household Income Brackets in Cedar Lake
With 1,018 households falling in the category, the $100,000 to $149,999 income range is the most frequent in Cedar Lake, accounting for 19.3% of all households. In contrast, only 84 households (1.6%) fall into the less than $10,000 income bracket, making it the least populous group.
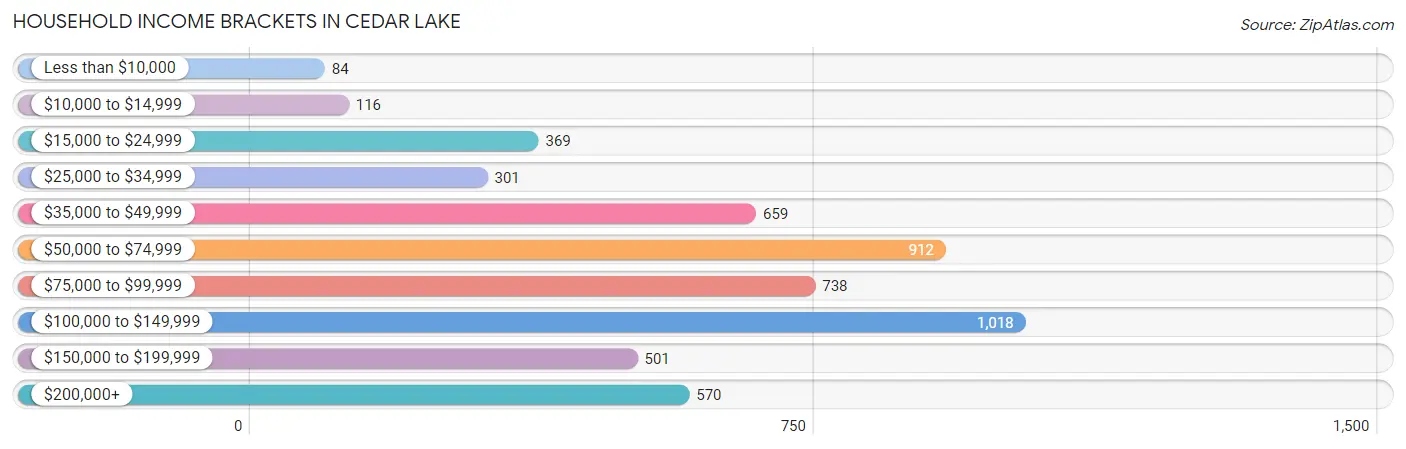
| Income Bracket | # Households | % Households |
| Less than $10,000 | 84 | 1.6% |
| $10,000 to $14,999 | 116 | 2.2% |
| $15,000 to $24,999 | 369 | 7.0% |
| $25,000 to $34,999 | 301 | 5.7% |
| $35,000 to $49,999 | 659 | 12.5% |
| $50,000 to $74,999 | 912 | 17.3% |
| $75,000 to $99,999 | 738 | 14.0% |
| $100,000 to $149,999 | 1,018 | 19.3% |
| $150,000 to $199,999 | 501 | 9.5% |
| $200,000+ | 570 | 10.8% |
Household Income by Householder Age in Cedar Lake
The median household income in Cedar Lake is $84,444, with the highest median household income of $102,656 found in the 25 to 44 years age bracket for the primary householder. A total of 1,875 households (35.5%) fall into this category.
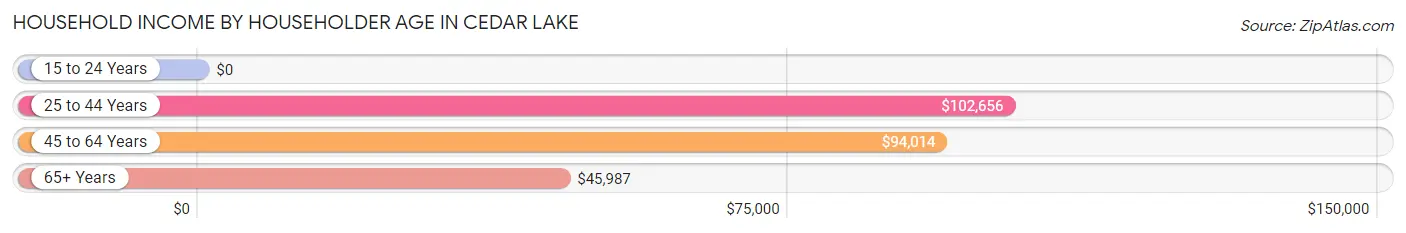
| Income Bracket | # Households | Median Income |
| 15 to 24 Years | 0 (0.0%) | $0 |
| 25 to 44 Years | 1,875 (35.5%) | $102,656 |
| 45 to 64 Years | 2,152 (40.8%) | $94,014 |
| 65+ Years | 1,247 (23.6%) | $45,987 |
| Total | 5,274 (100.0%) | $84,444 |
Poverty in Cedar Lake
Income Below Poverty by Sex and Age in Cedar Lake
With 3.5% poverty level for males and 3.9% for females among the residents of Cedar Lake, 16 and 17 year old males and 15 year old females are the most vulnerable to poverty, with 33 males (18.8%) and 7 females (8.4%) in their respective age groups living below the poverty level.
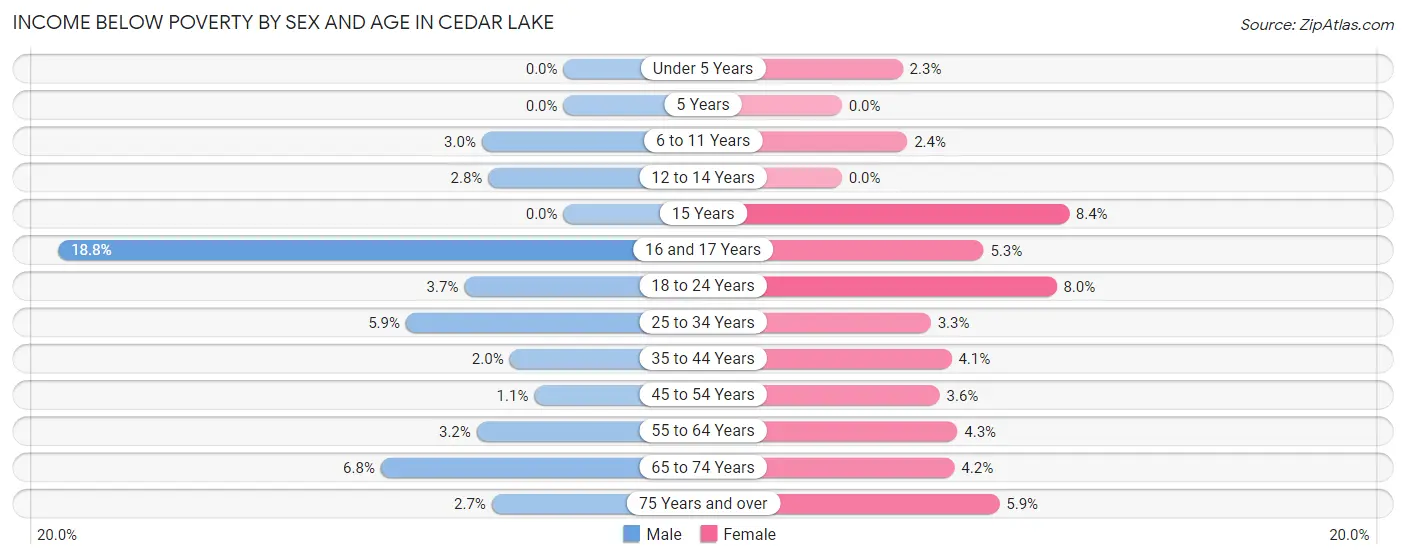
| Age Bracket | Male | Female |
| Under 5 Years | 0 (0.0%) | 11 (2.3%) |
| 5 Years | 0 (0.0%) | 0 (0.0%) |
| 6 to 11 Years | 20 (3.0%) | 11 (2.4%) |
| 12 to 14 Years | 9 (2.8%) | 0 (0.0%) |
| 15 Years | 0 (0.0%) | 7 (8.4%) |
| 16 and 17 Years | 33 (18.8%) | 12 (5.3%) |
| 18 to 24 Years | 25 (3.7%) | 37 (8.0%) |
| 25 to 34 Years | 46 (5.9%) | 36 (3.3%) |
| 35 to 44 Years | 19 (2.0%) | 34 (4.1%) |
| 45 to 54 Years | 10 (1.1%) | 35 (3.6%) |
| 55 to 64 Years | 31 (3.2%) | 40 (4.3%) |
| 65 to 74 Years | 40 (6.8%) | 28 (4.2%) |
| 75 Years and over | 13 (2.7%) | 31 (5.9%) |
| Total | 246 (3.5%) | 282 (3.9%) |
Income Above Poverty by Sex and Age in Cedar Lake
According to the poverty statistics in Cedar Lake, males aged under 5 years and females aged 5 years are the age groups that are most secure financially, with 100.0% of males and 100.0% of females in these age groups living above the poverty line.
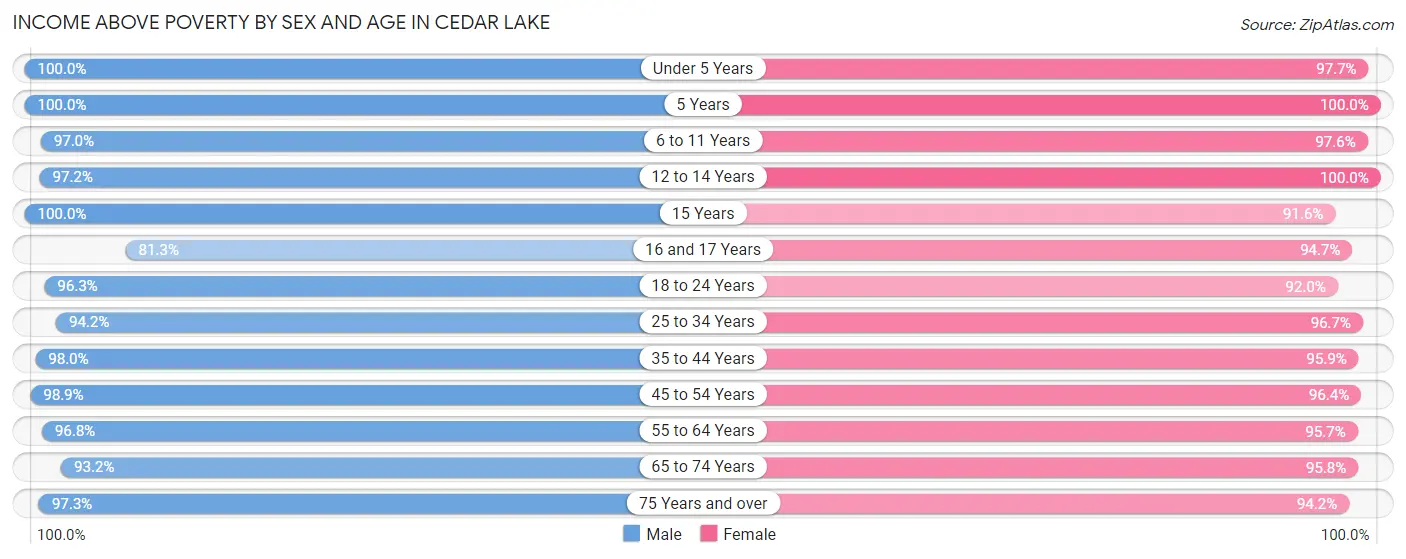
| Age Bracket | Male | Female |
| Under 5 Years | 344 (100.0%) | 476 (97.7%) |
| 5 Years | 84 (100.0%) | 105 (100.0%) |
| 6 to 11 Years | 640 (97.0%) | 442 (97.6%) |
| 12 to 14 Years | 314 (97.2%) | 331 (100.0%) |
| 15 Years | 73 (100.0%) | 76 (91.6%) |
| 16 and 17 Years | 143 (81.2%) | 216 (94.7%) |
| 18 to 24 Years | 655 (96.3%) | 427 (92.0%) |
| 25 to 34 Years | 740 (94.2%) | 1,054 (96.7%) |
| 35 to 44 Years | 930 (98.0%) | 802 (95.9%) |
| 45 to 54 Years | 916 (98.9%) | 928 (96.4%) |
| 55 to 64 Years | 932 (96.8%) | 892 (95.7%) |
| 65 to 74 Years | 550 (93.2%) | 642 (95.8%) |
| 75 Years and over | 476 (97.3%) | 499 (94.2%) |
| Total | 6,797 (96.5%) | 6,890 (96.1%) |
Income Below Poverty Among Married-Couple Families in Cedar Lake
The poverty statistics for married-couple families in Cedar Lake show that 1.0% or 29 of the total 2,994 families live below the poverty line. Families with no children have the highest poverty rate of 1.5%, comprising of 29 families. On the other hand, families with 1 or 2 children have the lowest poverty rate of 0.0%, which includes 0 families.
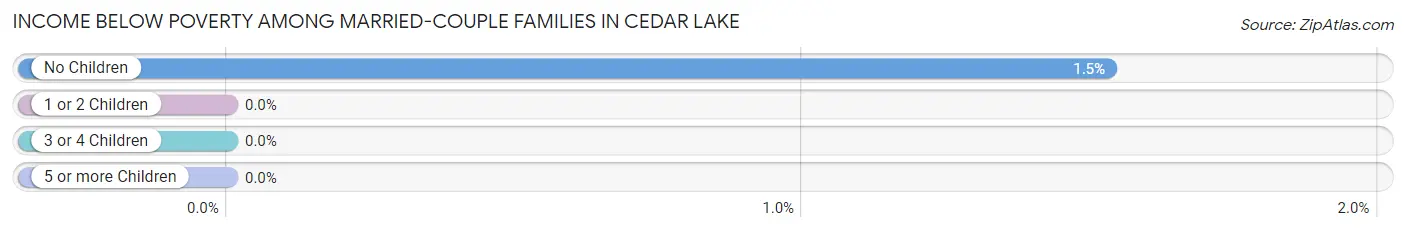
| Children | Above Poverty | Below Poverty |
| No Children | 1,870 (98.5%) | 29 (1.5%) |
| 1 or 2 Children | 920 (100.0%) | 0 (0.0%) |
| 3 or 4 Children | 169 (100.0%) | 0 (0.0%) |
| 5 or more Children | 6 (100.0%) | 0 (0.0%) |
| Total | 2,965 (99.0%) | 29 (1.0%) |
Income Below Poverty Among Single-Parent Households in Cedar Lake
According to the poverty data in Cedar Lake, 7.1% or 21 single-father households and 7.9% or 46 single-mother households are living below the poverty line. Among single-father households, those with 3 or 4 children have the highest poverty rate, with 10 households (11.2%) experiencing poverty. Likewise, among single-mother households, those with 1 or 2 children have the highest poverty rate, with 36 households (16.9%) falling below the poverty line.
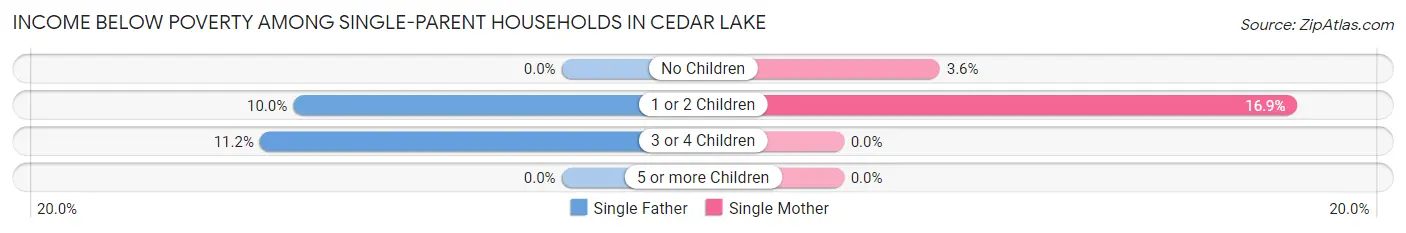
| Children | Single Father | Single Mother |
| No Children | 0 (0.0%) | 10 (3.6%) |
| 1 or 2 Children | 11 (10.0%) | 36 (16.9%) |
| 3 or 4 Children | 10 (11.2%) | 0 (0.0%) |
| 5 or more Children | 0 (0.0%) | 0 (0.0%) |
| Total | 21 (7.1%) | 46 (7.9%) |
Income Below Poverty Among Married-Couple vs Single-Parent Households in Cedar Lake
The poverty data for Cedar Lake shows that 29 of the married-couple family households (1.0%) and 67 of the single-parent households (7.6%) are living below the poverty level. Within the married-couple family households, those with no children have the highest poverty rate, with 29 households (1.5%) falling below the poverty line. Among the single-parent households, those with 1 or 2 children have the highest poverty rate, with 47 household (14.5%) living below poverty.
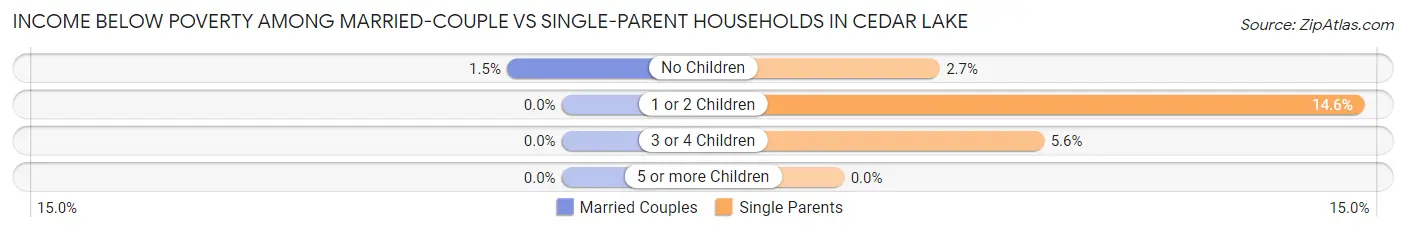
| Children | Married-Couple Families | Single-Parent Households |
| No Children | 29 (1.5%) | 10 (2.7%) |
| 1 or 2 Children | 0 (0.0%) | 47 (14.5%) |
| 3 or 4 Children | 0 (0.0%) | 10 (5.6%) |
| 5 or more Children | 0 (0.0%) | 0 (0.0%) |
| Total | 29 (1.0%) | 67 (7.6%) |
Race in Cedar Lake
The most populous races in Cedar Lake are White / Caucasian (13,558 | 95.4%), Hispanic or Latino (475 | 3.3%), and Two or more Races (436 | 3.1%).
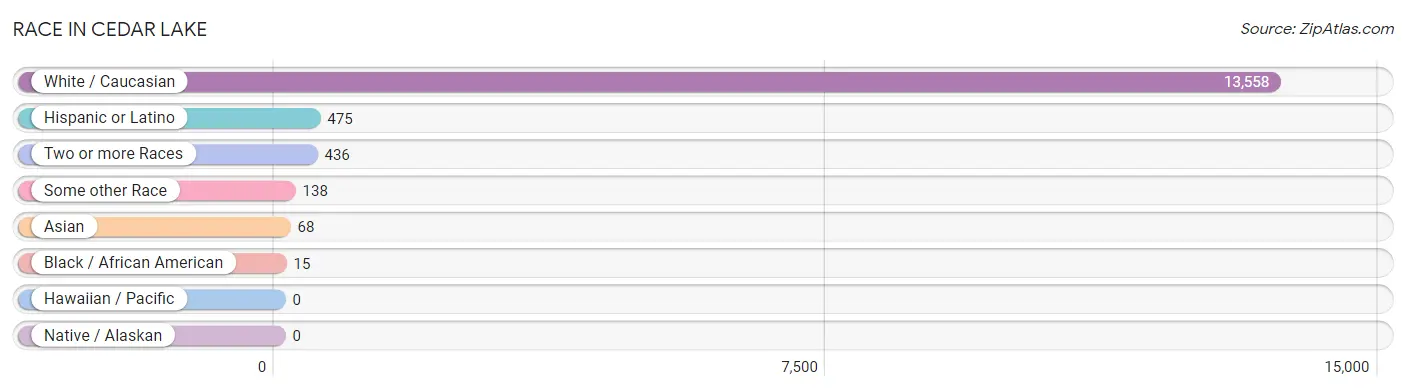
| Race | # Population | % Population |
| Asian | 68 | 0.5% |
| Black / African American | 15 | 0.1% |
| Hawaiian / Pacific | 0 | 0.0% |
| Hispanic or Latino | 475 | 3.3% |
| Native / Alaskan | 0 | 0.0% |
| White / Caucasian | 13,558 | 95.4% |
| Two or more Races | 436 | 3.1% |
| Some other Race | 138 | 1.0% |
| Total | 14,215 | 100.0% |
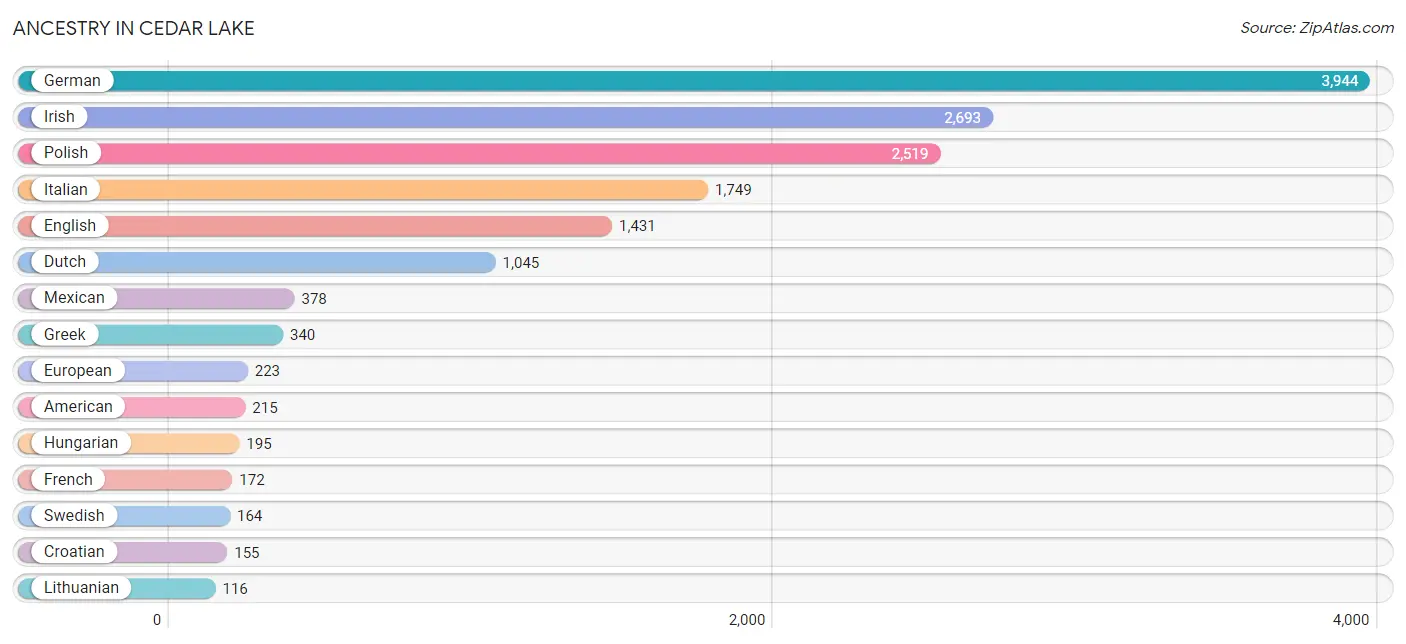
Ancestry in Cedar Lake
The most populous ancestries reported in Cedar Lake are German (3,944 | 27.8%), Irish (2,693 | 18.9%), Polish (2,519 | 17.7%), Italian (1,749 | 12.3%), and English (1,431 | 10.1%), together accounting for 86.8% of all Cedar Lake residents.
| Ancestry | # Population | % Population |
| American | 215 | 1.5% |
| Austrian | 13 | 0.1% |
| Bhutanese | 95 | 0.7% |
| British | 53 | 0.4% |
| Celtic | 32 | 0.2% |
| Central American | 4 | 0.0% |
| Cherokee | 31 | 0.2% |
| Chippewa | 17 | 0.1% |
| Croatian | 155 | 1.1% |
| Czech | 62 | 0.4% |
| Czechoslovakian | 20 | 0.1% |
| Danish | 34 | 0.2% |
| Dutch | 1,045 | 7.3% |
| English | 1,431 | 10.1% |
| European | 223 | 1.6% |
| Finnish | 26 | 0.2% |
| French | 172 | 1.2% |
| French Canadian | 56 | 0.4% |
| German | 3,944 | 27.8% |
| Greek | 340 | 2.4% |
| Guatemalan | 4 | 0.0% |
| Hungarian | 195 | 1.4% |
| Indian (Asian) | 23 | 0.2% |
| Irish | 2,693 | 18.9% |
| Italian | 1,749 | 12.3% |
| Korean | 46 | 0.3% |
| Lithuanian | 116 | 0.8% |
| Macedonian | 77 | 0.5% |
| Mexican | 378 | 2.7% |
| Mexican American Indian | 12 | 0.1% |
| Norwegian | 31 | 0.2% |
| Polish | 2,519 | 17.7% |
| Portuguese | 7 | 0.1% |
| Puerto Rican | 25 | 0.2% |
| Romanian | 41 | 0.3% |
| Russian | 79 | 0.6% |
| Scandinavian | 42 | 0.3% |
| Scotch-Irish | 78 | 0.5% |
| Scottish | 112 | 0.8% |
| Serbian | 90 | 0.6% |
| Slovak | 98 | 0.7% |
| Slovene | 23 | 0.2% |
| Spanish | 59 | 0.4% |
| Swedish | 164 | 1.1% |
| Swiss | 21 | 0.2% |
| Ukrainian | 8 | 0.1% |
| Yugoslavian | 38 | 0.3% | View All 47 Rows |
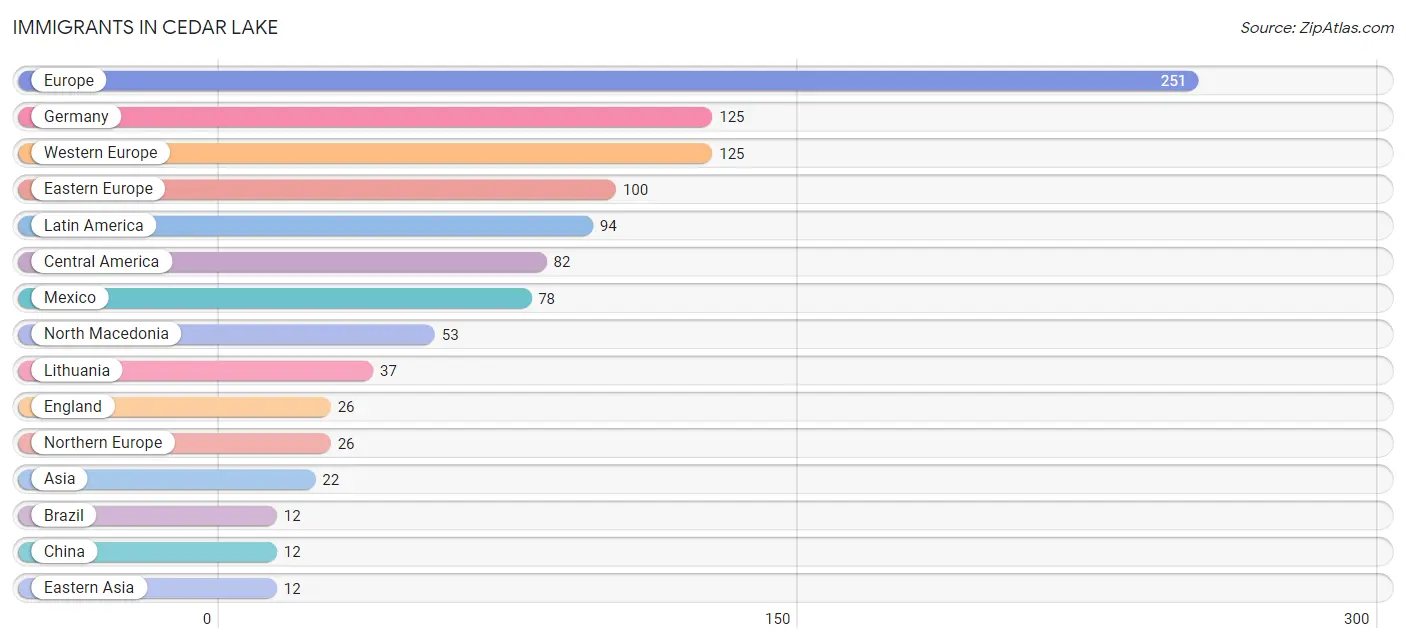
Immigrants in Cedar Lake
The most numerous immigrant groups reported in Cedar Lake came from Europe (251 | 1.8%), Germany (125 | 0.9%), Western Europe (125 | 0.9%), Eastern Europe (100 | 0.7%), and Latin America (94 | 0.7%), together accounting for 4.9% of all Cedar Lake residents.
| Immigration Origin | # Population | % Population |
| Asia | 22 | 0.2% |
| Brazil | 12 | 0.1% |
| Central America | 82 | 0.6% |
| China | 12 | 0.1% |
| Eastern Asia | 12 | 0.1% |
| Eastern Europe | 100 | 0.7% |
| England | 26 | 0.2% |
| Europe | 251 | 1.8% |
| Germany | 125 | 0.9% |
| Guatemala | 4 | 0.0% |
| Latin America | 94 | 0.7% |
| Lithuania | 37 | 0.3% |
| Mexico | 78 | 0.5% |
| North Macedonia | 53 | 0.4% |
| Northern Europe | 26 | 0.2% |
| Philippines | 10 | 0.1% |
| Poland | 10 | 0.1% |
| South America | 12 | 0.1% |
| South Eastern Asia | 10 | 0.1% |
| Western Europe | 125 | 0.9% | View All 20 Rows |
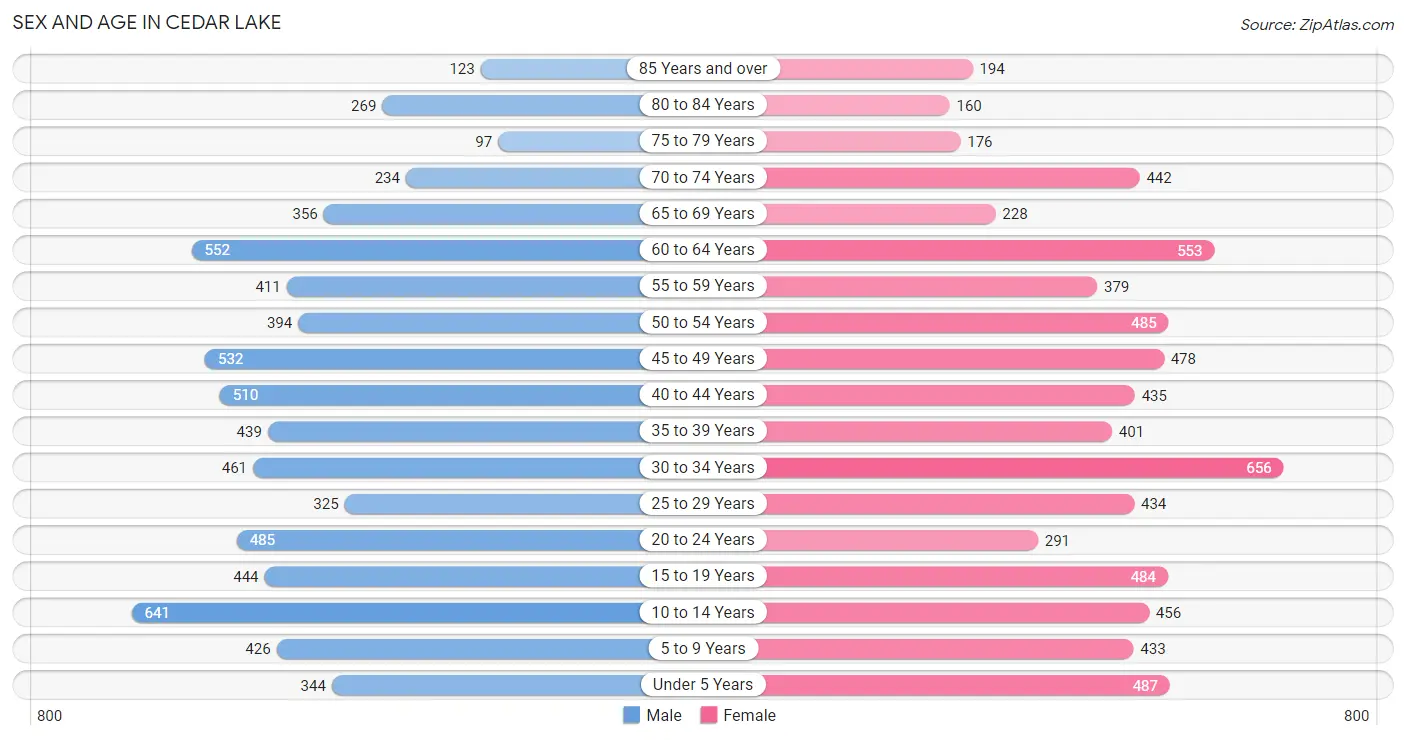
Sex and Age in Cedar Lake
Sex and Age in Cedar Lake
The most populous age groups in Cedar Lake are 10 to 14 Years (641 | 9.1%) for men and 30 to 34 Years (656 | 9.1%) for women.
| Age Bracket | Male | Female |
| Under 5 Years | 344 (4.9%) | 487 (6.8%) |
| 5 to 9 Years | 426 (6.0%) | 433 (6.0%) |
| 10 to 14 Years | 641 (9.1%) | 456 (6.4%) |
| 15 to 19 Years | 444 (6.3%) | 484 (6.8%) |
| 20 to 24 Years | 485 (6.9%) | 291 (4.1%) |
| 25 to 29 Years | 325 (4.6%) | 434 (6.0%) |
| 30 to 34 Years | 461 (6.6%) | 656 (9.1%) |
| 35 to 39 Years | 439 (6.2%) | 401 (5.6%) |
| 40 to 44 Years | 510 (7.2%) | 435 (6.1%) |
| 45 to 49 Years | 532 (7.5%) | 478 (6.7%) |
| 50 to 54 Years | 394 (5.6%) | 485 (6.8%) |
| 55 to 59 Years | 411 (5.8%) | 379 (5.3%) |
| 60 to 64 Years | 552 (7.8%) | 553 (7.7%) |
| 65 to 69 Years | 356 (5.1%) | 228 (3.2%) |
| 70 to 74 Years | 234 (3.3%) | 442 (6.2%) |
| 75 to 79 Years | 97 (1.4%) | 176 (2.5%) |
| 80 to 84 Years | 269 (3.8%) | 160 (2.2%) |
| 85 Years and over | 123 (1.8%) | 194 (2.7%) |
| Total | 7,043 (100.0%) | 7,172 (100.0%) |
Families and Households in Cedar Lake
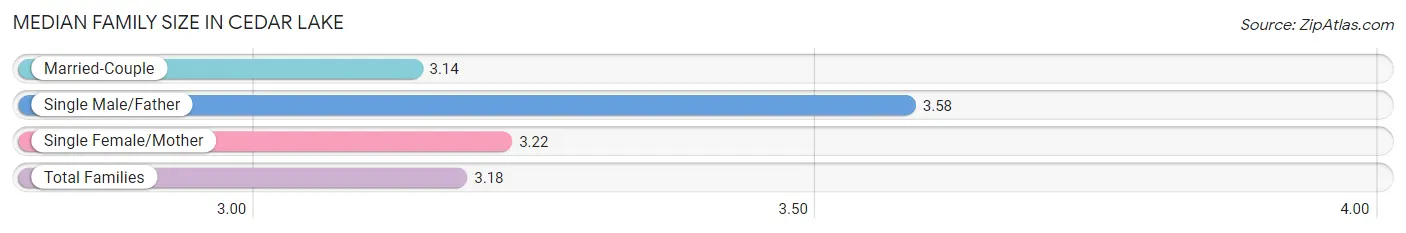
Median Family Size in Cedar Lake
The median family size in Cedar Lake is 3.18 persons per family, with single male/father families (294 | 7.6%) accounting for the largest median family size of 3.58 persons per family. On the other hand, married-couple families (2,994 | 77.4%) represent the smallest median family size with 3.14 persons per family.
| Family Type | # Families | Family Size |
| Married-Couple | 2,994 (77.4%) | 3.14 |
| Single Male/Father | 294 (7.6%) | 3.58 |
| Single Female/Mother | 582 (15.0%) | 3.22 |
| Total Families | 3,870 (100.0%) | 3.18 |
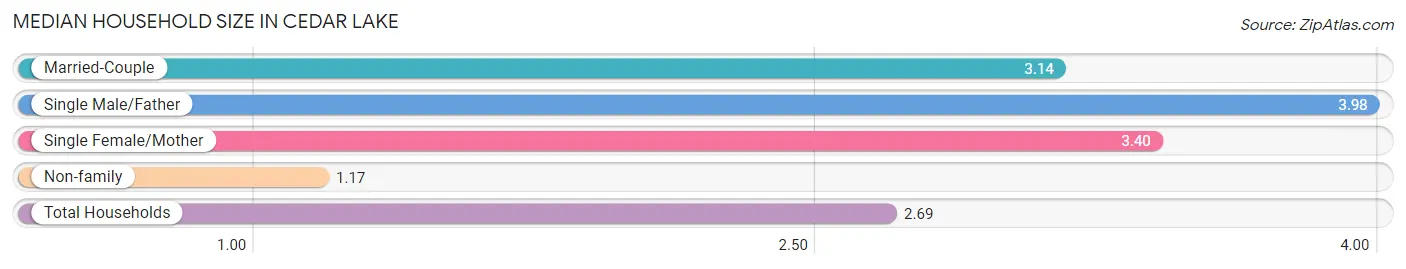
Median Household Size in Cedar Lake
The median household size in Cedar Lake is 2.69 persons per household, with single male/father households (294 | 5.6%) accounting for the largest median household size of 3.98 persons per household. non-family households (1,404 | 26.6%) represent the smallest median household size with 1.17 persons per household.
| Household Type | # Households | Household Size |
| Married-Couple | 2,994 (56.8%) | 3.14 |
| Single Male/Father | 294 (5.6%) | 3.98 |
| Single Female/Mother | 582 (11.0%) | 3.40 |
| Non-family | 1,404 (26.6%) | 1.17 |
| Total Households | 5,274 (100.0%) | 2.69 |
Household Size by Marriage Status in Cedar Lake
Out of a total of 5,274 households in Cedar Lake, 3,870 (73.4%) are family households, while 1,404 (26.6%) are nonfamily households. The most numerous type of family households are 2-person households, comprising 1,774, and the most common type of nonfamily households are 1-person households, comprising 1,174.
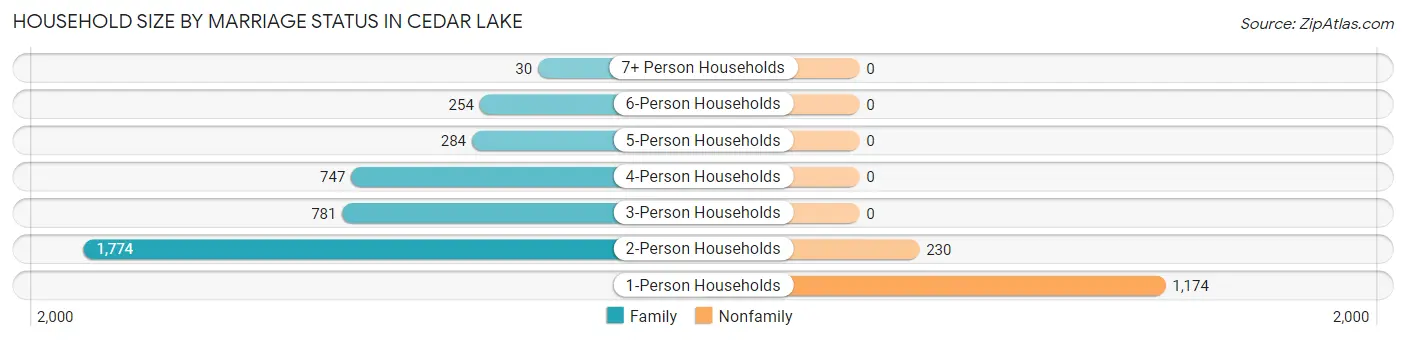
| Household Size | Family Households | Nonfamily Households |
| 1-Person Households | - | 1,174 (22.3%) |
| 2-Person Households | 1,774 (33.6%) | 230 (4.4%) |
| 3-Person Households | 781 (14.8%) | 0 (0.0%) |
| 4-Person Households | 747 (14.2%) | 0 (0.0%) |
| 5-Person Households | 284 (5.4%) | 0 (0.0%) |
| 6-Person Households | 254 (4.8%) | 0 (0.0%) |
| 7+ Person Households | 30 (0.6%) | 0 (0.0%) |
| Total | 3,870 (73.4%) | 1,404 (26.6%) |
Female Fertility in Cedar Lake
Fertility by Age in Cedar Lake
Average fertility rate in Cedar Lake is 86.0 births per 1,000 women. Women in the age bracket of 20 to 34 years have the highest fertility rate with 198.0 births per 1,000 women. Women in the age bracket of 20 to 34 years acount for 96.8% of all women with births.
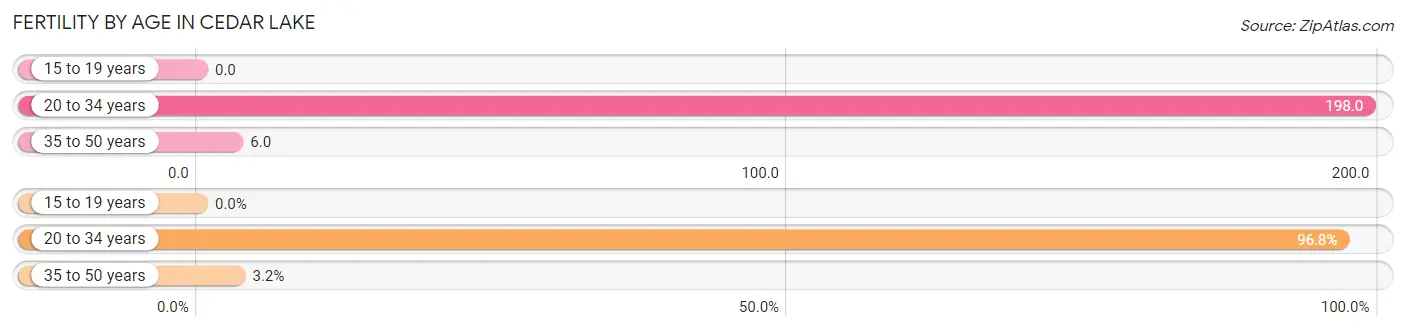
| Age Bracket | Women with Births | Births / 1,000 Women |
| 15 to 19 years | 0 (0.0%) | 0.0 |
| 20 to 34 years | 274 (96.8%) | 198.0 |
| 35 to 50 years | 9 (3.2%) | 6.0 |
| Total | 283 (100.0%) | 86.0 |
Fertility by Age by Marriage Status in Cedar Lake
91.5% of women with births (283) in Cedar Lake are married. The highest percentage of unmarried women with births falls into 20 to 34 years age bracket with 8.8% of them unmarried at the time of birth, while the lowest percentage of unmarried women with births belong to 35 to 50 years age bracket with 0.0% of them unmarried.
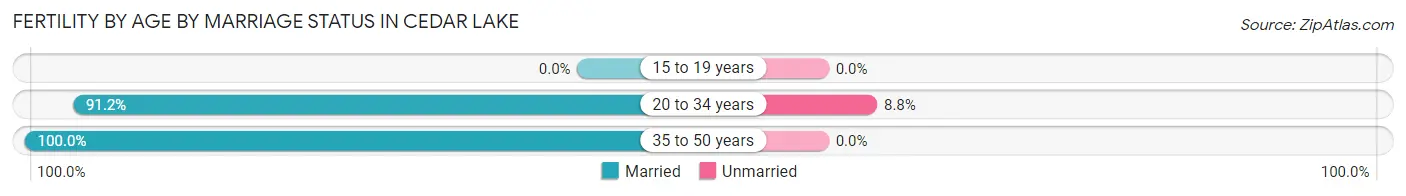
| Age Bracket | Married | Unmarried |
| 15 to 19 years | 0 (0.0%) | 0 (0.0%) |
| 20 to 34 years | 250 (91.2%) | 24 (8.8%) |
| 35 to 50 years | 9 (100.0%) | 0 (0.0%) |
| Total | 259 (91.5%) | 24 (8.5%) |
Fertility by Education in Cedar Lake
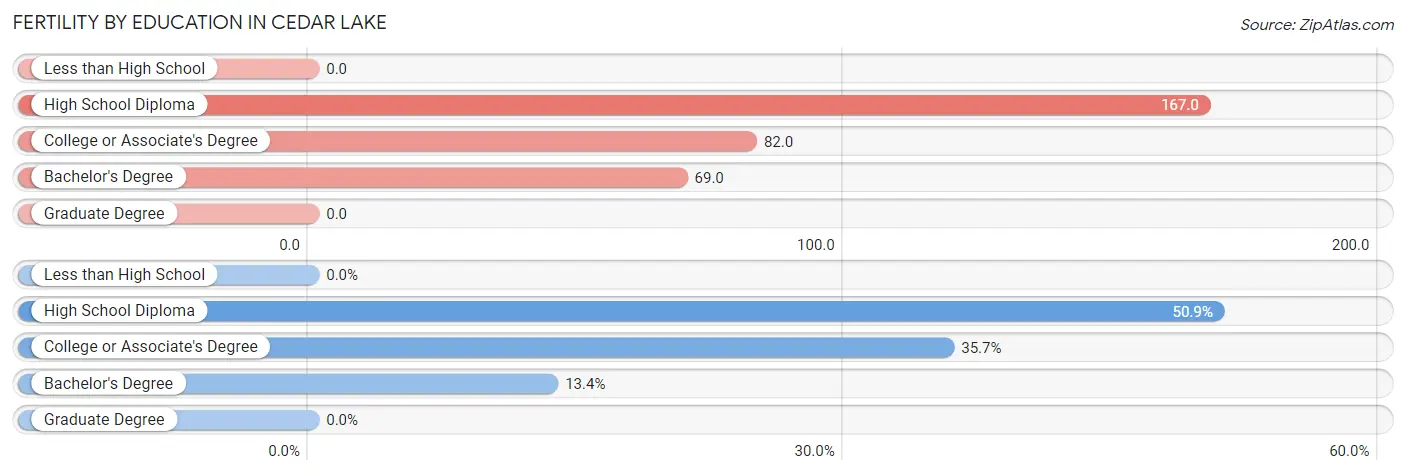
| Educational Attainment | Women with Births | Births / 1,000 Women |
| Less than High School | 0 (0.0%) | 0.0 |
| High School Diploma | 144 (50.9%) | 167.0 |
| College or Associate's Degree | 101 (35.7%) | 82.0 |
| Bachelor's Degree | 38 (13.4%) | 69.0 |
| Graduate Degree | 0 (0.0%) | 0.0 |
| Total | 283 (100.0%) | 86.0 |
Fertility by Education by Marriage Status in Cedar Lake
8.5% of women with births in Cedar Lake are unmarried. Women with the educational attainment of college or associate's degree are most likely to be married with 100.0% of them married at childbirth, while women with the educational attainment of high school diploma are least likely to be married with 16.7% of them unmarried at childbirth.
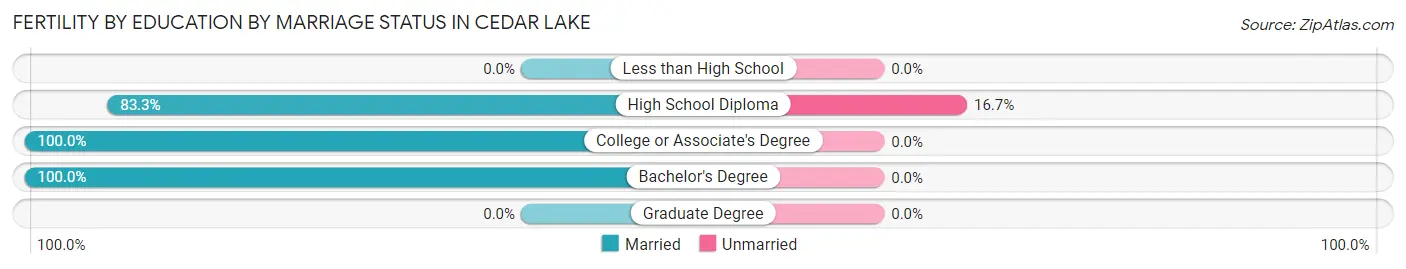
| Educational Attainment | Married | Unmarried |
| Less than High School | 0 (0.0%) | 0 (0.0%) |
| High School Diploma | 120 (83.3%) | 24 (16.7%) |
| College or Associate's Degree | 101 (100.0%) | 0 (0.0%) |
| Bachelor's Degree | 38 (100.0%) | 0 (0.0%) |
| Graduate Degree | 0 (0.0%) | 0 (0.0%) |
| Total | 259 (91.5%) | 24 (8.5%) |
Employment Characteristics in Cedar Lake
Employment by Class of Employer in Cedar Lake
Among the 6,986 employed individuals in Cedar Lake, private company employees (5,279 | 75.6%), not-for-profit organizations (733 | 10.5%), and local government employees (515 | 7.4%) make up the most common classes of employment.
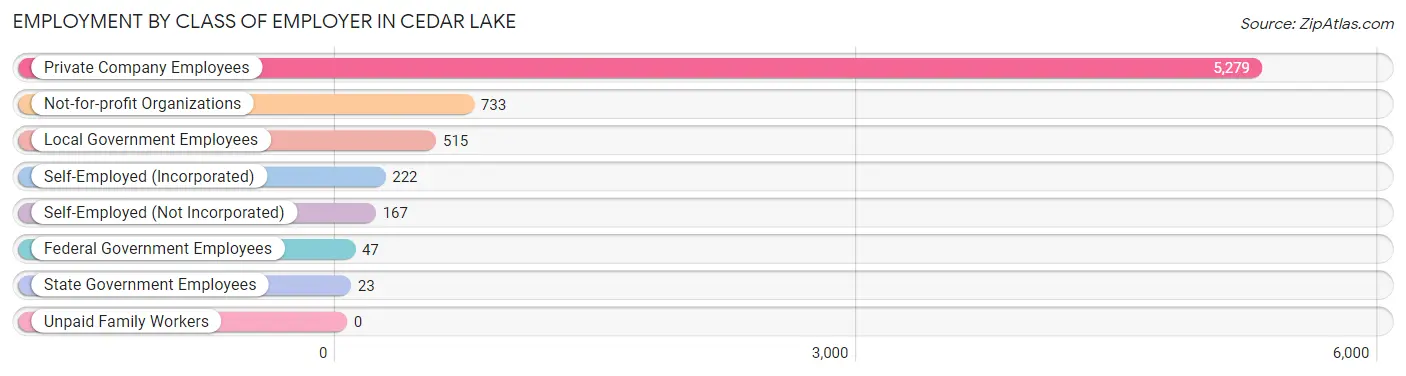
| Employer Class | # Employees | % Employees |
| Private Company Employees | 5,279 | 75.6% |
| Self-Employed (Incorporated) | 222 | 3.2% |
| Self-Employed (Not Incorporated) | 167 | 2.4% |
| Not-for-profit Organizations | 733 | 10.5% |
| Local Government Employees | 515 | 7.4% |
| State Government Employees | 23 | 0.3% |
| Federal Government Employees | 47 | 0.7% |
| Unpaid Family Workers | 0 | 0.0% |
| Total | 6,986 | 100.0% |
Employment Status by Age in Cedar Lake
According to the labor force statistics for Cedar Lake, out of the total population over 16 years of age (11,272), 66.4% or 7,485 individuals are in the labor force, with 5.7% or 427 of them unemployed. The age group with the highest labor force participation rate is 35 to 44 years, with 91.7% or 1,637 individuals in the labor force. Within the labor force, the 20 to 24 years age range has the highest percentage of unemployed individuals, with 29.1% or 195 of them being unemployed.
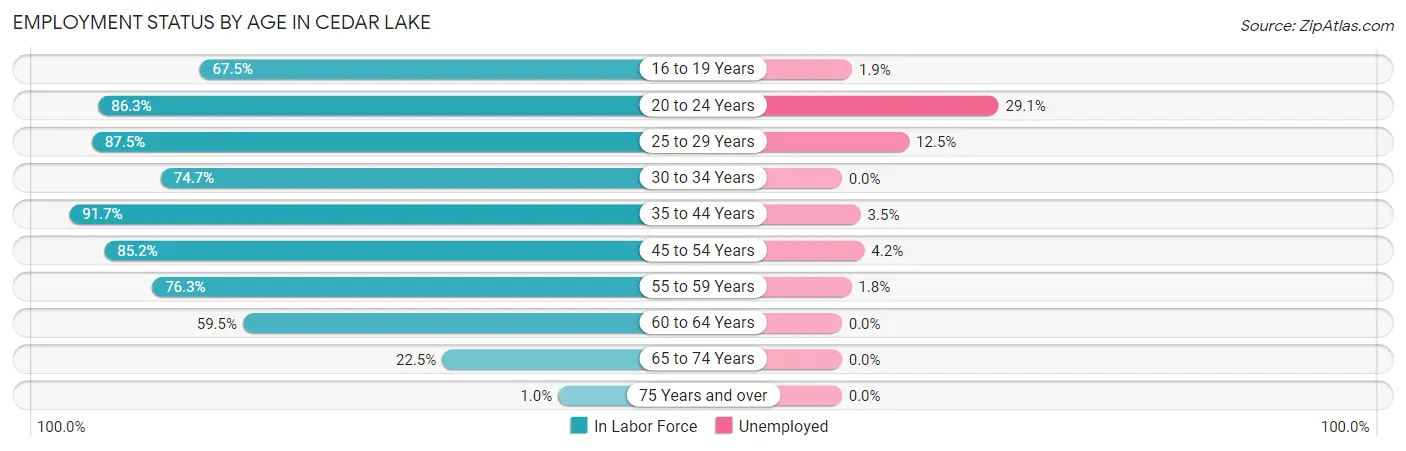
| Age Bracket | In Labor Force | Unemployed |
| 16 to 19 Years | 521 (67.5%) | 10 (1.9%) |
| 20 to 24 Years | 670 (86.3%) | 195 (29.1%) |
| 25 to 29 Years | 664 (87.5%) | 83 (12.5%) |
| 30 to 34 Years | 834 (74.7%) | 0 (0.0%) |
| 35 to 44 Years | 1,637 (91.7%) | 57 (3.5%) |
| 45 to 54 Years | 1,609 (85.2%) | 68 (4.2%) |
| 55 to 59 Years | 603 (76.3%) | 11 (1.8%) |
| 60 to 64 Years | 657 (59.5%) | 0 (0.0%) |
| 65 to 74 Years | 284 (22.5%) | 0 (0.0%) |
| 75 Years and over | 10 (1.0%) | 0 (0.0%) |
| Total | 7,485 (66.4%) | 427 (5.7%) |
Employment Status by Educational Attainment in Cedar Lake
According to labor force statistics for Cedar Lake, 80.6% of individuals (6,001) out of the total population between 25 and 64 years of age (7,445) are in the labor force, with 3.6% or 216 of them being unemployed. The group with the highest labor force participation rate are those with the educational attainment of bachelor's degree or higher, with 91.3% or 1,631 individuals in the labor force. Within the labor force, individuals with high school diploma education have the highest percentage of unemployment, with 8.5% or 174 of them being unemployed.
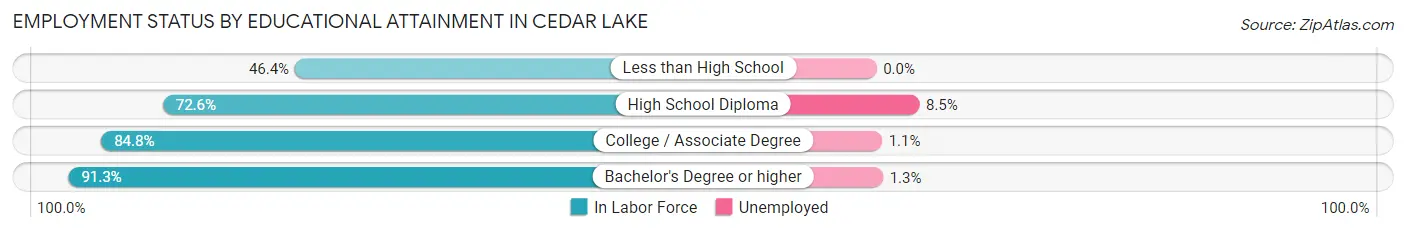
| Educational Attainment | In Labor Force | Unemployed |
| Less than High School | 97 (46.4%) | 0 (0.0%) |
| High School Diploma | 2,047 (72.6%) | 240 (8.5%) |
| College / Associate Degree | 2,230 (84.8%) | 29 (1.1%) |
| Bachelor's Degree or higher | 1,631 (91.3%) | 23 (1.3%) |
| Total | 6,001 (80.6%) | 268 (3.6%) |
Employment Occupations by Sex in Cedar Lake
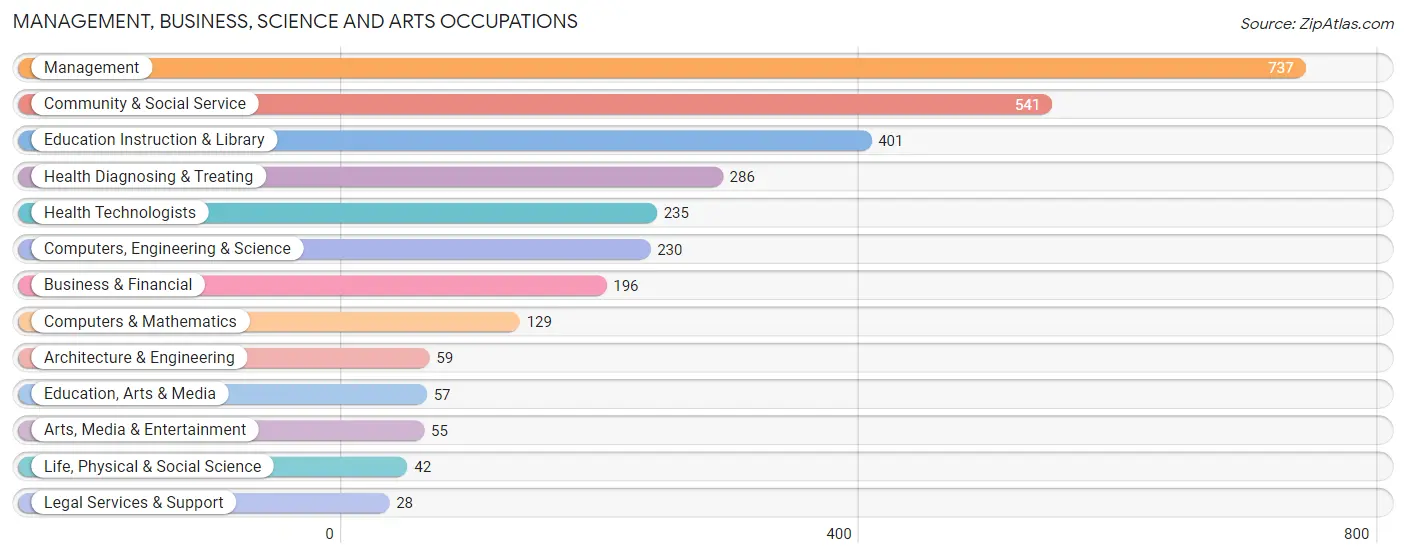
Management, Business, Science and Arts Occupations
The most common Management, Business, Science and Arts occupations in Cedar Lake are Management (737 | 10.4%), Community & Social Service (541 | 7.7%), Education Instruction & Library (401 | 5.7%), Health Diagnosing & Treating (286 | 4.1%), and Health Technologists (235 | 3.3%).
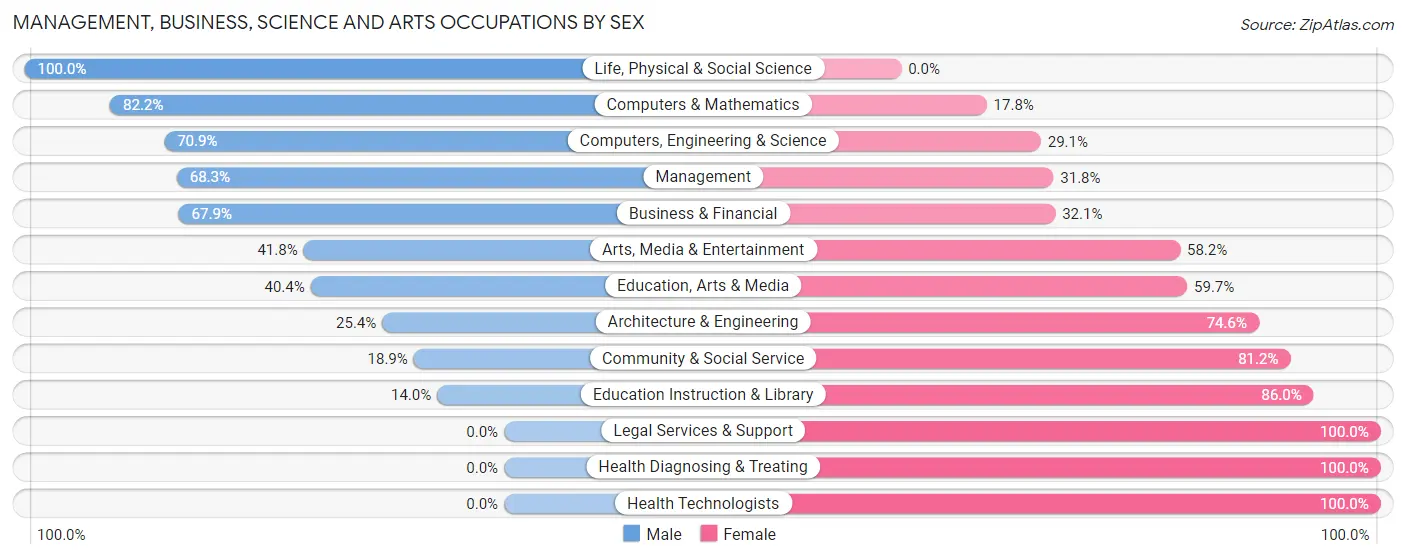
Management, Business, Science and Arts Occupations by Sex
Within the Management, Business, Science and Arts occupations in Cedar Lake, the most male-oriented occupations are Life, Physical & Social Science (100.0%), Computers & Mathematics (82.2%), and Computers, Engineering & Science (70.9%), while the most female-oriented occupations are Legal Services & Support (100.0%), Health Diagnosing & Treating (100.0%), and Health Technologists (100.0%).
| Occupation | Male | Female |
| Management | 503 (68.2%) | 234 (31.8%) |
| Business & Financial | 133 (67.9%) | 63 (32.1%) |
| Computers, Engineering & Science | 163 (70.9%) | 67 (29.1%) |
| Computers & Mathematics | 106 (82.2%) | 23 (17.8%) |
| Architecture & Engineering | 15 (25.4%) | 44 (74.6%) |
| Life, Physical & Social Science | 42 (100.0%) | 0 (0.0%) |
| Community & Social Service | 102 (18.9%) | 439 (81.1%) |
| Education, Arts & Media | 23 (40.4%) | 34 (59.7%) |
| Legal Services & Support | 0 (0.0%) | 28 (100.0%) |
| Education Instruction & Library | 56 (14.0%) | 345 (86.0%) |
| Arts, Media & Entertainment | 23 (41.8%) | 32 (58.2%) |
| Health Diagnosing & Treating | 0 (0.0%) | 286 (100.0%) |
| Health Technologists | 0 (0.0%) | 235 (100.0%) |
| Total (Category) | 901 (45.3%) | 1,089 (54.7%) |
| Total (Overall) | 3,661 (51.8%) | 3,403 (48.2%) |
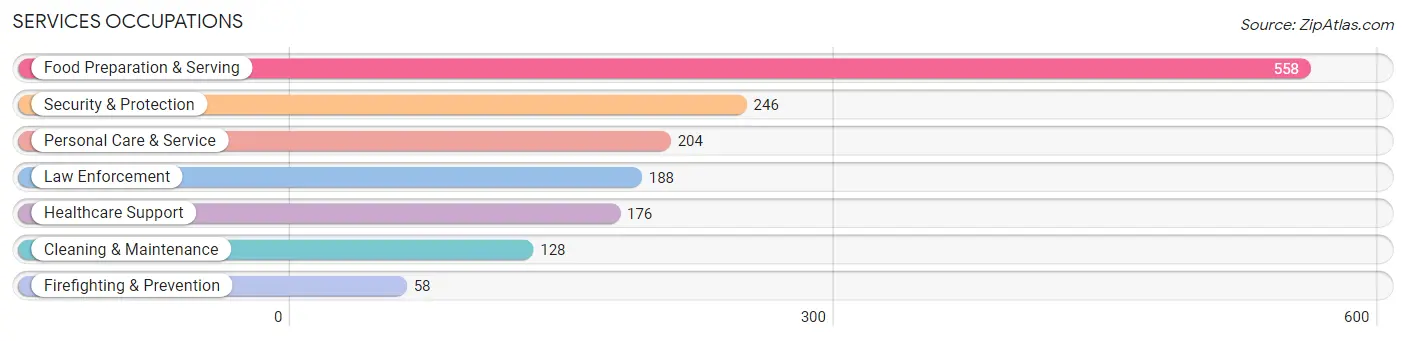
Services Occupations
The most common Services occupations in Cedar Lake are Food Preparation & Serving (558 | 7.9%), Security & Protection (246 | 3.5%), Personal Care & Service (204 | 2.9%), Law Enforcement (188 | 2.7%), and Healthcare Support (176 | 2.5%).
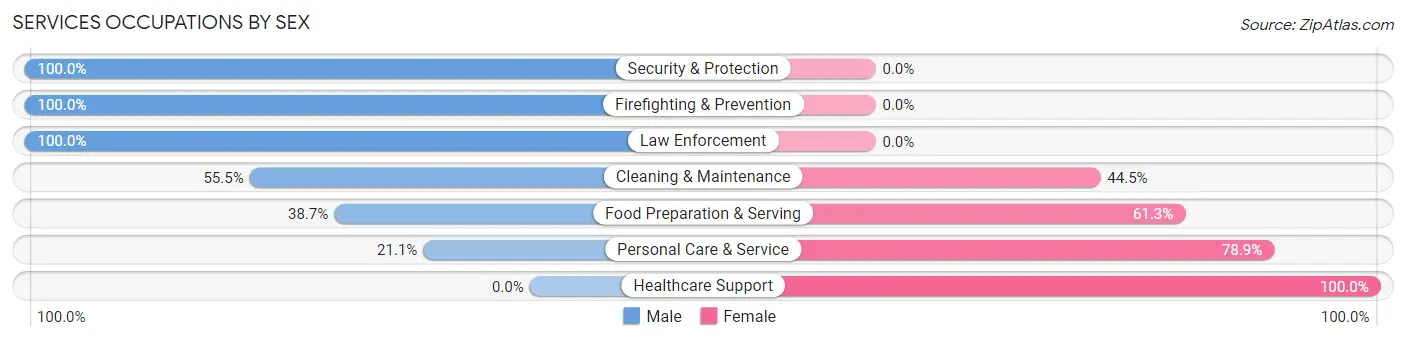
Services Occupations by Sex
Within the Services occupations in Cedar Lake, the most male-oriented occupations are Security & Protection (100.0%), Firefighting & Prevention (100.0%), and Law Enforcement (100.0%), while the most female-oriented occupations are Healthcare Support (100.0%), Personal Care & Service (78.9%), and Food Preparation & Serving (61.3%).
| Occupation | Male | Female |
| Healthcare Support | 0 (0.0%) | 176 (100.0%) |
| Security & Protection | 246 (100.0%) | 0 (0.0%) |
| Firefighting & Prevention | 58 (100.0%) | 0 (0.0%) |
| Law Enforcement | 188 (100.0%) | 0 (0.0%) |
| Food Preparation & Serving | 216 (38.7%) | 342 (61.3%) |
| Cleaning & Maintenance | 71 (55.5%) | 57 (44.5%) |
| Personal Care & Service | 43 (21.1%) | 161 (78.9%) |
| Total (Category) | 576 (43.9%) | 736 (56.1%) |
| Total (Overall) | 3,661 (51.8%) | 3,403 (48.2%) |
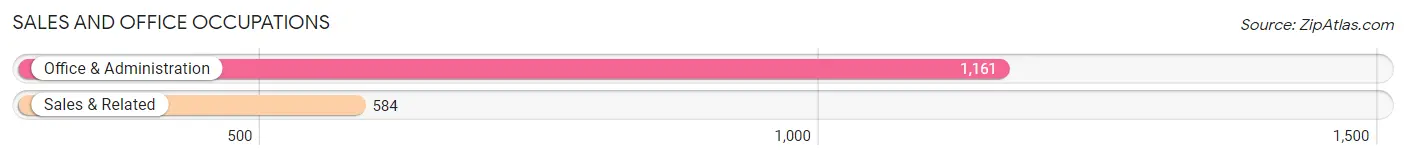
Sales and Office Occupations
The most common Sales and Office occupations in Cedar Lake are Office & Administration (1,161 | 16.4%), and Sales & Related (584 | 8.3%).
Sales and Office Occupations by Sex
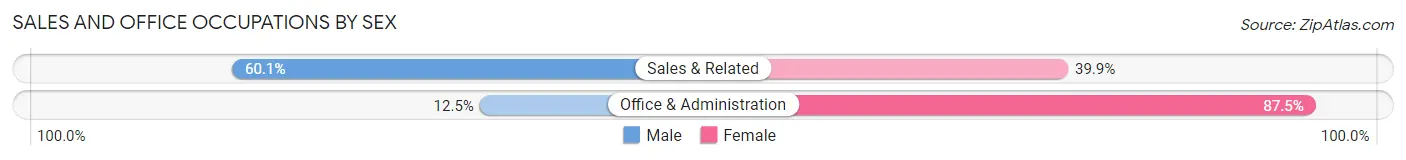
| Occupation | Male | Female |
| Sales & Related | 351 (60.1%) | 233 (39.9%) |
| Office & Administration | 145 (12.5%) | 1,016 (87.5%) |
| Total (Category) | 496 (28.4%) | 1,249 (71.6%) |
| Total (Overall) | 3,661 (51.8%) | 3,403 (48.2%) |
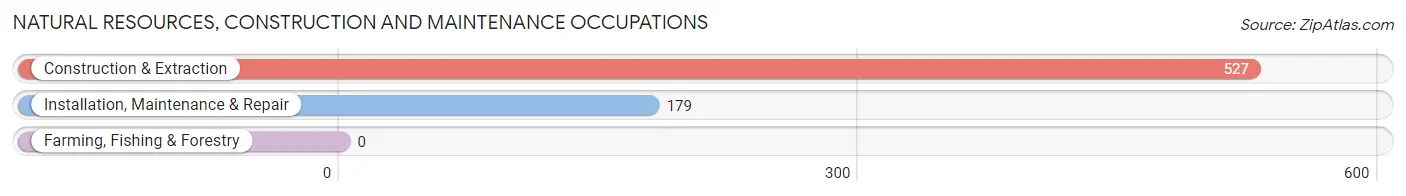
Natural Resources, Construction and Maintenance Occupations
The most common Natural Resources, Construction and Maintenance occupations in Cedar Lake are Construction & Extraction (527 | 7.5%), and Installation, Maintenance & Repair (179 | 2.5%).
Natural Resources, Construction and Maintenance Occupations by Sex
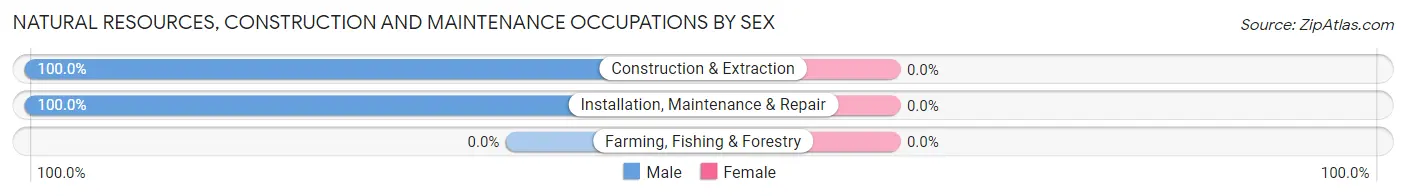
| Occupation | Male | Female |
| Farming, Fishing & Forestry | 0 (0.0%) | 0 (0.0%) |
| Construction & Extraction | 527 (100.0%) | 0 (0.0%) |
| Installation, Maintenance & Repair | 179 (100.0%) | 0 (0.0%) |
| Total (Category) | 706 (100.0%) | 0 (0.0%) |
| Total (Overall) | 3,661 (51.8%) | 3,403 (48.2%) |
Production, Transportation and Moving Occupations
The most common Production, Transportation and Moving occupations in Cedar Lake are Production (458 | 6.5%), Transportation (443 | 6.3%), and Material Moving (410 | 5.8%).
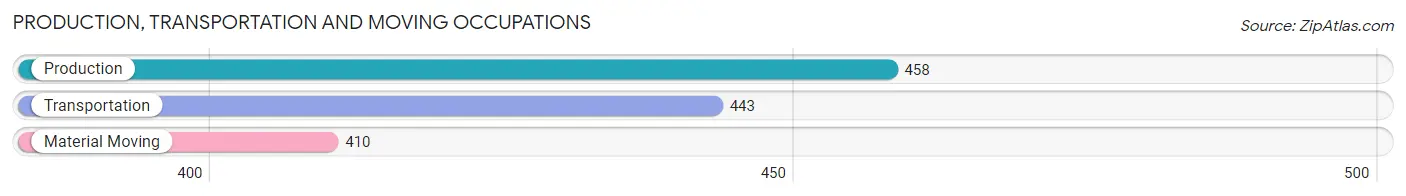
Production, Transportation and Moving Occupations by Sex
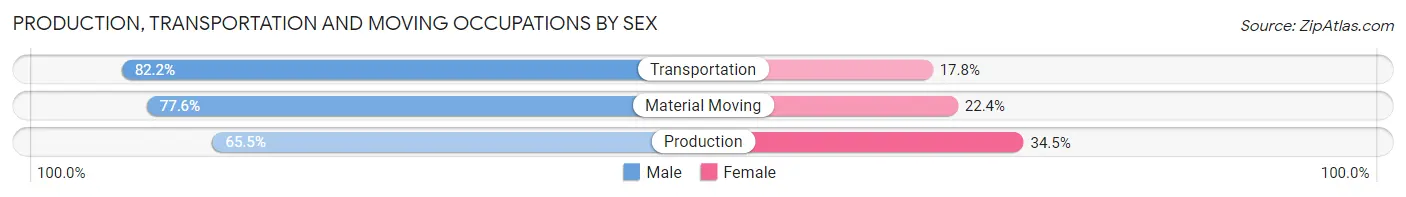
| Occupation | Male | Female |
| Production | 300 (65.5%) | 158 (34.5%) |
| Transportation | 364 (82.2%) | 79 (17.8%) |
| Material Moving | 318 (77.6%) | 92 (22.4%) |
| Total (Category) | 982 (74.9%) | 329 (25.1%) |
| Total (Overall) | 3,661 (51.8%) | 3,403 (48.2%) |
Employment Industries by Sex in Cedar Lake
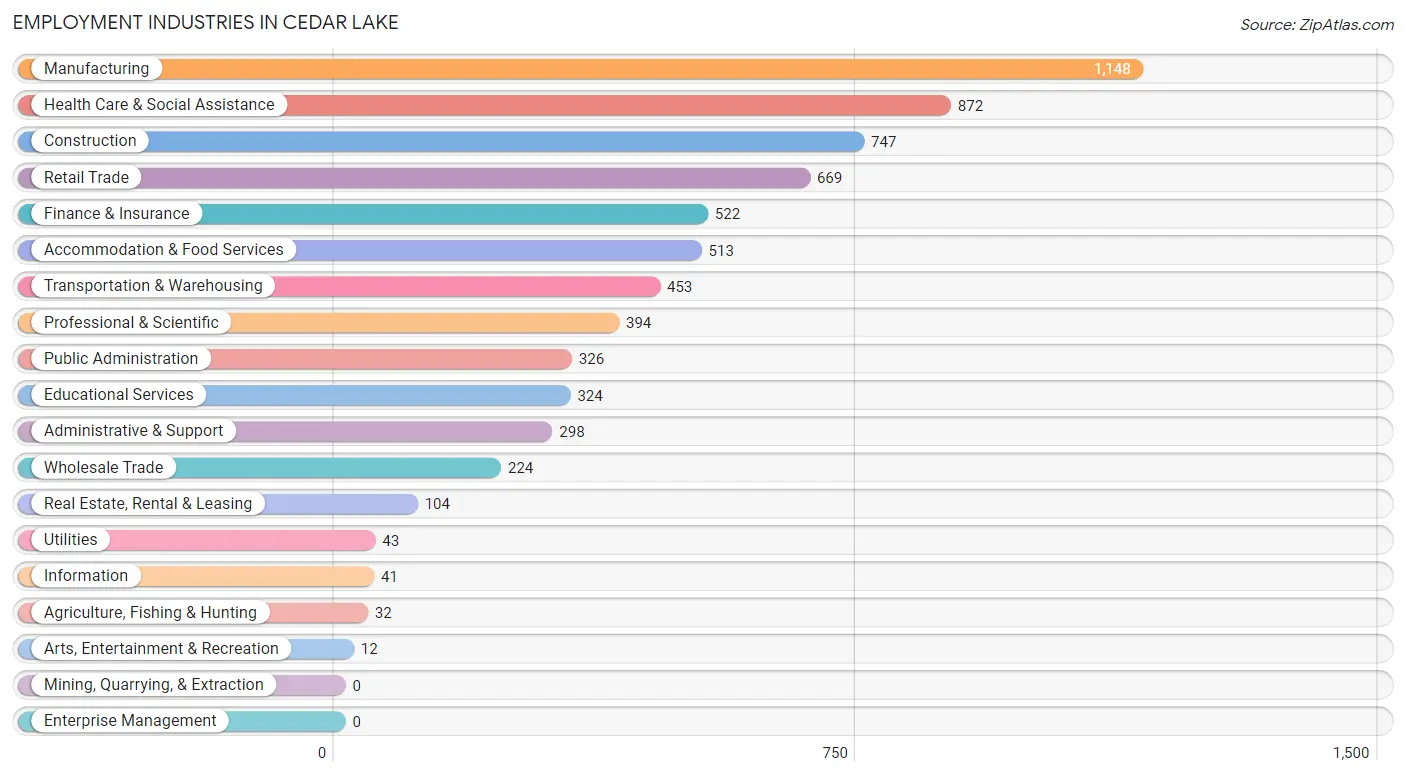
Employment Industries in Cedar Lake
The major employment industries in Cedar Lake include Manufacturing (1,148 | 16.3%), Health Care & Social Assistance (872 | 12.3%), Construction (747 | 10.6%), Retail Trade (669 | 9.5%), and Finance & Insurance (522 | 7.4%).
Employment Industries by Sex in Cedar Lake
The Cedar Lake industries that see more men than women are Utilities (100.0%), Transportation & Warehousing (89.6%), and Construction (82.3%), whereas the industries that tend to have a higher number of women are Agriculture, Fishing & Hunting (100.0%), Arts, Entertainment & Recreation (100.0%), and Health Care & Social Assistance (94.8%).
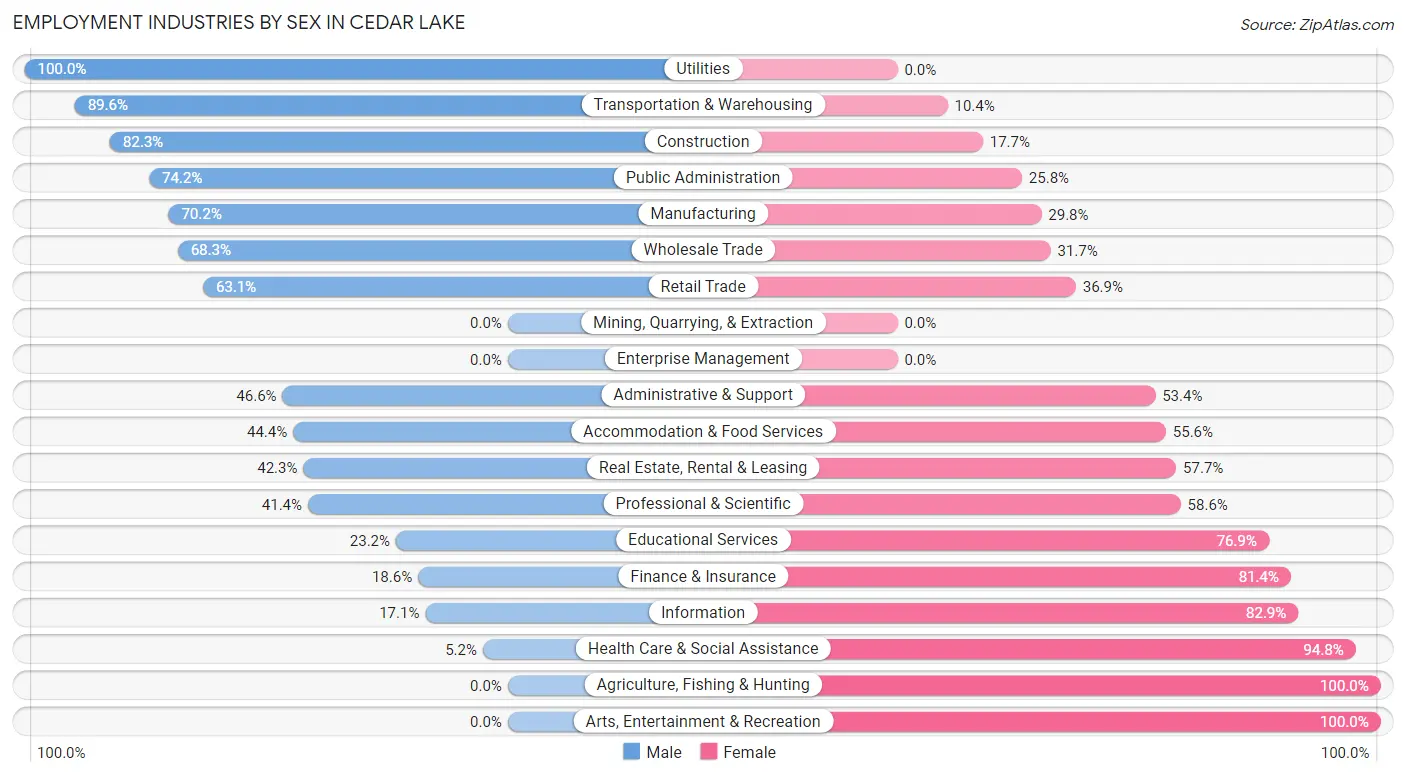
| Industry | Male | Female |
| Agriculture, Fishing & Hunting | 0 (0.0%) | 32 (100.0%) |
| Mining, Quarrying, & Extraction | 0 (0.0%) | 0 (0.0%) |
| Construction | 615 (82.3%) | 132 (17.7%) |
| Manufacturing | 806 (70.2%) | 342 (29.8%) |
| Wholesale Trade | 153 (68.3%) | 71 (31.7%) |
| Retail Trade | 422 (63.1%) | 247 (36.9%) |
| Transportation & Warehousing | 406 (89.6%) | 47 (10.4%) |
| Utilities | 43 (100.0%) | 0 (0.0%) |
| Information | 7 (17.1%) | 34 (82.9%) |
| Finance & Insurance | 97 (18.6%) | 425 (81.4%) |
| Real Estate, Rental & Leasing | 44 (42.3%) | 60 (57.7%) |
| Professional & Scientific | 163 (41.4%) | 231 (58.6%) |
| Enterprise Management | 0 (0.0%) | 0 (0.0%) |
| Administrative & Support | 139 (46.6%) | 159 (53.4%) |
| Educational Services | 75 (23.2%) | 249 (76.8%) |
| Health Care & Social Assistance | 45 (5.2%) | 827 (94.8%) |
| Arts, Entertainment & Recreation | 0 (0.0%) | 12 (100.0%) |
| Accommodation & Food Services | 228 (44.4%) | 285 (55.6%) |
| Public Administration | 242 (74.2%) | 84 (25.8%) |
| Total | 3,661 (51.8%) | 3,403 (48.2%) |
Education in Cedar Lake
School Enrollment in Cedar Lake
The most common levels of schooling among the 3,272 students in Cedar Lake are middle school (949 | 29.0%), high school (702 | 21.4%), and elementary school (602 | 18.4%).
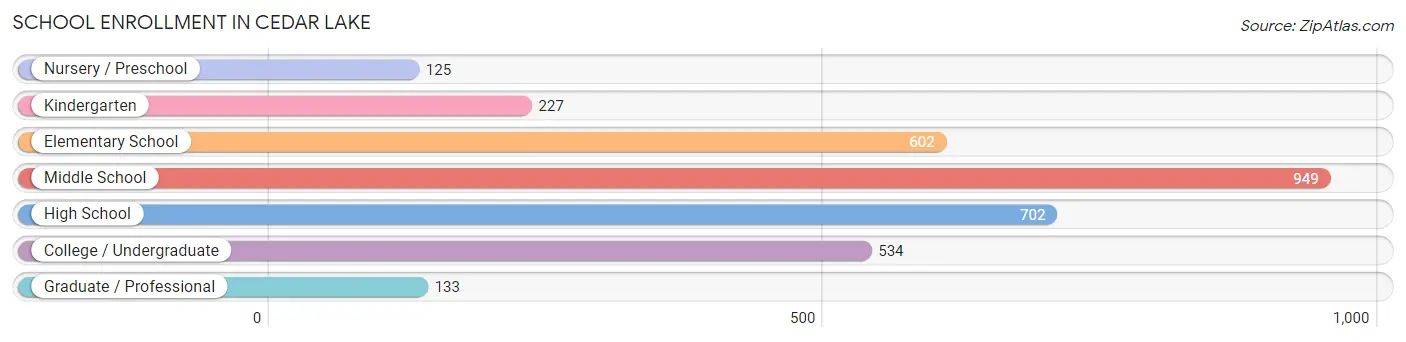
| School Level | # Students | % Students |
| Nursery / Preschool | 125 | 3.8% |
| Kindergarten | 227 | 6.9% |
| Elementary School | 602 | 18.4% |
| Middle School | 949 | 29.0% |
| High School | 702 | 21.4% |
| College / Undergraduate | 534 | 16.3% |
| Graduate / Professional | 133 | 4.1% |
| Total | 3,272 | 100.0% |
School Enrollment by Age by Funding Source in Cedar Lake
Out of a total of 3,272 students who are enrolled in schools in Cedar Lake, 455 (13.9%) attend a private institution, while the remaining 2,817 (86.1%) are enrolled in public schools. The age group of 25 to 34 year olds has the highest likelihood of being enrolled in private schools, with 52 (53.6% in the age bracket) enrolled. Conversely, the age group of 3 to 4 year olds has the lowest likelihood of being enrolled in a private school, with 37 (100.0% in the age bracket) attending a public institution.
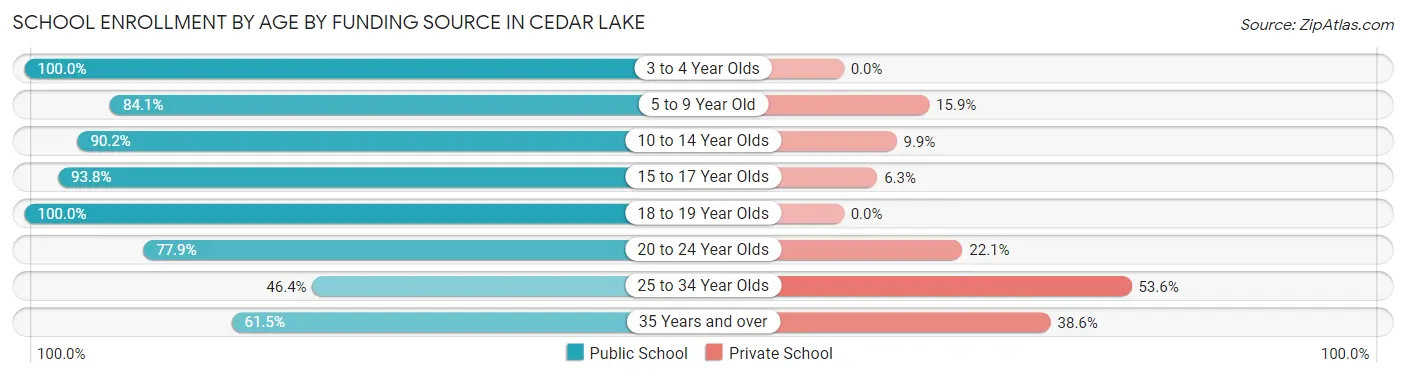
| Age Bracket | Public School | Private School |
| 3 to 4 Year Olds | 37 (100.0%) | 0 (0.0%) |
| 5 to 9 Year Old | 692 (84.1%) | 131 (15.9%) |
| 10 to 14 Year Olds | 989 (90.1%) | 108 (9.9%) |
| 15 to 17 Year Olds | 525 (93.8%) | 35 (6.2%) |
| 18 to 19 Year Olds | 198 (100.0%) | 0 (0.0%) |
| 20 to 24 Year Olds | 229 (77.9%) | 65 (22.1%) |
| 25 to 34 Year Olds | 45 (46.4%) | 52 (53.6%) |
| 35 Years and over | 102 (61.5%) | 64 (38.6%) |
| Total | 2,817 (86.1%) | 455 (13.9%) |
Educational Attainment by Field of Study in Cedar Lake
Business (674 | 28.5%), science & technology (346 | 14.6%), education (306 | 13.0%), liberal arts & history (249 | 10.5%), and arts & humanities (174 | 7.4%) are the most common fields of study among 2,361 individuals in Cedar Lake who have obtained a bachelor's degree or higher.
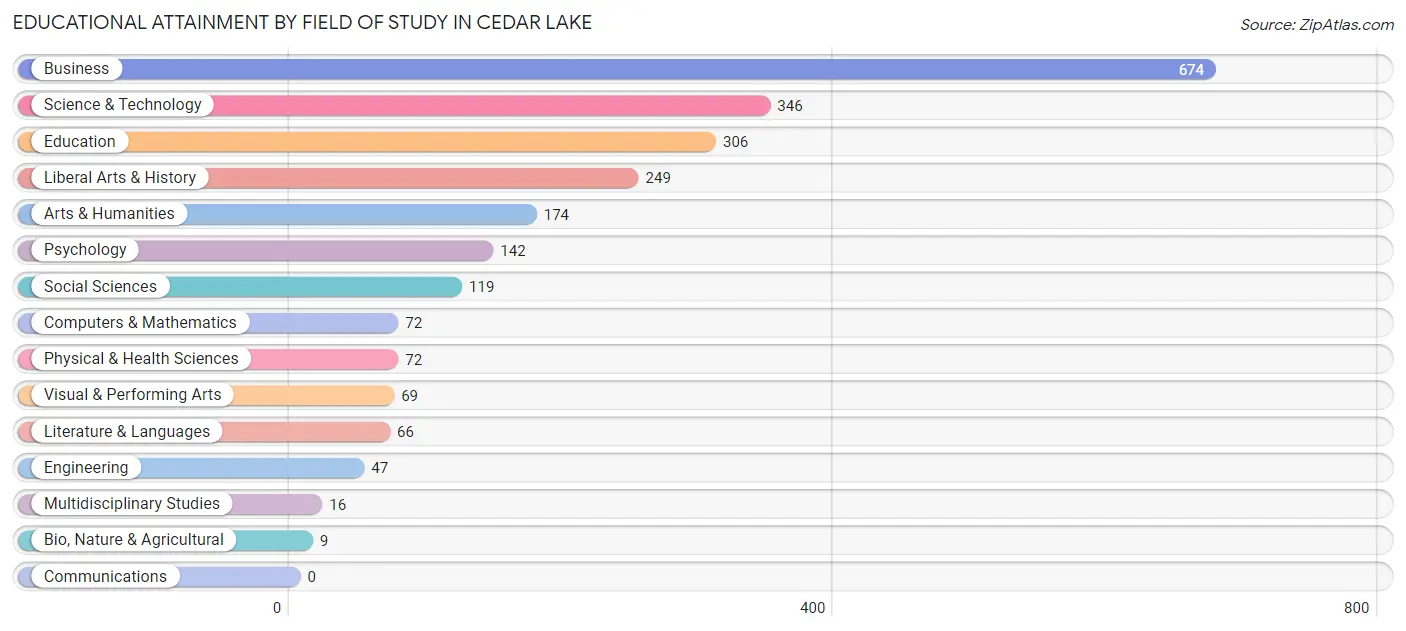
| Field of Study | # Graduates | % Graduates |
| Computers & Mathematics | 72 | 3.0% |
| Bio, Nature & Agricultural | 9 | 0.4% |
| Physical & Health Sciences | 72 | 3.0% |
| Psychology | 142 | 6.0% |
| Social Sciences | 119 | 5.0% |
| Engineering | 47 | 2.0% |
| Multidisciplinary Studies | 16 | 0.7% |
| Science & Technology | 346 | 14.6% |
| Business | 674 | 28.5% |
| Education | 306 | 13.0% |
| Literature & Languages | 66 | 2.8% |
| Liberal Arts & History | 249 | 10.5% |
| Visual & Performing Arts | 69 | 2.9% |
| Communications | 0 | 0.0% |
| Arts & Humanities | 174 | 7.4% |
| Total | 2,361 | 100.0% |
Transportation & Commute in Cedar Lake
Vehicle Availability by Sex in Cedar Lake
The most prevalent vehicle ownership categories in Cedar Lake are males with 2 vehicles (1,785, accounting for 49.1%) and females with 2 vehicles (1,431, making up 53.4%).
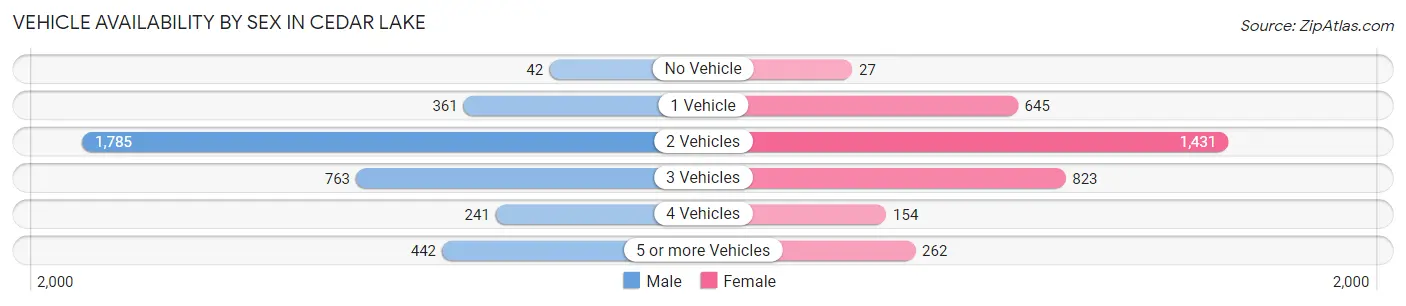
| Vehicles Available | Male | Female |
| No Vehicle | 42 (1.2%) | 27 (0.8%) |
| 1 Vehicle | 361 (9.9%) | 645 (19.3%) |
| 2 Vehicles | 1,785 (49.1%) | 1,431 (42.8%) |
| 3 Vehicles | 763 (21.0%) | 823 (24.6%) |
| 4 Vehicles | 241 (6.6%) | 154 (4.6%) |
| 5 or more Vehicles | 442 (12.2%) | 262 (7.8%) |
| Total | 3,634 (100.0%) | 3,342 (100.0%) |
Commute Time in Cedar Lake
The most frequently occuring commute durations in Cedar Lake are 15 to 19 minutes (954 commuters, 14.3%), 30 to 34 minutes (886 commuters, 13.3%), and 45 to 59 minutes (840 commuters, 12.6%).
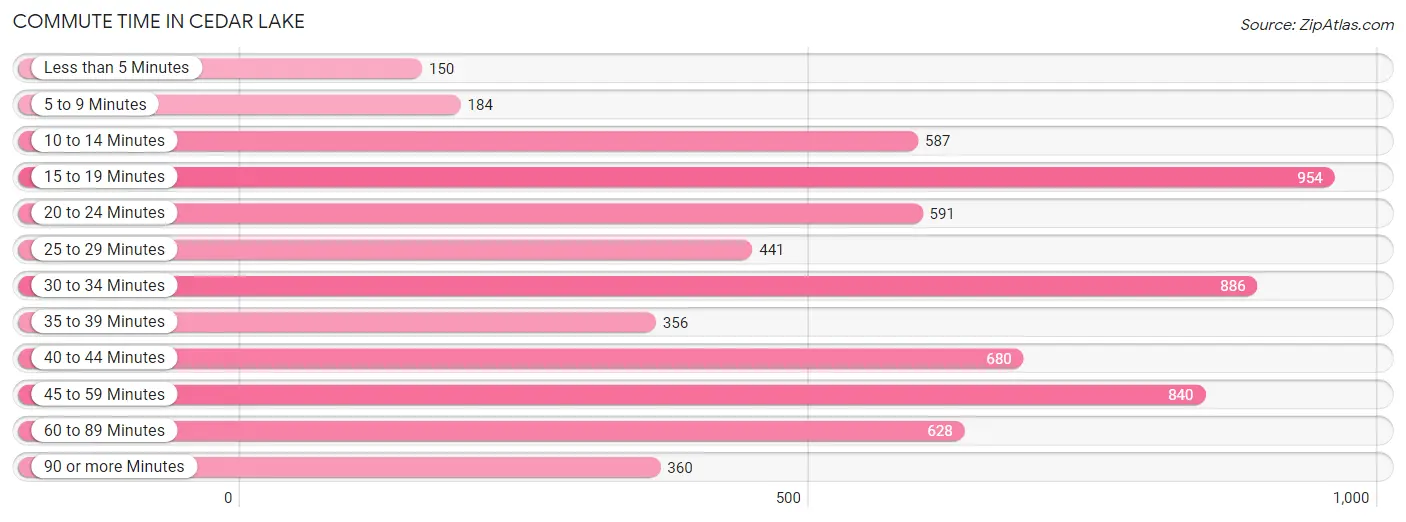
| Commute Time | # Commuters | % Commuters |
| Less than 5 Minutes | 150 | 2.2% |
| 5 to 9 Minutes | 184 | 2.8% |
| 10 to 14 Minutes | 587 | 8.8% |
| 15 to 19 Minutes | 954 | 14.3% |
| 20 to 24 Minutes | 591 | 8.9% |
| 25 to 29 Minutes | 441 | 6.6% |
| 30 to 34 Minutes | 886 | 13.3% |
| 35 to 39 Minutes | 356 | 5.3% |
| 40 to 44 Minutes | 680 | 10.2% |
| 45 to 59 Minutes | 840 | 12.6% |
| 60 to 89 Minutes | 628 | 9.4% |
| 90 or more Minutes | 360 | 5.4% |
Commute Time by Sex in Cedar Lake
The most common commute times in Cedar Lake are 15 to 19 minutes (514 commuters, 14.9%) for males and 20 to 24 minutes (461 commuters, 14.4%) for females.
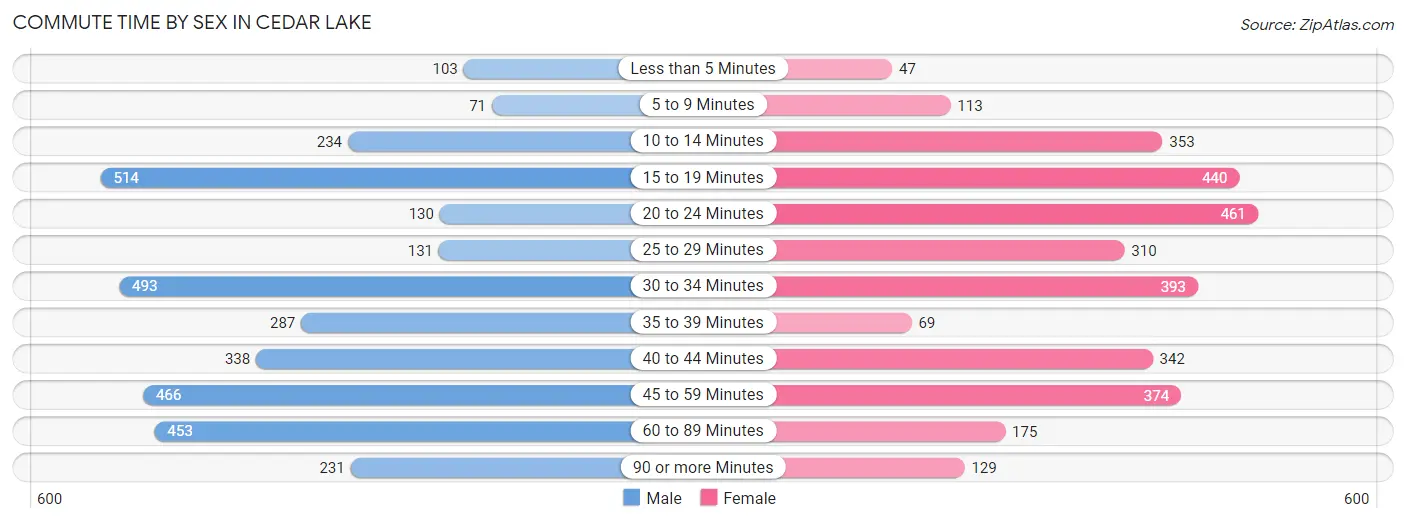
| Commute Time | Male | Female |
| Less than 5 Minutes | 103 (3.0%) | 47 (1.5%) |
| 5 to 9 Minutes | 71 (2.1%) | 113 (3.5%) |
| 10 to 14 Minutes | 234 (6.8%) | 353 (11.0%) |
| 15 to 19 Minutes | 514 (14.9%) | 440 (13.7%) |
| 20 to 24 Minutes | 130 (3.8%) | 461 (14.4%) |
| 25 to 29 Minutes | 131 (3.8%) | 310 (9.7%) |
| 30 to 34 Minutes | 493 (14.3%) | 393 (12.3%) |
| 35 to 39 Minutes | 287 (8.3%) | 69 (2.1%) |
| 40 to 44 Minutes | 338 (9.8%) | 342 (10.7%) |
| 45 to 59 Minutes | 466 (13.5%) | 374 (11.7%) |
| 60 to 89 Minutes | 453 (13.1%) | 175 (5.5%) |
| 90 or more Minutes | 231 (6.7%) | 129 (4.0%) |
Time of Departure to Work by Sex in Cedar Lake
The most frequent times of departure to work in Cedar Lake are 12:00 AM to 4:59 AM (554, 16.1%) for males and 6:30 AM to 6:59 AM (612, 19.1%) for females.
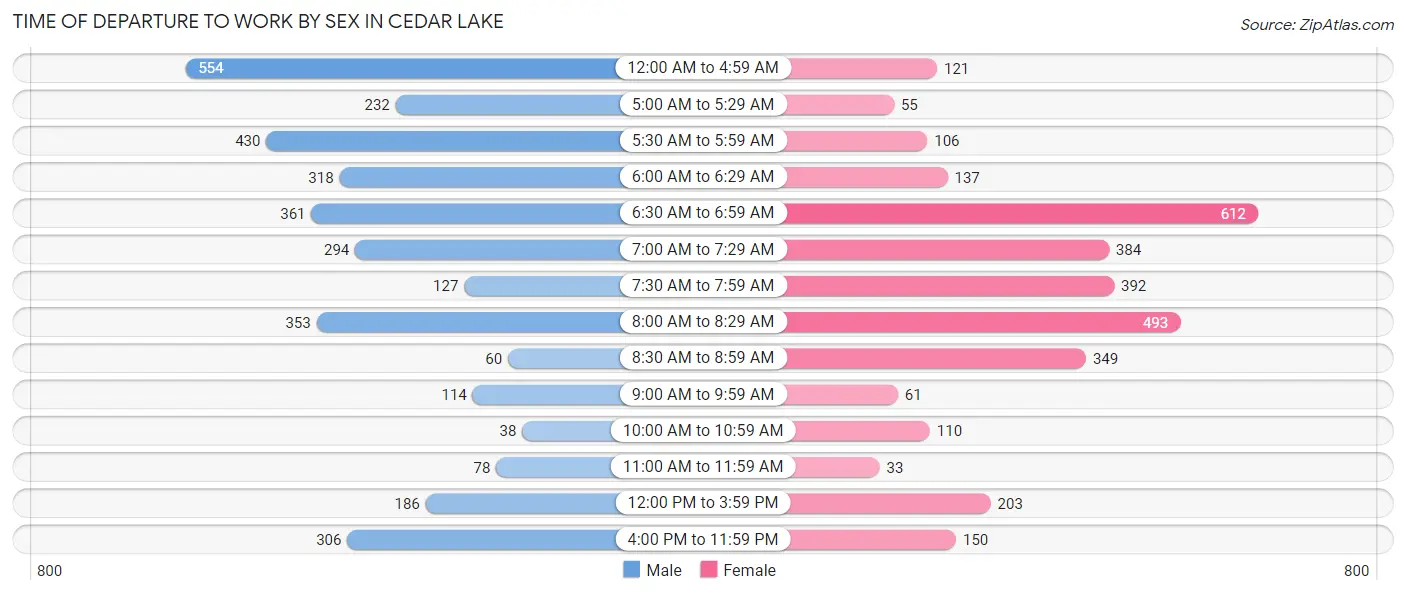
| Time of Departure | Male | Female |
| 12:00 AM to 4:59 AM | 554 (16.1%) | 121 (3.8%) |
| 5:00 AM to 5:29 AM | 232 (6.7%) | 55 (1.7%) |
| 5:30 AM to 5:59 AM | 430 (12.5%) | 106 (3.3%) |
| 6:00 AM to 6:29 AM | 318 (9.2%) | 137 (4.3%) |
| 6:30 AM to 6:59 AM | 361 (10.5%) | 612 (19.1%) |
| 7:00 AM to 7:29 AM | 294 (8.5%) | 384 (12.0%) |
| 7:30 AM to 7:59 AM | 127 (3.7%) | 392 (12.2%) |
| 8:00 AM to 8:29 AM | 353 (10.2%) | 493 (15.4%) |
| 8:30 AM to 8:59 AM | 60 (1.7%) | 349 (10.9%) |
| 9:00 AM to 9:59 AM | 114 (3.3%) | 61 (1.9%) |
| 10:00 AM to 10:59 AM | 38 (1.1%) | 110 (3.4%) |
| 11:00 AM to 11:59 AM | 78 (2.3%) | 33 (1.0%) |
| 12:00 PM to 3:59 PM | 186 (5.4%) | 203 (6.3%) |
| 4:00 PM to 11:59 PM | 306 (8.9%) | 150 (4.7%) |
| Total | 3,451 (100.0%) | 3,206 (100.0%) |
Housing Occupancy in Cedar Lake
Occupancy by Ownership in Cedar Lake
Of the total 5,274 dwellings in Cedar Lake, owner-occupied units account for 4,211 (79.8%), while renter-occupied units make up 1,063 (20.2%).
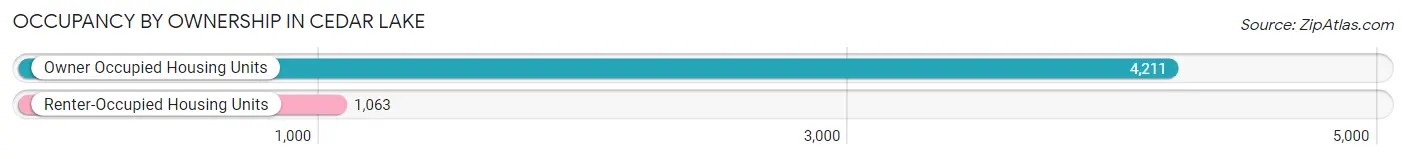
| Occupancy | # Housing Units | % Housing Units |
| Owner Occupied Housing Units | 4,211 | 79.8% |
| Renter-Occupied Housing Units | 1,063 | 20.2% |
| Total Occupied Housing Units | 5,274 | 100.0% |
Occupancy by Household Size in Cedar Lake
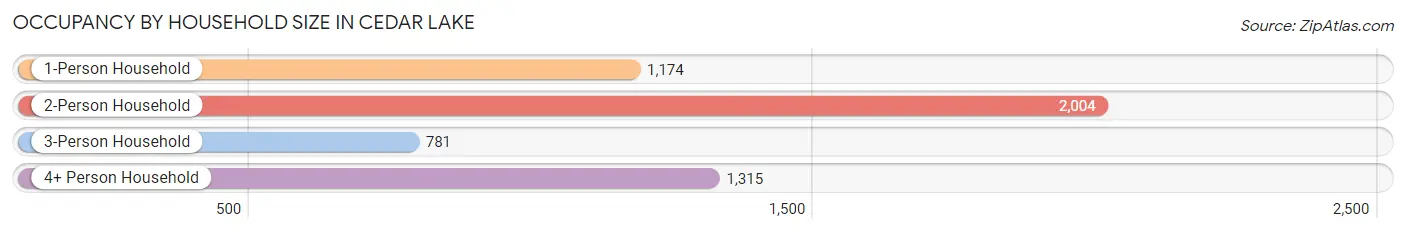
| Household Size | # Housing Units | % Housing Units |
| 1-Person Household | 1,174 | 22.3% |
| 2-Person Household | 2,004 | 38.0% |
| 3-Person Household | 781 | 14.8% |
| 4+ Person Household | 1,315 | 24.9% |
| Total Housing Units | 5,274 | 100.0% |
Occupancy by Ownership by Household Size in Cedar Lake
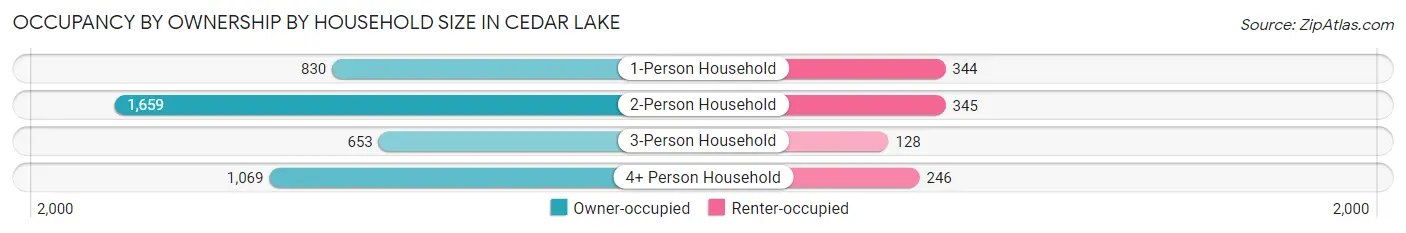
| Household Size | Owner-occupied | Renter-occupied |
| 1-Person Household | 830 (70.7%) | 344 (29.3%) |
| 2-Person Household | 1,659 (82.8%) | 345 (17.2%) |
| 3-Person Household | 653 (83.6%) | 128 (16.4%) |
| 4+ Person Household | 1,069 (81.3%) | 246 (18.7%) |
| Total Housing Units | 4,211 (79.8%) | 1,063 (20.2%) |
Occupancy by Educational Attainment in Cedar Lake
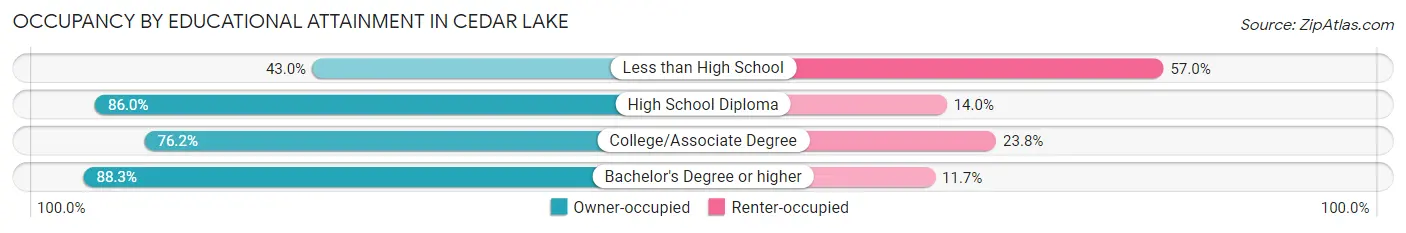
| Household Size | Owner-occupied | Renter-occupied |
| Less than High School | 142 (43.0%) | 188 (57.0%) |
| High School Diploma | 1,463 (86.0%) | 238 (14.0%) |
| College/Associate Degree | 1,624 (76.2%) | 507 (23.8%) |
| Bachelor's Degree or higher | 982 (88.3%) | 130 (11.7%) |
Occupancy by Age of Householder in Cedar Lake
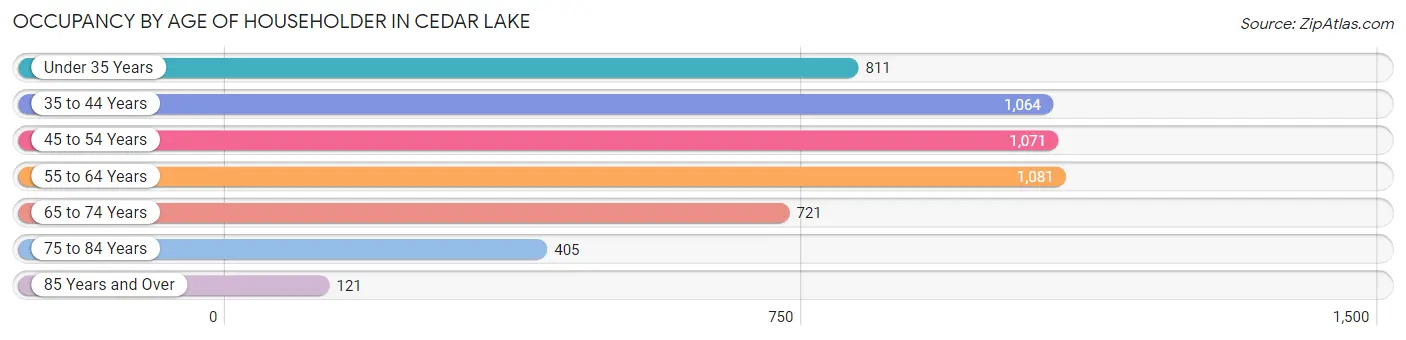
| Age Bracket | # Households | % Households |
| Under 35 Years | 811 | 15.4% |
| 35 to 44 Years | 1,064 | 20.2% |
| 45 to 54 Years | 1,071 | 20.3% |
| 55 to 64 Years | 1,081 | 20.5% |
| 65 to 74 Years | 721 | 13.7% |
| 75 to 84 Years | 405 | 7.7% |
| 85 Years and Over | 121 | 2.3% |
| Total | 5,274 | 100.0% |
Housing Finances in Cedar Lake
Median Income by Occupancy in Cedar Lake
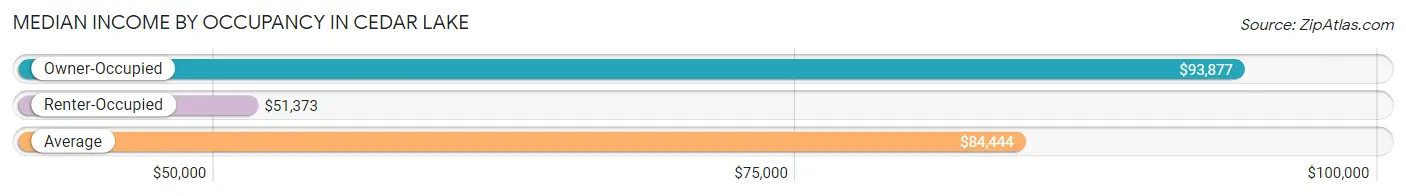
| Occupancy Type | # Households | Median Income |
| Owner-Occupied | 4,211 (79.8%) | $93,877 |
| Renter-Occupied | 1,063 (20.2%) | $51,373 |
| Average | 5,274 (100.0%) | $84,444 |
Occupancy by Householder Income Bracket in Cedar Lake
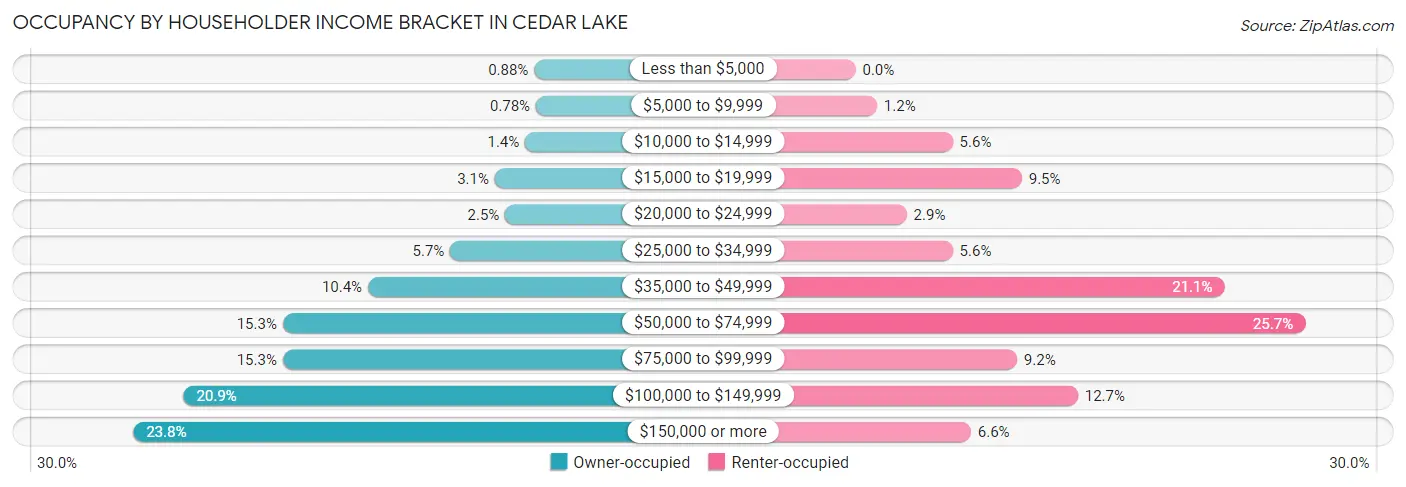
| Income Bracket | Owner-occupied | Renter-occupied |
| Less than $5,000 | 37 (0.9%) | 0 (0.0%) |
| $5,000 to $9,999 | 33 (0.8%) | 13 (1.2%) |
| $10,000 to $14,999 | 59 (1.4%) | 59 (5.6%) |
| $15,000 to $19,999 | 132 (3.1%) | 101 (9.5%) |
| $20,000 to $24,999 | 107 (2.5%) | 31 (2.9%) |
| $25,000 to $34,999 | 239 (5.7%) | 59 (5.6%) |
| $35,000 to $49,999 | 437 (10.4%) | 224 (21.1%) |
| $50,000 to $74,999 | 642 (15.2%) | 273 (25.7%) |
| $75,000 to $99,999 | 642 (15.2%) | 98 (9.2%) |
| $100,000 to $149,999 | 881 (20.9%) | 135 (12.7%) |
| $150,000 or more | 1,002 (23.8%) | 70 (6.6%) |
| Total | 4,211 (100.0%) | 1,063 (100.0%) |
Monthly Housing Cost Tiers in Cedar Lake
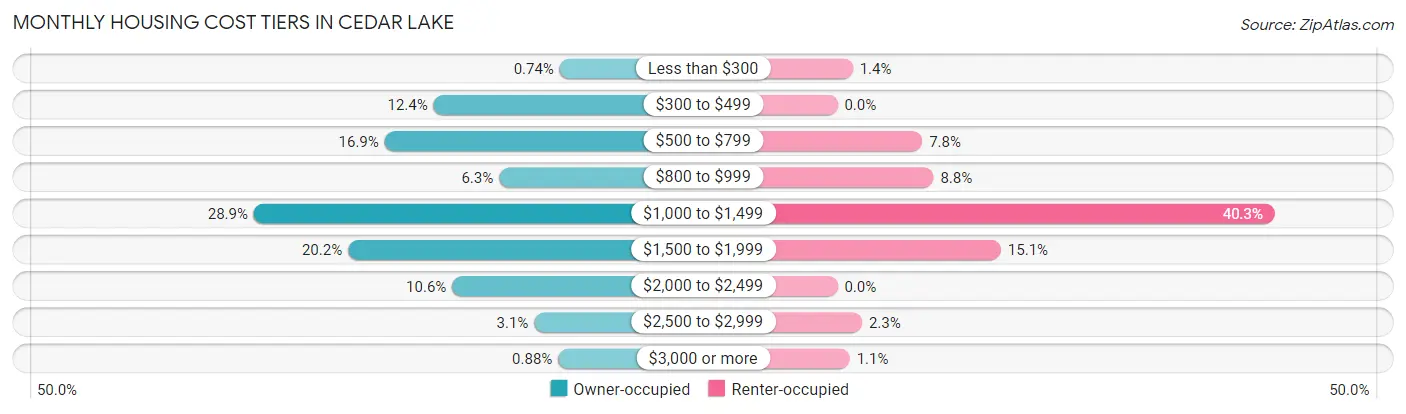
| Monthly Cost | Owner-occupied | Renter-occupied |
| Less than $300 | 31 (0.7%) | 15 (1.4%) |
| $300 to $499 | 520 (12.3%) | 0 (0.0%) |
| $500 to $799 | 710 (16.9%) | 83 (7.8%) |
| $800 to $999 | 266 (6.3%) | 94 (8.8%) |
| $1,000 to $1,499 | 1,217 (28.9%) | 428 (40.3%) |
| $1,500 to $1,999 | 852 (20.2%) | 160 (15.0%) |
| $2,000 to $2,499 | 448 (10.6%) | 0 (0.0%) |
| $2,500 to $2,999 | 130 (3.1%) | 24 (2.3%) |
| $3,000 or more | 37 (0.9%) | 12 (1.1%) |
| Total | 4,211 (100.0%) | 1,063 (100.0%) |
Physical Housing Characteristics in Cedar Lake
Housing Structures in Cedar Lake
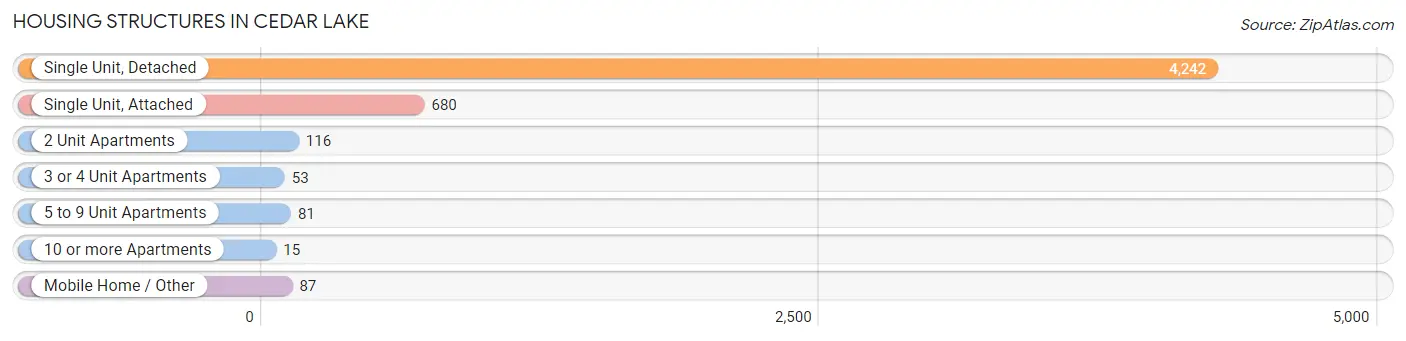
| Structure Type | # Housing Units | % Housing Units |
| Single Unit, Detached | 4,242 | 80.4% |
| Single Unit, Attached | 680 | 12.9% |
| 2 Unit Apartments | 116 | 2.2% |
| 3 or 4 Unit Apartments | 53 | 1.0% |
| 5 to 9 Unit Apartments | 81 | 1.5% |
| 10 or more Apartments | 15 | 0.3% |
| Mobile Home / Other | 87 | 1.7% |
| Total | 5,274 | 100.0% |
Housing Structures by Occupancy in Cedar Lake
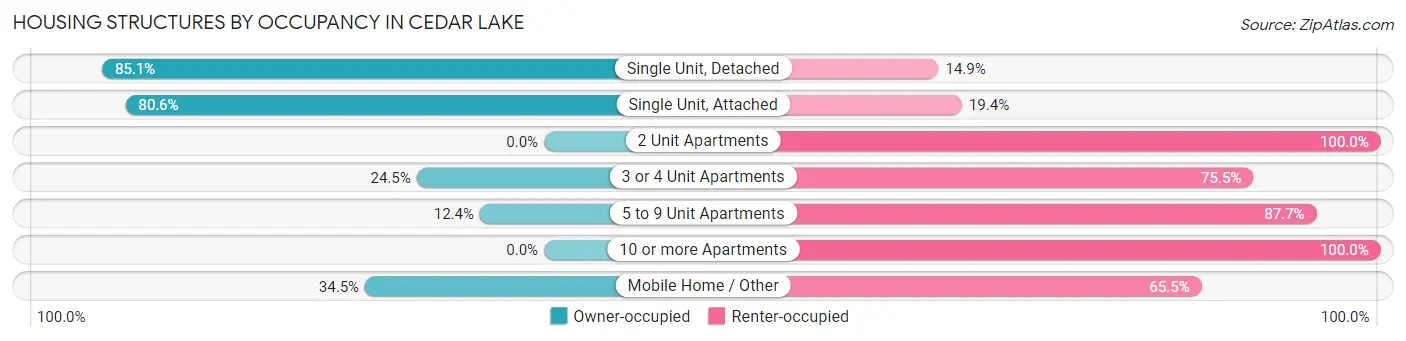
| Structure Type | Owner-occupied | Renter-occupied |
| Single Unit, Detached | 3,610 (85.1%) | 632 (14.9%) |
| Single Unit, Attached | 548 (80.6%) | 132 (19.4%) |
| 2 Unit Apartments | 0 (0.0%) | 116 (100.0%) |
| 3 or 4 Unit Apartments | 13 (24.5%) | 40 (75.5%) |
| 5 to 9 Unit Apartments | 10 (12.3%) | 71 (87.6%) |
| 10 or more Apartments | 0 (0.0%) | 15 (100.0%) |
| Mobile Home / Other | 30 (34.5%) | 57 (65.5%) |
| Total | 4,211 (79.8%) | 1,063 (20.2%) |
Housing Structures by Number of Rooms in Cedar Lake
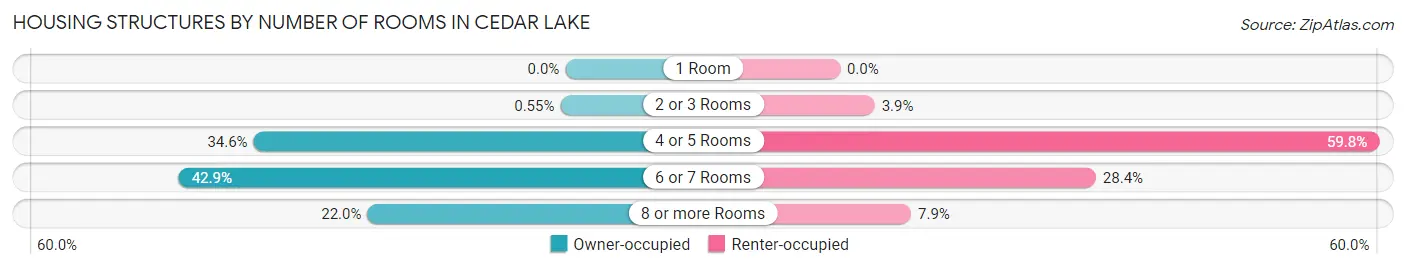
| Number of Rooms | Owner-occupied | Renter-occupied |
| 1 Room | 0 (0.0%) | 0 (0.0%) |
| 2 or 3 Rooms | 23 (0.5%) | 41 (3.9%) |
| 4 or 5 Rooms | 1,457 (34.6%) | 636 (59.8%) |
| 6 or 7 Rooms | 1,806 (42.9%) | 302 (28.4%) |
| 8 or more Rooms | 925 (22.0%) | 84 (7.9%) |
| Total | 4,211 (100.0%) | 1,063 (100.0%) |
Housing Structure by Heating Type in Cedar Lake
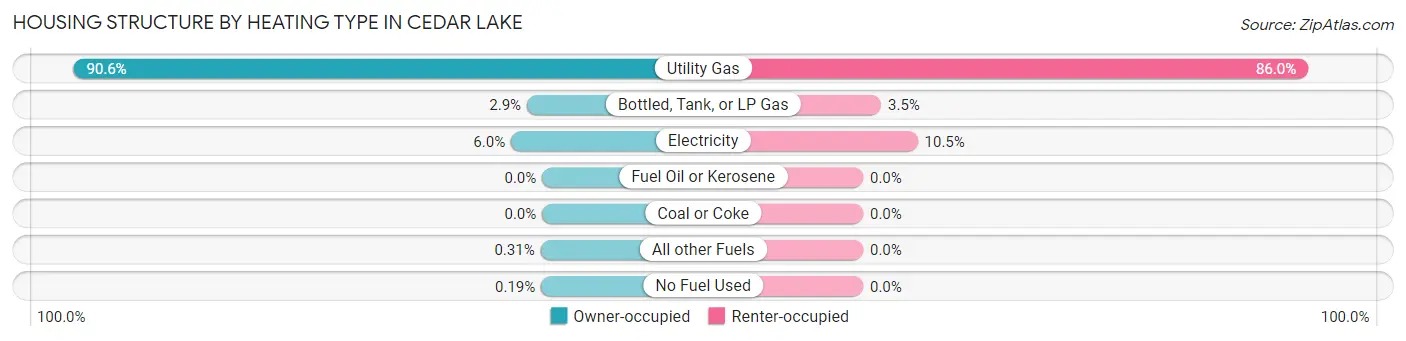
| Heating Type | Owner-occupied | Renter-occupied |
| Utility Gas | 3,813 (90.5%) | 914 (86.0%) |
| Bottled, Tank, or LP Gas | 124 (2.9%) | 37 (3.5%) |
| Electricity | 253 (6.0%) | 112 (10.5%) |
| Fuel Oil or Kerosene | 0 (0.0%) | 0 (0.0%) |
| Coal or Coke | 0 (0.0%) | 0 (0.0%) |
| All other Fuels | 13 (0.3%) | 0 (0.0%) |
| No Fuel Used | 8 (0.2%) | 0 (0.0%) |
| Total | 4,211 (100.0%) | 1,063 (100.0%) |
Household Vehicle Usage in Cedar Lake
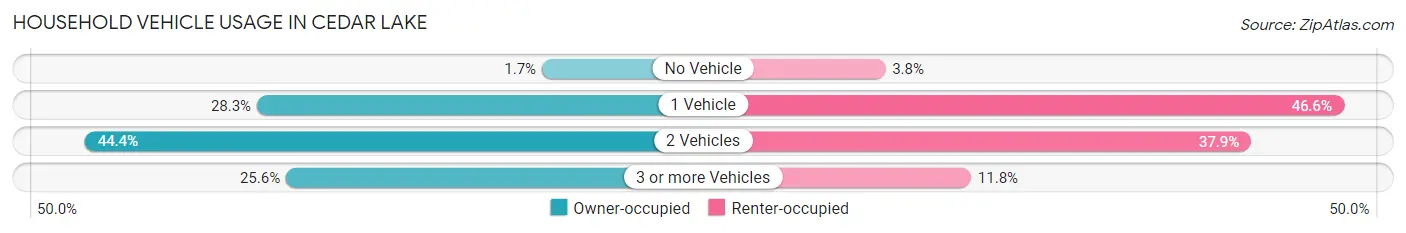
| Vehicles per Household | Owner-occupied | Renter-occupied |
| No Vehicle | 72 (1.7%) | 40 (3.8%) |
| 1 Vehicle | 1,192 (28.3%) | 495 (46.6%) |
| 2 Vehicles | 1,869 (44.4%) | 403 (37.9%) |
| 3 or more Vehicles | 1,078 (25.6%) | 125 (11.8%) |
| Total | 4,211 (100.0%) | 1,063 (100.0%) |
Real Estate & Mortgages in Cedar Lake
Real Estate and Mortgage Overview in Cedar Lake
| Characteristic | Without Mortgage | With Mortgage |
| Housing Units | 1,165 | 3,046 |
| Median Property Value | $231,700 | $231,300 |
| Median Household Income | $56,849 | $851 |
| Monthly Housing Costs | $530 | $37 |
| Real Estate Taxes | $2,181 | $16 |
Property Value by Mortgage Status in Cedar Lake
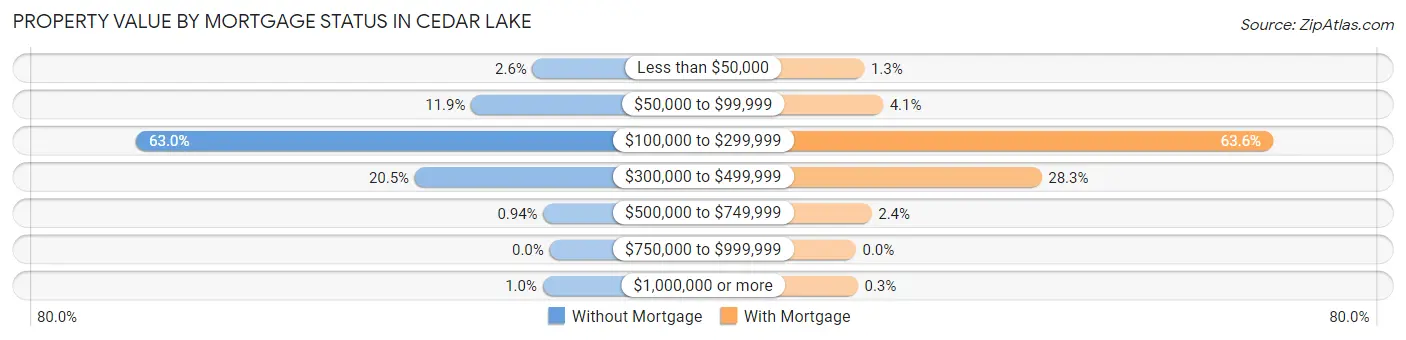
| Property Value | Without Mortgage | With Mortgage |
| Less than $50,000 | 30 (2.6%) | 39 (1.3%) |
| $50,000 to $99,999 | 139 (11.9%) | 126 (4.1%) |
| $100,000 to $299,999 | 734 (63.0%) | 1,937 (63.6%) |
| $300,000 to $499,999 | 239 (20.5%) | 862 (28.3%) |
| $500,000 to $749,999 | 11 (0.9%) | 73 (2.4%) |
| $750,000 to $999,999 | 0 (0.0%) | 0 (0.0%) |
| $1,000,000 or more | 12 (1.0%) | 9 (0.3%) |
| Total | 1,165 (100.0%) | 3,046 (100.0%) |
Household Income by Mortgage Status in Cedar Lake
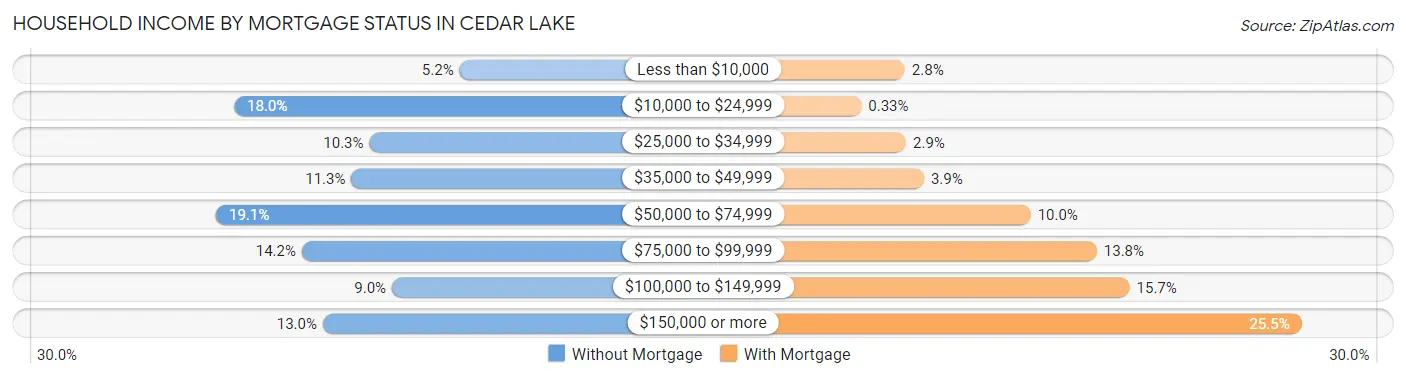
| Household Income | Without Mortgage | With Mortgage |
| Less than $10,000 | 60 (5.1%) | 86 (2.8%) |
| $10,000 to $24,999 | 210 (18.0%) | 10 (0.3%) |
| $25,000 to $34,999 | 120 (10.3%) | 88 (2.9%) |
| $35,000 to $49,999 | 132 (11.3%) | 119 (3.9%) |
| $50,000 to $74,999 | 222 (19.1%) | 305 (10.0%) |
| $75,000 to $99,999 | 165 (14.2%) | 420 (13.8%) |
| $100,000 to $149,999 | 105 (9.0%) | 477 (15.7%) |
| $150,000 or more | 151 (13.0%) | 776 (25.5%) |
| Total | 1,165 (100.0%) | 3,046 (100.0%) |
Property Value to Household Income Ratio in Cedar Lake
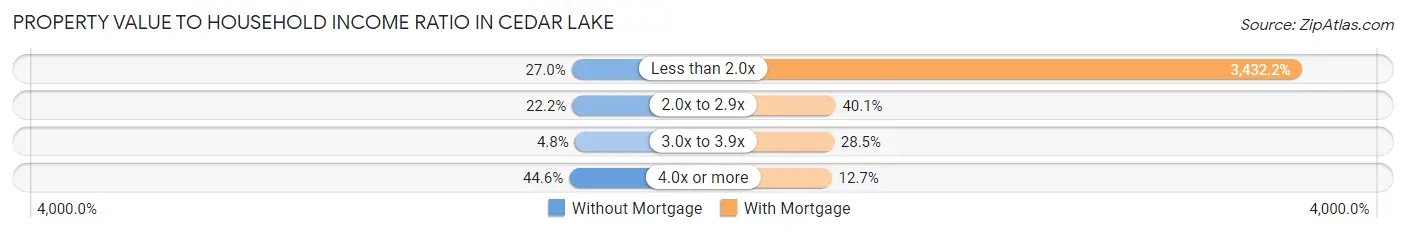
| Value-to-Income Ratio | Without Mortgage | With Mortgage |
| Less than 2.0x | 315 (27.0%) | 104,545 (3,432.2%) |
| 2.0x to 2.9x | 259 (22.2%) | 1,221 (40.1%) |
| 3.0x to 3.9x | 56 (4.8%) | 868 (28.5%) |
| 4.0x or more | 520 (44.6%) | 386 (12.7%) |
| Total | 1,165 (100.0%) | 3,046 (100.0%) |
Real Estate Taxes by Mortgage Status in Cedar Lake
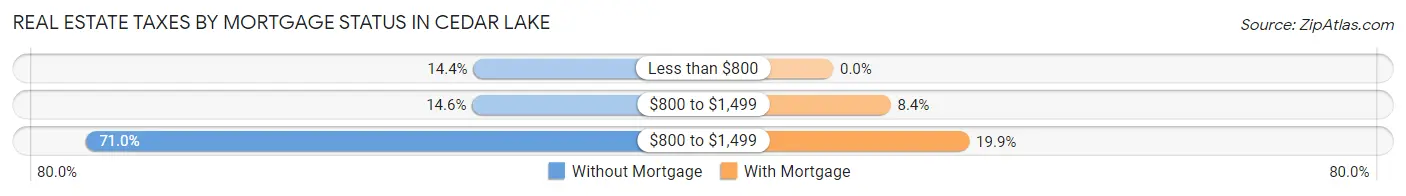
| Property Taxes | Without Mortgage | With Mortgage |
| Less than $800 | 168 (14.4%) | 0 (0.0%) |
| $800 to $1,499 | 170 (14.6%) | 256 (8.4%) |
| $800 to $1,499 | 827 (71.0%) | 606 (19.9%) |
| Total | 1,165 (100.0%) | 3,046 (100.0%) |
Health & Disability in Cedar Lake
Health Insurance Coverage by Age in Cedar Lake
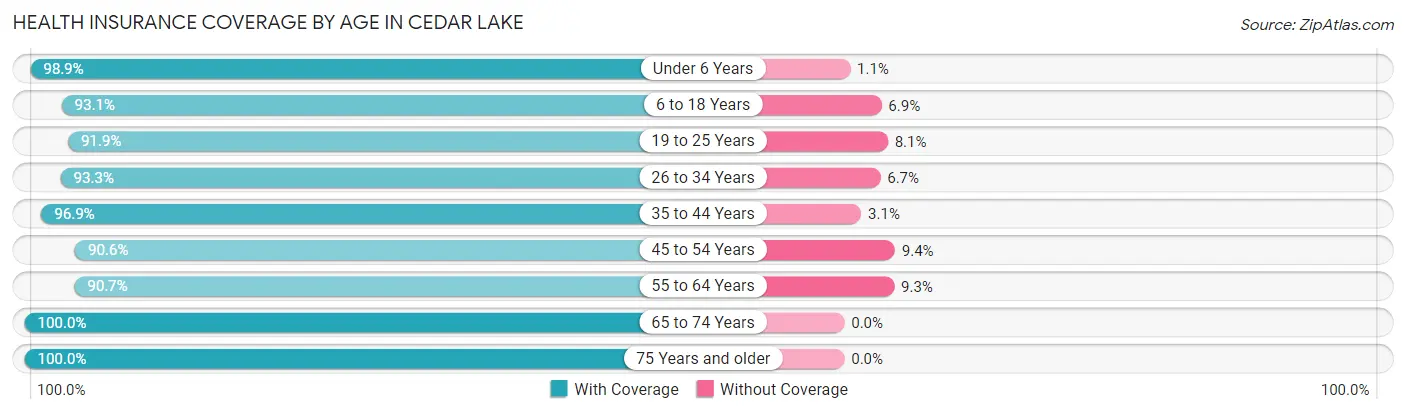
| Age Bracket | With Coverage | Without Coverage |
| Under 6 Years | 1,009 (98.9%) | 11 (1.1%) |
| 6 to 18 Years | 2,379 (93.1%) | 177 (6.9%) |
| 19 to 25 Years | 976 (91.9%) | 86 (8.1%) |
| 26 to 34 Years | 1,613 (93.3%) | 116 (6.7%) |
| 35 to 44 Years | 1,729 (96.9%) | 56 (3.1%) |
| 45 to 54 Years | 1,711 (90.6%) | 178 (9.4%) |
| 55 to 64 Years | 1,719 (90.7%) | 176 (9.3%) |
| 65 to 74 Years | 1,260 (100.0%) | 0 (0.0%) |
| 75 Years and older | 1,019 (100.0%) | 0 (0.0%) |
| Total | 13,415 (94.4%) | 800 (5.6%) |
Health Insurance Coverage by Citizenship Status in Cedar Lake
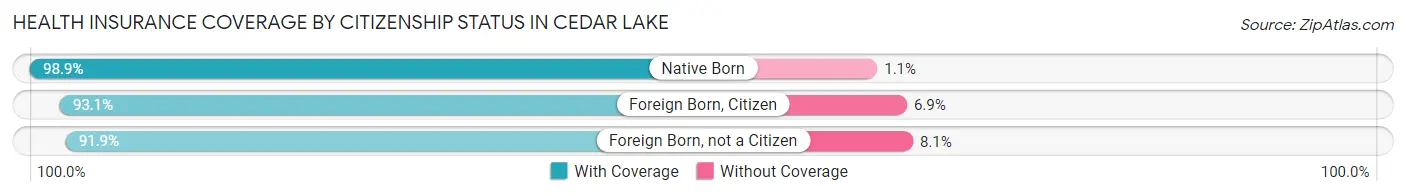
| Citizenship Status | With Coverage | Without Coverage |
| Native Born | 1,009 (98.9%) | 11 (1.1%) |
| Foreign Born, Citizen | 2,379 (93.1%) | 177 (6.9%) |
| Foreign Born, not a Citizen | 976 (91.9%) | 86 (8.1%) |
Health Insurance Coverage by Household Income in Cedar Lake
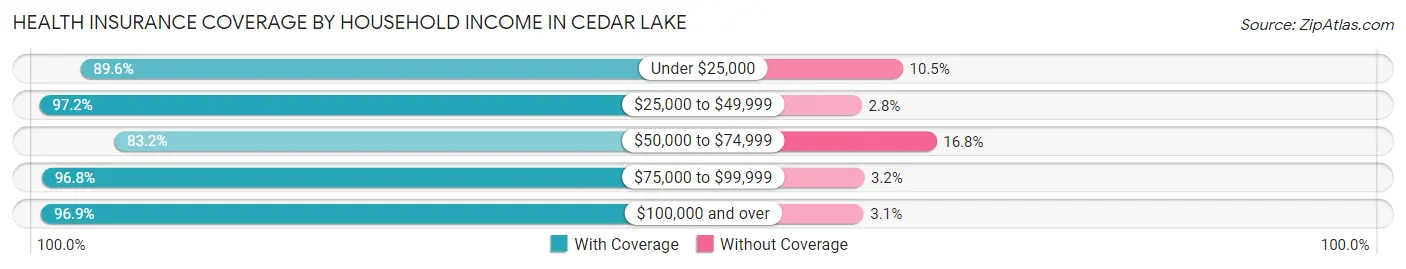
| Household Income | With Coverage | Without Coverage |
| Under $25,000 | 771 (89.5%) | 90 (10.4%) |
| $25,000 to $49,999 | 1,898 (97.2%) | 54 (2.8%) |
| $50,000 to $74,999 | 1,813 (83.2%) | 365 (16.8%) |
| $75,000 to $99,999 | 1,930 (96.8%) | 64 (3.2%) |
| $100,000 and over | 6,989 (96.9%) | 224 (3.1%) |
Public vs Private Health Insurance Coverage by Age in Cedar Lake
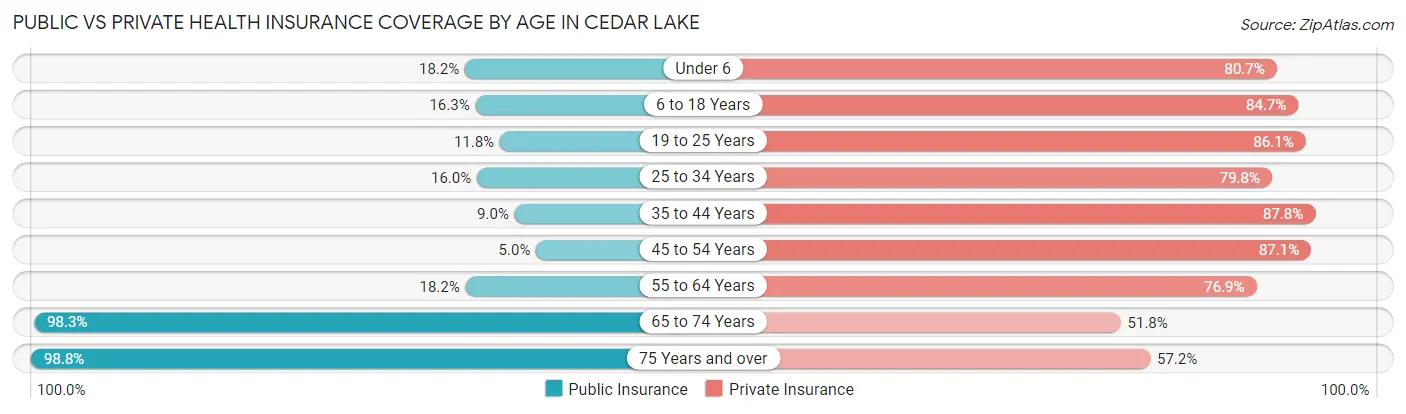
| Age Bracket | Public Insurance | Private Insurance |
| Under 6 | 186 (18.2%) | 823 (80.7%) |
| 6 to 18 Years | 417 (16.3%) | 2,165 (84.7%) |
| 19 to 25 Years | 125 (11.8%) | 914 (86.1%) |
| 25 to 34 Years | 277 (16.0%) | 1,380 (79.8%) |
| 35 to 44 Years | 161 (9.0%) | 1,568 (87.8%) |
| 45 to 54 Years | 95 (5.0%) | 1,645 (87.1%) |
| 55 to 64 Years | 344 (18.1%) | 1,458 (76.9%) |
| 65 to 74 Years | 1,238 (98.3%) | 652 (51.7%) |
| 75 Years and over | 1,007 (98.8%) | 583 (57.2%) |
| Total | 3,850 (27.1%) | 11,188 (78.7%) |
Disability Status by Sex by Age in Cedar Lake
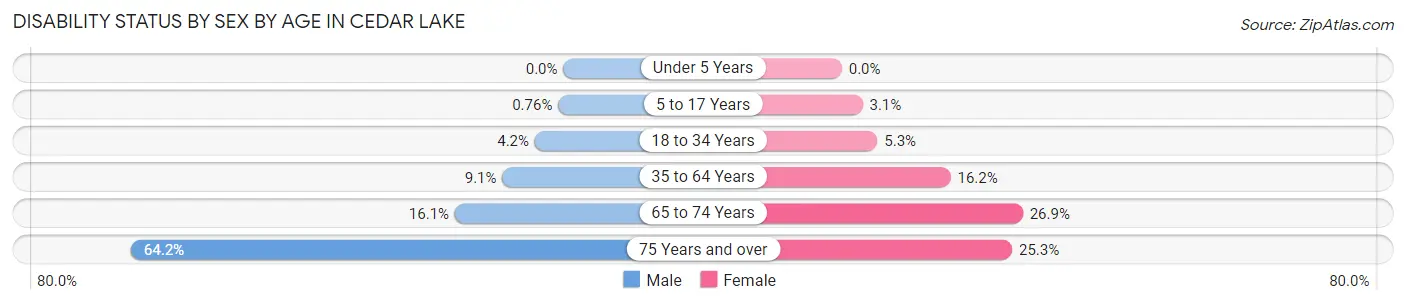
| Age Bracket | Male | Female |
| Under 5 Years | 0 (0.0%) | 0 (0.0%) |
| 5 to 17 Years | 10 (0.8%) | 37 (3.1%) |
| 18 to 34 Years | 62 (4.2%) | 82 (5.3%) |
| 35 to 64 Years | 257 (9.1%) | 441 (16.2%) |
| 65 to 74 Years | 95 (16.1%) | 180 (26.9%) |
| 75 Years and over | 314 (64.2%) | 134 (25.3%) |
Disability Class by Sex by Age in Cedar Lake
Disability Class: Hearing Difficulty
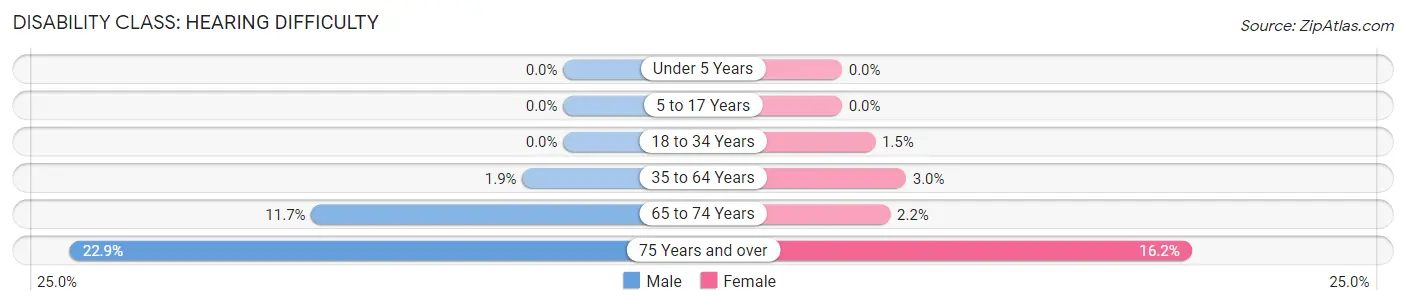
| Age Bracket | Male | Female |
| Under 5 Years | 0 (0.0%) | 0 (0.0%) |
| 5 to 17 Years | 0 (0.0%) | 0 (0.0%) |
| 18 to 34 Years | 0 (0.0%) | 24 (1.5%) |
| 35 to 64 Years | 54 (1.9%) | 81 (3.0%) |
| 65 to 74 Years | 69 (11.7%) | 15 (2.2%) |
| 75 Years and over | 112 (22.9%) | 86 (16.2%) |
Disability Class: Vision Difficulty
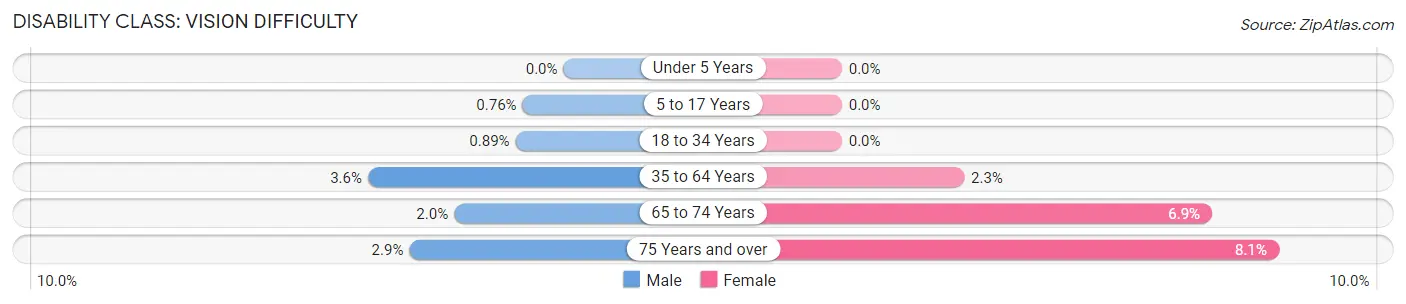
| Age Bracket | Male | Female |
| Under 5 Years | 0 (0.0%) | 0 (0.0%) |
| 5 to 17 Years | 10 (0.8%) | 0 (0.0%) |
| 18 to 34 Years | 13 (0.9%) | 0 (0.0%) |
| 35 to 64 Years | 103 (3.6%) | 62 (2.3%) |
| 65 to 74 Years | 12 (2.0%) | 46 (6.9%) |
| 75 Years and over | 14 (2.9%) | 43 (8.1%) |
Disability Class: Cognitive Difficulty
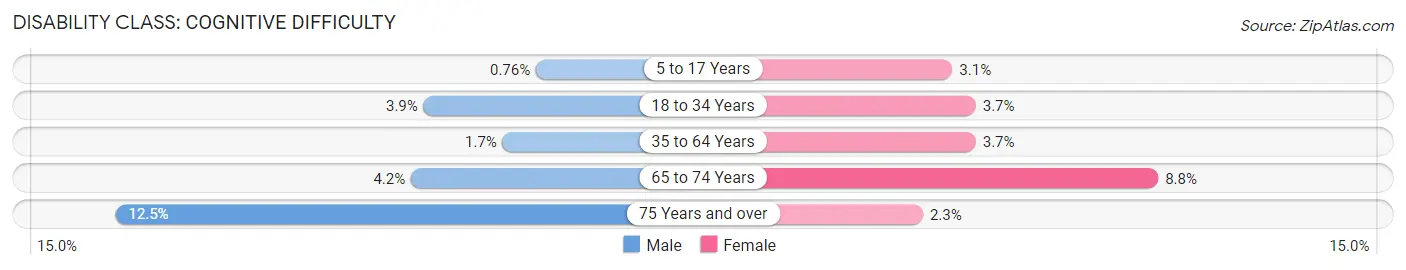
| Age Bracket | Male | Female |
| 5 to 17 Years | 10 (0.8%) | 37 (3.1%) |
| 18 to 34 Years | 57 (3.9%) | 58 (3.7%) |
| 35 to 64 Years | 48 (1.7%) | 102 (3.7%) |
| 65 to 74 Years | 25 (4.2%) | 59 (8.8%) |
| 75 Years and over | 61 (12.5%) | 12 (2.3%) |
Disability Class: Ambulatory Difficulty
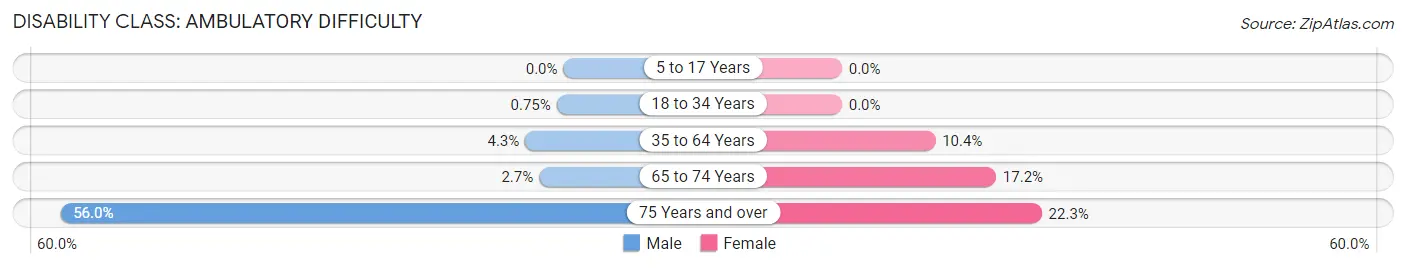
| Age Bracket | Male | Female |
| 5 to 17 Years | 0 (0.0%) | 0 (0.0%) |
| 18 to 34 Years | 11 (0.7%) | 0 (0.0%) |
| 35 to 64 Years | 121 (4.3%) | 284 (10.4%) |
| 65 to 74 Years | 16 (2.7%) | 115 (17.2%) |
| 75 Years and over | 274 (56.0%) | 118 (22.3%) |
Disability Class: Self-Care Difficulty
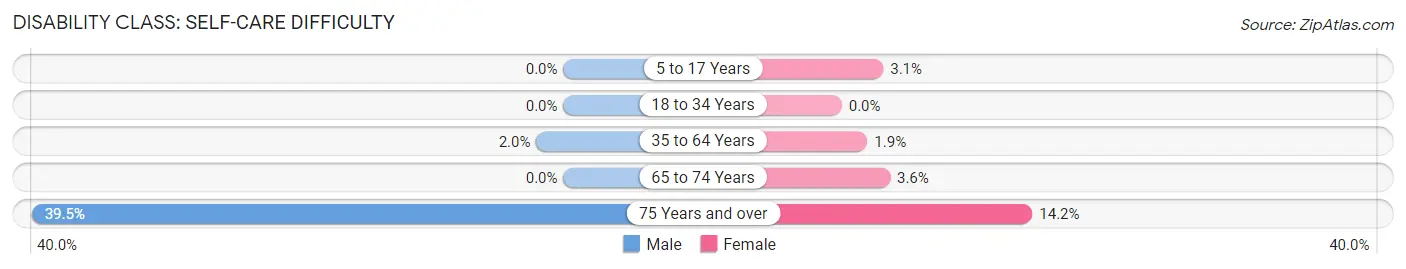
| Age Bracket | Male | Female |
| 5 to 17 Years | 0 (0.0%) | 37 (3.1%) |
| 18 to 34 Years | 0 (0.0%) | 0 (0.0%) |
| 35 to 64 Years | 57 (2.0%) | 52 (1.9%) |
| 65 to 74 Years | 0 (0.0%) | 24 (3.6%) |
| 75 Years and over | 193 (39.5%) | 75 (14.1%) |
Technology Access in Cedar Lake
Computing Device Access in Cedar Lake
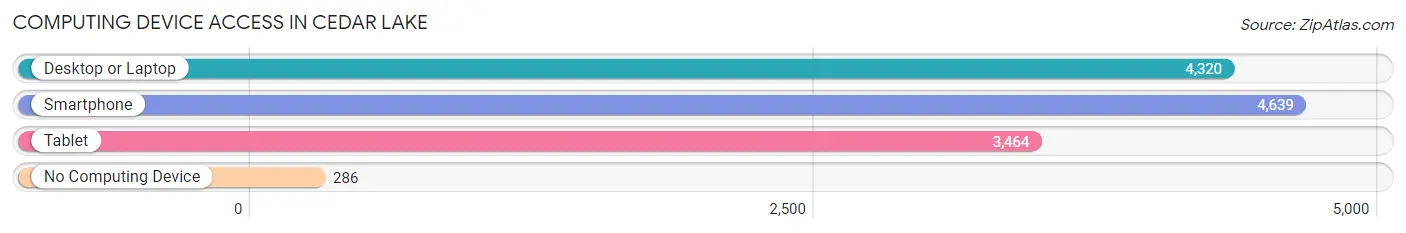
| Device Type | # Households | % Households |
| Desktop or Laptop | 4,320 | 81.9% |
| Smartphone | 4,639 | 88.0% |
| Tablet | 3,464 | 65.7% |
| No Computing Device | 286 | 5.4% |
| Total | 5,274 | 100.0% |
Internet Access in Cedar Lake
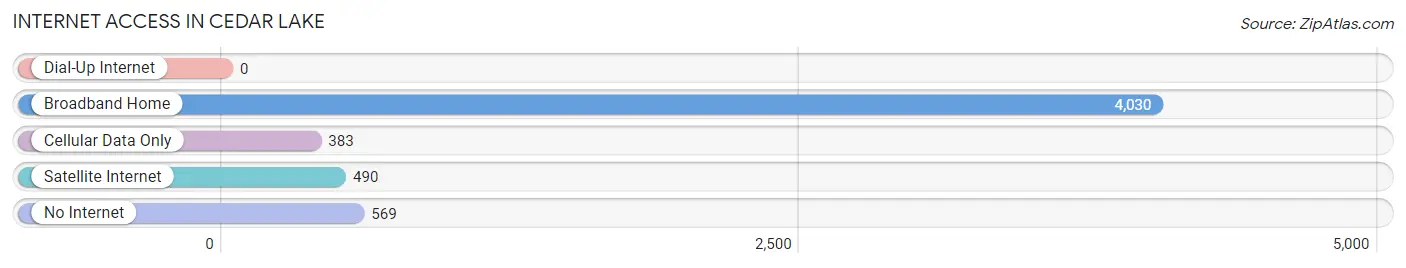
| Internet Type | # Households | % Households |
| Dial-Up Internet | 0 | 0.0% |
| Broadband Home | 4,030 | 76.4% |
| Cellular Data Only | 383 | 7.3% |
| Satellite Internet | 490 | 9.3% |
| No Internet | 569 | 10.8% |
| Total | 5,274 | 100.0% |
Cedar Lake Summary
Cedar Lake, Indiana is a small town located in Lake County, Indiana. It is situated on the western shore of Cedar Lake, a natural lake that is part of the Kankakee River watershed. The town has a population of approximately 8,000 people and is located about 25 miles southeast of Chicago.
History
The area that is now Cedar Lake was originally inhabited by the Potawatomi Native American tribe. The first white settlers arrived in the area in the early 1800s. The town was officially founded in 1837 and was named after the nearby Cedar Lake. The town was originally a farming community, but it soon developed into a resort town due to its proximity to Chicago. In the late 1800s, the town was a popular destination for wealthy Chicagoans who wanted to escape the city for the weekend.
In the early 1900s, the town began to develop into a more permanent residential community. The town was incorporated in 1908 and the first mayor was elected in 1909. The town continued to grow throughout the 20th century and by the 2000s, it had become a popular bedroom community for Chicago.
Geography
Cedar Lake is located in Lake County, Indiana. It is situated on the western shore of Cedar Lake, a natural lake that is part of the Kankakee River watershed. The town is located about 25 miles southeast of Chicago and is bordered by the towns of Lowell, Schneider, and Winfield. The town has a total area of 4.2 square miles, all of which is land.
Economy
The economy of Cedar Lake is largely based on tourism and retail. The town is home to several small businesses, including restaurants, shops, and other services. The town is also home to several large employers, including a manufacturing plant and a hospital.
Demographics
As of the 2010 census, the population of Cedar Lake was 8,039. The racial makeup of the town was 94.3% White, 1.2% African American, 0.3% Native American, 0.7% Asian, 0.1% Pacific Islander, 1.7% from other races, and 1.9% from two or more races. Hispanic or Latino of any race were 4.2% of the population.
The median income for a household in the town was $50,945 and the median income for a family was $60,945. The per capita income for the town was $25,945. About 5.2% of families and 7.2% of the population were below the poverty line, including 8.2% of those under age 18 and 5.2% of those age 65 or over.
Common Questions
What is Per Capita Income in Cedar Lake?
Per Capita income in Cedar Lake is $39,906.
What is the Median Family Income in Cedar Lake?
Median Family Income in Cedar Lake is $94,976.
What is the Median Household income in Cedar Lake?
Median Household Income in Cedar Lake is $84,444.
What is Income or Wage Gap in Cedar Lake?
Income or Wage Gap in Cedar Lake is 46.5%.
Women in Cedar Lake earn 53.5 cents for every dollar earned by a man.
What is Inequality or Gini Index in Cedar Lake?
Inequality or Gini Index in Cedar Lake is 0.43.
What is the Total Population of Cedar Lake?
Total Population of Cedar Lake is 14,215.
What is the Total Male Population of Cedar Lake?
Total Male Population of Cedar Lake is 7,043.
What is the Total Female Population of Cedar Lake?
Total Female Population of Cedar Lake is 7,172.
What is the Ratio of Males per 100 Females in Cedar Lake?
There are 98.20 Males per 100 Females in Cedar Lake.
What is the Ratio of Females per 100 Males in Cedar Lake?
There are 101.83 Females per 100 Males in Cedar Lake.
What is the Median Population Age in Cedar Lake?
Median Population Age in Cedar Lake is 39.5 Years.
What is the Average Family Size in Cedar Lake
Average Family Size in Cedar Lake is 3.2 People.
What is the Average Household Size in Cedar Lake
Average Household Size in Cedar Lake is 2.7 People.
How Large is the Labor Force in Cedar Lake?
There are 7,485 People in the Labor Forcein in Cedar Lake.
What is the Percentage of People in the Labor Force in Cedar Lake?
66.4% of People are in the Labor Force in Cedar Lake.
What is the Unemployment Rate in Cedar Lake?
Unemployment Rate in Cedar Lake is 5.7%.