Bass Lake, IN Map & Demographics
Bass Lake Map
Bass Lake Overview
$36,565
PER CAPITA INCOME
$82,778
AVG FAMILY INCOME
$70,110
AVG HOUSEHOLD INCOME
52.1%
WAGE / INCOME GAP [ % ]
47.9¢/ $1
WAGE / INCOME GAP [ $ ]
0.37
INEQUALITY / GINI INDEX
1,018
TOTAL POPULATION
590
MALE POPULATION
428
FEMALE POPULATION
137.85
MALES / 100 FEMALES
72.54
FEMALES / 100 MALES
55.8
MEDIAN AGE
3.3
AVG FAMILY SIZE
2.4
AVG HOUSEHOLD SIZE
391
LABOR FORCE [ PEOPLE ]
46.2%
PERCENT IN LABOR FORCE
11.0%
UNEMPLOYMENT RATE
Income in Bass Lake
Income Overview in Bass Lake
Per Capita Income in Bass Lake is $36,565, while median incomes of families and households are $82,778 and $70,110 respectively.
| Characteristic | Number | Measure |
| Per Capita Income | 1,018 | $36,565 |
| Median Family Income | 262 | $82,778 |
| Mean Family Income | 262 | $100,806 |
| Median Household Income | 419 | $70,110 |
| Mean Household Income | 419 | $83,221 |
| Income Deficit | 262 | $0 |
| Wage / Income Gap (%) | 1,018 | 52.09% |
| Wage / Income Gap ($) | 1,018 | 47.91¢ per $1 |
| Gini / Inequality Index | 1,018 | 0.37 |
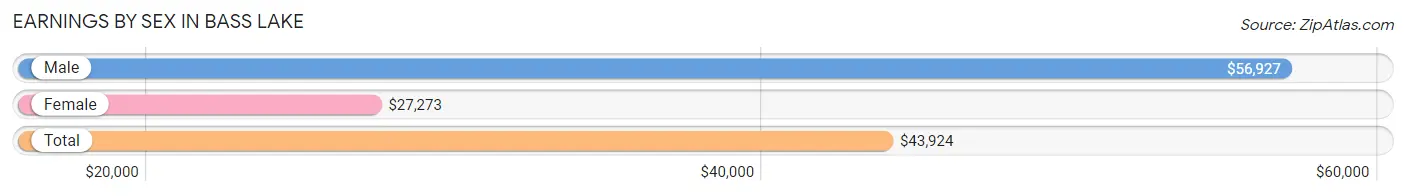
Earnings by Sex in Bass Lake
Average Earnings in Bass Lake are $43,924, $56,927 for men and $27,273 for women, a difference of 52.1%.
| Sex | Number | Average Earnings |
| Male | 255 (65.5%) | $56,927 |
| Female | 134 (34.4%) | $27,273 |
| Total | 389 (100.0%) | $43,924 |
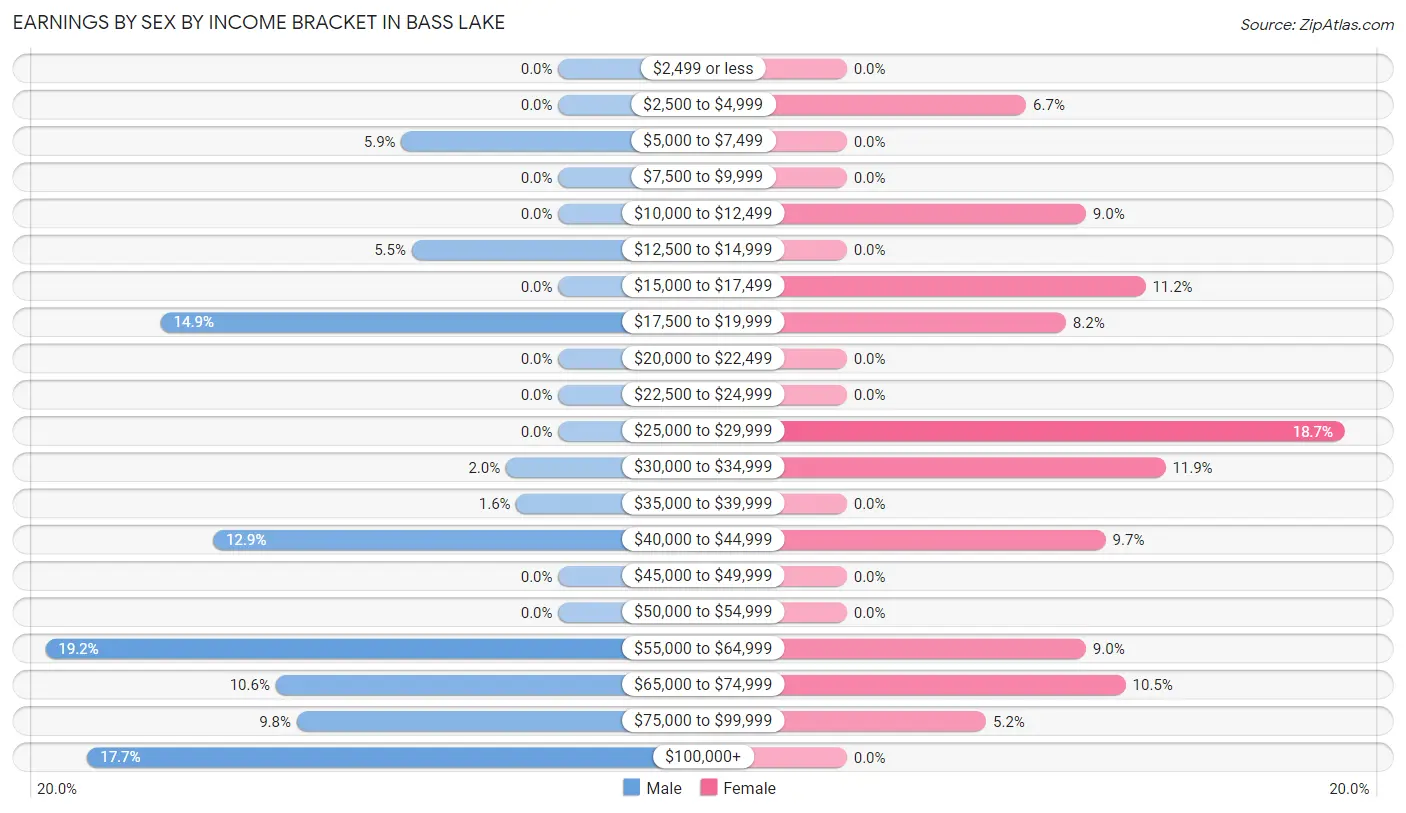
Earnings by Sex by Income Bracket in Bass Lake
The most common earnings brackets in Bass Lake are $55,000 to $64,999 for men (49 | 19.2%) and $25,000 to $29,999 for women (25 | 18.7%).
| Income | Male | Female |
| $2,499 or less | 0 (0.0%) | 0 (0.0%) |
| $2,500 to $4,999 | 0 (0.0%) | 9 (6.7%) |
| $5,000 to $7,499 | 15 (5.9%) | 0 (0.0%) |
| $7,500 to $9,999 | 0 (0.0%) | 0 (0.0%) |
| $10,000 to $12,499 | 0 (0.0%) | 12 (9.0%) |
| $12,500 to $14,999 | 14 (5.5%) | 0 (0.0%) |
| $15,000 to $17,499 | 0 (0.0%) | 15 (11.2%) |
| $17,500 to $19,999 | 38 (14.9%) | 11 (8.2%) |
| $20,000 to $22,499 | 0 (0.0%) | 0 (0.0%) |
| $22,500 to $24,999 | 0 (0.0%) | 0 (0.0%) |
| $25,000 to $29,999 | 0 (0.0%) | 25 (18.7%) |
| $30,000 to $34,999 | 5 (2.0%) | 16 (11.9%) |
| $35,000 to $39,999 | 4 (1.6%) | 0 (0.0%) |
| $40,000 to $44,999 | 33 (12.9%) | 13 (9.7%) |
| $45,000 to $49,999 | 0 (0.0%) | 0 (0.0%) |
| $50,000 to $54,999 | 0 (0.0%) | 0 (0.0%) |
| $55,000 to $64,999 | 49 (19.2%) | 12 (9.0%) |
| $65,000 to $74,999 | 27 (10.6%) | 14 (10.4%) |
| $75,000 to $99,999 | 25 (9.8%) | 7 (5.2%) |
| $100,000+ | 45 (17.6%) | 0 (0.0%) |
| Total | 255 (100.0%) | 134 (100.0%) |
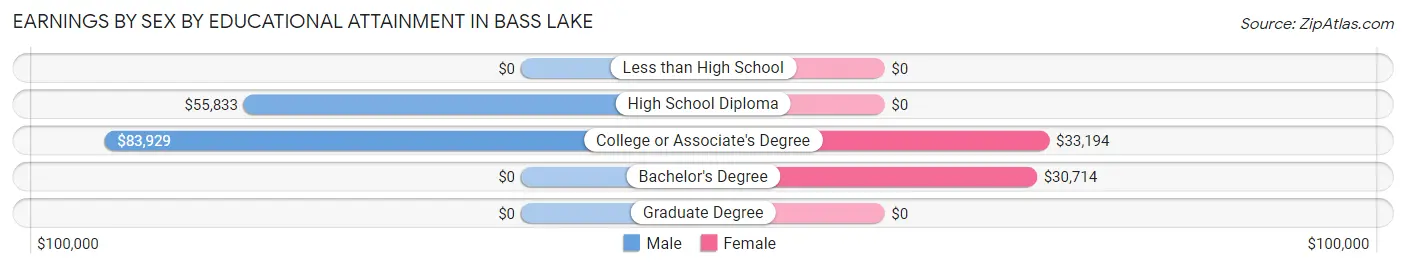
Earnings by Sex by Educational Attainment in Bass Lake
Average earnings in Bass Lake are $61,923 for men and $27,273 for women, a difference of 56.0%. Men with an educational attainment of college or associate's degree enjoy the highest average annual earnings of $83,929, while those with high school diploma education earn the least with $55,833. Women with an educational attainment of college or associate's degree earn the most with the average annual earnings of $33,194, while those with bachelor's degree education have the smallest earnings of $30,714.
| Educational Attainment | Male Income | Female Income |
| Less than High School | - | - |
| High School Diploma | $55,833 | $0 |
| College or Associate's Degree | $83,929 | $33,194 |
| Bachelor's Degree | - | - |
| Graduate Degree | - | - |
| Total | $61,923 | $27,273 |
Family Income in Bass Lake
Family Income Brackets in Bass Lake
According to the Bass Lake family income data, there are 74 families falling into the $50,000 to $74,999 income range, which is the most common income bracket and makes up 28.2% of all families.
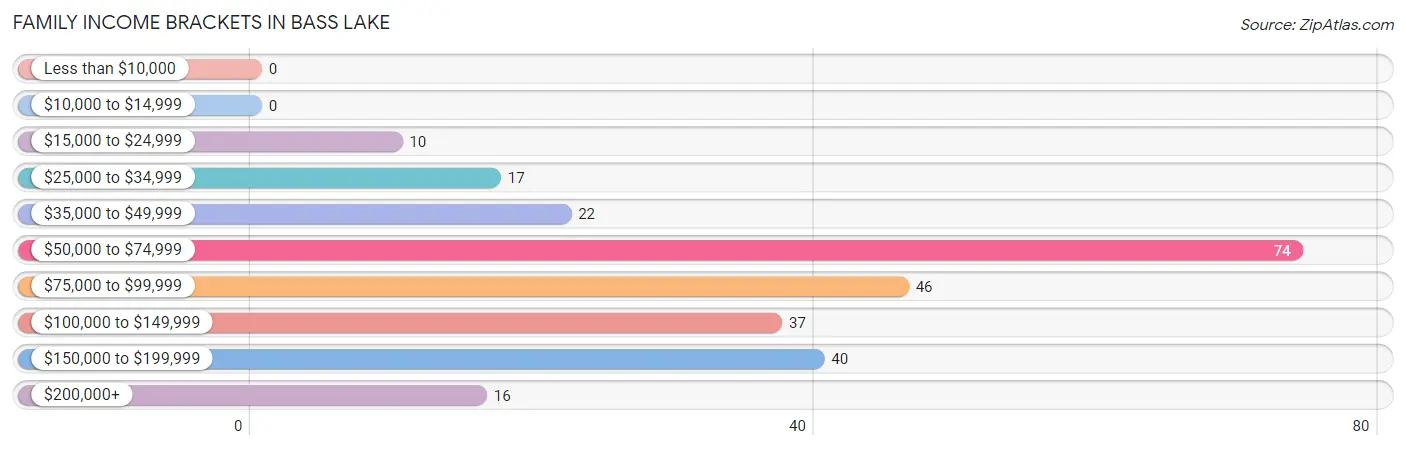
| Income Bracket | # Families | % Families |
| Less than $10,000 | 0 | 0.0% |
| $10,000 to $14,999 | 0 | 0.0% |
| $15,000 to $24,999 | 10 | 3.8% |
| $25,000 to $34,999 | 17 | 6.5% |
| $35,000 to $49,999 | 22 | 8.4% |
| $50,000 to $74,999 | 74 | 28.2% |
| $75,000 to $99,999 | 46 | 17.6% |
| $100,000 to $149,999 | 37 | 14.1% |
| $150,000 to $199,999 | 40 | 15.3% |
| $200,000+ | 16 | 6.1% |
Family Income by Famaliy Size in Bass Lake
5-person families (15 | 5.7%) account for the highest median family income in Bass Lake with $114,219 per family, while 2-person families (180 | 68.7%) have the highest median income of $36,458 per family member.
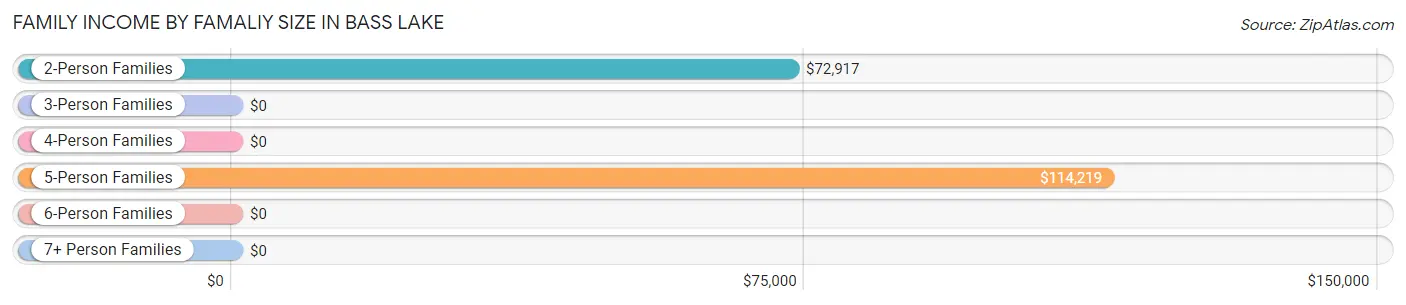
| Income Bracket | # Families | Median Income |
| 2-Person Families | 180 (68.7%) | $72,917 |
| 3-Person Families | 7 (2.7%) | $0 |
| 4-Person Families | 48 (18.3%) | $0 |
| 5-Person Families | 15 (5.7%) | $114,219 |
| 6-Person Families | 0 (0.0%) | $0 |
| 7+ Person Families | 12 (4.6%) | $0 |
| Total | 262 (100.0%) | $82,778 |
Family Income by Number of Earners in Bass Lake
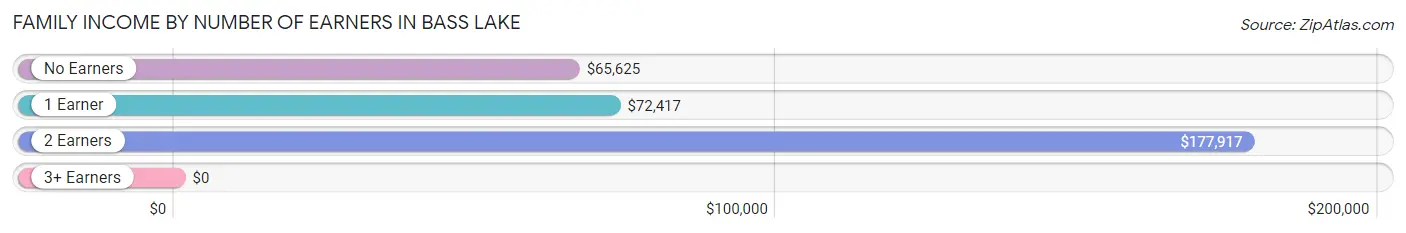
| Number of Earners | # Families | Median Income |
| No Earners | 101 (38.6%) | $65,625 |
| 1 Earner | 107 (40.8%) | $72,417 |
| 2 Earners | 37 (14.1%) | $177,917 |
| 3+ Earners | 17 (6.5%) | $0 |
| Total | 262 (100.0%) | $82,778 |
Household Income in Bass Lake
Household Income Brackets in Bass Lake
With 144 households falling in the category, the $50,000 to $74,999 income range is the most frequent in Bass Lake, accounting for 34.4% of all households.
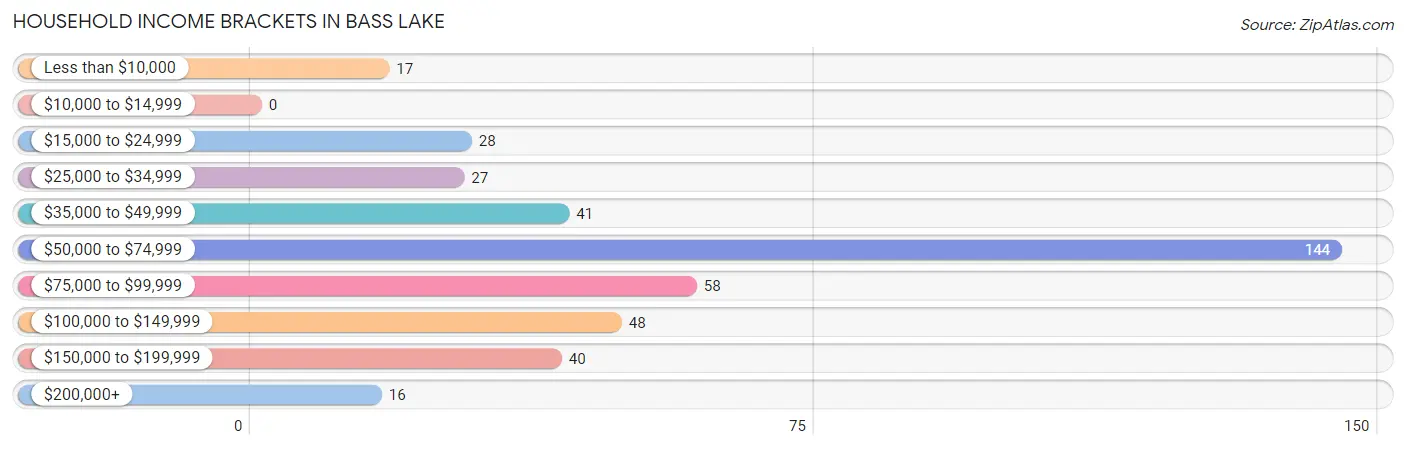
| Income Bracket | # Households | % Households |
| Less than $10,000 | 17 | 4.1% |
| $10,000 to $14,999 | 0 | 0.0% |
| $15,000 to $24,999 | 28 | 6.7% |
| $25,000 to $34,999 | 27 | 6.4% |
| $35,000 to $49,999 | 41 | 9.8% |
| $50,000 to $74,999 | 144 | 34.4% |
| $75,000 to $99,999 | 58 | 13.8% |
| $100,000 to $149,999 | 48 | 11.5% |
| $150,000 to $199,999 | 40 | 9.5% |
| $200,000+ | 16 | 3.8% |
Household Income by Householder Age in Bass Lake
The median household income in Bass Lake is $70,110, with the highest median household income of $72,778 found in the 45 to 64 years age bracket for the primary householder. A total of 186 households (44.4%) fall into this category.
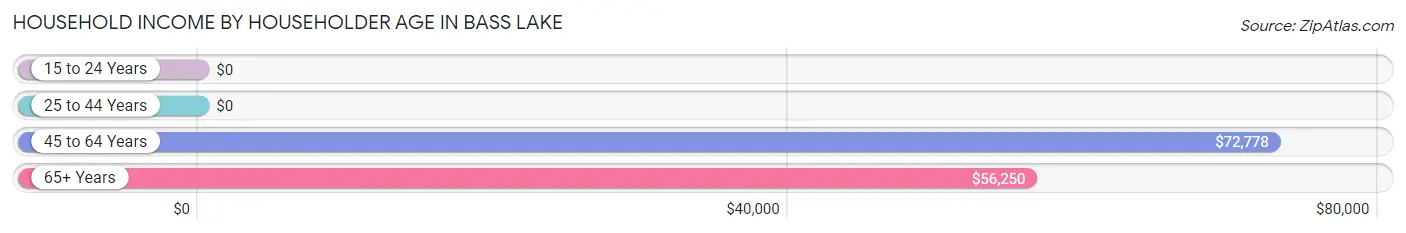
| Income Bracket | # Households | Median Income |
| 15 to 24 Years | 0 (0.0%) | $0 |
| 25 to 44 Years | 44 (10.5%) | $0 |
| 45 to 64 Years | 186 (44.4%) | $72,778 |
| 65+ Years | 189 (45.1%) | $56,250 |
| Total | 419 (100.0%) | $70,110 |
Poverty in Bass Lake
Income Below Poverty by Sex and Age in Bass Lake
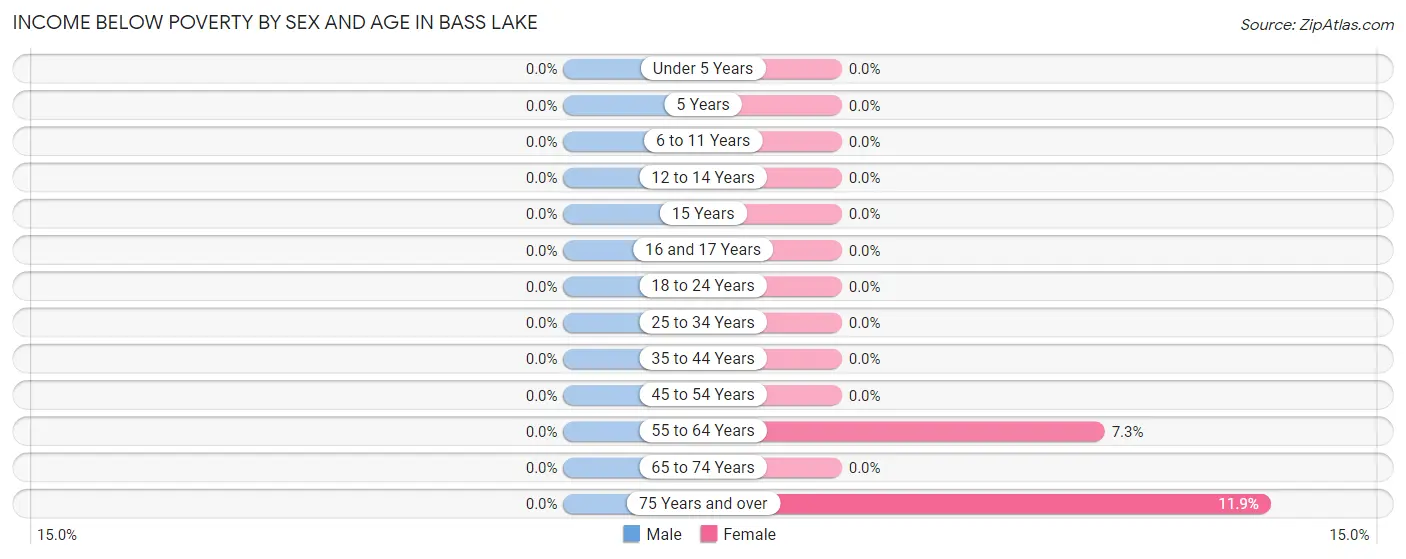
| Age Bracket | Male | Female |
| Under 5 Years | 0 (0.0%) | 0 (0.0%) |
| 5 Years | 0 (0.0%) | 0 (0.0%) |
| 6 to 11 Years | 0 (0.0%) | 0 (0.0%) |
| 12 to 14 Years | 0 (0.0%) | 0 (0.0%) |
| 15 Years | 0 (0.0%) | 0 (0.0%) |
| 16 and 17 Years | 0 (0.0%) | 0 (0.0%) |
| 18 to 24 Years | 0 (0.0%) | 0 (0.0%) |
| 25 to 34 Years | 0 (0.0%) | 0 (0.0%) |
| 35 to 44 Years | 0 (0.0%) | 0 (0.0%) |
| 45 to 54 Years | 0 (0.0%) | 0 (0.0%) |
| 55 to 64 Years | 0 (0.0%) | 9 (7.3%) |
| 65 to 74 Years | 0 (0.0%) | 0 (0.0%) |
| 75 Years and over | 0 (0.0%) | 8 (11.9%) |
| Total | 0 (0.0%) | 17 (4.0%) |
Income Above Poverty by Sex and Age in Bass Lake
According to the poverty statistics in Bass Lake, males aged under 5 years and females aged under 5 years are the age groups that are most secure financially, with 100.0% of males and 100.0% of females in these age groups living above the poverty line.
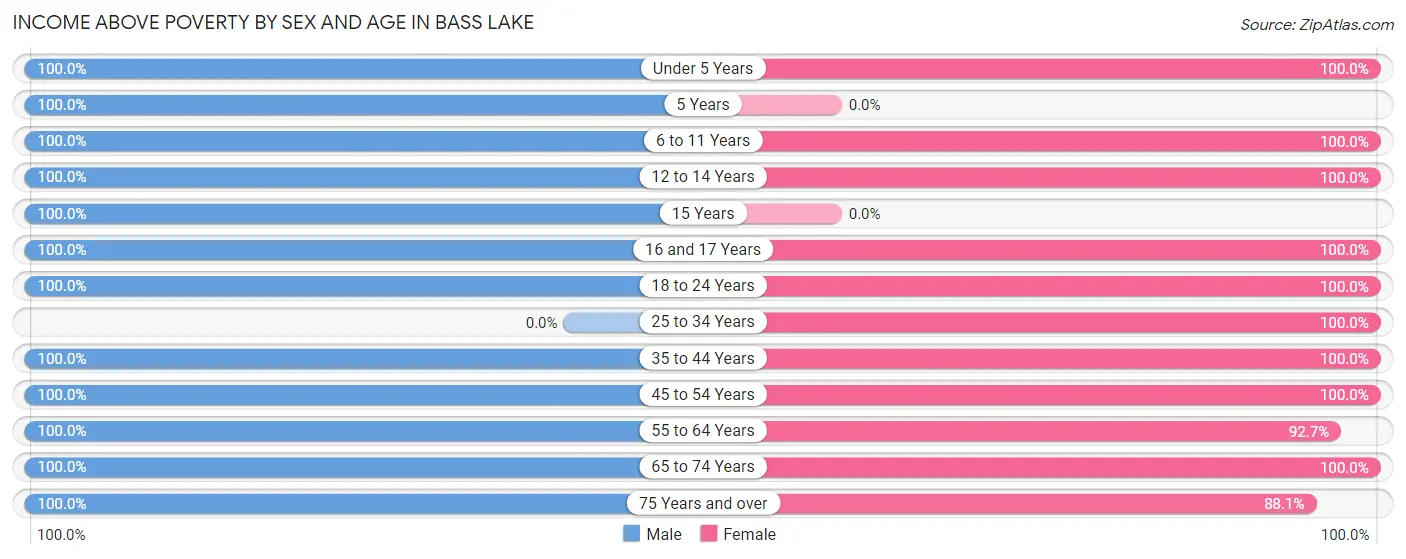
| Age Bracket | Male | Female |
| Under 5 Years | 39 (100.0%) | 5 (100.0%) |
| 5 Years | 12 (100.0%) | 0 (0.0%) |
| 6 to 11 Years | 40 (100.0%) | 18 (100.0%) |
| 12 to 14 Years | 21 (100.0%) | 29 (100.0%) |
| 15 Years | 7 (100.0%) | 0 (0.0%) |
| 16 and 17 Years | 8 (100.0%) | 2 (100.0%) |
| 18 to 24 Years | 55 (100.0%) | 9 (100.0%) |
| 25 to 34 Years | 0 (0.0%) | 28 (100.0%) |
| 35 to 44 Years | 99 (100.0%) | 36 (100.0%) |
| 45 to 54 Years | 49 (100.0%) | 30 (100.0%) |
| 55 to 64 Years | 92 (100.0%) | 114 (92.7%) |
| 65 to 74 Years | 87 (100.0%) | 81 (100.0%) |
| 75 Years and over | 81 (100.0%) | 59 (88.1%) |
| Total | 590 (100.0%) | 411 (96.0%) |
Income Below Poverty Among Married-Couple Families in Bass Lake
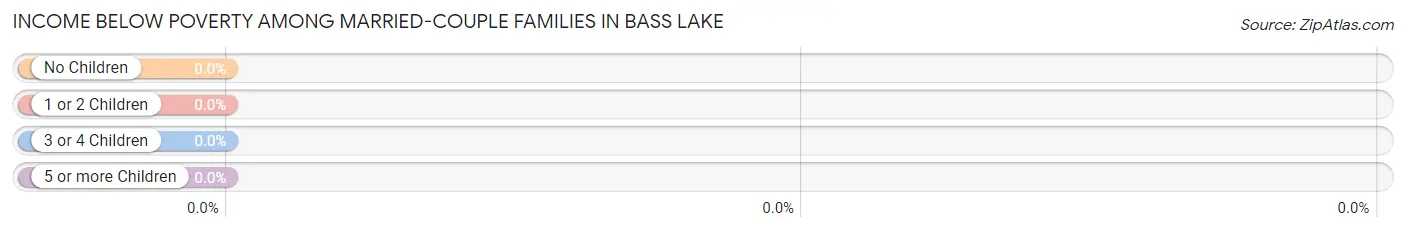
| Children | Above Poverty | Below Poverty |
| No Children | 174 (100.0%) | 0 (0.0%) |
| 1 or 2 Children | 47 (100.0%) | 0 (0.0%) |
| 3 or 4 Children | 0 (0.0%) | 0 (0.0%) |
| 5 or more Children | 12 (100.0%) | 0 (0.0%) |
| Total | 233 (100.0%) | 0 (0.0%) |
Income Below Poverty Among Single-Parent Households in Bass Lake
| Children | Single Father | Single Mother |
| No Children | 0 (0.0%) | 0 (0.0%) |
| 1 or 2 Children | 0 (0.0%) | 0 (0.0%) |
| 3 or 4 Children | 0 (0.0%) | 0 (0.0%) |
| 5 or more Children | 0 (0.0%) | 0 (0.0%) |
| Total | 0 (0.0%) | 0 (0.0%) |
Income Below Poverty Among Married-Couple vs Single-Parent Households in Bass Lake
| Children | Married-Couple Families | Single-Parent Households |
| No Children | 0 (0.0%) | 0 (0.0%) |
| 1 or 2 Children | 0 (0.0%) | 0 (0.0%) |
| 3 or 4 Children | 0 (0.0%) | 0 (0.0%) |
| 5 or more Children | 0 (0.0%) | 0 (0.0%) |
| Total | 0 (0.0%) | 0 (0.0%) |
Race in Bass Lake
The most populous races in Bass Lake are White / Caucasian (1,000 | 98.2%), Hispanic or Latino (97 | 9.5%), and Two or more Races (10 | 1.0%).
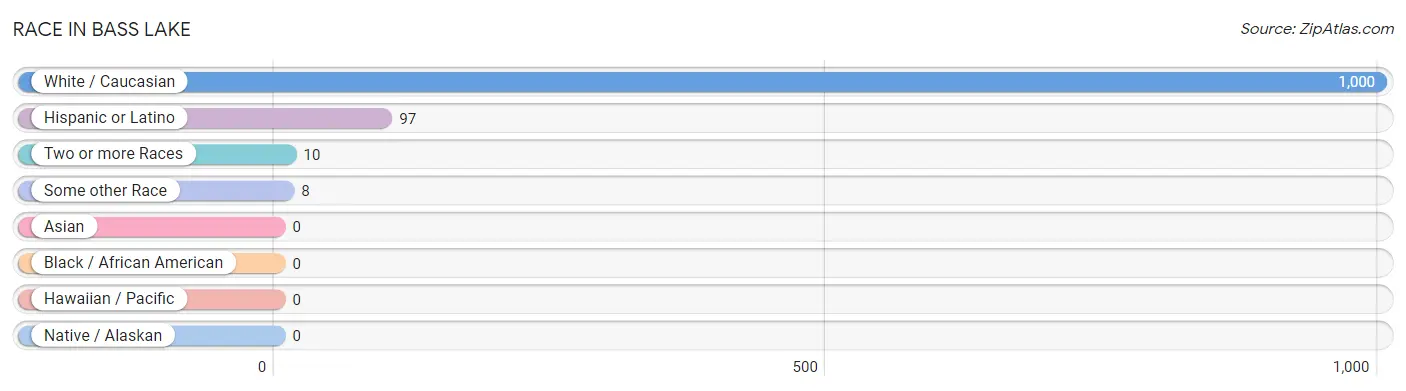
| Race | # Population | % Population |
| Asian | 0 | 0.0% |
| Black / African American | 0 | 0.0% |
| Hawaiian / Pacific | 0 | 0.0% |
| Hispanic or Latino | 97 | 9.5% |
| Native / Alaskan | 0 | 0.0% |
| White / Caucasian | 1,000 | 98.2% |
| Two or more Races | 10 | 1.0% |
| Some other Race | 8 | 0.8% |
| Total | 1,018 | 100.0% |
Ancestry in Bass Lake
The most populous ancestries reported in Bass Lake are German (279 | 27.4%), Irish (138 | 13.6%), Polish (121 | 11.9%), English (73 | 7.2%), and Italian (56 | 5.5%), together accounting for 65.5% of all Bass Lake residents.
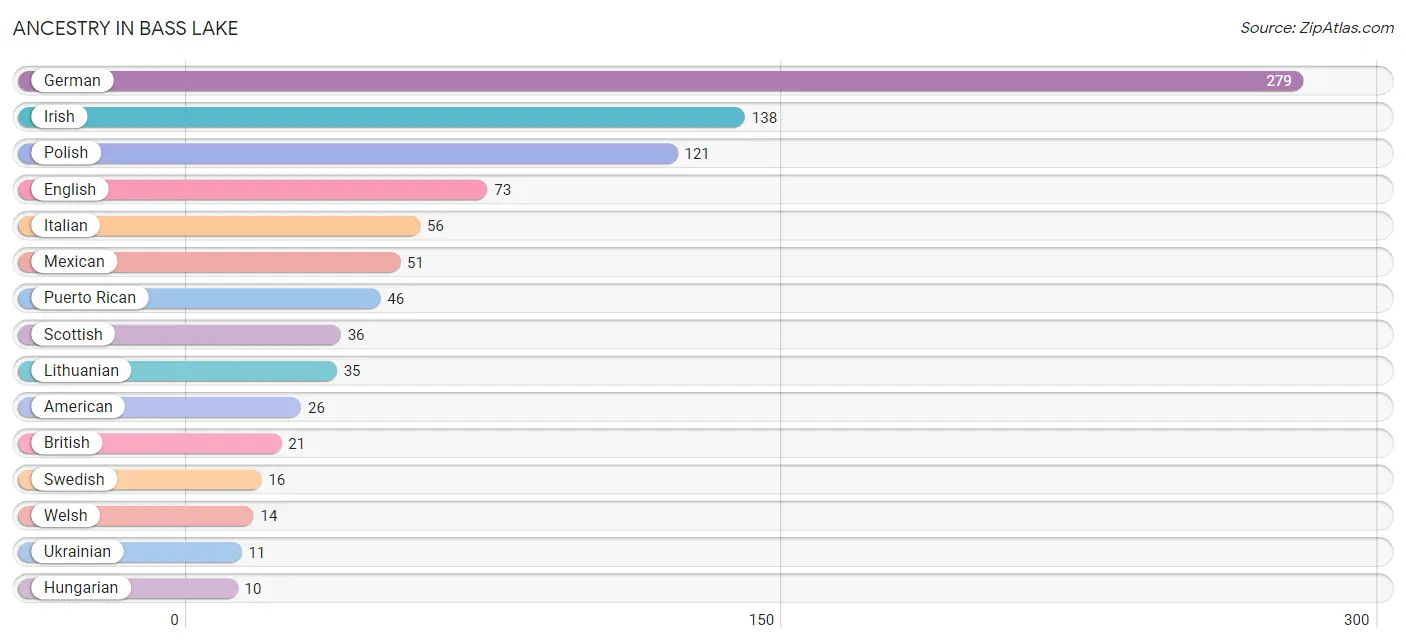
| Ancestry | # Population | % Population |
| American | 26 | 2.5% |
| Bhutanese | 1 | 0.1% |
| Blackfeet | 9 | 0.9% |
| British | 21 | 2.1% |
| Croatian | 7 | 0.7% |
| Czech | 5 | 0.5% |
| English | 73 | 7.2% |
| French | 8 | 0.8% |
| French Canadian | 5 | 0.5% |
| German | 279 | 27.4% |
| Greek | 5 | 0.5% |
| Hungarian | 10 | 1.0% |
| Irish | 138 | 13.6% |
| Italian | 56 | 5.5% |
| Lithuanian | 35 | 3.4% |
| Mexican | 51 | 5.0% |
| Polish | 121 | 11.9% |
| Puerto Rican | 46 | 4.5% |
| Scottish | 36 | 3.5% |
| Slovak | 9 | 0.9% |
| Slovene | 6 | 0.6% |
| Swedish | 16 | 1.6% |
| Ukrainian | 11 | 1.1% |
| Welsh | 14 | 1.4% | View All 24 Rows |
Immigrants in Bass Lake
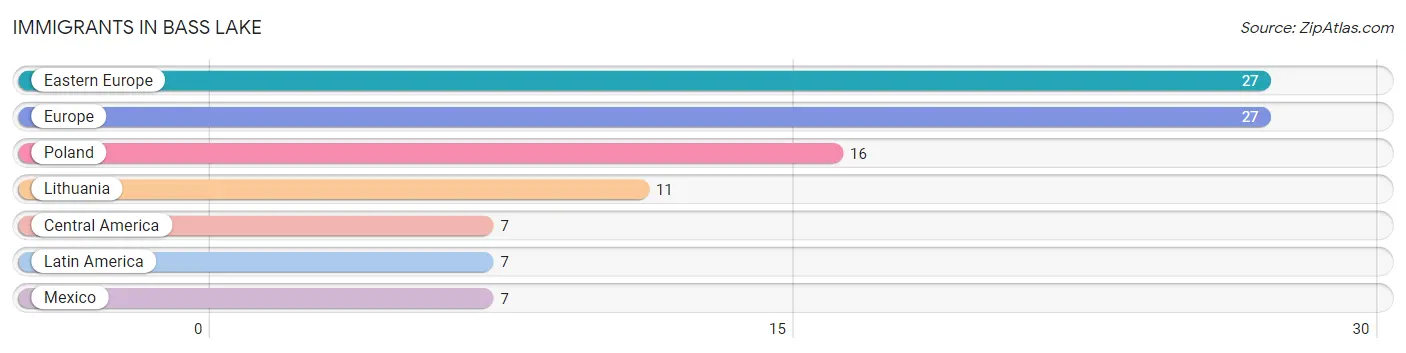
The most numerous immigrant groups reported in Bass Lake came from Eastern Europe (27 | 2.6%), Europe (27 | 2.6%), Poland (16 | 1.6%), Lithuania (11 | 1.1%), and Central America (7 | 0.7%), together accounting for 8.6% of all Bass Lake residents.
| Immigration Origin | # Population | % Population |
| Central America | 7 | 0.7% |
| Eastern Europe | 27 | 2.6% |
| Europe | 27 | 2.6% |
| Latin America | 7 | 0.7% |
| Lithuania | 11 | 1.1% |
| Mexico | 7 | 0.7% |
| Poland | 16 | 1.6% | View All 7 Rows |
Sex and Age in Bass Lake
Sex and Age in Bass Lake
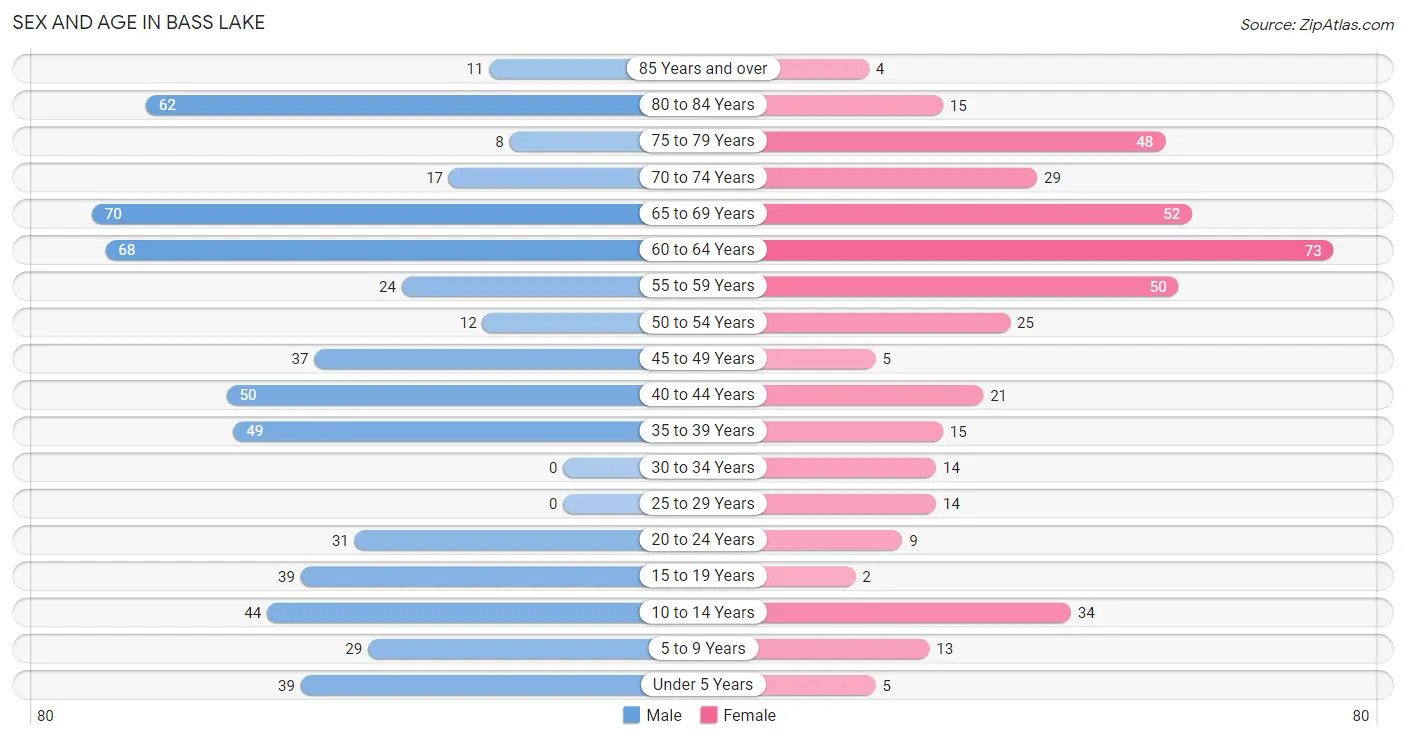
The most populous age groups in Bass Lake are 65 to 69 Years (70 | 11.9%) for men and 60 to 64 Years (73 | 17.1%) for women.
| Age Bracket | Male | Female |
| Under 5 Years | 39 (6.6%) | 5 (1.2%) |
| 5 to 9 Years | 29 (4.9%) | 13 (3.0%) |
| 10 to 14 Years | 44 (7.5%) | 34 (7.9%) |
| 15 to 19 Years | 39 (6.6%) | 2 (0.5%) |
| 20 to 24 Years | 31 (5.2%) | 9 (2.1%) |
| 25 to 29 Years | 0 (0.0%) | 14 (3.3%) |
| 30 to 34 Years | 0 (0.0%) | 14 (3.3%) |
| 35 to 39 Years | 49 (8.3%) | 15 (3.5%) |
| 40 to 44 Years | 50 (8.5%) | 21 (4.9%) |
| 45 to 49 Years | 37 (6.3%) | 5 (1.2%) |
| 50 to 54 Years | 12 (2.0%) | 25 (5.8%) |
| 55 to 59 Years | 24 (4.1%) | 50 (11.7%) |
| 60 to 64 Years | 68 (11.5%) | 73 (17.1%) |
| 65 to 69 Years | 70 (11.9%) | 52 (12.1%) |
| 70 to 74 Years | 17 (2.9%) | 29 (6.8%) |
| 75 to 79 Years | 8 (1.4%) | 48 (11.2%) |
| 80 to 84 Years | 62 (10.5%) | 15 (3.5%) |
| 85 Years and over | 11 (1.9%) | 4 (0.9%) |
| Total | 590 (100.0%) | 428 (100.0%) |
Families and Households in Bass Lake
Median Family Size in Bass Lake
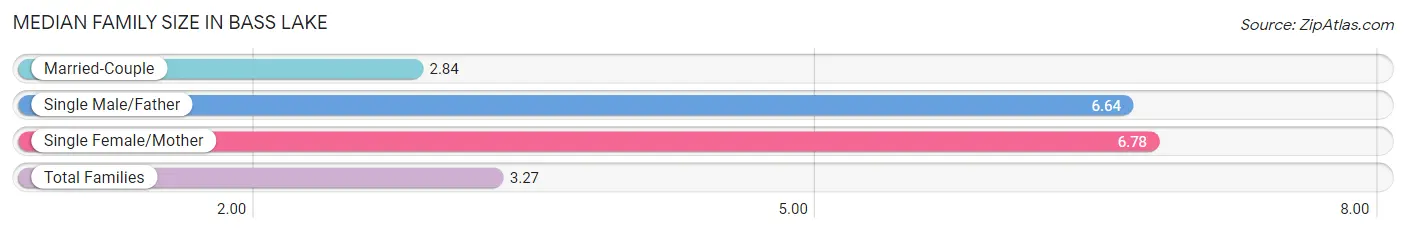
The median family size in Bass Lake is 3.27 persons per family, with single female/mother families (18 | 6.9%) accounting for the largest median family size of 6.78 persons per family. On the other hand, married-couple families (233 | 88.9%) represent the smallest median family size with 2.84 persons per family.
| Family Type | # Families | Family Size |
| Married-Couple | 233 (88.9%) | 2.84 |
| Single Male/Father | 11 (4.2%) | 6.64 |
| Single Female/Mother | 18 (6.9%) | 6.78 |
| Total Families | 262 (100.0%) | 3.27 |
Median Household Size in Bass Lake
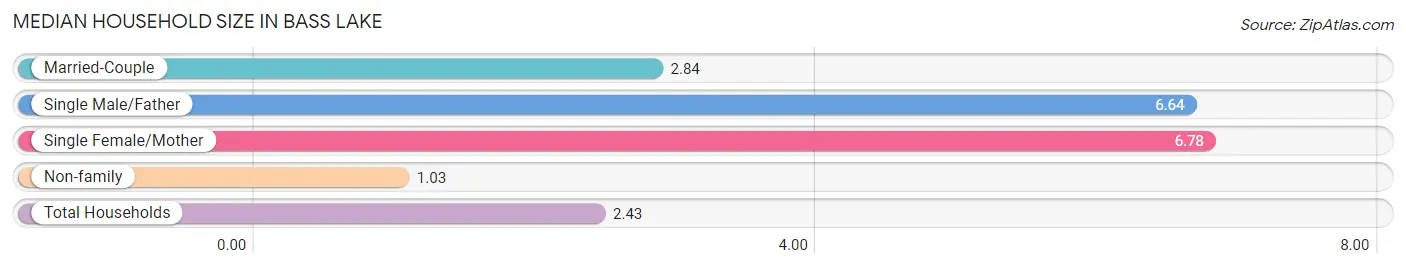
The median household size in Bass Lake is 2.43 persons per household, with single female/mother households (18 | 4.3%) accounting for the largest median household size of 6.78 persons per household. non-family households (157 | 37.5%) represent the smallest median household size with 1.03 persons per household.
| Household Type | # Households | Household Size |
| Married-Couple | 233 (55.6%) | 2.84 |
| Single Male/Father | 11 (2.6%) | 6.64 |
| Single Female/Mother | 18 (4.3%) | 6.78 |
| Non-family | 157 (37.5%) | 1.03 |
| Total Households | 419 (100.0%) | 2.43 |
Household Size by Marriage Status in Bass Lake
Out of a total of 419 households in Bass Lake, 262 (62.5%) are family households, while 157 (37.5%) are nonfamily households. The most numerous type of family households are 2-person households, comprising 180, and the most common type of nonfamily households are 1-person households, comprising 151.
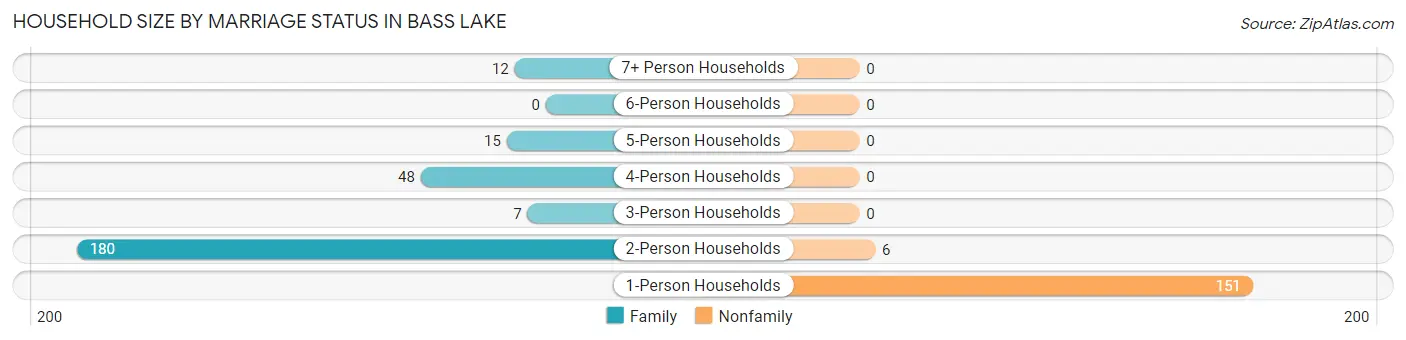
| Household Size | Family Households | Nonfamily Households |
| 1-Person Households | - | 151 (36.0%) |
| 2-Person Households | 180 (43.0%) | 6 (1.4%) |
| 3-Person Households | 7 (1.7%) | 0 (0.0%) |
| 4-Person Households | 48 (11.5%) | 0 (0.0%) |
| 5-Person Households | 15 (3.6%) | 0 (0.0%) |
| 6-Person Households | 0 (0.0%) | 0 (0.0%) |
| 7+ Person Households | 12 (2.9%) | 0 (0.0%) |
| Total | 262 (62.5%) | 157 (37.5%) |
Female Fertility in Bass Lake
Fertility by Age in Bass Lake
Average fertility rate in Bass Lake is 313.0 births per 1,000 women. Women in the age bracket of 20 to 34 years have the highest fertility rate with 676.0 births per 1,000 women. Women in the age bracket of 20 to 34 years acount for 100.0% of all women with births.
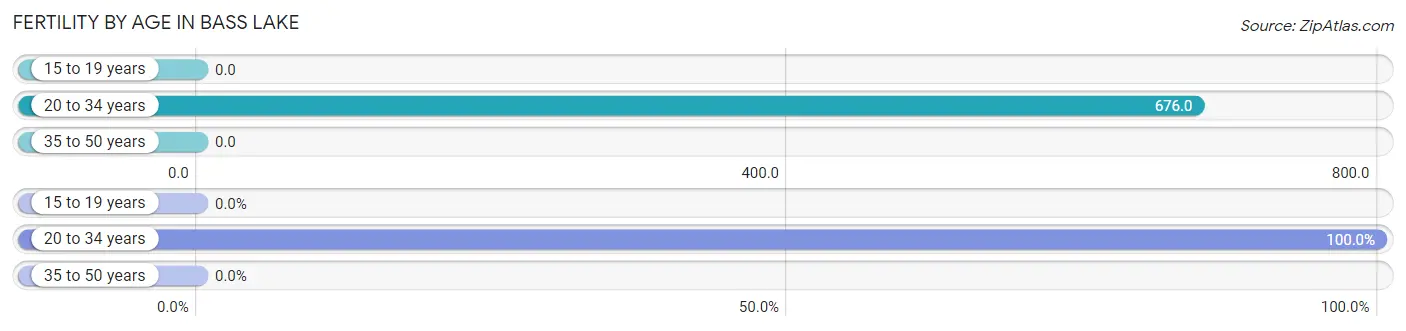
| Age Bracket | Women with Births | Births / 1,000 Women |
| 15 to 19 years | 0 (0.0%) | 0.0 |
| 20 to 34 years | 25 (100.0%) | 676.0 |
| 35 to 50 years | 0 (0.0%) | 0.0 |
| Total | 25 (100.0%) | 313.0 |
Fertility by Age by Marriage Status in Bass Lake
44.0% of women with births (25) in Bass Lake are married. The highest percentage of unmarried women with births falls into 20 to 34 years age bracket with 56.0% of them unmarried at the time of birth, while the lowest percentage of unmarried women with births belong to 20 to 34 years age bracket with 56.0% of them unmarried.
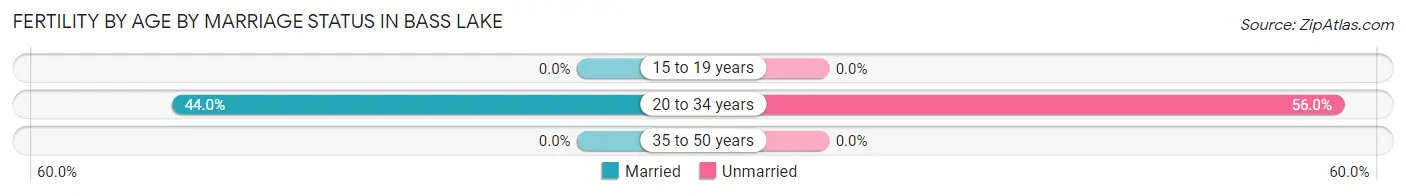
| Age Bracket | Married | Unmarried |
| 15 to 19 years | 0 (0.0%) | 0 (0.0%) |
| 20 to 34 years | 11 (44.0%) | 14 (56.0%) |
| 35 to 50 years | 0 (0.0%) | 0 (0.0%) |
| Total | 11 (44.0%) | 14 (56.0%) |
Fertility by Education in Bass Lake
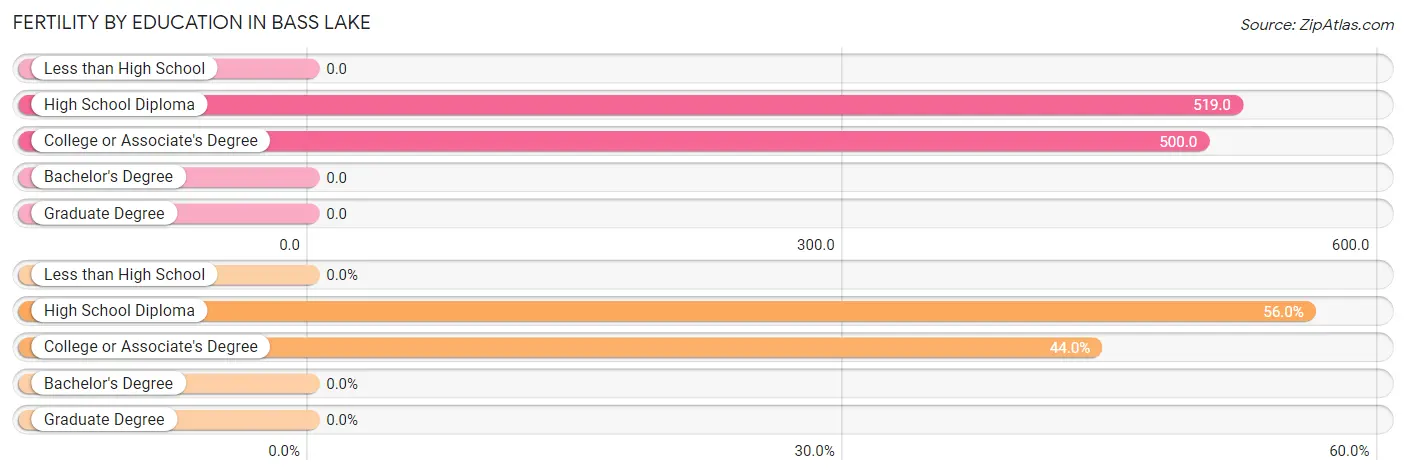
| Educational Attainment | Women with Births | Births / 1,000 Women |
| Less than High School | 0 (0.0%) | 0.0 |
| High School Diploma | 14 (56.0%) | 519.0 |
| College or Associate's Degree | 11 (44.0%) | 500.0 |
| Bachelor's Degree | 0 (0.0%) | 0.0 |
| Graduate Degree | 0 (0.0%) | 0.0 |
| Total | 25 (100.0%) | 313.0 |
Fertility by Education by Marriage Status in Bass Lake
56.0% of women with births in Bass Lake are unmarried. Women with the educational attainment of college or associate's degree are most likely to be married with 100.0% of them married at childbirth, while women with the educational attainment of high school diploma are least likely to be married with 100.0% of them unmarried at childbirth.
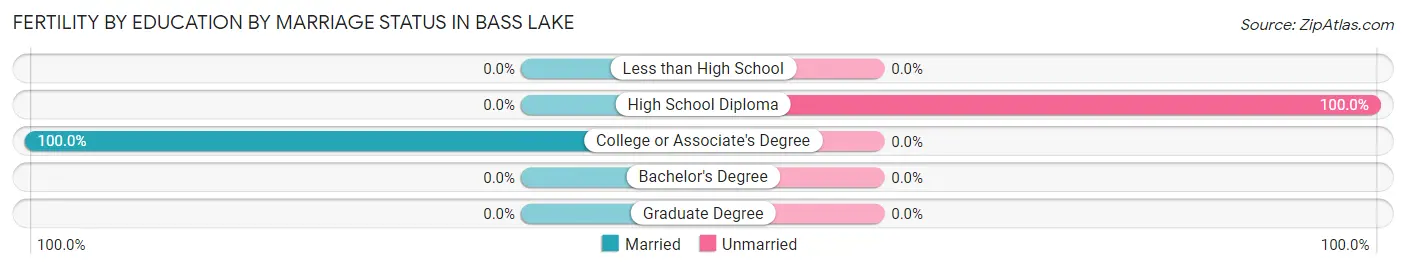
| Educational Attainment | Married | Unmarried |
| Less than High School | 0 (0.0%) | 0 (0.0%) |
| High School Diploma | 0 (0.0%) | 14 (100.0%) |
| College or Associate's Degree | 11 (100.0%) | 0 (0.0%) |
| Bachelor's Degree | 0 (0.0%) | 0 (0.0%) |
| Graduate Degree | 0 (0.0%) | 0 (0.0%) |
| Total | 11 (44.0%) | 14 (56.0%) |
Employment Characteristics in Bass Lake
Employment by Class of Employer in Bass Lake
Among the 327 employed individuals in Bass Lake, private company employees (178 | 54.4%), local government employees (44 | 13.5%), and not-for-profit organizations (43 | 13.2%) make up the most common classes of employment.
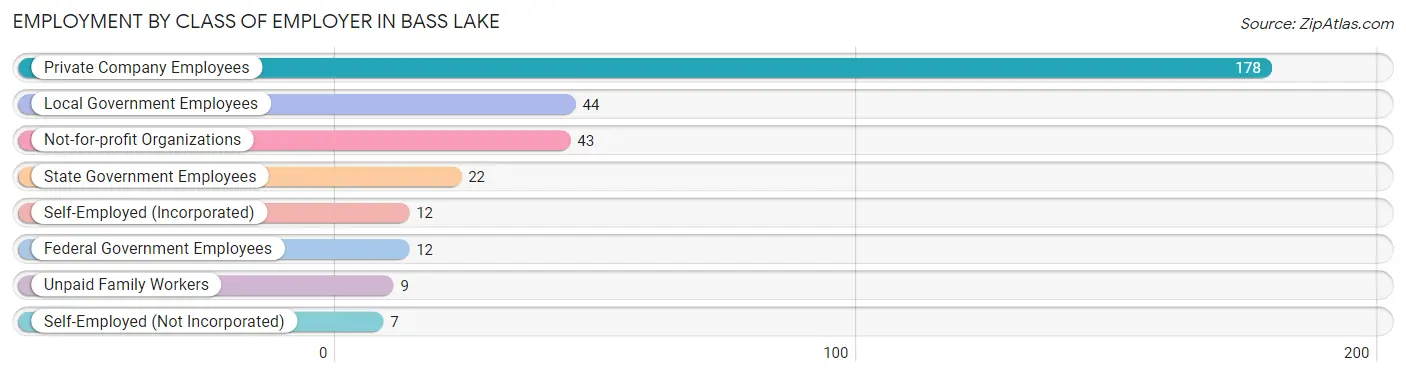
| Employer Class | # Employees | % Employees |
| Private Company Employees | 178 | 54.4% |
| Self-Employed (Incorporated) | 12 | 3.7% |
| Self-Employed (Not Incorporated) | 7 | 2.1% |
| Not-for-profit Organizations | 43 | 13.2% |
| Local Government Employees | 44 | 13.5% |
| State Government Employees | 22 | 6.7% |
| Federal Government Employees | 12 | 3.7% |
| Unpaid Family Workers | 9 | 2.8% |
| Total | 327 | 100.0% |
Employment Status by Age in Bass Lake
According to the labor force statistics for Bass Lake, out of the total population over 16 years of age (847), 46.2% or 391 individuals are in the labor force, with 11.0% or 43 of them unemployed. The age group with the highest labor force participation rate is 45 to 54 years, with 84.8% or 67 individuals in the labor force. Within the labor force, the 20 to 24 years age range has the highest percentage of unemployed individuals, with 100.0% or 14 of them being unemployed.
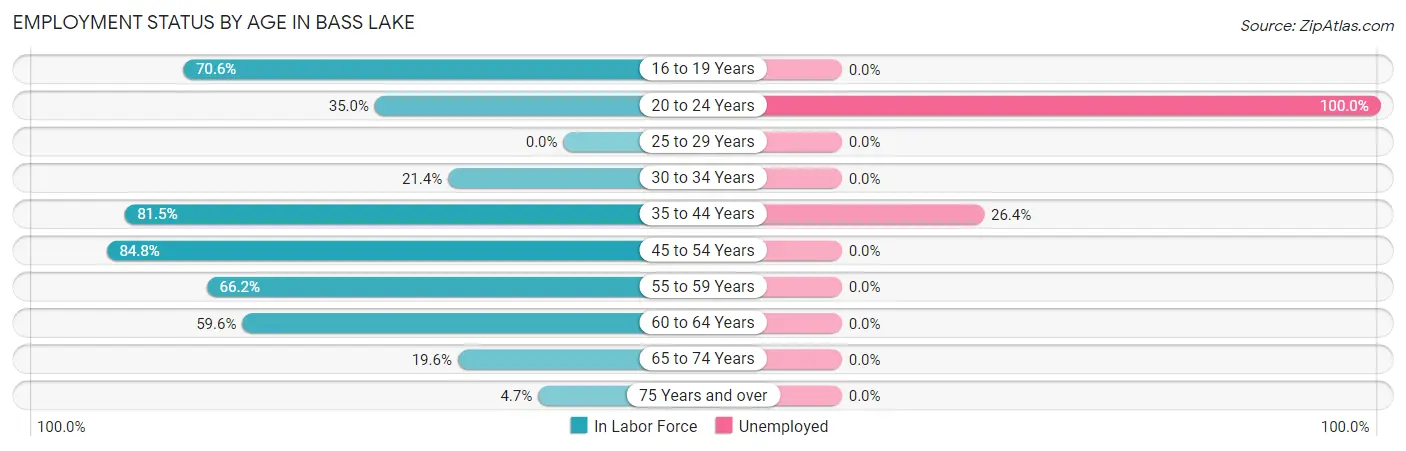
| Age Bracket | In Labor Force | Unemployed |
| 16 to 19 Years | 24 (70.6%) | 0 (0.0%) |
| 20 to 24 Years | 14 (35.0%) | 14 (100.0%) |
| 25 to 29 Years | 0 (0.0%) | 0 (0.0%) |
| 30 to 34 Years | 3 (21.4%) | 0 (0.0%) |
| 35 to 44 Years | 110 (81.5%) | 29 (26.4%) |
| 45 to 54 Years | 67 (84.8%) | 0 (0.0%) |
| 55 to 59 Years | 49 (66.2%) | 0 (0.0%) |
| 60 to 64 Years | 84 (59.6%) | 0 (0.0%) |
| 65 to 74 Years | 33 (19.6%) | 0 (0.0%) |
| 75 Years and over | 7 (4.7%) | 0 (0.0%) |
| Total | 391 (46.2%) | 43 (11.0%) |
Employment Status by Educational Attainment in Bass Lake
According to labor force statistics for Bass Lake, 68.5% of individuals (313) out of the total population between 25 and 64 years of age (457) are in the labor force, with 9.3% or 29 of them being unemployed. The group with the highest labor force participation rate are those with the educational attainment of bachelor's degree or higher, with 92.4% or 85 individuals in the labor force. Within the labor force, individuals with high school diploma education have the highest percentage of unemployment, with 21.6% or 29 of them being unemployed.
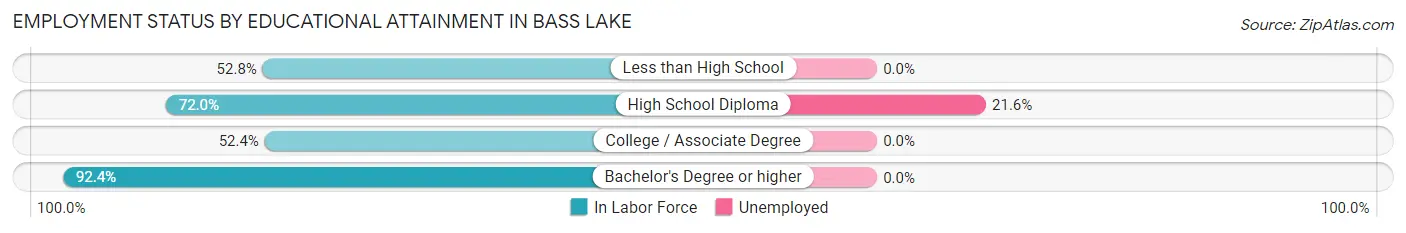
| Educational Attainment | In Labor Force | Unemployed |
| Less than High School | 19 (52.8%) | 0 (0.0%) |
| High School Diploma | 134 (72.0%) | 40 (21.6%) |
| College / Associate Degree | 75 (52.4%) | 0 (0.0%) |
| Bachelor's Degree or higher | 85 (92.4%) | 0 (0.0%) |
| Total | 313 (68.5%) | 43 (9.3%) |
Employment Occupations by Sex in Bass Lake
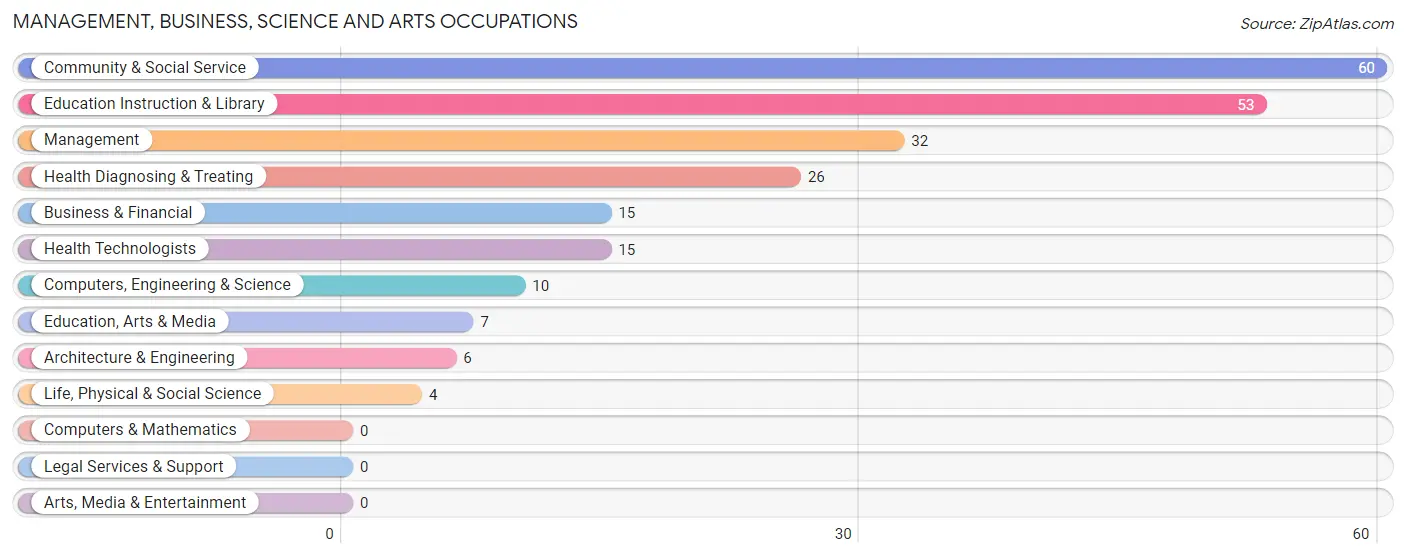
Management, Business, Science and Arts Occupations
The most common Management, Business, Science and Arts occupations in Bass Lake are Community & Social Service (60 | 17.2%), Education Instruction & Library (53 | 15.2%), Management (32 | 9.2%), Health Diagnosing & Treating (26 | 7.5%), and Business & Financial (15 | 4.3%).
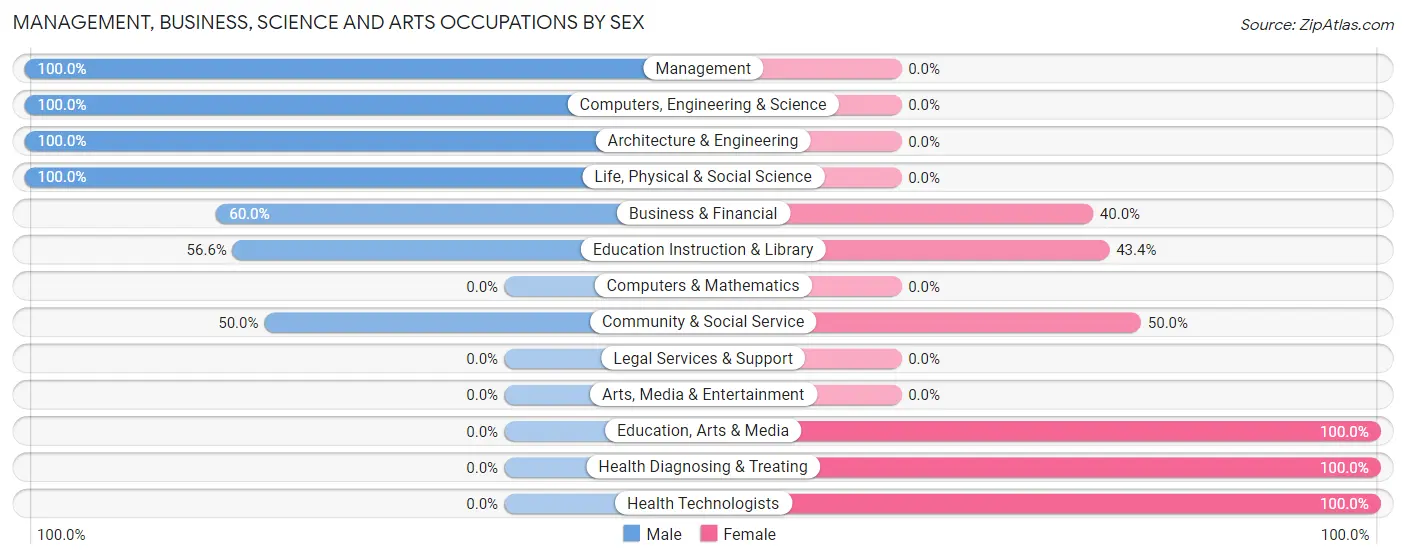
Management, Business, Science and Arts Occupations by Sex
Within the Management, Business, Science and Arts occupations in Bass Lake, the most male-oriented occupations are Management (100.0%), Computers, Engineering & Science (100.0%), and Architecture & Engineering (100.0%), while the most female-oriented occupations are Education, Arts & Media (100.0%), Health Diagnosing & Treating (100.0%), and Health Technologists (100.0%).
| Occupation | Male | Female |
| Management | 32 (100.0%) | 0 (0.0%) |
| Business & Financial | 9 (60.0%) | 6 (40.0%) |
| Computers, Engineering & Science | 10 (100.0%) | 0 (0.0%) |
| Computers & Mathematics | 0 (0.0%) | 0 (0.0%) |
| Architecture & Engineering | 6 (100.0%) | 0 (0.0%) |
| Life, Physical & Social Science | 4 (100.0%) | 0 (0.0%) |
| Community & Social Service | 30 (50.0%) | 30 (50.0%) |
| Education, Arts & Media | 0 (0.0%) | 7 (100.0%) |
| Legal Services & Support | 0 (0.0%) | 0 (0.0%) |
| Education Instruction & Library | 30 (56.6%) | 23 (43.4%) |
| Arts, Media & Entertainment | 0 (0.0%) | 0 (0.0%) |
| Health Diagnosing & Treating | 0 (0.0%) | 26 (100.0%) |
| Health Technologists | 0 (0.0%) | 15 (100.0%) |
| Total (Category) | 81 (56.6%) | 62 (43.4%) |
| Total (Overall) | 224 (64.4%) | 124 (35.6%) |
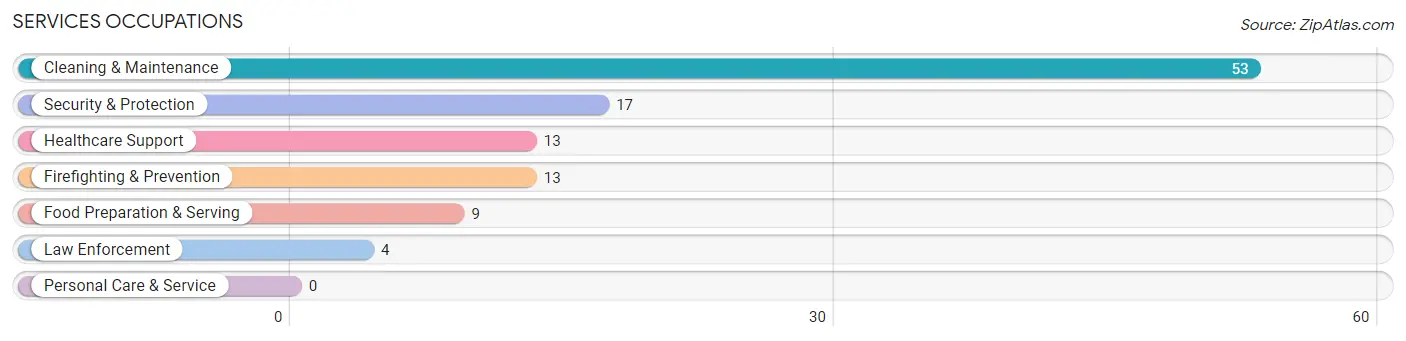
Services Occupations
The most common Services occupations in Bass Lake are Cleaning & Maintenance (53 | 15.2%), Security & Protection (17 | 4.9%), Healthcare Support (13 | 3.7%), Firefighting & Prevention (13 | 3.7%), and Food Preparation & Serving (9 | 2.6%).
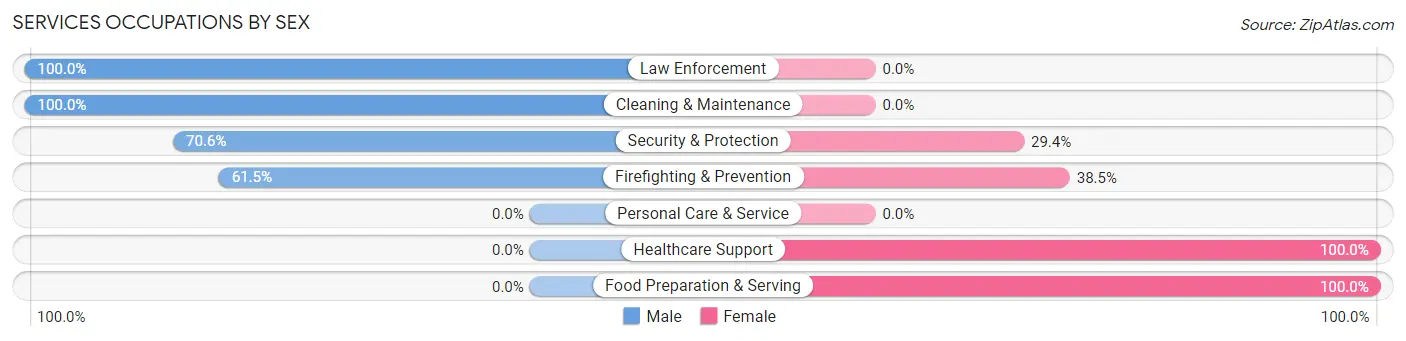
Services Occupations by Sex
Within the Services occupations in Bass Lake, the most male-oriented occupations are Law Enforcement (100.0%), Cleaning & Maintenance (100.0%), and Security & Protection (70.6%), while the most female-oriented occupations are Healthcare Support (100.0%), Food Preparation & Serving (100.0%), and Firefighting & Prevention (38.5%).
| Occupation | Male | Female |
| Healthcare Support | 0 (0.0%) | 13 (100.0%) |
| Security & Protection | 12 (70.6%) | 5 (29.4%) |
| Firefighting & Prevention | 8 (61.5%) | 5 (38.5%) |
| Law Enforcement | 4 (100.0%) | 0 (0.0%) |
| Food Preparation & Serving | 0 (0.0%) | 9 (100.0%) |
| Cleaning & Maintenance | 53 (100.0%) | 0 (0.0%) |
| Personal Care & Service | 0 (0.0%) | 0 (0.0%) |
| Total (Category) | 65 (70.7%) | 27 (29.3%) |
| Total (Overall) | 224 (64.4%) | 124 (35.6%) |
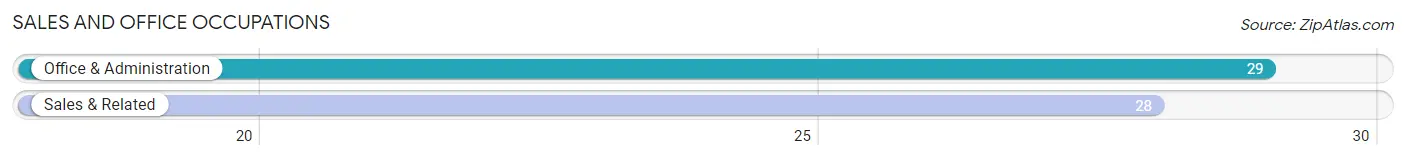
Sales and Office Occupations
The most common Sales and Office occupations in Bass Lake are Office & Administration (29 | 8.3%), and Sales & Related (28 | 8.1%).
Sales and Office Occupations by Sex
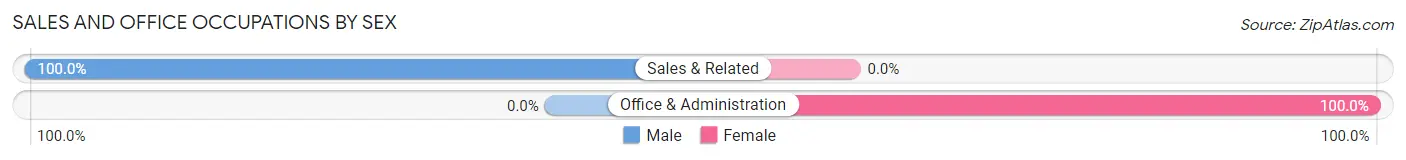
| Occupation | Male | Female |
| Sales & Related | 28 (100.0%) | 0 (0.0%) |
| Office & Administration | 0 (0.0%) | 29 (100.0%) |
| Total (Category) | 28 (49.1%) | 29 (50.9%) |
| Total (Overall) | 224 (64.4%) | 124 (35.6%) |
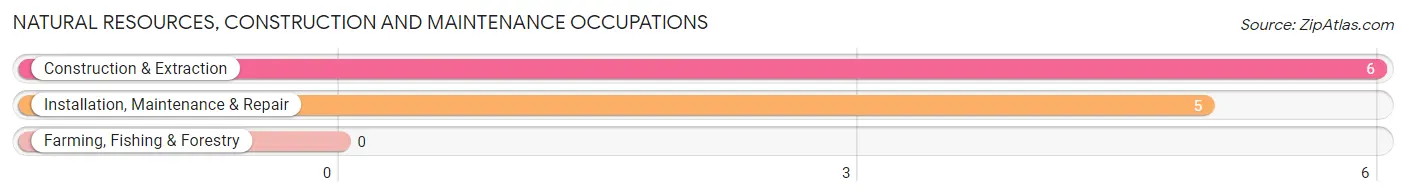
Natural Resources, Construction and Maintenance Occupations
The most common Natural Resources, Construction and Maintenance occupations in Bass Lake are Construction & Extraction (6 | 1.7%), and Installation, Maintenance & Repair (5 | 1.4%).
Natural Resources, Construction and Maintenance Occupations by Sex
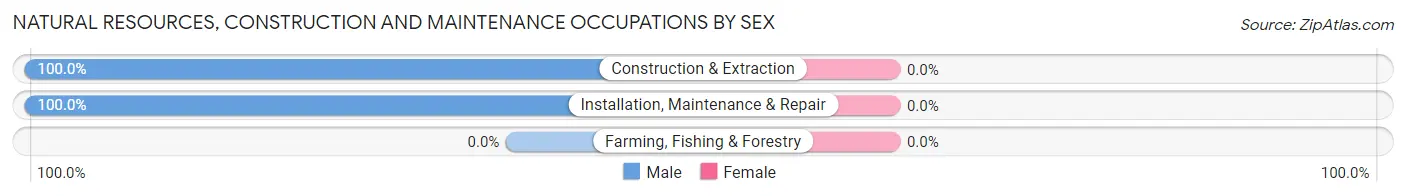
| Occupation | Male | Female |
| Farming, Fishing & Forestry | 0 (0.0%) | 0 (0.0%) |
| Construction & Extraction | 6 (100.0%) | 0 (0.0%) |
| Installation, Maintenance & Repair | 5 (100.0%) | 0 (0.0%) |
| Total (Category) | 11 (100.0%) | 0 (0.0%) |
| Total (Overall) | 224 (64.4%) | 124 (35.6%) |
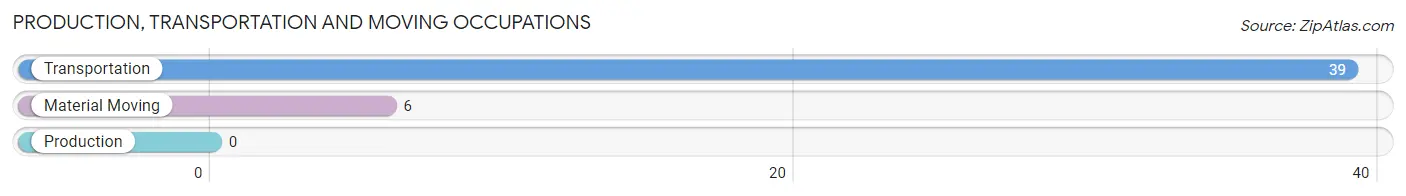
Production, Transportation and Moving Occupations
The most common Production, Transportation and Moving occupations in Bass Lake are Transportation (39 | 11.2%), and Material Moving (6 | 1.7%).
Production, Transportation and Moving Occupations by Sex
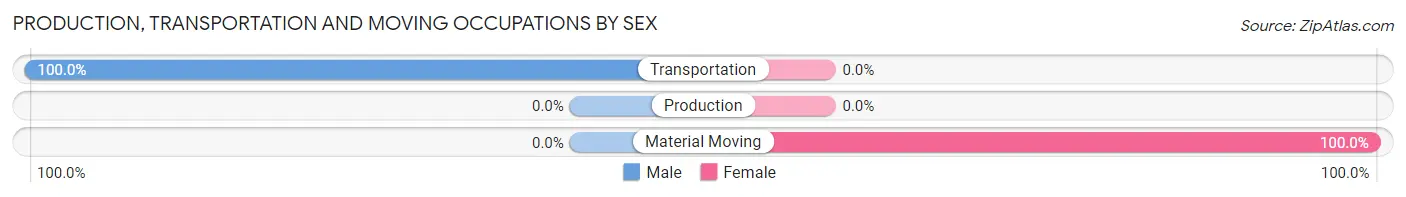
| Occupation | Male | Female |
| Production | 0 (0.0%) | 0 (0.0%) |
| Transportation | 39 (100.0%) | 0 (0.0%) |
| Material Moving | 0 (0.0%) | 6 (100.0%) |
| Total (Category) | 39 (86.7%) | 6 (13.3%) |
| Total (Overall) | 224 (64.4%) | 124 (35.6%) |
Employment Industries by Sex in Bass Lake
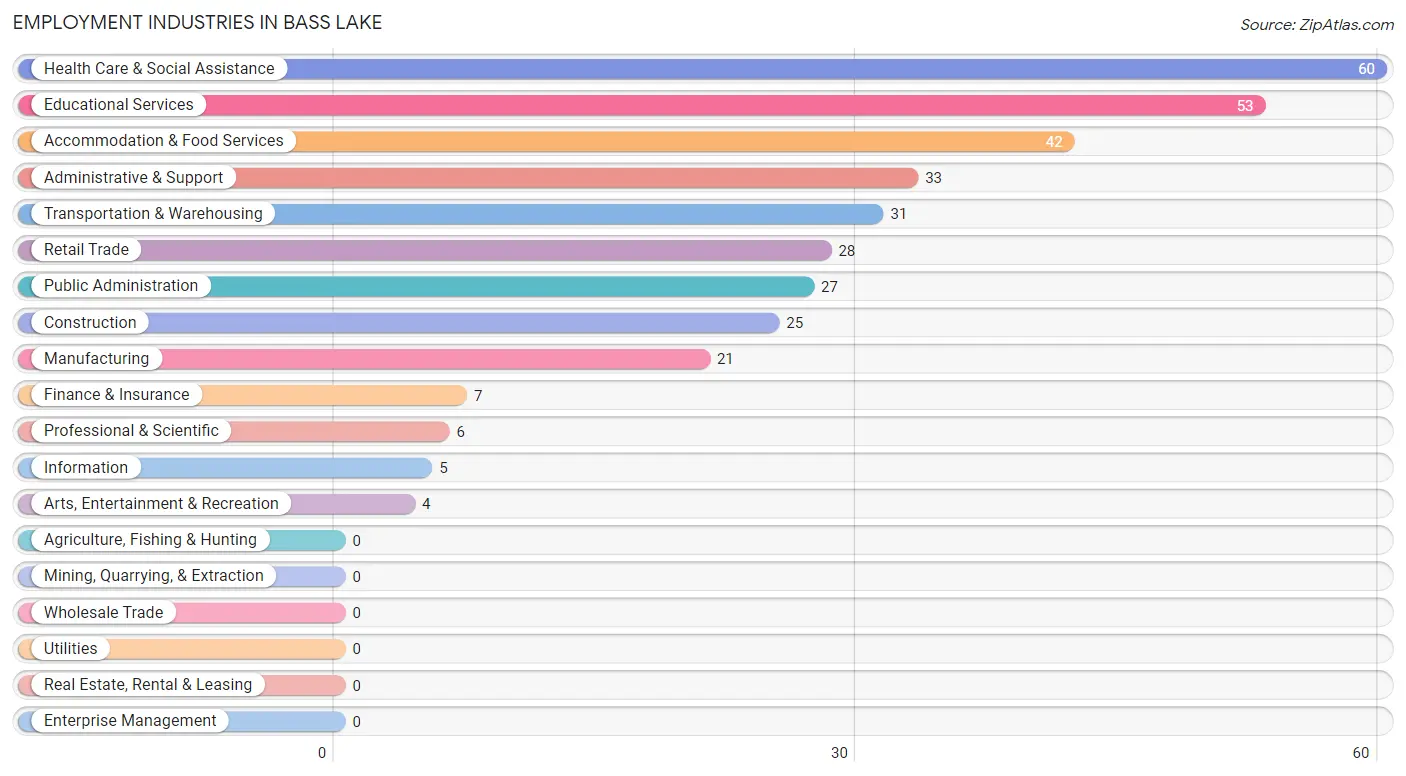
Employment Industries in Bass Lake
The major employment industries in Bass Lake include Health Care & Social Assistance (60 | 17.2%), Educational Services (53 | 15.2%), Accommodation & Food Services (42 | 12.1%), Administrative & Support (33 | 9.5%), and Transportation & Warehousing (31 | 8.9%).
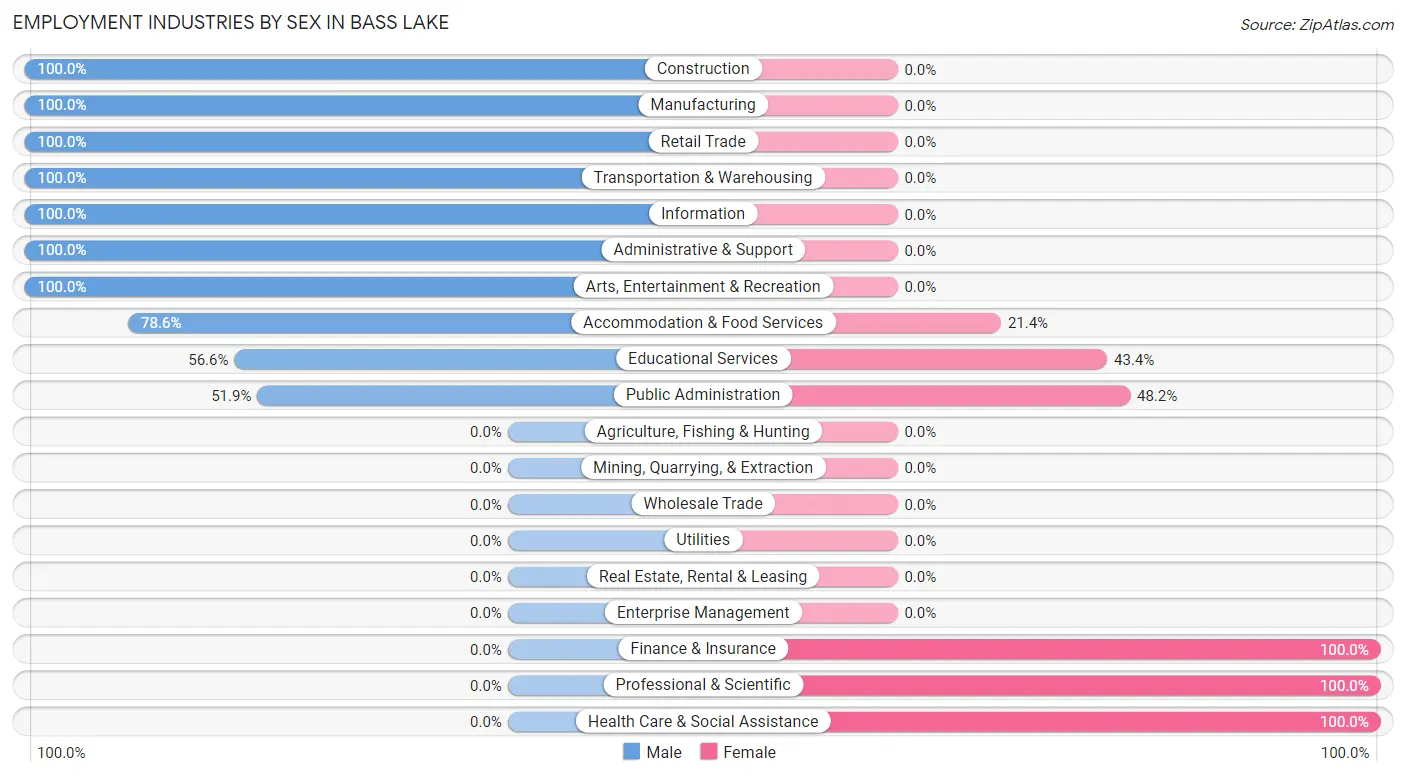
Employment Industries by Sex in Bass Lake
The Bass Lake industries that see more men than women are Construction (100.0%), Manufacturing (100.0%), and Retail Trade (100.0%), whereas the industries that tend to have a higher number of women are Finance & Insurance (100.0%), Professional & Scientific (100.0%), and Health Care & Social Assistance (100.0%).
| Industry | Male | Female |
| Agriculture, Fishing & Hunting | 0 (0.0%) | 0 (0.0%) |
| Mining, Quarrying, & Extraction | 0 (0.0%) | 0 (0.0%) |
| Construction | 25 (100.0%) | 0 (0.0%) |
| Manufacturing | 21 (100.0%) | 0 (0.0%) |
| Wholesale Trade | 0 (0.0%) | 0 (0.0%) |
| Retail Trade | 28 (100.0%) | 0 (0.0%) |
| Transportation & Warehousing | 31 (100.0%) | 0 (0.0%) |
| Utilities | 0 (0.0%) | 0 (0.0%) |
| Information | 5 (100.0%) | 0 (0.0%) |
| Finance & Insurance | 0 (0.0%) | 7 (100.0%) |
| Real Estate, Rental & Leasing | 0 (0.0%) | 0 (0.0%) |
| Professional & Scientific | 0 (0.0%) | 6 (100.0%) |
| Enterprise Management | 0 (0.0%) | 0 (0.0%) |
| Administrative & Support | 33 (100.0%) | 0 (0.0%) |
| Educational Services | 30 (56.6%) | 23 (43.4%) |
| Health Care & Social Assistance | 0 (0.0%) | 60 (100.0%) |
| Arts, Entertainment & Recreation | 4 (100.0%) | 0 (0.0%) |
| Accommodation & Food Services | 33 (78.6%) | 9 (21.4%) |
| Public Administration | 14 (51.8%) | 13 (48.1%) |
| Total | 224 (64.4%) | 124 (35.6%) |
Education in Bass Lake
School Enrollment in Bass Lake
The most common levels of schooling among the 164 students in Bass Lake are middle school (49 | 29.9%), elementary school (40 | 24.4%), and high school (32 | 19.5%).
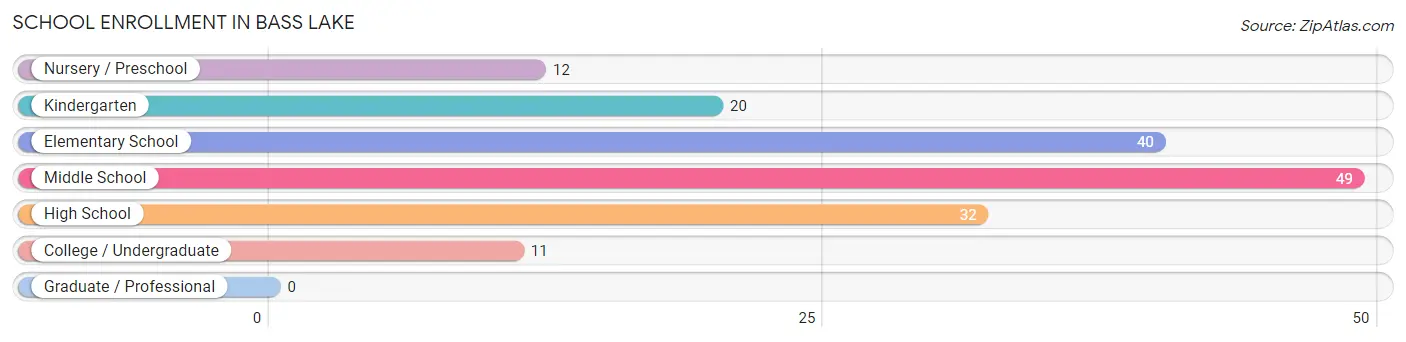
| School Level | # Students | % Students |
| Nursery / Preschool | 12 | 7.3% |
| Kindergarten | 20 | 12.2% |
| Elementary School | 40 | 24.4% |
| Middle School | 49 | 29.9% |
| High School | 32 | 19.5% |
| College / Undergraduate | 11 | 6.7% |
| Graduate / Professional | 0 | 0.0% |
| Total | 164 | 100.0% |
School Enrollment by Age by Funding Source in Bass Lake
Out of a total of 164 students who are enrolled in schools in Bass Lake, 13 (7.9%) attend a private institution, while the remaining 151 (92.1%) are enrolled in public schools. The age group of 35 years and over has the highest likelihood of being enrolled in private schools, with 11 (100.0% in the age bracket) enrolled. Conversely, the age group of 3 to 4 year olds has the lowest likelihood of being enrolled in a private school, with 12 (100.0% in the age bracket) attending a public institution.
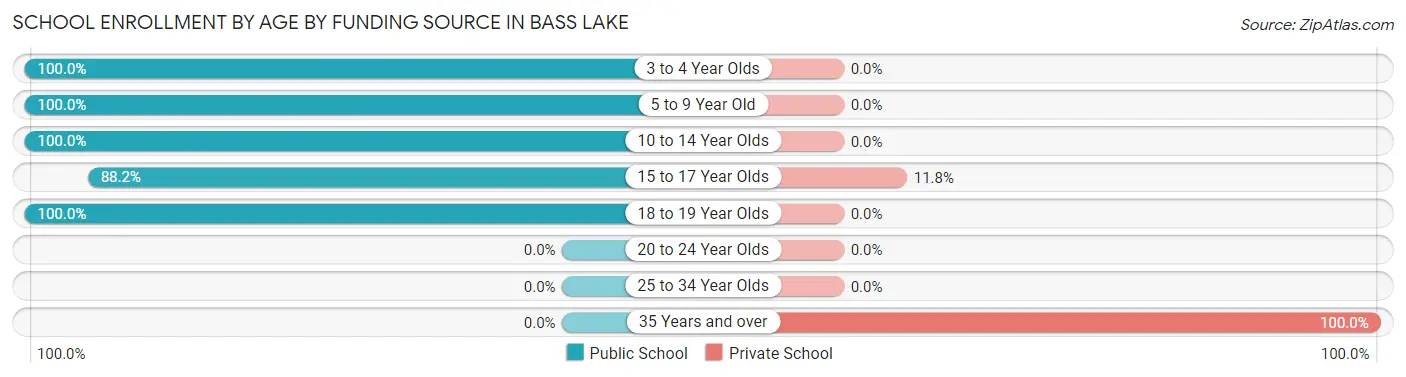
| Age Bracket | Public School | Private School |
| 3 to 4 Year Olds | 12 (100.0%) | 0 (0.0%) |
| 5 to 9 Year Old | 42 (100.0%) | 0 (0.0%) |
| 10 to 14 Year Olds | 67 (100.0%) | 0 (0.0%) |
| 15 to 17 Year Olds | 15 (88.2%) | 2 (11.8%) |
| 18 to 19 Year Olds | 15 (100.0%) | 0 (0.0%) |
| 20 to 24 Year Olds | 0 (0.0%) | 0 (0.0%) |
| 25 to 34 Year Olds | 0 (0.0%) | 0 (0.0%) |
| 35 Years and over | 0 (0.0%) | 11 (100.0%) |
| Total | 151 (92.1%) | 13 (7.9%) |
Educational Attainment by Field of Study in Bass Lake
Education (55 | 30.0%), business (39 | 21.3%), bio, nature & agricultural (25 | 13.7%), computers & mathematics (24 | 13.1%), and arts & humanities (16 | 8.7%) are the most common fields of study among 183 individuals in Bass Lake who have obtained a bachelor's degree or higher.
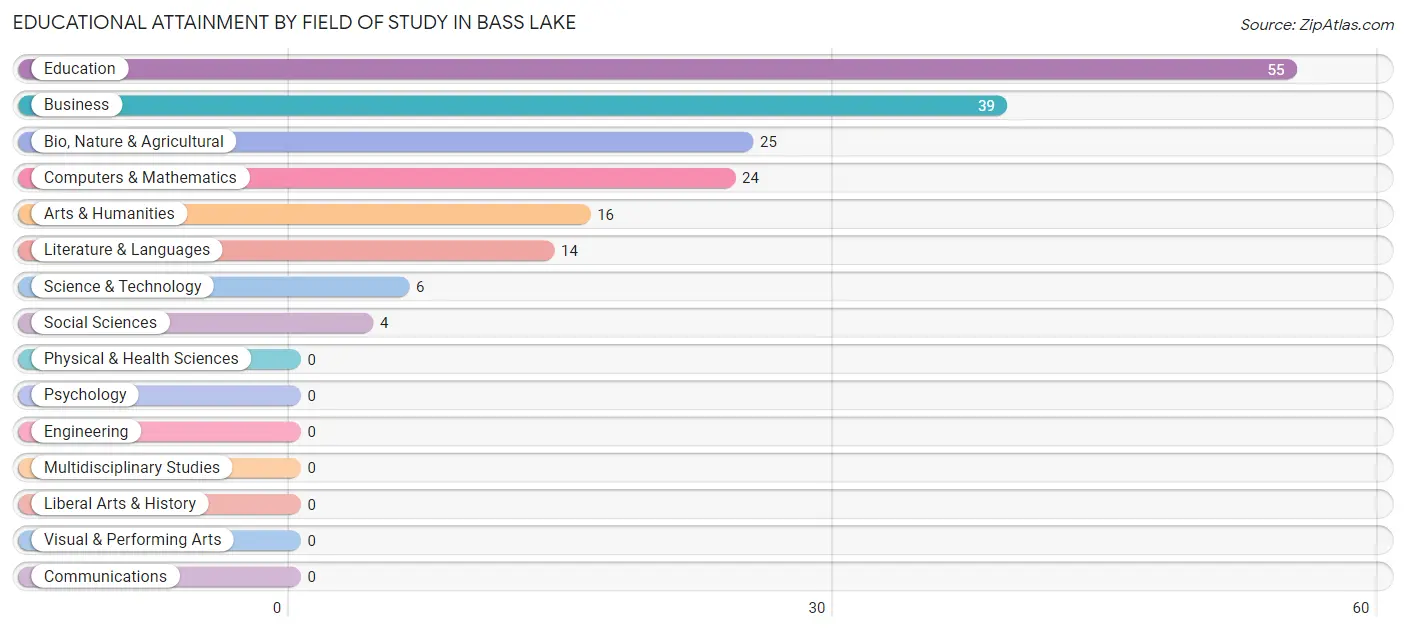
| Field of Study | # Graduates | % Graduates |
| Computers & Mathematics | 24 | 13.1% |
| Bio, Nature & Agricultural | 25 | 13.7% |
| Physical & Health Sciences | 0 | 0.0% |
| Psychology | 0 | 0.0% |
| Social Sciences | 4 | 2.2% |
| Engineering | 0 | 0.0% |
| Multidisciplinary Studies | 0 | 0.0% |
| Science & Technology | 6 | 3.3% |
| Business | 39 | 21.3% |
| Education | 55 | 30.0% |
| Literature & Languages | 14 | 7.6% |
| Liberal Arts & History | 0 | 0.0% |
| Visual & Performing Arts | 0 | 0.0% |
| Communications | 0 | 0.0% |
| Arts & Humanities | 16 | 8.7% |
| Total | 183 | 100.0% |
Transportation & Commute in Bass Lake
Vehicle Availability by Sex in Bass Lake
The most prevalent vehicle ownership categories in Bass Lake are males with 3 vehicles (86, accounting for 41.1%) and females with 3 vehicles (43, making up 72.9%).
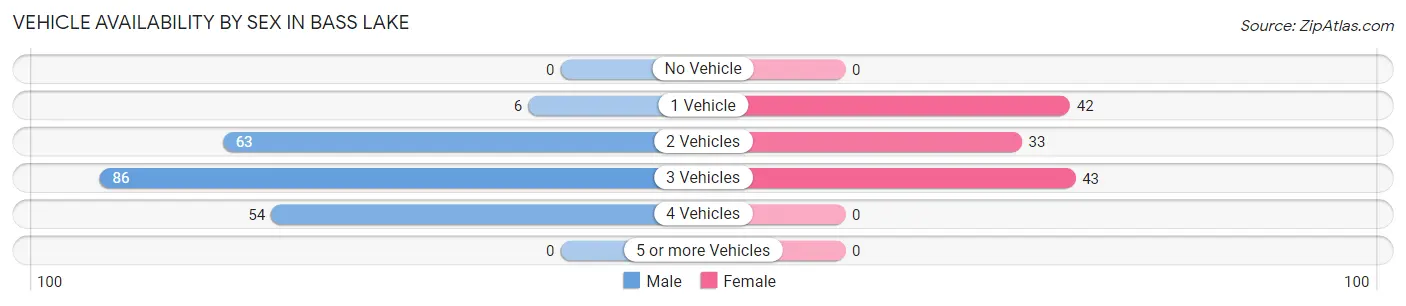
| Vehicles Available | Male | Female |
| No Vehicle | 0 (0.0%) | 0 (0.0%) |
| 1 Vehicle | 6 (2.9%) | 42 (35.6%) |
| 2 Vehicles | 63 (30.1%) | 33 (28.0%) |
| 3 Vehicles | 86 (41.1%) | 43 (36.4%) |
| 4 Vehicles | 54 (25.8%) | 0 (0.0%) |
| 5 or more Vehicles | 0 (0.0%) | 0 (0.0%) |
| Total | 209 (100.0%) | 118 (100.0%) |
Commute Time in Bass Lake
The most frequently occuring commute durations in Bass Lake are 10 to 14 minutes (57 commuters, 17.9%), 45 to 59 minutes (54 commuters, 16.9%), and 35 to 39 minutes (44 commuters, 13.8%).
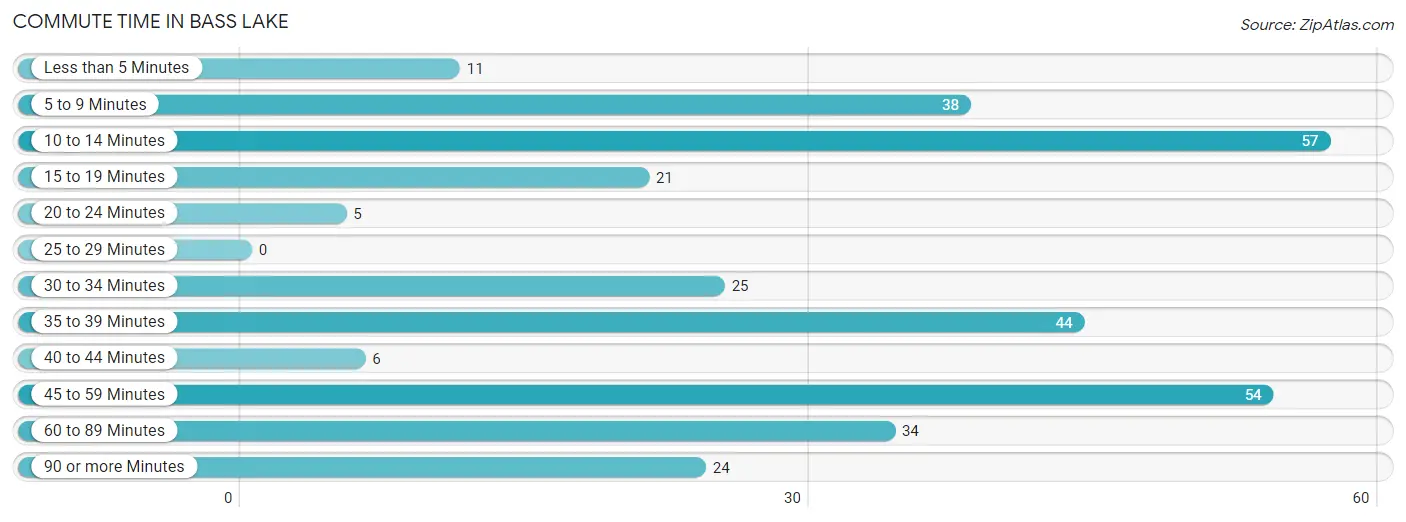
| Commute Time | # Commuters | % Commuters |
| Less than 5 Minutes | 11 | 3.5% |
| 5 to 9 Minutes | 38 | 11.9% |
| 10 to 14 Minutes | 57 | 17.9% |
| 15 to 19 Minutes | 21 | 6.6% |
| 20 to 24 Minutes | 5 | 1.6% |
| 25 to 29 Minutes | 0 | 0.0% |
| 30 to 34 Minutes | 25 | 7.8% |
| 35 to 39 Minutes | 44 | 13.8% |
| 40 to 44 Minutes | 6 | 1.9% |
| 45 to 59 Minutes | 54 | 16.9% |
| 60 to 89 Minutes | 34 | 10.7% |
| 90 or more Minutes | 24 | 7.5% |
Commute Time by Sex in Bass Lake
The most common commute times in Bass Lake are 35 to 39 minutes (38 commuters, 18.9%) for males and 45 to 59 minutes (27 commuters, 22.9%) for females.
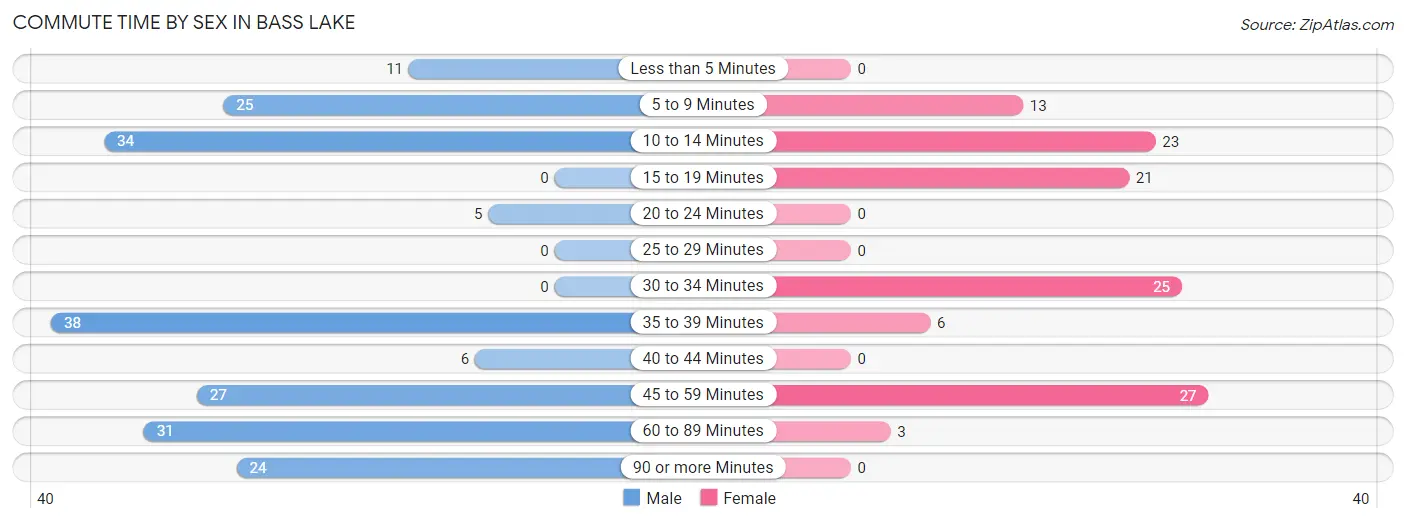
| Commute Time | Male | Female |
| Less than 5 Minutes | 11 (5.5%) | 0 (0.0%) |
| 5 to 9 Minutes | 25 (12.4%) | 13 (11.0%) |
| 10 to 14 Minutes | 34 (16.9%) | 23 (19.5%) |
| 15 to 19 Minutes | 0 (0.0%) | 21 (17.8%) |
| 20 to 24 Minutes | 5 (2.5%) | 0 (0.0%) |
| 25 to 29 Minutes | 0 (0.0%) | 0 (0.0%) |
| 30 to 34 Minutes | 0 (0.0%) | 25 (21.2%) |
| 35 to 39 Minutes | 38 (18.9%) | 6 (5.1%) |
| 40 to 44 Minutes | 6 (3.0%) | 0 (0.0%) |
| 45 to 59 Minutes | 27 (13.4%) | 27 (22.9%) |
| 60 to 89 Minutes | 31 (15.4%) | 3 (2.5%) |
| 90 or more Minutes | 24 (11.9%) | 0 (0.0%) |
Time of Departure to Work by Sex in Bass Lake
The most frequent times of departure to work in Bass Lake are 7:00 AM to 7:29 AM (63, 31.3%) for males and 7:30 AM to 7:59 AM (37, 31.4%) for females.
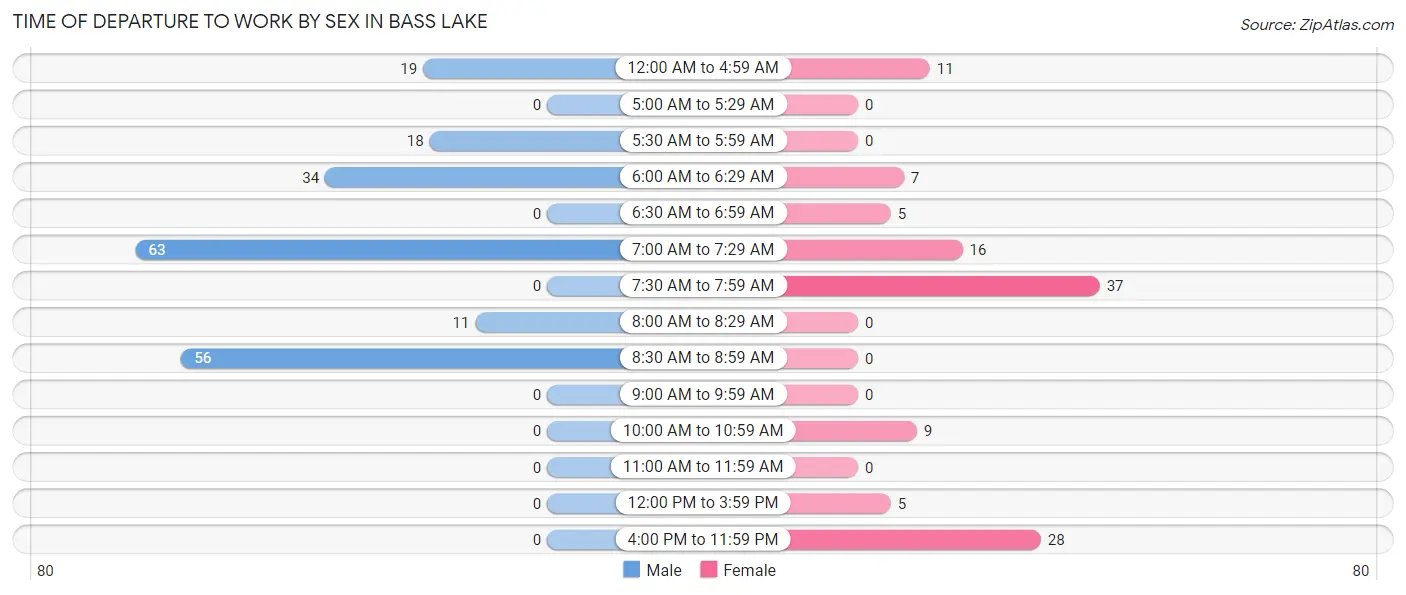
| Time of Departure | Male | Female |
| 12:00 AM to 4:59 AM | 19 (9.5%) | 11 (9.3%) |
| 5:00 AM to 5:29 AM | 0 (0.0%) | 0 (0.0%) |
| 5:30 AM to 5:59 AM | 18 (9.0%) | 0 (0.0%) |
| 6:00 AM to 6:29 AM | 34 (16.9%) | 7 (5.9%) |
| 6:30 AM to 6:59 AM | 0 (0.0%) | 5 (4.2%) |
| 7:00 AM to 7:29 AM | 63 (31.3%) | 16 (13.6%) |
| 7:30 AM to 7:59 AM | 0 (0.0%) | 37 (31.4%) |
| 8:00 AM to 8:29 AM | 11 (5.5%) | 0 (0.0%) |
| 8:30 AM to 8:59 AM | 56 (27.9%) | 0 (0.0%) |
| 9:00 AM to 9:59 AM | 0 (0.0%) | 0 (0.0%) |
| 10:00 AM to 10:59 AM | 0 (0.0%) | 9 (7.6%) |
| 11:00 AM to 11:59 AM | 0 (0.0%) | 0 (0.0%) |
| 12:00 PM to 3:59 PM | 0 (0.0%) | 5 (4.2%) |
| 4:00 PM to 11:59 PM | 0 (0.0%) | 28 (23.7%) |
| Total | 201 (100.0%) | 118 (100.0%) |
Housing Occupancy in Bass Lake
Occupancy by Ownership in Bass Lake
Of the total 419 dwellings in Bass Lake, owner-occupied units account for 390 (93.1%), while renter-occupied units make up 29 (6.9%).
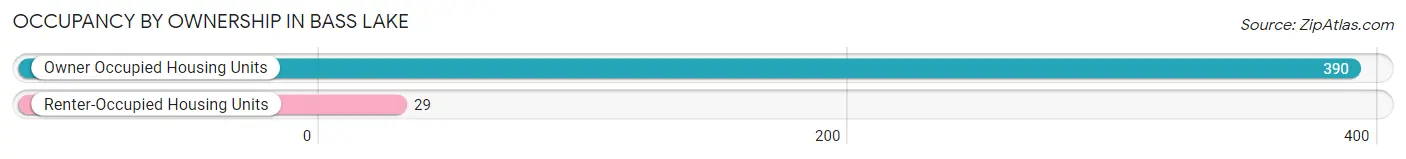
| Occupancy | # Housing Units | % Housing Units |
| Owner Occupied Housing Units | 390 | 93.1% |
| Renter-Occupied Housing Units | 29 | 6.9% |
| Total Occupied Housing Units | 419 | 100.0% |
Occupancy by Household Size in Bass Lake
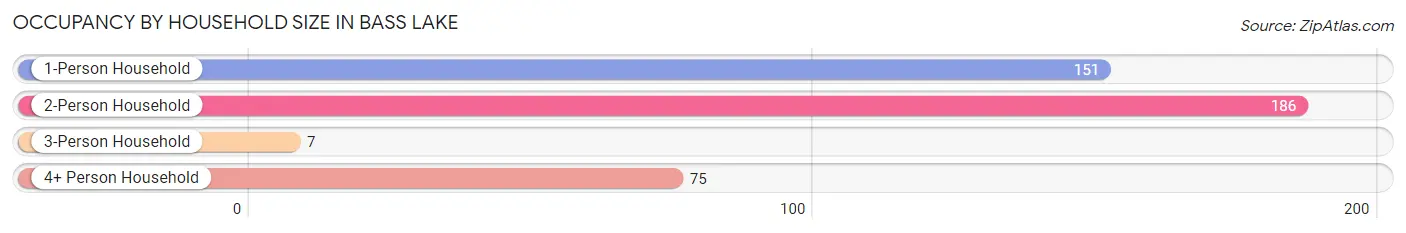
| Household Size | # Housing Units | % Housing Units |
| 1-Person Household | 151 | 36.0% |
| 2-Person Household | 186 | 44.4% |
| 3-Person Household | 7 | 1.7% |
| 4+ Person Household | 75 | 17.9% |
| Total Housing Units | 419 | 100.0% |
Occupancy by Ownership by Household Size in Bass Lake
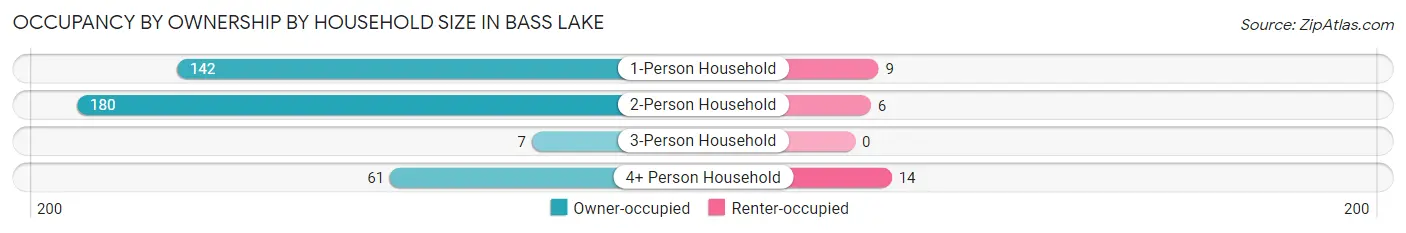
| Household Size | Owner-occupied | Renter-occupied |
| 1-Person Household | 142 (94.0%) | 9 (6.0%) |
| 2-Person Household | 180 (96.8%) | 6 (3.2%) |
| 3-Person Household | 7 (100.0%) | 0 (0.0%) |
| 4+ Person Household | 61 (81.3%) | 14 (18.7%) |
| Total Housing Units | 390 (93.1%) | 29 (6.9%) |
Occupancy by Educational Attainment in Bass Lake
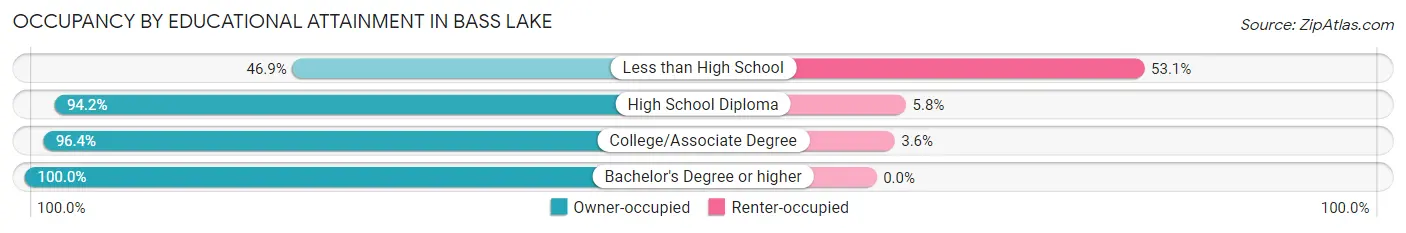
| Household Size | Owner-occupied | Renter-occupied |
| Less than High School | 15 (46.9%) | 17 (53.1%) |
| High School Diploma | 97 (94.2%) | 6 (5.8%) |
| College/Associate Degree | 161 (96.4%) | 6 (3.6%) |
| Bachelor's Degree or higher | 117 (100.0%) | 0 (0.0%) |
Occupancy by Age of Householder in Bass Lake
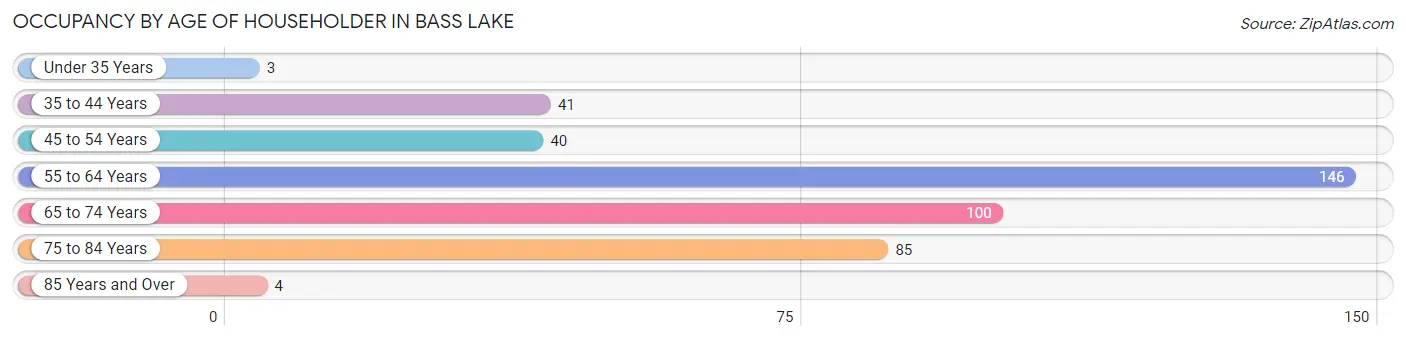
| Age Bracket | # Households | % Households |
| Under 35 Years | 3 | 0.7% |
| 35 to 44 Years | 41 | 9.8% |
| 45 to 54 Years | 40 | 9.6% |
| 55 to 64 Years | 146 | 34.8% |
| 65 to 74 Years | 100 | 23.9% |
| 75 to 84 Years | 85 | 20.3% |
| 85 Years and Over | 4 | 0.9% |
| Total | 419 | 100.0% |
Housing Finances in Bass Lake
Median Income by Occupancy in Bass Lake
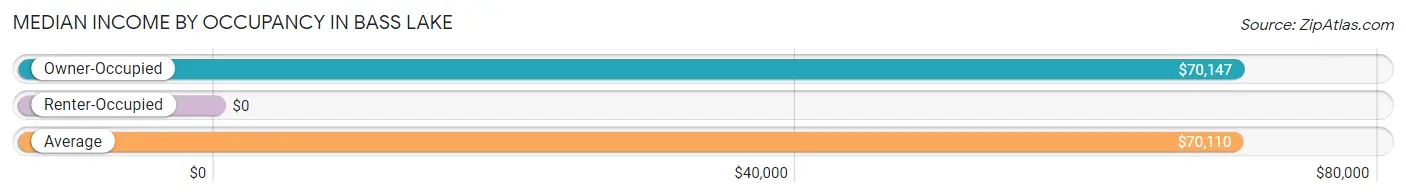
| Occupancy Type | # Households | Median Income |
| Owner-Occupied | 390 (93.1%) | $70,147 |
| Renter-Occupied | 29 (6.9%) | $0 |
| Average | 419 (100.0%) | $70,110 |
Occupancy by Householder Income Bracket in Bass Lake
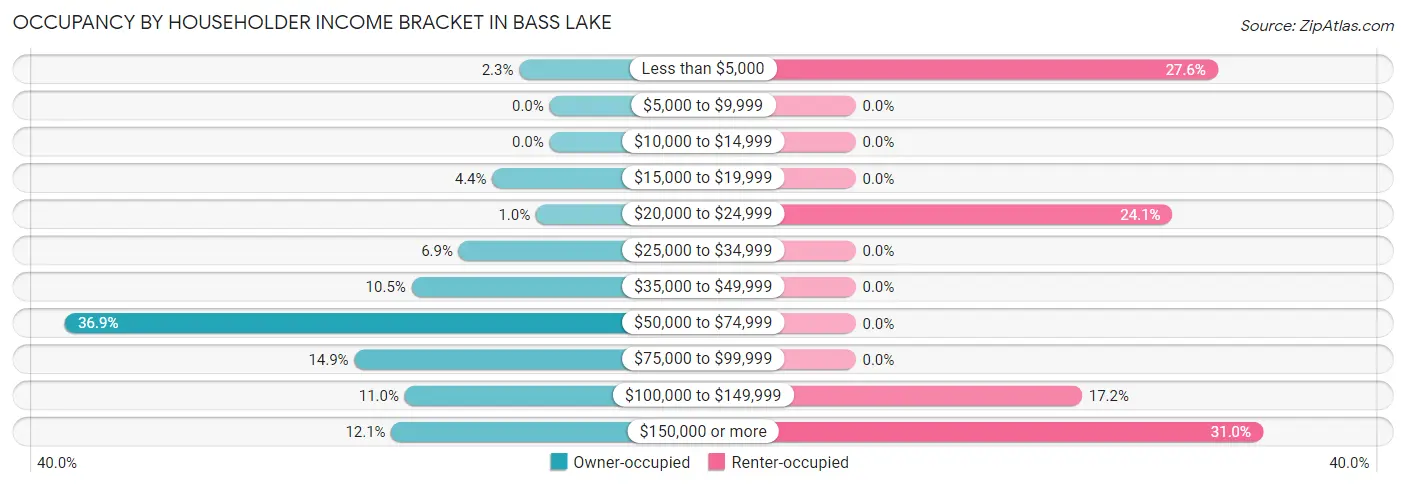
| Income Bracket | Owner-occupied | Renter-occupied |
| Less than $5,000 | 9 (2.3%) | 8 (27.6%) |
| $5,000 to $9,999 | 0 (0.0%) | 0 (0.0%) |
| $10,000 to $14,999 | 0 (0.0%) | 0 (0.0%) |
| $15,000 to $19,999 | 17 (4.4%) | 0 (0.0%) |
| $20,000 to $24,999 | 4 (1.0%) | 7 (24.1%) |
| $25,000 to $34,999 | 27 (6.9%) | 0 (0.0%) |
| $35,000 to $49,999 | 41 (10.5%) | 0 (0.0%) |
| $50,000 to $74,999 | 144 (36.9%) | 0 (0.0%) |
| $75,000 to $99,999 | 58 (14.9%) | 0 (0.0%) |
| $100,000 to $149,999 | 43 (11.0%) | 5 (17.2%) |
| $150,000 or more | 47 (12.0%) | 9 (31.0%) |
| Total | 390 (100.0%) | 29 (100.0%) |
Monthly Housing Cost Tiers in Bass Lake
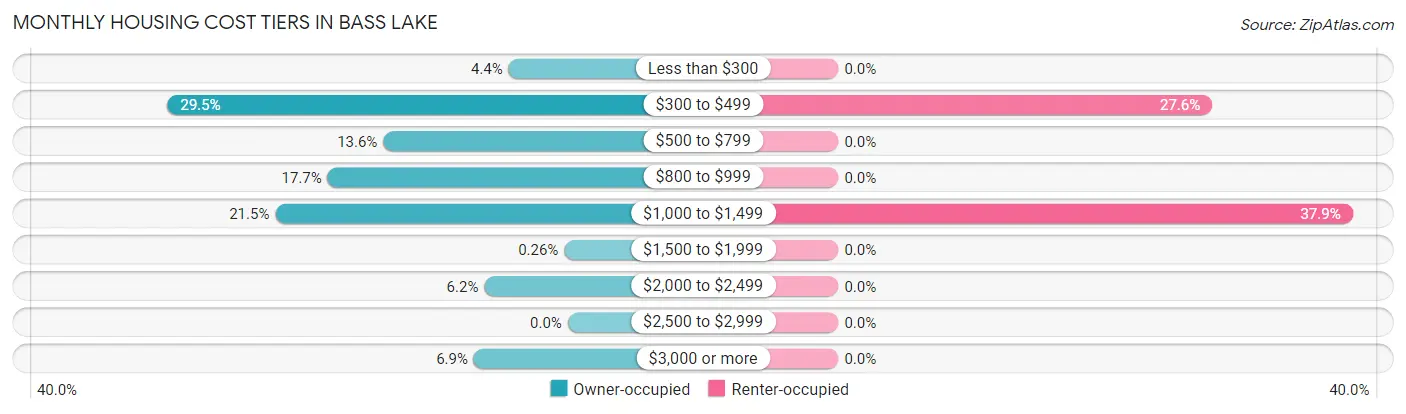
| Monthly Cost | Owner-occupied | Renter-occupied |
| Less than $300 | 17 (4.4%) | 0 (0.0%) |
| $300 to $499 | 115 (29.5%) | 8 (27.6%) |
| $500 to $799 | 53 (13.6%) | 0 (0.0%) |
| $800 to $999 | 69 (17.7%) | 0 (0.0%) |
| $1,000 to $1,499 | 84 (21.5%) | 11 (37.9%) |
| $1,500 to $1,999 | 1 (0.3%) | 0 (0.0%) |
| $2,000 to $2,499 | 24 (6.1%) | 0 (0.0%) |
| $2,500 to $2,999 | 0 (0.0%) | 0 (0.0%) |
| $3,000 or more | 27 (6.9%) | 0 (0.0%) |
| Total | 390 (100.0%) | 29 (100.0%) |
Physical Housing Characteristics in Bass Lake
Housing Structures in Bass Lake
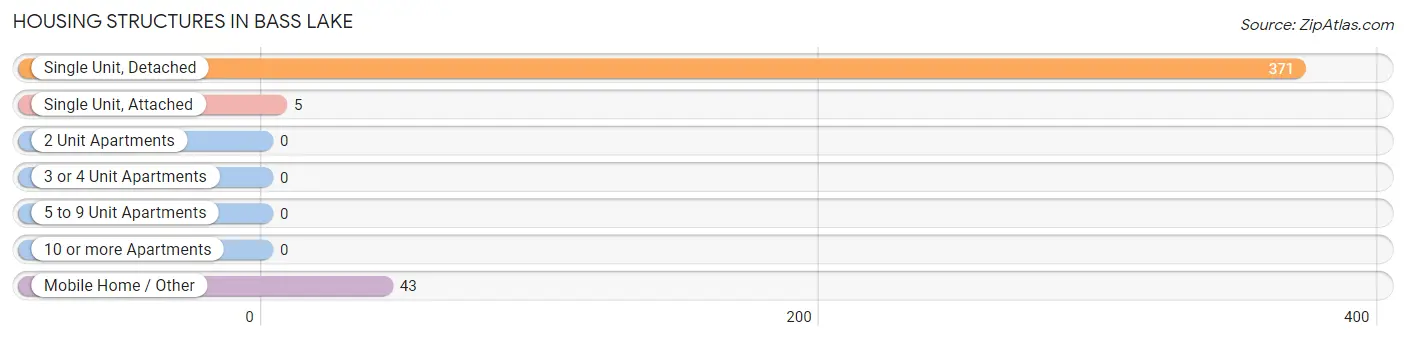
| Structure Type | # Housing Units | % Housing Units |
| Single Unit, Detached | 371 | 88.5% |
| Single Unit, Attached | 5 | 1.2% |
| 2 Unit Apartments | 0 | 0.0% |
| 3 or 4 Unit Apartments | 0 | 0.0% |
| 5 to 9 Unit Apartments | 0 | 0.0% |
| 10 or more Apartments | 0 | 0.0% |
| Mobile Home / Other | 43 | 10.3% |
| Total | 419 | 100.0% |
Housing Structures by Occupancy in Bass Lake
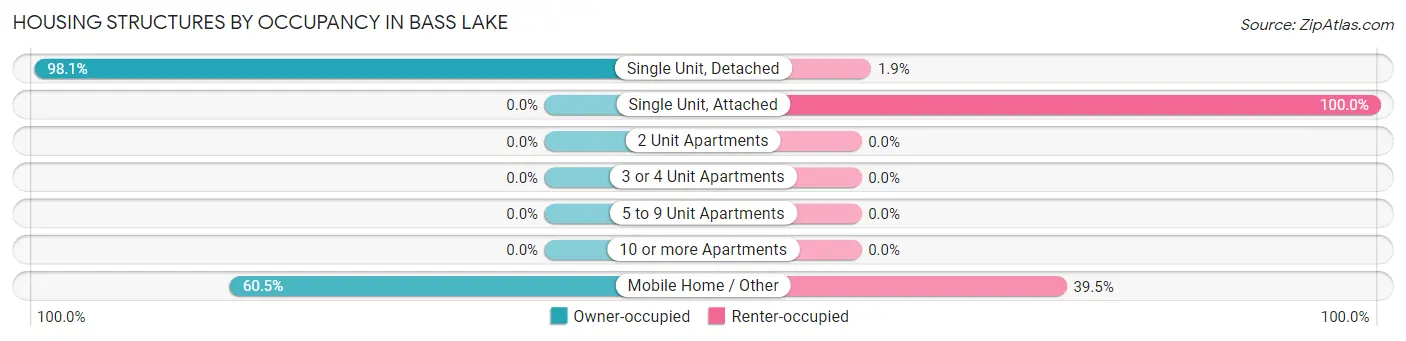
| Structure Type | Owner-occupied | Renter-occupied |
| Single Unit, Detached | 364 (98.1%) | 7 (1.9%) |
| Single Unit, Attached | 0 (0.0%) | 5 (100.0%) |
| 2 Unit Apartments | 0 (0.0%) | 0 (0.0%) |
| 3 or 4 Unit Apartments | 0 (0.0%) | 0 (0.0%) |
| 5 to 9 Unit Apartments | 0 (0.0%) | 0 (0.0%) |
| 10 or more Apartments | 0 (0.0%) | 0 (0.0%) |
| Mobile Home / Other | 26 (60.5%) | 17 (39.5%) |
| Total | 390 (93.1%) | 29 (6.9%) |
Housing Structures by Number of Rooms in Bass Lake
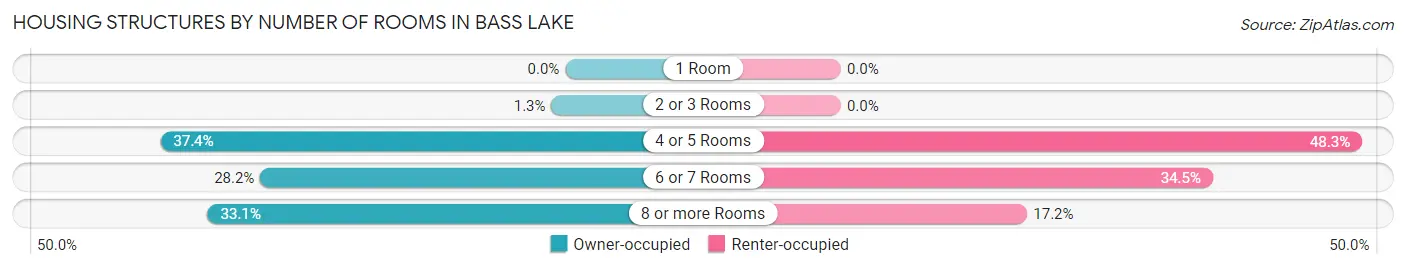
| Number of Rooms | Owner-occupied | Renter-occupied |
| 1 Room | 0 (0.0%) | 0 (0.0%) |
| 2 or 3 Rooms | 5 (1.3%) | 0 (0.0%) |
| 4 or 5 Rooms | 146 (37.4%) | 14 (48.3%) |
| 6 or 7 Rooms | 110 (28.2%) | 10 (34.5%) |
| 8 or more Rooms | 129 (33.1%) | 5 (17.2%) |
| Total | 390 (100.0%) | 29 (100.0%) |
Housing Structure by Heating Type in Bass Lake
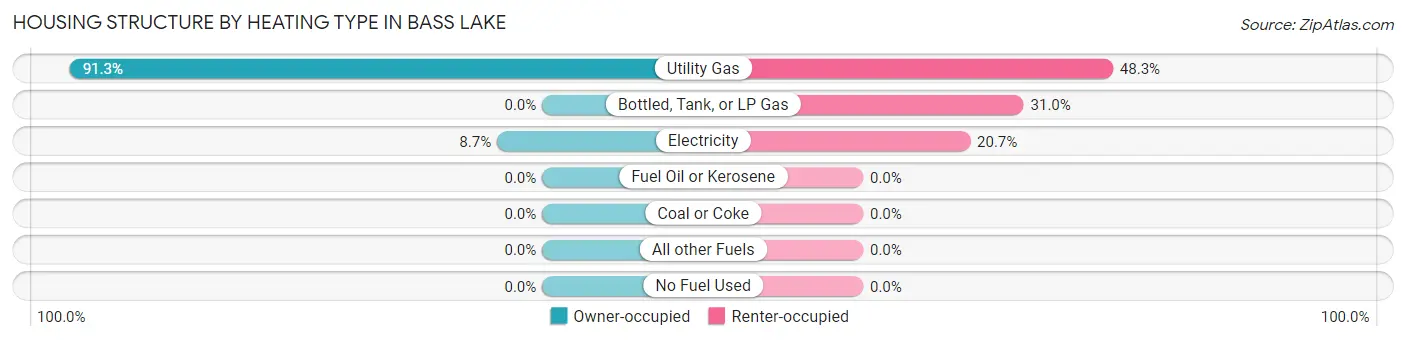
| Heating Type | Owner-occupied | Renter-occupied |
| Utility Gas | 356 (91.3%) | 14 (48.3%) |
| Bottled, Tank, or LP Gas | 0 (0.0%) | 9 (31.0%) |
| Electricity | 34 (8.7%) | 6 (20.7%) |
| Fuel Oil or Kerosene | 0 (0.0%) | 0 (0.0%) |
| Coal or Coke | 0 (0.0%) | 0 (0.0%) |
| All other Fuels | 0 (0.0%) | 0 (0.0%) |
| No Fuel Used | 0 (0.0%) | 0 (0.0%) |
| Total | 390 (100.0%) | 29 (100.0%) |
Household Vehicle Usage in Bass Lake
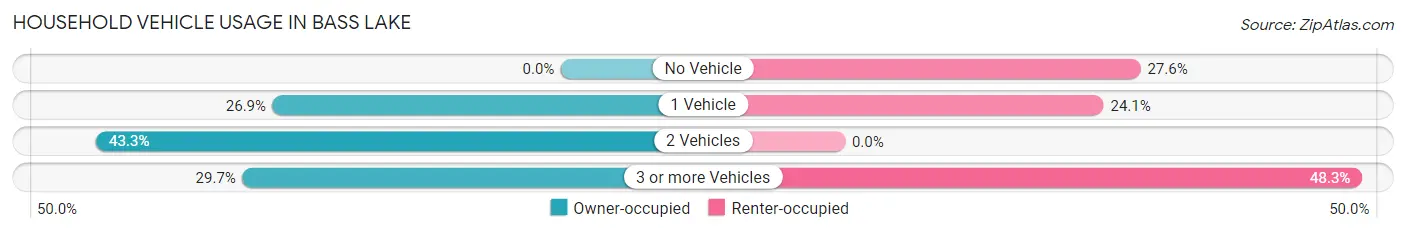
| Vehicles per Household | Owner-occupied | Renter-occupied |
| No Vehicle | 0 (0.0%) | 8 (27.6%) |
| 1 Vehicle | 105 (26.9%) | 7 (24.1%) |
| 2 Vehicles | 169 (43.3%) | 0 (0.0%) |
| 3 or more Vehicles | 116 (29.7%) | 14 (48.3%) |
| Total | 390 (100.0%) | 29 (100.0%) |
Real Estate & Mortgages in Bass Lake
Real Estate and Mortgage Overview in Bass Lake
| Characteristic | Without Mortgage | With Mortgage |
| Housing Units | 203 | 187 |
| Median Property Value | $192,400 | $154,500 |
| Median Household Income | $70,331 | $33 |
| Monthly Housing Costs | $434 | $27 |
| Real Estate Taxes | $1,365 | $7 |
Property Value by Mortgage Status in Bass Lake
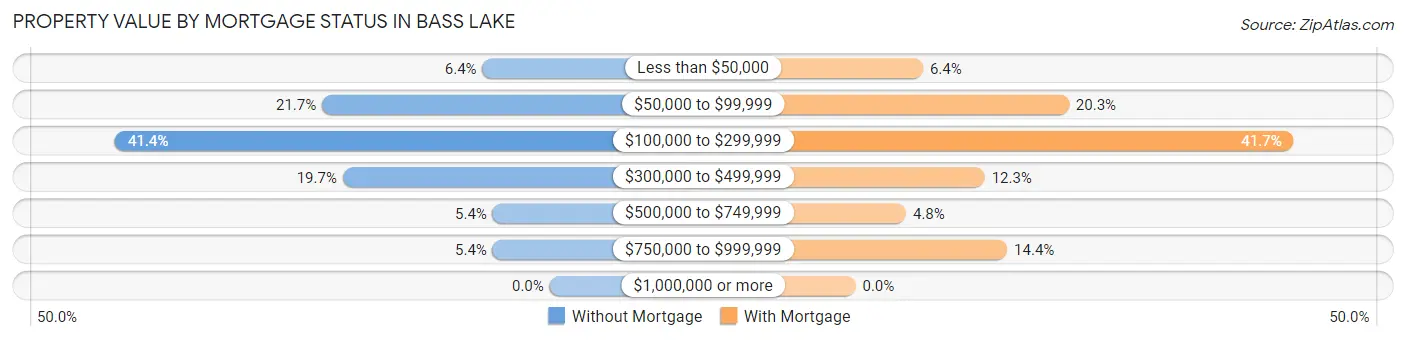
| Property Value | Without Mortgage | With Mortgage |
| Less than $50,000 | 13 (6.4%) | 12 (6.4%) |
| $50,000 to $99,999 | 44 (21.7%) | 38 (20.3%) |
| $100,000 to $299,999 | 84 (41.4%) | 78 (41.7%) |
| $300,000 to $499,999 | 40 (19.7%) | 23 (12.3%) |
| $500,000 to $749,999 | 11 (5.4%) | 9 (4.8%) |
| $750,000 to $999,999 | 11 (5.4%) | 27 (14.4%) |
| $1,000,000 or more | 0 (0.0%) | 0 (0.0%) |
| Total | 203 (100.0%) | 187 (100.0%) |
Household Income by Mortgage Status in Bass Lake
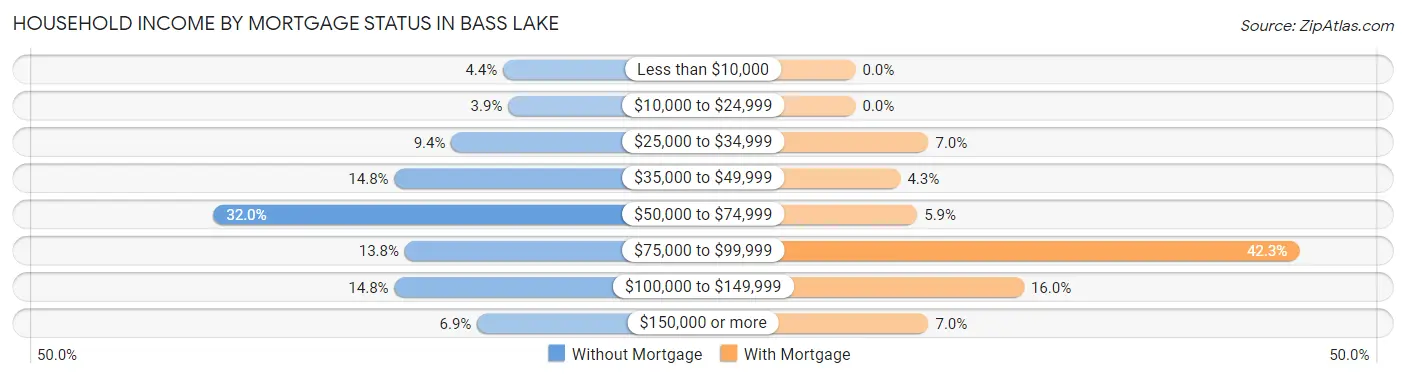
| Household Income | Without Mortgage | With Mortgage |
| Less than $10,000 | 9 (4.4%) | 0 (0.0%) |
| $10,000 to $24,999 | 8 (3.9%) | 0 (0.0%) |
| $25,000 to $34,999 | 19 (9.4%) | 13 (7.0%) |
| $35,000 to $49,999 | 30 (14.8%) | 8 (4.3%) |
| $50,000 to $74,999 | 65 (32.0%) | 11 (5.9%) |
| $75,000 to $99,999 | 28 (13.8%) | 79 (42.2%) |
| $100,000 to $149,999 | 30 (14.8%) | 30 (16.0%) |
| $150,000 or more | 14 (6.9%) | 13 (7.0%) |
| Total | 203 (100.0%) | 187 (100.0%) |
Property Value to Household Income Ratio in Bass Lake
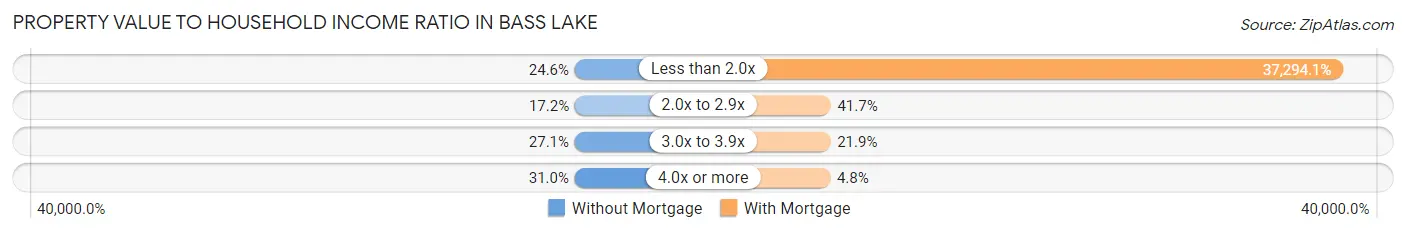
| Value-to-Income Ratio | Without Mortgage | With Mortgage |
| Less than 2.0x | 50 (24.6%) | 69,740 (37,294.1%) |
| 2.0x to 2.9x | 35 (17.2%) | 78 (41.7%) |
| 3.0x to 3.9x | 55 (27.1%) | 41 (21.9%) |
| 4.0x or more | 63 (31.0%) | 9 (4.8%) |
| Total | 203 (100.0%) | 187 (100.0%) |
Real Estate Taxes by Mortgage Status in Bass Lake
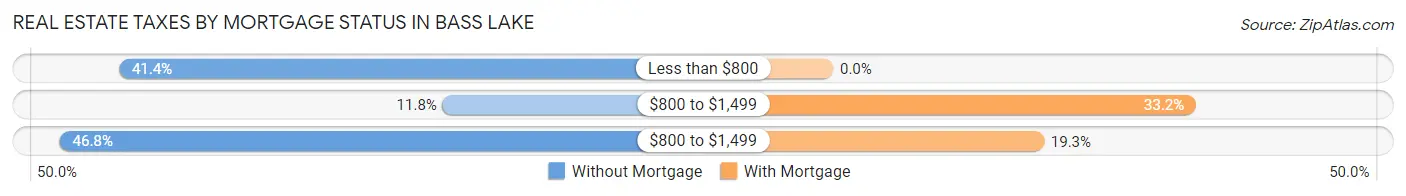
| Property Taxes | Without Mortgage | With Mortgage |
| Less than $800 | 84 (41.4%) | 0 (0.0%) |
| $800 to $1,499 | 24 (11.8%) | 62 (33.2%) |
| $800 to $1,499 | 95 (46.8%) | 36 (19.3%) |
| Total | 203 (100.0%) | 187 (100.0%) |
Health & Disability in Bass Lake
Health Insurance Coverage by Age in Bass Lake
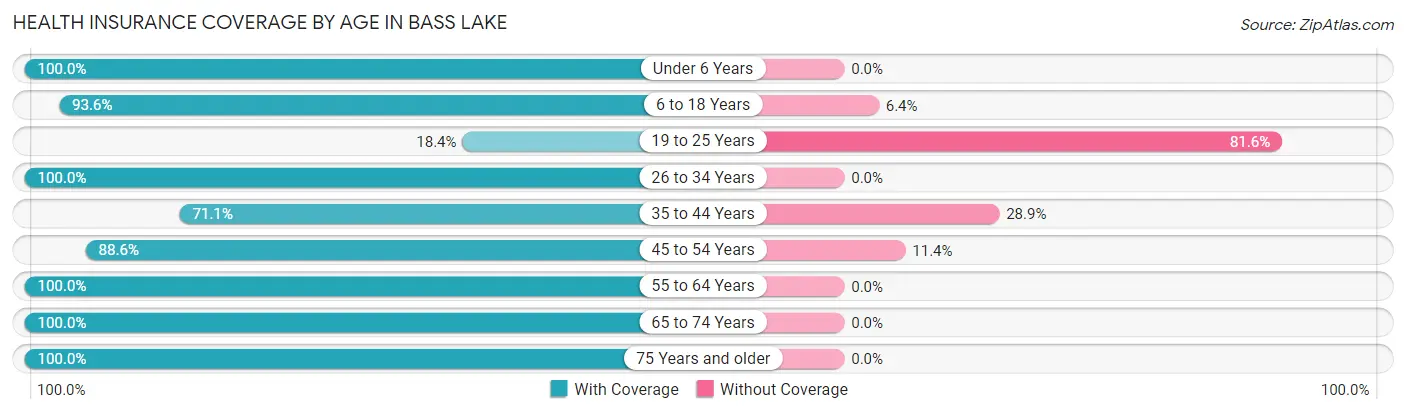
| Age Bracket | With Coverage | Without Coverage |
| Under 6 Years | 56 (100.0%) | 0 (0.0%) |
| 6 to 18 Years | 131 (93.6%) | 9 (6.4%) |
| 19 to 25 Years | 9 (18.4%) | 40 (81.6%) |
| 26 to 34 Years | 28 (100.0%) | 0 (0.0%) |
| 35 to 44 Years | 96 (71.1%) | 39 (28.9%) |
| 45 to 54 Years | 70 (88.6%) | 9 (11.4%) |
| 55 to 64 Years | 215 (100.0%) | 0 (0.0%) |
| 65 to 74 Years | 168 (100.0%) | 0 (0.0%) |
| 75 Years and older | 148 (100.0%) | 0 (0.0%) |
| Total | 921 (90.5%) | 97 (9.5%) |
Health Insurance Coverage by Citizenship Status in Bass Lake
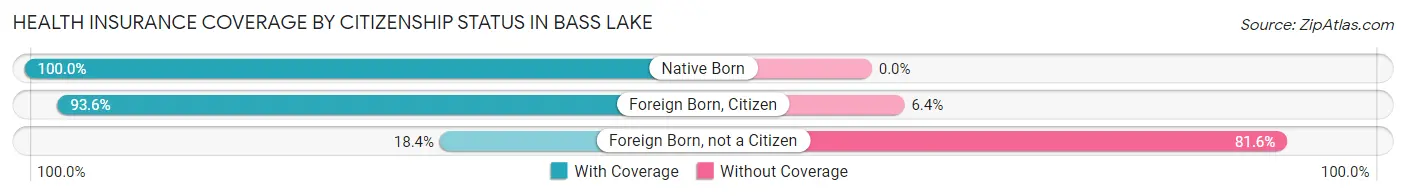
| Citizenship Status | With Coverage | Without Coverage |
| Native Born | 56 (100.0%) | 0 (0.0%) |
| Foreign Born, Citizen | 131 (93.6%) | 9 (6.4%) |
| Foreign Born, not a Citizen | 9 (18.4%) | 40 (81.6%) |
Health Insurance Coverage by Household Income in Bass Lake
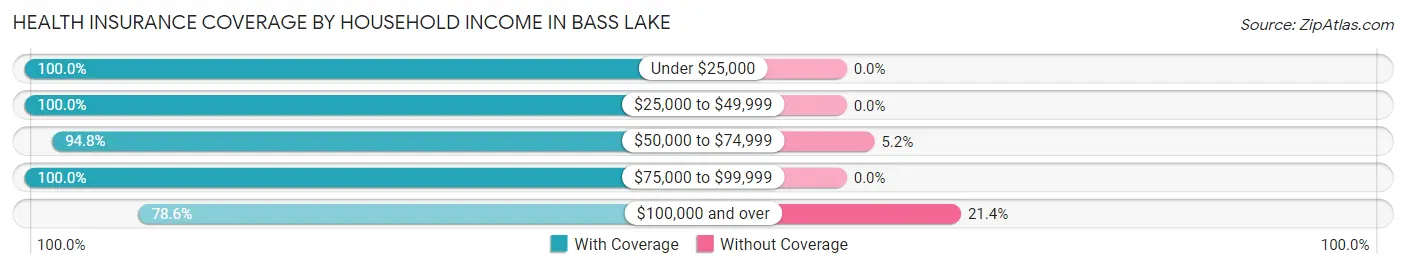
| Household Income | With Coverage | Without Coverage |
| Under $25,000 | 53 (100.0%) | 0 (0.0%) |
| $25,000 to $49,999 | 141 (100.0%) | 0 (0.0%) |
| $50,000 to $74,999 | 311 (94.8%) | 17 (5.2%) |
| $75,000 to $99,999 | 122 (100.0%) | 0 (0.0%) |
| $100,000 and over | 294 (78.6%) | 80 (21.4%) |
Public vs Private Health Insurance Coverage by Age in Bass Lake
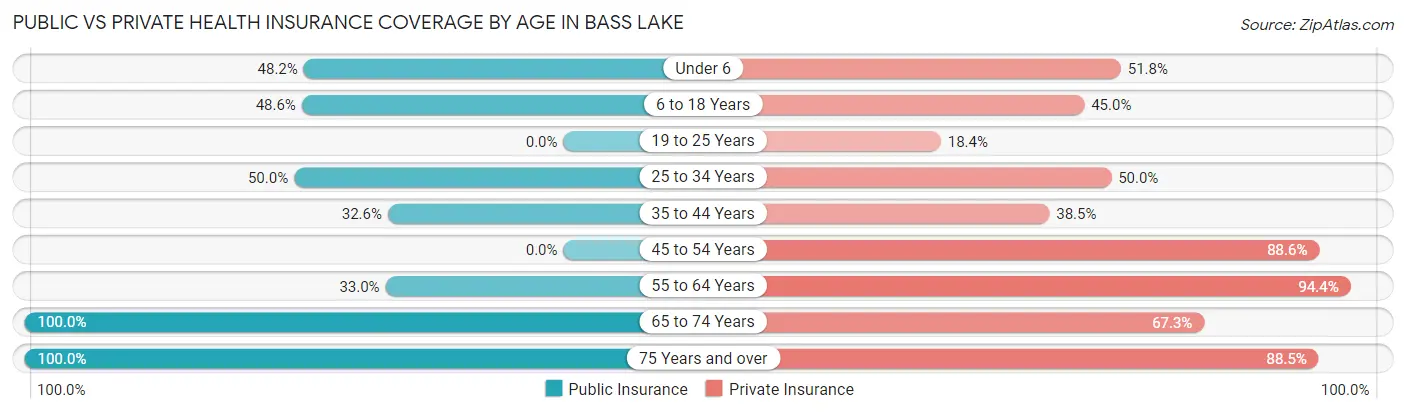
| Age Bracket | Public Insurance | Private Insurance |
| Under 6 | 27 (48.2%) | 29 (51.8%) |
| 6 to 18 Years | 68 (48.6%) | 63 (45.0%) |
| 19 to 25 Years | 0 (0.0%) | 9 (18.4%) |
| 25 to 34 Years | 14 (50.0%) | 14 (50.0%) |
| 35 to 44 Years | 44 (32.6%) | 52 (38.5%) |
| 45 to 54 Years | 0 (0.0%) | 70 (88.6%) |
| 55 to 64 Years | 71 (33.0%) | 203 (94.4%) |
| 65 to 74 Years | 168 (100.0%) | 113 (67.3%) |
| 75 Years and over | 148 (100.0%) | 131 (88.5%) |
| Total | 540 (53.0%) | 684 (67.2%) |
Disability Status by Sex by Age in Bass Lake
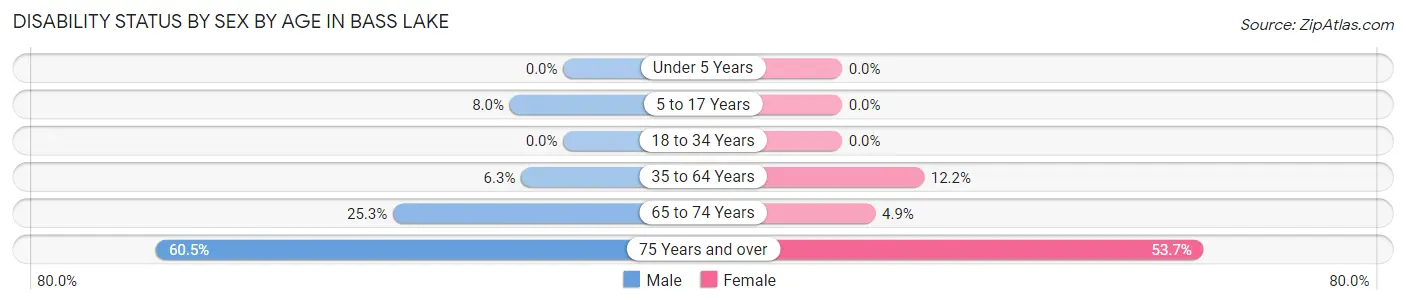
| Age Bracket | Male | Female |
| Under 5 Years | 0 (0.0%) | 0 (0.0%) |
| 5 to 17 Years | 7 (8.0%) | 0 (0.0%) |
| 18 to 34 Years | 0 (0.0%) | 0 (0.0%) |
| 35 to 64 Years | 15 (6.2%) | 23 (12.2%) |
| 65 to 74 Years | 22 (25.3%) | 4 (4.9%) |
| 75 Years and over | 49 (60.5%) | 36 (53.7%) |
Disability Class by Sex by Age in Bass Lake
Disability Class: Hearing Difficulty
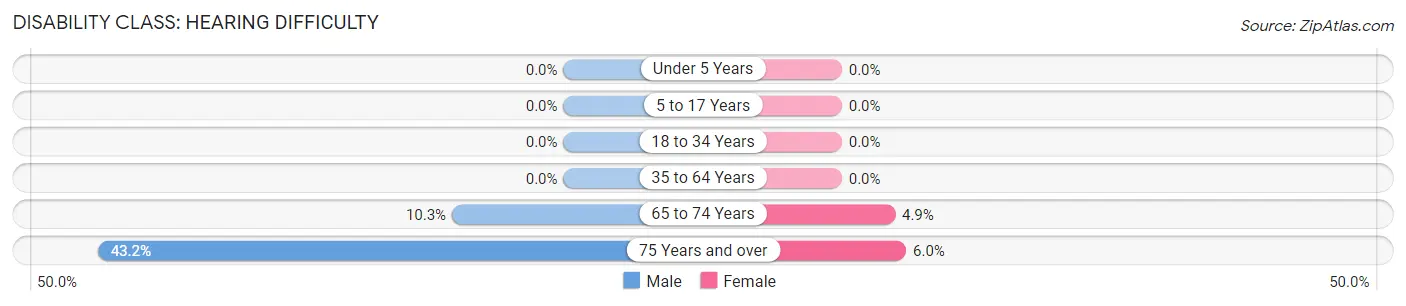
| Age Bracket | Male | Female |
| Under 5 Years | 0 (0.0%) | 0 (0.0%) |
| 5 to 17 Years | 0 (0.0%) | 0 (0.0%) |
| 18 to 34 Years | 0 (0.0%) | 0 (0.0%) |
| 35 to 64 Years | 0 (0.0%) | 0 (0.0%) |
| 65 to 74 Years | 9 (10.3%) | 4 (4.9%) |
| 75 Years and over | 35 (43.2%) | 4 (6.0%) |
Disability Class: Vision Difficulty
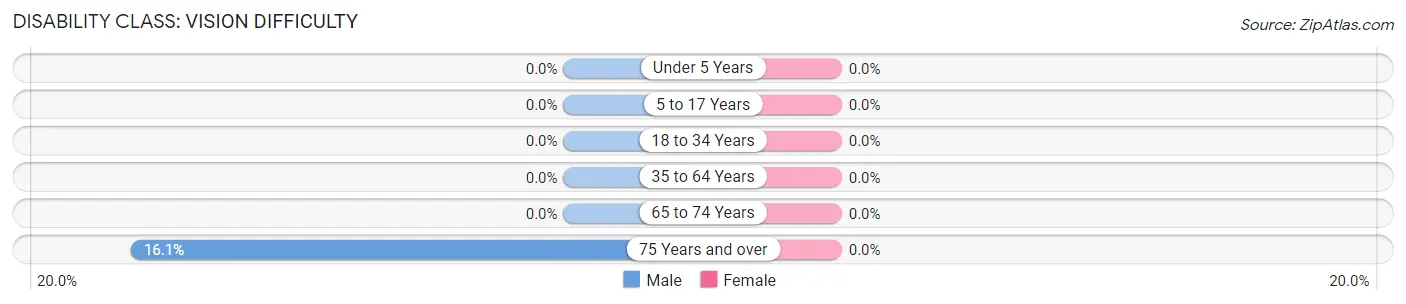
| Age Bracket | Male | Female |
| Under 5 Years | 0 (0.0%) | 0 (0.0%) |
| 5 to 17 Years | 0 (0.0%) | 0 (0.0%) |
| 18 to 34 Years | 0 (0.0%) | 0 (0.0%) |
| 35 to 64 Years | 0 (0.0%) | 0 (0.0%) |
| 65 to 74 Years | 0 (0.0%) | 0 (0.0%) |
| 75 Years and over | 13 (16.1%) | 0 (0.0%) |
Disability Class: Cognitive Difficulty
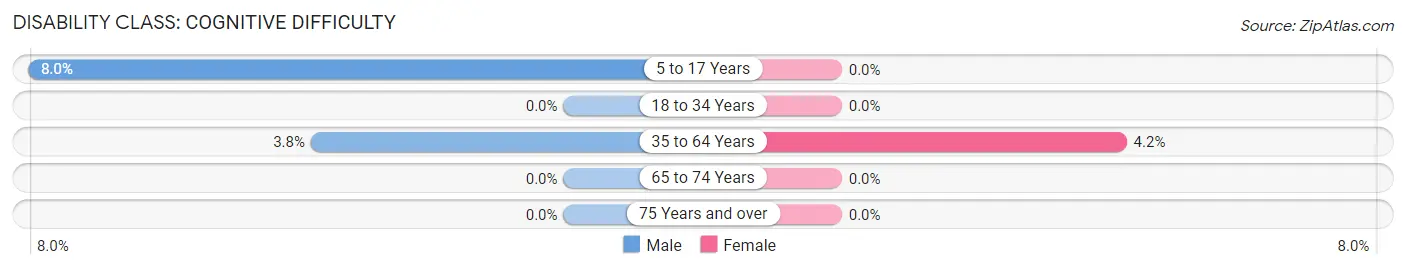
| Age Bracket | Male | Female |
| 5 to 17 Years | 7 (8.0%) | 0 (0.0%) |
| 18 to 34 Years | 0 (0.0%) | 0 (0.0%) |
| 35 to 64 Years | 9 (3.7%) | 8 (4.2%) |
| 65 to 74 Years | 0 (0.0%) | 0 (0.0%) |
| 75 Years and over | 0 (0.0%) | 0 (0.0%) |
Disability Class: Ambulatory Difficulty
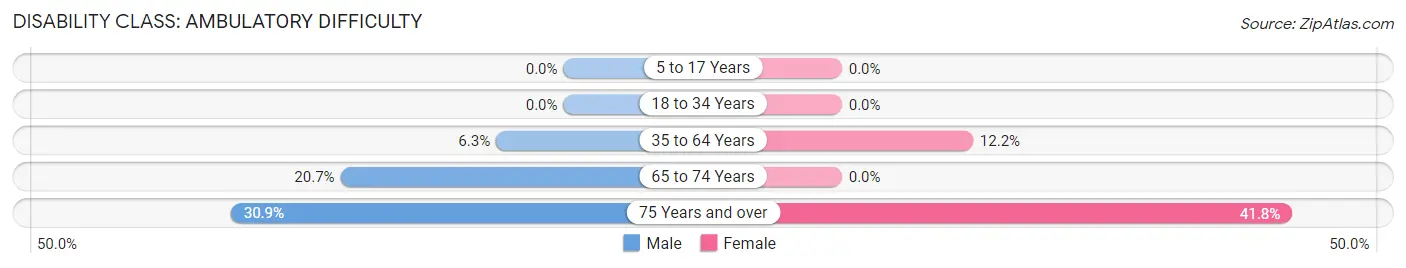
| Age Bracket | Male | Female |
| 5 to 17 Years | 0 (0.0%) | 0 (0.0%) |
| 18 to 34 Years | 0 (0.0%) | 0 (0.0%) |
| 35 to 64 Years | 15 (6.2%) | 23 (12.2%) |
| 65 to 74 Years | 18 (20.7%) | 0 (0.0%) |
| 75 Years and over | 25 (30.9%) | 28 (41.8%) |
Disability Class: Self-Care Difficulty
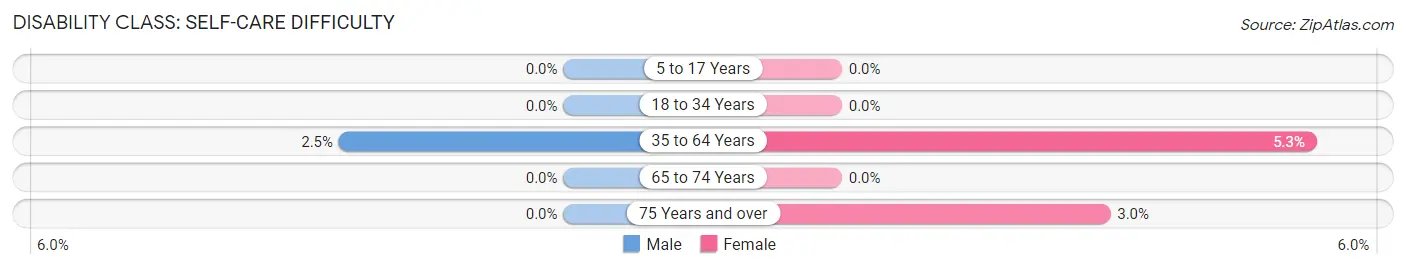
| Age Bracket | Male | Female |
| 5 to 17 Years | 0 (0.0%) | 0 (0.0%) |
| 18 to 34 Years | 0 (0.0%) | 0 (0.0%) |
| 35 to 64 Years | 6 (2.5%) | 10 (5.3%) |
| 65 to 74 Years | 0 (0.0%) | 0 (0.0%) |
| 75 Years and over | 0 (0.0%) | 2 (3.0%) |
Technology Access in Bass Lake
Computing Device Access in Bass Lake
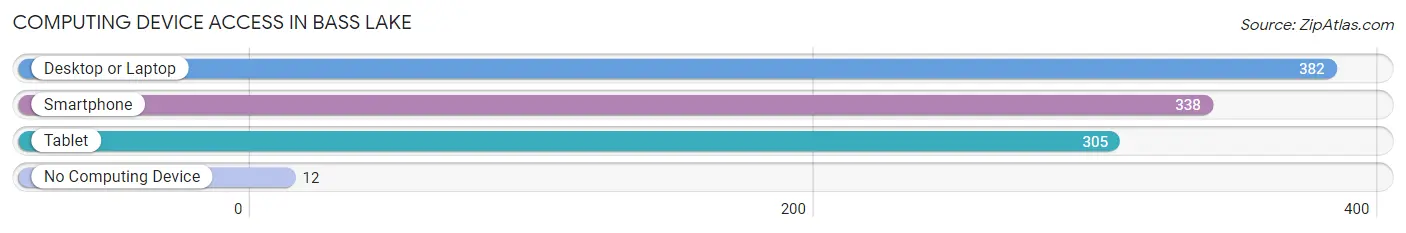
| Device Type | # Households | % Households |
| Desktop or Laptop | 382 | 91.2% |
| Smartphone | 338 | 80.7% |
| Tablet | 305 | 72.8% |
| No Computing Device | 12 | 2.9% |
| Total | 419 | 100.0% |
Internet Access in Bass Lake
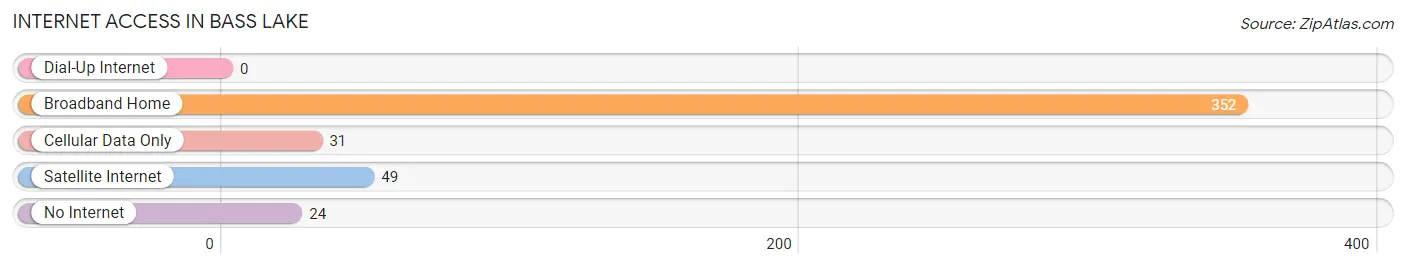
| Internet Type | # Households | % Households |
| Dial-Up Internet | 0 | 0.0% |
| Broadband Home | 352 | 84.0% |
| Cellular Data Only | 31 | 7.4% |
| Satellite Internet | 49 | 11.7% |
| No Internet | 24 | 5.7% |
| Total | 419 | 100.0% |
Bass Lake Summary
Bass Lake is a small town located in the state of Indiana, in the United States of America. It is situated in the northern part of the state, in the county of Porter. The town is located on the shores of Bass Lake, a small lake that is part of the Kankakee River watershed. The town has a population of approximately 1,500 people, and is a popular tourist destination due to its proximity to the lake and its many recreational activities.
History
The area around Bass Lake has been inhabited for thousands of years, with evidence of human activity dating back to the Paleo-Indian period. The first European settlers arrived in the area in the early 1800s, and the town of Bass Lake was officially founded in 1837. The town was named after the lake, which was named after a local Native American chief.
The town grew slowly over the next few decades, and by the late 1800s it had become a popular tourist destination. The town was home to several resorts, and the lake was a popular spot for fishing and boating. The town also had a thriving lumber industry, and the surrounding forests were home to several sawmills.
In the early 1900s, the town began to decline as the lumber industry moved away and the resorts closed. The town was revitalized in the 1950s, when the state of Indiana began to promote the area as a tourist destination. The town has since become a popular spot for fishing, boating, and other outdoor activities.
Geography
Bass Lake is located in the northern part of the state of Indiana, in the county of Porter. The town is situated on the shores of Bass Lake, a small lake that is part of the Kankakee River watershed. The lake is approximately 1,000 acres in size, and is a popular spot for fishing and boating. The town is surrounded by forests, and is home to several parks and nature preserves.
The town is located approximately 40 miles from the city of Chicago, and is accessible by car via Interstate 65. The nearest major airport is located in Chicago, and the town is served by several smaller airports in the area.
Economy
The economy of Bass Lake is largely based on tourism. The town is a popular destination for fishing, boating, and other outdoor activities. The town is also home to several resorts and hotels, as well as restaurants and other businesses catering to tourists. The town is also home to several small businesses, including a lumber mill and a sawmill.
Demographics
As of the 2010 census, the population of Bass Lake was 1,500 people. The town is predominantly white, with approximately 95% of the population identifying as such. The median household income is approximately $45,000, and the median home value is approximately $150,000. The town has a low unemployment rate, and the majority of the population is employed in the tourism and hospitality industry.
Common Questions
What is Per Capita Income in Bass Lake?
Per Capita income in Bass Lake is $36,565.
What is the Median Family Income in Bass Lake?
Median Family Income in Bass Lake is $82,778.
What is the Median Household income in Bass Lake?
Median Household Income in Bass Lake is $70,110.
What is Income or Wage Gap in Bass Lake?
Income or Wage Gap in Bass Lake is 52.1%.
Women in Bass Lake earn 47.9 cents for every dollar earned by a man.
What is Inequality or Gini Index in Bass Lake?
Inequality or Gini Index in Bass Lake is 0.37.
What is the Total Population of Bass Lake?
Total Population of Bass Lake is 1,018.
What is the Total Male Population of Bass Lake?
Total Male Population of Bass Lake is 590.
What is the Total Female Population of Bass Lake?
Total Female Population of Bass Lake is 428.
What is the Ratio of Males per 100 Females in Bass Lake?
There are 137.85 Males per 100 Females in Bass Lake.
What is the Ratio of Females per 100 Males in Bass Lake?
There are 72.54 Females per 100 Males in Bass Lake.
What is the Median Population Age in Bass Lake?
Median Population Age in Bass Lake is 55.8 Years.
What is the Average Family Size in Bass Lake
Average Family Size in Bass Lake is 3.3 People.
What is the Average Household Size in Bass Lake
Average Household Size in Bass Lake is 2.4 People.
How Large is the Labor Force in Bass Lake?
There are 391 People in the Labor Forcein in Bass Lake.
What is the Percentage of People in the Labor Force in Bass Lake?
46.2% of People are in the Labor Force in Bass Lake.
What is the Unemployment Rate in Bass Lake?
Unemployment Rate in Bass Lake is 11.0%.