Prince s Lakes, IN Map & Demographics
Prince s Lakes Map
Prince s Lakes Overview
$47,793
PER CAPITA INCOME
$102,279
AVG FAMILY INCOME
$88,833
AVG HOUSEHOLD INCOME
18.6%
WAGE / INCOME GAP [ % ]
81.4¢/ $1
WAGE / INCOME GAP [ $ ]
$9,218
FAMILY INCOME DEFICIT
0.34
INEQUALITY / GINI INDEX
1,276
TOTAL POPULATION
590
MALE POPULATION
686
FEMALE POPULATION
86.01
MALES / 100 FEMALES
116.27
FEMALES / 100 MALES
56.1
MEDIAN AGE
2.5
AVG FAMILY SIZE
2.1
AVG HOUSEHOLD SIZE
739
LABOR FORCE [ PEOPLE ]
65.0%
PERCENT IN LABOR FORCE
1.9%
UNEMPLOYMENT RATE
Income in Prince s Lakes
Income Overview in Prince s Lakes
Per Capita Income in Prince s Lakes is $47,793, while median incomes of families and households are $102,279 and $88,833 respectively.
| Characteristic | Number | Measure |
| Per Capita Income | 1,276 | $47,793 |
| Median Family Income | 425 | $102,279 |
| Mean Family Income | 425 | $106,813 |
| Median Household Income | 596 | $88,833 |
| Mean Household Income | 596 | $98,490 |
| Income Deficit | 425 | $9,218 |
| Wage / Income Gap (%) | 1,276 | 18.64% |
| Wage / Income Gap ($) | 1,276 | 81.36¢ per $1 |
| Gini / Inequality Index | 1,276 | 0.34 |
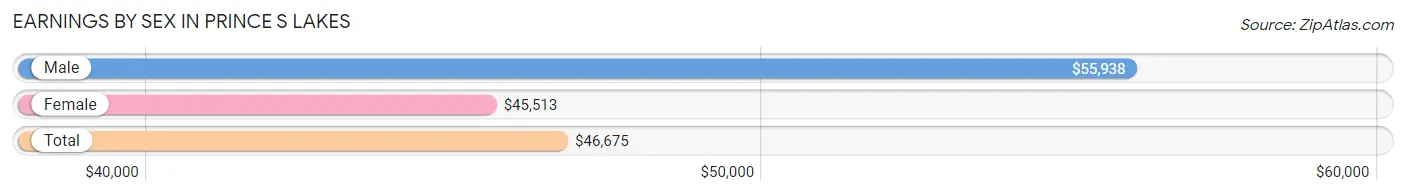
Earnings by Sex in Prince s Lakes
Average Earnings in Prince s Lakes are $46,675, $55,938 for men and $45,513 for women, a difference of 18.6%.
| Sex | Number | Average Earnings |
| Male | 354 (46.1%) | $55,938 |
| Female | 414 (53.9%) | $45,513 |
| Total | 768 (100.0%) | $46,675 |
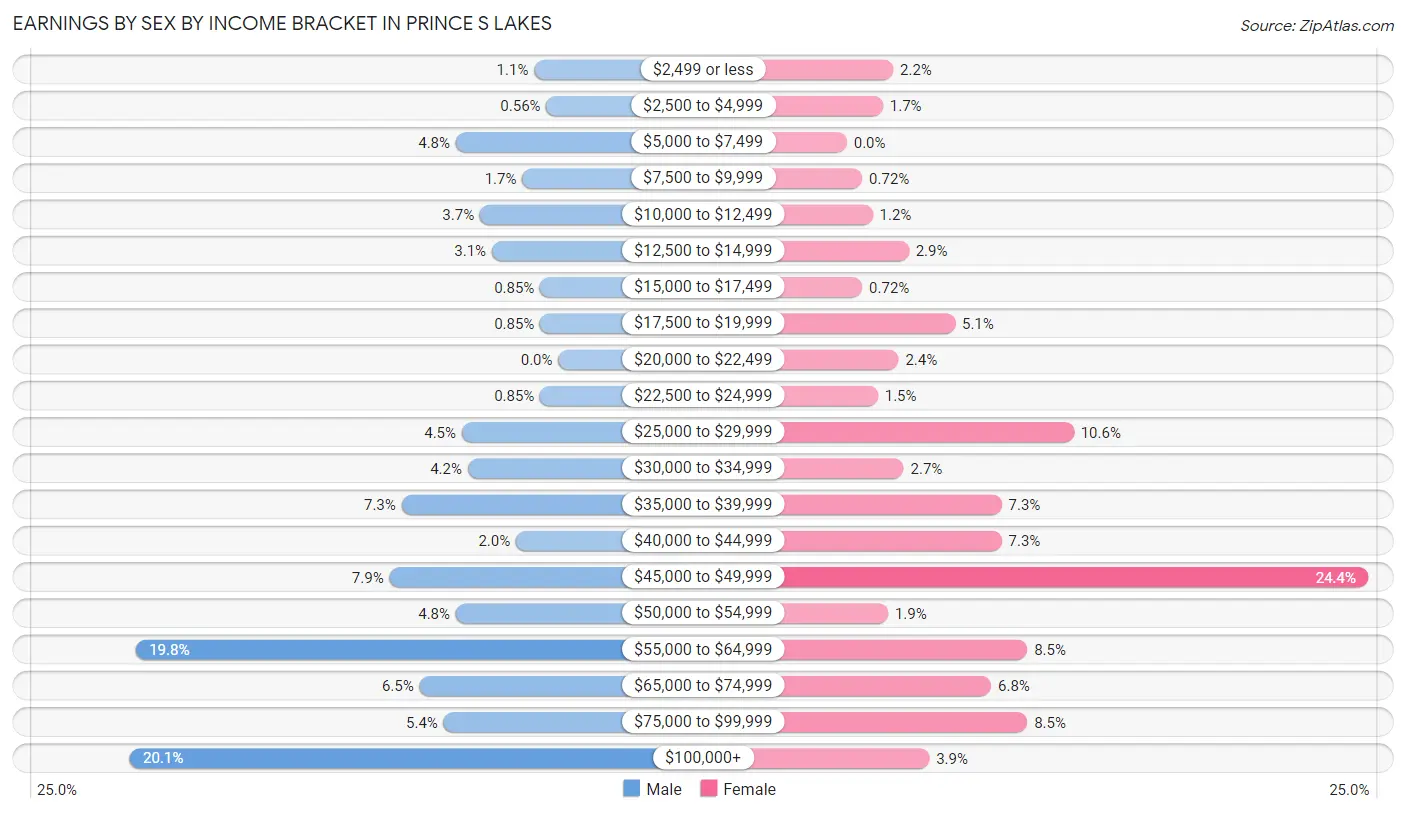
Earnings by Sex by Income Bracket in Prince s Lakes
The most common earnings brackets in Prince s Lakes are $100,000+ for men (71 | 20.1%) and $45,000 to $49,999 for women (101 | 24.4%).
| Income | Male | Female |
| $2,499 or less | 4 (1.1%) | 9 (2.2%) |
| $2,500 to $4,999 | 2 (0.6%) | 7 (1.7%) |
| $5,000 to $7,499 | 17 (4.8%) | 0 (0.0%) |
| $7,500 to $9,999 | 6 (1.7%) | 3 (0.7%) |
| $10,000 to $12,499 | 13 (3.7%) | 5 (1.2%) |
| $12,500 to $14,999 | 11 (3.1%) | 12 (2.9%) |
| $15,000 to $17,499 | 3 (0.9%) | 3 (0.7%) |
| $17,500 to $19,999 | 3 (0.9%) | 21 (5.1%) |
| $20,000 to $22,499 | 0 (0.0%) | 10 (2.4%) |
| $22,500 to $24,999 | 3 (0.9%) | 6 (1.5%) |
| $25,000 to $29,999 | 16 (4.5%) | 44 (10.6%) |
| $30,000 to $34,999 | 15 (4.2%) | 11 (2.7%) |
| $35,000 to $39,999 | 26 (7.3%) | 30 (7.2%) |
| $40,000 to $44,999 | 7 (2.0%) | 30 (7.2%) |
| $45,000 to $49,999 | 28 (7.9%) | 101 (24.4%) |
| $50,000 to $54,999 | 17 (4.8%) | 8 (1.9%) |
| $55,000 to $64,999 | 70 (19.8%) | 35 (8.5%) |
| $65,000 to $74,999 | 23 (6.5%) | 28 (6.8%) |
| $75,000 to $99,999 | 19 (5.4%) | 35 (8.5%) |
| $100,000+ | 71 (20.1%) | 16 (3.9%) |
| Total | 354 (100.0%) | 414 (100.0%) |
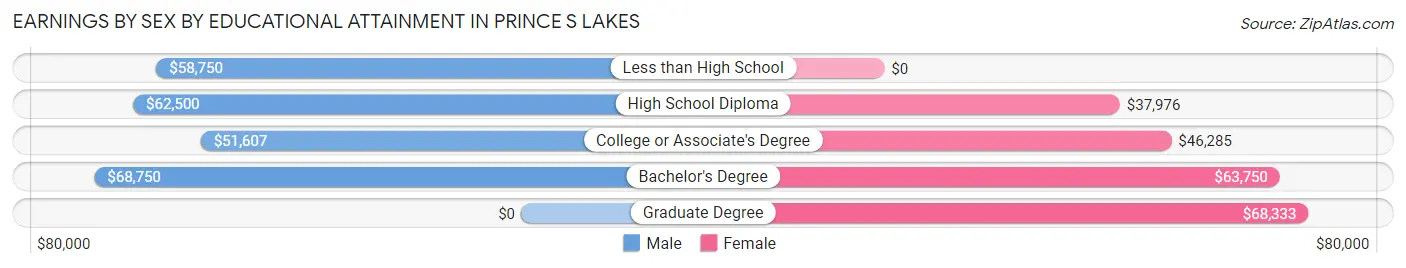
Earnings by Sex by Educational Attainment in Prince s Lakes
Average earnings in Prince s Lakes are $58,125 for men and $45,881 for women, a difference of 21.1%. Men with an educational attainment of bachelor's degree enjoy the highest average annual earnings of $68,750, while those with college or associate's degree education earn the least with $51,607. Women with an educational attainment of graduate degree earn the most with the average annual earnings of $68,333, while those with high school diploma education have the smallest earnings of $37,976.
| Educational Attainment | Male Income | Female Income |
| Less than High School | $58,750 | $0 |
| High School Diploma | $62,500 | $37,976 |
| College or Associate's Degree | $51,607 | $46,285 |
| Bachelor's Degree | $68,750 | $63,750 |
| Graduate Degree | - | - |
| Total | $58,125 | $45,881 |
Family Income in Prince s Lakes
Family Income Brackets in Prince s Lakes
According to the Prince s Lakes family income data, there are 152 families falling into the $100,000 to $149,999 income range, which is the most common income bracket and makes up 35.8% of all families. Conversely, the $10,000 to $14,999 income bracket is the least frequent group with only 2 families (0.5%) belonging to this category.
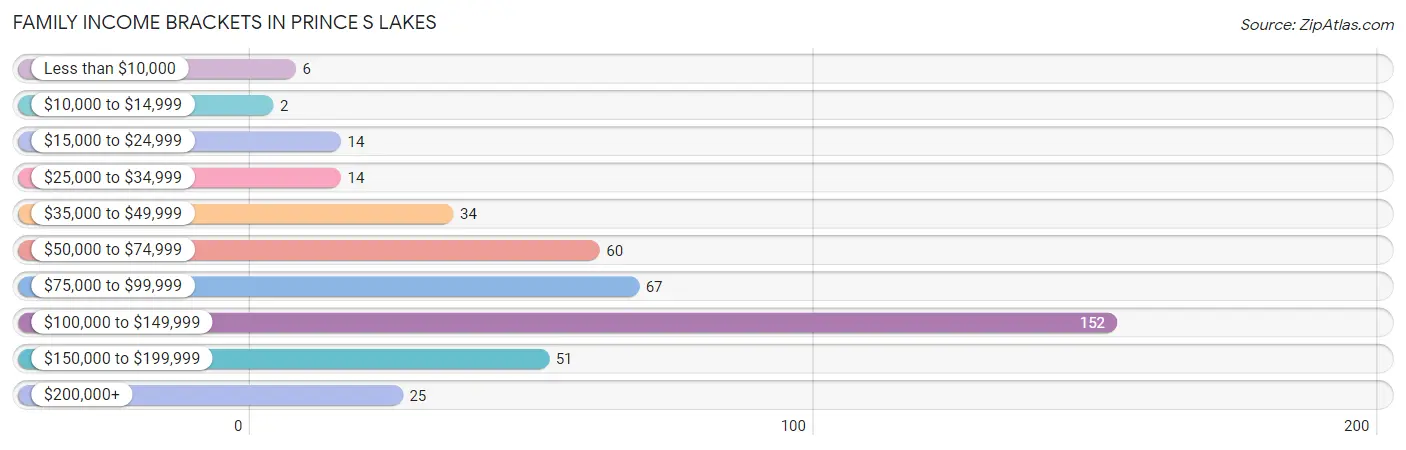
| Income Bracket | # Families | % Families |
| Less than $10,000 | 6 | 1.4% |
| $10,000 to $14,999 | 2 | 0.5% |
| $15,000 to $24,999 | 14 | 3.3% |
| $25,000 to $34,999 | 14 | 3.3% |
| $35,000 to $49,999 | 34 | 8.0% |
| $50,000 to $74,999 | 60 | 14.1% |
| $75,000 to $99,999 | 67 | 15.8% |
| $100,000 to $149,999 | 152 | 35.8% |
| $150,000 to $199,999 | 51 | 12.0% |
| $200,000+ | 25 | 5.9% |
Family Income by Famaliy Size in Prince s Lakes
4-person families (36 | 8.5%) account for the highest median family income in Prince s Lakes with $112,500 per family, while 2-person families (298 | 70.1%) have the highest median income of $50,514 per family member.
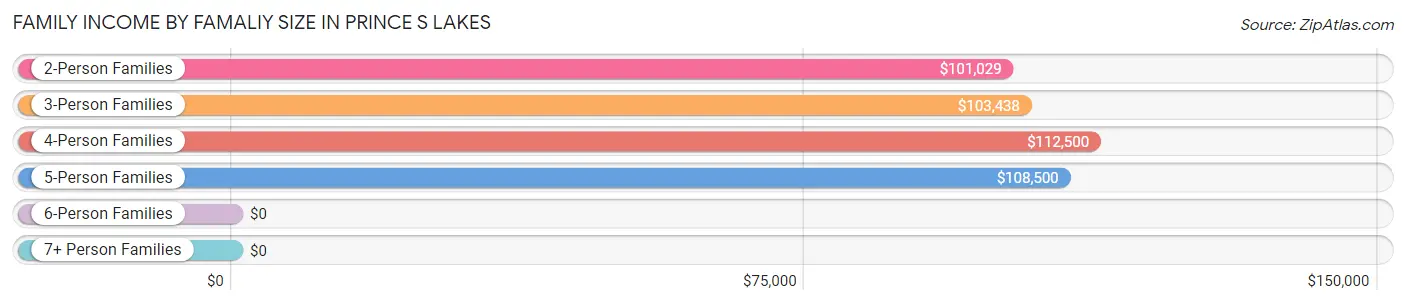
| Income Bracket | # Families | Median Income |
| 2-Person Families | 298 (70.1%) | $101,029 |
| 3-Person Families | 71 (16.7%) | $103,438 |
| 4-Person Families | 36 (8.5%) | $112,500 |
| 5-Person Families | 18 (4.2%) | $108,500 |
| 6-Person Families | 2 (0.5%) | $0 |
| 7+ Person Families | 0 (0.0%) | $0 |
| Total | 425 (100.0%) | $102,279 |
Family Income by Number of Earners in Prince s Lakes
The median family income in Prince s Lakes is $102,279, with families comprising 3+ earners (26) having the highest median family income of $146,250, while families with no earners (82) have the lowest median family income of $49,167, accounting for 6.1% and 19.3% of families, respectively.
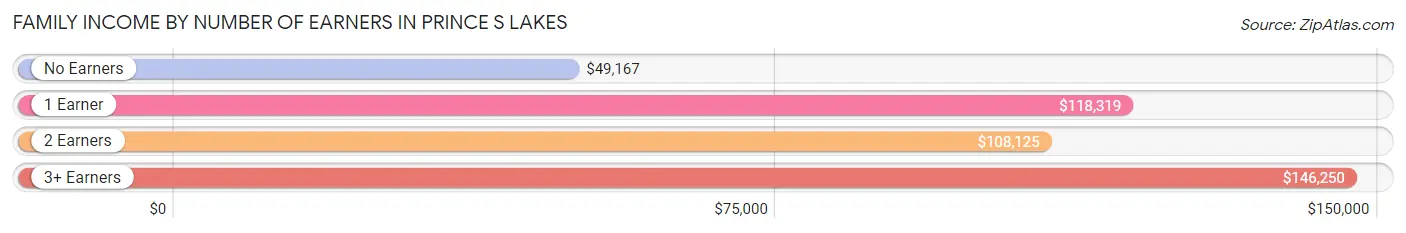
| Number of Earners | # Families | Median Income |
| No Earners | 82 (19.3%) | $49,167 |
| 1 Earner | 136 (32.0%) | $118,319 |
| 2 Earners | 181 (42.6%) | $108,125 |
| 3+ Earners | 26 (6.1%) | $146,250 |
| Total | 425 (100.0%) | $102,279 |
Household Income in Prince s Lakes
Household Income Brackets in Prince s Lakes
With 165 households falling in the category, the $100,000 to $149,999 income range is the most frequent in Prince s Lakes, accounting for 27.7% of all households. In contrast, only 2 households (0.3%) fall into the $10,000 to $14,999 income bracket, making it the least populous group.
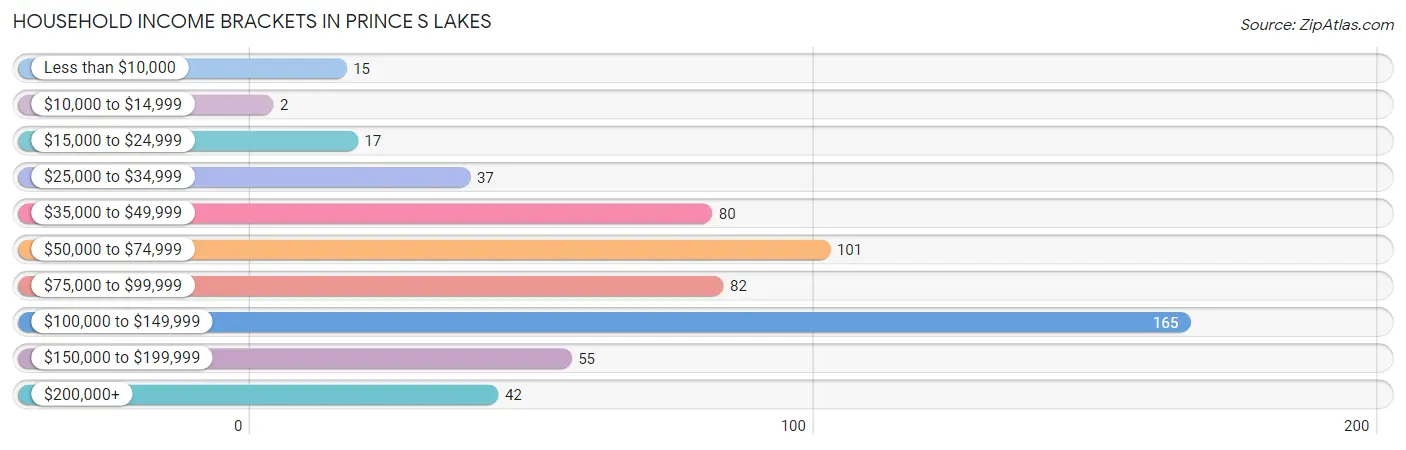
| Income Bracket | # Households | % Households |
| Less than $10,000 | 15 | 2.5% |
| $10,000 to $14,999 | 2 | 0.3% |
| $15,000 to $24,999 | 17 | 2.9% |
| $25,000 to $34,999 | 37 | 6.2% |
| $35,000 to $49,999 | 80 | 13.4% |
| $50,000 to $74,999 | 101 | 16.9% |
| $75,000 to $99,999 | 82 | 13.8% |
| $100,000 to $149,999 | 165 | 27.7% |
| $150,000 to $199,999 | 55 | 9.2% |
| $200,000+ | 42 | 7.0% |
Household Income by Householder Age in Prince s Lakes
The median household income in Prince s Lakes is $88,833, with the highest median household income of $117,750 found in the 45 to 64 years age bracket for the primary householder. A total of 309 households (51.8%) fall into this category. Meanwhile, the 15 to 24 years age bracket for the primary householder has the lowest median household income of $0, with 10 households (1.7%) in this group.
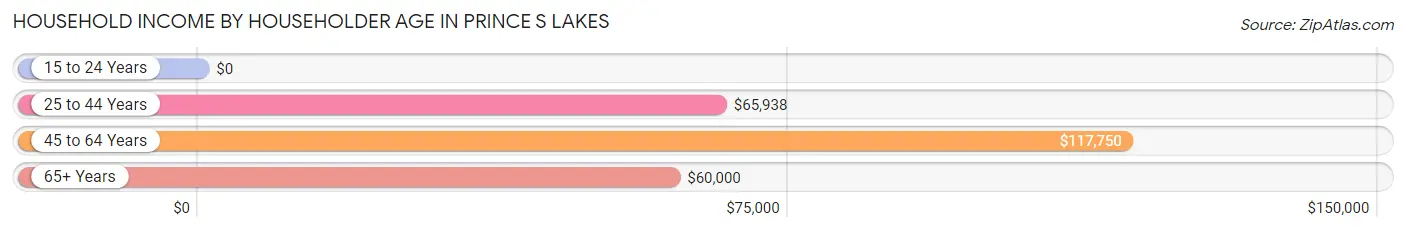
| Income Bracket | # Households | Median Income |
| 15 to 24 Years | 10 (1.7%) | $0 |
| 25 to 44 Years | 109 (18.3%) | $65,938 |
| 45 to 64 Years | 309 (51.8%) | $117,750 |
| 65+ Years | 168 (28.2%) | $60,000 |
| Total | 596 (100.0%) | $88,833 |
Poverty in Prince s Lakes
Income Below Poverty by Sex and Age in Prince s Lakes
With 8.0% poverty level for males and 7.0% for females among the residents of Prince s Lakes, 15 year old males and under 5 year old females are the most vulnerable to poverty, with 3 males (100.0%) and 3 females (23.1%) in their respective age groups living below the poverty level.
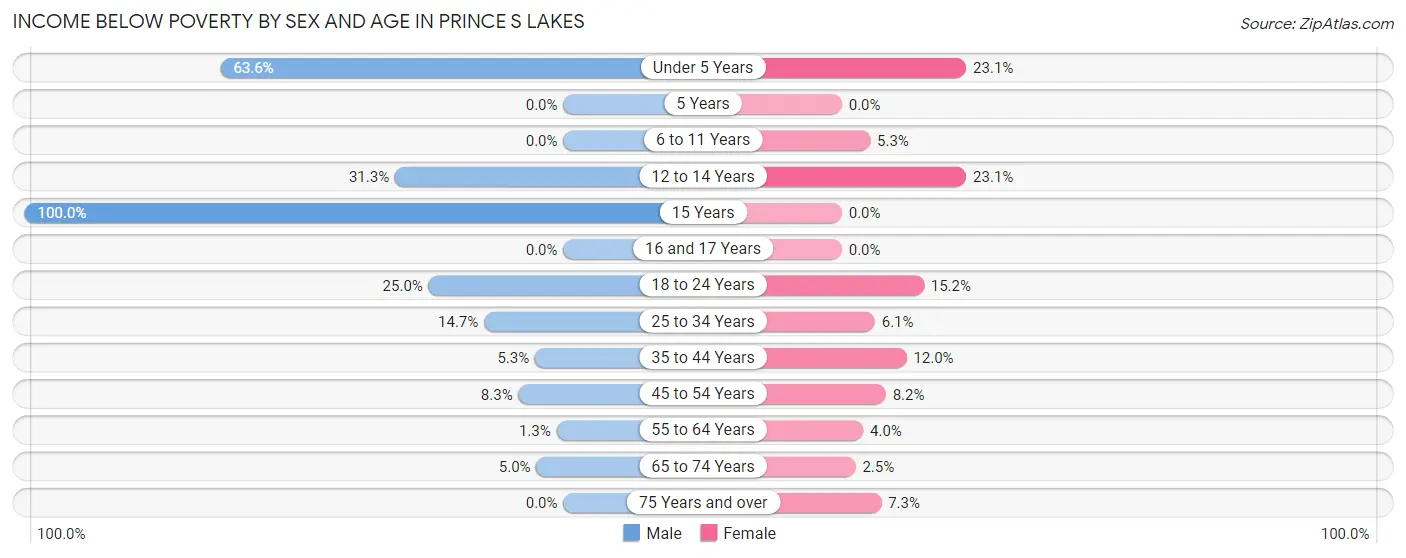
| Age Bracket | Male | Female |
| Under 5 Years | 7 (63.6%) | 3 (23.1%) |
| 5 Years | 0 (0.0%) | 0 (0.0%) |
| 6 to 11 Years | 0 (0.0%) | 2 (5.3%) |
| 12 to 14 Years | 5 (31.2%) | 3 (23.1%) |
| 15 Years | 3 (100.0%) | 0 (0.0%) |
| 16 and 17 Years | 0 (0.0%) | 0 (0.0%) |
| 18 to 24 Years | 9 (25.0%) | 7 (15.2%) |
| 25 to 34 Years | 5 (14.7%) | 3 (6.1%) |
| 35 to 44 Years | 3 (5.3%) | 9 (12.0%) |
| 45 to 54 Years | 6 (8.3%) | 8 (8.2%) |
| 55 to 64 Years | 2 (1.3%) | 7 (4.0%) |
| 65 to 74 Years | 7 (5.0%) | 3 (2.5%) |
| 75 Years and over | 0 (0.0%) | 3 (7.3%) |
| Total | 47 (8.0%) | 48 (7.0%) |
Income Above Poverty by Sex and Age in Prince s Lakes
According to the poverty statistics in Prince s Lakes, males aged 5 years and females aged 5 years are the age groups that are most secure financially, with 100.0% of males and 100.0% of females in these age groups living above the poverty line.
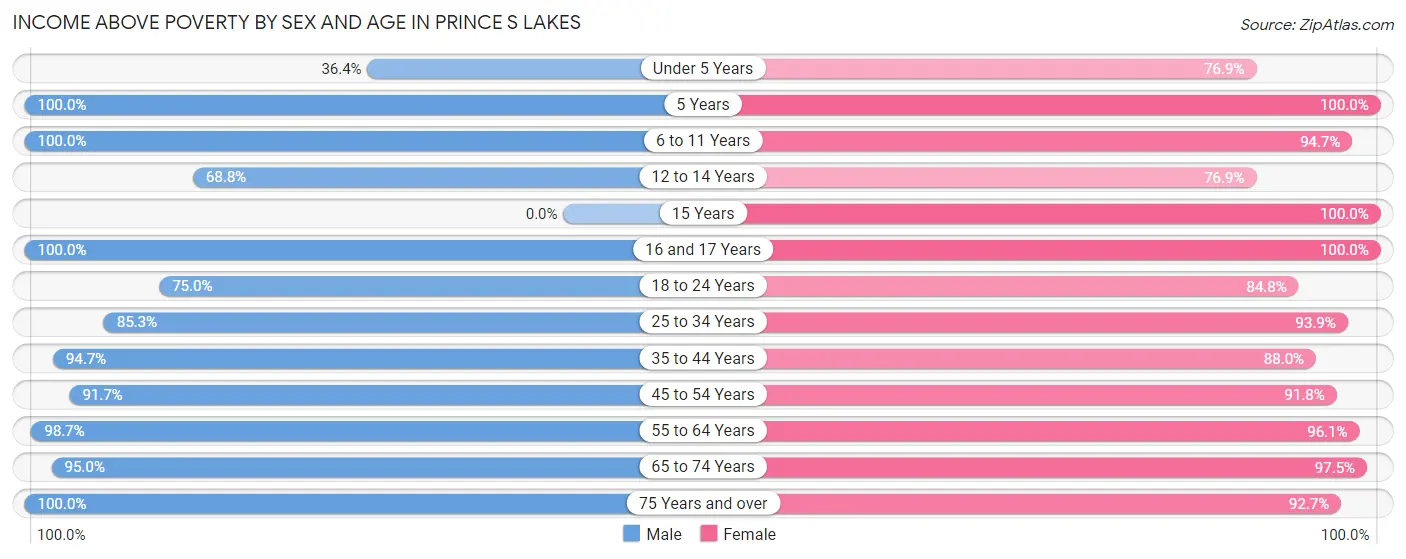
| Age Bracket | Male | Female |
| Under 5 Years | 4 (36.4%) | 10 (76.9%) |
| 5 Years | 3 (100.0%) | 7 (100.0%) |
| 6 to 11 Years | 31 (100.0%) | 36 (94.7%) |
| 12 to 14 Years | 11 (68.8%) | 10 (76.9%) |
| 15 Years | 0 (0.0%) | 3 (100.0%) |
| 16 and 17 Years | 4 (100.0%) | 7 (100.0%) |
| 18 to 24 Years | 27 (75.0%) | 39 (84.8%) |
| 25 to 34 Years | 29 (85.3%) | 46 (93.9%) |
| 35 to 44 Years | 54 (94.7%) | 66 (88.0%) |
| 45 to 54 Years | 66 (91.7%) | 90 (91.8%) |
| 55 to 64 Years | 157 (98.7%) | 170 (96.1%) |
| 65 to 74 Years | 133 (95.0%) | 115 (97.5%) |
| 75 Years and over | 24 (100.0%) | 38 (92.7%) |
| Total | 543 (92.0%) | 637 (93.0%) |
Income Below Poverty Among Married-Couple Families in Prince s Lakes
The poverty statistics for married-couple families in Prince s Lakes show that 5.9% or 22 of the total 376 families live below the poverty line. Families with 1 or 2 children have the highest poverty rate of 22.4%, comprising of 13 families. On the other hand, families with no children have the lowest poverty rate of 2.0%, which includes 6 families.
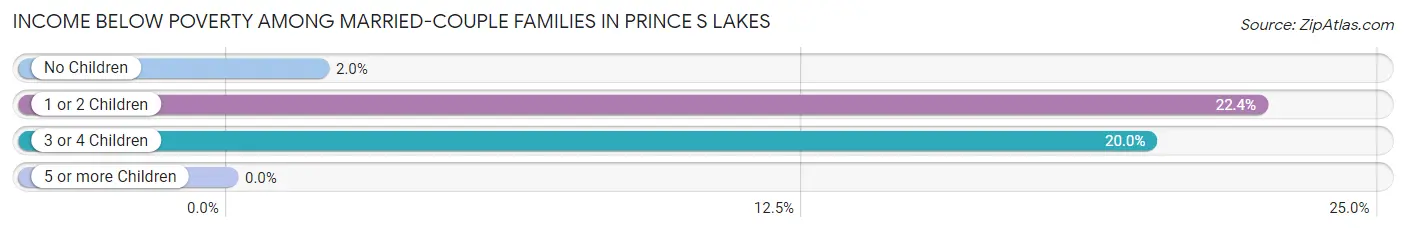
| Children | Above Poverty | Below Poverty |
| No Children | 297 (98.0%) | 6 (2.0%) |
| 1 or 2 Children | 45 (77.6%) | 13 (22.4%) |
| 3 or 4 Children | 12 (80.0%) | 3 (20.0%) |
| 5 or more Children | 0 (0.0%) | 0 (0.0%) |
| Total | 354 (94.2%) | 22 (5.9%) |
Income Below Poverty Among Single-Parent Households in Prince s Lakes
| Children | Single Father | Single Mother |
| No Children | 0 (0.0%) | 0 (0.0%) |
| 1 or 2 Children | 0 (0.0%) | 0 (0.0%) |
| 3 or 4 Children | 0 (0.0%) | 0 (0.0%) |
| 5 or more Children | 0 (0.0%) | 0 (0.0%) |
| Total | 0 (0.0%) | 0 (0.0%) |
Income Below Poverty Among Married-Couple vs Single-Parent Households in Prince s Lakes
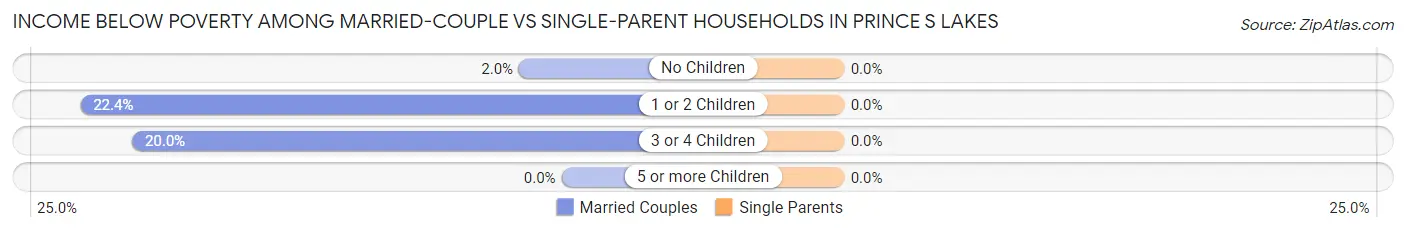
| Children | Married-Couple Families | Single-Parent Households |
| No Children | 6 (2.0%) | 0 (0.0%) |
| 1 or 2 Children | 13 (22.4%) | 0 (0.0%) |
| 3 or 4 Children | 3 (20.0%) | 0 (0.0%) |
| 5 or more Children | 0 (0.0%) | 0 (0.0%) |
| Total | 22 (5.9%) | 0 (0.0%) |
Race in Prince s Lakes
The most populous races in Prince s Lakes are White / Caucasian (1,217 | 95.4%), Two or more Races (36 | 2.8%), and Asian (22 | 1.7%).
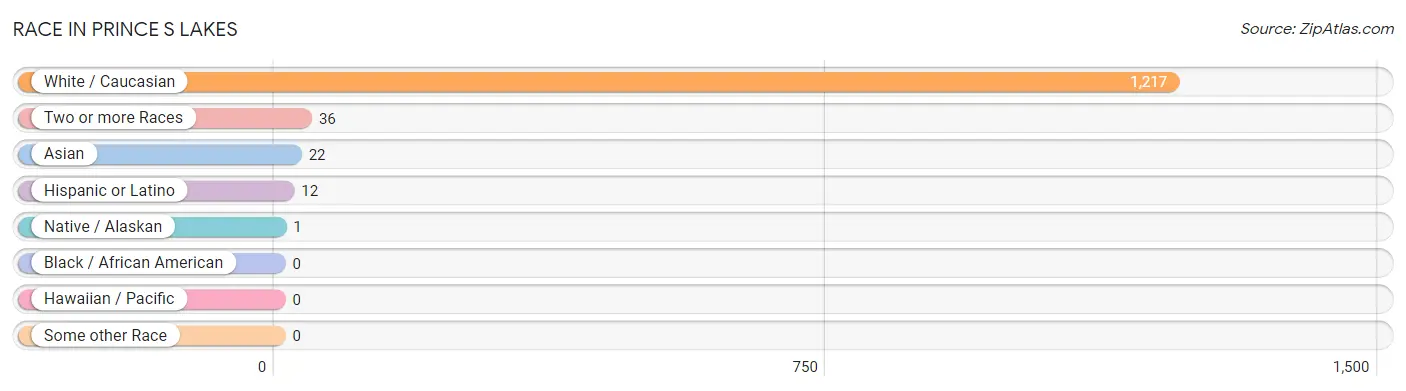
| Race | # Population | % Population |
| Asian | 22 | 1.7% |
| Black / African American | 0 | 0.0% |
| Hawaiian / Pacific | 0 | 0.0% |
| Hispanic or Latino | 12 | 0.9% |
| Native / Alaskan | 1 | 0.1% |
| White / Caucasian | 1,217 | 95.4% |
| Two or more Races | 36 | 2.8% |
| Some other Race | 0 | 0.0% |
| Total | 1,276 | 100.0% |
Ancestry in Prince s Lakes
The most populous ancestries reported in Prince s Lakes are German (262 | 20.5%), Irish (224 | 17.5%), English (149 | 11.7%), American (135 | 10.6%), and French Canadian (61 | 4.8%), together accounting for 65.1% of all Prince s Lakes residents.
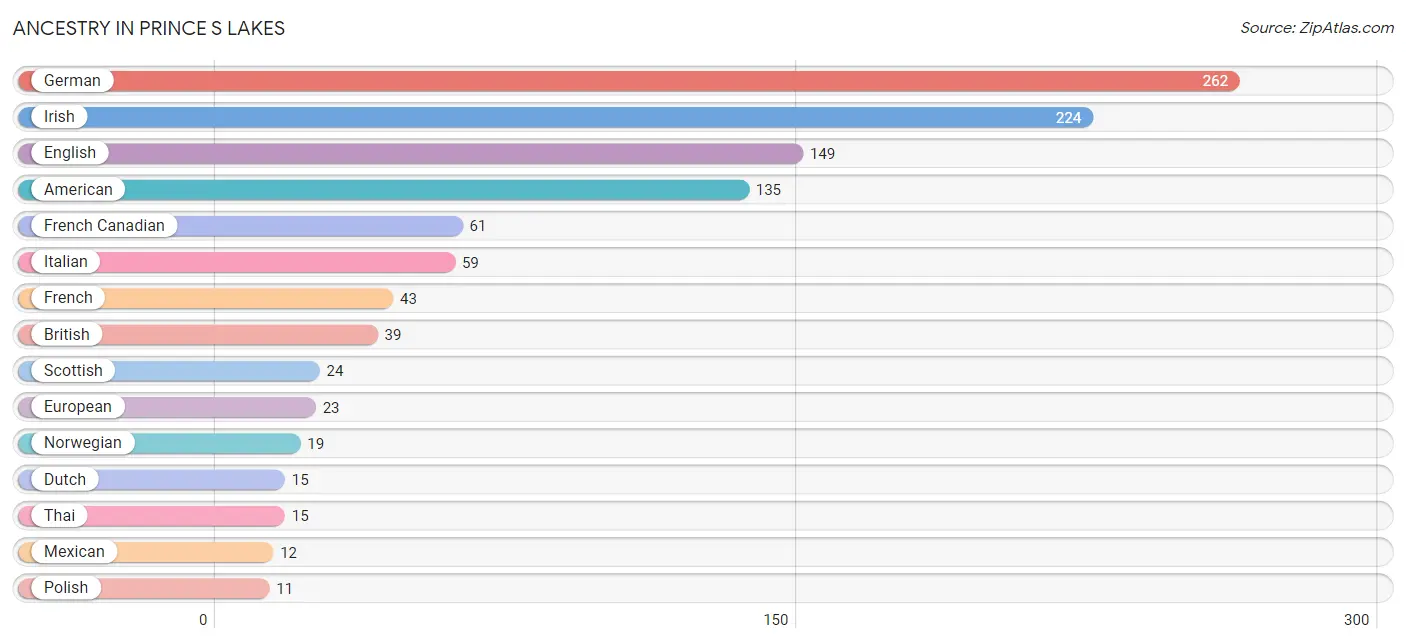
| Ancestry | # Population | % Population |
| American | 135 | 10.6% |
| British | 39 | 3.1% |
| Burmese | 5 | 0.4% |
| Cherokee | 4 | 0.3% |
| Czech | 5 | 0.4% |
| Danish | 7 | 0.5% |
| Delaware | 1 | 0.1% |
| Dutch | 15 | 1.2% |
| English | 149 | 11.7% |
| European | 23 | 1.8% |
| French | 43 | 3.4% |
| French Canadian | 61 | 4.8% |
| German | 262 | 20.5% |
| Greek | 4 | 0.3% |
| Irish | 224 | 17.5% |
| Italian | 59 | 4.6% |
| Korean | 10 | 0.8% |
| Mexican | 12 | 0.9% |
| Northern European | 3 | 0.2% |
| Norwegian | 19 | 1.5% |
| Pennsylvania German | 3 | 0.2% |
| Polish | 11 | 0.9% |
| Russian | 3 | 0.2% |
| Scottish | 24 | 1.9% |
| Slovak | 4 | 0.3% |
| Thai | 15 | 1.2% |
| Welsh | 6 | 0.5% | View All 27 Rows |
Immigrants in Prince s Lakes
The most numerous immigrant groups reported in Prince s Lakes came from Asia (25 | 2.0%), India (15 | 1.2%), South Central Asia (15 | 1.2%), Central America (12 | 0.9%), and Latin America (12 | 0.9%), together accounting for 6.2% of all Prince s Lakes residents.
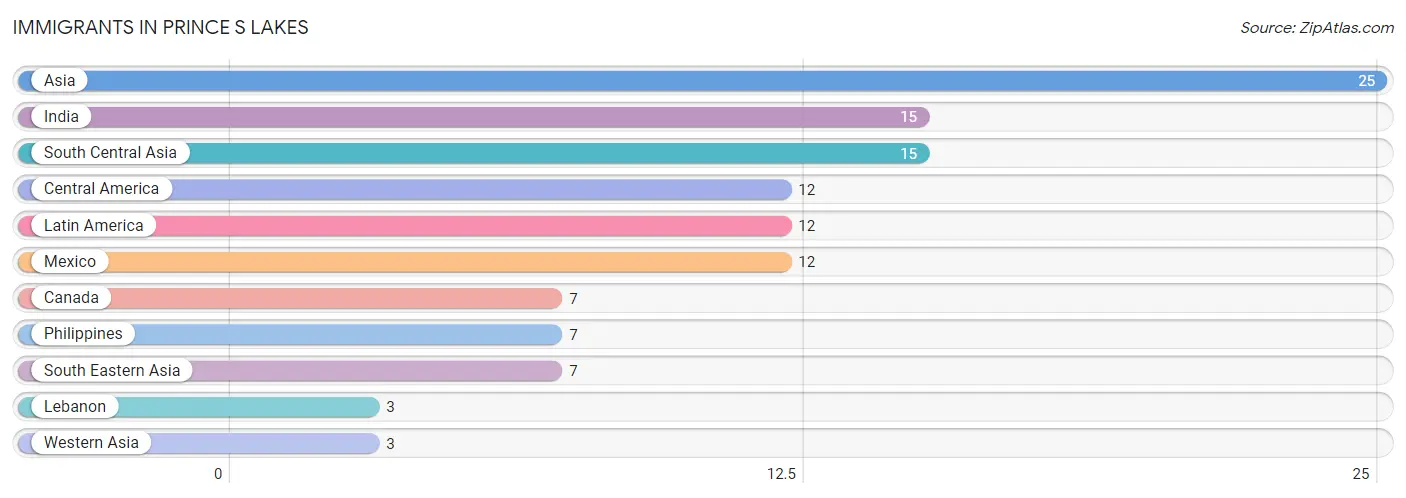
| Immigration Origin | # Population | % Population |
| Asia | 25 | 2.0% |
| Canada | 7 | 0.5% |
| Central America | 12 | 0.9% |
| India | 15 | 1.2% |
| Latin America | 12 | 0.9% |
| Lebanon | 3 | 0.2% |
| Mexico | 12 | 0.9% |
| Philippines | 7 | 0.5% |
| South Central Asia | 15 | 1.2% |
| South Eastern Asia | 7 | 0.5% |
| Western Asia | 3 | 0.2% | View All 11 Rows |
Sex and Age in Prince s Lakes
Sex and Age in Prince s Lakes
The most populous age groups in Prince s Lakes are 65 to 69 Years (91 | 15.4%) for men and 60 to 64 Years (144 | 21.0%) for women.
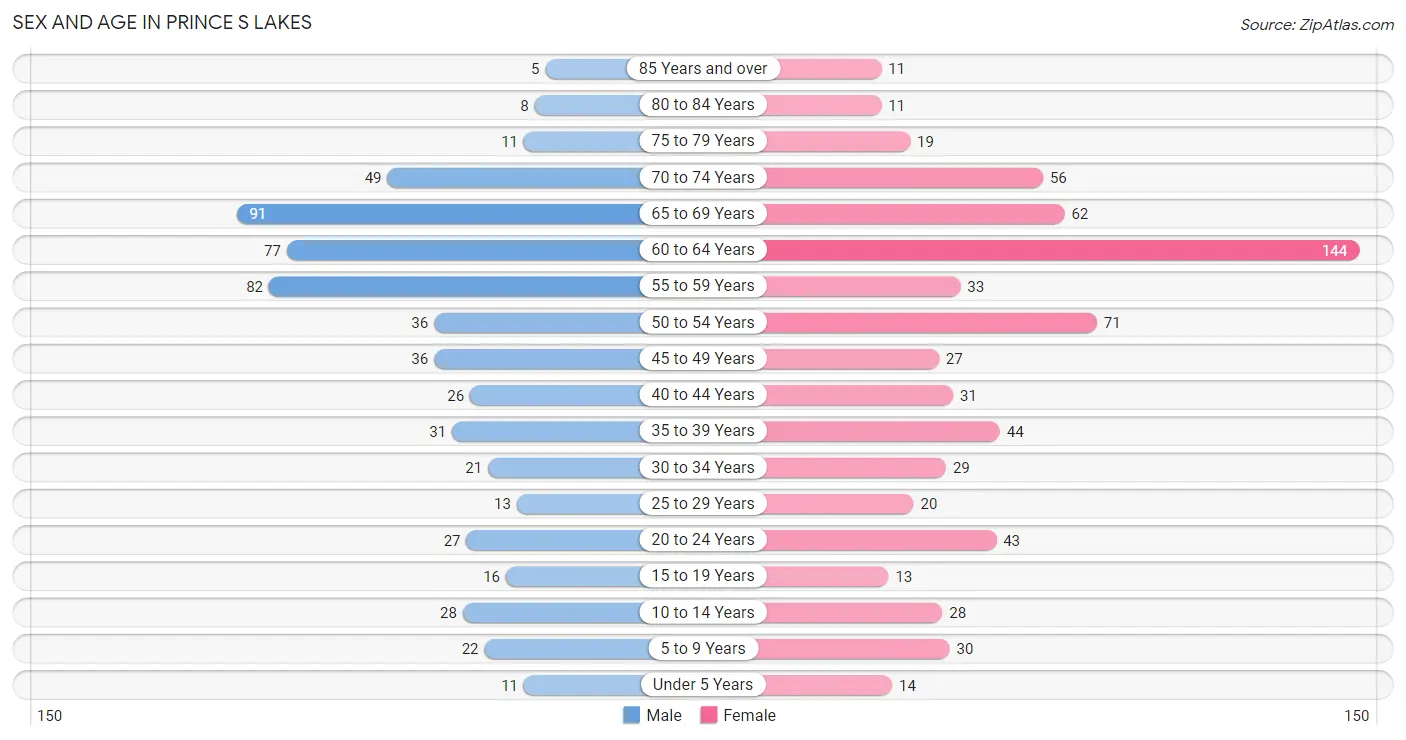
| Age Bracket | Male | Female |
| Under 5 Years | 11 (1.9%) | 14 (2.0%) |
| 5 to 9 Years | 22 (3.7%) | 30 (4.4%) |
| 10 to 14 Years | 28 (4.8%) | 28 (4.1%) |
| 15 to 19 Years | 16 (2.7%) | 13 (1.9%) |
| 20 to 24 Years | 27 (4.6%) | 43 (6.3%) |
| 25 to 29 Years | 13 (2.2%) | 20 (2.9%) |
| 30 to 34 Years | 21 (3.6%) | 29 (4.2%) |
| 35 to 39 Years | 31 (5.2%) | 44 (6.4%) |
| 40 to 44 Years | 26 (4.4%) | 31 (4.5%) |
| 45 to 49 Years | 36 (6.1%) | 27 (3.9%) |
| 50 to 54 Years | 36 (6.1%) | 71 (10.3%) |
| 55 to 59 Years | 82 (13.9%) | 33 (4.8%) |
| 60 to 64 Years | 77 (13.1%) | 144 (21.0%) |
| 65 to 69 Years | 91 (15.4%) | 62 (9.0%) |
| 70 to 74 Years | 49 (8.3%) | 56 (8.2%) |
| 75 to 79 Years | 11 (1.9%) | 19 (2.8%) |
| 80 to 84 Years | 8 (1.4%) | 11 (1.6%) |
| 85 Years and over | 5 (0.9%) | 11 (1.6%) |
| Total | 590 (100.0%) | 686 (100.0%) |
Families and Households in Prince s Lakes
Median Family Size in Prince s Lakes
The median family size in Prince s Lakes is 2.48 persons per family, with single male/father families (15 | 3.5%) accounting for the largest median family size of 3 persons per family. On the other hand, married-couple families (376 | 88.5%) represent the smallest median family size with 2.44 persons per family.
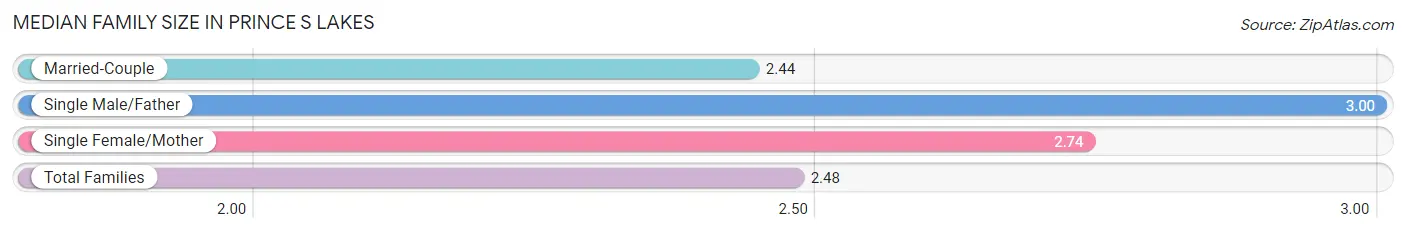
| Family Type | # Families | Family Size |
| Married-Couple | 376 (88.5%) | 2.44 |
| Single Male/Father | 15 (3.5%) | 3.00 |
| Single Female/Mother | 34 (8.0%) | 2.74 |
| Total Families | 425 (100.0%) | 2.48 |
Median Household Size in Prince s Lakes
The median household size in Prince s Lakes is 2.14 persons per household, with single male/father households (15 | 2.5%) accounting for the largest median household size of 3.53 persons per household. non-family households (171 | 28.7%) represent the smallest median household size with 1.09 persons per household.
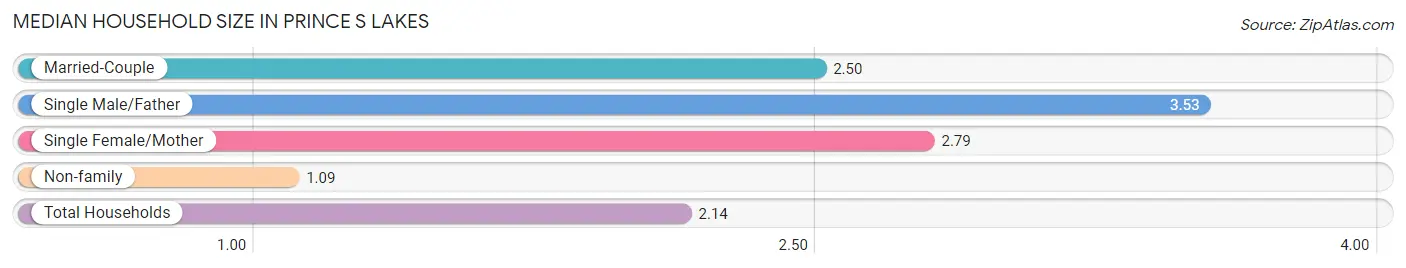
| Household Type | # Households | Household Size |
| Married-Couple | 376 (63.1%) | 2.50 |
| Single Male/Father | 15 (2.5%) | 3.53 |
| Single Female/Mother | 34 (5.7%) | 2.79 |
| Non-family | 171 (28.7%) | 1.09 |
| Total Households | 596 (100.0%) | 2.14 |
Household Size by Marriage Status in Prince s Lakes
Out of a total of 596 households in Prince s Lakes, 425 (71.3%) are family households, while 171 (28.7%) are nonfamily households. The most numerous type of family households are 2-person households, comprising 284, and the most common type of nonfamily households are 1-person households, comprising 158.
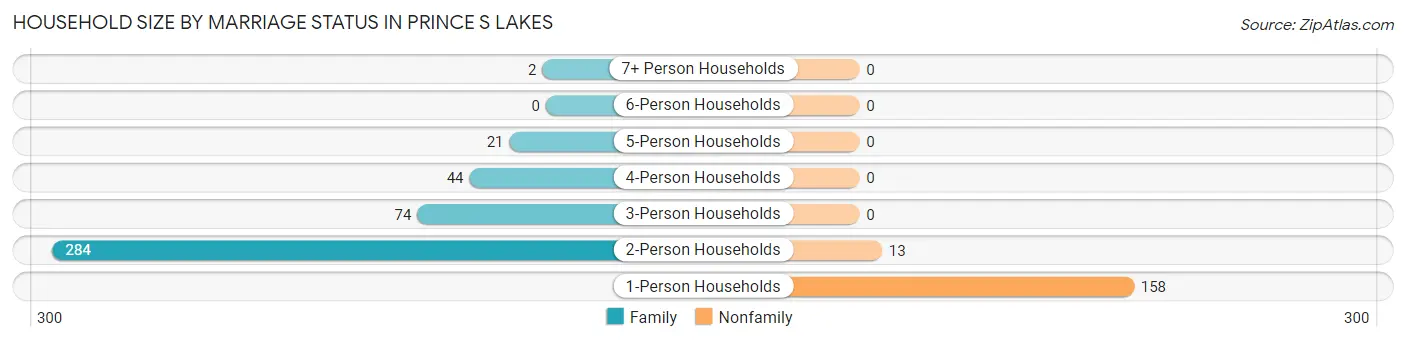
| Household Size | Family Households | Nonfamily Households |
| 1-Person Households | - | 158 (26.5%) |
| 2-Person Households | 284 (47.6%) | 13 (2.2%) |
| 3-Person Households | 74 (12.4%) | 0 (0.0%) |
| 4-Person Households | 44 (7.4%) | 0 (0.0%) |
| 5-Person Households | 21 (3.5%) | 0 (0.0%) |
| 6-Person Households | 0 (0.0%) | 0 (0.0%) |
| 7+ Person Households | 2 (0.3%) | 0 (0.0%) |
| Total | 425 (71.3%) | 171 (28.7%) |
Female Fertility in Prince s Lakes
Fertility by Age in Prince s Lakes
Average fertility rate in Prince s Lakes is 17.0 births per 1,000 women. Women in the age bracket of 20 to 34 years have the highest fertility rate with 43.0 births per 1,000 women. Women in the age bracket of 20 to 34 years acount for 100.0% of all women with births.
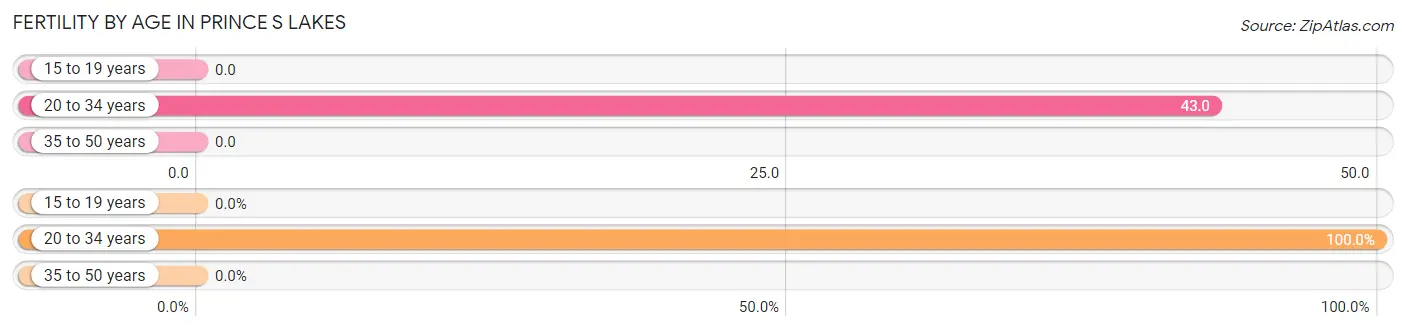
| Age Bracket | Women with Births | Births / 1,000 Women |
| 15 to 19 years | 0 (0.0%) | 0.0 |
| 20 to 34 years | 4 (100.0%) | 43.0 |
| 35 to 50 years | 0 (0.0%) | 0.0 |
| Total | 4 (100.0%) | 17.0 |
Fertility by Age by Marriage Status in Prince s Lakes
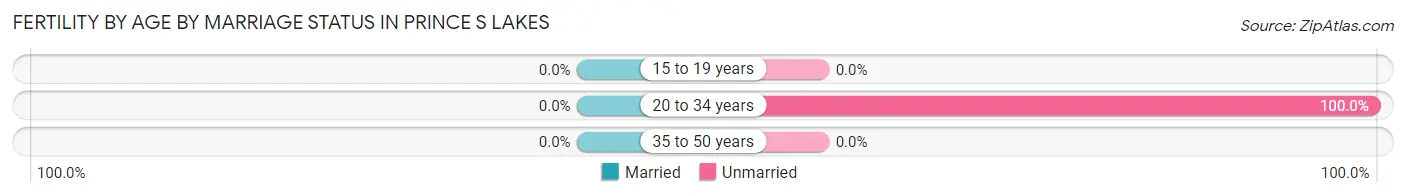
| Age Bracket | Married | Unmarried |
| 15 to 19 years | 0 (0.0%) | 0 (0.0%) |
| 20 to 34 years | 0 (0.0%) | 4 (100.0%) |
| 35 to 50 years | 0 (0.0%) | 0 (0.0%) |
| Total | 0 (0.0%) | 4 (100.0%) |
Fertility by Education in Prince s Lakes
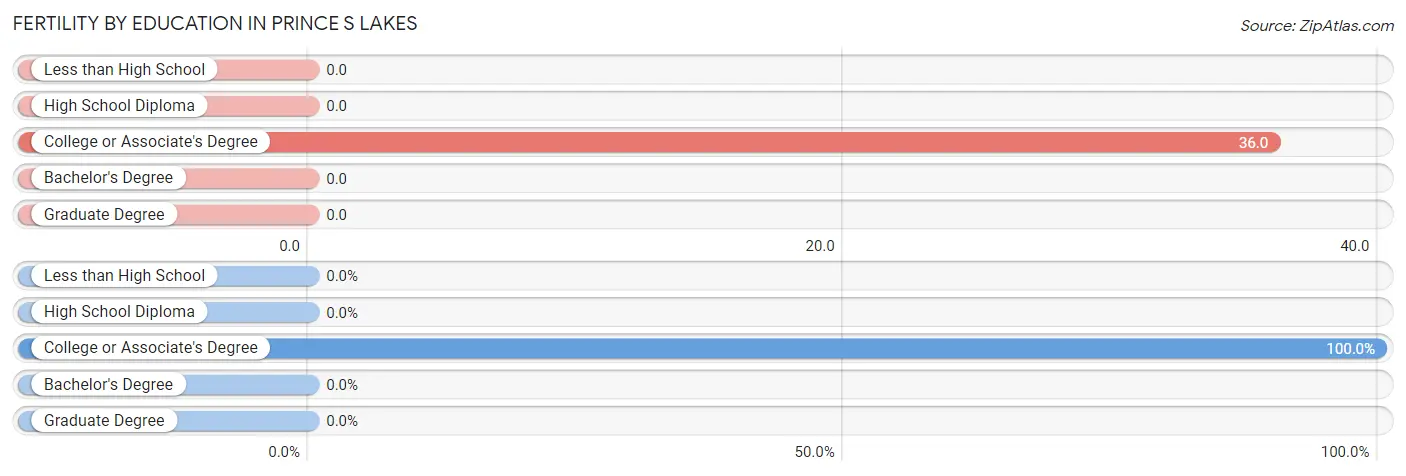
| Educational Attainment | Women with Births | Births / 1,000 Women |
| Less than High School | 0 (0.0%) | 0.0 |
| High School Diploma | 0 (0.0%) | 0.0 |
| College or Associate's Degree | 4 (100.0%) | 36.0 |
| Bachelor's Degree | 0 (0.0%) | 0.0 |
| Graduate Degree | 0 (0.0%) | 0.0 |
| Total | 4 (100.0%) | 17.0 |
Fertility by Education by Marriage Status in Prince s Lakes
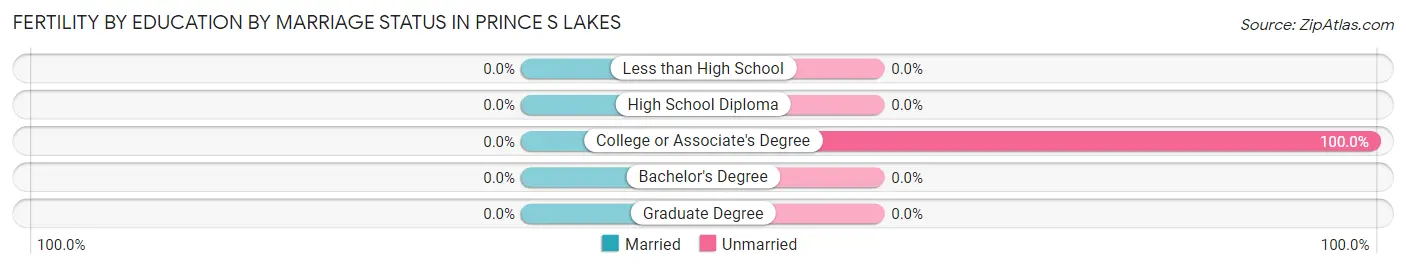
| Educational Attainment | Married | Unmarried |
| Less than High School | 0 (0.0%) | 0 (0.0%) |
| High School Diploma | 0 (0.0%) | 0 (0.0%) |
| College or Associate's Degree | 0 (0.0%) | 4 (100.0%) |
| Bachelor's Degree | 0 (0.0%) | 0 (0.0%) |
| Graduate Degree | 0 (0.0%) | 0 (0.0%) |
| Total | 0 (0.0%) | 4 (100.0%) |
Employment Characteristics in Prince s Lakes
Employment by Class of Employer in Prince s Lakes
Among the 721 employed individuals in Prince s Lakes, private company employees (502 | 69.6%), local government employees (53 | 7.3%), and self-employed (incorporated) (50 | 6.9%) make up the most common classes of employment.
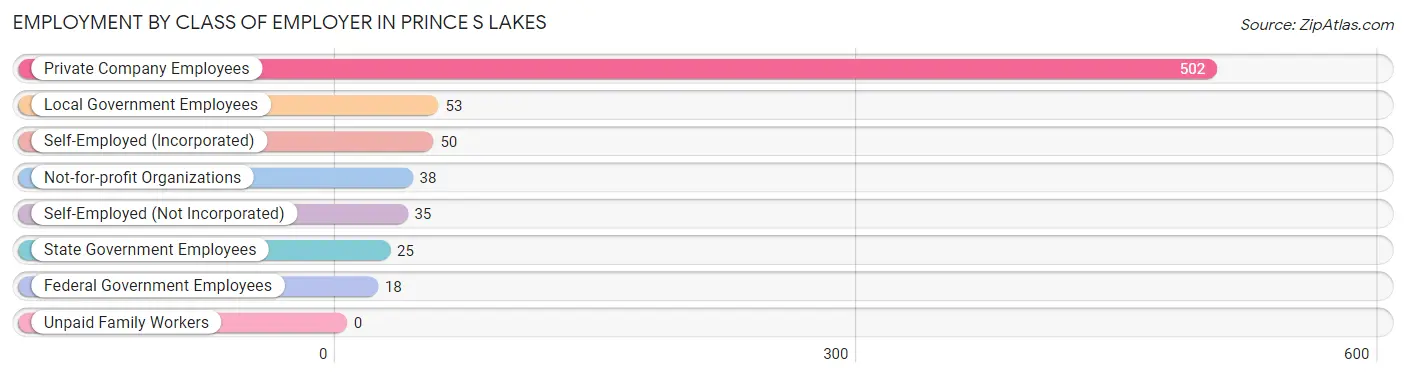
| Employer Class | # Employees | % Employees |
| Private Company Employees | 502 | 69.6% |
| Self-Employed (Incorporated) | 50 | 6.9% |
| Self-Employed (Not Incorporated) | 35 | 4.9% |
| Not-for-profit Organizations | 38 | 5.3% |
| Local Government Employees | 53 | 7.3% |
| State Government Employees | 25 | 3.5% |
| Federal Government Employees | 18 | 2.5% |
| Unpaid Family Workers | 0 | 0.0% |
| Total | 721 | 100.0% |
Employment Status by Age in Prince s Lakes
According to the labor force statistics for Prince s Lakes, out of the total population over 16 years of age (1,137), 65.0% or 739 individuals are in the labor force, with 1.9% or 14 of them unemployed. The age group with the highest labor force participation rate is 25 to 29 years, with 100.0% or 33 individuals in the labor force. Within the labor force, the 75 years and over age range has the highest percentage of unemployed individuals, with 100.0% or 3 of them being unemployed.
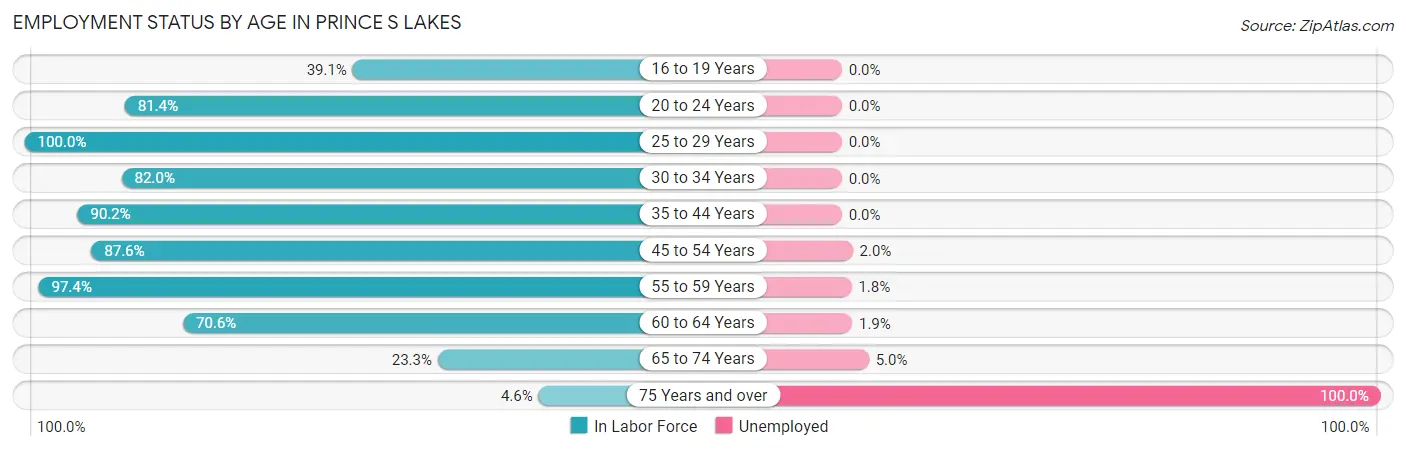
| Age Bracket | In Labor Force | Unemployed |
| 16 to 19 Years | 9 (39.1%) | 0 (0.0%) |
| 20 to 24 Years | 57 (81.4%) | 0 (0.0%) |
| 25 to 29 Years | 33 (100.0%) | 0 (0.0%) |
| 30 to 34 Years | 41 (82.0%) | 0 (0.0%) |
| 35 to 44 Years | 119 (90.2%) | 0 (0.0%) |
| 45 to 54 Years | 149 (87.6%) | 3 (2.0%) |
| 55 to 59 Years | 112 (97.4%) | 2 (1.8%) |
| 60 to 64 Years | 156 (70.6%) | 3 (1.9%) |
| 65 to 74 Years | 60 (23.3%) | 3 (5.0%) |
| 75 Years and over | 3 (4.6%) | 3 (100.0%) |
| Total | 739 (65.0%) | 14 (1.9%) |
Employment Status by Educational Attainment in Prince s Lakes
According to labor force statistics for Prince s Lakes, 84.6% of individuals (610) out of the total population between 25 and 64 years of age (721) are in the labor force, with 1.3% or 8 of them being unemployed. The group with the highest labor force participation rate are those with the educational attainment of college / associate degree, with 91.1% or 287 individuals in the labor force. Within the labor force, individuals with high school diploma education have the highest percentage of unemployment, with 2.7% or 5 of them being unemployed.
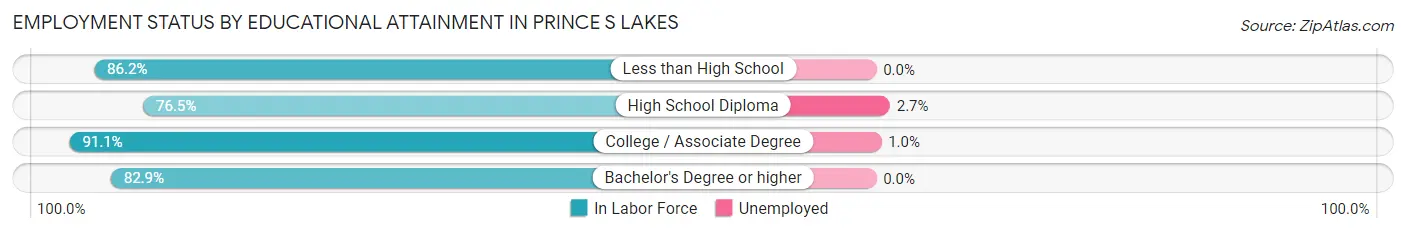
| Educational Attainment | In Labor Force | Unemployed |
| Less than High School | 50 (86.2%) | 0 (0.0%) |
| High School Diploma | 186 (76.5%) | 7 (2.7%) |
| College / Associate Degree | 287 (91.1%) | 3 (1.0%) |
| Bachelor's Degree or higher | 87 (82.9%) | 0 (0.0%) |
| Total | 610 (84.6%) | 9 (1.3%) |
Employment Occupations by Sex in Prince s Lakes
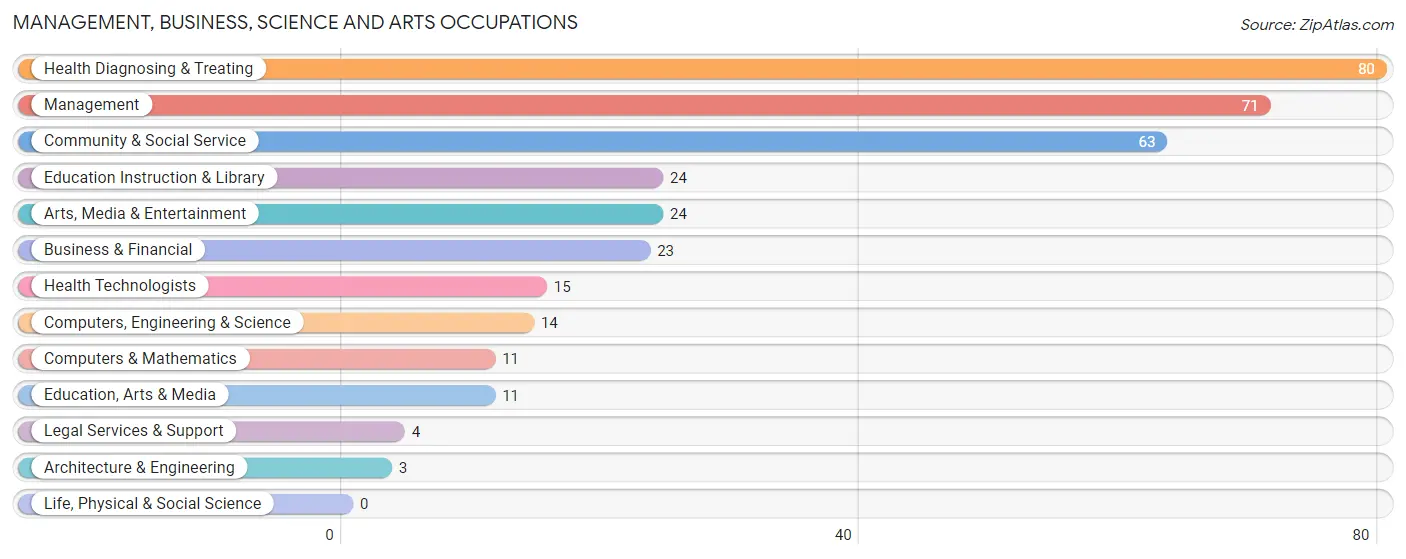
Management, Business, Science and Arts Occupations
The most common Management, Business, Science and Arts occupations in Prince s Lakes are Health Diagnosing & Treating (80 | 11.0%), Management (71 | 9.8%), Community & Social Service (63 | 8.7%), Education Instruction & Library (24 | 3.3%), and Arts, Media & Entertainment (24 | 3.3%).
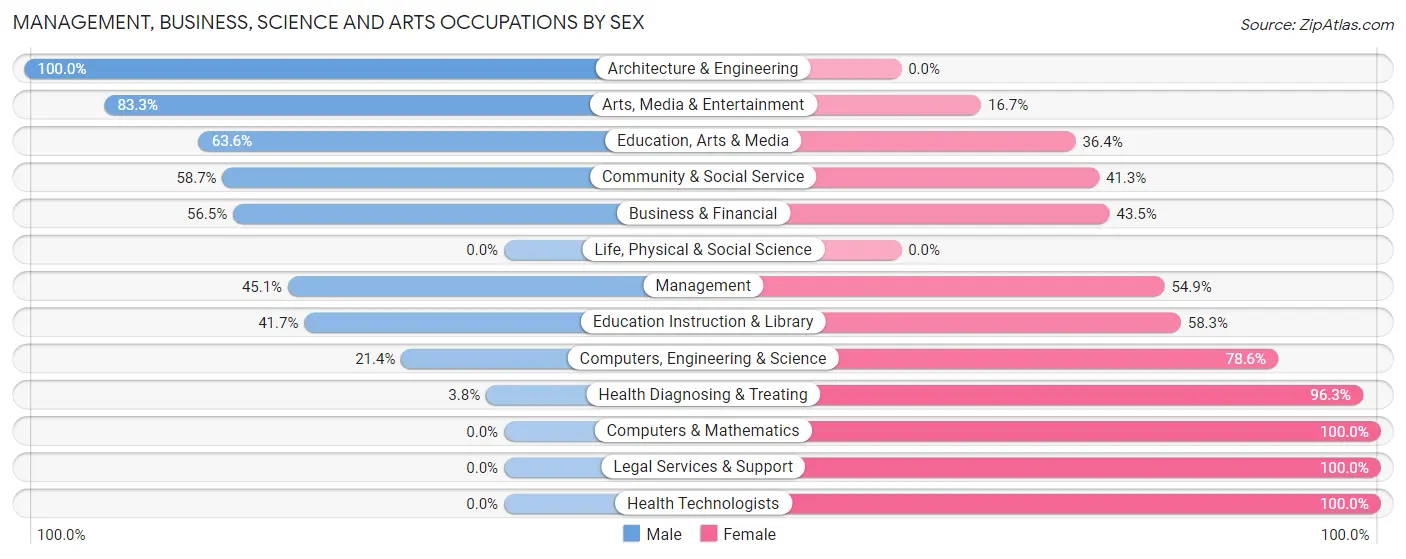
Management, Business, Science and Arts Occupations by Sex
Within the Management, Business, Science and Arts occupations in Prince s Lakes, the most male-oriented occupations are Architecture & Engineering (100.0%), Arts, Media & Entertainment (83.3%), and Education, Arts & Media (63.6%), while the most female-oriented occupations are Computers & Mathematics (100.0%), Legal Services & Support (100.0%), and Health Technologists (100.0%).
| Occupation | Male | Female |
| Management | 32 (45.1%) | 39 (54.9%) |
| Business & Financial | 13 (56.5%) | 10 (43.5%) |
| Computers, Engineering & Science | 3 (21.4%) | 11 (78.6%) |
| Computers & Mathematics | 0 (0.0%) | 11 (100.0%) |
| Architecture & Engineering | 3 (100.0%) | 0 (0.0%) |
| Life, Physical & Social Science | 0 (0.0%) | 0 (0.0%) |
| Community & Social Service | 37 (58.7%) | 26 (41.3%) |
| Education, Arts & Media | 7 (63.6%) | 4 (36.4%) |
| Legal Services & Support | 0 (0.0%) | 4 (100.0%) |
| Education Instruction & Library | 10 (41.7%) | 14 (58.3%) |
| Arts, Media & Entertainment | 20 (83.3%) | 4 (16.7%) |
| Health Diagnosing & Treating | 3 (3.7%) | 77 (96.3%) |
| Health Technologists | 0 (0.0%) | 15 (100.0%) |
| Total (Category) | 88 (35.1%) | 163 (64.9%) |
| Total (Overall) | 334 (46.1%) | 391 (53.9%) |
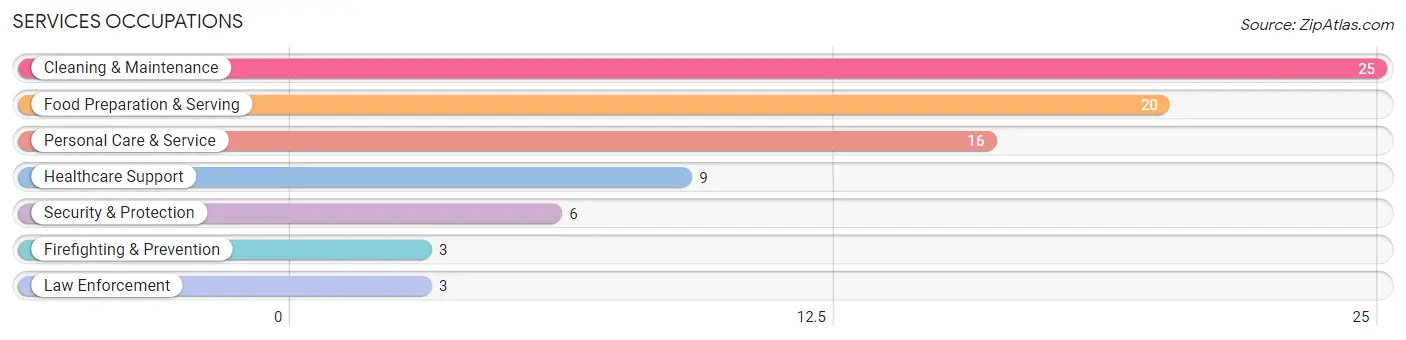
Services Occupations
The most common Services occupations in Prince s Lakes are Cleaning & Maintenance (25 | 3.5%), Food Preparation & Serving (20 | 2.8%), Personal Care & Service (16 | 2.2%), Healthcare Support (9 | 1.2%), and Security & Protection (6 | 0.8%).
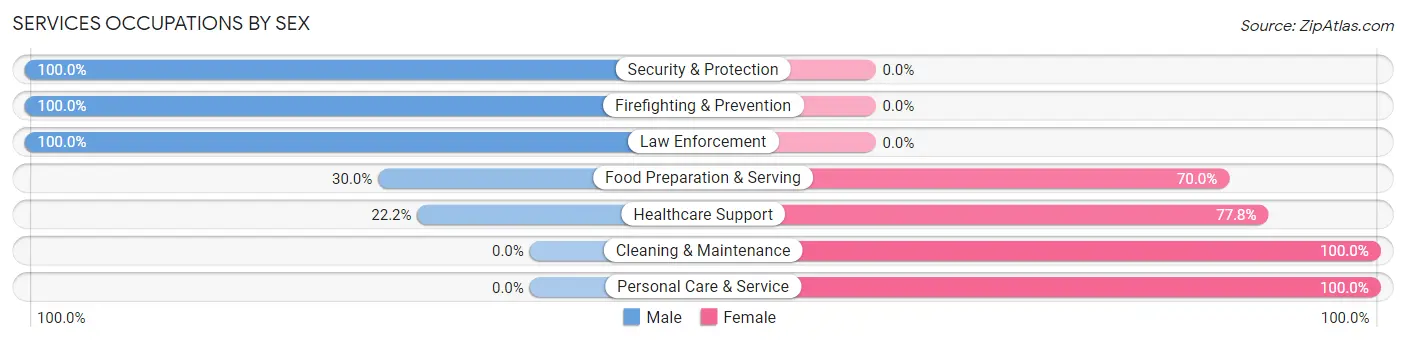
Services Occupations by Sex
Within the Services occupations in Prince s Lakes, the most male-oriented occupations are Security & Protection (100.0%), Firefighting & Prevention (100.0%), and Law Enforcement (100.0%), while the most female-oriented occupations are Cleaning & Maintenance (100.0%), Personal Care & Service (100.0%), and Healthcare Support (77.8%).
| Occupation | Male | Female |
| Healthcare Support | 2 (22.2%) | 7 (77.8%) |
| Security & Protection | 6 (100.0%) | 0 (0.0%) |
| Firefighting & Prevention | 3 (100.0%) | 0 (0.0%) |
| Law Enforcement | 3 (100.0%) | 0 (0.0%) |
| Food Preparation & Serving | 6 (30.0%) | 14 (70.0%) |
| Cleaning & Maintenance | 0 (0.0%) | 25 (100.0%) |
| Personal Care & Service | 0 (0.0%) | 16 (100.0%) |
| Total (Category) | 14 (18.4%) | 62 (81.6%) |
| Total (Overall) | 334 (46.1%) | 391 (53.9%) |
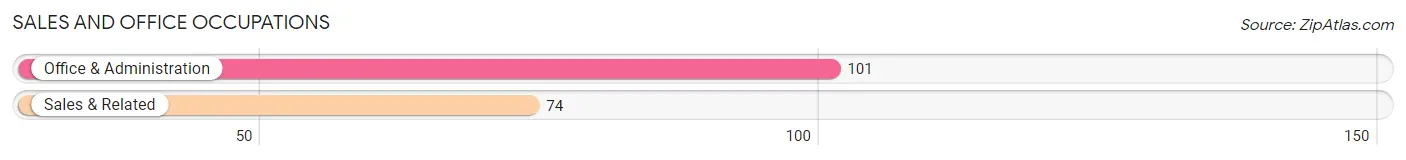
Sales and Office Occupations
The most common Sales and Office occupations in Prince s Lakes are Office & Administration (101 | 13.9%), and Sales & Related (74 | 10.2%).
Sales and Office Occupations by Sex
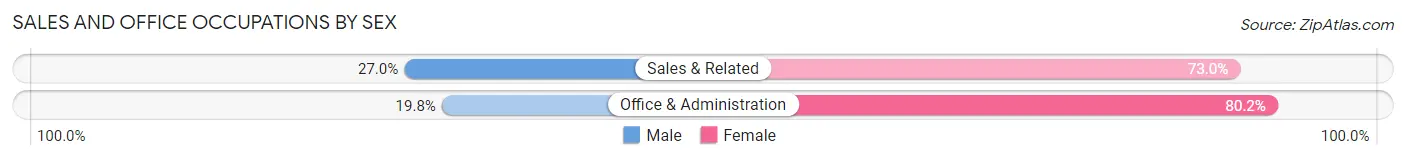
| Occupation | Male | Female |
| Sales & Related | 20 (27.0%) | 54 (73.0%) |
| Office & Administration | 20 (19.8%) | 81 (80.2%) |
| Total (Category) | 40 (22.9%) | 135 (77.1%) |
| Total (Overall) | 334 (46.1%) | 391 (53.9%) |
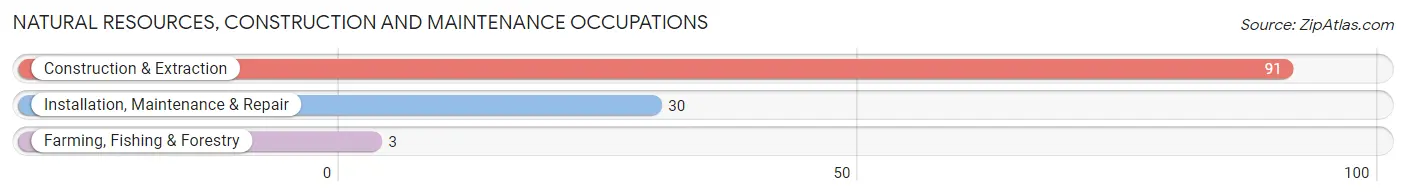
Natural Resources, Construction and Maintenance Occupations
The most common Natural Resources, Construction and Maintenance occupations in Prince s Lakes are Construction & Extraction (91 | 12.6%), Installation, Maintenance & Repair (30 | 4.1%), and Farming, Fishing & Forestry (3 | 0.4%).
Natural Resources, Construction and Maintenance Occupations by Sex
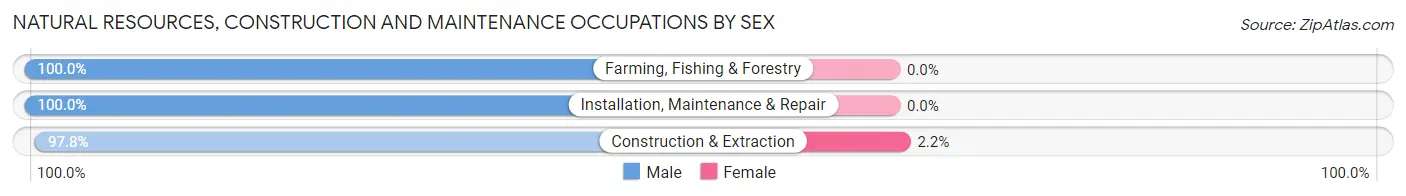
| Occupation | Male | Female |
| Farming, Fishing & Forestry | 3 (100.0%) | 0 (0.0%) |
| Construction & Extraction | 89 (97.8%) | 2 (2.2%) |
| Installation, Maintenance & Repair | 30 (100.0%) | 0 (0.0%) |
| Total (Category) | 122 (98.4%) | 2 (1.6%) |
| Total (Overall) | 334 (46.1%) | 391 (53.9%) |
Production, Transportation and Moving Occupations
The most common Production, Transportation and Moving occupations in Prince s Lakes are Production (54 | 7.4%), Transportation (32 | 4.4%), and Material Moving (13 | 1.8%).
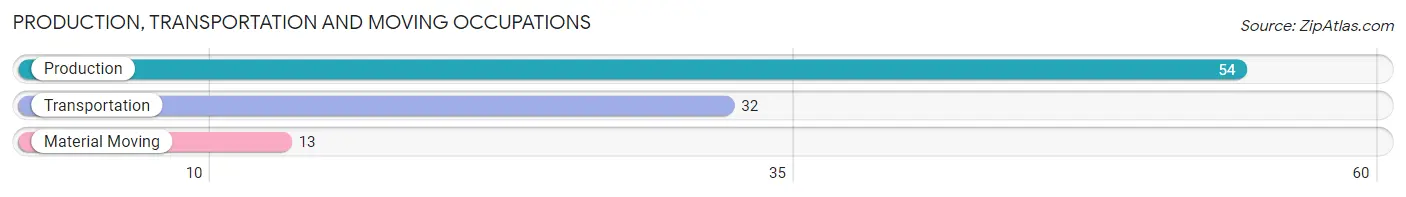
Production, Transportation and Moving Occupations by Sex
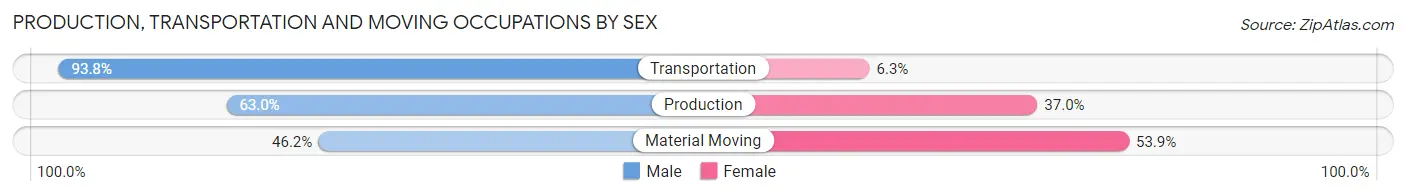
| Occupation | Male | Female |
| Production | 34 (63.0%) | 20 (37.0%) |
| Transportation | 30 (93.8%) | 2 (6.2%) |
| Material Moving | 6 (46.2%) | 7 (53.8%) |
| Total (Category) | 70 (70.7%) | 29 (29.3%) |
| Total (Overall) | 334 (46.1%) | 391 (53.9%) |
Employment Industries by Sex in Prince s Lakes
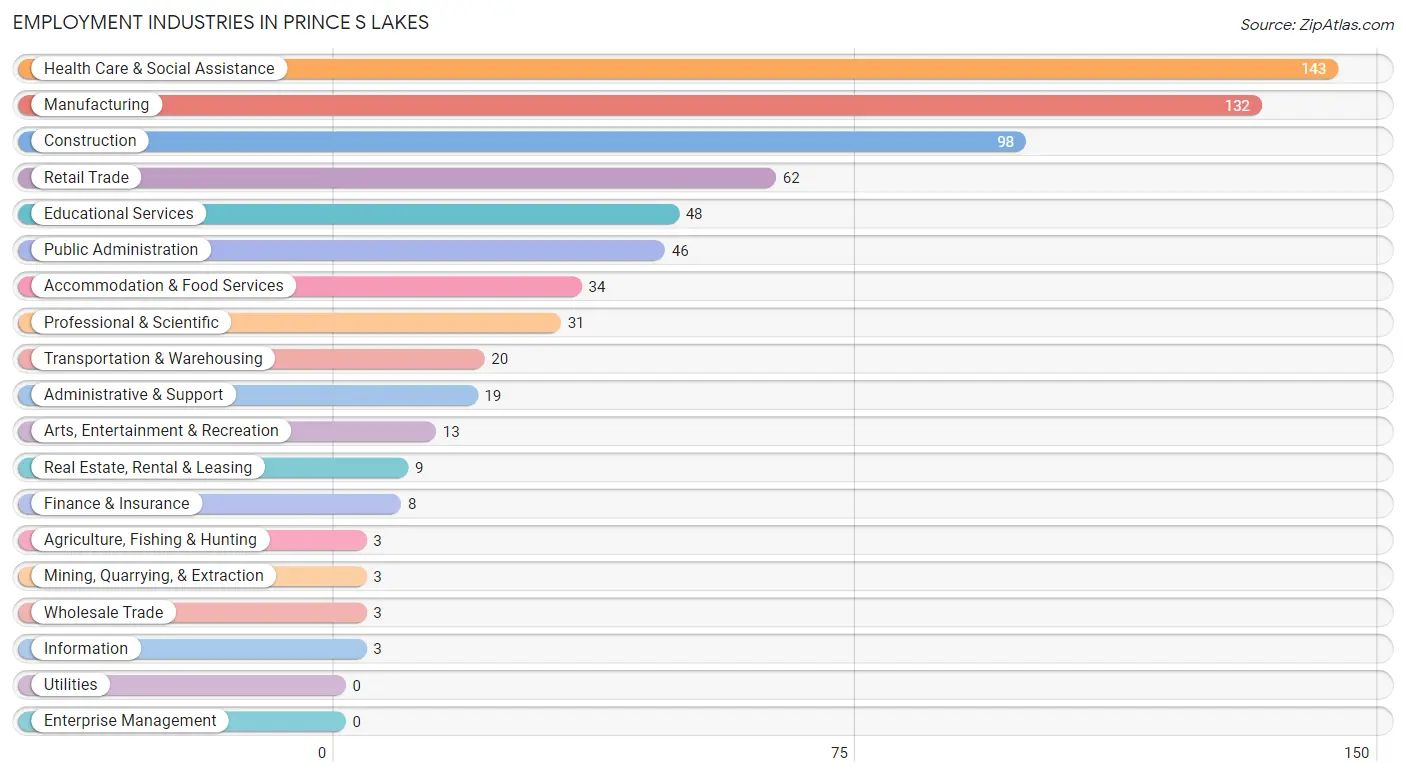
Employment Industries in Prince s Lakes
The major employment industries in Prince s Lakes include Health Care & Social Assistance (143 | 19.7%), Manufacturing (132 | 18.2%), Construction (98 | 13.5%), Retail Trade (62 | 8.6%), and Educational Services (48 | 6.6%).
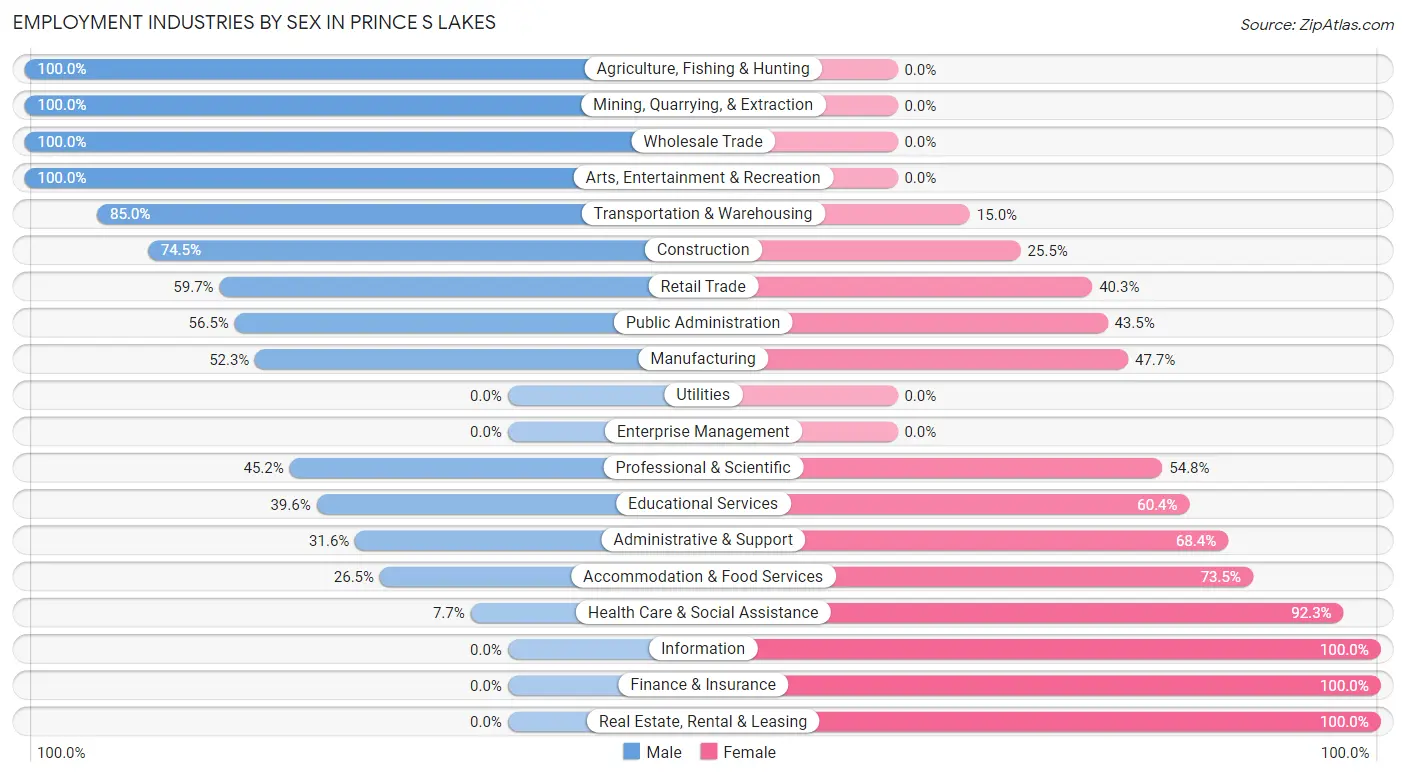
Employment Industries by Sex in Prince s Lakes
The Prince s Lakes industries that see more men than women are Agriculture, Fishing & Hunting (100.0%), Mining, Quarrying, & Extraction (100.0%), and Wholesale Trade (100.0%), whereas the industries that tend to have a higher number of women are Information (100.0%), Finance & Insurance (100.0%), and Real Estate, Rental & Leasing (100.0%).
| Industry | Male | Female |
| Agriculture, Fishing & Hunting | 3 (100.0%) | 0 (0.0%) |
| Mining, Quarrying, & Extraction | 3 (100.0%) | 0 (0.0%) |
| Construction | 73 (74.5%) | 25 (25.5%) |
| Manufacturing | 69 (52.3%) | 63 (47.7%) |
| Wholesale Trade | 3 (100.0%) | 0 (0.0%) |
| Retail Trade | 37 (59.7%) | 25 (40.3%) |
| Transportation & Warehousing | 17 (85.0%) | 3 (15.0%) |
| Utilities | 0 (0.0%) | 0 (0.0%) |
| Information | 0 (0.0%) | 3 (100.0%) |
| Finance & Insurance | 0 (0.0%) | 8 (100.0%) |
| Real Estate, Rental & Leasing | 0 (0.0%) | 9 (100.0%) |
| Professional & Scientific | 14 (45.2%) | 17 (54.8%) |
| Enterprise Management | 0 (0.0%) | 0 (0.0%) |
| Administrative & Support | 6 (31.6%) | 13 (68.4%) |
| Educational Services | 19 (39.6%) | 29 (60.4%) |
| Health Care & Social Assistance | 11 (7.7%) | 132 (92.3%) |
| Arts, Entertainment & Recreation | 13 (100.0%) | 0 (0.0%) |
| Accommodation & Food Services | 9 (26.5%) | 25 (73.5%) |
| Public Administration | 26 (56.5%) | 20 (43.5%) |
| Total | 334 (46.1%) | 391 (53.9%) |
Education in Prince s Lakes
School Enrollment in Prince s Lakes
The most common levels of schooling among the 165 students in Prince s Lakes are middle school (51 | 30.9%), elementary school (40 | 24.2%), and college / undergraduate (32 | 19.4%).
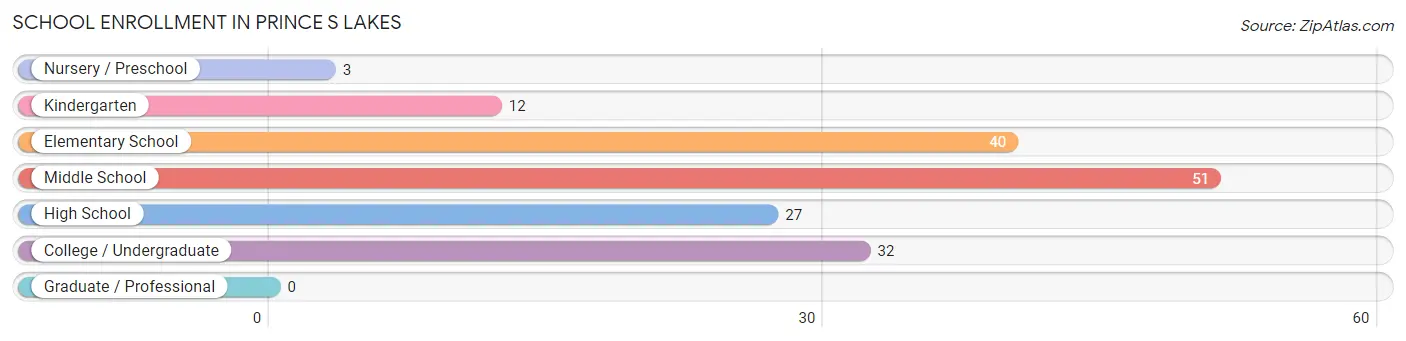
| School Level | # Students | % Students |
| Nursery / Preschool | 3 | 1.8% |
| Kindergarten | 12 | 7.3% |
| Elementary School | 40 | 24.2% |
| Middle School | 51 | 30.9% |
| High School | 27 | 16.4% |
| College / Undergraduate | 32 | 19.4% |
| Graduate / Professional | 0 | 0.0% |
| Total | 165 | 100.0% |
School Enrollment by Age by Funding Source in Prince s Lakes
Out of a total of 165 students who are enrolled in schools in Prince s Lakes, 26 (15.8%) attend a private institution, while the remaining 139 (84.2%) are enrolled in public schools. The age group of 18 to 19 year olds has the highest likelihood of being enrolled in private schools, with 2 (22.2% in the age bracket) enrolled. Conversely, the age group of 15 to 17 year olds has the lowest likelihood of being enrolled in a private school, with 17 (100.0% in the age bracket) attending a public institution.
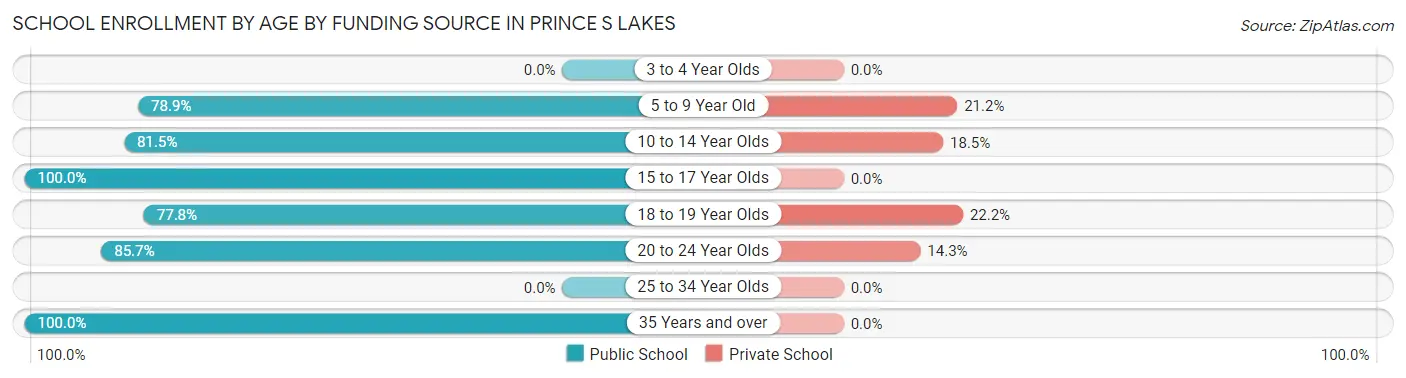
| Age Bracket | Public School | Private School |
| 3 to 4 Year Olds | 0 (0.0%) | 0 (0.0%) |
| 5 to 9 Year Old | 41 (78.8%) | 11 (21.1%) |
| 10 to 14 Year Olds | 44 (81.5%) | 10 (18.5%) |
| 15 to 17 Year Olds | 17 (100.0%) | 0 (0.0%) |
| 18 to 19 Year Olds | 7 (77.8%) | 2 (22.2%) |
| 20 to 24 Year Olds | 18 (85.7%) | 3 (14.3%) |
| 25 to 34 Year Olds | 0 (0.0%) | 0 (0.0%) |
| 35 Years and over | 12 (100.0%) | 0 (0.0%) |
| Total | 139 (84.2%) | 26 (15.8%) |
Educational Attainment by Field of Study in Prince s Lakes
Education (59 | 29.5%), bio, nature & agricultural (40 | 20.0%), business (30 | 15.0%), science & technology (25 | 12.5%), and arts & humanities (12 | 6.0%) are the most common fields of study among 200 individuals in Prince s Lakes who have obtained a bachelor's degree or higher.
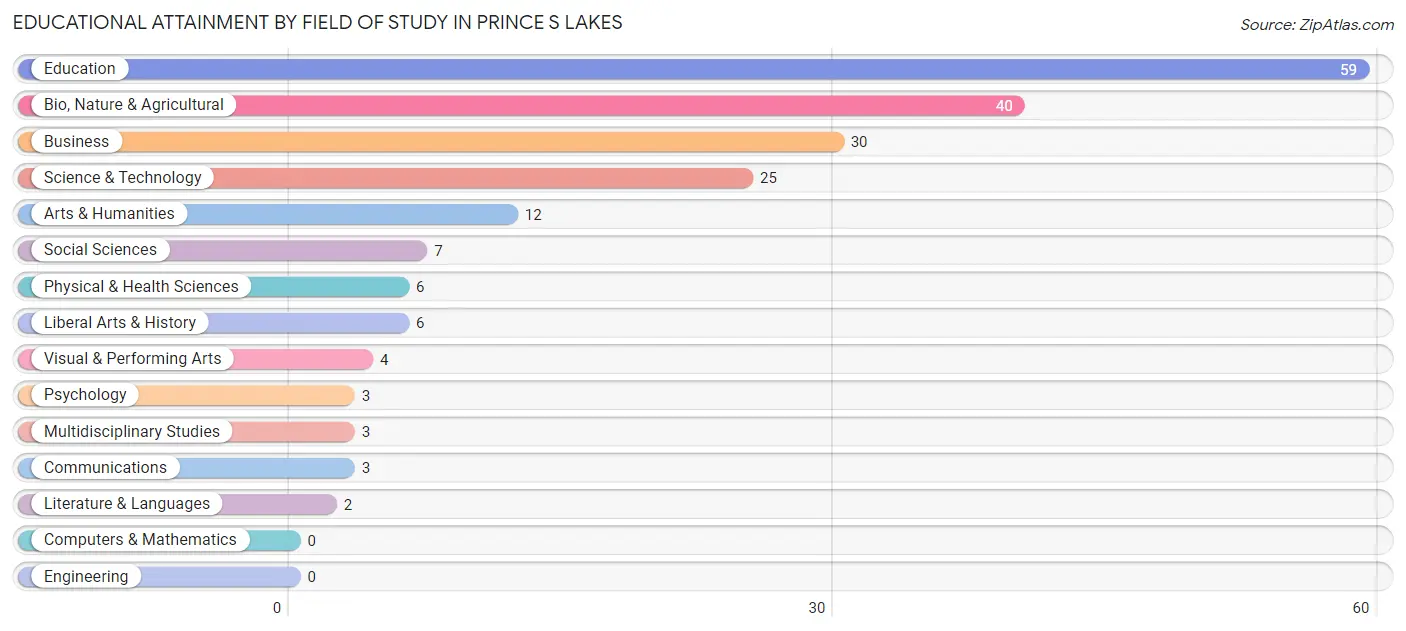
| Field of Study | # Graduates | % Graduates |
| Computers & Mathematics | 0 | 0.0% |
| Bio, Nature & Agricultural | 40 | 20.0% |
| Physical & Health Sciences | 6 | 3.0% |
| Psychology | 3 | 1.5% |
| Social Sciences | 7 | 3.5% |
| Engineering | 0 | 0.0% |
| Multidisciplinary Studies | 3 | 1.5% |
| Science & Technology | 25 | 12.5% |
| Business | 30 | 15.0% |
| Education | 59 | 29.5% |
| Literature & Languages | 2 | 1.0% |
| Liberal Arts & History | 6 | 3.0% |
| Visual & Performing Arts | 4 | 2.0% |
| Communications | 3 | 1.5% |
| Arts & Humanities | 12 | 6.0% |
| Total | 200 | 100.0% |
Transportation & Commute in Prince s Lakes
Vehicle Availability by Sex in Prince s Lakes
The most prevalent vehicle ownership categories in Prince s Lakes are males with 3 vehicles (118, accounting for 35.3%) and females with 3 vehicles (126, making up 30.5%).
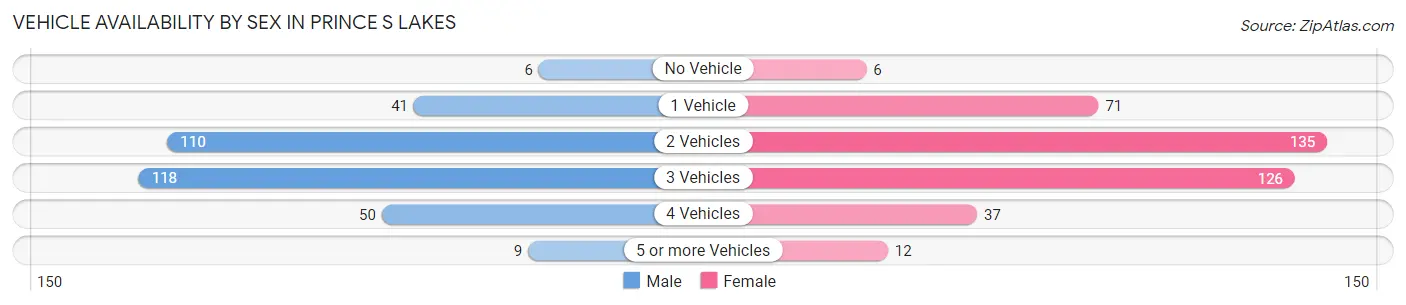
| Vehicles Available | Male | Female |
| No Vehicle | 6 (1.8%) | 6 (1.5%) |
| 1 Vehicle | 41 (12.3%) | 71 (18.3%) |
| 2 Vehicles | 110 (32.9%) | 135 (34.9%) |
| 3 Vehicles | 118 (35.3%) | 126 (32.6%) |
| 4 Vehicles | 50 (15.0%) | 37 (9.6%) |
| 5 or more Vehicles | 9 (2.7%) | 12 (3.1%) |
| Total | 334 (100.0%) | 387 (100.0%) |
Commute Time in Prince s Lakes
The most frequently occuring commute durations in Prince s Lakes are 45 to 59 minutes (172 commuters, 24.9%), 30 to 34 minutes (117 commuters, 16.9%), and 60 to 89 minutes (83 commuters, 12.0%).
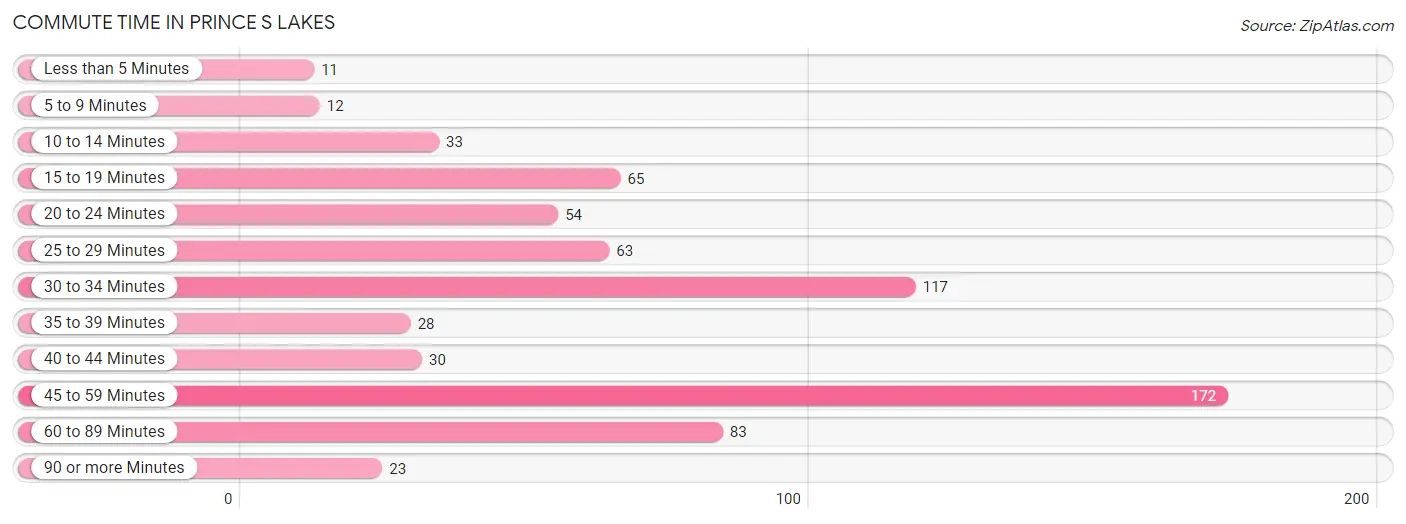
| Commute Time | # Commuters | % Commuters |
| Less than 5 Minutes | 11 | 1.6% |
| 5 to 9 Minutes | 12 | 1.7% |
| 10 to 14 Minutes | 33 | 4.8% |
| 15 to 19 Minutes | 65 | 9.4% |
| 20 to 24 Minutes | 54 | 7.8% |
| 25 to 29 Minutes | 63 | 9.1% |
| 30 to 34 Minutes | 117 | 16.9% |
| 35 to 39 Minutes | 28 | 4.1% |
| 40 to 44 Minutes | 30 | 4.3% |
| 45 to 59 Minutes | 172 | 24.9% |
| 60 to 89 Minutes | 83 | 12.0% |
| 90 or more Minutes | 23 | 3.3% |
Commute Time by Sex in Prince s Lakes
The most common commute times in Prince s Lakes are 60 to 89 minutes (63 commuters, 19.1%) for males and 45 to 59 minutes (131 commuters, 36.3%) for females.
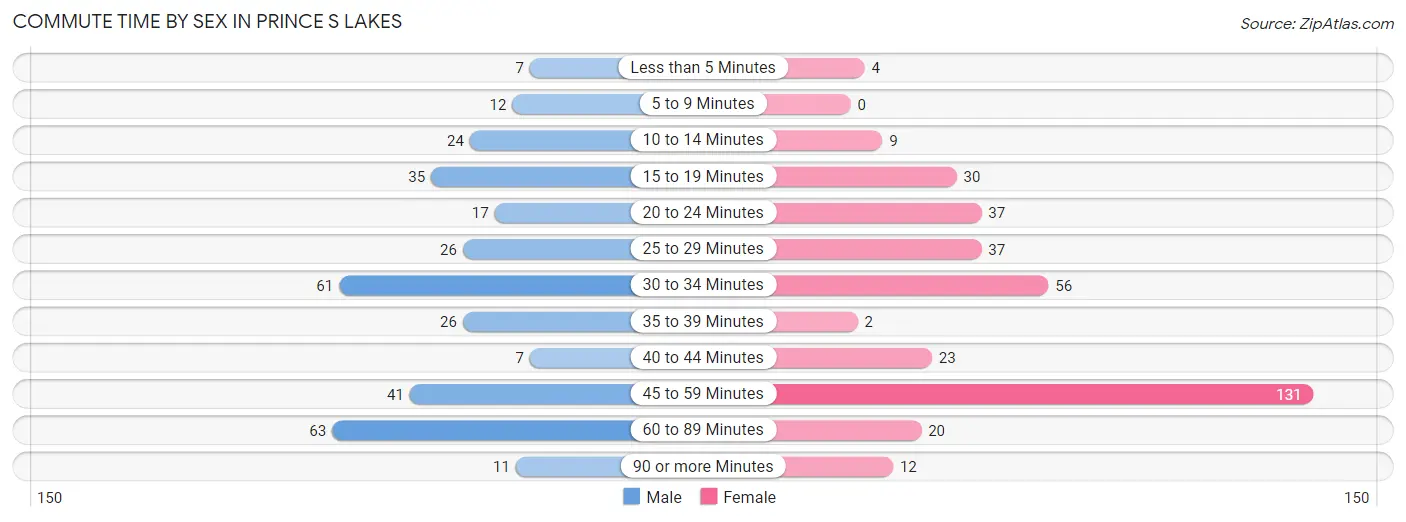
| Commute Time | Male | Female |
| Less than 5 Minutes | 7 (2.1%) | 4 (1.1%) |
| 5 to 9 Minutes | 12 (3.6%) | 0 (0.0%) |
| 10 to 14 Minutes | 24 (7.3%) | 9 (2.5%) |
| 15 to 19 Minutes | 35 (10.6%) | 30 (8.3%) |
| 20 to 24 Minutes | 17 (5.1%) | 37 (10.2%) |
| 25 to 29 Minutes | 26 (7.9%) | 37 (10.2%) |
| 30 to 34 Minutes | 61 (18.5%) | 56 (15.5%) |
| 35 to 39 Minutes | 26 (7.9%) | 2 (0.5%) |
| 40 to 44 Minutes | 7 (2.1%) | 23 (6.4%) |
| 45 to 59 Minutes | 41 (12.4%) | 131 (36.3%) |
| 60 to 89 Minutes | 63 (19.1%) | 20 (5.5%) |
| 90 or more Minutes | 11 (3.3%) | 12 (3.3%) |
Time of Departure to Work by Sex in Prince s Lakes
The most frequent times of departure to work in Prince s Lakes are 6:00 AM to 6:29 AM (74, 22.4%) for males and 6:00 AM to 6:29 AM (92, 25.5%) for females.
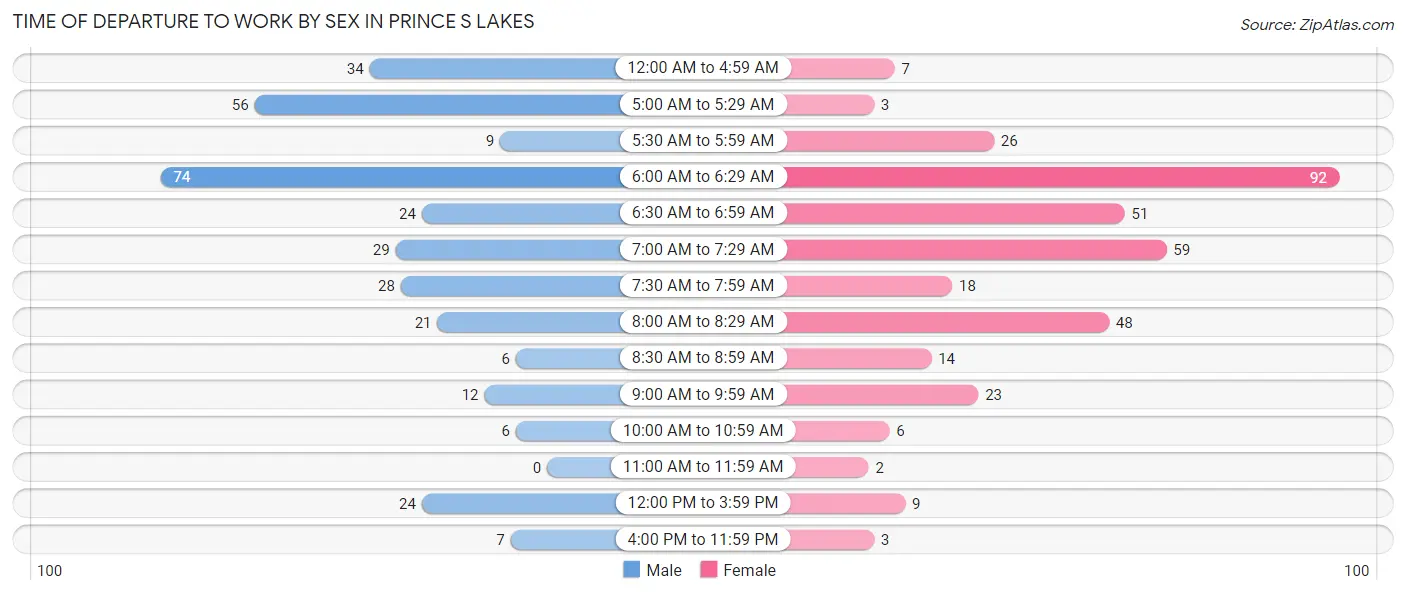
| Time of Departure | Male | Female |
| 12:00 AM to 4:59 AM | 34 (10.3%) | 7 (1.9%) |
| 5:00 AM to 5:29 AM | 56 (17.0%) | 3 (0.8%) |
| 5:30 AM to 5:59 AM | 9 (2.7%) | 26 (7.2%) |
| 6:00 AM to 6:29 AM | 74 (22.4%) | 92 (25.5%) |
| 6:30 AM to 6:59 AM | 24 (7.3%) | 51 (14.1%) |
| 7:00 AM to 7:29 AM | 29 (8.8%) | 59 (16.3%) |
| 7:30 AM to 7:59 AM | 28 (8.5%) | 18 (5.0%) |
| 8:00 AM to 8:29 AM | 21 (6.4%) | 48 (13.3%) |
| 8:30 AM to 8:59 AM | 6 (1.8%) | 14 (3.9%) |
| 9:00 AM to 9:59 AM | 12 (3.6%) | 23 (6.4%) |
| 10:00 AM to 10:59 AM | 6 (1.8%) | 6 (1.7%) |
| 11:00 AM to 11:59 AM | 0 (0.0%) | 2 (0.5%) |
| 12:00 PM to 3:59 PM | 24 (7.3%) | 9 (2.5%) |
| 4:00 PM to 11:59 PM | 7 (2.1%) | 3 (0.8%) |
| Total | 330 (100.0%) | 361 (100.0%) |
Housing Occupancy in Prince s Lakes
Occupancy by Ownership in Prince s Lakes
Of the total 596 dwellings in Prince s Lakes, owner-occupied units account for 571 (95.8%), while renter-occupied units make up 25 (4.2%).
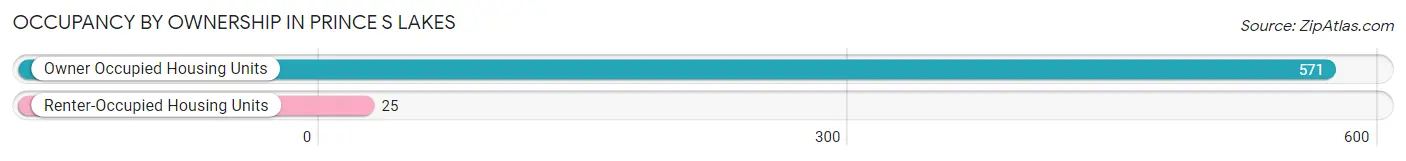
| Occupancy | # Housing Units | % Housing Units |
| Owner Occupied Housing Units | 571 | 95.8% |
| Renter-Occupied Housing Units | 25 | 4.2% |
| Total Occupied Housing Units | 596 | 100.0% |
Occupancy by Household Size in Prince s Lakes
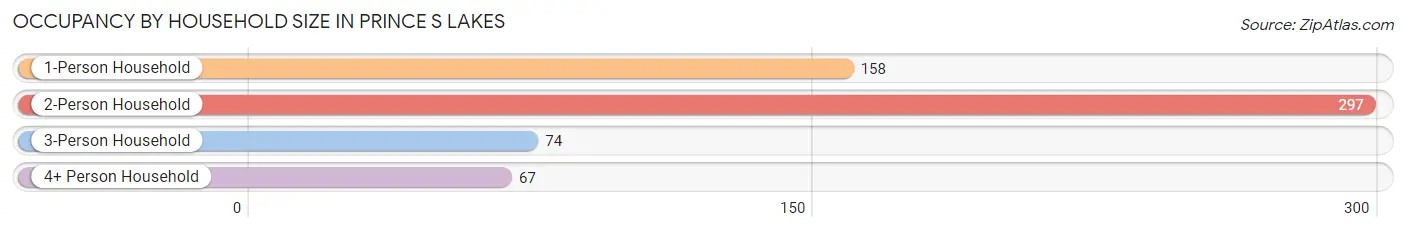
| Household Size | # Housing Units | % Housing Units |
| 1-Person Household | 158 | 26.5% |
| 2-Person Household | 297 | 49.8% |
| 3-Person Household | 74 | 12.4% |
| 4+ Person Household | 67 | 11.2% |
| Total Housing Units | 596 | 100.0% |
Occupancy by Ownership by Household Size in Prince s Lakes
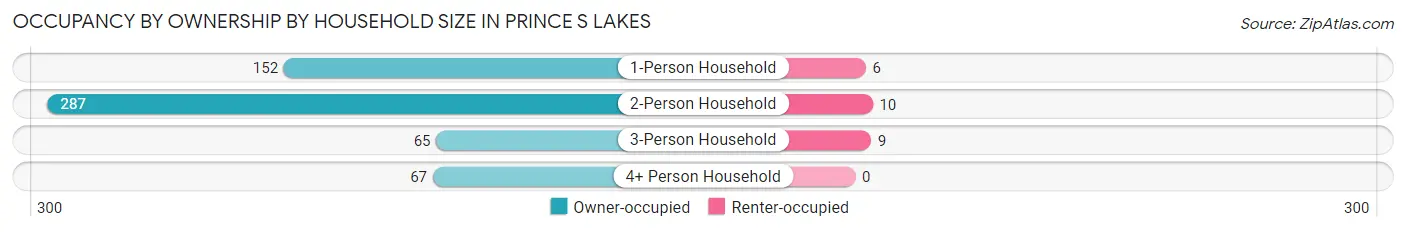
| Household Size | Owner-occupied | Renter-occupied |
| 1-Person Household | 152 (96.2%) | 6 (3.8%) |
| 2-Person Household | 287 (96.6%) | 10 (3.4%) |
| 3-Person Household | 65 (87.8%) | 9 (12.2%) |
| 4+ Person Household | 67 (100.0%) | 0 (0.0%) |
| Total Housing Units | 571 (95.8%) | 25 (4.2%) |
Occupancy by Educational Attainment in Prince s Lakes
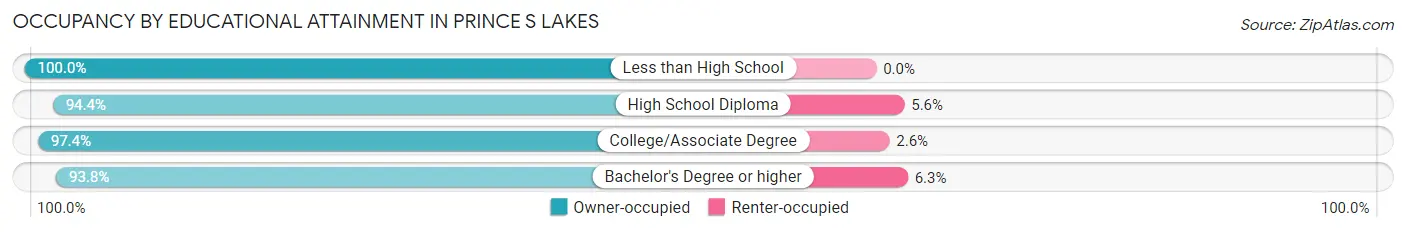
| Household Size | Owner-occupied | Renter-occupied |
| Less than High School | 40 (100.0%) | 0 (0.0%) |
| High School Diploma | 203 (94.4%) | 12 (5.6%) |
| College/Associate Degree | 223 (97.4%) | 6 (2.6%) |
| Bachelor's Degree or higher | 105 (93.8%) | 7 (6.2%) |
Occupancy by Age of Householder in Prince s Lakes
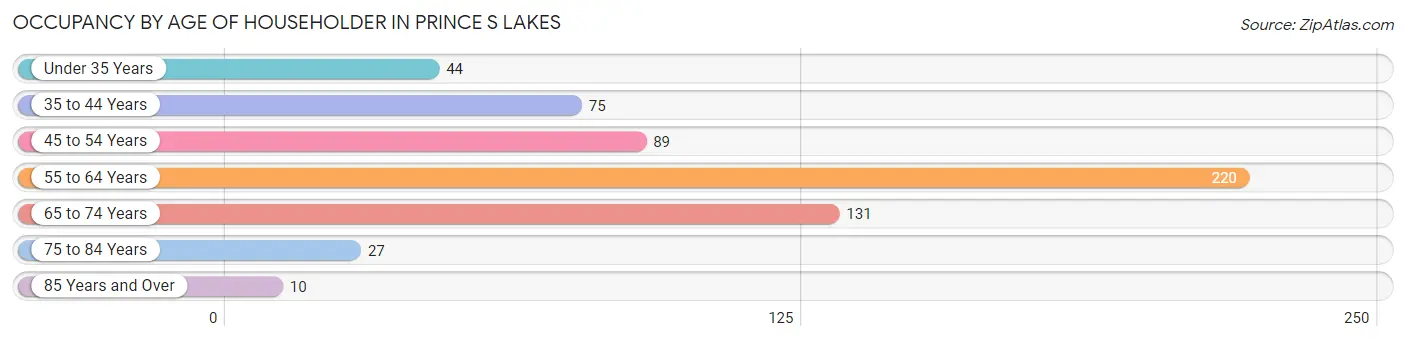
| Age Bracket | # Households | % Households |
| Under 35 Years | 44 | 7.4% |
| 35 to 44 Years | 75 | 12.6% |
| 45 to 54 Years | 89 | 14.9% |
| 55 to 64 Years | 220 | 36.9% |
| 65 to 74 Years | 131 | 22.0% |
| 75 to 84 Years | 27 | 4.5% |
| 85 Years and Over | 10 | 1.7% |
| Total | 596 | 100.0% |
Housing Finances in Prince s Lakes
Median Income by Occupancy in Prince s Lakes
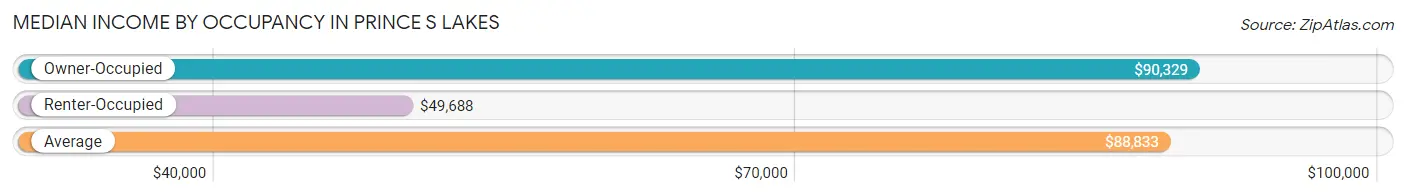
| Occupancy Type | # Households | Median Income |
| Owner-Occupied | 571 (95.8%) | $90,329 |
| Renter-Occupied | 25 (4.2%) | $49,688 |
| Average | 596 (100.0%) | $88,833 |
Occupancy by Householder Income Bracket in Prince s Lakes
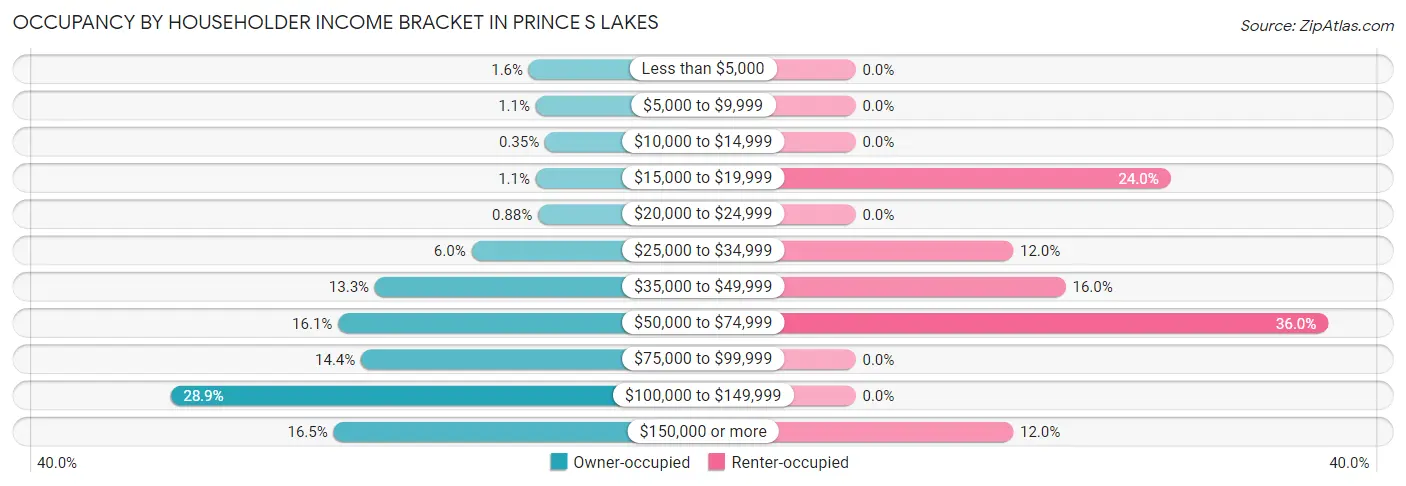
| Income Bracket | Owner-occupied | Renter-occupied |
| Less than $5,000 | 9 (1.6%) | 0 (0.0%) |
| $5,000 to $9,999 | 6 (1.1%) | 0 (0.0%) |
| $10,000 to $14,999 | 2 (0.4%) | 0 (0.0%) |
| $15,000 to $19,999 | 6 (1.1%) | 6 (24.0%) |
| $20,000 to $24,999 | 5 (0.9%) | 0 (0.0%) |
| $25,000 to $34,999 | 34 (5.9%) | 3 (12.0%) |
| $35,000 to $49,999 | 76 (13.3%) | 4 (16.0%) |
| $50,000 to $74,999 | 92 (16.1%) | 9 (36.0%) |
| $75,000 to $99,999 | 82 (14.4%) | 0 (0.0%) |
| $100,000 to $149,999 | 165 (28.9%) | 0 (0.0%) |
| $150,000 or more | 94 (16.5%) | 3 (12.0%) |
| Total | 571 (100.0%) | 25 (100.0%) |
Monthly Housing Cost Tiers in Prince s Lakes
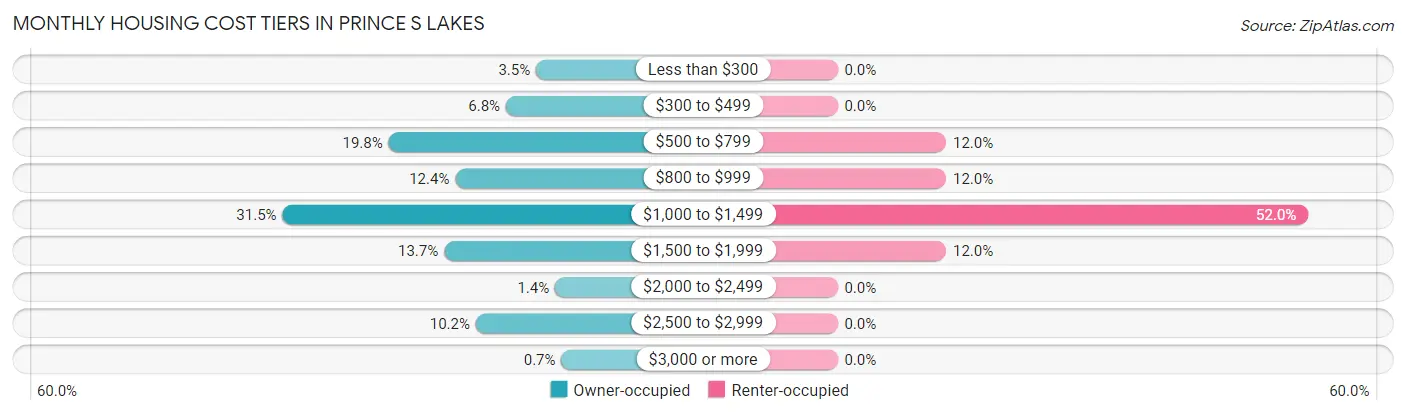
| Monthly Cost | Owner-occupied | Renter-occupied |
| Less than $300 | 20 (3.5%) | 0 (0.0%) |
| $300 to $499 | 39 (6.8%) | 0 (0.0%) |
| $500 to $799 | 113 (19.8%) | 3 (12.0%) |
| $800 to $999 | 71 (12.4%) | 3 (12.0%) |
| $1,000 to $1,499 | 180 (31.5%) | 13 (52.0%) |
| $1,500 to $1,999 | 78 (13.7%) | 3 (12.0%) |
| $2,000 to $2,499 | 8 (1.4%) | 0 (0.0%) |
| $2,500 to $2,999 | 58 (10.2%) | 0 (0.0%) |
| $3,000 or more | 4 (0.7%) | 0 (0.0%) |
| Total | 571 (100.0%) | 25 (100.0%) |
Physical Housing Characteristics in Prince s Lakes
Housing Structures in Prince s Lakes
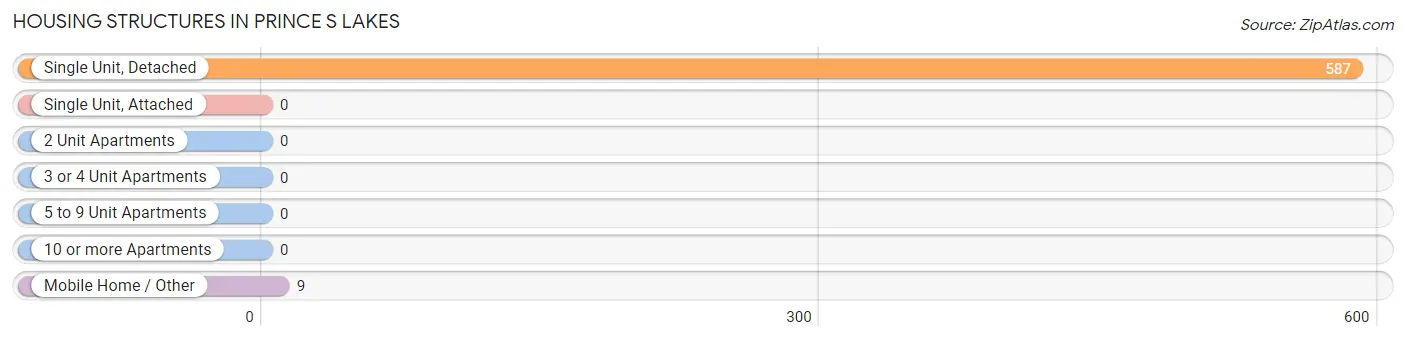
| Structure Type | # Housing Units | % Housing Units |
| Single Unit, Detached | 587 | 98.5% |
| Single Unit, Attached | 0 | 0.0% |
| 2 Unit Apartments | 0 | 0.0% |
| 3 or 4 Unit Apartments | 0 | 0.0% |
| 5 to 9 Unit Apartments | 0 | 0.0% |
| 10 or more Apartments | 0 | 0.0% |
| Mobile Home / Other | 9 | 1.5% |
| Total | 596 | 100.0% |
Housing Structures by Occupancy in Prince s Lakes
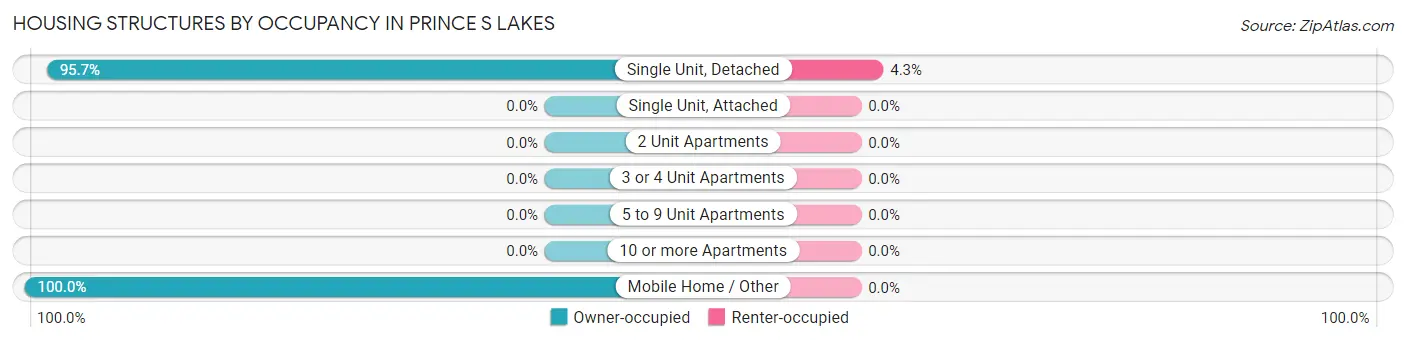
| Structure Type | Owner-occupied | Renter-occupied |
| Single Unit, Detached | 562 (95.7%) | 25 (4.3%) |
| Single Unit, Attached | 0 (0.0%) | 0 (0.0%) |
| 2 Unit Apartments | 0 (0.0%) | 0 (0.0%) |
| 3 or 4 Unit Apartments | 0 (0.0%) | 0 (0.0%) |
| 5 to 9 Unit Apartments | 0 (0.0%) | 0 (0.0%) |
| 10 or more Apartments | 0 (0.0%) | 0 (0.0%) |
| Mobile Home / Other | 9 (100.0%) | 0 (0.0%) |
| Total | 571 (95.8%) | 25 (4.2%) |
Housing Structures by Number of Rooms in Prince s Lakes
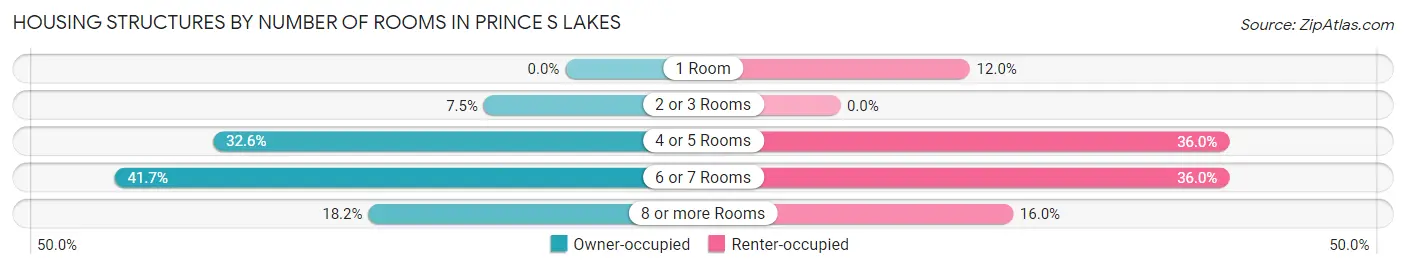
| Number of Rooms | Owner-occupied | Renter-occupied |
| 1 Room | 0 (0.0%) | 3 (12.0%) |
| 2 or 3 Rooms | 43 (7.5%) | 0 (0.0%) |
| 4 or 5 Rooms | 186 (32.6%) | 9 (36.0%) |
| 6 or 7 Rooms | 238 (41.7%) | 9 (36.0%) |
| 8 or more Rooms | 104 (18.2%) | 4 (16.0%) |
| Total | 571 (100.0%) | 25 (100.0%) |
Housing Structure by Heating Type in Prince s Lakes
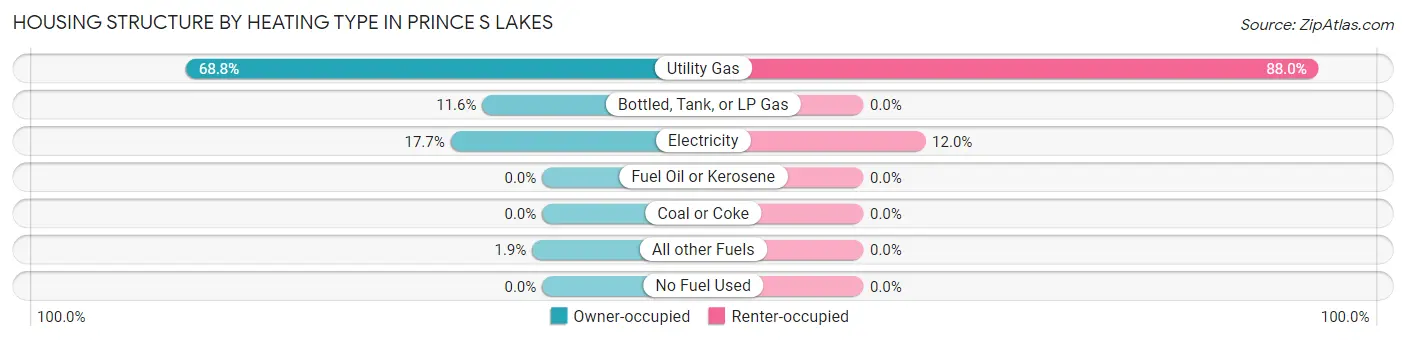
| Heating Type | Owner-occupied | Renter-occupied |
| Utility Gas | 393 (68.8%) | 22 (88.0%) |
| Bottled, Tank, or LP Gas | 66 (11.6%) | 0 (0.0%) |
| Electricity | 101 (17.7%) | 3 (12.0%) |
| Fuel Oil or Kerosene | 0 (0.0%) | 0 (0.0%) |
| Coal or Coke | 0 (0.0%) | 0 (0.0%) |
| All other Fuels | 11 (1.9%) | 0 (0.0%) |
| No Fuel Used | 0 (0.0%) | 0 (0.0%) |
| Total | 571 (100.0%) | 25 (100.0%) |
Household Vehicle Usage in Prince s Lakes
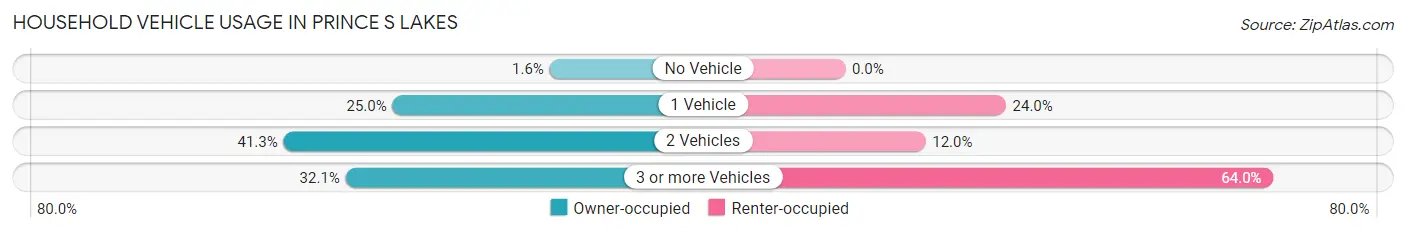
| Vehicles per Household | Owner-occupied | Renter-occupied |
| No Vehicle | 9 (1.6%) | 0 (0.0%) |
| 1 Vehicle | 143 (25.0%) | 6 (24.0%) |
| 2 Vehicles | 236 (41.3%) | 3 (12.0%) |
| 3 or more Vehicles | 183 (32.1%) | 16 (64.0%) |
| Total | 571 (100.0%) | 25 (100.0%) |
Real Estate & Mortgages in Prince s Lakes
Real Estate and Mortgage Overview in Prince s Lakes
| Characteristic | Without Mortgage | With Mortgage |
| Housing Units | 152 | 419 |
| Median Property Value | $217,200 | $203,600 |
| Median Household Income | $62,813 | $61 |
| Monthly Housing Costs | $568 | $4 |
| Real Estate Taxes | $1,721 | $17 |
Property Value by Mortgage Status in Prince s Lakes
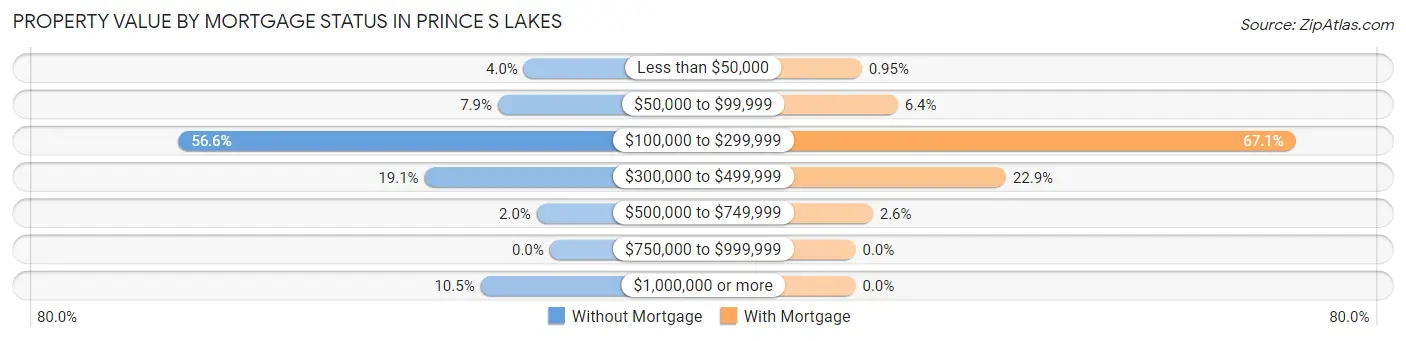
| Property Value | Without Mortgage | With Mortgage |
| Less than $50,000 | 6 (4.0%) | 4 (0.9%) |
| $50,000 to $99,999 | 12 (7.9%) | 27 (6.4%) |
| $100,000 to $299,999 | 86 (56.6%) | 281 (67.1%) |
| $300,000 to $499,999 | 29 (19.1%) | 96 (22.9%) |
| $500,000 to $749,999 | 3 (2.0%) | 11 (2.6%) |
| $750,000 to $999,999 | 0 (0.0%) | 0 (0.0%) |
| $1,000,000 or more | 16 (10.5%) | 0 (0.0%) |
| Total | 152 (100.0%) | 419 (100.0%) |
Household Income by Mortgage Status in Prince s Lakes
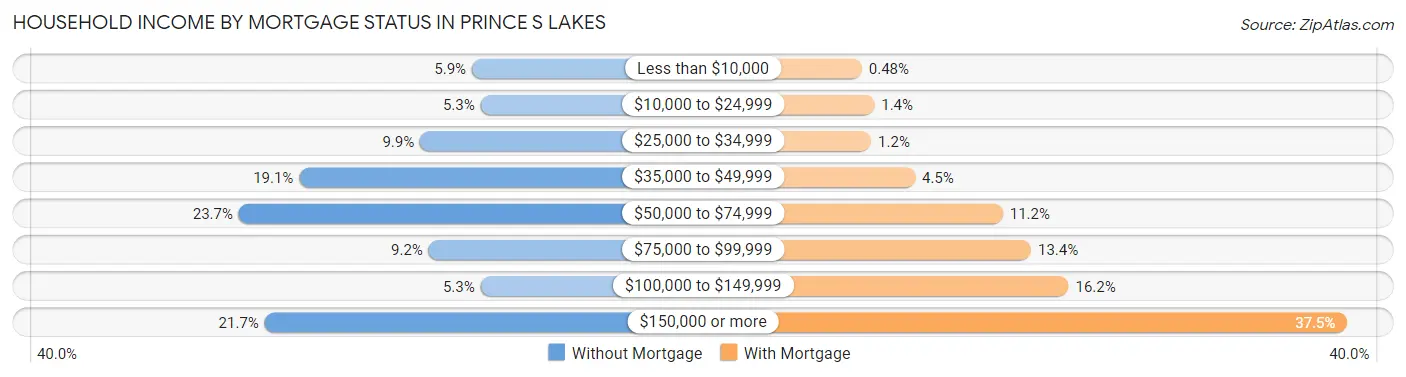
| Household Income | Without Mortgage | With Mortgage |
| Less than $10,000 | 9 (5.9%) | 2 (0.5%) |
| $10,000 to $24,999 | 8 (5.3%) | 6 (1.4%) |
| $25,000 to $34,999 | 15 (9.9%) | 5 (1.2%) |
| $35,000 to $49,999 | 29 (19.1%) | 19 (4.5%) |
| $50,000 to $74,999 | 36 (23.7%) | 47 (11.2%) |
| $75,000 to $99,999 | 14 (9.2%) | 56 (13.4%) |
| $100,000 to $149,999 | 8 (5.3%) | 68 (16.2%) |
| $150,000 or more | 33 (21.7%) | 157 (37.5%) |
| Total | 152 (100.0%) | 419 (100.0%) |
Property Value to Household Income Ratio in Prince s Lakes
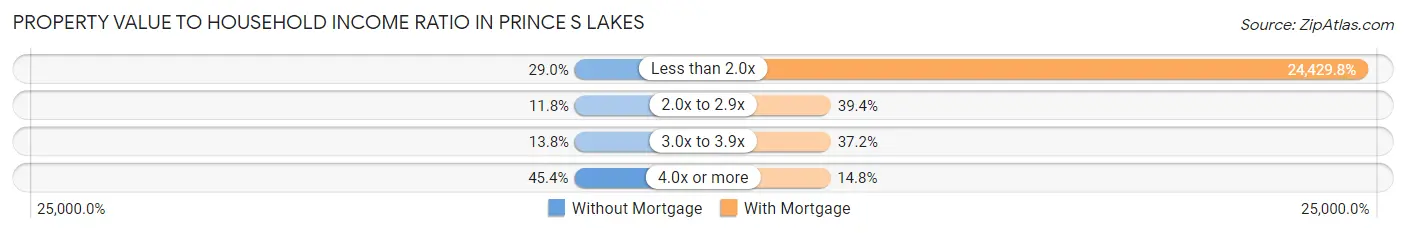
| Value-to-Income Ratio | Without Mortgage | With Mortgage |
| Less than 2.0x | 44 (28.9%) | 102,361 (24,429.8%) |
| 2.0x to 2.9x | 18 (11.8%) | 165 (39.4%) |
| 3.0x to 3.9x | 21 (13.8%) | 156 (37.2%) |
| 4.0x or more | 69 (45.4%) | 62 (14.8%) |
| Total | 152 (100.0%) | 419 (100.0%) |
Real Estate Taxes by Mortgage Status in Prince s Lakes
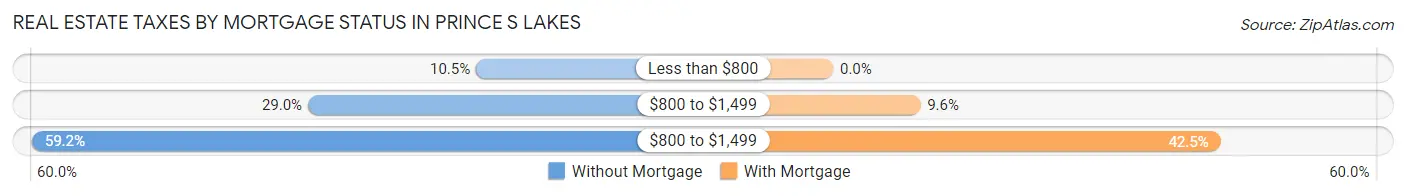
| Property Taxes | Without Mortgage | With Mortgage |
| Less than $800 | 16 (10.5%) | 0 (0.0%) |
| $800 to $1,499 | 44 (28.9%) | 40 (9.6%) |
| $800 to $1,499 | 90 (59.2%) | 178 (42.5%) |
| Total | 152 (100.0%) | 419 (100.0%) |
Health & Disability in Prince s Lakes
Health Insurance Coverage by Age in Prince s Lakes
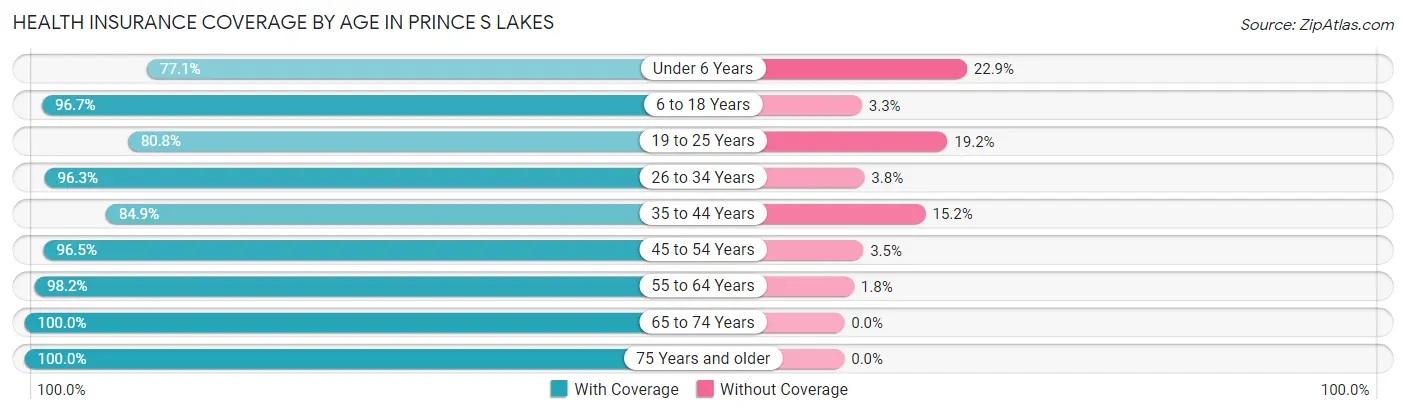
| Age Bracket | With Coverage | Without Coverage |
| Under 6 Years | 27 (77.1%) | 8 (22.9%) |
| 6 to 18 Years | 118 (96.7%) | 4 (3.3%) |
| 19 to 25 Years | 63 (80.8%) | 15 (19.2%) |
| 26 to 34 Years | 77 (96.3%) | 3 (3.7%) |
| 35 to 44 Years | 112 (84.9%) | 20 (15.1%) |
| 45 to 54 Years | 164 (96.5%) | 6 (3.5%) |
| 55 to 64 Years | 330 (98.2%) | 6 (1.8%) |
| 65 to 74 Years | 258 (100.0%) | 0 (0.0%) |
| 75 Years and older | 65 (100.0%) | 0 (0.0%) |
| Total | 1,214 (95.1%) | 62 (4.9%) |
Health Insurance Coverage by Citizenship Status in Prince s Lakes
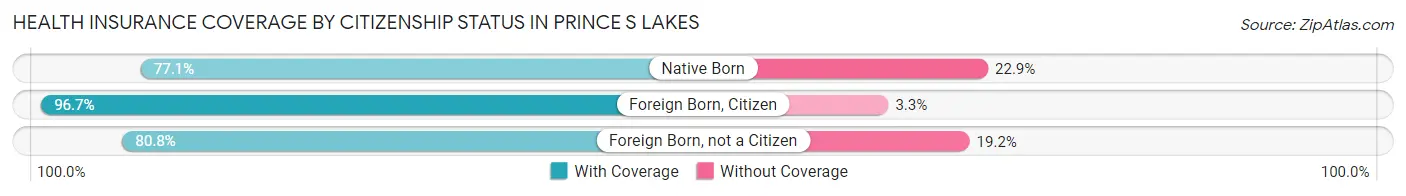
| Citizenship Status | With Coverage | Without Coverage |
| Native Born | 27 (77.1%) | 8 (22.9%) |
| Foreign Born, Citizen | 118 (96.7%) | 4 (3.3%) |
| Foreign Born, not a Citizen | 63 (80.8%) | 15 (19.2%) |
Health Insurance Coverage by Household Income in Prince s Lakes
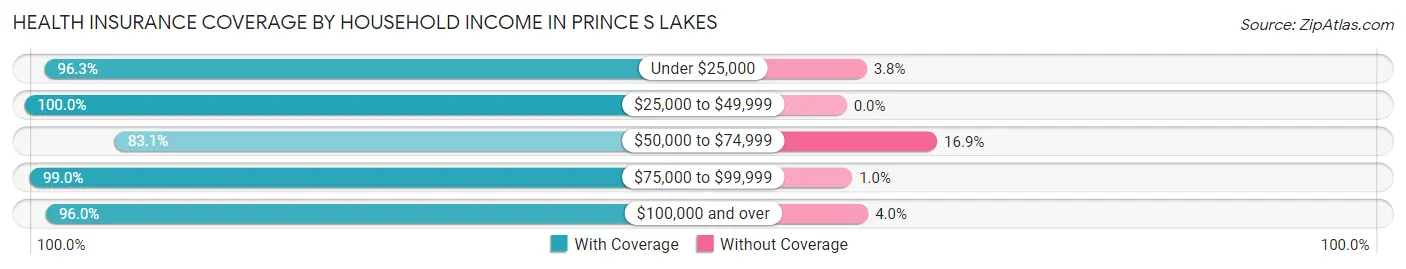
| Household Income | With Coverage | Without Coverage |
| Under $25,000 | 77 (96.3%) | 3 (3.7%) |
| $25,000 to $49,999 | 186 (100.0%) | 0 (0.0%) |
| $50,000 to $74,999 | 157 (83.1%) | 32 (16.9%) |
| $75,000 to $99,999 | 195 (99.0%) | 2 (1.0%) |
| $100,000 and over | 599 (96.0%) | 25 (4.0%) |
Public vs Private Health Insurance Coverage by Age in Prince s Lakes
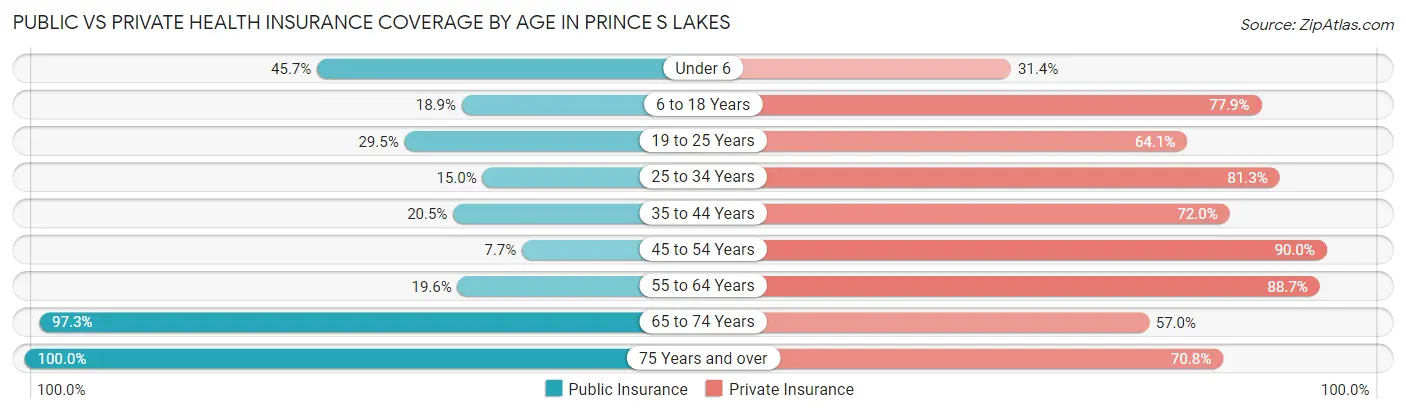
| Age Bracket | Public Insurance | Private Insurance |
| Under 6 | 16 (45.7%) | 11 (31.4%) |
| 6 to 18 Years | 23 (18.9%) | 95 (77.9%) |
| 19 to 25 Years | 23 (29.5%) | 50 (64.1%) |
| 25 to 34 Years | 12 (15.0%) | 65 (81.2%) |
| 35 to 44 Years | 27 (20.4%) | 95 (72.0%) |
| 45 to 54 Years | 13 (7.6%) | 153 (90.0%) |
| 55 to 64 Years | 66 (19.6%) | 298 (88.7%) |
| 65 to 74 Years | 251 (97.3%) | 147 (57.0%) |
| 75 Years and over | 65 (100.0%) | 46 (70.8%) |
| Total | 496 (38.9%) | 960 (75.2%) |
Disability Status by Sex by Age in Prince s Lakes
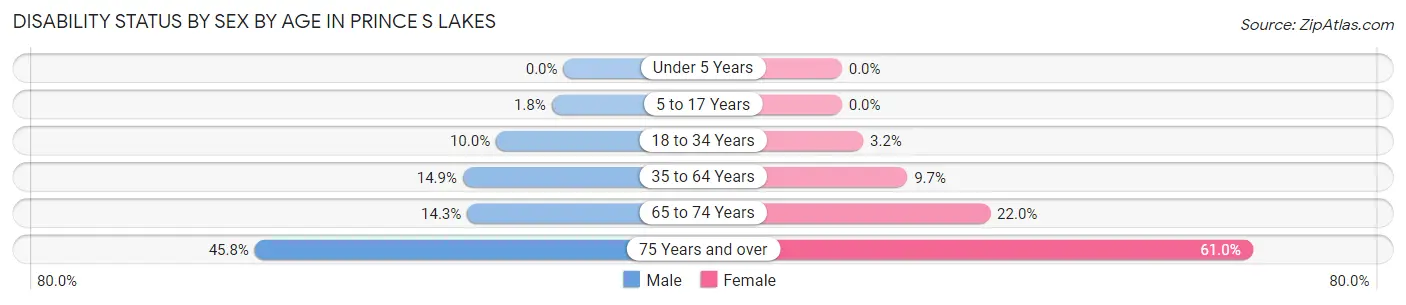
| Age Bracket | Male | Female |
| Under 5 Years | 0 (0.0%) | 0 (0.0%) |
| 5 to 17 Years | 1 (1.8%) | 0 (0.0%) |
| 18 to 34 Years | 7 (10.0%) | 3 (3.2%) |
| 35 to 64 Years | 43 (14.9%) | 34 (9.7%) |
| 65 to 74 Years | 20 (14.3%) | 26 (22.0%) |
| 75 Years and over | 11 (45.8%) | 25 (61.0%) |
Disability Class by Sex by Age in Prince s Lakes
Disability Class: Hearing Difficulty
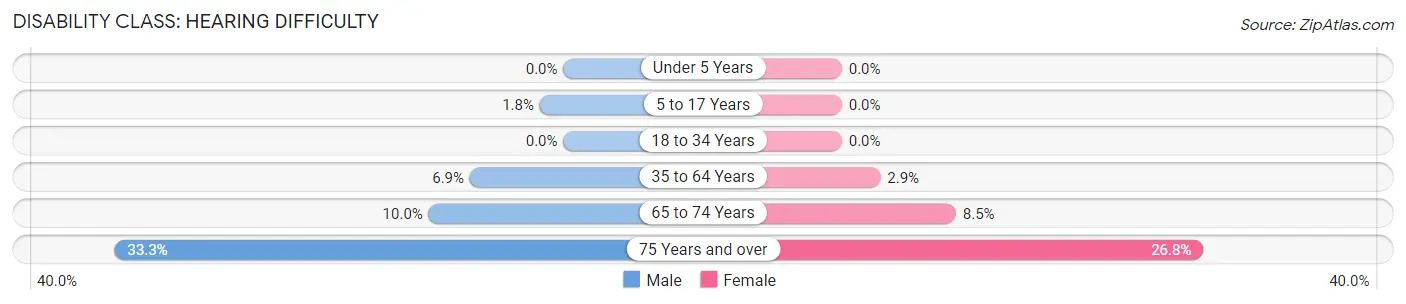
| Age Bracket | Male | Female |
| Under 5 Years | 0 (0.0%) | 0 (0.0%) |
| 5 to 17 Years | 1 (1.8%) | 0 (0.0%) |
| 18 to 34 Years | 0 (0.0%) | 0 (0.0%) |
| 35 to 64 Years | 20 (6.9%) | 10 (2.9%) |
| 65 to 74 Years | 14 (10.0%) | 10 (8.5%) |
| 75 Years and over | 8 (33.3%) | 11 (26.8%) |
Disability Class: Vision Difficulty
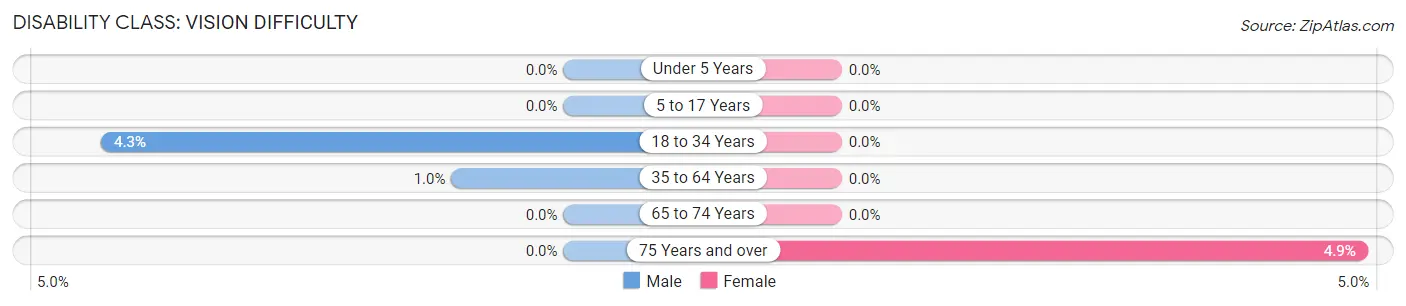
| Age Bracket | Male | Female |
| Under 5 Years | 0 (0.0%) | 0 (0.0%) |
| 5 to 17 Years | 0 (0.0%) | 0 (0.0%) |
| 18 to 34 Years | 3 (4.3%) | 0 (0.0%) |
| 35 to 64 Years | 3 (1.0%) | 0 (0.0%) |
| 65 to 74 Years | 0 (0.0%) | 0 (0.0%) |
| 75 Years and over | 0 (0.0%) | 2 (4.9%) |
Disability Class: Cognitive Difficulty
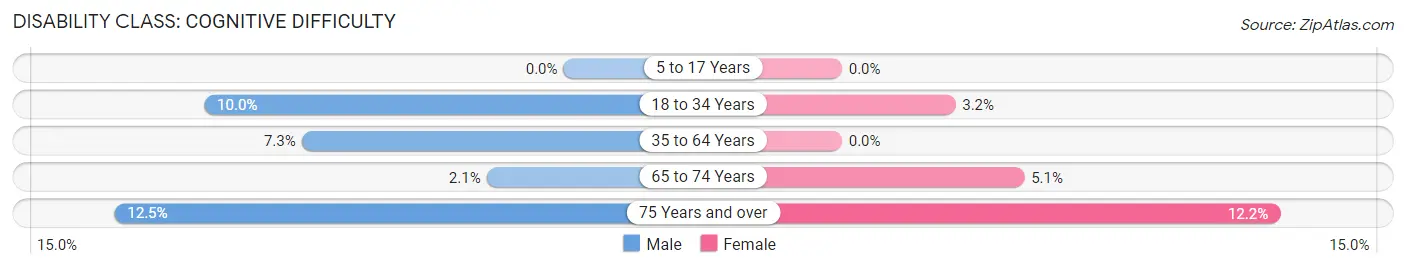
| Age Bracket | Male | Female |
| 5 to 17 Years | 0 (0.0%) | 0 (0.0%) |
| 18 to 34 Years | 7 (10.0%) | 3 (3.2%) |
| 35 to 64 Years | 21 (7.3%) | 0 (0.0%) |
| 65 to 74 Years | 3 (2.1%) | 6 (5.1%) |
| 75 Years and over | 3 (12.5%) | 5 (12.2%) |
Disability Class: Ambulatory Difficulty
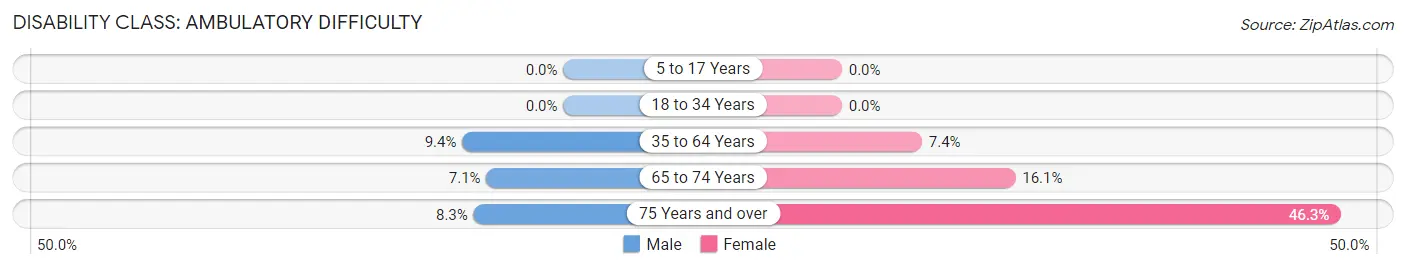
| Age Bracket | Male | Female |
| 5 to 17 Years | 0 (0.0%) | 0 (0.0%) |
| 18 to 34 Years | 0 (0.0%) | 0 (0.0%) |
| 35 to 64 Years | 27 (9.4%) | 26 (7.4%) |
| 65 to 74 Years | 10 (7.1%) | 19 (16.1%) |
| 75 Years and over | 2 (8.3%) | 19 (46.3%) |
Disability Class: Self-Care Difficulty
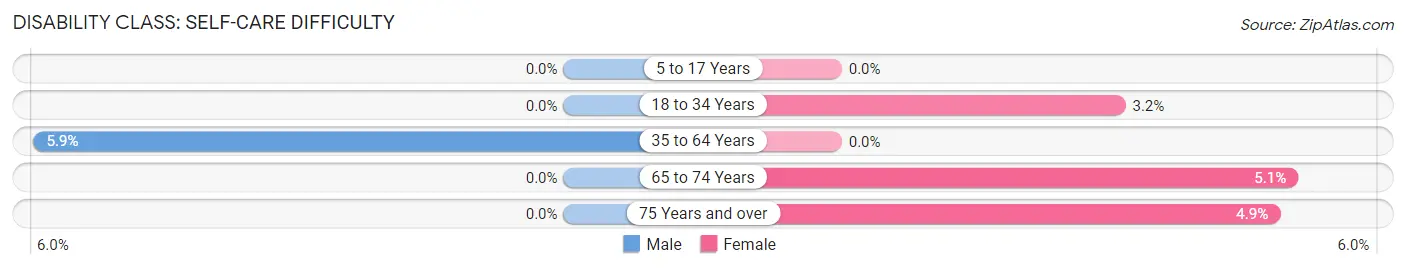
| Age Bracket | Male | Female |
| 5 to 17 Years | 0 (0.0%) | 0 (0.0%) |
| 18 to 34 Years | 0 (0.0%) | 3 (3.2%) |
| 35 to 64 Years | 17 (5.9%) | 0 (0.0%) |
| 65 to 74 Years | 0 (0.0%) | 6 (5.1%) |
| 75 Years and over | 0 (0.0%) | 2 (4.9%) |
Technology Access in Prince s Lakes
Computing Device Access in Prince s Lakes
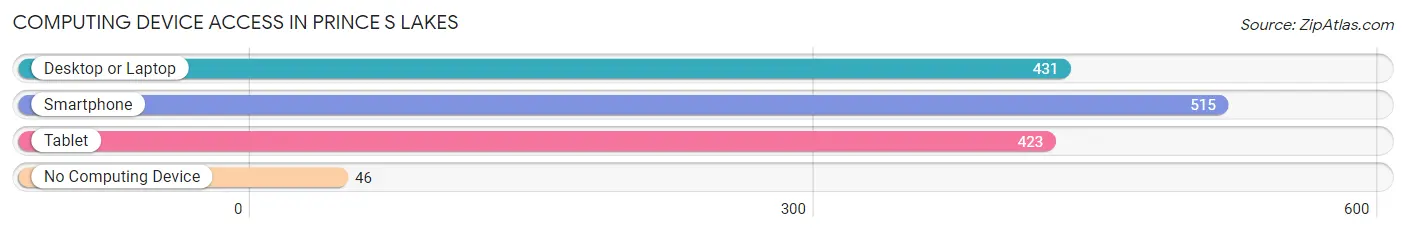
| Device Type | # Households | % Households |
| Desktop or Laptop | 431 | 72.3% |
| Smartphone | 515 | 86.4% |
| Tablet | 423 | 71.0% |
| No Computing Device | 46 | 7.7% |
| Total | 596 | 100.0% |
Internet Access in Prince s Lakes
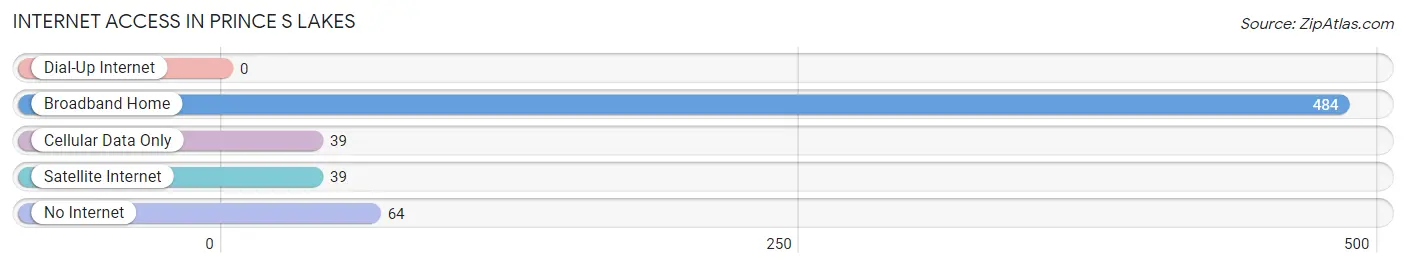
| Internet Type | # Households | % Households |
| Dial-Up Internet | 0 | 0.0% |
| Broadband Home | 484 | 81.2% |
| Cellular Data Only | 39 | 6.5% |
| Satellite Internet | 39 | 6.5% |
| No Internet | 64 | 10.7% |
| Total | 596 | 100.0% |
Prince s Lakes Summary
Prince S Lakes is a small town located in the state of Indiana, in the United States. It is situated in the northwest corner of the state, in the county of Porter. The town is located on the banks of the Little Calumet River, and is part of the Chicago metropolitan area. The population of Prince S Lakes was estimated to be 1,845 in the year 2000.
Geography
Prince S Lakes is located in the northwest corner of Indiana, in the county of Porter. It is situated on the banks of the Little Calumet River, and is part of the Chicago metropolitan area. The town is located at an elevation of 645 feet above sea level. The total area of the town is 1.3 square miles, of which 0.2 square miles is water. The town is surrounded by the towns of Chesterton, Valparaiso, and Portage.
Climate
Prince S Lakes has a humid continental climate, with hot summers and cold winters. The average temperature in the summer months is around 75°F, while in the winter months it is around 25°F. The average annual precipitation is around 37 inches.
Demographics
As of the year 2000, the population of Prince S Lakes was estimated to be 1,845. The racial makeup of the town was 97.3% White, 0.9% African American, 0.3% Native American, 0.3% Asian, 0.2% from other races, and 0.9% from two or more races. Hispanic or Latino of any race were 1.2% of the population.
Economy
The economy of Prince S Lakes is largely based on agriculture and manufacturing. The town is home to several small businesses, including a grocery store, a hardware store, and a few restaurants. The town also has a few small industrial parks, which provide employment opportunities for the local residents.
The town is also home to a number of tourist attractions, including the Indiana Dunes National Lakeshore, the Indiana Dunes State Park, and the Indiana Dunes National Wildlife Refuge. These attractions draw visitors from all over the country, and provide an important source of income for the town.
History
Prince S Lakes was founded in 1836 by a group of settlers from New York. The town was named after Prince S. Smith, who was a prominent local businessman. The town grew slowly over the years, and by the early 1900s it had become a popular tourist destination.
In the 1950s, the town began to experience a period of rapid growth, as the population increased from 1,000 to over 5,000. This growth was largely due to the influx of new residents from the Chicago metropolitan area.
In the late 1970s, the town experienced a period of decline, as the population began to decline due to the loss of manufacturing jobs. However, in recent years the town has seen a resurgence in population growth, as new businesses have moved into the area.
Conclusion
Prince S Lakes is a small town located in the northwest corner of Indiana. It is situated on the banks of the Little Calumet River, and is part of the Chicago metropolitan area. The population of the town was estimated to be 1,845 in the year 2000. The economy of the town is largely based on agriculture and manufacturing, and it is also home to a number of tourist attractions. The town has experienced periods of both growth and decline over the years, but in recent years it has seen a resurgence in population growth.
Common Questions
What is Per Capita Income in Prince s Lakes?
Per Capita income in Prince s Lakes is $47,793.
What is the Median Family Income in Prince s Lakes?
Median Family Income in Prince s Lakes is $102,279.
What is the Median Household income in Prince s Lakes?
Median Household Income in Prince s Lakes is $88,833.
What is Income or Wage Gap in Prince s Lakes?
Income or Wage Gap in Prince s Lakes is 18.6%.
Women in Prince s Lakes earn 81.4 cents for every dollar earned by a man.
What is Family Income Deficit in Prince s Lakes?
Family Income Deficit in Prince s Lakes is $9,218.
Families that are below poverty line in Prince s Lakes earn $9,218 less on average than the poverty threshold level.
What is Inequality or Gini Index in Prince s Lakes?
Inequality or Gini Index in Prince s Lakes is 0.34.
What is the Total Population of Prince s Lakes?
Total Population of Prince s Lakes is 1,276.
What is the Total Male Population of Prince s Lakes?
Total Male Population of Prince s Lakes is 590.
What is the Total Female Population of Prince s Lakes?
Total Female Population of Prince s Lakes is 686.
What is the Ratio of Males per 100 Females in Prince s Lakes?
There are 86.01 Males per 100 Females in Prince s Lakes.
What is the Ratio of Females per 100 Males in Prince s Lakes?
There are 116.27 Females per 100 Males in Prince s Lakes.
What is the Median Population Age in Prince s Lakes?
Median Population Age in Prince s Lakes is 56.1 Years.
What is the Average Family Size in Prince s Lakes
Average Family Size in Prince s Lakes is 2.5 People.
What is the Average Household Size in Prince s Lakes
Average Household Size in Prince s Lakes is 2.1 People.
How Large is the Labor Force in Prince s Lakes?
There are 739 People in the Labor Forcein in Prince s Lakes.
What is the Percentage of People in the Labor Force in Prince s Lakes?
65.0% of People are in the Labor Force in Prince s Lakes.
What is the Unemployment Rate in Prince s Lakes?
Unemployment Rate in Prince s Lakes is 1.9%.