La Paz, IN Map & Demographics
La Paz Map
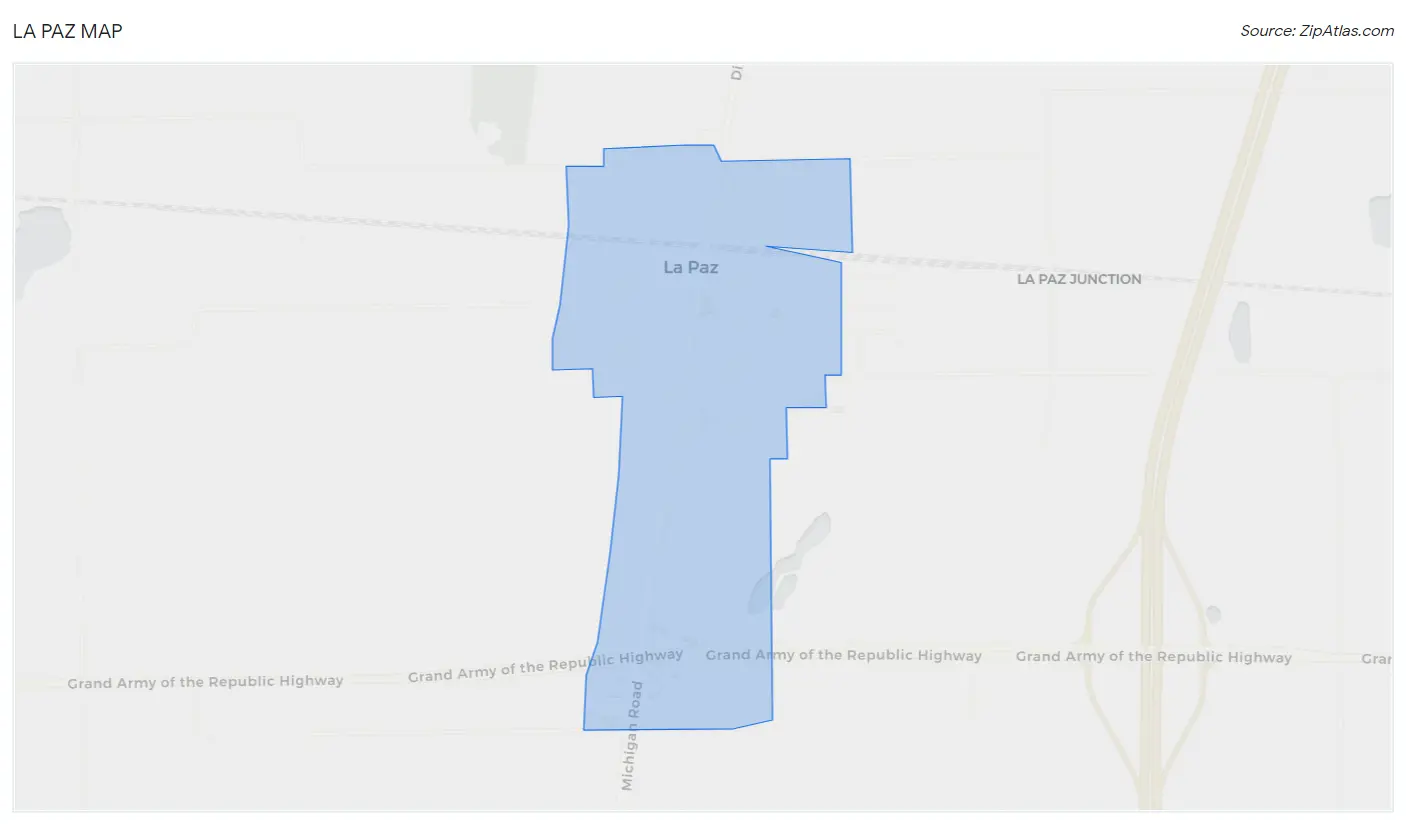
La Paz Overview
$27,468
PER CAPITA INCOME
$74,348
AVG FAMILY INCOME
$73,098
AVG HOUSEHOLD INCOME
45.9%
WAGE / INCOME GAP [ % ]
54.1¢/ $1
WAGE / INCOME GAP [ $ ]
0.29
INEQUALITY / GINI INDEX
536
TOTAL POPULATION
288
MALE POPULATION
248
FEMALE POPULATION
116.13
MALES / 100 FEMALES
86.11
FEMALES / 100 MALES
44.5
MEDIAN AGE
2.7
AVG FAMILY SIZE
2.3
AVG HOUSEHOLD SIZE
324
LABOR FORCE [ PEOPLE ]
70.6%
PERCENT IN LABOR FORCE
1.9%
UNEMPLOYMENT RATE
La Paz Area Codes
Income in La Paz
Income Overview in La Paz
Per Capita Income in La Paz is $27,468, while median incomes of families and households are $74,348 and $73,098 respectively.
| Characteristic | Number | Measure |
| Per Capita Income | 536 | $27,468 |
| Median Family Income | 168 | $74,348 |
| Mean Family Income | 168 | $71,290 |
| Median Household Income | 232 | $73,098 |
| Mean Household Income | 232 | $65,668 |
| Income Deficit | 168 | $0 |
| Wage / Income Gap (%) | 536 | 45.94% |
| Wage / Income Gap ($) | 536 | 54.06¢ per $1 |
| Gini / Inequality Index | 536 | 0.29 |
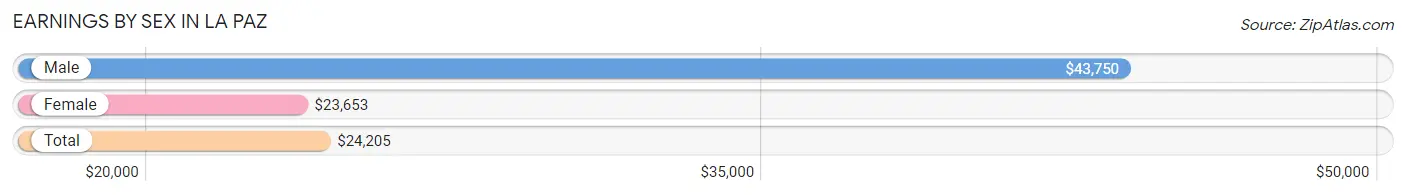
Earnings by Sex in La Paz
Average Earnings in La Paz are $24,205, $43,750 for men and $23,653 for women, a difference of 45.9%.
| Sex | Number | Average Earnings |
| Male | 170 (52.0%) | $43,750 |
| Female | 157 (48.0%) | $23,653 |
| Total | 327 (100.0%) | $24,205 |
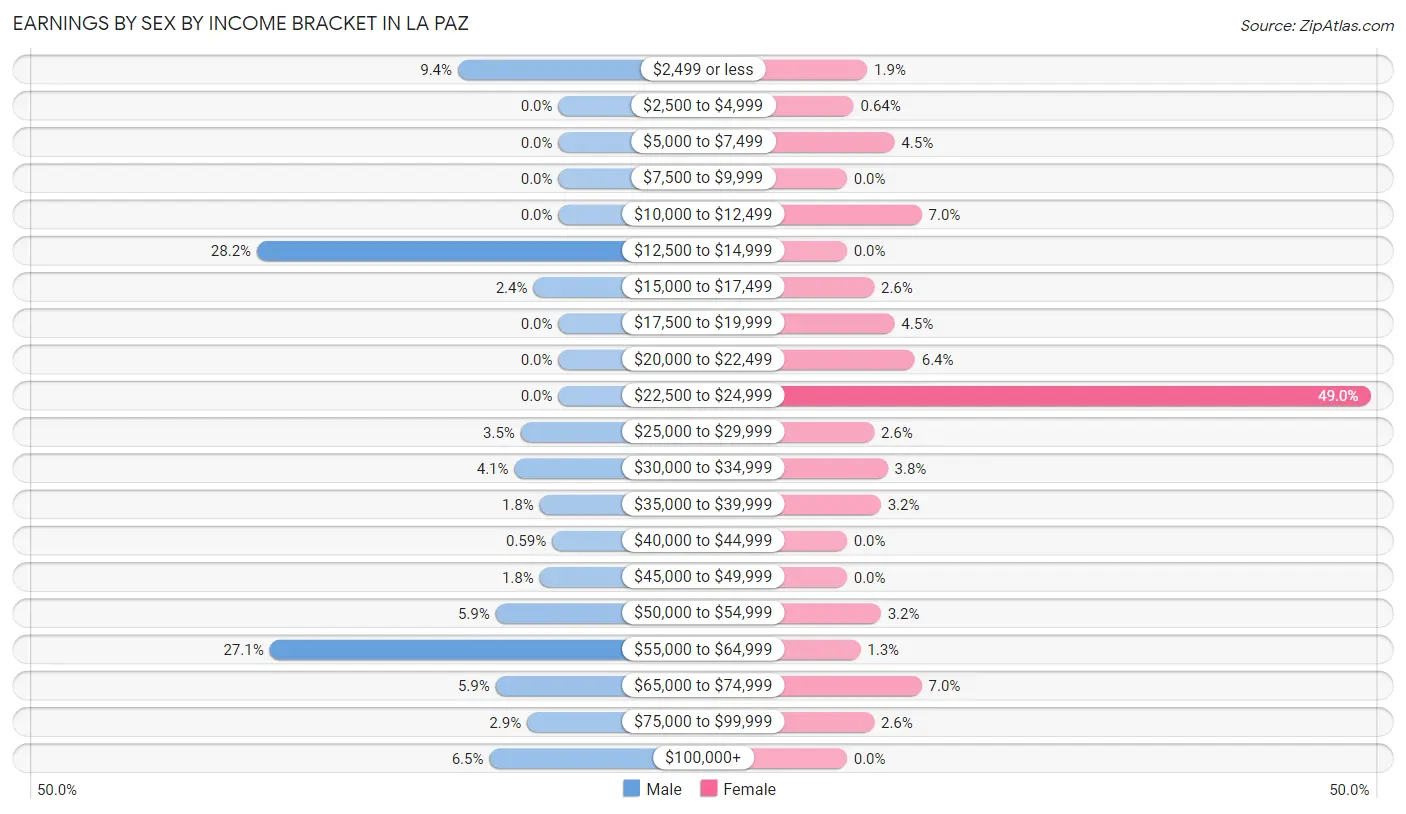
Earnings by Sex by Income Bracket in La Paz
The most common earnings brackets in La Paz are $12,500 to $14,999 for men (48 | 28.2%) and $22,500 to $24,999 for women (77 | 49.0%).
| Income | Male | Female |
| $2,499 or less | 16 (9.4%) | 3 (1.9%) |
| $2,500 to $4,999 | 0 (0.0%) | 1 (0.6%) |
| $5,000 to $7,499 | 0 (0.0%) | 7 (4.5%) |
| $7,500 to $9,999 | 0 (0.0%) | 0 (0.0%) |
| $10,000 to $12,499 | 0 (0.0%) | 11 (7.0%) |
| $12,500 to $14,999 | 48 (28.2%) | 0 (0.0%) |
| $15,000 to $17,499 | 4 (2.4%) | 4 (2.5%) |
| $17,500 to $19,999 | 0 (0.0%) | 7 (4.5%) |
| $20,000 to $22,499 | 0 (0.0%) | 10 (6.4%) |
| $22,500 to $24,999 | 0 (0.0%) | 77 (49.0%) |
| $25,000 to $29,999 | 6 (3.5%) | 4 (2.5%) |
| $30,000 to $34,999 | 7 (4.1%) | 6 (3.8%) |
| $35,000 to $39,999 | 3 (1.8%) | 5 (3.2%) |
| $40,000 to $44,999 | 1 (0.6%) | 0 (0.0%) |
| $45,000 to $49,999 | 3 (1.8%) | 0 (0.0%) |
| $50,000 to $54,999 | 10 (5.9%) | 5 (3.2%) |
| $55,000 to $64,999 | 46 (27.1%) | 2 (1.3%) |
| $65,000 to $74,999 | 10 (5.9%) | 11 (7.0%) |
| $75,000 to $99,999 | 5 (2.9%) | 4 (2.5%) |
| $100,000+ | 11 (6.5%) | 0 (0.0%) |
| Total | 170 (100.0%) | 157 (100.0%) |
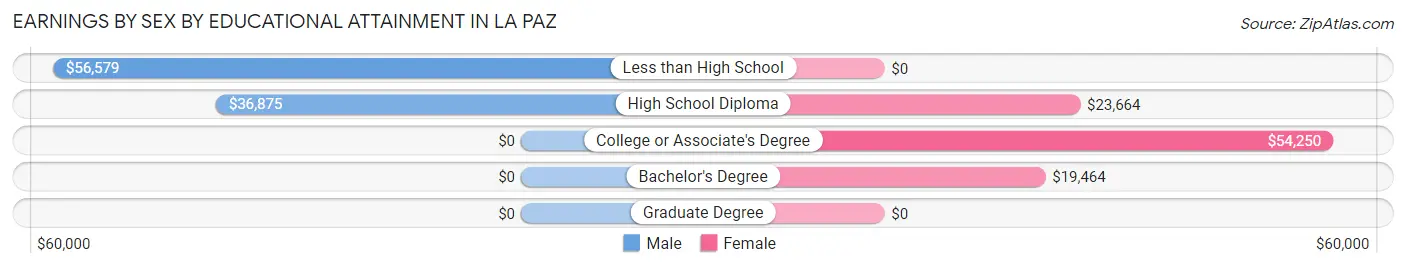
Earnings by Sex by Educational Attainment in La Paz
Average earnings in La Paz are $51,563 for men and $23,766 for women, a difference of 53.9%. Men with an educational attainment of less than high school enjoy the highest average annual earnings of $56,579, while those with high school diploma education earn the least with $36,875. Women with an educational attainment of college or associate's degree earn the most with the average annual earnings of $54,250, while those with bachelor's degree education have the smallest earnings of $19,464.
| Educational Attainment | Male Income | Female Income |
| Less than High School | $56,579 | $0 |
| High School Diploma | $36,875 | $23,664 |
| College or Associate's Degree | - | - |
| Bachelor's Degree | - | - |
| Graduate Degree | - | - |
| Total | $51,563 | $23,766 |
Family Income in La Paz
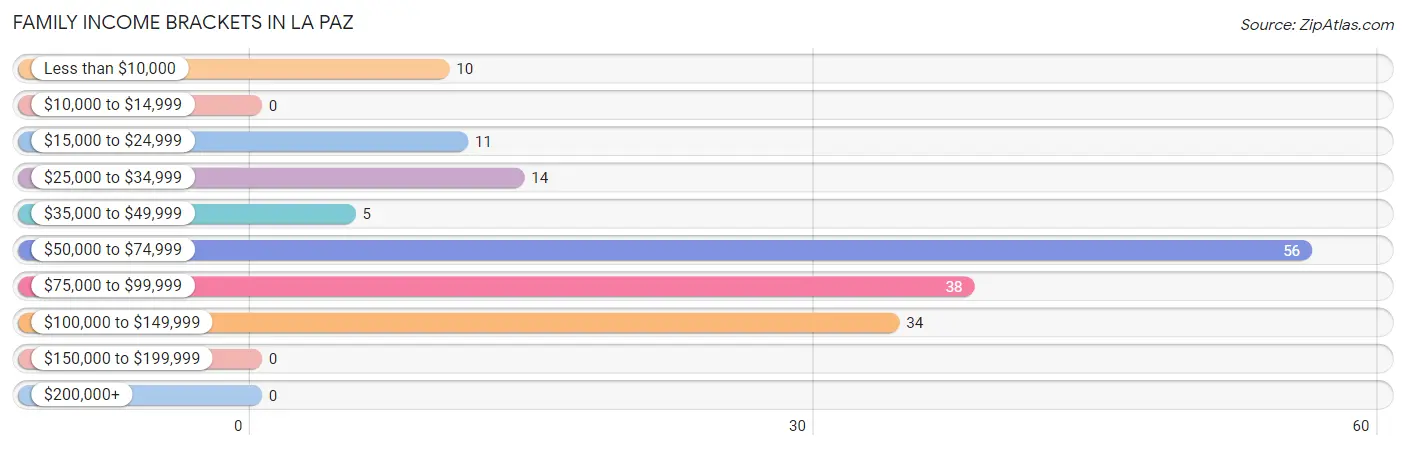
Family Income Brackets in La Paz
According to the La Paz family income data, there are 56 families falling into the $50,000 to $74,999 income range, which is the most common income bracket and makes up 33.3% of all families.
| Income Bracket | # Families | % Families |
| Less than $10,000 | 10 | 6.0% |
| $10,000 to $14,999 | 0 | 0.0% |
| $15,000 to $24,999 | 11 | 6.5% |
| $25,000 to $34,999 | 14 | 8.3% |
| $35,000 to $49,999 | 5 | 3.0% |
| $50,000 to $74,999 | 56 | 33.3% |
| $75,000 to $99,999 | 38 | 22.6% |
| $100,000 to $149,999 | 34 | 20.2% |
| $150,000 to $199,999 | 0 | 0.0% |
| $200,000+ | 0 | 0.0% |
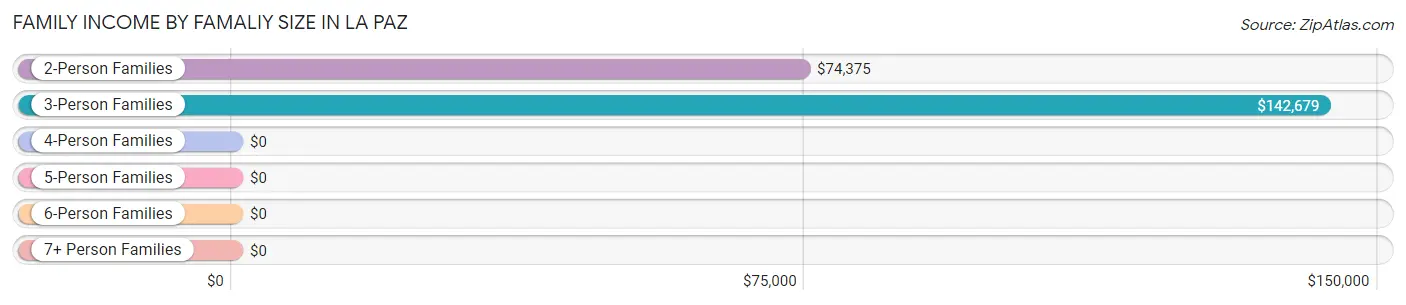
Family Income by Famaliy Size in La Paz
3-person families (13 | 7.7%) account for the highest median family income in La Paz with $142,679 per family, while 3-person families (13 | 7.7%) have the highest median income of $47,560 per family member.
| Income Bracket | # Families | Median Income |
| 2-Person Families | 137 (81.6%) | $74,375 |
| 3-Person Families | 13 (7.7%) | $142,679 |
| 4-Person Families | 2 (1.2%) | $0 |
| 5-Person Families | 3 (1.8%) | $0 |
| 6-Person Families | 13 (7.7%) | $0 |
| 7+ Person Families | 0 (0.0%) | $0 |
| Total | 168 (100.0%) | $74,348 |
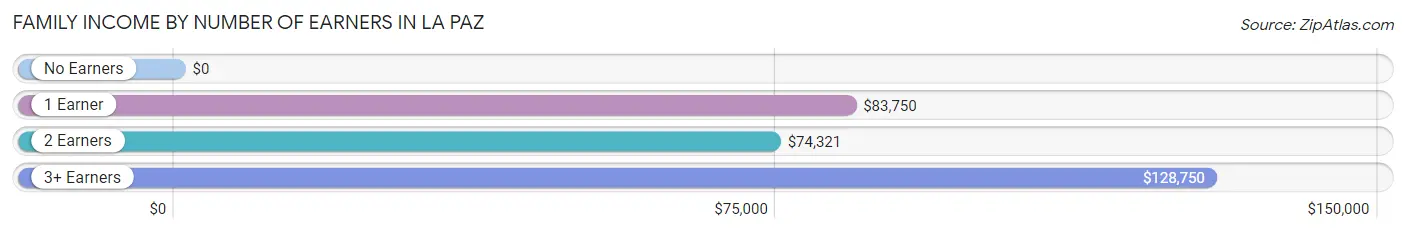
Family Income by Number of Earners in La Paz
| Number of Earners | # Families | Median Income |
| No Earners | 25 (14.9%) | $0 |
| 1 Earner | 30 (17.9%) | $83,750 |
| 2 Earners | 99 (58.9%) | $74,321 |
| 3+ Earners | 14 (8.3%) | $128,750 |
| Total | 168 (100.0%) | $74,348 |
Household Income in La Paz
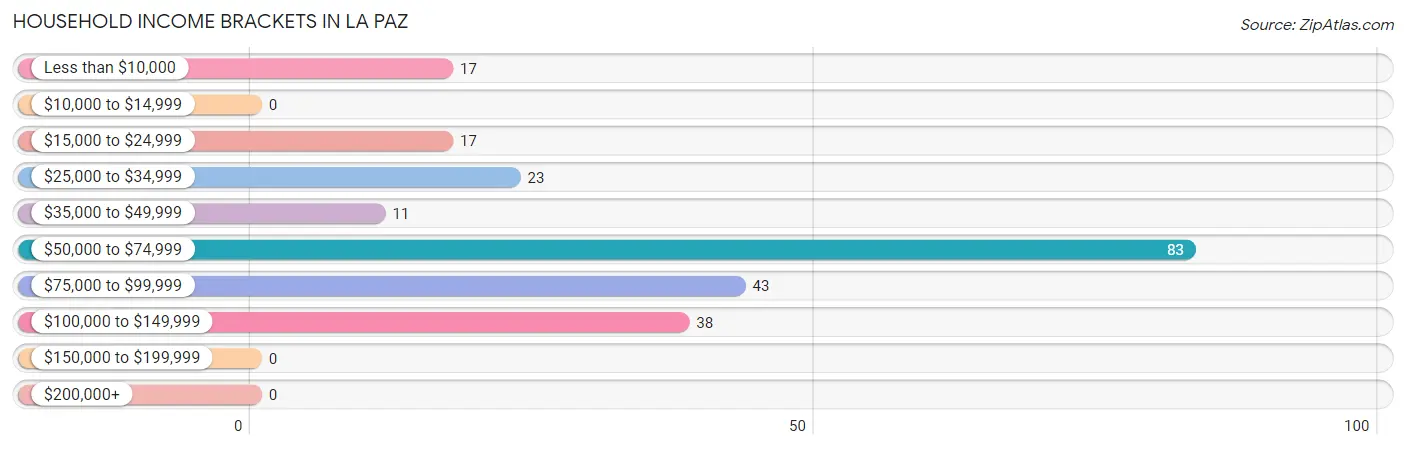
Household Income Brackets in La Paz
With 83 households falling in the category, the $50,000 to $74,999 income range is the most frequent in La Paz, accounting for 35.8% of all households.
| Income Bracket | # Households | % Households |
| Less than $10,000 | 17 | 7.3% |
| $10,000 to $14,999 | 0 | 0.0% |
| $15,000 to $24,999 | 17 | 7.3% |
| $25,000 to $34,999 | 23 | 9.9% |
| $35,000 to $49,999 | 11 | 4.7% |
| $50,000 to $74,999 | 83 | 35.8% |
| $75,000 to $99,999 | 43 | 18.5% |
| $100,000 to $149,999 | 38 | 16.4% |
| $150,000 to $199,999 | 0 | 0.0% |
| $200,000+ | 0 | 0.0% |
Household Income by Householder Age in La Paz
The median household income in La Paz is $73,098, with the highest median household income of $78,158 found in the 25 to 44 years age bracket for the primary householder. A total of 54 households (23.3%) fall into this category.
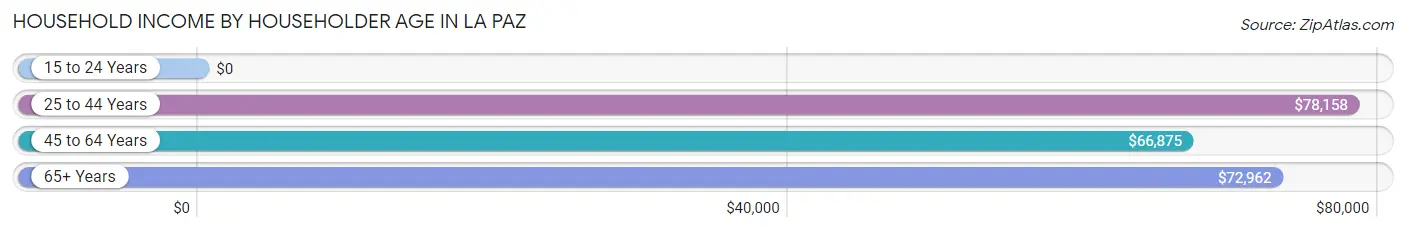
| Income Bracket | # Households | Median Income |
| 15 to 24 Years | 0 (0.0%) | $0 |
| 25 to 44 Years | 54 (23.3%) | $78,158 |
| 45 to 64 Years | 67 (28.9%) | $66,875 |
| 65+ Years | 111 (47.8%) | $72,962 |
| Total | 232 (100.0%) | $73,098 |
Poverty in La Paz
Income Below Poverty by Sex and Age in La Paz
With 27.8% poverty level for males and 22.3% for females among the residents of La Paz, 5 year old males and under 5 year old females are the most vulnerable to poverty, with 9 males (90.0%) and 6 females (100.0%) in their respective age groups living below the poverty level.
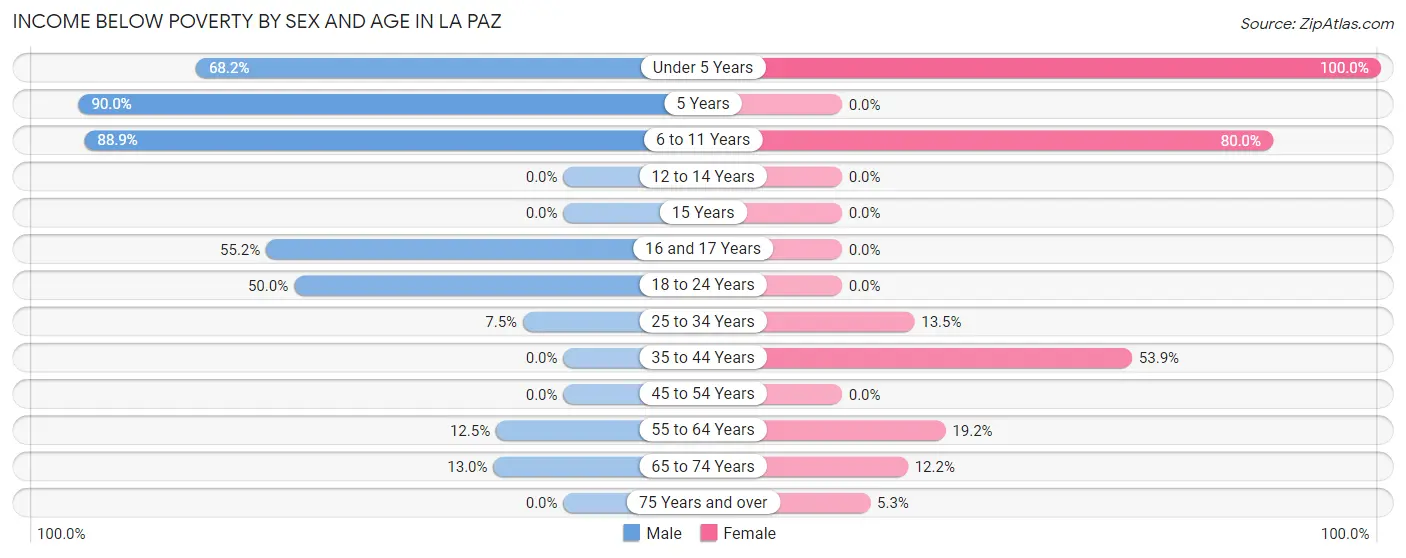
| Age Bracket | Male | Female |
| Under 5 Years | 15 (68.2%) | 6 (100.0%) |
| 5 Years | 9 (90.0%) | 0 (0.0%) |
| 6 to 11 Years | 16 (88.9%) | 8 (80.0%) |
| 12 to 14 Years | 0 (0.0%) | 0 (0.0%) |
| 15 Years | 0 (0.0%) | 0 (0.0%) |
| 16 and 17 Years | 16 (55.2%) | 0 (0.0%) |
| 18 to 24 Years | 9 (50.0%) | 0 (0.0%) |
| 25 to 34 Years | 3 (7.5%) | 7 (13.5%) |
| 35 to 44 Years | 0 (0.0%) | 21 (53.8%) |
| 45 to 54 Years | 0 (0.0%) | 0 (0.0%) |
| 55 to 64 Years | 2 (12.5%) | 5 (19.2%) |
| 65 to 74 Years | 10 (13.0%) | 6 (12.2%) |
| 75 Years and over | 0 (0.0%) | 1 (5.3%) |
| Total | 80 (27.8%) | 54 (22.3%) |
Income Above Poverty by Sex and Age in La Paz
According to the poverty statistics in La Paz, males aged 35 to 44 years and females aged 5 years are the age groups that are most secure financially, with 100.0% of males and 100.0% of females in these age groups living above the poverty line.
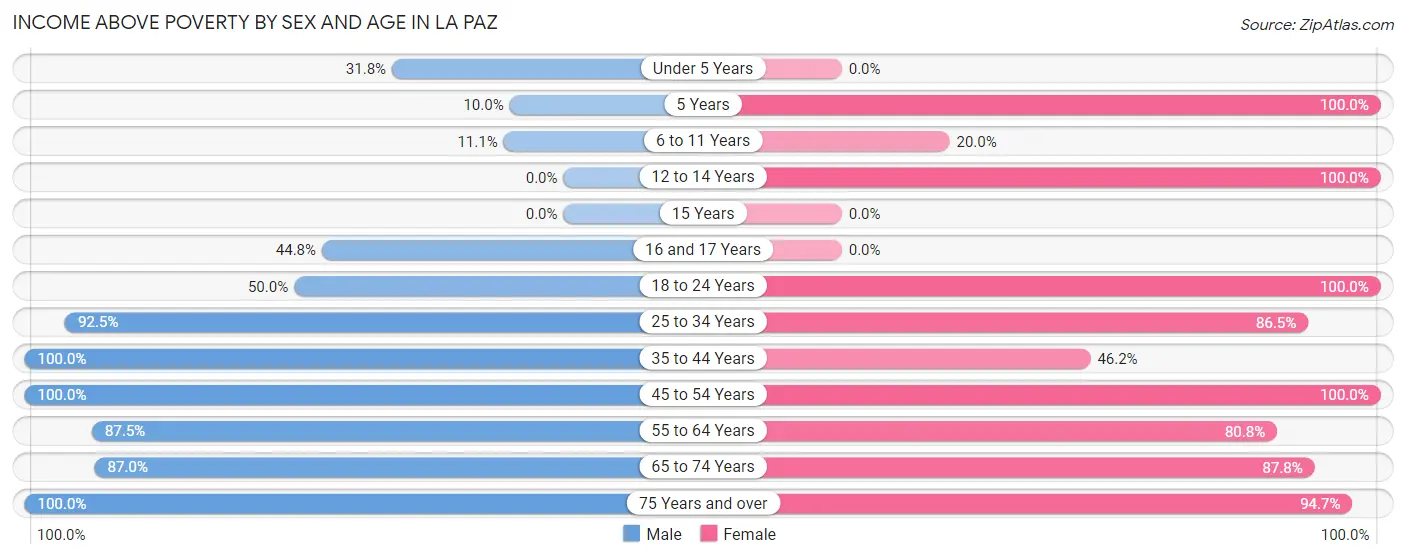
| Age Bracket | Male | Female |
| Under 5 Years | 7 (31.8%) | 0 (0.0%) |
| 5 Years | 1 (10.0%) | 3 (100.0%) |
| 6 to 11 Years | 2 (11.1%) | 2 (20.0%) |
| 12 to 14 Years | 0 (0.0%) | 2 (100.0%) |
| 15 Years | 0 (0.0%) | 0 (0.0%) |
| 16 and 17 Years | 13 (44.8%) | 0 (0.0%) |
| 18 to 24 Years | 9 (50.0%) | 10 (100.0%) |
| 25 to 34 Years | 37 (92.5%) | 45 (86.5%) |
| 35 to 44 Years | 11 (100.0%) | 18 (46.2%) |
| 45 to 54 Years | 34 (100.0%) | 26 (100.0%) |
| 55 to 64 Years | 14 (87.5%) | 21 (80.8%) |
| 65 to 74 Years | 67 (87.0%) | 43 (87.8%) |
| 75 Years and over | 13 (100.0%) | 18 (94.7%) |
| Total | 208 (72.2%) | 188 (77.7%) |
Income Below Poverty Among Married-Couple Families in La Paz
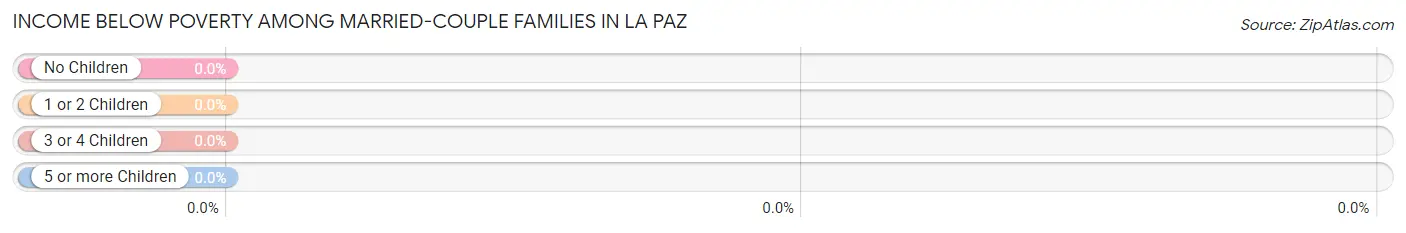
| Children | Above Poverty | Below Poverty |
| No Children | 112 (100.0%) | 0 (0.0%) |
| 1 or 2 Children | 8 (100.0%) | 0 (0.0%) |
| 3 or 4 Children | 1 (100.0%) | 0 (0.0%) |
| 5 or more Children | 0 (0.0%) | 0 (0.0%) |
| Total | 121 (100.0%) | 0 (0.0%) |
Income Below Poverty Among Single-Parent Households in La Paz
According to the poverty data in La Paz, 45.0% or 9 single-father households and 51.8% or 14 single-mother households are living below the poverty line. Among single-father households, those with no children have the highest poverty rate, with 9 households (81.8%) experiencing poverty. Likewise, among single-mother households, those with 3 or 4 children have the highest poverty rate, with 4 households (100.0%) falling below the poverty line.
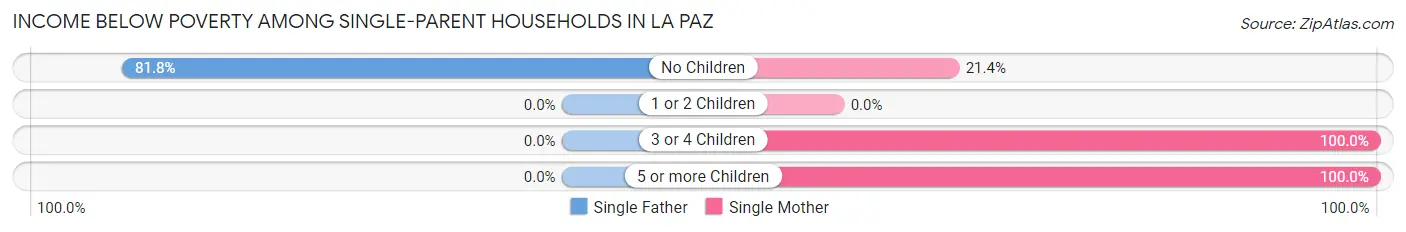
| Children | Single Father | Single Mother |
| No Children | 9 (81.8%) | 3 (21.4%) |
| 1 or 2 Children | 0 (0.0%) | 0 (0.0%) |
| 3 or 4 Children | 0 (0.0%) | 4 (100.0%) |
| 5 or more Children | 0 (0.0%) | 7 (100.0%) |
| Total | 9 (45.0%) | 14 (51.8%) |
Income Below Poverty Among Married-Couple vs Single-Parent Households in La Paz
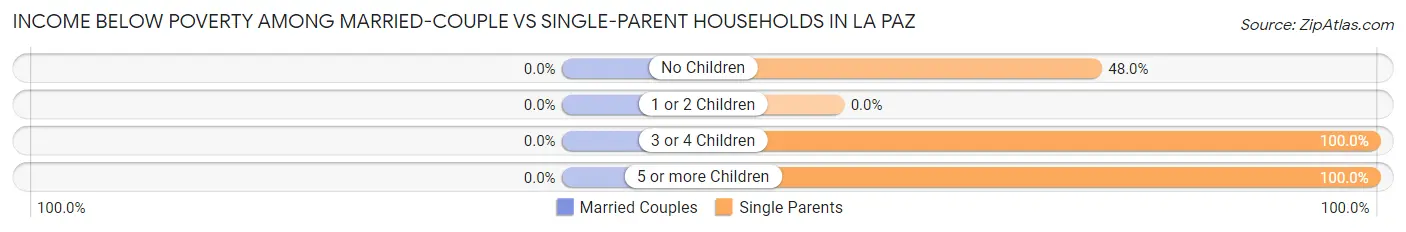
| Children | Married-Couple Families | Single-Parent Households |
| No Children | 0 (0.0%) | 12 (48.0%) |
| 1 or 2 Children | 0 (0.0%) | 0 (0.0%) |
| 3 or 4 Children | 0 (0.0%) | 4 (100.0%) |
| 5 or more Children | 0 (0.0%) | 7 (100.0%) |
| Total | 0 (0.0%) | 23 (48.9%) |
Race in La Paz
The most populous races in La Paz are White / Caucasian (477 | 89.0%), Two or more Races (53 | 9.9%), and Hispanic or Latino (11 | 2.1%).
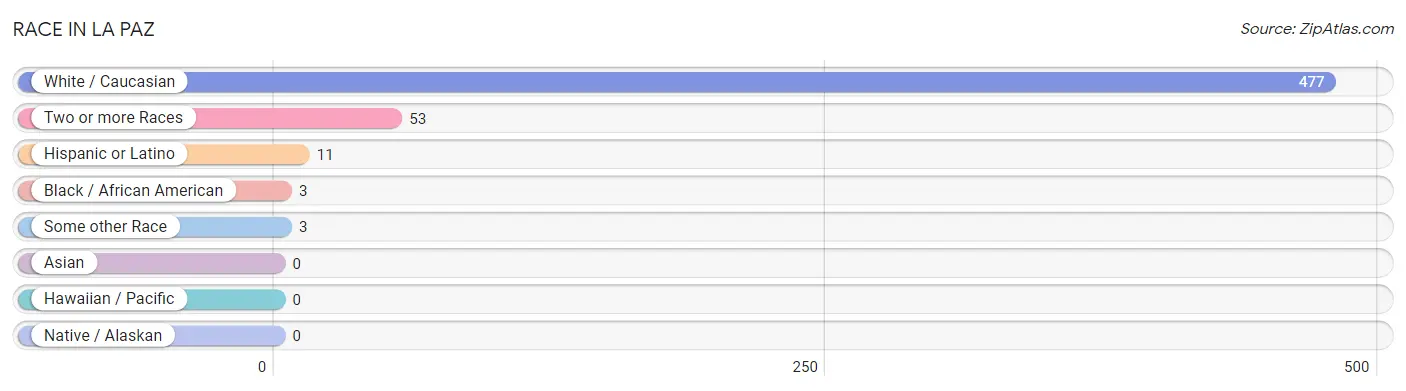
| Race | # Population | % Population |
| Asian | 0 | 0.0% |
| Black / African American | 3 | 0.6% |
| Hawaiian / Pacific | 0 | 0.0% |
| Hispanic or Latino | 11 | 2.1% |
| Native / Alaskan | 0 | 0.0% |
| White / Caucasian | 477 | 89.0% |
| Two or more Races | 53 | 9.9% |
| Some other Race | 3 | 0.6% |
| Total | 536 | 100.0% |
Ancestry in La Paz
The most populous ancestries reported in La Paz are German (181 | 33.8%), Irish (104 | 19.4%), Scottish (33 | 6.2%), Polish (16 | 3.0%), and American (12 | 2.2%), together accounting for 64.6% of all La Paz residents.
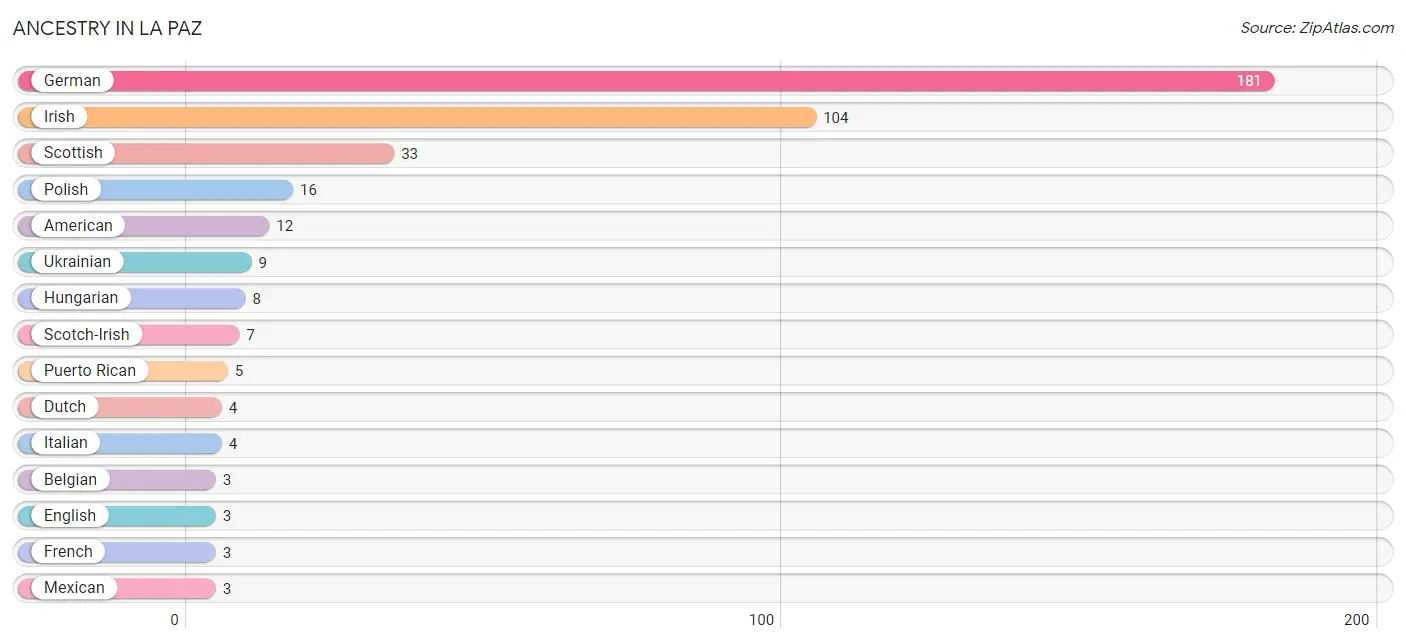
| Ancestry | # Population | % Population |
| American | 12 | 2.2% |
| Belgian | 3 | 0.6% |
| Dutch | 4 | 0.7% |
| English | 3 | 0.6% |
| French | 3 | 0.6% |
| German | 181 | 33.8% |
| Hungarian | 8 | 1.5% |
| Irish | 104 | 19.4% |
| Italian | 4 | 0.7% |
| Mexican | 3 | 0.6% |
| Polish | 16 | 3.0% |
| Puerto Rican | 5 | 0.9% |
| Scotch-Irish | 7 | 1.3% |
| Scottish | 33 | 6.2% |
| Swedish | 1 | 0.2% |
| Ukrainian | 9 | 1.7% | View All 16 Rows |
Immigrants in La Paz
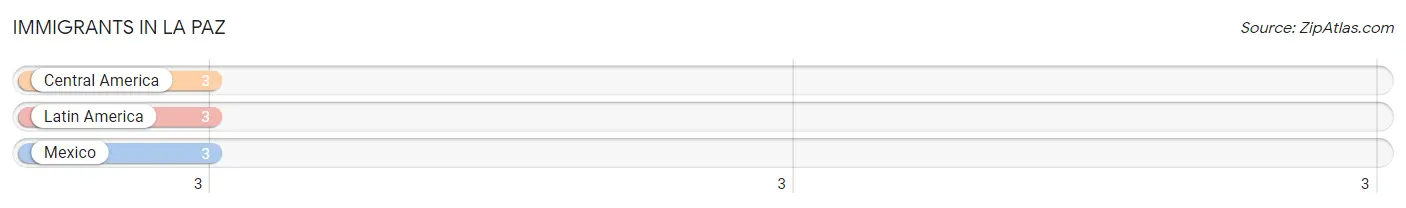
The most numerous immigrant groups reported in La Paz came from Central America (3 | 0.6%), Latin America (3 | 0.6%), and Mexico (3 | 0.6%), together accounting for 1.7% of all La Paz residents.
| Immigration Origin | # Population | % Population |
| Central America | 3 | 0.6% |
| Latin America | 3 | 0.6% |
| Mexico | 3 | 0.6% | View All 3 Rows |
Sex and Age in La Paz
Sex and Age in La Paz
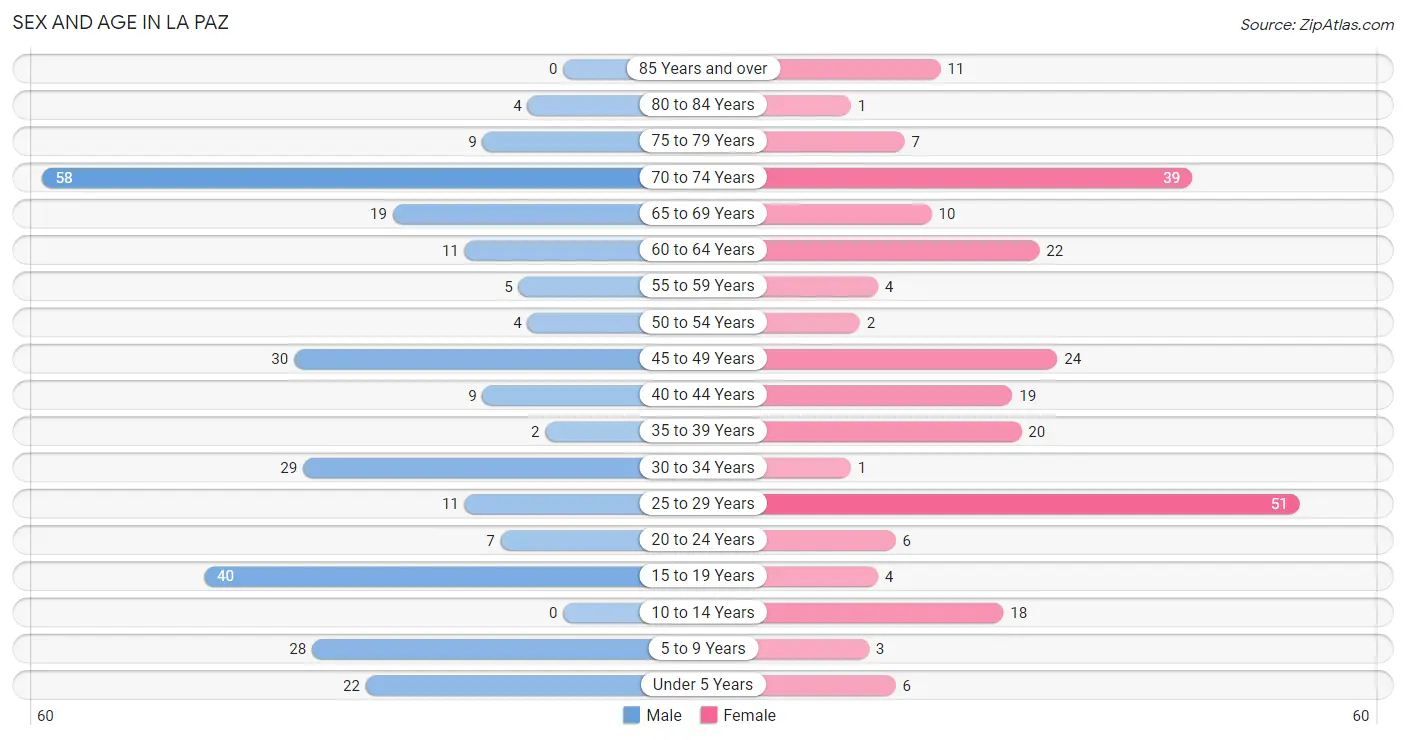
The most populous age groups in La Paz are 70 to 74 Years (58 | 20.1%) for men and 25 to 29 Years (51 | 20.6%) for women.
| Age Bracket | Male | Female |
| Under 5 Years | 22 (7.6%) | 6 (2.4%) |
| 5 to 9 Years | 28 (9.7%) | 3 (1.2%) |
| 10 to 14 Years | 0 (0.0%) | 18 (7.3%) |
| 15 to 19 Years | 40 (13.9%) | 4 (1.6%) |
| 20 to 24 Years | 7 (2.4%) | 6 (2.4%) |
| 25 to 29 Years | 11 (3.8%) | 51 (20.6%) |
| 30 to 34 Years | 29 (10.1%) | 1 (0.4%) |
| 35 to 39 Years | 2 (0.7%) | 20 (8.1%) |
| 40 to 44 Years | 9 (3.1%) | 19 (7.7%) |
| 45 to 49 Years | 30 (10.4%) | 24 (9.7%) |
| 50 to 54 Years | 4 (1.4%) | 2 (0.8%) |
| 55 to 59 Years | 5 (1.7%) | 4 (1.6%) |
| 60 to 64 Years | 11 (3.8%) | 22 (8.9%) |
| 65 to 69 Years | 19 (6.6%) | 10 (4.0%) |
| 70 to 74 Years | 58 (20.1%) | 39 (15.7%) |
| 75 to 79 Years | 9 (3.1%) | 7 (2.8%) |
| 80 to 84 Years | 4 (1.4%) | 1 (0.4%) |
| 85 Years and over | 0 (0.0%) | 11 (4.4%) |
| Total | 288 (100.0%) | 248 (100.0%) |
Families and Households in La Paz
Median Family Size in La Paz
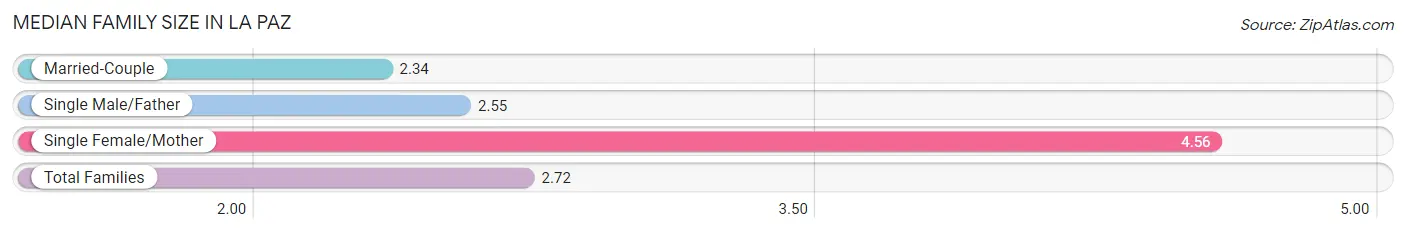
The median family size in La Paz is 2.72 persons per family, with single female/mother families (27 | 16.1%) accounting for the largest median family size of 4.56 persons per family. On the other hand, married-couple families (121 | 72.0%) represent the smallest median family size with 2.34 persons per family.
| Family Type | # Families | Family Size |
| Married-Couple | 121 (72.0%) | 2.34 |
| Single Male/Father | 20 (11.9%) | 2.55 |
| Single Female/Mother | 27 (16.1%) | 4.56 |
| Total Families | 168 (100.0%) | 2.72 |
Median Household Size in La Paz
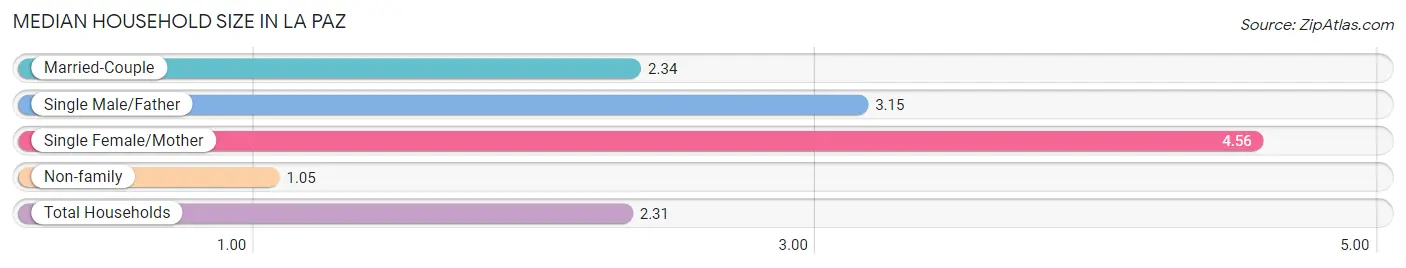
The median household size in La Paz is 2.31 persons per household, with single female/mother households (27 | 11.6%) accounting for the largest median household size of 4.56 persons per household. non-family households (64 | 27.6%) represent the smallest median household size with 1.05 persons per household.
| Household Type | # Households | Household Size |
| Married-Couple | 121 (52.2%) | 2.34 |
| Single Male/Father | 20 (8.6%) | 3.15 |
| Single Female/Mother | 27 (11.6%) | 4.56 |
| Non-family | 64 (27.6%) | 1.05 |
| Total Households | 232 (100.0%) | 2.31 |
Household Size by Marriage Status in La Paz
Out of a total of 232 households in La Paz, 168 (72.4%) are family households, while 64 (27.6%) are nonfamily households. The most numerous type of family households are 2-person households, comprising 132, and the most common type of nonfamily households are 1-person households, comprising 61.
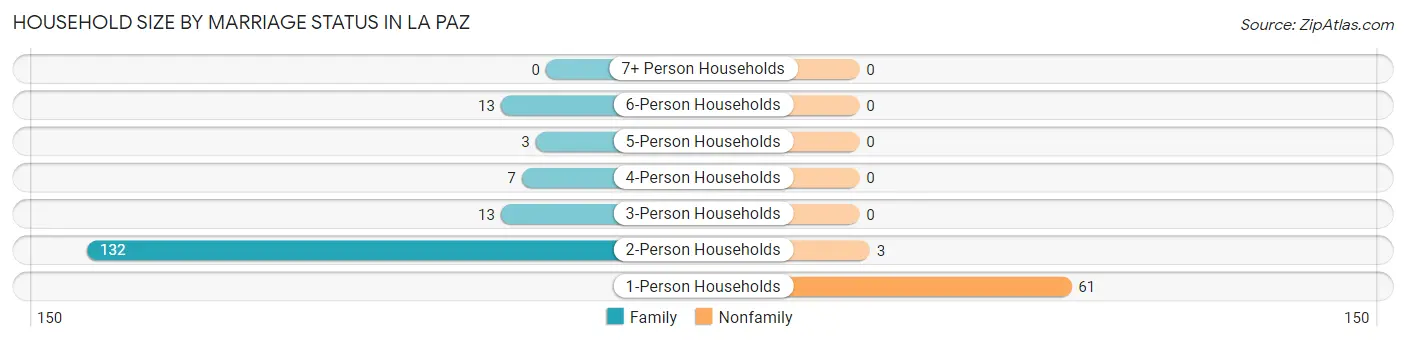
| Household Size | Family Households | Nonfamily Households |
| 1-Person Households | - | 61 (26.3%) |
| 2-Person Households | 132 (56.9%) | 3 (1.3%) |
| 3-Person Households | 13 (5.6%) | 0 (0.0%) |
| 4-Person Households | 7 (3.0%) | 0 (0.0%) |
| 5-Person Households | 3 (1.3%) | 0 (0.0%) |
| 6-Person Households | 13 (5.6%) | 0 (0.0%) |
| 7+ Person Households | 0 (0.0%) | 0 (0.0%) |
| Total | 168 (72.4%) | 64 (27.6%) |
Female Fertility in La Paz
Fertility by Age in La Paz
Average fertility rate in La Paz is 102.0 births per 1,000 women. Women in the age bracket of 20 to 34 years have the highest fertility rate with 224.0 births per 1,000 women. Women in the age bracket of 20 to 34 years acount for 100.0% of all women with births.
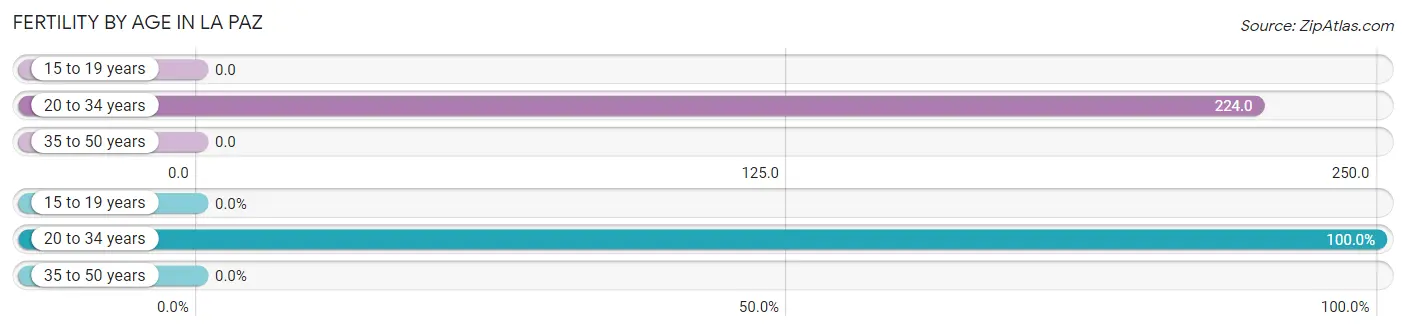
| Age Bracket | Women with Births | Births / 1,000 Women |
| 15 to 19 years | 0 (0.0%) | 0.0 |
| 20 to 34 years | 13 (100.0%) | 224.0 |
| 35 to 50 years | 0 (0.0%) | 0.0 |
| Total | 13 (100.0%) | 102.0 |
Fertility by Age by Marriage Status in La Paz
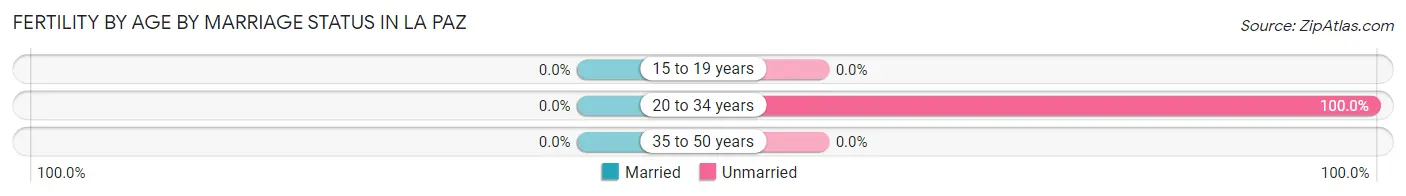
| Age Bracket | Married | Unmarried |
| 15 to 19 years | 0 (0.0%) | 0 (0.0%) |
| 20 to 34 years | 0 (0.0%) | 13 (100.0%) |
| 35 to 50 years | 0 (0.0%) | 0 (0.0%) |
| Total | 0 (0.0%) | 13 (100.0%) |
Fertility by Education in La Paz
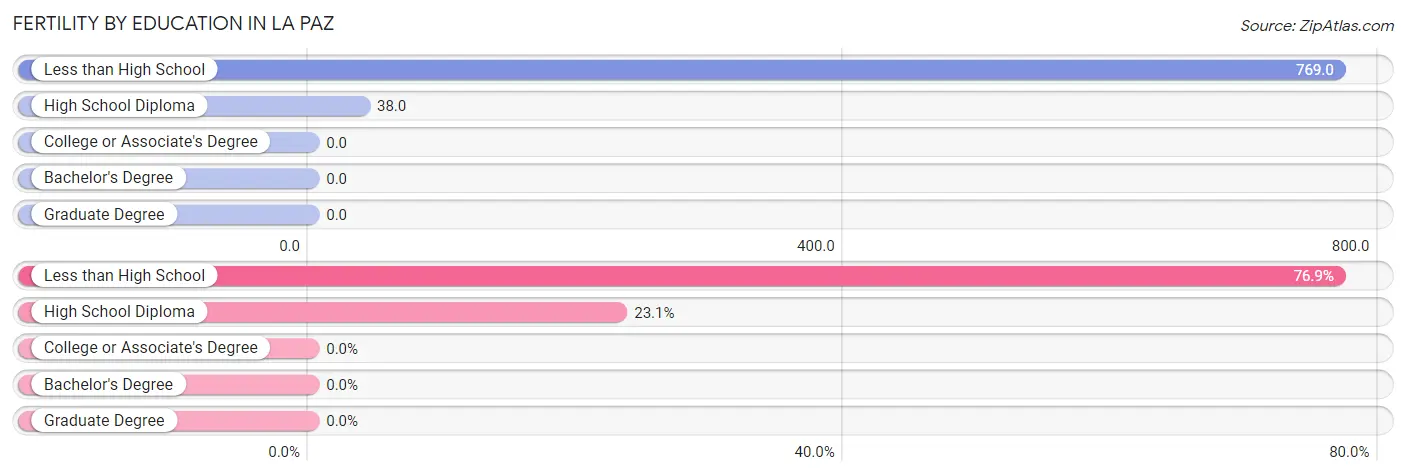
| Educational Attainment | Women with Births | Births / 1,000 Women |
| Less than High School | 10 (76.9%) | 769.0 |
| High School Diploma | 3 (23.1%) | 38.0 |
| College or Associate's Degree | 0 (0.0%) | 0.0 |
| Bachelor's Degree | 0 (0.0%) | 0.0 |
| Graduate Degree | 0 (0.0%) | 0.0 |
| Total | 13 (100.0%) | 102.0 |
Fertility by Education by Marriage Status in La Paz
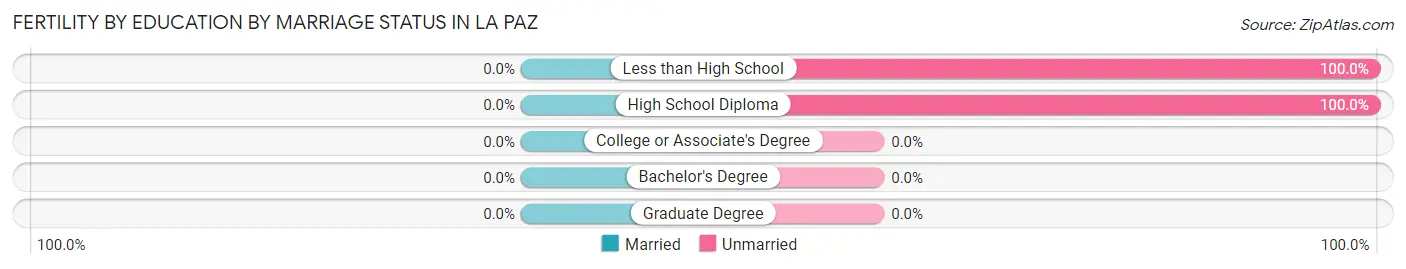
| Educational Attainment | Married | Unmarried |
| Less than High School | 0 (0.0%) | 10 (100.0%) |
| High School Diploma | 0 (0.0%) | 3 (100.0%) |
| College or Associate's Degree | 0 (0.0%) | 0 (0.0%) |
| Bachelor's Degree | 0 (0.0%) | 0 (0.0%) |
| Graduate Degree | 0 (0.0%) | 0 (0.0%) |
| Total | 0 (0.0%) | 13 (100.0%) |
Employment Characteristics in La Paz
Employment by Class of Employer in La Paz
Among the 318 employed individuals in La Paz, private company employees (268 | 84.3%), not-for-profit organizations (29 | 9.1%), and local government employees (15 | 4.7%) make up the most common classes of employment.
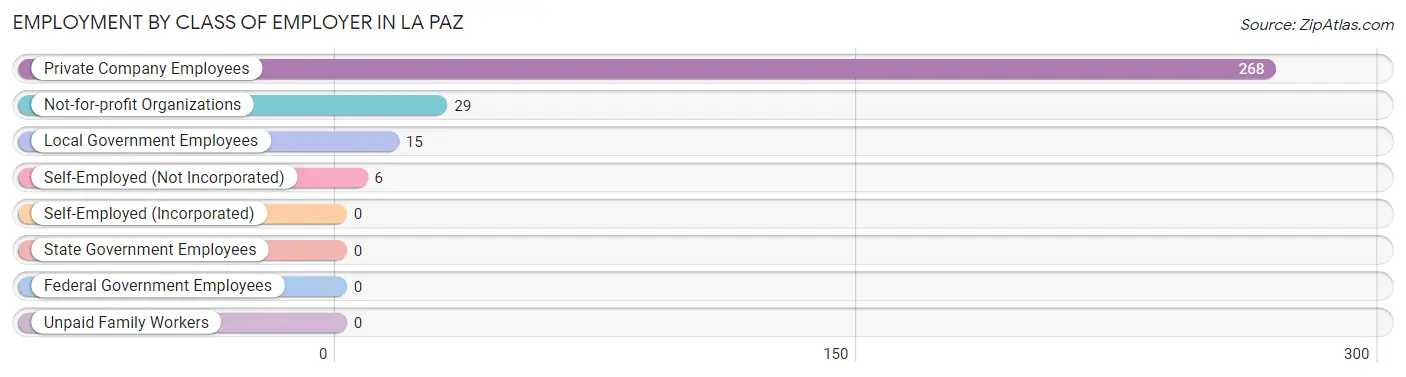
| Employer Class | # Employees | % Employees |
| Private Company Employees | 268 | 84.3% |
| Self-Employed (Incorporated) | 0 | 0.0% |
| Self-Employed (Not Incorporated) | 6 | 1.9% |
| Not-for-profit Organizations | 29 | 9.1% |
| Local Government Employees | 15 | 4.7% |
| State Government Employees | 0 | 0.0% |
| Federal Government Employees | 0 | 0.0% |
| Unpaid Family Workers | 0 | 0.0% |
| Total | 318 | 100.0% |
Employment Status by Age in La Paz
According to the labor force statistics for La Paz, out of the total population over 16 years of age (459), 70.6% or 324 individuals are in the labor force, with 1.9% or 6 of them unemployed. The age group with the highest labor force participation rate is 30 to 34 years, with 100.0% or 30 individuals in the labor force. Within the labor force, the 30 to 34 years age range has the highest percentage of unemployed individuals, with 10.0% or 3 of them being unemployed.
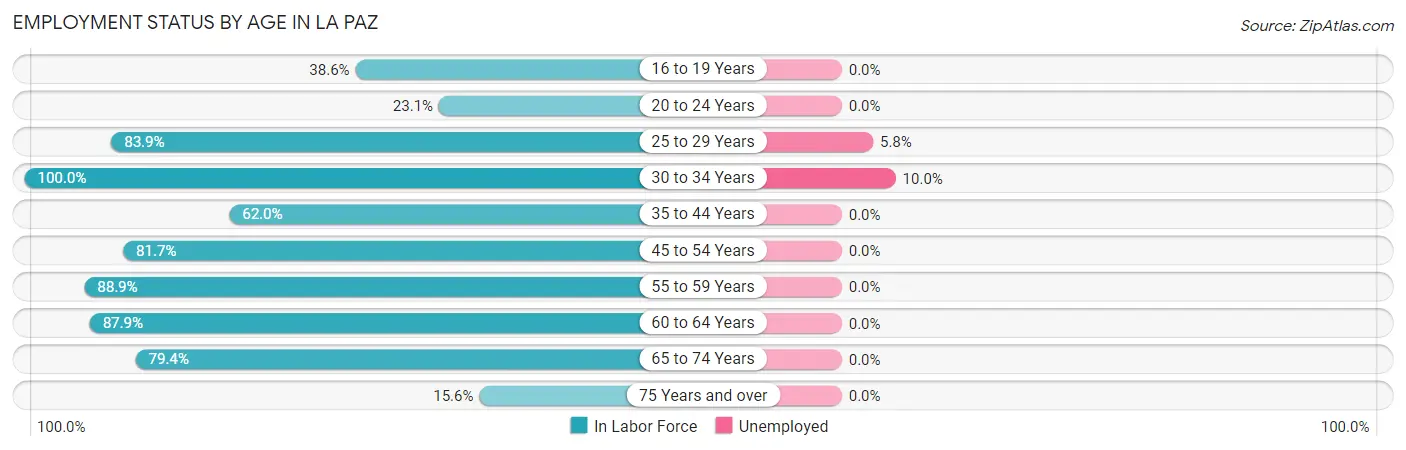
| Age Bracket | In Labor Force | Unemployed |
| 16 to 19 Years | 17 (38.6%) | 0 (0.0%) |
| 20 to 24 Years | 3 (23.1%) | 0 (0.0%) |
| 25 to 29 Years | 52 (83.9%) | 3 (5.8%) |
| 30 to 34 Years | 30 (100.0%) | 3 (10.0%) |
| 35 to 44 Years | 31 (62.0%) | 0 (0.0%) |
| 45 to 54 Years | 49 (81.7%) | 0 (0.0%) |
| 55 to 59 Years | 8 (88.9%) | 0 (0.0%) |
| 60 to 64 Years | 29 (87.9%) | 0 (0.0%) |
| 65 to 74 Years | 100 (79.4%) | 0 (0.0%) |
| 75 Years and over | 5 (15.6%) | 0 (0.0%) |
| Total | 324 (70.6%) | 6 (1.9%) |
Employment Status by Educational Attainment in La Paz
According to labor force statistics for La Paz, 81.6% of individuals (199) out of the total population between 25 and 64 years of age (244) are in the labor force, with 3.0% or 6 of them being unemployed. The group with the highest labor force participation rate are those with the educational attainment of college / associate degree, with 100.0% or 57 individuals in the labor force. Within the labor force, individuals with high school diploma education have the highest percentage of unemployment, with 6.7% or 6 of them being unemployed.
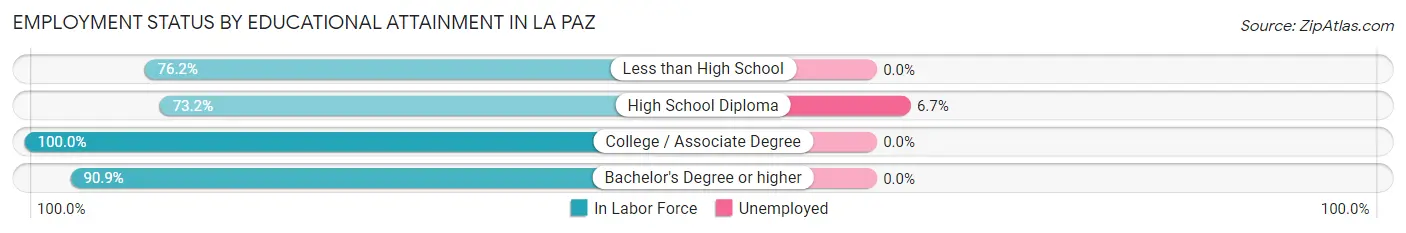
| Educational Attainment | In Labor Force | Unemployed |
| Less than High School | 32 (76.2%) | 0 (0.0%) |
| High School Diploma | 90 (73.2%) | 8 (6.7%) |
| College / Associate Degree | 57 (100.0%) | 0 (0.0%) |
| Bachelor's Degree or higher | 20 (90.9%) | 0 (0.0%) |
| Total | 199 (81.6%) | 7 (3.0%) |
Employment Occupations by Sex in La Paz
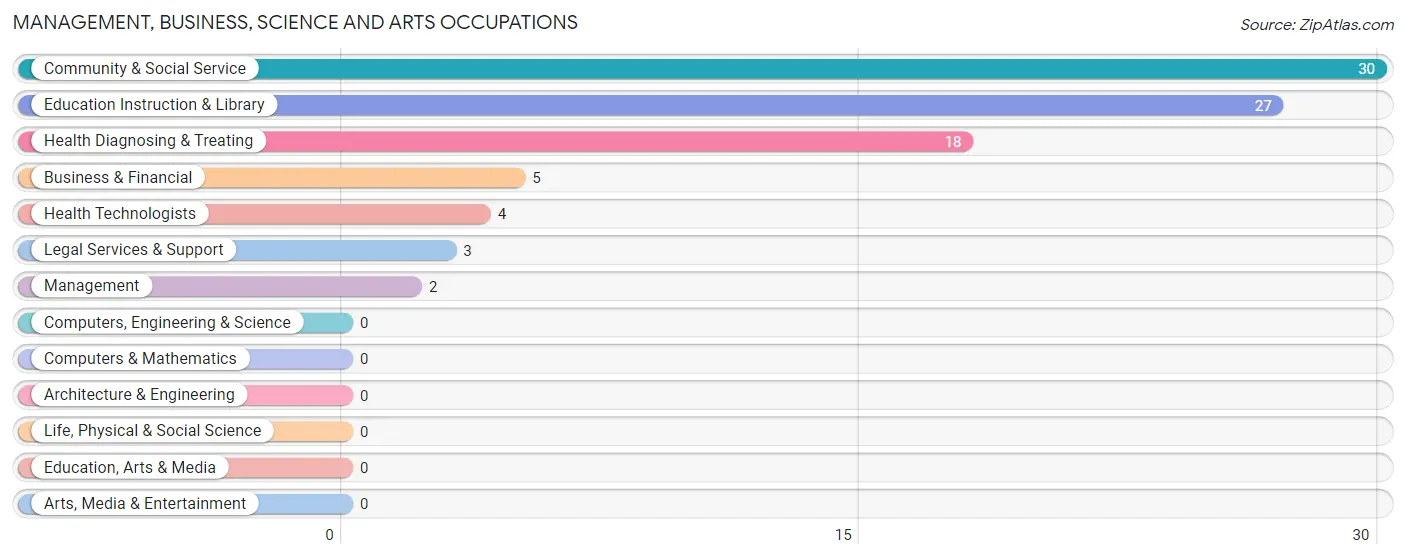
Management, Business, Science and Arts Occupations
The most common Management, Business, Science and Arts occupations in La Paz are Community & Social Service (30 | 9.4%), Education Instruction & Library (27 | 8.5%), Health Diagnosing & Treating (18 | 5.7%), Business & Financial (5 | 1.6%), and Health Technologists (4 | 1.3%).
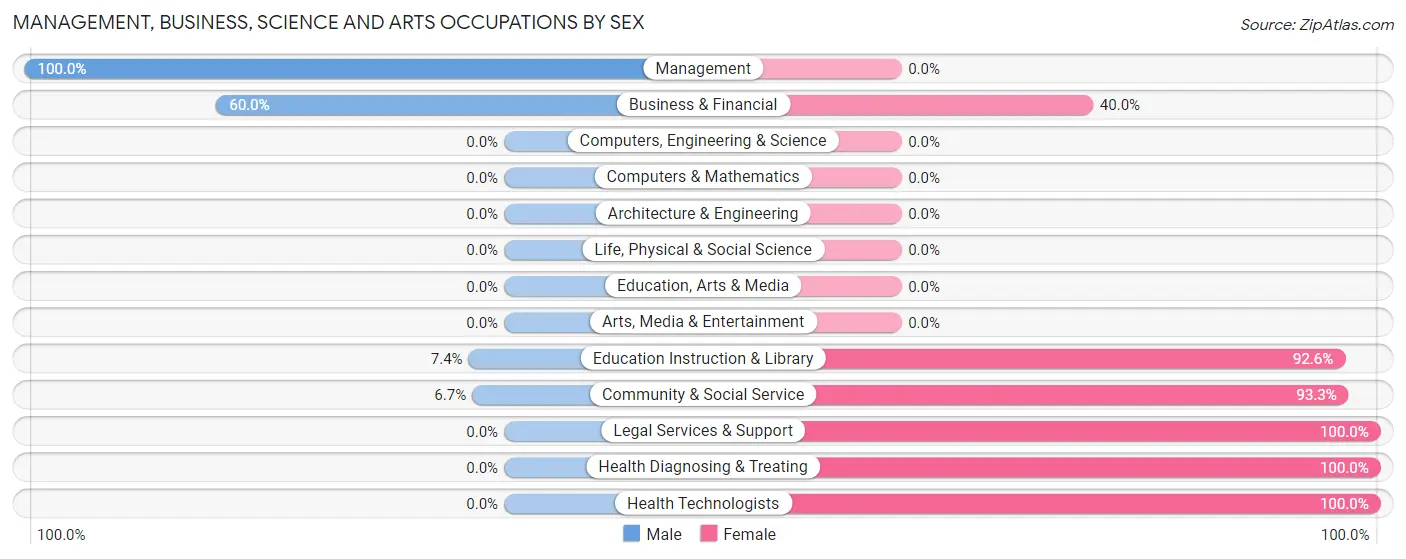
Management, Business, Science and Arts Occupations by Sex
Within the Management, Business, Science and Arts occupations in La Paz, the most male-oriented occupations are Management (100.0%), Business & Financial (60.0%), and Education Instruction & Library (7.4%), while the most female-oriented occupations are Legal Services & Support (100.0%), Health Diagnosing & Treating (100.0%), and Health Technologists (100.0%).
| Occupation | Male | Female |
| Management | 2 (100.0%) | 0 (0.0%) |
| Business & Financial | 3 (60.0%) | 2 (40.0%) |
| Computers, Engineering & Science | 0 (0.0%) | 0 (0.0%) |
| Computers & Mathematics | 0 (0.0%) | 0 (0.0%) |
| Architecture & Engineering | 0 (0.0%) | 0 (0.0%) |
| Life, Physical & Social Science | 0 (0.0%) | 0 (0.0%) |
| Community & Social Service | 2 (6.7%) | 28 (93.3%) |
| Education, Arts & Media | 0 (0.0%) | 0 (0.0%) |
| Legal Services & Support | 0 (0.0%) | 3 (100.0%) |
| Education Instruction & Library | 2 (7.4%) | 25 (92.6%) |
| Arts, Media & Entertainment | 0 (0.0%) | 0 (0.0%) |
| Health Diagnosing & Treating | 0 (0.0%) | 18 (100.0%) |
| Health Technologists | 0 (0.0%) | 4 (100.0%) |
| Total (Category) | 7 (12.7%) | 48 (87.3%) |
| Total (Overall) | 164 (51.6%) | 154 (48.4%) |
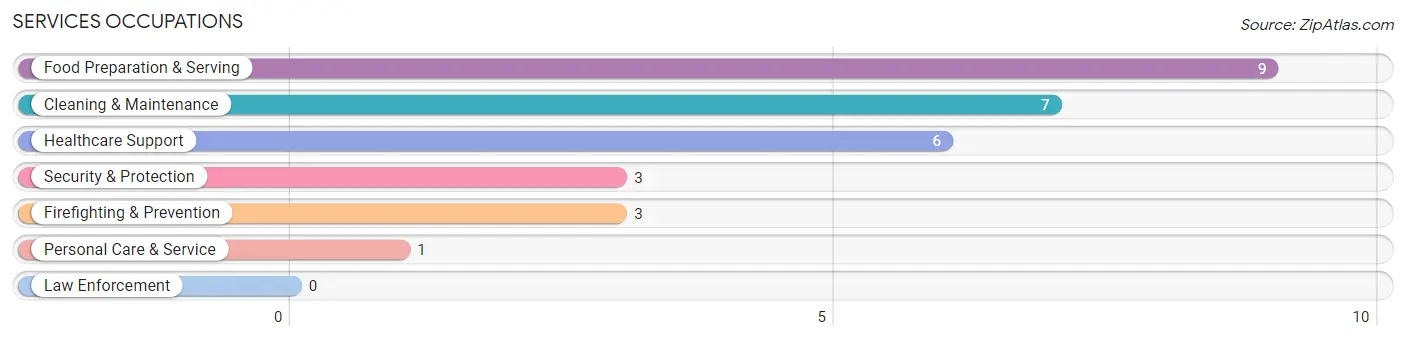
Services Occupations
The most common Services occupations in La Paz are Food Preparation & Serving (9 | 2.8%), Cleaning & Maintenance (7 | 2.2%), Healthcare Support (6 | 1.9%), Security & Protection (3 | 0.9%), and Firefighting & Prevention (3 | 0.9%).
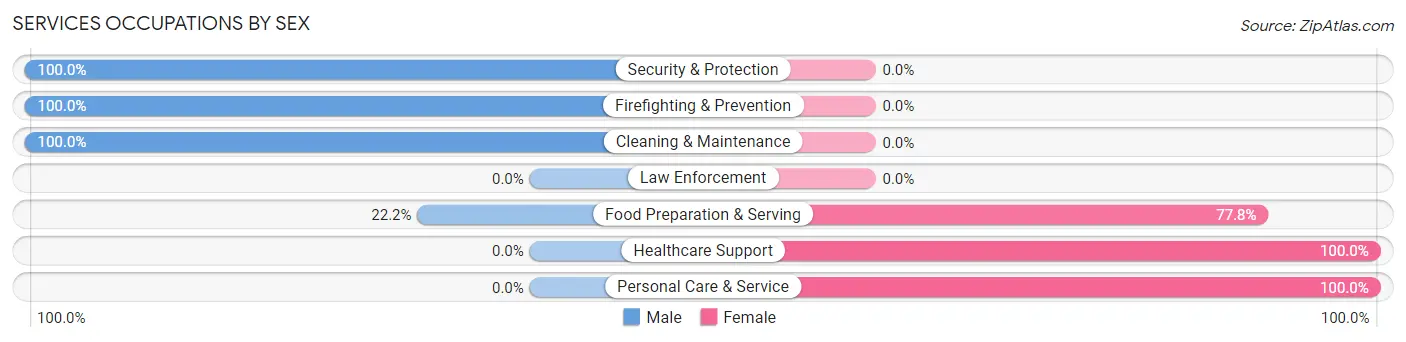
Services Occupations by Sex
Within the Services occupations in La Paz, the most male-oriented occupations are Security & Protection (100.0%), Firefighting & Prevention (100.0%), and Cleaning & Maintenance (100.0%), while the most female-oriented occupations are Healthcare Support (100.0%), Personal Care & Service (100.0%), and Food Preparation & Serving (77.8%).
| Occupation | Male | Female |
| Healthcare Support | 0 (0.0%) | 6 (100.0%) |
| Security & Protection | 3 (100.0%) | 0 (0.0%) |
| Firefighting & Prevention | 3 (100.0%) | 0 (0.0%) |
| Law Enforcement | 0 (0.0%) | 0 (0.0%) |
| Food Preparation & Serving | 2 (22.2%) | 7 (77.8%) |
| Cleaning & Maintenance | 7 (100.0%) | 0 (0.0%) |
| Personal Care & Service | 0 (0.0%) | 1 (100.0%) |
| Total (Category) | 12 (46.2%) | 14 (53.8%) |
| Total (Overall) | 164 (51.6%) | 154 (48.4%) |
Sales and Office Occupations
The most common Sales and Office occupations in La Paz are Sales & Related (82 | 25.8%), and Office & Administration (7 | 2.2%).
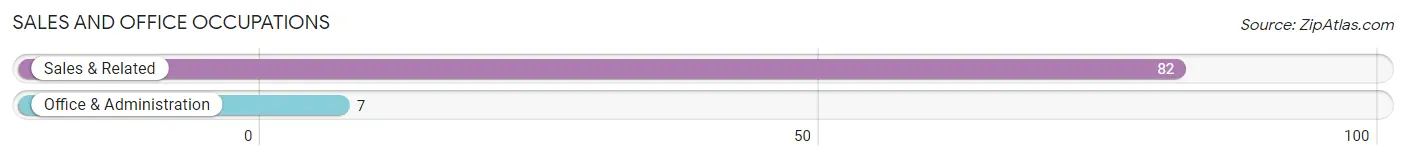
Sales and Office Occupations by Sex
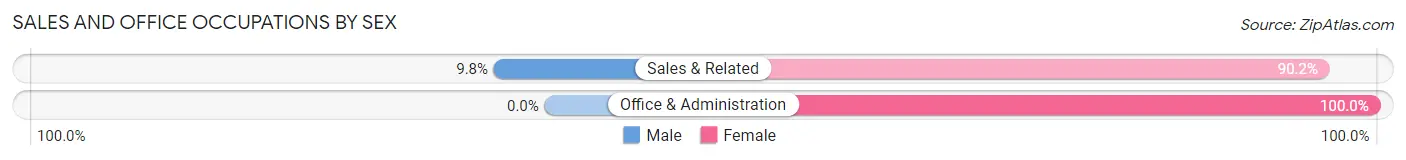
| Occupation | Male | Female |
| Sales & Related | 8 (9.8%) | 74 (90.2%) |
| Office & Administration | 0 (0.0%) | 7 (100.0%) |
| Total (Category) | 8 (9.0%) | 81 (91.0%) |
| Total (Overall) | 164 (51.6%) | 154 (48.4%) |
Natural Resources, Construction and Maintenance Occupations
The most common Natural Resources, Construction and Maintenance occupations in La Paz are Construction & Extraction (14 | 4.4%), and Installation, Maintenance & Repair (12 | 3.8%).
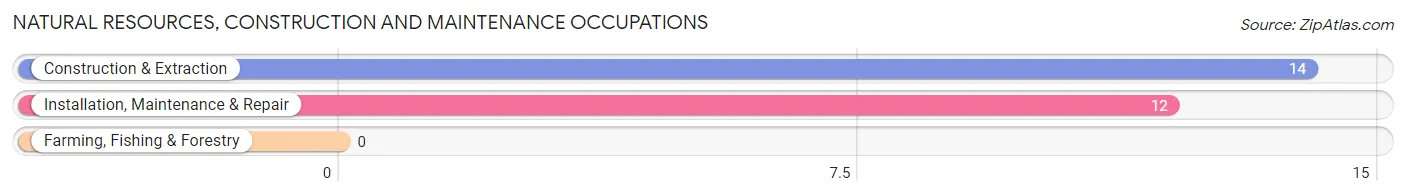
Natural Resources, Construction and Maintenance Occupations by Sex
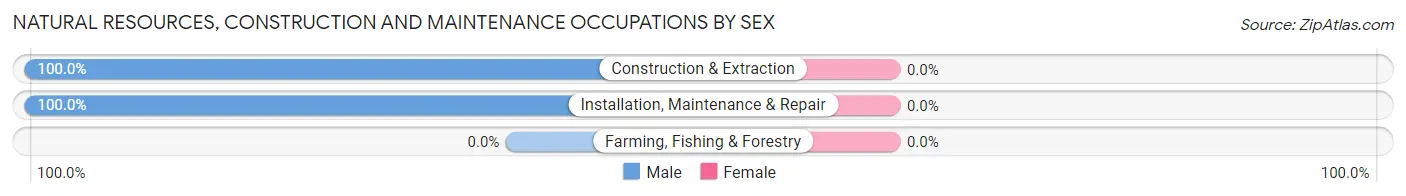
| Occupation | Male | Female |
| Farming, Fishing & Forestry | 0 (0.0%) | 0 (0.0%) |
| Construction & Extraction | 14 (100.0%) | 0 (0.0%) |
| Installation, Maintenance & Repair | 12 (100.0%) | 0 (0.0%) |
| Total (Category) | 26 (100.0%) | 0 (0.0%) |
| Total (Overall) | 164 (51.6%) | 154 (48.4%) |
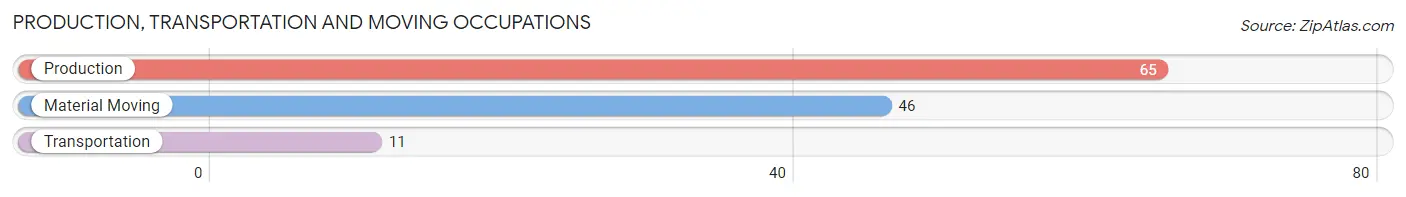
Production, Transportation and Moving Occupations
The most common Production, Transportation and Moving occupations in La Paz are Production (65 | 20.4%), Material Moving (46 | 14.5%), and Transportation (11 | 3.5%).
Production, Transportation and Moving Occupations by Sex
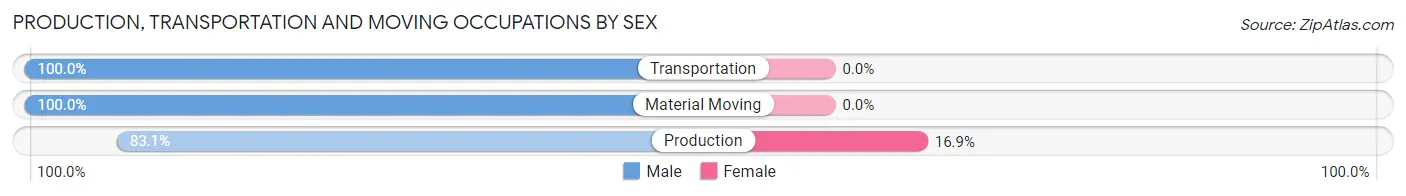
| Occupation | Male | Female |
| Production | 54 (83.1%) | 11 (16.9%) |
| Transportation | 11 (100.0%) | 0 (0.0%) |
| Material Moving | 46 (100.0%) | 0 (0.0%) |
| Total (Category) | 111 (91.0%) | 11 (9.0%) |
| Total (Overall) | 164 (51.6%) | 154 (48.4%) |
Employment Industries by Sex in La Paz
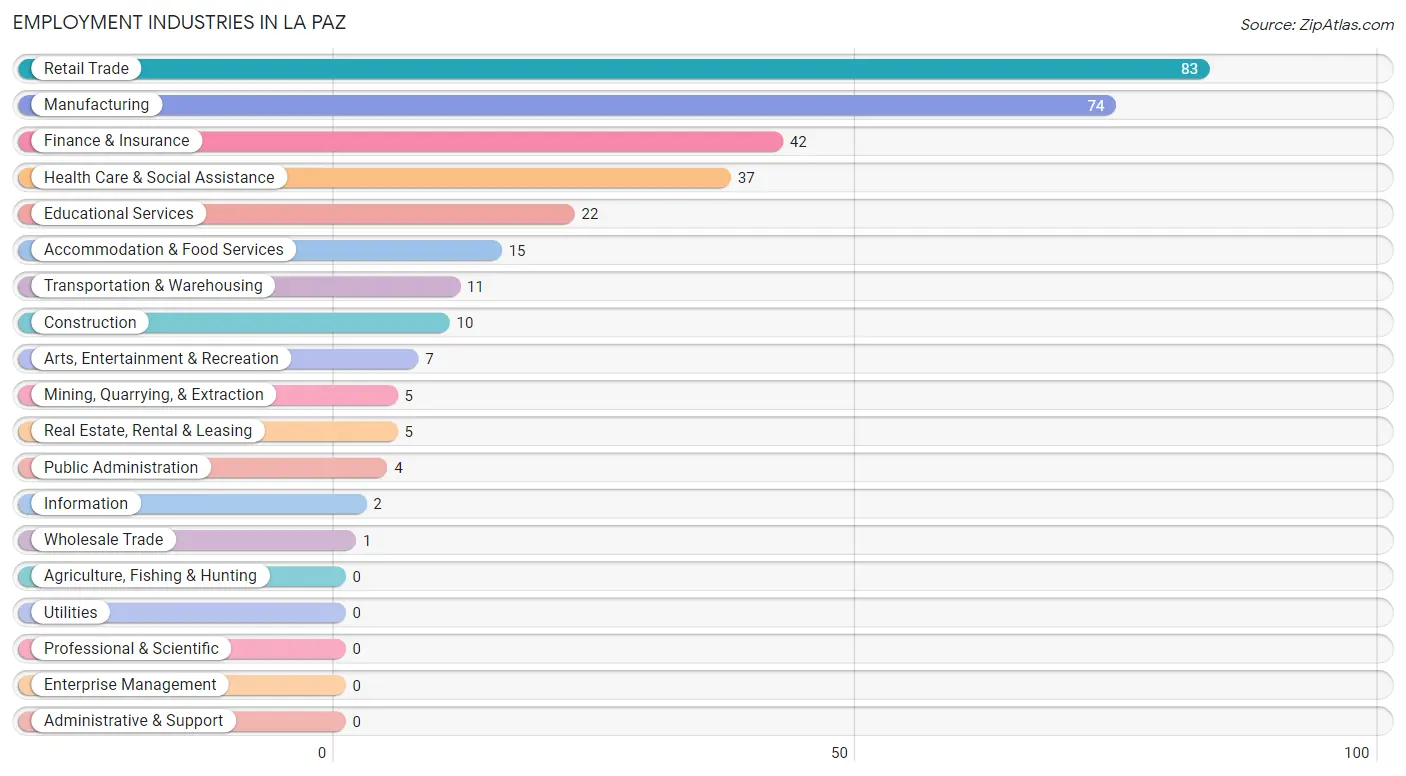
Employment Industries in La Paz
The major employment industries in La Paz include Retail Trade (83 | 26.1%), Manufacturing (74 | 23.3%), Finance & Insurance (42 | 13.2%), Health Care & Social Assistance (37 | 11.6%), and Educational Services (22 | 6.9%).
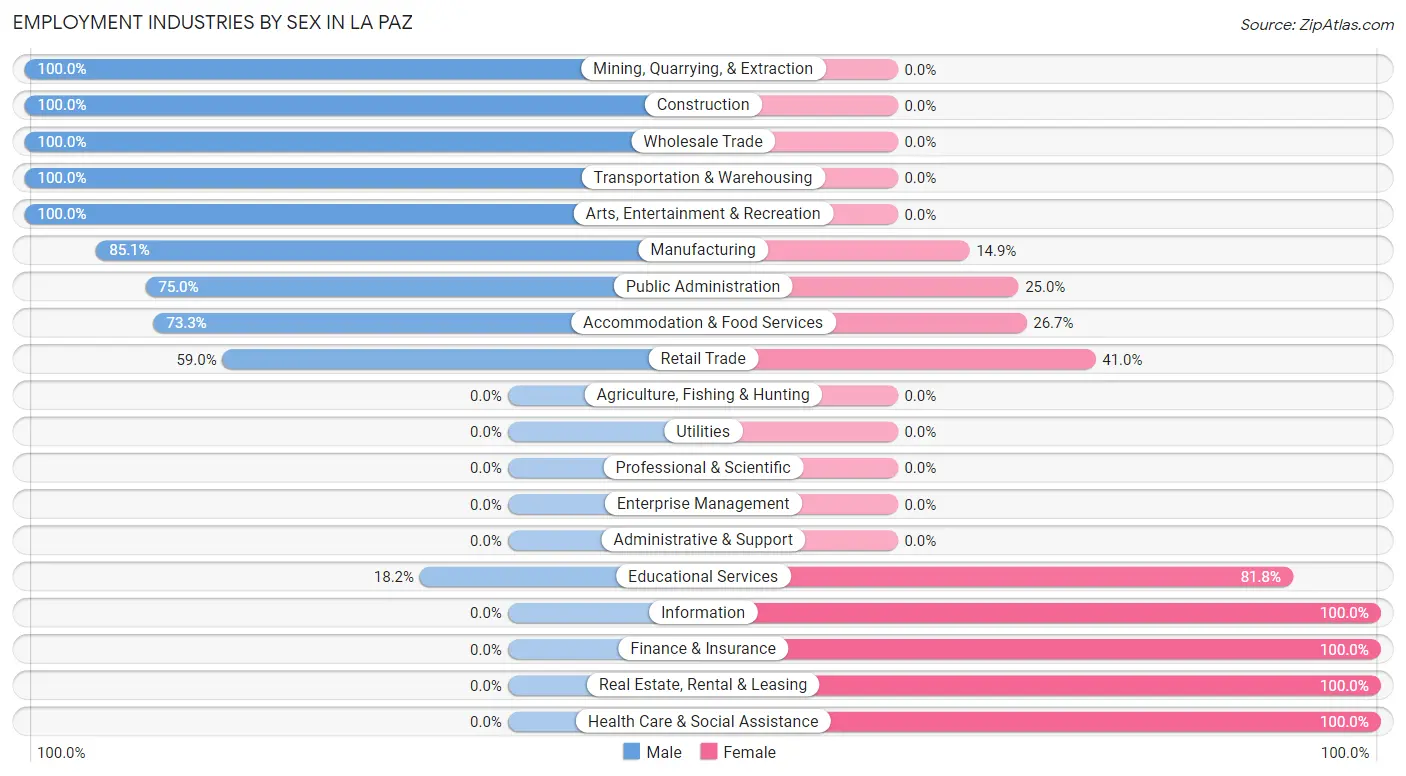
Employment Industries by Sex in La Paz
The La Paz industries that see more men than women are Mining, Quarrying, & Extraction (100.0%), Construction (100.0%), and Wholesale Trade (100.0%), whereas the industries that tend to have a higher number of women are Information (100.0%), Finance & Insurance (100.0%), and Real Estate, Rental & Leasing (100.0%).
| Industry | Male | Female |
| Agriculture, Fishing & Hunting | 0 (0.0%) | 0 (0.0%) |
| Mining, Quarrying, & Extraction | 5 (100.0%) | 0 (0.0%) |
| Construction | 10 (100.0%) | 0 (0.0%) |
| Manufacturing | 63 (85.1%) | 11 (14.9%) |
| Wholesale Trade | 1 (100.0%) | 0 (0.0%) |
| Retail Trade | 49 (59.0%) | 34 (41.0%) |
| Transportation & Warehousing | 11 (100.0%) | 0 (0.0%) |
| Utilities | 0 (0.0%) | 0 (0.0%) |
| Information | 0 (0.0%) | 2 (100.0%) |
| Finance & Insurance | 0 (0.0%) | 42 (100.0%) |
| Real Estate, Rental & Leasing | 0 (0.0%) | 5 (100.0%) |
| Professional & Scientific | 0 (0.0%) | 0 (0.0%) |
| Enterprise Management | 0 (0.0%) | 0 (0.0%) |
| Administrative & Support | 0 (0.0%) | 0 (0.0%) |
| Educational Services | 4 (18.2%) | 18 (81.8%) |
| Health Care & Social Assistance | 0 (0.0%) | 37 (100.0%) |
| Arts, Entertainment & Recreation | 7 (100.0%) | 0 (0.0%) |
| Accommodation & Food Services | 11 (73.3%) | 4 (26.7%) |
| Public Administration | 3 (75.0%) | 1 (25.0%) |
| Total | 164 (51.6%) | 154 (48.4%) |
Education in La Paz
School Enrollment in La Paz
The most common levels of schooling among the 101 students in La Paz are high school (34 | 33.7%), nursery / preschool (21 | 20.8%), and elementary school (18 | 17.8%).
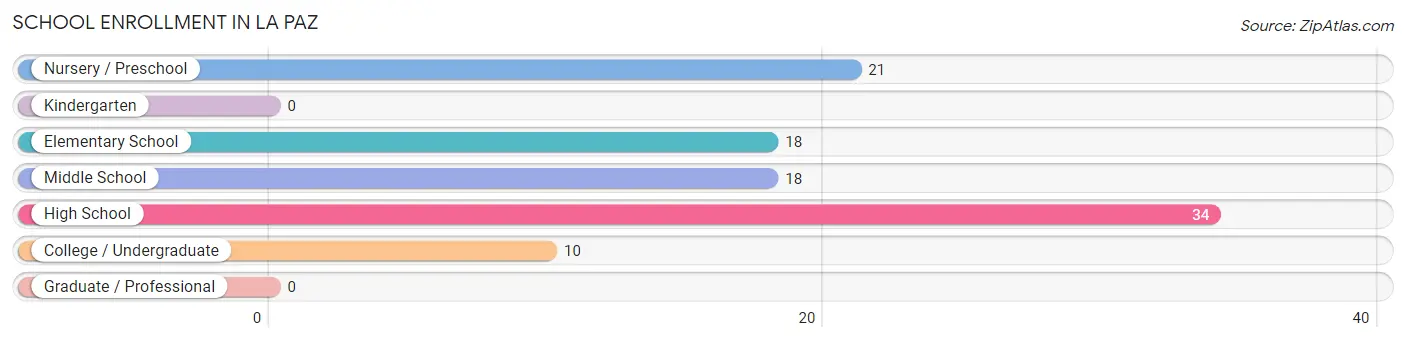
| School Level | # Students | % Students |
| Nursery / Preschool | 21 | 20.8% |
| Kindergarten | 0 | 0.0% |
| Elementary School | 18 | 17.8% |
| Middle School | 18 | 17.8% |
| High School | 34 | 33.7% |
| College / Undergraduate | 10 | 9.9% |
| Graduate / Professional | 0 | 0.0% |
| Total | 101 | 100.0% |
School Enrollment by Age by Funding Source in La Paz
Out of a total of 101 students who are enrolled in schools in La Paz, 5 (5.0%) attend a private institution, while the remaining 96 (95.0%) are enrolled in public schools. The age group of 3 to 4 year olds has the highest likelihood of being enrolled in private schools, with 2 (25.0% in the age bracket) enrolled. Conversely, the age group of 10 to 14 year olds has the lowest likelihood of being enrolled in a private school, with 18 (100.0% in the age bracket) attending a public institution.
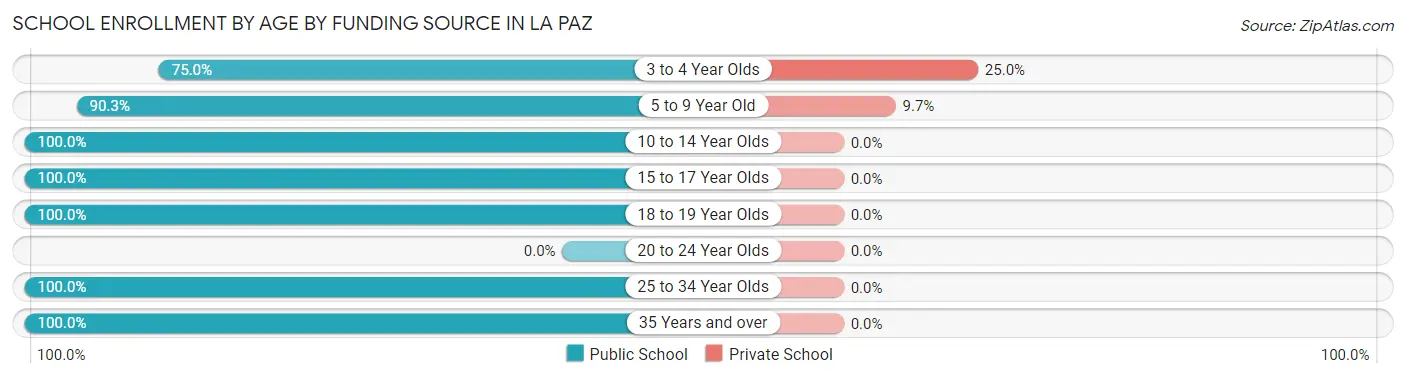
| Age Bracket | Public School | Private School |
| 3 to 4 Year Olds | 6 (75.0%) | 2 (25.0%) |
| 5 to 9 Year Old | 28 (90.3%) | 3 (9.7%) |
| 10 to 14 Year Olds | 18 (100.0%) | 0 (0.0%) |
| 15 to 17 Year Olds | 21 (100.0%) | 0 (0.0%) |
| 18 to 19 Year Olds | 15 (100.0%) | 0 (0.0%) |
| 20 to 24 Year Olds | 0 (0.0%) | 0 (0.0%) |
| 25 to 34 Year Olds | 6 (100.0%) | 0 (0.0%) |
| 35 Years and over | 2 (100.0%) | 0 (0.0%) |
| Total | 96 (95.0%) | 5 (5.0%) |
Educational Attainment by Field of Study in La Paz
Education (16 | 43.2%), communications (7 | 18.9%), arts & humanities (7 | 18.9%), visual & performing arts (4 | 10.8%), and science & technology (2 | 5.4%) are the most common fields of study among 37 individuals in La Paz who have obtained a bachelor's degree or higher.
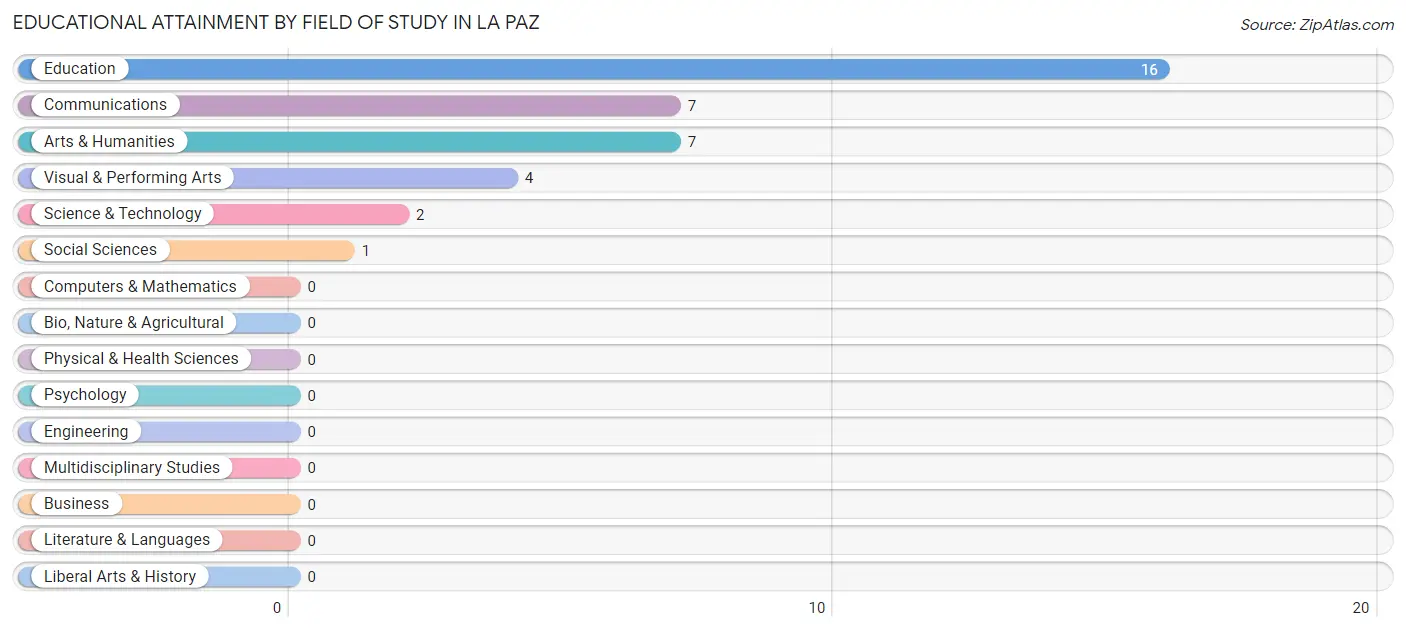
| Field of Study | # Graduates | % Graduates |
| Computers & Mathematics | 0 | 0.0% |
| Bio, Nature & Agricultural | 0 | 0.0% |
| Physical & Health Sciences | 0 | 0.0% |
| Psychology | 0 | 0.0% |
| Social Sciences | 1 | 2.7% |
| Engineering | 0 | 0.0% |
| Multidisciplinary Studies | 0 | 0.0% |
| Science & Technology | 2 | 5.4% |
| Business | 0 | 0.0% |
| Education | 16 | 43.2% |
| Literature & Languages | 0 | 0.0% |
| Liberal Arts & History | 0 | 0.0% |
| Visual & Performing Arts | 4 | 10.8% |
| Communications | 7 | 18.9% |
| Arts & Humanities | 7 | 18.9% |
| Total | 37 | 100.0% |
Transportation & Commute in La Paz
Vehicle Availability by Sex in La Paz
The most prevalent vehicle ownership categories in La Paz are males with 2 vehicles (91, accounting for 55.5%) and females with 2 vehicles (108, making up 59.1%).
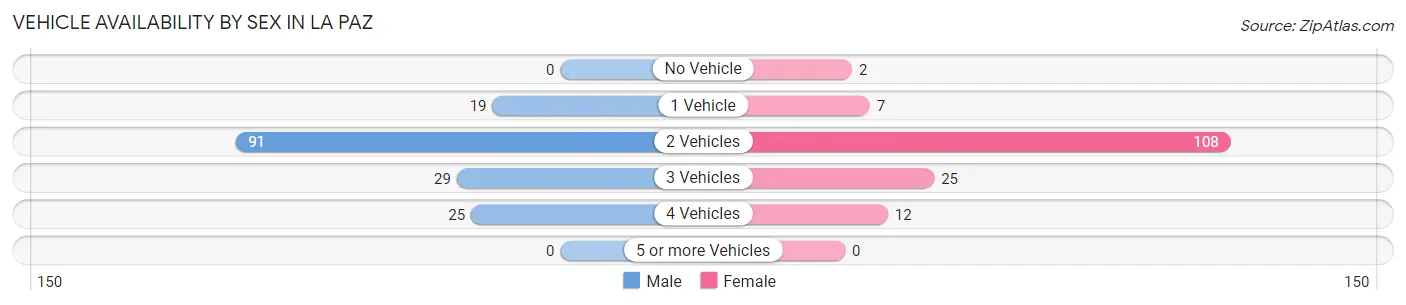
| Vehicles Available | Male | Female |
| No Vehicle | 0 (0.0%) | 2 (1.3%) |
| 1 Vehicle | 19 (11.6%) | 7 (4.5%) |
| 2 Vehicles | 91 (55.5%) | 108 (70.1%) |
| 3 Vehicles | 29 (17.7%) | 25 (16.2%) |
| 4 Vehicles | 25 (15.2%) | 12 (7.8%) |
| 5 or more Vehicles | 0 (0.0%) | 0 (0.0%) |
| Total | 164 (100.0%) | 154 (100.0%) |
Commute Time in La Paz
The most frequently occuring commute durations in La Paz are 20 to 24 minutes (73 commuters, 23.4%), 35 to 39 minutes (68 commuters, 21.8%), and 15 to 19 minutes (54 commuters, 17.3%).
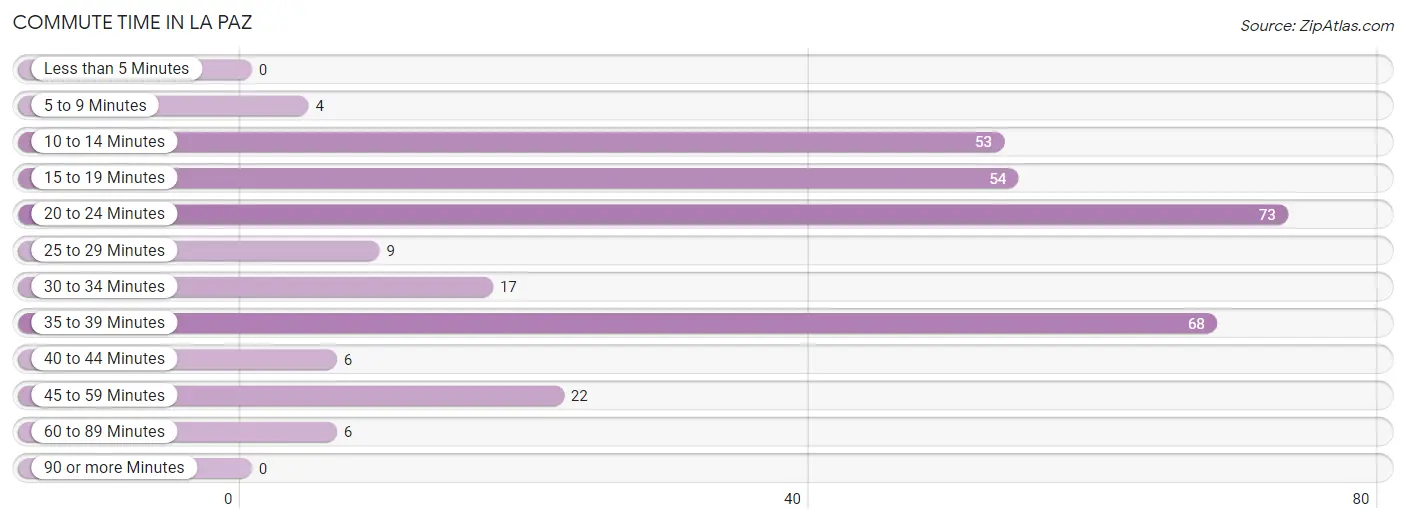
| Commute Time | # Commuters | % Commuters |
| Less than 5 Minutes | 0 | 0.0% |
| 5 to 9 Minutes | 4 | 1.3% |
| 10 to 14 Minutes | 53 | 17.0% |
| 15 to 19 Minutes | 54 | 17.3% |
| 20 to 24 Minutes | 73 | 23.4% |
| 25 to 29 Minutes | 9 | 2.9% |
| 30 to 34 Minutes | 17 | 5.4% |
| 35 to 39 Minutes | 68 | 21.8% |
| 40 to 44 Minutes | 6 | 1.9% |
| 45 to 59 Minutes | 22 | 7.0% |
| 60 to 89 Minutes | 6 | 1.9% |
| 90 or more Minutes | 0 | 0.0% |
Commute Time by Sex in La Paz
The most common commute times in La Paz are 20 to 24 minutes (56 commuters, 34.2%) for males and 10 to 14 minutes (48 commuters, 32.4%) for females.
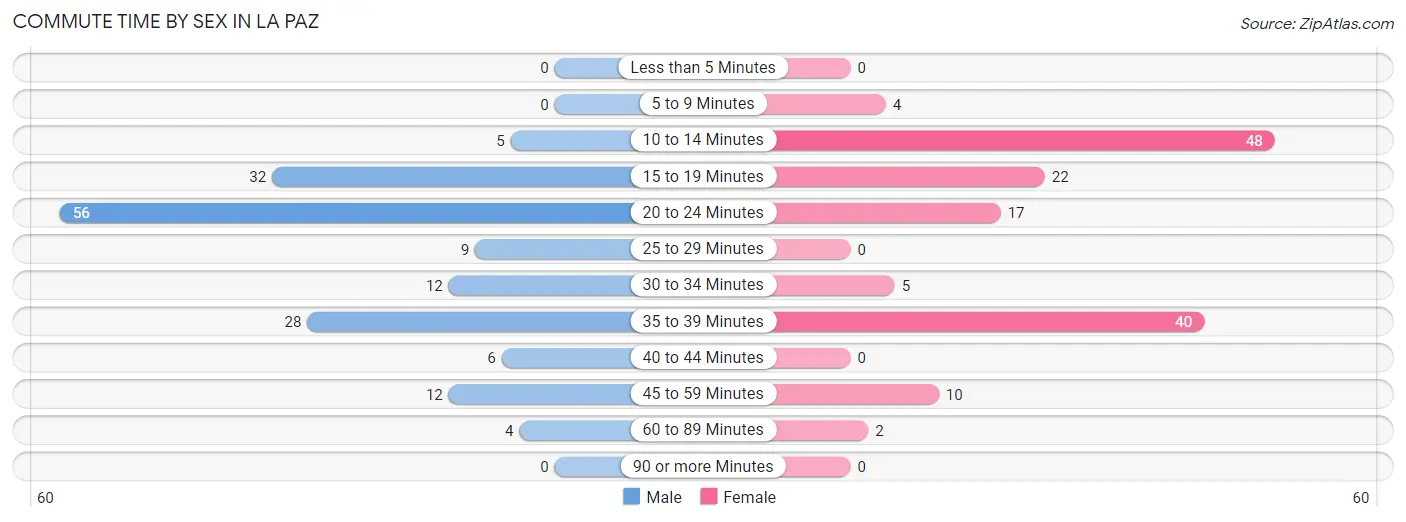
| Commute Time | Male | Female |
| Less than 5 Minutes | 0 (0.0%) | 0 (0.0%) |
| 5 to 9 Minutes | 0 (0.0%) | 4 (2.7%) |
| 10 to 14 Minutes | 5 (3.0%) | 48 (32.4%) |
| 15 to 19 Minutes | 32 (19.5%) | 22 (14.9%) |
| 20 to 24 Minutes | 56 (34.2%) | 17 (11.5%) |
| 25 to 29 Minutes | 9 (5.5%) | 0 (0.0%) |
| 30 to 34 Minutes | 12 (7.3%) | 5 (3.4%) |
| 35 to 39 Minutes | 28 (17.1%) | 40 (27.0%) |
| 40 to 44 Minutes | 6 (3.7%) | 0 (0.0%) |
| 45 to 59 Minutes | 12 (7.3%) | 10 (6.8%) |
| 60 to 89 Minutes | 4 (2.4%) | 2 (1.3%) |
| 90 or more Minutes | 0 (0.0%) | 0 (0.0%) |
Time of Departure to Work by Sex in La Paz
The most frequent times of departure to work in La Paz are 12:00 AM to 4:59 AM (96, 58.5%) for males and 8:00 AM to 8:29 AM (47, 31.8%) for females.
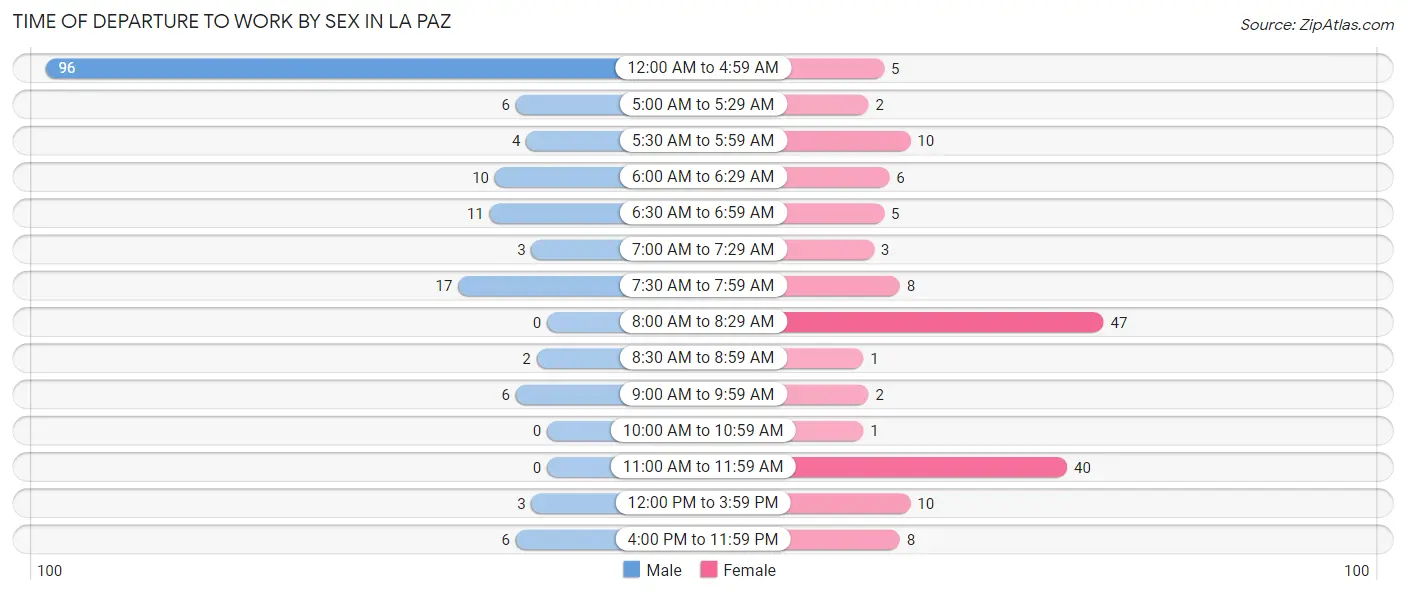
| Time of Departure | Male | Female |
| 12:00 AM to 4:59 AM | 96 (58.5%) | 5 (3.4%) |
| 5:00 AM to 5:29 AM | 6 (3.7%) | 2 (1.3%) |
| 5:30 AM to 5:59 AM | 4 (2.4%) | 10 (6.8%) |
| 6:00 AM to 6:29 AM | 10 (6.1%) | 6 (4.1%) |
| 6:30 AM to 6:59 AM | 11 (6.7%) | 5 (3.4%) |
| 7:00 AM to 7:29 AM | 3 (1.8%) | 3 (2.0%) |
| 7:30 AM to 7:59 AM | 17 (10.4%) | 8 (5.4%) |
| 8:00 AM to 8:29 AM | 0 (0.0%) | 47 (31.8%) |
| 8:30 AM to 8:59 AM | 2 (1.2%) | 1 (0.7%) |
| 9:00 AM to 9:59 AM | 6 (3.7%) | 2 (1.3%) |
| 10:00 AM to 10:59 AM | 0 (0.0%) | 1 (0.7%) |
| 11:00 AM to 11:59 AM | 0 (0.0%) | 40 (27.0%) |
| 12:00 PM to 3:59 PM | 3 (1.8%) | 10 (6.8%) |
| 4:00 PM to 11:59 PM | 6 (3.7%) | 8 (5.4%) |
| Total | 164 (100.0%) | 148 (100.0%) |
Housing Occupancy in La Paz
Occupancy by Ownership in La Paz
Of the total 232 dwellings in La Paz, owner-occupied units account for 198 (85.3%), while renter-occupied units make up 34 (14.7%).
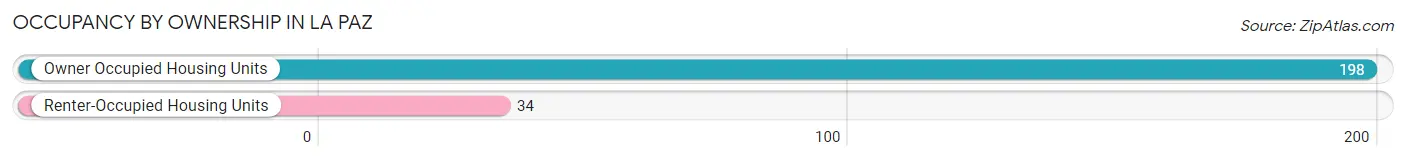
| Occupancy | # Housing Units | % Housing Units |
| Owner Occupied Housing Units | 198 | 85.3% |
| Renter-Occupied Housing Units | 34 | 14.7% |
| Total Occupied Housing Units | 232 | 100.0% |
Occupancy by Household Size in La Paz
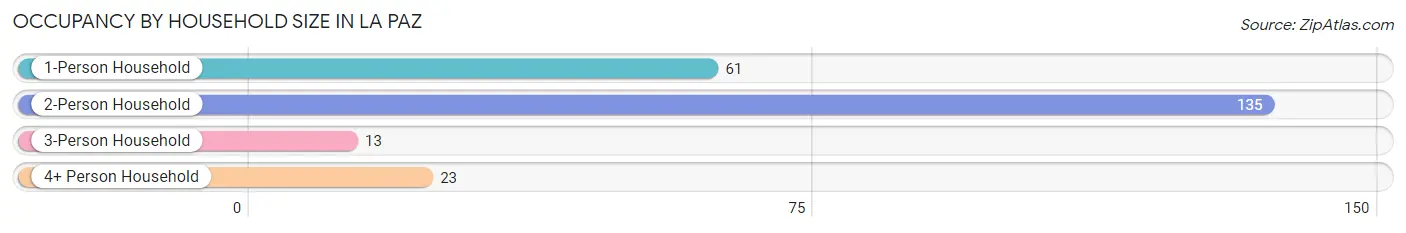
| Household Size | # Housing Units | % Housing Units |
| 1-Person Household | 61 | 26.3% |
| 2-Person Household | 135 | 58.2% |
| 3-Person Household | 13 | 5.6% |
| 4+ Person Household | 23 | 9.9% |
| Total Housing Units | 232 | 100.0% |
Occupancy by Ownership by Household Size in La Paz

| Household Size | Owner-occupied | Renter-occupied |
| 1-Person Household | 40 (65.6%) | 21 (34.4%) |
| 2-Person Household | 135 (100.0%) | 0 (0.0%) |
| 3-Person Household | 12 (92.3%) | 1 (7.7%) |
| 4+ Person Household | 11 (47.8%) | 12 (52.2%) |
| Total Housing Units | 198 (85.3%) | 34 (14.7%) |
Occupancy by Educational Attainment in La Paz
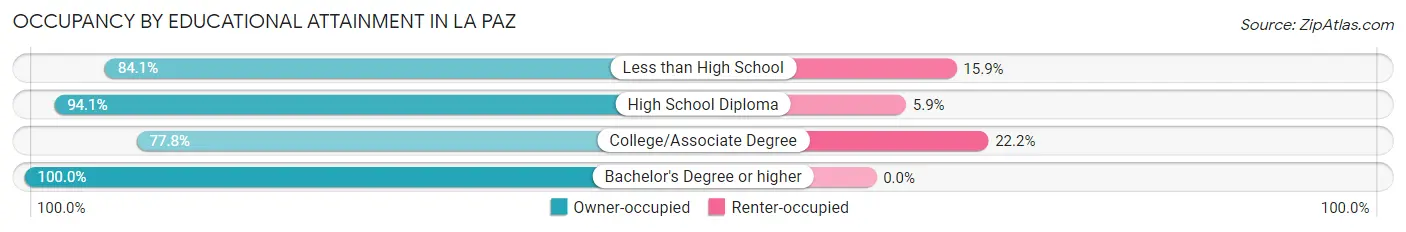
| Household Size | Owner-occupied | Renter-occupied |
| Less than High School | 37 (84.1%) | 7 (15.9%) |
| High School Diploma | 80 (94.1%) | 5 (5.9%) |
| College/Associate Degree | 77 (77.8%) | 22 (22.2%) |
| Bachelor's Degree or higher | 4 (100.0%) | 0 (0.0%) |
Occupancy by Age of Householder in La Paz
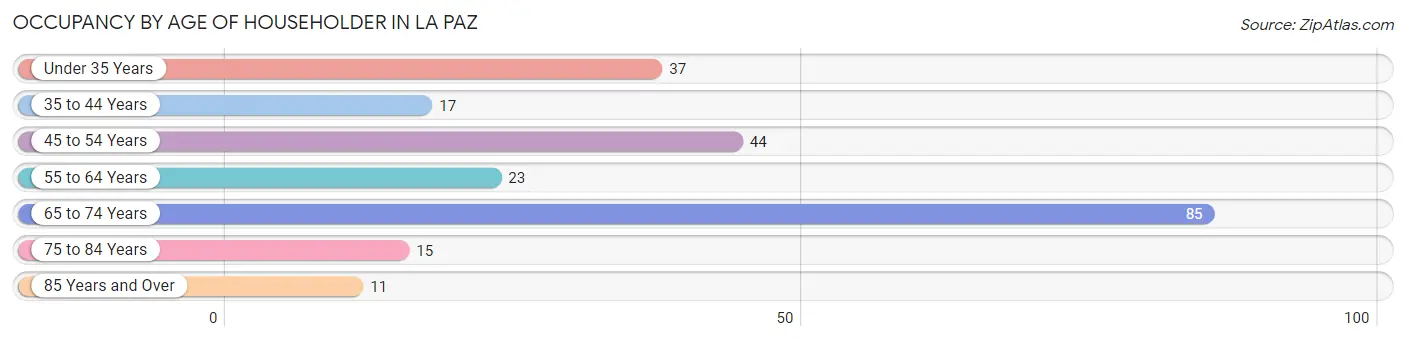
| Age Bracket | # Households | % Households |
| Under 35 Years | 37 | 16.0% |
| 35 to 44 Years | 17 | 7.3% |
| 45 to 54 Years | 44 | 19.0% |
| 55 to 64 Years | 23 | 9.9% |
| 65 to 74 Years | 85 | 36.6% |
| 75 to 84 Years | 15 | 6.5% |
| 85 Years and Over | 11 | 4.7% |
| Total | 232 | 100.0% |
Housing Finances in La Paz
Median Income by Occupancy in La Paz
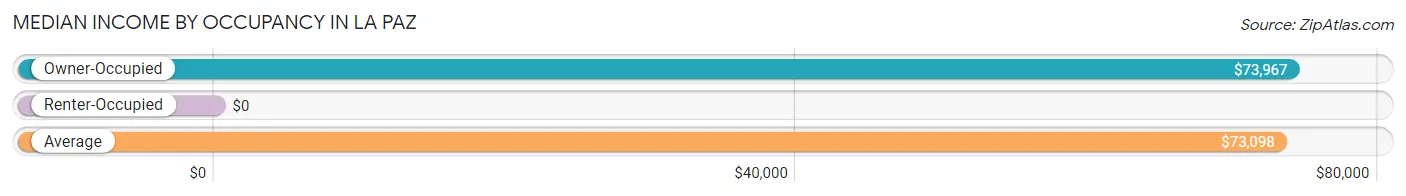
| Occupancy Type | # Households | Median Income |
| Owner-Occupied | 198 (85.3%) | $73,967 |
| Renter-Occupied | 34 (14.7%) | $0 |
| Average | 232 (100.0%) | $73,098 |
Occupancy by Householder Income Bracket in La Paz
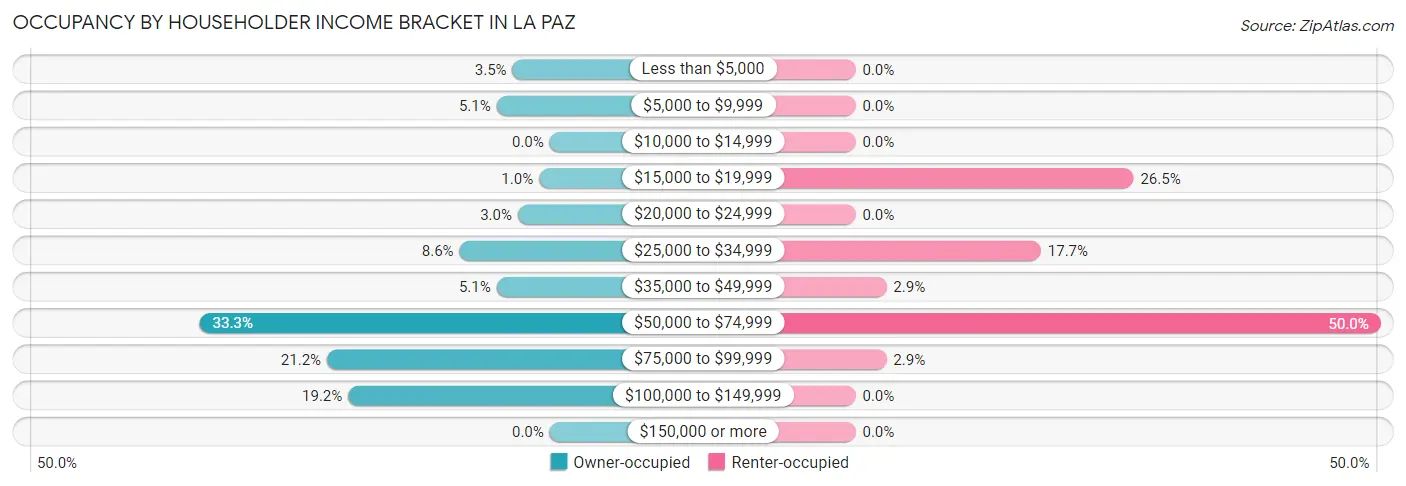
| Income Bracket | Owner-occupied | Renter-occupied |
| Less than $5,000 | 7 (3.5%) | 0 (0.0%) |
| $5,000 to $9,999 | 10 (5.1%) | 0 (0.0%) |
| $10,000 to $14,999 | 0 (0.0%) | 0 (0.0%) |
| $15,000 to $19,999 | 2 (1.0%) | 9 (26.5%) |
| $20,000 to $24,999 | 6 (3.0%) | 0 (0.0%) |
| $25,000 to $34,999 | 17 (8.6%) | 6 (17.6%) |
| $35,000 to $49,999 | 10 (5.1%) | 1 (2.9%) |
| $50,000 to $74,999 | 66 (33.3%) | 17 (50.0%) |
| $75,000 to $99,999 | 42 (21.2%) | 1 (2.9%) |
| $100,000 to $149,999 | 38 (19.2%) | 0 (0.0%) |
| $150,000 or more | 0 (0.0%) | 0 (0.0%) |
| Total | 198 (100.0%) | 34 (100.0%) |
Monthly Housing Cost Tiers in La Paz
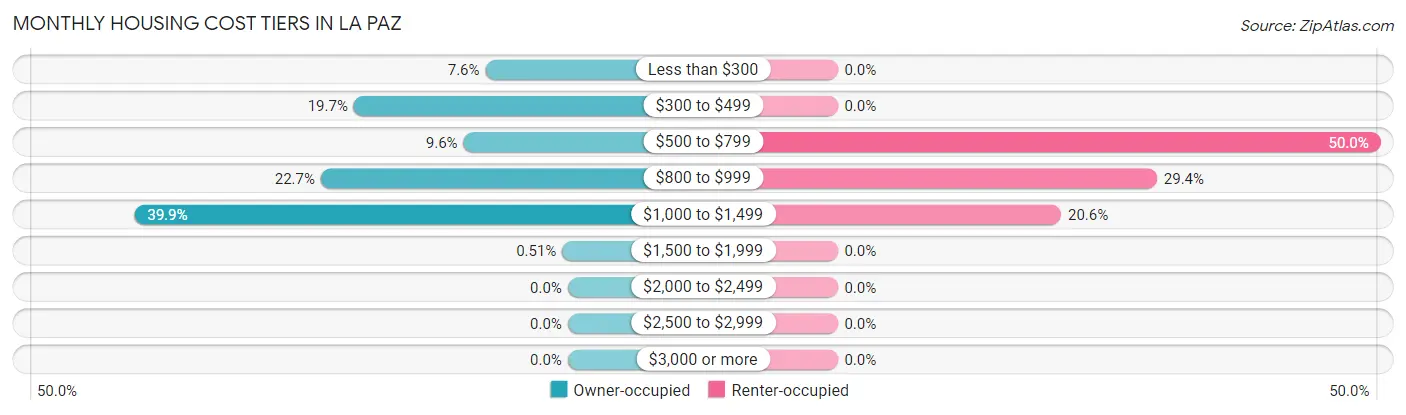
| Monthly Cost | Owner-occupied | Renter-occupied |
| Less than $300 | 15 (7.6%) | 0 (0.0%) |
| $300 to $499 | 39 (19.7%) | 0 (0.0%) |
| $500 to $799 | 19 (9.6%) | 17 (50.0%) |
| $800 to $999 | 45 (22.7%) | 10 (29.4%) |
| $1,000 to $1,499 | 79 (39.9%) | 7 (20.6%) |
| $1,500 to $1,999 | 1 (0.5%) | 0 (0.0%) |
| $2,000 to $2,499 | 0 (0.0%) | 0 (0.0%) |
| $2,500 to $2,999 | 0 (0.0%) | 0 (0.0%) |
| $3,000 or more | 0 (0.0%) | 0 (0.0%) |
| Total | 198 (100.0%) | 34 (100.0%) |
Physical Housing Characteristics in La Paz
Housing Structures in La Paz
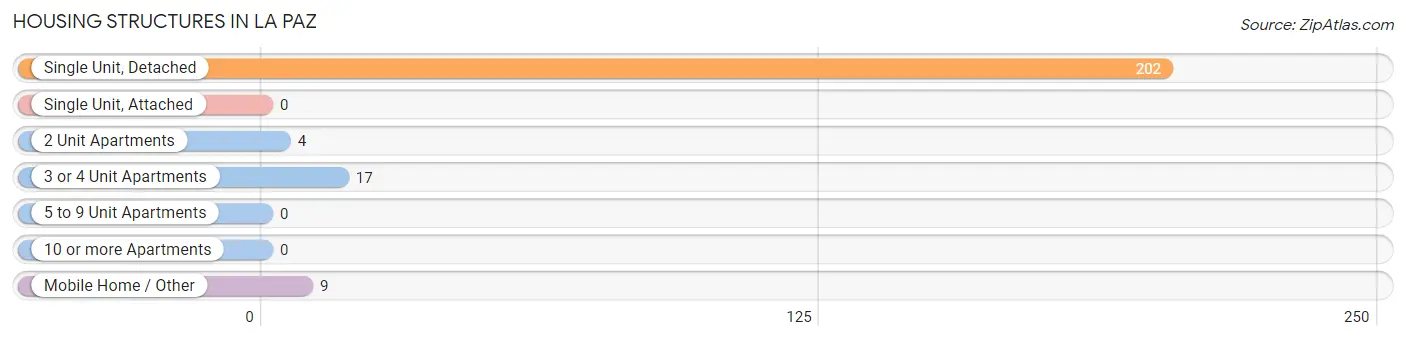
| Structure Type | # Housing Units | % Housing Units |
| Single Unit, Detached | 202 | 87.1% |
| Single Unit, Attached | 0 | 0.0% |
| 2 Unit Apartments | 4 | 1.7% |
| 3 or 4 Unit Apartments | 17 | 7.3% |
| 5 to 9 Unit Apartments | 0 | 0.0% |
| 10 or more Apartments | 0 | 0.0% |
| Mobile Home / Other | 9 | 3.9% |
| Total | 232 | 100.0% |
Housing Structures by Occupancy in La Paz
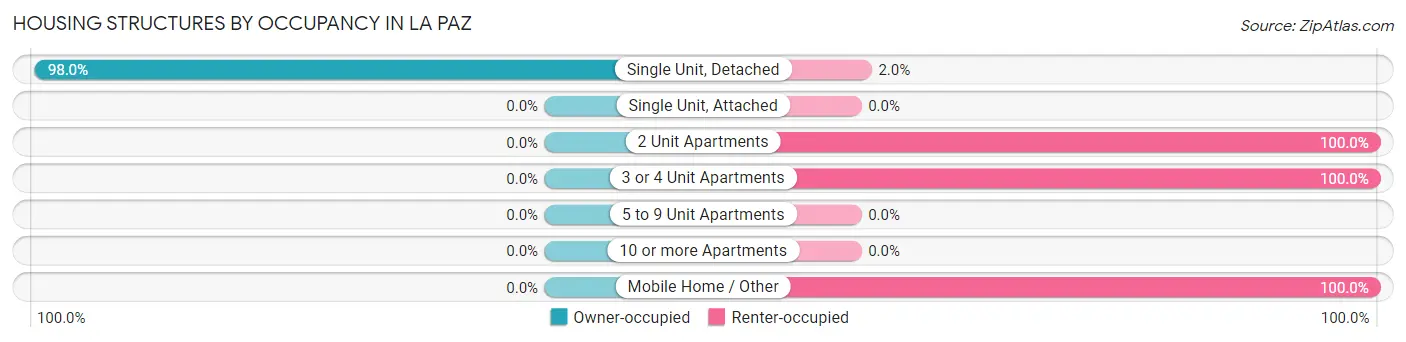
| Structure Type | Owner-occupied | Renter-occupied |
| Single Unit, Detached | 198 (98.0%) | 4 (2.0%) |
| Single Unit, Attached | 0 (0.0%) | 0 (0.0%) |
| 2 Unit Apartments | 0 (0.0%) | 4 (100.0%) |
| 3 or 4 Unit Apartments | 0 (0.0%) | 17 (100.0%) |
| 5 to 9 Unit Apartments | 0 (0.0%) | 0 (0.0%) |
| 10 or more Apartments | 0 (0.0%) | 0 (0.0%) |
| Mobile Home / Other | 0 (0.0%) | 9 (100.0%) |
| Total | 198 (85.3%) | 34 (14.7%) |
Housing Structures by Number of Rooms in La Paz
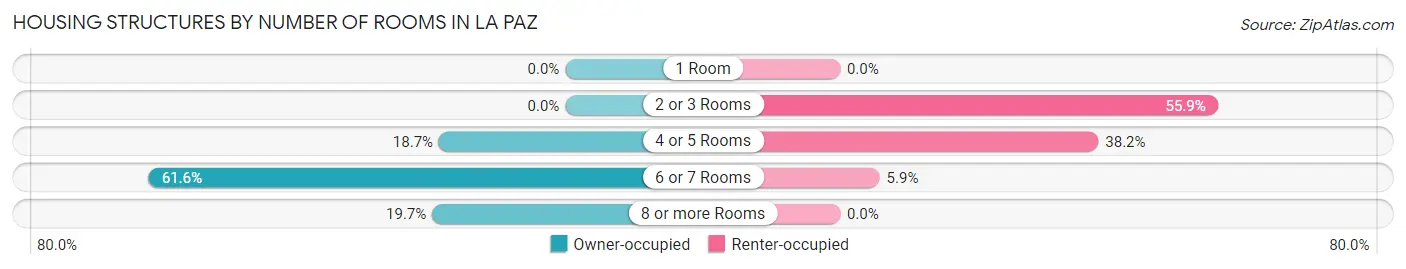
| Number of Rooms | Owner-occupied | Renter-occupied |
| 1 Room | 0 (0.0%) | 0 (0.0%) |
| 2 or 3 Rooms | 0 (0.0%) | 19 (55.9%) |
| 4 or 5 Rooms | 37 (18.7%) | 13 (38.2%) |
| 6 or 7 Rooms | 122 (61.6%) | 2 (5.9%) |
| 8 or more Rooms | 39 (19.7%) | 0 (0.0%) |
| Total | 198 (100.0%) | 34 (100.0%) |
Housing Structure by Heating Type in La Paz
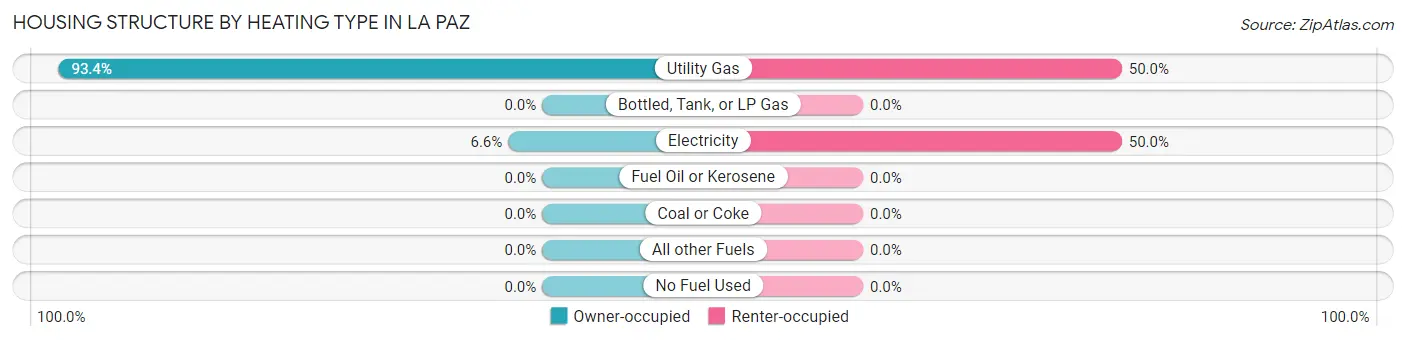
| Heating Type | Owner-occupied | Renter-occupied |
| Utility Gas | 185 (93.4%) | 17 (50.0%) |
| Bottled, Tank, or LP Gas | 0 (0.0%) | 0 (0.0%) |
| Electricity | 13 (6.6%) | 17 (50.0%) |
| Fuel Oil or Kerosene | 0 (0.0%) | 0 (0.0%) |
| Coal or Coke | 0 (0.0%) | 0 (0.0%) |
| All other Fuels | 0 (0.0%) | 0 (0.0%) |
| No Fuel Used | 0 (0.0%) | 0 (0.0%) |
| Total | 198 (100.0%) | 34 (100.0%) |
Household Vehicle Usage in La Paz
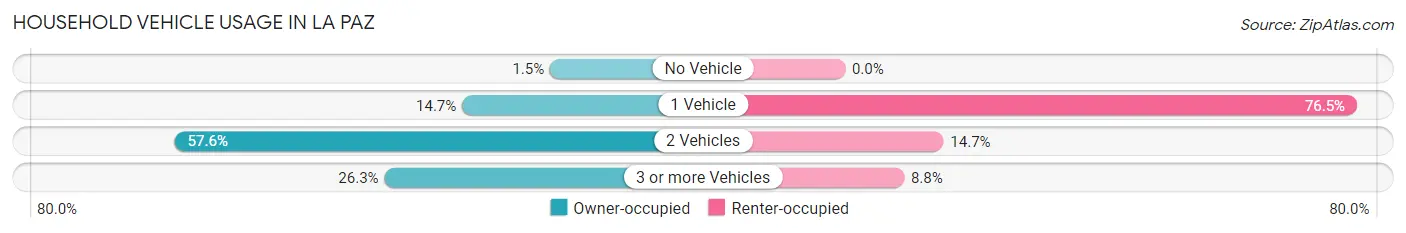
| Vehicles per Household | Owner-occupied | Renter-occupied |
| No Vehicle | 3 (1.5%) | 0 (0.0%) |
| 1 Vehicle | 29 (14.6%) | 26 (76.5%) |
| 2 Vehicles | 114 (57.6%) | 5 (14.7%) |
| 3 or more Vehicles | 52 (26.3%) | 3 (8.8%) |
| Total | 198 (100.0%) | 34 (100.0%) |
Real Estate & Mortgages in La Paz
Real Estate and Mortgage Overview in La Paz
| Characteristic | Without Mortgage | With Mortgage |
| Housing Units | 54 | 144 |
| Median Property Value | $88,400 | $126,800 |
| Median Household Income | $34,375 | $0 |
| Monthly Housing Costs | $338 | $0 |
| Real Estate Taxes | $377 | $2 |
Property Value by Mortgage Status in La Paz
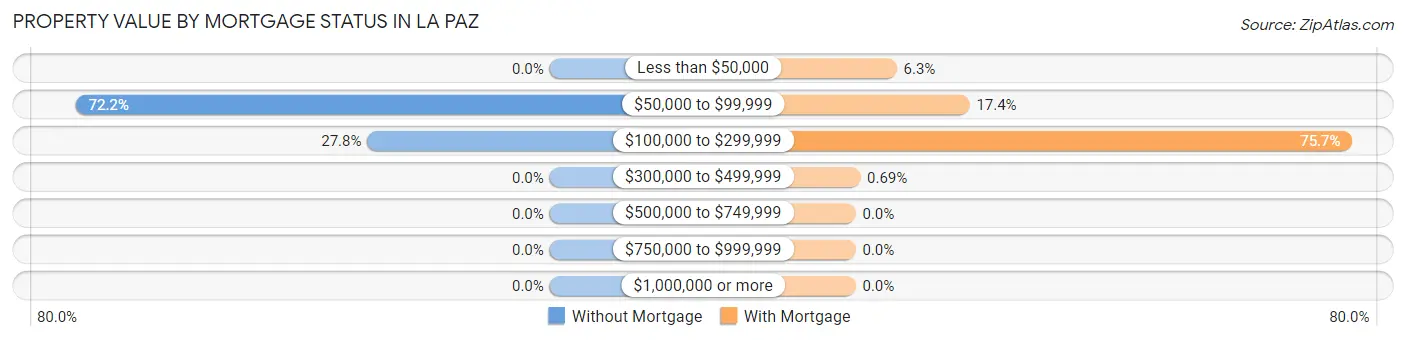
| Property Value | Without Mortgage | With Mortgage |
| Less than $50,000 | 0 (0.0%) | 9 (6.2%) |
| $50,000 to $99,999 | 39 (72.2%) | 25 (17.4%) |
| $100,000 to $299,999 | 15 (27.8%) | 109 (75.7%) |
| $300,000 to $499,999 | 0 (0.0%) | 1 (0.7%) |
| $500,000 to $749,999 | 0 (0.0%) | 0 (0.0%) |
| $750,000 to $999,999 | 0 (0.0%) | 0 (0.0%) |
| $1,000,000 or more | 0 (0.0%) | 0 (0.0%) |
| Total | 54 (100.0%) | 144 (100.0%) |
Household Income by Mortgage Status in La Paz
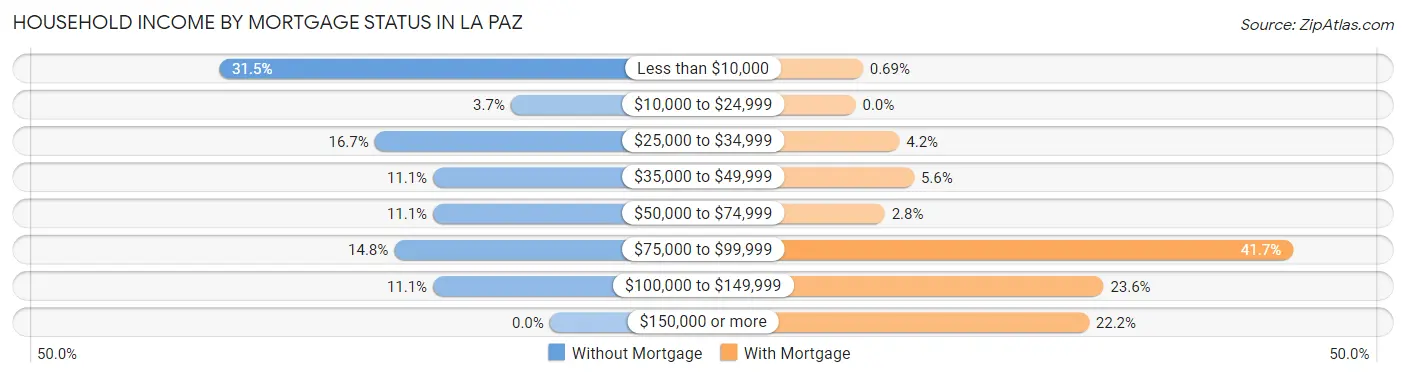
| Household Income | Without Mortgage | With Mortgage |
| Less than $10,000 | 17 (31.5%) | 1 (0.7%) |
| $10,000 to $24,999 | 2 (3.7%) | 0 (0.0%) |
| $25,000 to $34,999 | 9 (16.7%) | 6 (4.2%) |
| $35,000 to $49,999 | 6 (11.1%) | 8 (5.6%) |
| $50,000 to $74,999 | 6 (11.1%) | 4 (2.8%) |
| $75,000 to $99,999 | 8 (14.8%) | 60 (41.7%) |
| $100,000 to $149,999 | 6 (11.1%) | 34 (23.6%) |
| $150,000 or more | 0 (0.0%) | 32 (22.2%) |
| Total | 54 (100.0%) | 144 (100.0%) |
Property Value to Household Income Ratio in La Paz
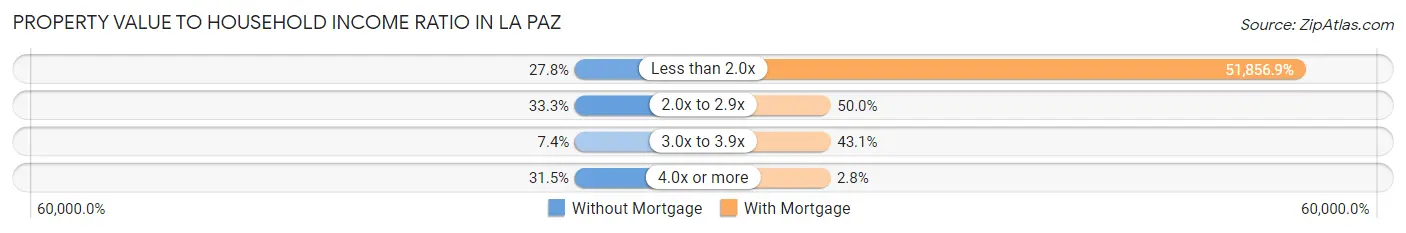
| Value-to-Income Ratio | Without Mortgage | With Mortgage |
| Less than 2.0x | 15 (27.8%) | 74,674 (51,856.9%) |
| 2.0x to 2.9x | 18 (33.3%) | 72 (50.0%) |
| 3.0x to 3.9x | 4 (7.4%) | 62 (43.1%) |
| 4.0x or more | 17 (31.5%) | 4 (2.8%) |
| Total | 54 (100.0%) | 144 (100.0%) |
Real Estate Taxes by Mortgage Status in La Paz
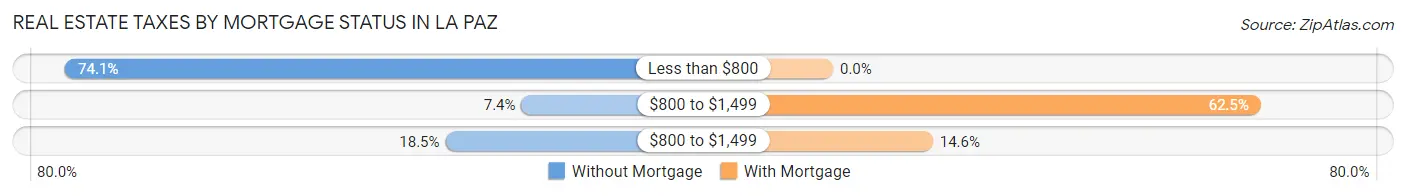
| Property Taxes | Without Mortgage | With Mortgage |
| Less than $800 | 40 (74.1%) | 0 (0.0%) |
| $800 to $1,499 | 4 (7.4%) | 90 (62.5%) |
| $800 to $1,499 | 10 (18.5%) | 21 (14.6%) |
| Total | 54 (100.0%) | 144 (100.0%) |
Health & Disability in La Paz
Health Insurance Coverage by Age in La Paz
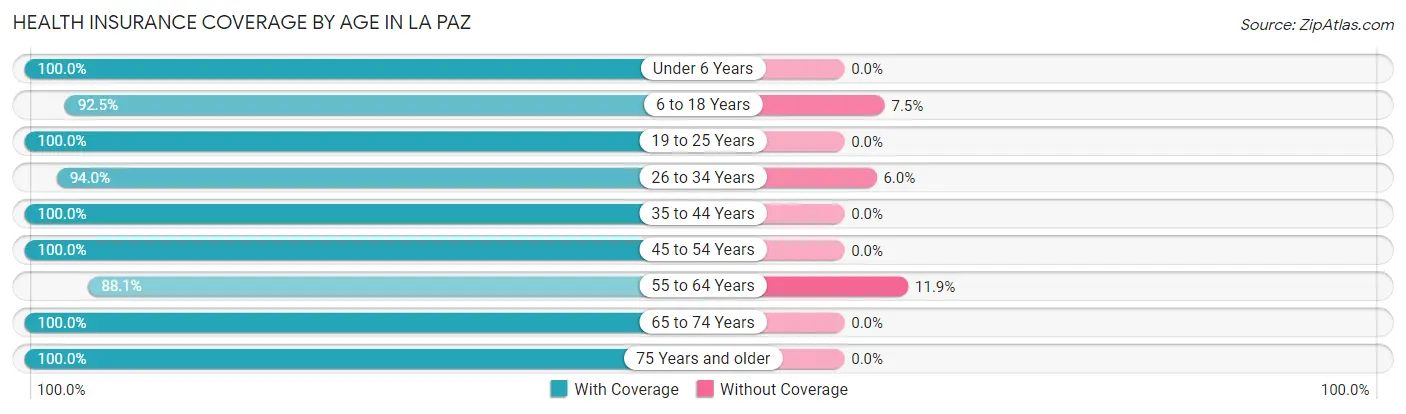
| Age Bracket | With Coverage | Without Coverage |
| Under 6 Years | 41 (100.0%) | 0 (0.0%) |
| 6 to 18 Years | 74 (92.5%) | 6 (7.5%) |
| 19 to 25 Years | 55 (100.0%) | 0 (0.0%) |
| 26 to 34 Years | 47 (94.0%) | 3 (6.0%) |
| 35 to 44 Years | 50 (100.0%) | 0 (0.0%) |
| 45 to 54 Years | 60 (100.0%) | 0 (0.0%) |
| 55 to 64 Years | 37 (88.1%) | 5 (11.9%) |
| 65 to 74 Years | 126 (100.0%) | 0 (0.0%) |
| 75 Years and older | 32 (100.0%) | 0 (0.0%) |
| Total | 522 (97.4%) | 14 (2.6%) |
Health Insurance Coverage by Citizenship Status in La Paz
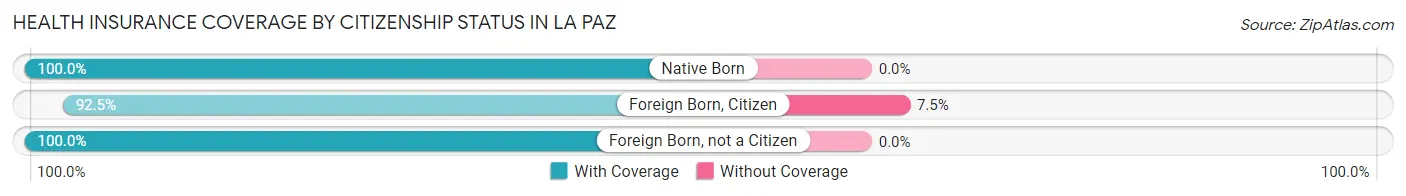
| Citizenship Status | With Coverage | Without Coverage |
| Native Born | 41 (100.0%) | 0 (0.0%) |
| Foreign Born, Citizen | 74 (92.5%) | 6 (7.5%) |
| Foreign Born, not a Citizen | 55 (100.0%) | 0 (0.0%) |
Health Insurance Coverage by Household Income in La Paz
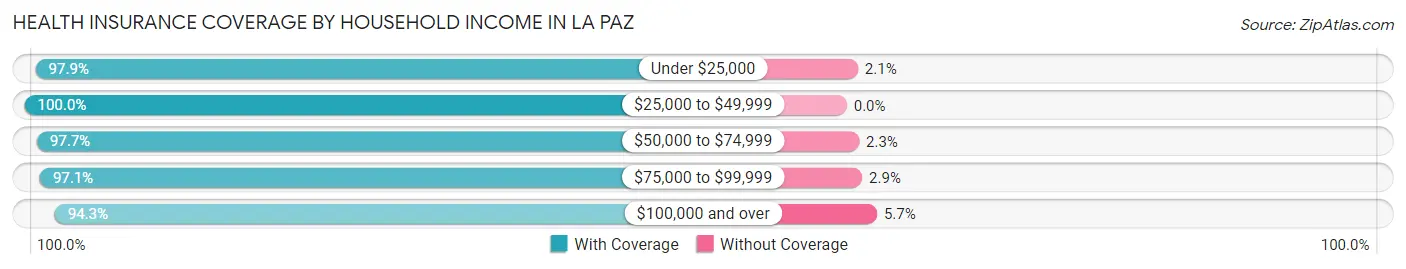
| Household Income | With Coverage | Without Coverage |
| Under $25,000 | 94 (97.9%) | 2 (2.1%) |
| $25,000 to $49,999 | 100 (100.0%) | 0 (0.0%) |
| $50,000 to $74,999 | 127 (97.7%) | 3 (2.3%) |
| $75,000 to $99,999 | 101 (97.1%) | 3 (2.9%) |
| $100,000 and over | 100 (94.3%) | 6 (5.7%) |
Public vs Private Health Insurance Coverage by Age in La Paz
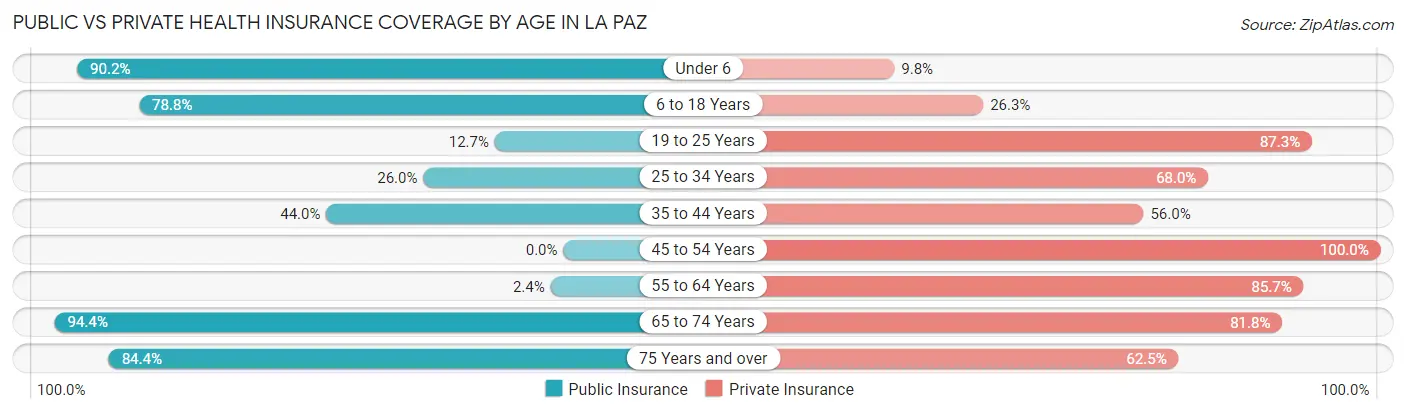
| Age Bracket | Public Insurance | Private Insurance |
| Under 6 | 37 (90.2%) | 4 (9.8%) |
| 6 to 18 Years | 63 (78.7%) | 21 (26.3%) |
| 19 to 25 Years | 7 (12.7%) | 48 (87.3%) |
| 25 to 34 Years | 13 (26.0%) | 34 (68.0%) |
| 35 to 44 Years | 22 (44.0%) | 28 (56.0%) |
| 45 to 54 Years | 0 (0.0%) | 60 (100.0%) |
| 55 to 64 Years | 1 (2.4%) | 36 (85.7%) |
| 65 to 74 Years | 119 (94.4%) | 103 (81.8%) |
| 75 Years and over | 27 (84.4%) | 20 (62.5%) |
| Total | 289 (53.9%) | 354 (66.0%) |
Disability Status by Sex by Age in La Paz
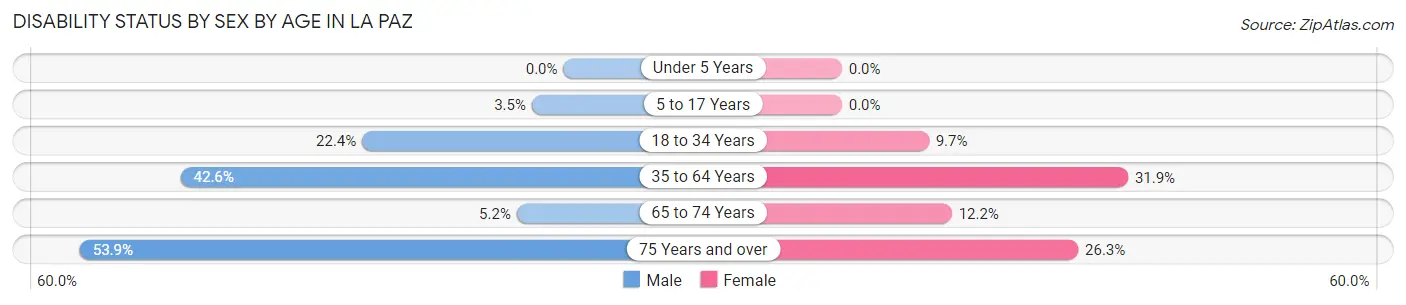
| Age Bracket | Male | Female |
| Under 5 Years | 0 (0.0%) | 0 (0.0%) |
| 5 to 17 Years | 2 (3.5%) | 0 (0.0%) |
| 18 to 34 Years | 13 (22.4%) | 6 (9.7%) |
| 35 to 64 Years | 26 (42.6%) | 29 (31.9%) |
| 65 to 74 Years | 4 (5.2%) | 6 (12.2%) |
| 75 Years and over | 7 (53.8%) | 5 (26.3%) |
Disability Class by Sex by Age in La Paz
Disability Class: Hearing Difficulty
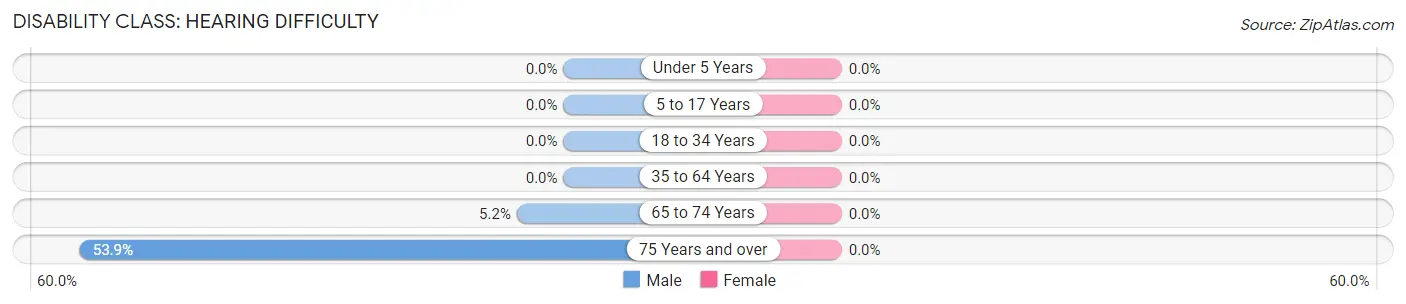
| Age Bracket | Male | Female |
| Under 5 Years | 0 (0.0%) | 0 (0.0%) |
| 5 to 17 Years | 0 (0.0%) | 0 (0.0%) |
| 18 to 34 Years | 0 (0.0%) | 0 (0.0%) |
| 35 to 64 Years | 0 (0.0%) | 0 (0.0%) |
| 65 to 74 Years | 4 (5.2%) | 0 (0.0%) |
| 75 Years and over | 7 (53.8%) | 0 (0.0%) |
Disability Class: Vision Difficulty
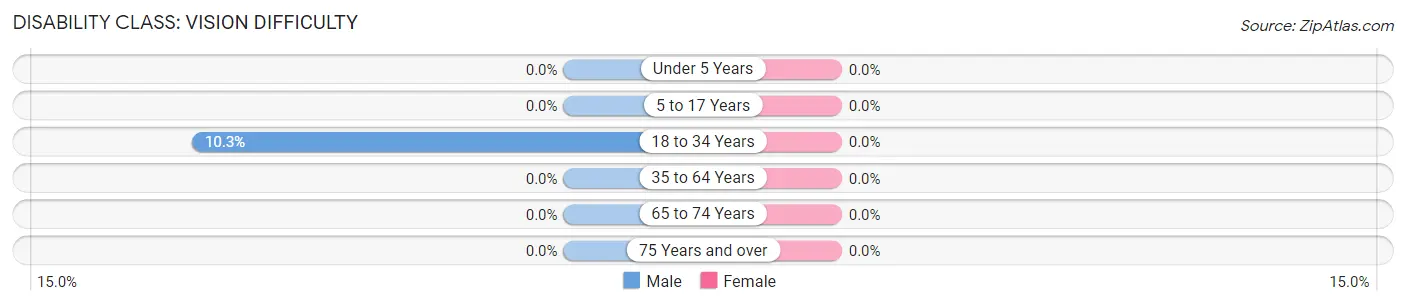
| Age Bracket | Male | Female |
| Under 5 Years | 0 (0.0%) | 0 (0.0%) |
| 5 to 17 Years | 0 (0.0%) | 0 (0.0%) |
| 18 to 34 Years | 6 (10.3%) | 0 (0.0%) |
| 35 to 64 Years | 0 (0.0%) | 0 (0.0%) |
| 65 to 74 Years | 0 (0.0%) | 0 (0.0%) |
| 75 Years and over | 0 (0.0%) | 0 (0.0%) |
Disability Class: Cognitive Difficulty
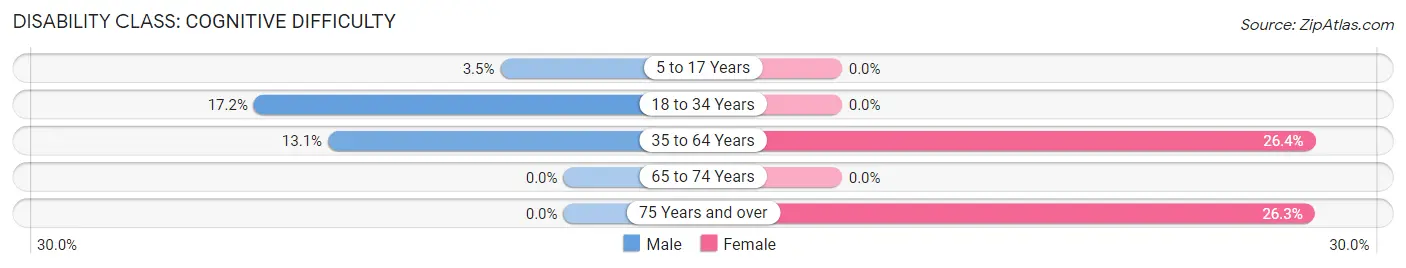
| Age Bracket | Male | Female |
| 5 to 17 Years | 2 (3.5%) | 0 (0.0%) |
| 18 to 34 Years | 10 (17.2%) | 0 (0.0%) |
| 35 to 64 Years | 8 (13.1%) | 24 (26.4%) |
| 65 to 74 Years | 0 (0.0%) | 0 (0.0%) |
| 75 Years and over | 0 (0.0%) | 5 (26.3%) |
Disability Class: Ambulatory Difficulty
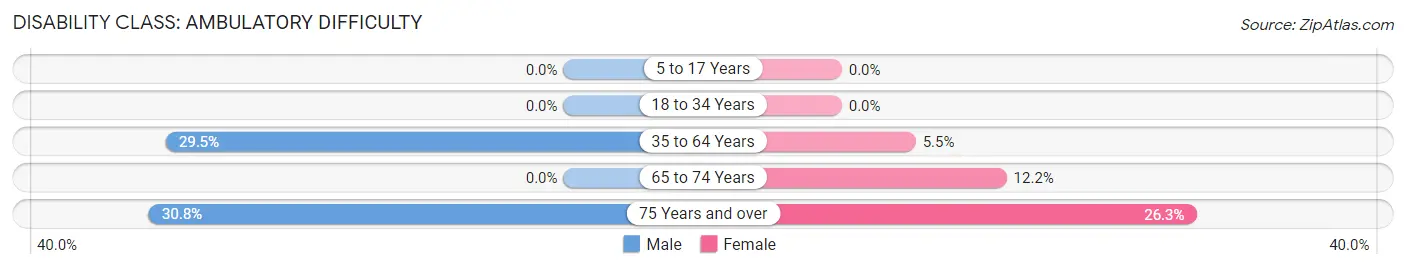
| Age Bracket | Male | Female |
| 5 to 17 Years | 0 (0.0%) | 0 (0.0%) |
| 18 to 34 Years | 0 (0.0%) | 0 (0.0%) |
| 35 to 64 Years | 18 (29.5%) | 5 (5.5%) |
| 65 to 74 Years | 0 (0.0%) | 6 (12.2%) |
| 75 Years and over | 4 (30.8%) | 5 (26.3%) |
Disability Class: Self-Care Difficulty
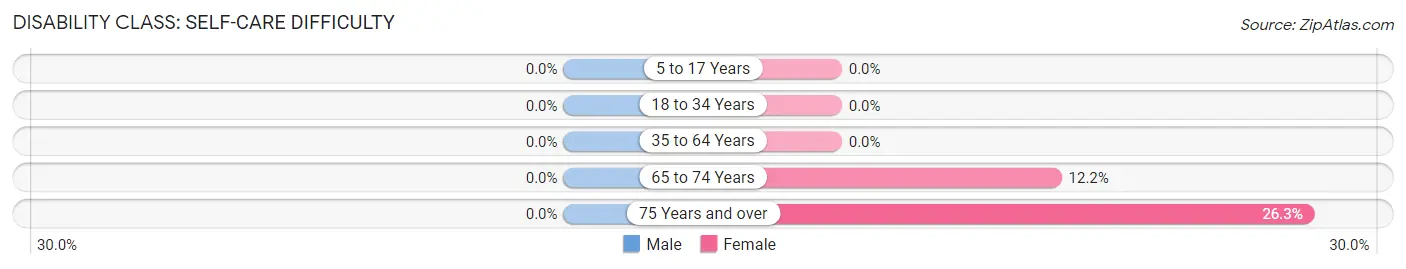
| Age Bracket | Male | Female |
| 5 to 17 Years | 0 (0.0%) | 0 (0.0%) |
| 18 to 34 Years | 0 (0.0%) | 0 (0.0%) |
| 35 to 64 Years | 0 (0.0%) | 0 (0.0%) |
| 65 to 74 Years | 0 (0.0%) | 6 (12.2%) |
| 75 Years and over | 0 (0.0%) | 5 (26.3%) |
Technology Access in La Paz
Computing Device Access in La Paz
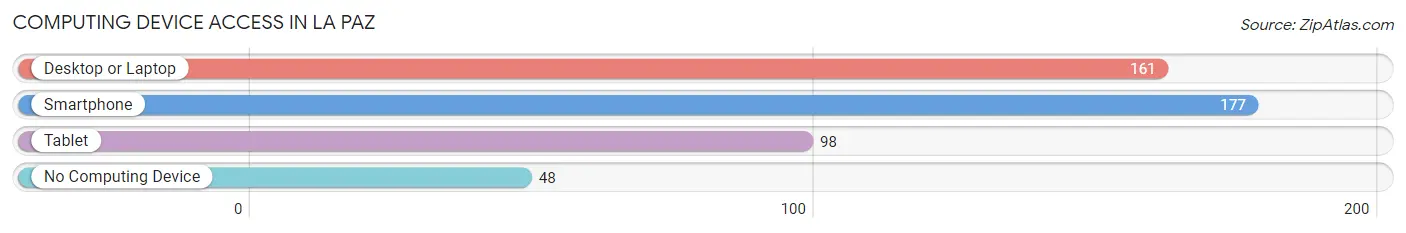
| Device Type | # Households | % Households |
| Desktop or Laptop | 161 | 69.4% |
| Smartphone | 177 | 76.3% |
| Tablet | 98 | 42.2% |
| No Computing Device | 48 | 20.7% |
| Total | 232 | 100.0% |
Internet Access in La Paz
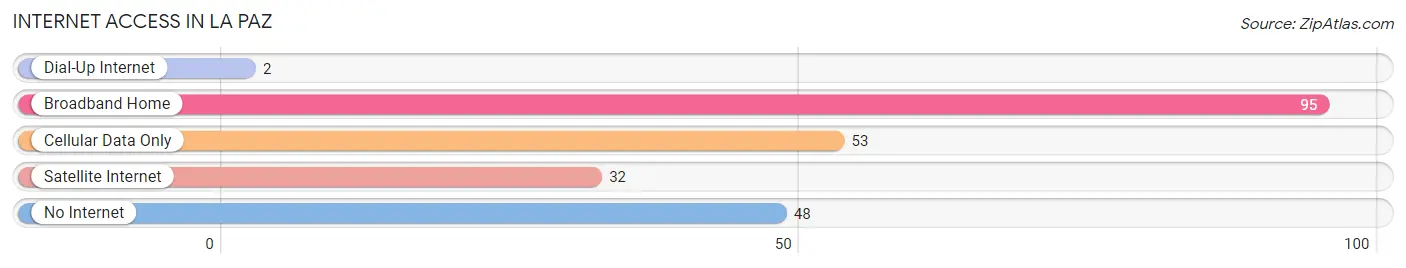
| Internet Type | # Households | % Households |
| Dial-Up Internet | 2 | 0.9% |
| Broadband Home | 95 | 40.9% |
| Cellular Data Only | 53 | 22.8% |
| Satellite Internet | 32 | 13.8% |
| No Internet | 48 | 20.7% |
| Total | 232 | 100.0% |
La Paz Summary
La Paz is the capital of Bolivia, located in the western part of the country. It is the administrative, economic, and cultural center of the country, and is home to more than two million people. La Paz is situated in a valley at an elevation of 3,650 meters (11,975 feet) above sea level, making it the highest capital city in the world.
History
The area of La Paz has been inhabited since at least the 15th century, when the Inca Empire established a settlement in the area. The city was founded in 1548 by the Spanish conquistador Alonso de Mendoza, who named it Nuestra Señora de La Paz (Our Lady of Peace). The city was initially a small settlement, but it grew rapidly as it became an important trading center for the Spanish Empire.
In 1809, La Paz was the site of a major battle between the Spanish and the forces of the revolutionary leader Simón Bolívar. Bolívar's forces were victorious, and he declared La Paz the capital of the newly independent Bolivia. Since then, La Paz has been the political and economic center of the country.
Geography
La Paz is located in the Andes Mountains in western Bolivia. The city is situated in a valley at an elevation of 3,650 meters (11,975 feet) above sea level, making it the highest capital city in the world. The city is surrounded by mountains, including the Illimani, which rises to an elevation of 6,438 meters (21,122 feet).
The city is divided into two distinct parts: the old city, which is located in the valley, and the modern city, which is located on the surrounding hills. The old city is the historical center of La Paz, and is home to many of the city's most important landmarks, including the Plaza Murillo, the Presidential Palace, and the Cathedral of Our Lady of Peace.
Economy
La Paz is the economic and financial center of Bolivia. The city is home to many of the country's largest companies, including the state-owned oil company YPFB, the telecommunications company Entel, and the banking and financial services company Banco Unión.
The city is also a major industrial center, with factories producing textiles, chemicals, and food products. La Paz is also a major tourist destination, with many visitors coming to see the city's colonial architecture and to experience its vibrant culture.
Demographics
As of the 2020 census, La Paz had a population of 2,072,871. The city is home to people of many different ethnic backgrounds, including Aymara, Quechua, and Guarani. The majority of the population is Roman Catholic, and Spanish is the official language.
La Paz is a rapidly growing city, with a population growth rate of 2.3% per year. The city is also becoming increasingly diverse, with a growing number of immigrants from other Latin American countries, as well as from Europe and Asia.
Common Questions
What is Per Capita Income in La Paz?
Per Capita income in La Paz is $27,468.
What is the Median Family Income in La Paz?
Median Family Income in La Paz is $74,348.
What is the Median Household income in La Paz?
Median Household Income in La Paz is $73,098.
What is Income or Wage Gap in La Paz?
Income or Wage Gap in La Paz is 45.9%.
Women in La Paz earn 54.1 cents for every dollar earned by a man.
What is Inequality or Gini Index in La Paz?
Inequality or Gini Index in La Paz is 0.29.
What is the Total Population of La Paz?
Total Population of La Paz is 536.
What is the Total Male Population of La Paz?
Total Male Population of La Paz is 288.
What is the Total Female Population of La Paz?
Total Female Population of La Paz is 248.
What is the Ratio of Males per 100 Females in La Paz?
There are 116.13 Males per 100 Females in La Paz.
What is the Ratio of Females per 100 Males in La Paz?
There are 86.11 Females per 100 Males in La Paz.
What is the Median Population Age in La Paz?
Median Population Age in La Paz is 44.5 Years.
What is the Average Family Size in La Paz
Average Family Size in La Paz is 2.7 People.
What is the Average Household Size in La Paz
Average Household Size in La Paz is 2.3 People.
How Large is the Labor Force in La Paz?
There are 324 People in the Labor Forcein in La Paz.
What is the Percentage of People in the Labor Force in La Paz?
70.6% of People are in the Labor Force in La Paz.
What is the Unemployment Rate in La Paz?
Unemployment Rate in La Paz is 1.9%.