Tipton, IN Map & Demographics
Tipton Map
Tipton Overview
$30,457
PER CAPITA INCOME
$69,109
AVG FAMILY INCOME
$64,167
AVG HOUSEHOLD INCOME
35.8%
WAGE / INCOME GAP [ % ]
64.2¢/ $1
WAGE / INCOME GAP [ $ ]
0.37
INEQUALITY / GINI INDEX
5,255
TOTAL POPULATION
2,714
MALE POPULATION
2,541
FEMALE POPULATION
106.81
MALES / 100 FEMALES
93.63
FEMALES / 100 MALES
41.8
MEDIAN AGE
2.6
AVG FAMILY SIZE
2.3
AVG HOUSEHOLD SIZE
2,696
LABOR FORCE [ PEOPLE ]
61.1%
PERCENT IN LABOR FORCE
5.1%
UNEMPLOYMENT RATE
Tipton Zip Codes
Tipton Area Codes
Income in Tipton
Income Overview in Tipton
Per Capita Income in Tipton is $30,457, while median incomes of families and households are $69,109 and $64,167 respectively.
| Characteristic | Number | Measure |
| Per Capita Income | 5,255 | $30,457 |
| Median Family Income | 1,624 | $69,109 |
| Mean Family Income | 1,624 | $80,235 |
| Median Household Income | 2,188 | $64,167 |
| Mean Household Income | 2,188 | $72,368 |
| Income Deficit | 1,624 | $0 |
| Wage / Income Gap (%) | 5,255 | 35.83% |
| Wage / Income Gap ($) | 5,255 | 64.17¢ per $1 |
| Gini / Inequality Index | 5,255 | 0.37 |
Earnings by Sex in Tipton
Average Earnings in Tipton are $43,521, $47,463 for men and $30,455 for women, a difference of 35.8%.
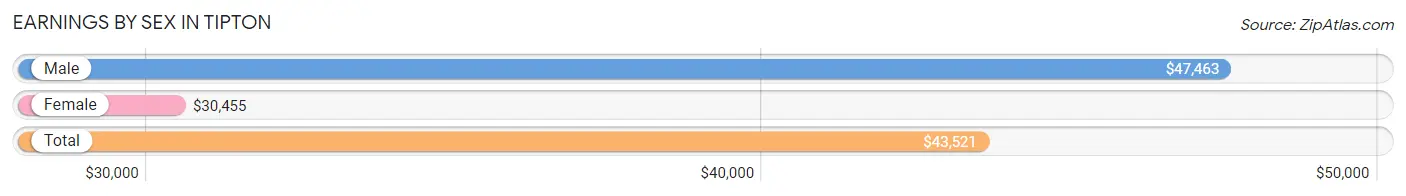
| Sex | Number | Average Earnings |
| Male | 1,530 (56.1%) | $47,463 |
| Female | 1,196 (43.9%) | $30,455 |
| Total | 2,726 (100.0%) | $43,521 |
Earnings by Sex by Income Bracket in Tipton
The most common earnings brackets in Tipton are $50,000 to $54,999 for men (361 | 23.6%) and $10,000 to $12,499 for women (163 | 13.6%).
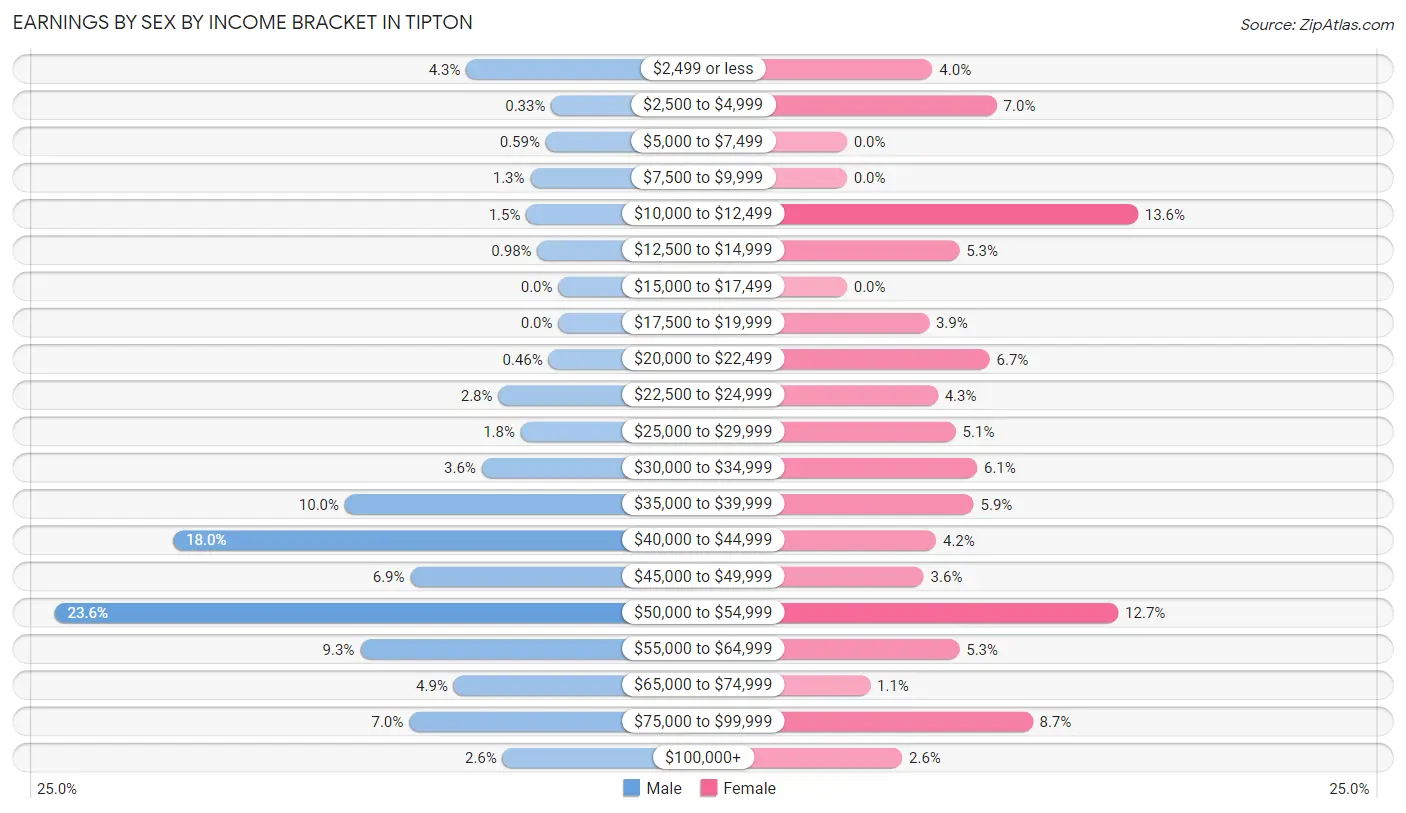
| Income | Male | Female |
| $2,499 or less | 66 (4.3%) | 48 (4.0%) |
| $2,500 to $4,999 | 5 (0.3%) | 84 (7.0%) |
| $5,000 to $7,499 | 9 (0.6%) | 0 (0.0%) |
| $7,500 to $9,999 | 20 (1.3%) | 0 (0.0%) |
| $10,000 to $12,499 | 23 (1.5%) | 163 (13.6%) |
| $12,500 to $14,999 | 15 (1.0%) | 63 (5.3%) |
| $15,000 to $17,499 | 0 (0.0%) | 0 (0.0%) |
| $17,500 to $19,999 | 0 (0.0%) | 46 (3.8%) |
| $20,000 to $22,499 | 7 (0.5%) | 80 (6.7%) |
| $22,500 to $24,999 | 43 (2.8%) | 51 (4.3%) |
| $25,000 to $29,999 | 27 (1.8%) | 61 (5.1%) |
| $30,000 to $34,999 | 55 (3.6%) | 73 (6.1%) |
| $35,000 to $39,999 | 153 (10.0%) | 71 (5.9%) |
| $40,000 to $44,999 | 276 (18.0%) | 50 (4.2%) |
| $45,000 to $49,999 | 106 (6.9%) | 43 (3.6%) |
| $50,000 to $54,999 | 361 (23.6%) | 152 (12.7%) |
| $55,000 to $64,999 | 142 (9.3%) | 63 (5.3%) |
| $65,000 to $74,999 | 75 (4.9%) | 13 (1.1%) |
| $75,000 to $99,999 | 107 (7.0%) | 104 (8.7%) |
| $100,000+ | 40 (2.6%) | 31 (2.6%) |
| Total | 1,530 (100.0%) | 1,196 (100.0%) |
Earnings by Sex by Educational Attainment in Tipton
Average earnings in Tipton are $49,872 for men and $26,992 for women, a difference of 45.9%. Men with an educational attainment of bachelor's degree enjoy the highest average annual earnings of $52,917, while those with college or associate's degree education earn the least with $44,836. Women with an educational attainment of bachelor's degree earn the most with the average annual earnings of $51,424, while those with less than high school education have the smallest earnings of $11,198.
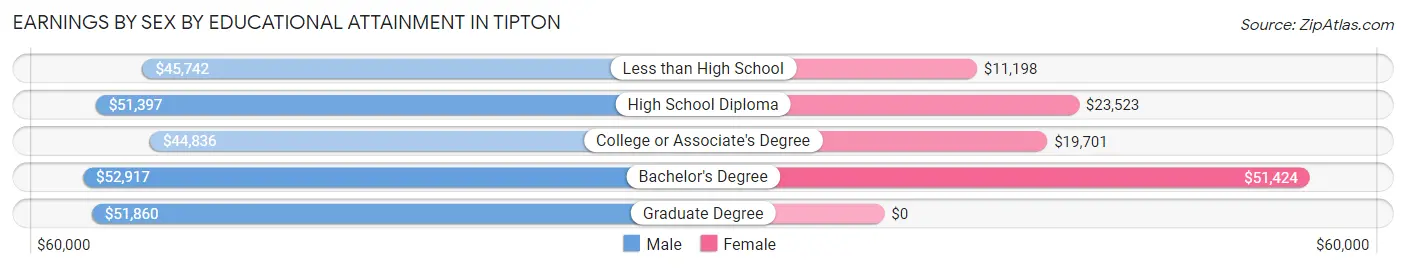
| Educational Attainment | Male Income | Female Income |
| Less than High School | $45,742 | $11,198 |
| High School Diploma | $51,397 | $23,523 |
| College or Associate's Degree | $44,836 | $19,701 |
| Bachelor's Degree | $52,917 | $51,424 |
| Graduate Degree | $51,860 | $0 |
| Total | $49,872 | $26,992 |
Family Income in Tipton
Family Income Brackets in Tipton
According to the Tipton family income data, there are 588 families falling into the $50,000 to $74,999 income range, which is the most common income bracket and makes up 36.2% of all families.
| Income Bracket | # Families | % Families |
| Less than $10,000 | 127 | 7.8% |
| $10,000 to $14,999 | 0 | 0.0% |
| $15,000 to $24,999 | 6 | 0.4% |
| $25,000 to $34,999 | 65 | 4.0% |
| $35,000 to $49,999 | 179 | 11.0% |
| $50,000 to $74,999 | 588 | 36.2% |
| $75,000 to $99,999 | 297 | 18.3% |
| $100,000 to $149,999 | 177 | 10.9% |
| $150,000 to $199,999 | 136 | 8.4% |
| $200,000+ | 50 | 3.1% |
Family Income by Famaliy Size in Tipton
4-person families (174 | 10.7%) account for the highest median family income in Tipton with $71,731 per family, while 2-person families (986 | 60.7%) have the highest median income of $34,684 per family member.
| Income Bracket | # Families | Median Income |
| 2-Person Families | 986 (60.7%) | $69,367 |
| 3-Person Families | 316 (19.5%) | $0 |
| 4-Person Families | 174 (10.7%) | $71,731 |
| 5-Person Families | 59 (3.6%) | $0 |
| 6-Person Families | 7 (0.4%) | $0 |
| 7+ Person Families | 82 (5.1%) | $56,111 |
| Total | 1,624 (100.0%) | $69,109 |
Family Income by Number of Earners in Tipton
The median family income in Tipton is $69,109, with families comprising 3+ earners (128) having the highest median family income of $156,739, while families with no earners (332) have the lowest median family income of $42,957, accounting for 7.9% and 20.4% of families, respectively.
| Number of Earners | # Families | Median Income |
| No Earners | 332 (20.4%) | $42,957 |
| 1 Earner | 484 (29.8%) | $67,750 |
| 2 Earners | 680 (41.9%) | $91,224 |
| 3+ Earners | 128 (7.9%) | $156,739 |
| Total | 1,624 (100.0%) | $69,109 |
Household Income in Tipton
Household Income Brackets in Tipton
With 503 households falling in the category, the $50,000 to $74,999 income range is the most frequent in Tipton, accounting for 23.0% of all households. In contrast, only 18 households (0.8%) fall into the $10,000 to $14,999 income bracket, making it the least populous group.
| Income Bracket | # Households | % Households |
| Less than $10,000 | 182 | 8.3% |
| $10,000 to $14,999 | 18 | 0.8% |
| $15,000 to $24,999 | 131 | 6.0% |
| $25,000 to $34,999 | 125 | 5.7% |
| $35,000 to $49,999 | 300 | 13.7% |
| $50,000 to $74,999 | 503 | 23.0% |
| $75,000 to $99,999 | 497 | 22.7% |
| $100,000 to $149,999 | 245 | 11.2% |
| $150,000 to $199,999 | 136 | 6.2% |
| $200,000+ | 50 | 2.3% |
Household Income by Householder Age in Tipton
The median household income in Tipton is $64,167, with the highest median household income of $71,684 found in the 25 to 44 years age bracket for the primary householder. A total of 639 households (29.2%) fall into this category. Meanwhile, the 15 to 24 years age bracket for the primary householder has the lowest median household income of $0, with 62 households (2.8%) in this group.
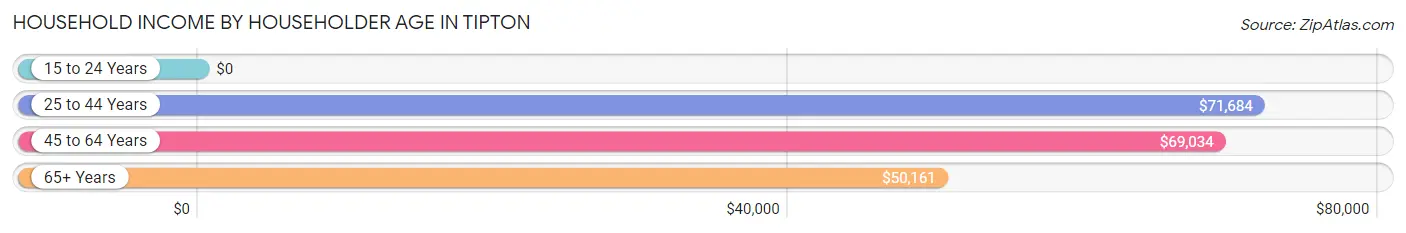
| Income Bracket | # Households | Median Income |
| 15 to 24 Years | 62 (2.8%) | $0 |
| 25 to 44 Years | 639 (29.2%) | $71,684 |
| 45 to 64 Years | 891 (40.7%) | $69,034 |
| 65+ Years | 596 (27.2%) | $50,161 |
| Total | 2,188 (100.0%) | $64,167 |
Poverty in Tipton
Income Below Poverty by Sex and Age in Tipton
With 7.6% poverty level for males and 23.0% for females among the residents of Tipton, 35 to 44 year old males and 18 to 24 year old females are the most vulnerable to poverty, with 36 males (21.6%) and 62 females (51.2%) in their respective age groups living below the poverty level.
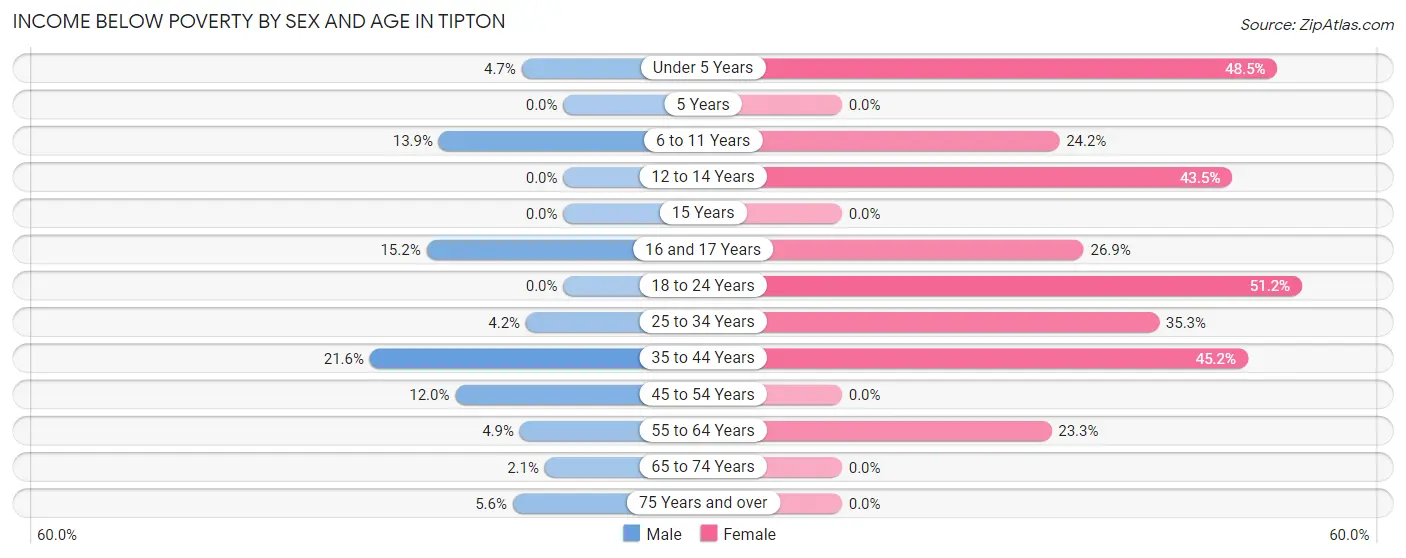
| Age Bracket | Male | Female |
| Under 5 Years | 6 (4.6%) | 98 (48.5%) |
| 5 Years | 0 (0.0%) | 0 (0.0%) |
| 6 to 11 Years | 33 (13.9%) | 23 (24.2%) |
| 12 to 14 Years | 0 (0.0%) | 20 (43.5%) |
| 15 Years | 0 (0.0%) | 0 (0.0%) |
| 16 and 17 Years | 16 (15.2%) | 21 (26.9%) |
| 18 to 24 Years | 0 (0.0%) | 62 (51.2%) |
| 25 to 34 Years | 23 (4.2%) | 125 (35.3%) |
| 35 to 44 Years | 36 (21.6%) | 132 (45.2%) |
| 45 to 54 Years | 51 (12.0%) | 0 (0.0%) |
| 55 to 64 Years | 16 (4.9%) | 77 (23.3%) |
| 65 to 74 Years | 4 (2.1%) | 0 (0.0%) |
| 75 Years and over | 13 (5.6%) | 0 (0.0%) |
| Total | 198 (7.6%) | 558 (23.0%) |
Income Above Poverty by Sex and Age in Tipton
According to the poverty statistics in Tipton, males aged 12 to 14 years and females aged 5 years are the age groups that are most secure financially, with 100.0% of males and 100.0% of females in these age groups living above the poverty line.
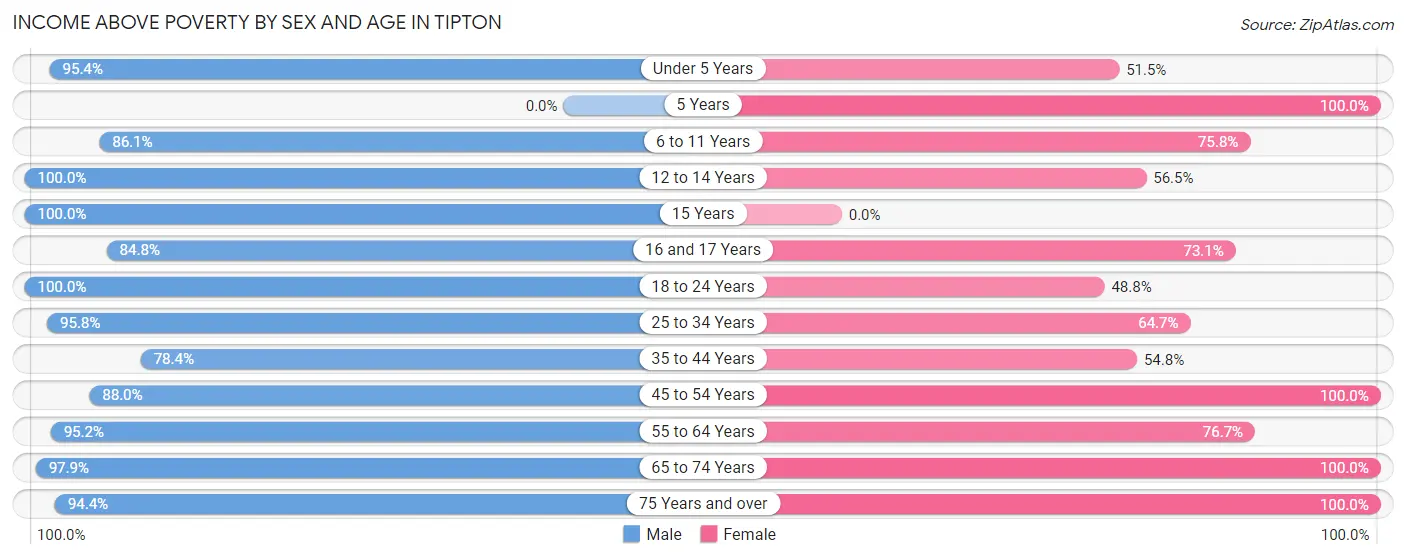
| Age Bracket | Male | Female |
| Under 5 Years | 123 (95.4%) | 104 (51.5%) |
| 5 Years | 0 (0.0%) | 31 (100.0%) |
| 6 to 11 Years | 205 (86.1%) | 72 (75.8%) |
| 12 to 14 Years | 78 (100.0%) | 26 (56.5%) |
| 15 Years | 23 (100.0%) | 0 (0.0%) |
| 16 and 17 Years | 89 (84.8%) | 57 (73.1%) |
| 18 to 24 Years | 148 (100.0%) | 59 (48.8%) |
| 25 to 34 Years | 529 (95.8%) | 229 (64.7%) |
| 35 to 44 Years | 131 (78.4%) | 160 (54.8%) |
| 45 to 54 Years | 373 (88.0%) | 375 (100.0%) |
| 55 to 64 Years | 314 (95.2%) | 253 (76.7%) |
| 65 to 74 Years | 189 (97.9%) | 251 (100.0%) |
| 75 Years and over | 218 (94.4%) | 247 (100.0%) |
| Total | 2,420 (92.4%) | 1,864 (77.0%) |
Income Below Poverty Among Married-Couple Families in Tipton
The poverty statistics for married-couple families in Tipton show that 6.4% or 79 of the total 1,233 families live below the poverty line. Families with 5 or more children have the highest poverty rate of 41.0%, comprising of 25 families. On the other hand, families with no children have the lowest poverty rate of 0.0%, which includes 0 families.
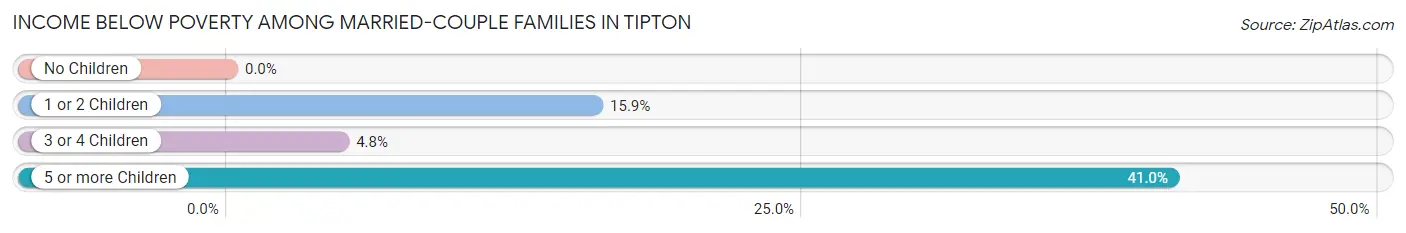
| Children | Above Poverty | Below Poverty |
| No Children | 789 (100.0%) | 0 (0.0%) |
| 1 or 2 Children | 270 (84.1%) | 51 (15.9%) |
| 3 or 4 Children | 59 (95.2%) | 3 (4.8%) |
| 5 or more Children | 36 (59.0%) | 25 (41.0%) |
| Total | 1,154 (93.6%) | 79 (6.4%) |
Income Below Poverty Among Single-Parent Households in Tipton
According to the poverty data in Tipton, 7.0% or 13 single-father households and 30.2% or 62 single-mother households are living below the poverty line. Among single-father households, those with no children have the highest poverty rate, with 13 households (100.0%) experiencing poverty. Likewise, among single-mother households, those with 1 or 2 children have the highest poverty rate, with 62 households (63.9%) falling below the poverty line.
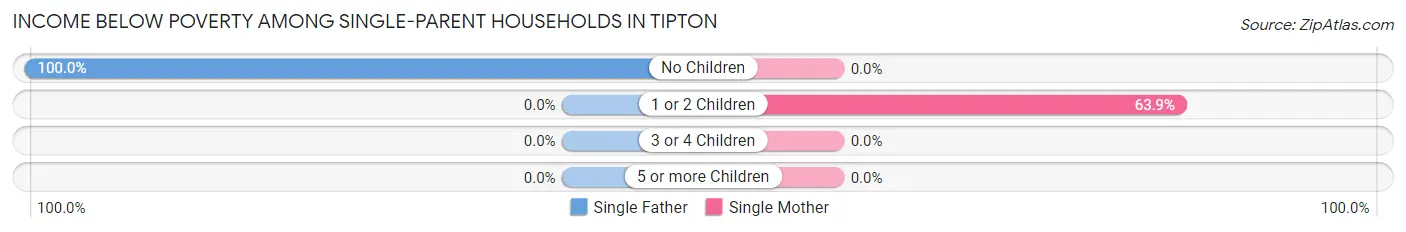
| Children | Single Father | Single Mother |
| No Children | 13 (100.0%) | 0 (0.0%) |
| 1 or 2 Children | 0 (0.0%) | 62 (63.9%) |
| 3 or 4 Children | 0 (0.0%) | 0 (0.0%) |
| 5 or more Children | 0 (0.0%) | 0 (0.0%) |
| Total | 13 (7.0%) | 62 (30.2%) |
Income Below Poverty Among Married-Couple vs Single-Parent Households in Tipton
The poverty data for Tipton shows that 79 of the married-couple family households (6.4%) and 75 of the single-parent households (19.2%) are living below the poverty level. Within the married-couple family households, those with 5 or more children have the highest poverty rate, with 25 households (41.0%) falling below the poverty line. Among the single-parent households, those with 1 or 2 children have the highest poverty rate, with 62 household (23.0%) living below poverty.
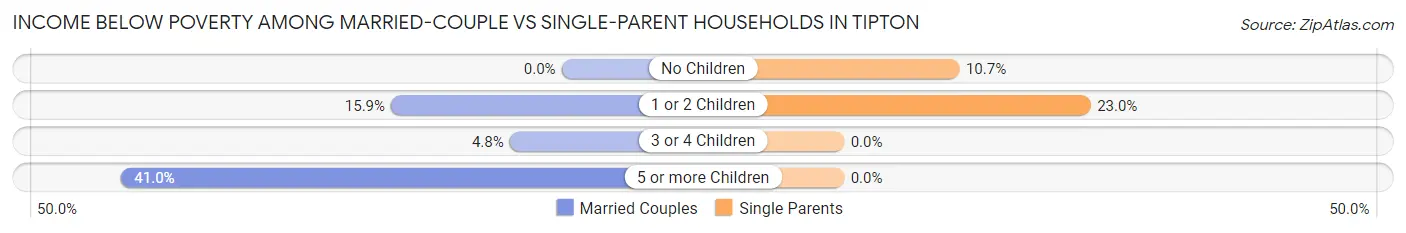
| Children | Married-Couple Families | Single-Parent Households |
| No Children | 0 (0.0%) | 13 (10.7%) |
| 1 or 2 Children | 51 (15.9%) | 62 (23.0%) |
| 3 or 4 Children | 3 (4.8%) | 0 (0.0%) |
| 5 or more Children | 25 (41.0%) | 0 (0.0%) |
| Total | 79 (6.4%) | 75 (19.2%) |
Race in Tipton
The most populous races in Tipton are White / Caucasian (5,056 | 96.2%), Two or more Races (131 | 2.5%), and Hispanic or Latino (100 | 1.9%).
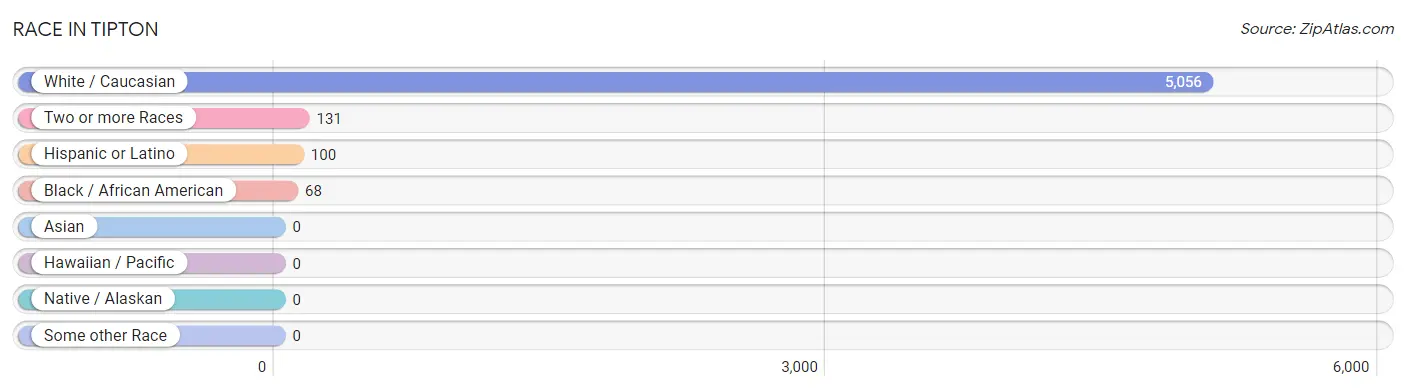
| Race | # Population | % Population |
| Asian | 0 | 0.0% |
| Black / African American | 68 | 1.3% |
| Hawaiian / Pacific | 0 | 0.0% |
| Hispanic or Latino | 100 | 1.9% |
| Native / Alaskan | 0 | 0.0% |
| White / Caucasian | 5,056 | 96.2% |
| Two or more Races | 131 | 2.5% |
| Some other Race | 0 | 0.0% |
| Total | 5,255 | 100.0% |
Ancestry in Tipton
The most populous ancestries reported in Tipton are English (1,078 | 20.5%), German (980 | 18.6%), American (714 | 13.6%), Irish (340 | 6.5%), and Scottish (175 | 3.3%), together accounting for 62.5% of all Tipton residents.
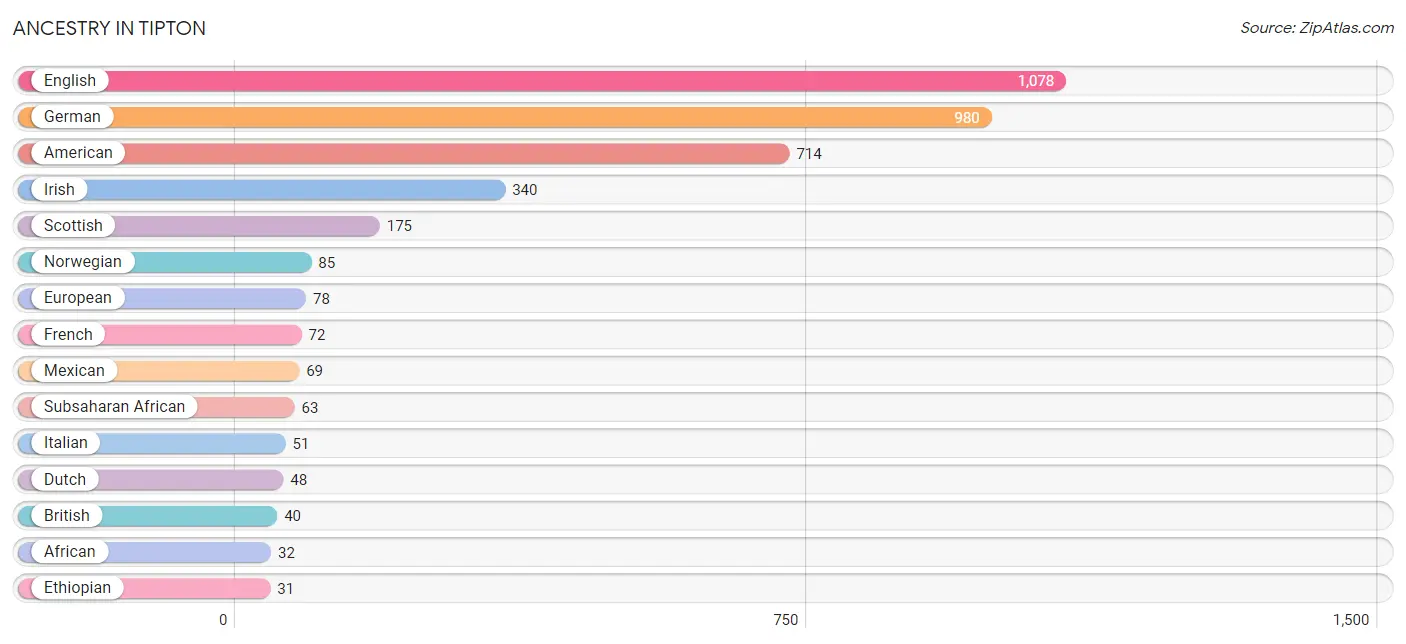
| Ancestry | # Population | % Population |
| African | 32 | 0.6% |
| American | 714 | 13.6% |
| British | 40 | 0.8% |
| Comanche | 18 | 0.3% |
| Dutch | 48 | 0.9% |
| Eastern European | 11 | 0.2% |
| English | 1,078 | 20.5% |
| Ethiopian | 31 | 0.6% |
| European | 78 | 1.5% |
| French | 72 | 1.4% |
| German | 980 | 18.6% |
| Irish | 340 | 6.5% |
| Italian | 51 | 1.0% |
| Mexican | 69 | 1.3% |
| Norwegian | 85 | 1.6% |
| Polish | 17 | 0.3% |
| Puerto Rican | 31 | 0.6% |
| Scandinavian | 15 | 0.3% |
| Scotch-Irish | 30 | 0.6% |
| Scottish | 175 | 3.3% |
| Subsaharan African | 63 | 1.2% |
| Swiss | 14 | 0.3% |
| Welsh | 16 | 0.3% | View All 23 Rows |
Immigrants in Tipton
The most numerous immigrant groups reported in Tipton came from Africa (31 | 0.6%), Eastern Africa (31 | 0.6%), Ethiopia (31 | 0.6%), Australia (15 | 0.3%), and Oceania (15 | 0.3%), together accounting for 2.4% of all Tipton residents.
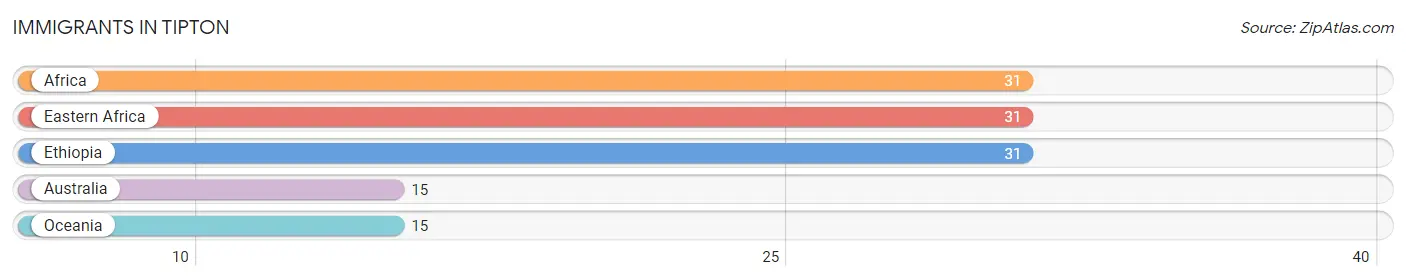
| Immigration Origin | # Population | % Population |
| Africa | 31 | 0.6% |
| Australia | 15 | 0.3% |
| Eastern Africa | 31 | 0.6% |
| Ethiopia | 31 | 0.6% |
| Oceania | 15 | 0.3% | View All 5 Rows |
Sex and Age in Tipton
Sex and Age in Tipton
The most populous age groups in Tipton are 25 to 29 Years (287 | 10.6%) for men and 25 to 29 Years (272 | 10.7%) for women.
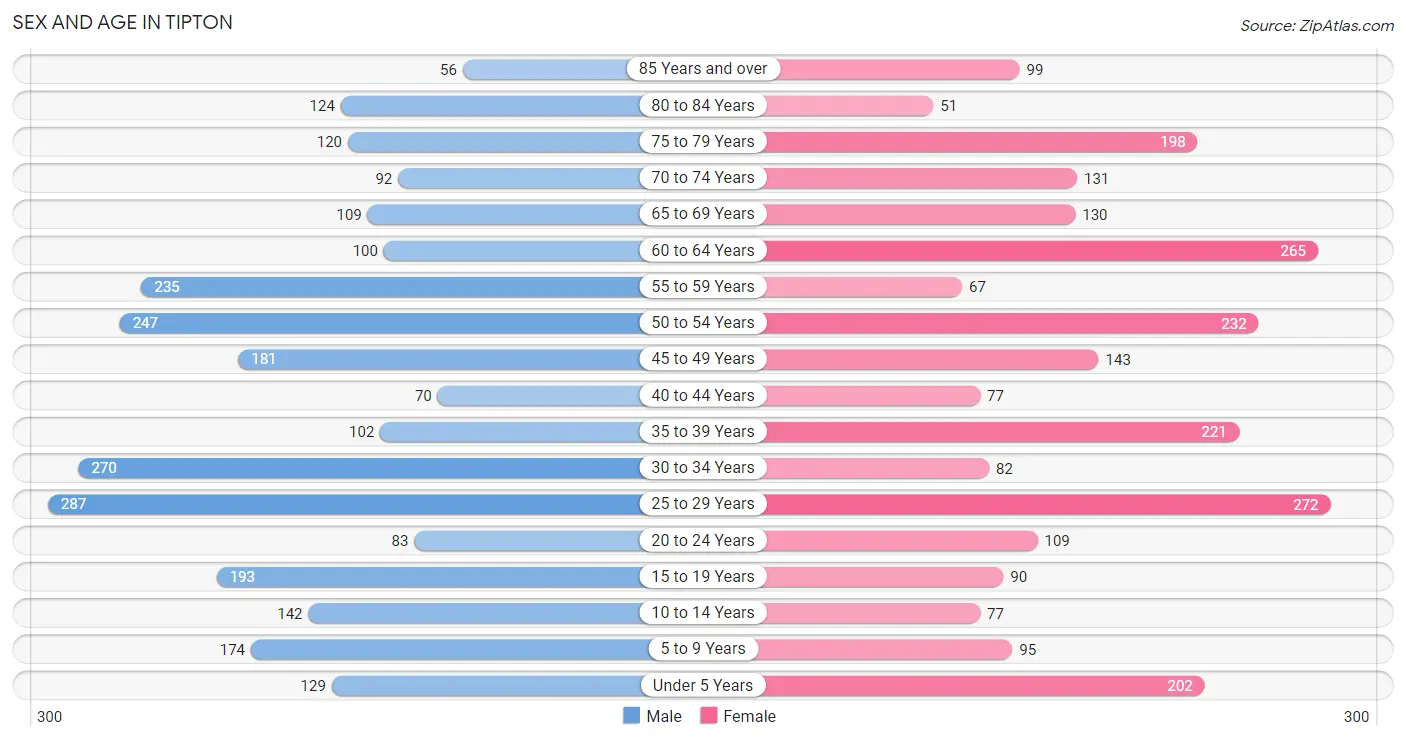
| Age Bracket | Male | Female |
| Under 5 Years | 129 (4.8%) | 202 (8.0%) |
| 5 to 9 Years | 174 (6.4%) | 95 (3.7%) |
| 10 to 14 Years | 142 (5.2%) | 77 (3.0%) |
| 15 to 19 Years | 193 (7.1%) | 90 (3.5%) |
| 20 to 24 Years | 83 (3.1%) | 109 (4.3%) |
| 25 to 29 Years | 287 (10.6%) | 272 (10.7%) |
| 30 to 34 Years | 270 (10.0%) | 82 (3.2%) |
| 35 to 39 Years | 102 (3.8%) | 221 (8.7%) |
| 40 to 44 Years | 70 (2.6%) | 77 (3.0%) |
| 45 to 49 Years | 181 (6.7%) | 143 (5.6%) |
| 50 to 54 Years | 247 (9.1%) | 232 (9.1%) |
| 55 to 59 Years | 235 (8.7%) | 67 (2.6%) |
| 60 to 64 Years | 100 (3.7%) | 265 (10.4%) |
| 65 to 69 Years | 109 (4.0%) | 130 (5.1%) |
| 70 to 74 Years | 92 (3.4%) | 131 (5.2%) |
| 75 to 79 Years | 120 (4.4%) | 198 (7.8%) |
| 80 to 84 Years | 124 (4.6%) | 51 (2.0%) |
| 85 Years and over | 56 (2.1%) | 99 (3.9%) |
| Total | 2,714 (100.0%) | 2,541 (100.0%) |
Families and Households in Tipton
Median Family Size in Tipton
The median family size in Tipton is 2.61 persons per family, with married-couple families (1,233 | 75.9%) accounting for the largest median family size of 2.81 persons per family. On the other hand, single male/father families (186 | 11.5%) represent the smallest median family size with 1.66 persons per family.
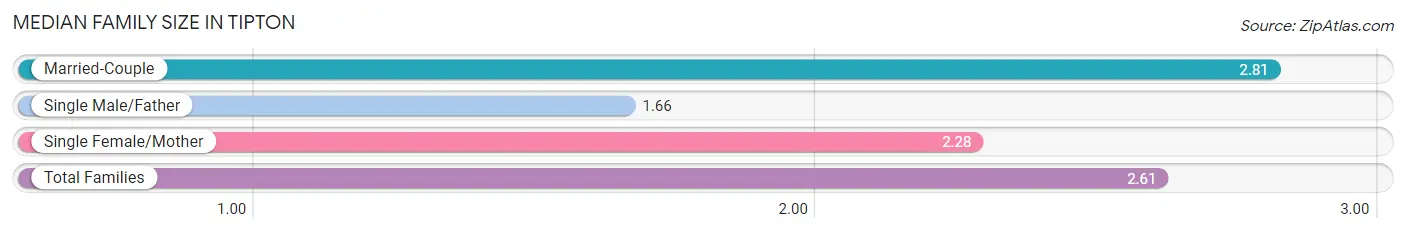
| Family Type | # Families | Family Size |
| Married-Couple | 1,233 (75.9%) | 2.81 |
| Single Male/Father | 186 (11.5%) | 1.66 |
| Single Female/Mother | 205 (12.6%) | 2.28 |
| Total Families | 1,624 (100.0%) | 2.61 |
Median Household Size in Tipton
The median household size in Tipton is 2.30 persons per household, with married-couple households (1,233 | 56.4%) accounting for the largest median household size of 2.82 persons per household. non-family households (564 | 25.8%) represent the smallest median household size with 1.20 persons per household.
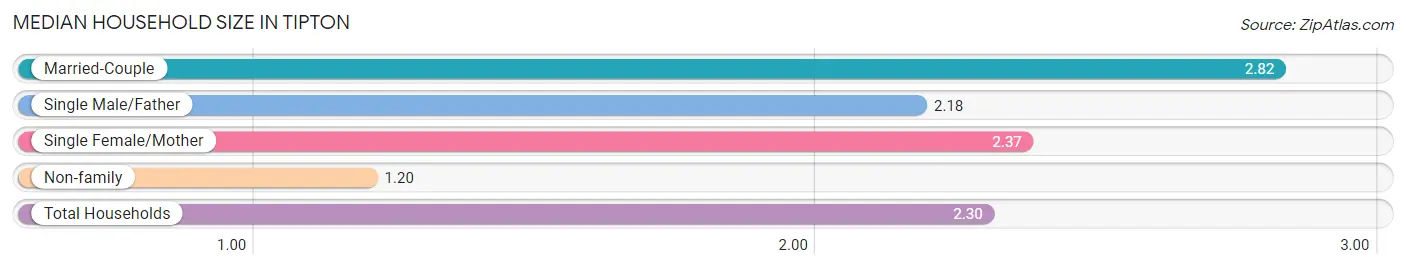
| Household Type | # Households | Household Size |
| Married-Couple | 1,233 (56.4%) | 2.82 |
| Single Male/Father | 186 (8.5%) | 2.18 |
| Single Female/Mother | 205 (9.4%) | 2.37 |
| Non-family | 564 (25.8%) | 1.20 |
| Total Households | 2,188 (100.0%) | 2.30 |
Household Size by Marriage Status in Tipton
Out of a total of 2,188 households in Tipton, 1,624 (74.2%) are family households, while 564 (25.8%) are nonfamily households. The most numerous type of family households are 2-person households, comprising 853, and the most common type of nonfamily households are 1-person households, comprising 443.

| Household Size | Family Households | Nonfamily Households |
| 1-Person Households | - | 443 (20.3%) |
| 2-Person Households | 853 (39.0%) | 121 (5.5%) |
| 3-Person Households | 437 (20.0%) | 0 (0.0%) |
| 4-Person Households | 186 (8.5%) | 0 (0.0%) |
| 5-Person Households | 59 (2.7%) | 0 (0.0%) |
| 6-Person Households | 4 (0.2%) | 0 (0.0%) |
| 7+ Person Households | 85 (3.9%) | 0 (0.0%) |
| Total | 1,624 (74.2%) | 564 (25.8%) |
Female Fertility in Tipton
Fertility by Age in Tipton
Average fertility rate in Tipton is 68.0 births per 1,000 women. Women in the age bracket of 20 to 34 years have the highest fertility rate with 112.0 births per 1,000 women. Women in the age bracket of 20 to 34 years acount for 71.2% of all women with births.
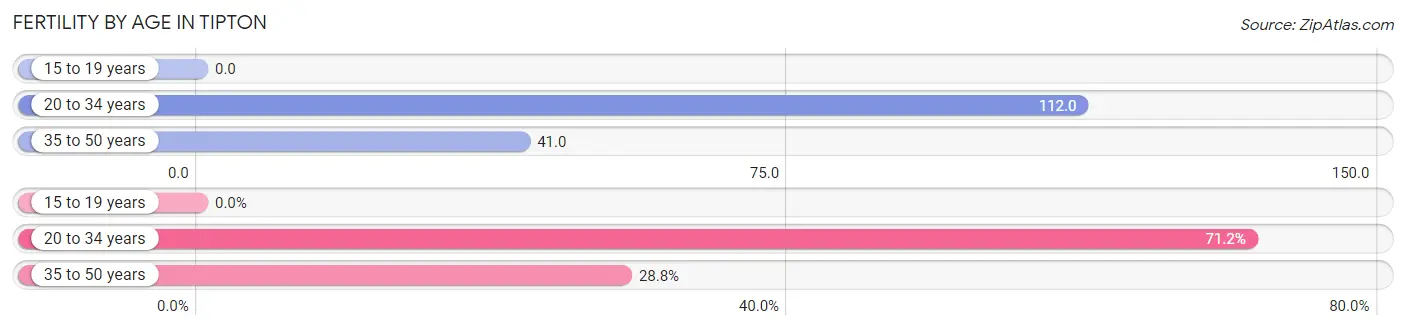
| Age Bracket | Women with Births | Births / 1,000 Women |
| 15 to 19 years | 0 (0.0%) | 0.0 |
| 20 to 34 years | 52 (71.2%) | 112.0 |
| 35 to 50 years | 21 (28.8%) | 41.0 |
| Total | 73 (100.0%) | 68.0 |
Fertility by Age by Marriage Status in Tipton
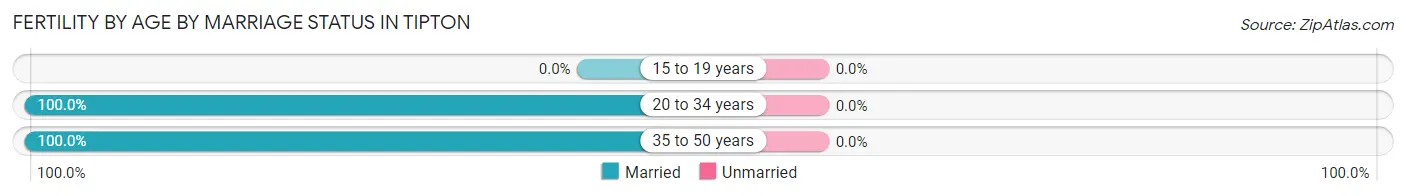
| Age Bracket | Married | Unmarried |
| 15 to 19 years | 0 (0.0%) | 0 (0.0%) |
| 20 to 34 years | 52 (100.0%) | 0 (0.0%) |
| 35 to 50 years | 21 (100.0%) | 0 (0.0%) |
| Total | 73 (100.0%) | 0 (0.0%) |
Fertility by Education in Tipton
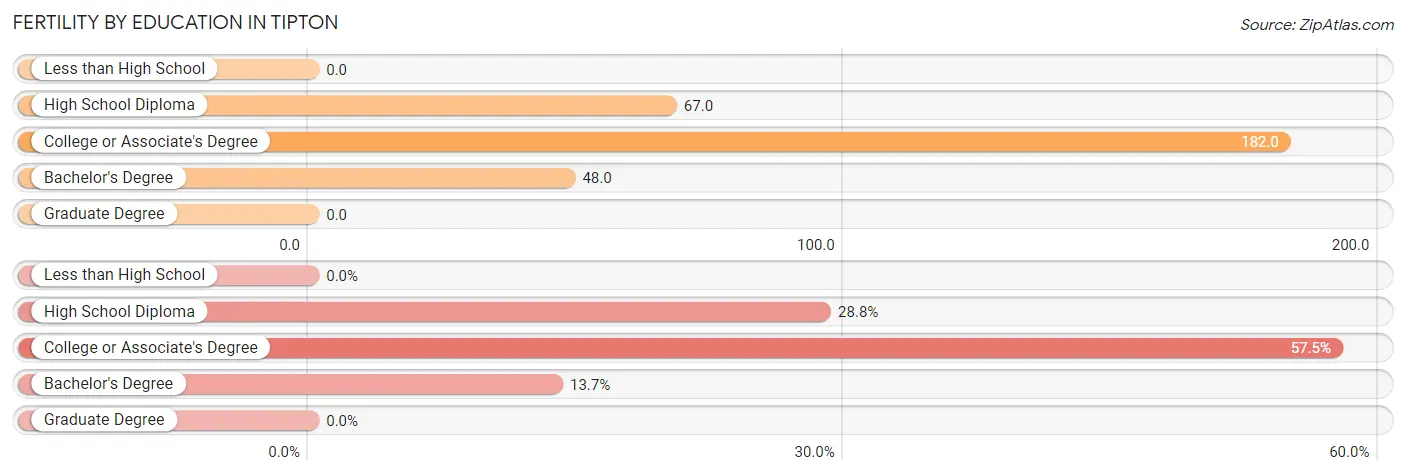
| Educational Attainment | Women with Births | Births / 1,000 Women |
| Less than High School | 0 (0.0%) | 0.0 |
| High School Diploma | 21 (28.8%) | 67.0 |
| College or Associate's Degree | 42 (57.5%) | 182.0 |
| Bachelor's Degree | 10 (13.7%) | 48.0 |
| Graduate Degree | 0 (0.0%) | 0.0 |
| Total | 73 (100.0%) | 68.0 |
Fertility by Education by Marriage Status in Tipton
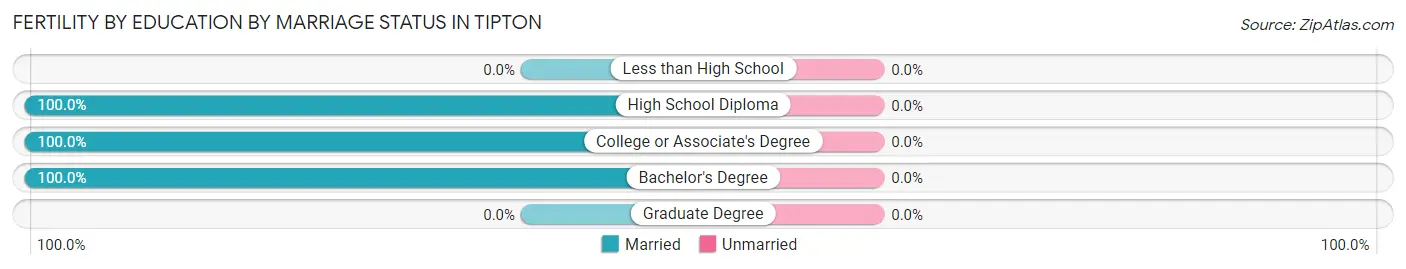
| Educational Attainment | Married | Unmarried |
| Less than High School | 0 (0.0%) | 0 (0.0%) |
| High School Diploma | 21 (100.0%) | 0 (0.0%) |
| College or Associate's Degree | 42 (100.0%) | 0 (0.0%) |
| Bachelor's Degree | 10 (100.0%) | 0 (0.0%) |
| Graduate Degree | 0 (0.0%) | 0 (0.0%) |
| Total | 73 (100.0%) | 0 (0.0%) |
Employment Characteristics in Tipton
Employment by Class of Employer in Tipton
Among the 2,541 employed individuals in Tipton, private company employees (1,738 | 68.4%), local government employees (472 | 18.6%), and not-for-profit organizations (151 | 5.9%) make up the most common classes of employment.
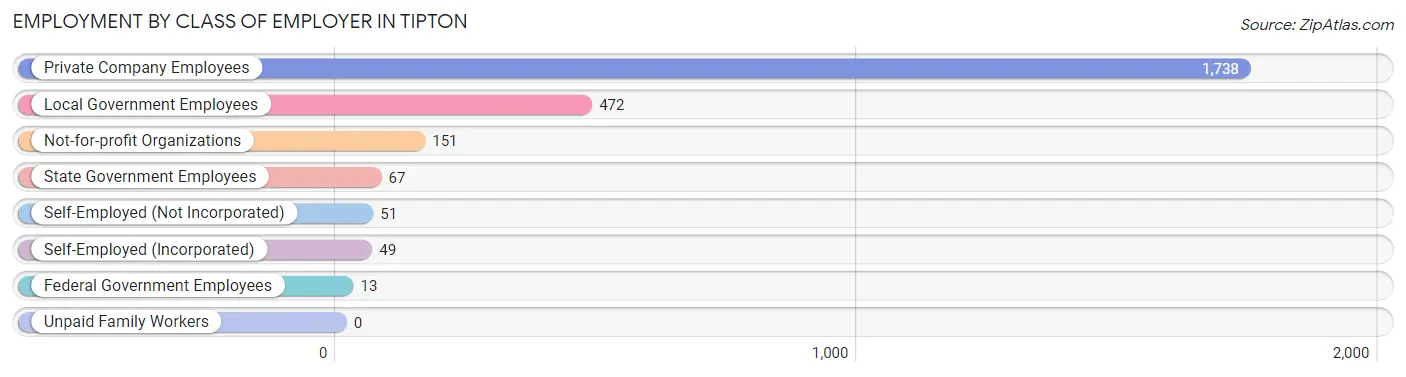
| Employer Class | # Employees | % Employees |
| Private Company Employees | 1,738 | 68.4% |
| Self-Employed (Incorporated) | 49 | 1.9% |
| Self-Employed (Not Incorporated) | 51 | 2.0% |
| Not-for-profit Organizations | 151 | 5.9% |
| Local Government Employees | 472 | 18.6% |
| State Government Employees | 67 | 2.6% |
| Federal Government Employees | 13 | 0.5% |
| Unpaid Family Workers | 0 | 0.0% |
| Total | 2,541 | 100.0% |
Employment Status by Age in Tipton
According to the labor force statistics for Tipton, out of the total population over 16 years of age (4,413), 61.1% or 2,696 individuals are in the labor force, with 5.1% or 137 of them unemployed. The age group with the highest labor force participation rate is 30 to 34 years, with 95.5% or 336 individuals in the labor force. Within the labor force, the 45 to 54 years age range has the highest percentage of unemployed individuals, with 15.7% or 106 of them being unemployed.
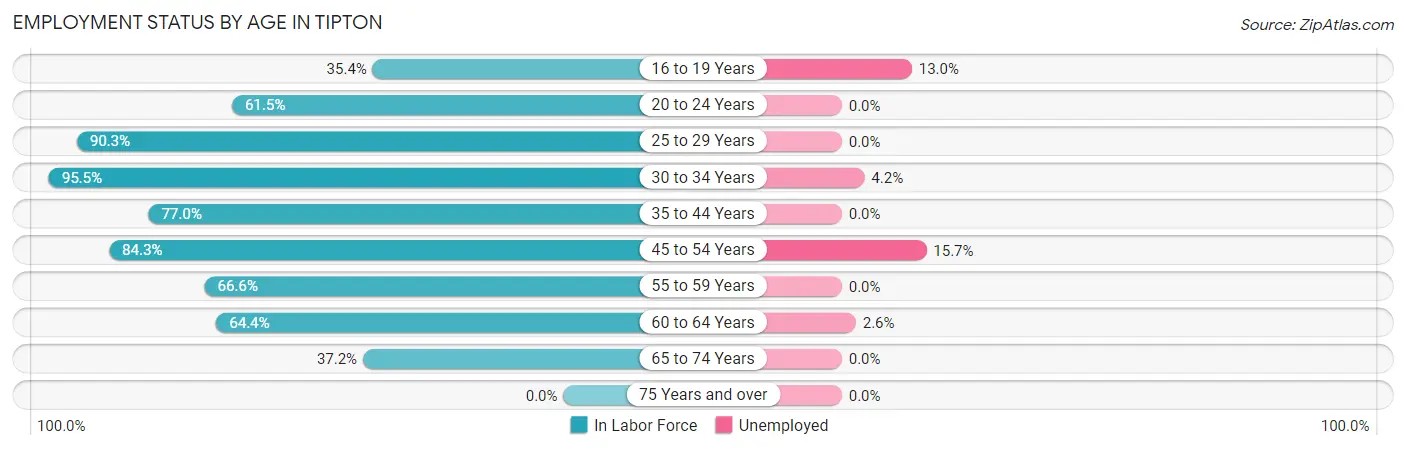
| Age Bracket | In Labor Force | Unemployed |
| 16 to 19 Years | 92 (35.4%) | 12 (13.0%) |
| 20 to 24 Years | 118 (61.5%) | 0 (0.0%) |
| 25 to 29 Years | 505 (90.3%) | 0 (0.0%) |
| 30 to 34 Years | 336 (95.5%) | 14 (4.2%) |
| 35 to 44 Years | 362 (77.0%) | 0 (0.0%) |
| 45 to 54 Years | 677 (84.3%) | 106 (15.7%) |
| 55 to 59 Years | 201 (66.6%) | 0 (0.0%) |
| 60 to 64 Years | 235 (64.4%) | 6 (2.6%) |
| 65 to 74 Years | 172 (37.2%) | 0 (0.0%) |
| 75 Years and over | 0 (0.0%) | 0 (0.0%) |
| Total | 2,696 (61.1%) | 137 (5.1%) |
Employment Status by Educational Attainment in Tipton
According to labor force statistics for Tipton, 81.2% of individuals (2,315) out of the total population between 25 and 64 years of age (2,851) are in the labor force, with 5.4% or 125 of them being unemployed. The group with the highest labor force participation rate are those with the educational attainment of bachelor's degree or higher, with 98.2% or 602 individuals in the labor force. Within the labor force, individuals with college / associate degree education have the highest percentage of unemployment, with 8.7% or 62 of them being unemployed.
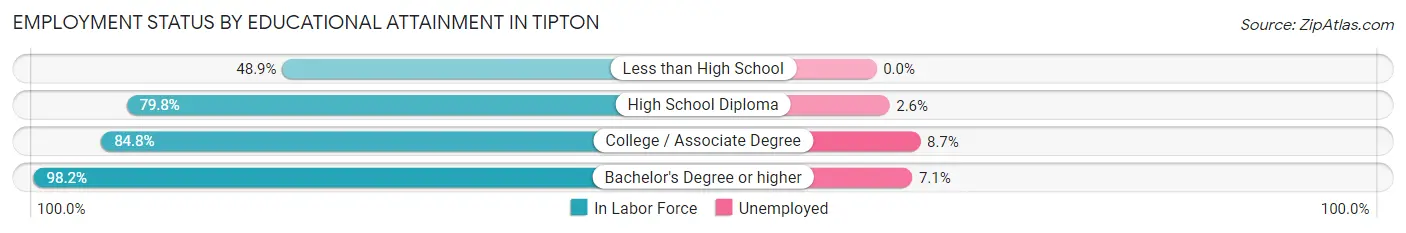
| Educational Attainment | In Labor Force | Unemployed |
| Less than High School | 181 (48.9%) | 0 (0.0%) |
| High School Diploma | 819 (79.8%) | 27 (2.6%) |
| College / Associate Degree | 714 (84.8%) | 73 (8.7%) |
| Bachelor's Degree or higher | 602 (98.2%) | 44 (7.1%) |
| Total | 2,315 (81.2%) | 154 (5.4%) |
Employment Occupations by Sex in Tipton
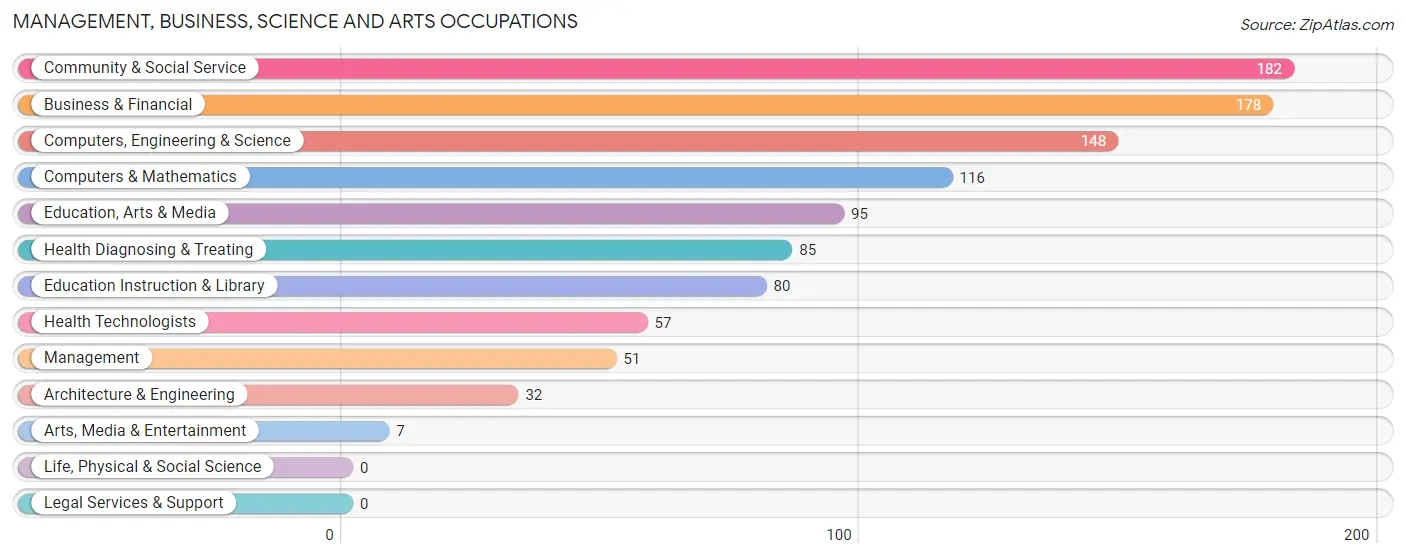
Management, Business, Science and Arts Occupations
The most common Management, Business, Science and Arts occupations in Tipton are Community & Social Service (182 | 7.1%), Business & Financial (178 | 7.0%), Computers, Engineering & Science (148 | 5.8%), Computers & Mathematics (116 | 4.5%), and Education, Arts & Media (95 | 3.7%).
Management, Business, Science and Arts Occupations by Sex
Within the Management, Business, Science and Arts occupations in Tipton, the most male-oriented occupations are Architecture & Engineering (100.0%), Computers, Engineering & Science (75.0%), and Computers & Mathematics (68.1%), while the most female-oriented occupations are Arts, Media & Entertainment (100.0%), Health Diagnosing & Treating (100.0%), and Health Technologists (100.0%).
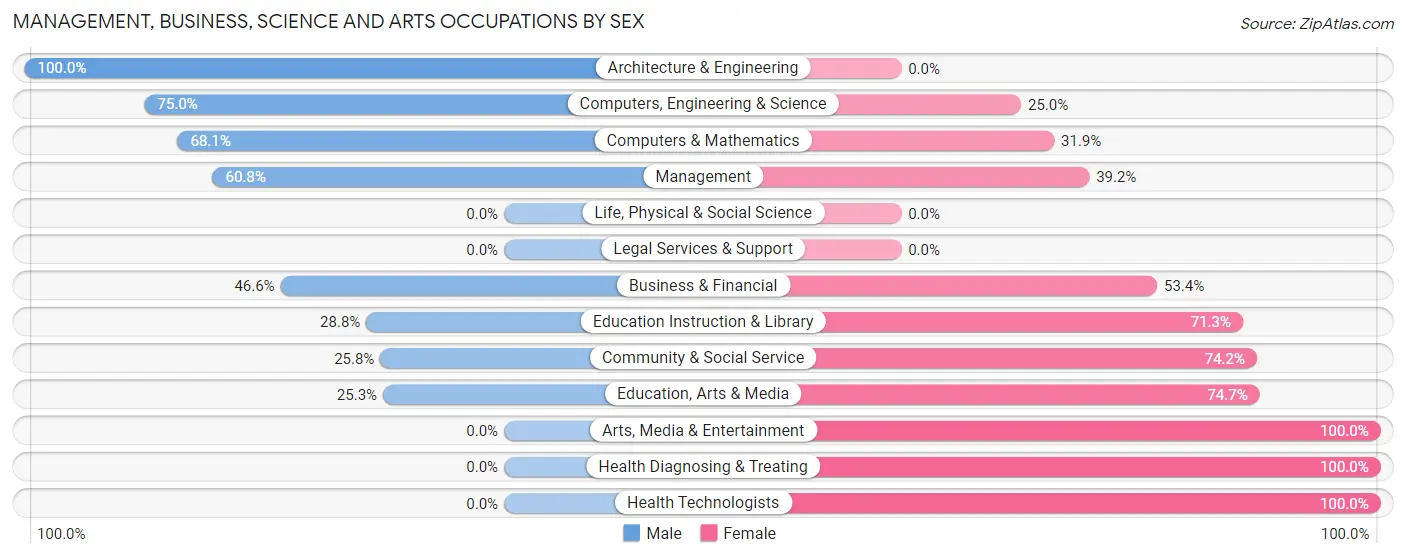
| Occupation | Male | Female |
| Management | 31 (60.8%) | 20 (39.2%) |
| Business & Financial | 83 (46.6%) | 95 (53.4%) |
| Computers, Engineering & Science | 111 (75.0%) | 37 (25.0%) |
| Computers & Mathematics | 79 (68.1%) | 37 (31.9%) |
| Architecture & Engineering | 32 (100.0%) | 0 (0.0%) |
| Life, Physical & Social Science | 0 (0.0%) | 0 (0.0%) |
| Community & Social Service | 47 (25.8%) | 135 (74.2%) |
| Education, Arts & Media | 24 (25.3%) | 71 (74.7%) |
| Legal Services & Support | 0 (0.0%) | 0 (0.0%) |
| Education Instruction & Library | 23 (28.7%) | 57 (71.3%) |
| Arts, Media & Entertainment | 0 (0.0%) | 7 (100.0%) |
| Health Diagnosing & Treating | 0 (0.0%) | 85 (100.0%) |
| Health Technologists | 0 (0.0%) | 57 (100.0%) |
| Total (Category) | 272 (42.2%) | 372 (57.8%) |
| Total (Overall) | 1,432 (55.9%) | 1,128 (44.1%) |
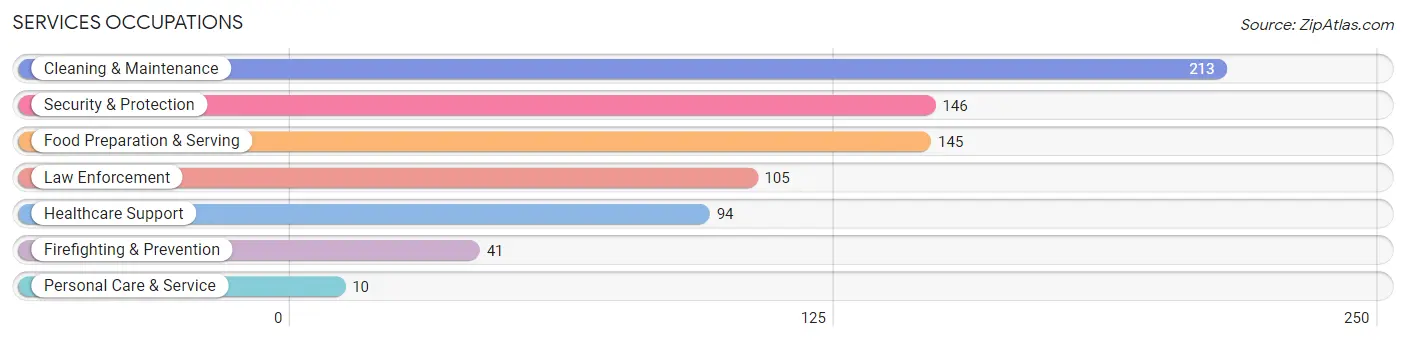
Services Occupations
The most common Services occupations in Tipton are Cleaning & Maintenance (213 | 8.3%), Security & Protection (146 | 5.7%), Food Preparation & Serving (145 | 5.7%), Law Enforcement (105 | 4.1%), and Healthcare Support (94 | 3.7%).
Services Occupations by Sex
Within the Services occupations in Tipton, the most male-oriented occupations are Law Enforcement (100.0%), Security & Protection (71.9%), and Cleaning & Maintenance (67.1%), while the most female-oriented occupations are Healthcare Support (100.0%), Firefighting & Prevention (100.0%), and Personal Care & Service (100.0%).
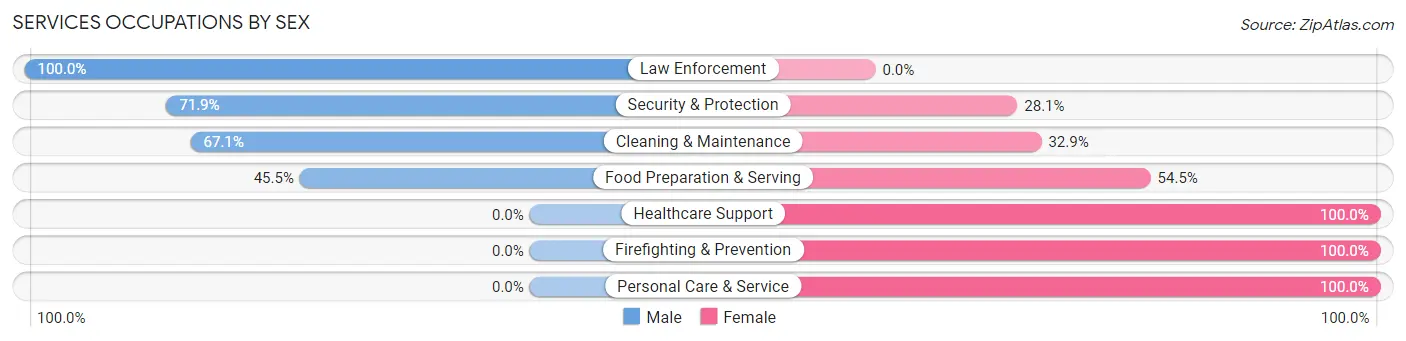
| Occupation | Male | Female |
| Healthcare Support | 0 (0.0%) | 94 (100.0%) |
| Security & Protection | 105 (71.9%) | 41 (28.1%) |
| Firefighting & Prevention | 0 (0.0%) | 41 (100.0%) |
| Law Enforcement | 105 (100.0%) | 0 (0.0%) |
| Food Preparation & Serving | 66 (45.5%) | 79 (54.5%) |
| Cleaning & Maintenance | 143 (67.1%) | 70 (32.9%) |
| Personal Care & Service | 0 (0.0%) | 10 (100.0%) |
| Total (Category) | 314 (51.6%) | 294 (48.4%) |
| Total (Overall) | 1,432 (55.9%) | 1,128 (44.1%) |
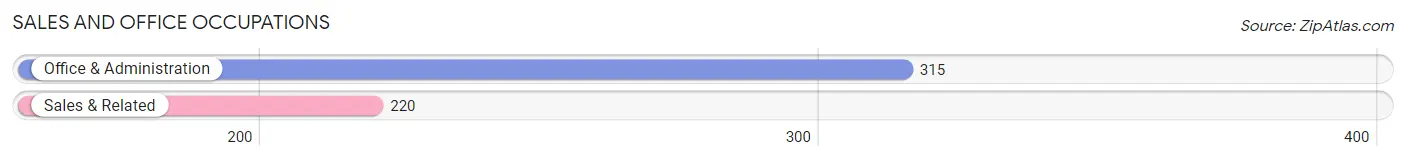
Sales and Office Occupations
The most common Sales and Office occupations in Tipton are Office & Administration (315 | 12.3%), and Sales & Related (220 | 8.6%).
Sales and Office Occupations by Sex
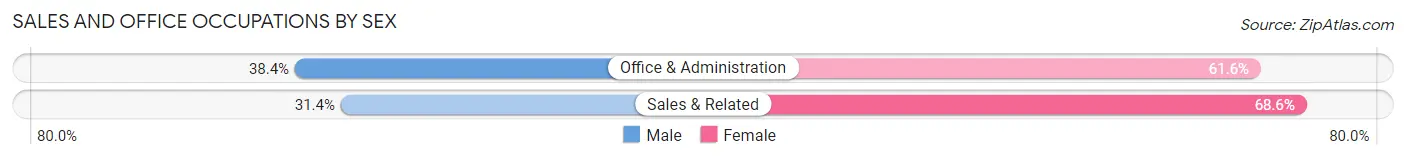
| Occupation | Male | Female |
| Sales & Related | 69 (31.4%) | 151 (68.6%) |
| Office & Administration | 121 (38.4%) | 194 (61.6%) |
| Total (Category) | 190 (35.5%) | 345 (64.5%) |
| Total (Overall) | 1,432 (55.9%) | 1,128 (44.1%) |
Natural Resources, Construction and Maintenance Occupations
The most common Natural Resources, Construction and Maintenance occupations in Tipton are Installation, Maintenance & Repair (117 | 4.6%), Construction & Extraction (73 | 2.9%), and Farming, Fishing & Forestry (12 | 0.5%).
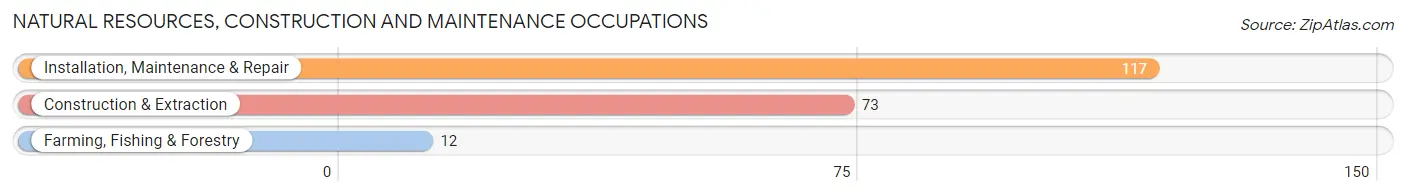
Natural Resources, Construction and Maintenance Occupations by Sex
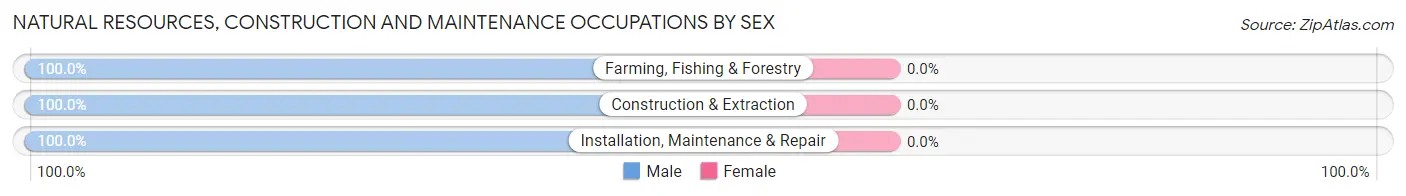
| Occupation | Male | Female |
| Farming, Fishing & Forestry | 12 (100.0%) | 0 (0.0%) |
| Construction & Extraction | 73 (100.0%) | 0 (0.0%) |
| Installation, Maintenance & Repair | 117 (100.0%) | 0 (0.0%) |
| Total (Category) | 202 (100.0%) | 0 (0.0%) |
| Total (Overall) | 1,432 (55.9%) | 1,128 (44.1%) |
Production, Transportation and Moving Occupations
The most common Production, Transportation and Moving occupations in Tipton are Production (354 | 13.8%), Material Moving (175 | 6.8%), and Transportation (42 | 1.6%).
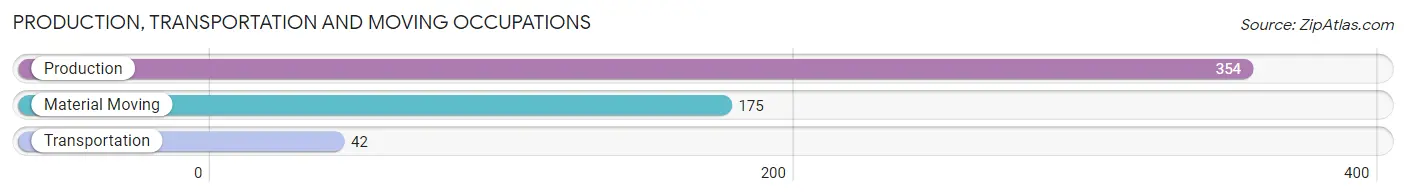
Production, Transportation and Moving Occupations by Sex
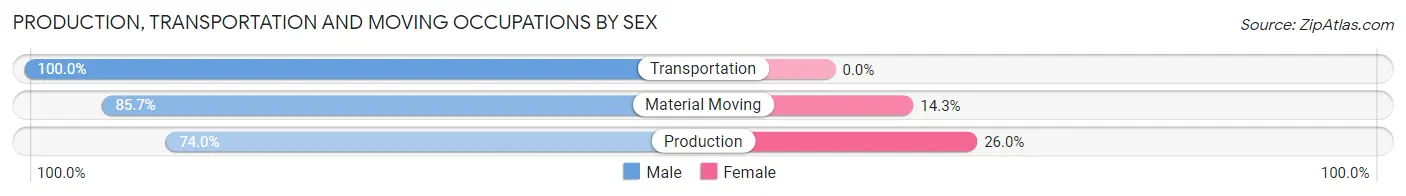
| Occupation | Male | Female |
| Production | 262 (74.0%) | 92 (26.0%) |
| Transportation | 42 (100.0%) | 0 (0.0%) |
| Material Moving | 150 (85.7%) | 25 (14.3%) |
| Total (Category) | 454 (79.5%) | 117 (20.5%) |
| Total (Overall) | 1,432 (55.9%) | 1,128 (44.1%) |
Employment Industries by Sex in Tipton
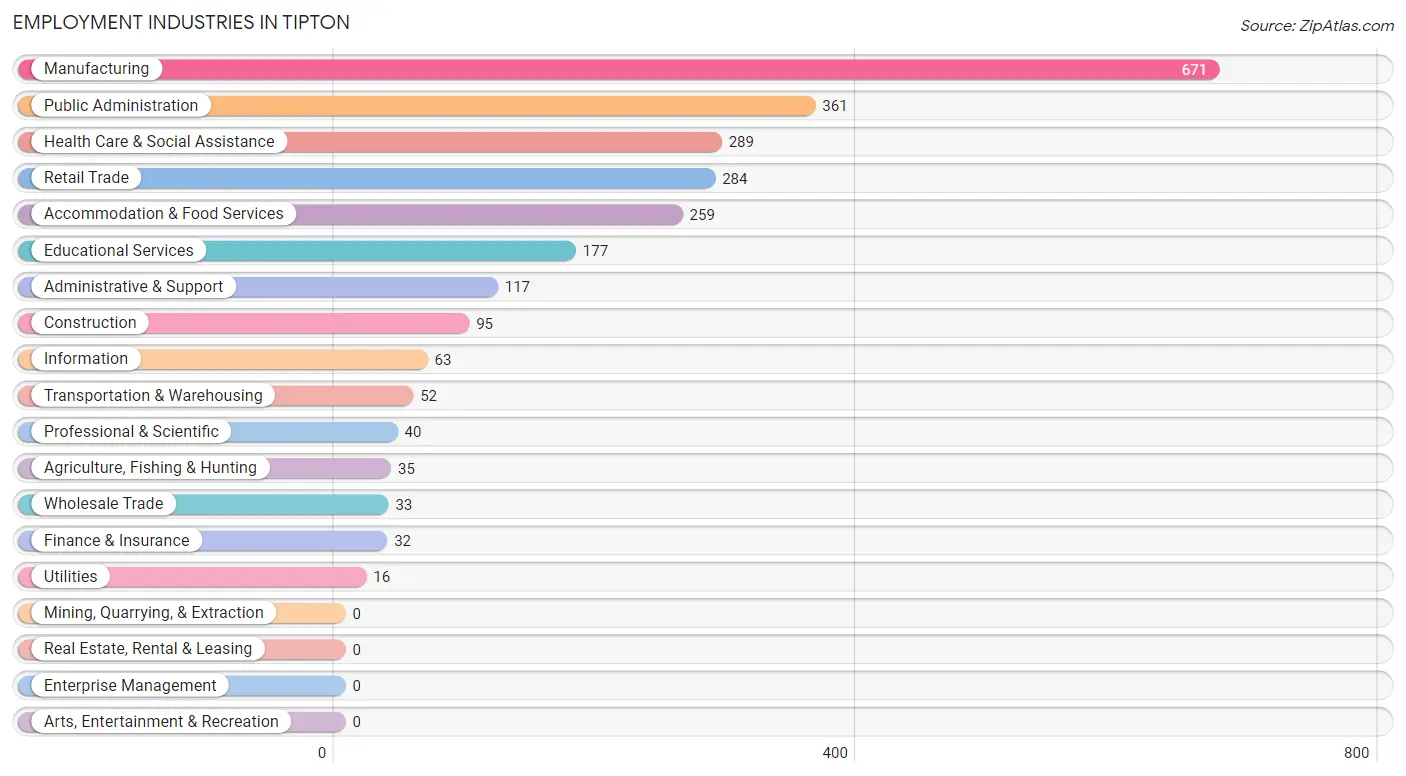
Employment Industries in Tipton
The major employment industries in Tipton include Manufacturing (671 | 26.2%), Public Administration (361 | 14.1%), Health Care & Social Assistance (289 | 11.3%), Retail Trade (284 | 11.1%), and Accommodation & Food Services (259 | 10.1%).
Employment Industries by Sex in Tipton
The Tipton industries that see more men than women are Agriculture, Fishing & Hunting (100.0%), Construction (100.0%), and Wholesale Trade (100.0%), whereas the industries that tend to have a higher number of women are Health Care & Social Assistance (79.2%), Public Administration (60.9%), and Accommodation & Food Services (59.9%).
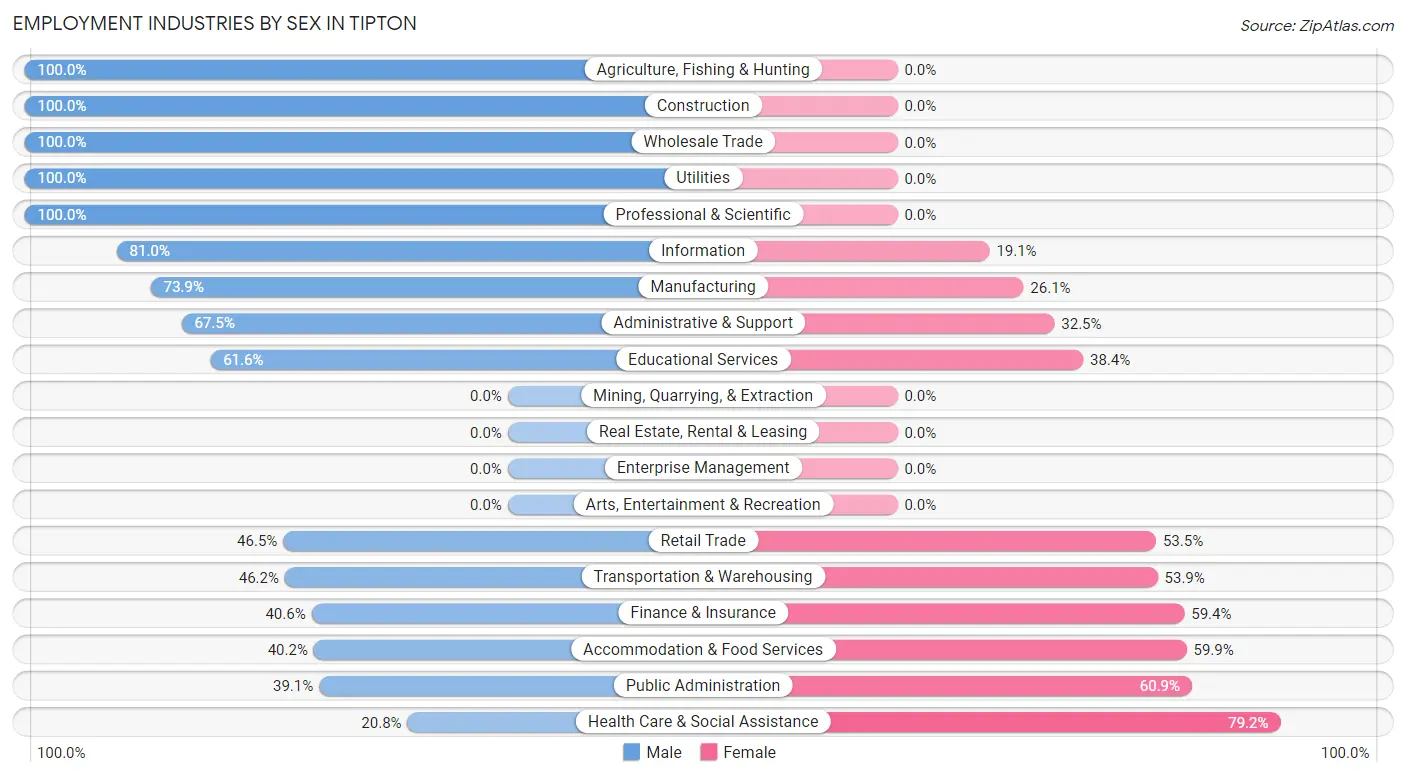
| Industry | Male | Female |
| Agriculture, Fishing & Hunting | 35 (100.0%) | 0 (0.0%) |
| Mining, Quarrying, & Extraction | 0 (0.0%) | 0 (0.0%) |
| Construction | 95 (100.0%) | 0 (0.0%) |
| Manufacturing | 496 (73.9%) | 175 (26.1%) |
| Wholesale Trade | 33 (100.0%) | 0 (0.0%) |
| Retail Trade | 132 (46.5%) | 152 (53.5%) |
| Transportation & Warehousing | 24 (46.2%) | 28 (53.8%) |
| Utilities | 16 (100.0%) | 0 (0.0%) |
| Information | 51 (80.9%) | 12 (19.1%) |
| Finance & Insurance | 13 (40.6%) | 19 (59.4%) |
| Real Estate, Rental & Leasing | 0 (0.0%) | 0 (0.0%) |
| Professional & Scientific | 40 (100.0%) | 0 (0.0%) |
| Enterprise Management | 0 (0.0%) | 0 (0.0%) |
| Administrative & Support | 79 (67.5%) | 38 (32.5%) |
| Educational Services | 109 (61.6%) | 68 (38.4%) |
| Health Care & Social Assistance | 60 (20.8%) | 229 (79.2%) |
| Arts, Entertainment & Recreation | 0 (0.0%) | 0 (0.0%) |
| Accommodation & Food Services | 104 (40.2%) | 155 (59.9%) |
| Public Administration | 141 (39.1%) | 220 (60.9%) |
| Total | 1,432 (55.9%) | 1,128 (44.1%) |
Education in Tipton
School Enrollment in Tipton
The most common levels of schooling among the 931 students in Tipton are elementary school (289 | 31.0%), high school (228 | 24.5%), and middle school (148 | 15.9%).
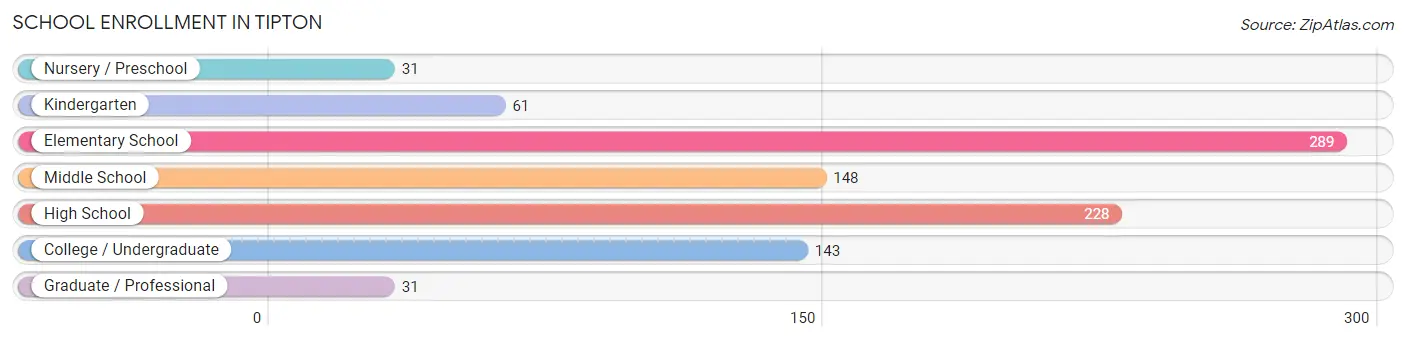
| School Level | # Students | % Students |
| Nursery / Preschool | 31 | 3.3% |
| Kindergarten | 61 | 6.6% |
| Elementary School | 289 | 31.0% |
| Middle School | 148 | 15.9% |
| High School | 228 | 24.5% |
| College / Undergraduate | 143 | 15.4% |
| Graduate / Professional | 31 | 3.3% |
| Total | 931 | 100.0% |
School Enrollment by Age by Funding Source in Tipton
Out of a total of 931 students who are enrolled in schools in Tipton, 195 (20.9%) attend a private institution, while the remaining 736 (79.1%) are enrolled in public schools. The age group of 3 to 4 year olds has the highest likelihood of being enrolled in private schools, with 31 (100.0% in the age bracket) enrolled. Conversely, the age group of 18 to 19 year olds has the lowest likelihood of being enrolled in a private school, with 41 (100.0% in the age bracket) attending a public institution.
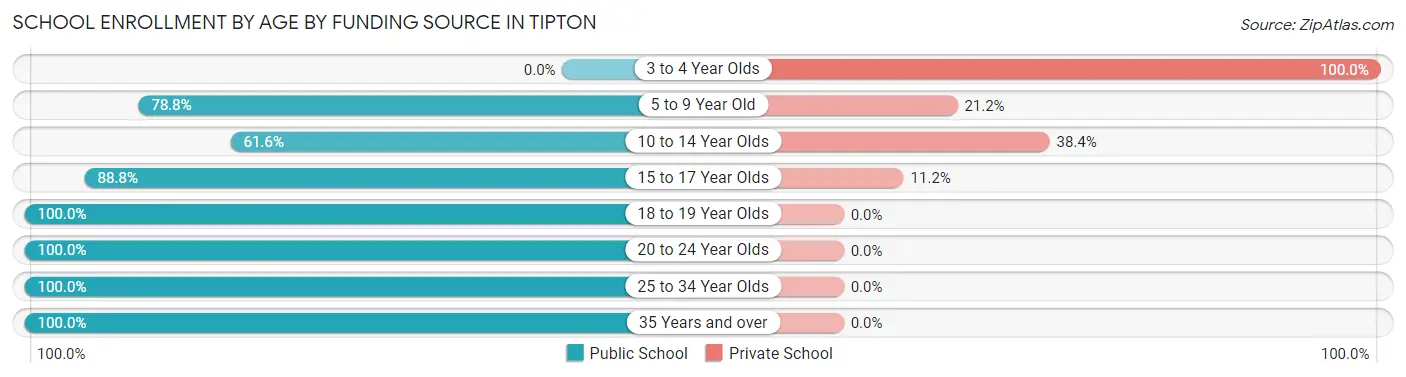
| Age Bracket | Public School | Private School |
| 3 to 4 Year Olds | 0 (0.0%) | 31 (100.0%) |
| 5 to 9 Year Old | 212 (78.8%) | 57 (21.2%) |
| 10 to 14 Year Olds | 135 (61.6%) | 84 (38.4%) |
| 15 to 17 Year Olds | 183 (88.8%) | 23 (11.2%) |
| 18 to 19 Year Olds | 41 (100.0%) | 0 (0.0%) |
| 20 to 24 Year Olds | 62 (100.0%) | 0 (0.0%) |
| 25 to 34 Year Olds | 72 (100.0%) | 0 (0.0%) |
| 35 Years and over | 31 (100.0%) | 0 (0.0%) |
| Total | 736 (79.1%) | 195 (20.9%) |
Educational Attainment by Field of Study in Tipton
Business (275 | 27.8%), science & technology (138 | 14.0%), arts & humanities (119 | 12.0%), bio, nature & agricultural (105 | 10.6%), and education (79 | 8.0%) are the most common fields of study among 989 individuals in Tipton who have obtained a bachelor's degree or higher.
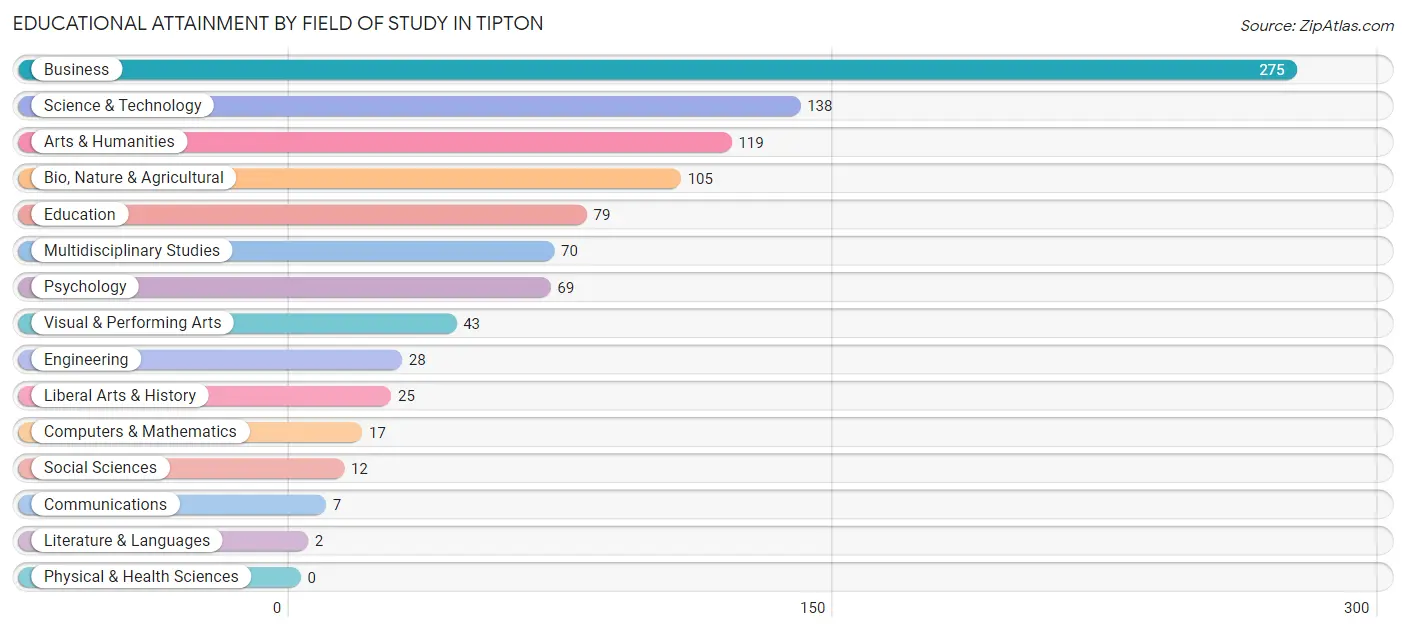
| Field of Study | # Graduates | % Graduates |
| Computers & Mathematics | 17 | 1.7% |
| Bio, Nature & Agricultural | 105 | 10.6% |
| Physical & Health Sciences | 0 | 0.0% |
| Psychology | 69 | 7.0% |
| Social Sciences | 12 | 1.2% |
| Engineering | 28 | 2.8% |
| Multidisciplinary Studies | 70 | 7.1% |
| Science & Technology | 138 | 14.0% |
| Business | 275 | 27.8% |
| Education | 79 | 8.0% |
| Literature & Languages | 2 | 0.2% |
| Liberal Arts & History | 25 | 2.5% |
| Visual & Performing Arts | 43 | 4.3% |
| Communications | 7 | 0.7% |
| Arts & Humanities | 119 | 12.0% |
| Total | 989 | 100.0% |
Transportation & Commute in Tipton
Vehicle Availability by Sex in Tipton
The most prevalent vehicle ownership categories in Tipton are males with 2 vehicles (789, accounting for 55.4%) and females with 2 vehicles (614, making up 70.6%).
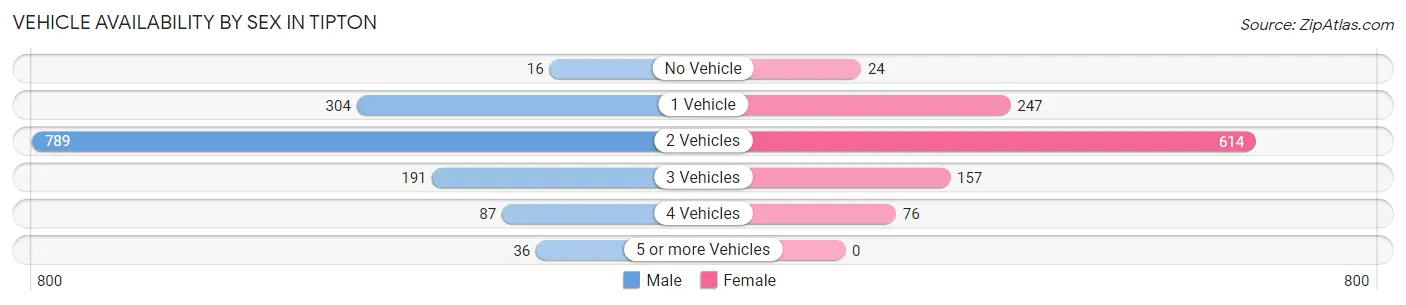
| Vehicles Available | Male | Female |
| No Vehicle | 16 (1.1%) | 24 (2.1%) |
| 1 Vehicle | 304 (21.4%) | 247 (22.1%) |
| 2 Vehicles | 789 (55.4%) | 614 (54.9%) |
| 3 Vehicles | 191 (13.4%) | 157 (14.0%) |
| 4 Vehicles | 87 (6.1%) | 76 (6.8%) |
| 5 or more Vehicles | 36 (2.5%) | 0 (0.0%) |
| Total | 1,423 (100.0%) | 1,118 (100.0%) |
Commute Time in Tipton
The most frequently occuring commute durations in Tipton are less than 5 minutes (335 commuters, 13.7%), 10 to 14 minutes (318 commuters, 13.0%), and 20 to 24 minutes (308 commuters, 12.6%).
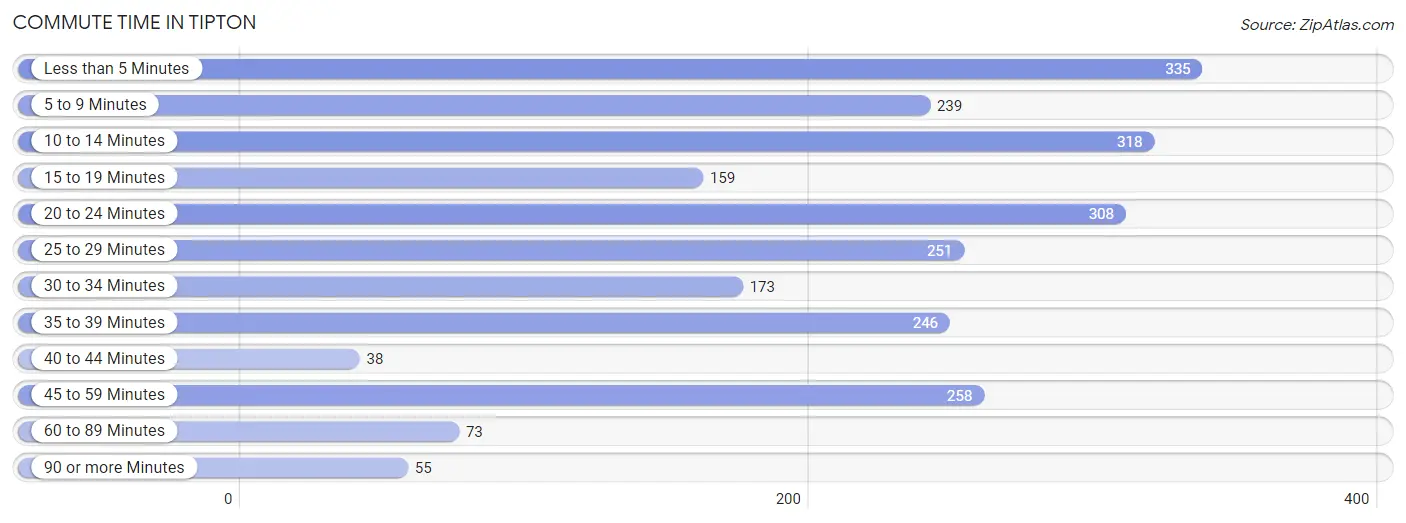
| Commute Time | # Commuters | % Commuters |
| Less than 5 Minutes | 335 | 13.7% |
| 5 to 9 Minutes | 239 | 9.7% |
| 10 to 14 Minutes | 318 | 13.0% |
| 15 to 19 Minutes | 159 | 6.5% |
| 20 to 24 Minutes | 308 | 12.6% |
| 25 to 29 Minutes | 251 | 10.2% |
| 30 to 34 Minutes | 173 | 7.0% |
| 35 to 39 Minutes | 246 | 10.0% |
| 40 to 44 Minutes | 38 | 1.5% |
| 45 to 59 Minutes | 258 | 10.5% |
| 60 to 89 Minutes | 73 | 3.0% |
| 90 or more Minutes | 55 | 2.2% |
Commute Time by Sex in Tipton
The most common commute times in Tipton are less than 5 minutes (208 commuters, 15.4%) for males and 10 to 14 minutes (160 commuters, 14.5%) for females.
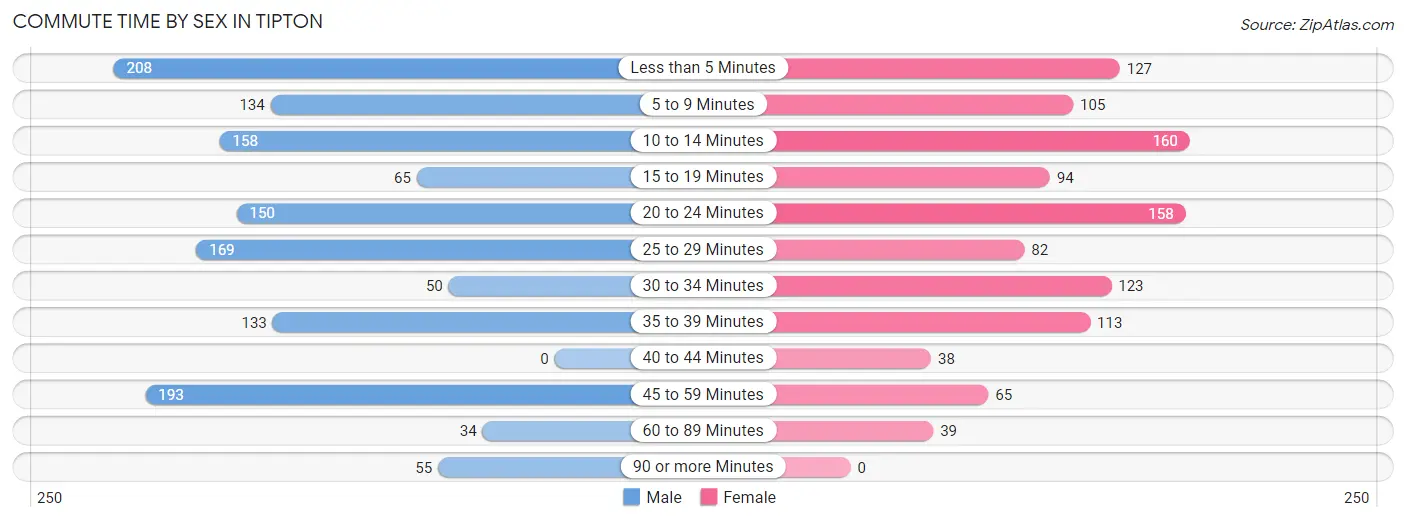
| Commute Time | Male | Female |
| Less than 5 Minutes | 208 (15.4%) | 127 (11.5%) |
| 5 to 9 Minutes | 134 (9.9%) | 105 (9.5%) |
| 10 to 14 Minutes | 158 (11.7%) | 160 (14.5%) |
| 15 to 19 Minutes | 65 (4.8%) | 94 (8.5%) |
| 20 to 24 Minutes | 150 (11.1%) | 158 (14.3%) |
| 25 to 29 Minutes | 169 (12.5%) | 82 (7.4%) |
| 30 to 34 Minutes | 50 (3.7%) | 123 (11.1%) |
| 35 to 39 Minutes | 133 (9.9%) | 113 (10.2%) |
| 40 to 44 Minutes | 0 (0.0%) | 38 (3.4%) |
| 45 to 59 Minutes | 193 (14.3%) | 65 (5.9%) |
| 60 to 89 Minutes | 34 (2.5%) | 39 (3.5%) |
| 90 or more Minutes | 55 (4.1%) | 0 (0.0%) |
Time of Departure to Work by Sex in Tipton
The most frequent times of departure to work in Tipton are 12:00 PM to 3:59 PM (330, 24.5%) for males and 12:00 PM to 3:59 PM (174, 15.8%) for females.
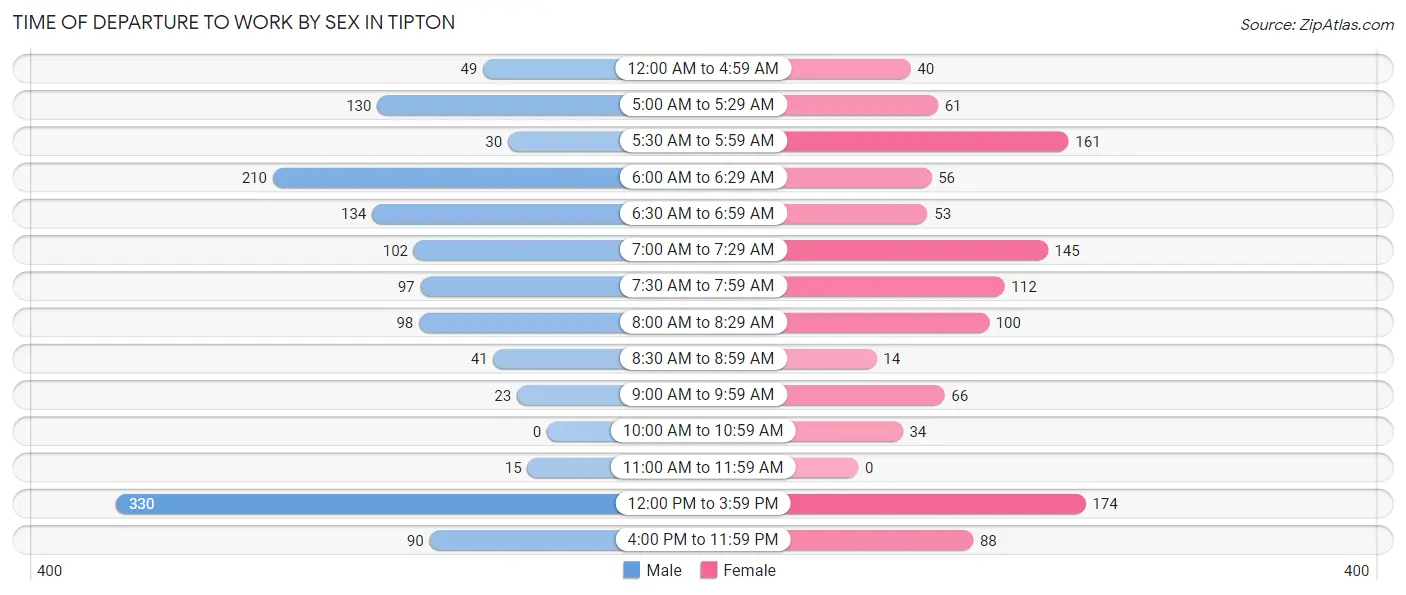
| Time of Departure | Male | Female |
| 12:00 AM to 4:59 AM | 49 (3.6%) | 40 (3.6%) |
| 5:00 AM to 5:29 AM | 130 (9.6%) | 61 (5.5%) |
| 5:30 AM to 5:59 AM | 30 (2.2%) | 161 (14.6%) |
| 6:00 AM to 6:29 AM | 210 (15.6%) | 56 (5.1%) |
| 6:30 AM to 6:59 AM | 134 (9.9%) | 53 (4.8%) |
| 7:00 AM to 7:29 AM | 102 (7.6%) | 145 (13.1%) |
| 7:30 AM to 7:59 AM | 97 (7.2%) | 112 (10.1%) |
| 8:00 AM to 8:29 AM | 98 (7.3%) | 100 (9.1%) |
| 8:30 AM to 8:59 AM | 41 (3.0%) | 14 (1.3%) |
| 9:00 AM to 9:59 AM | 23 (1.7%) | 66 (6.0%) |
| 10:00 AM to 10:59 AM | 0 (0.0%) | 34 (3.1%) |
| 11:00 AM to 11:59 AM | 15 (1.1%) | 0 (0.0%) |
| 12:00 PM to 3:59 PM | 330 (24.5%) | 174 (15.8%) |
| 4:00 PM to 11:59 PM | 90 (6.7%) | 88 (8.0%) |
| Total | 1,349 (100.0%) | 1,104 (100.0%) |
Housing Occupancy in Tipton
Occupancy by Ownership in Tipton
Of the total 2,188 dwellings in Tipton, owner-occupied units account for 1,522 (69.6%), while renter-occupied units make up 666 (30.4%).
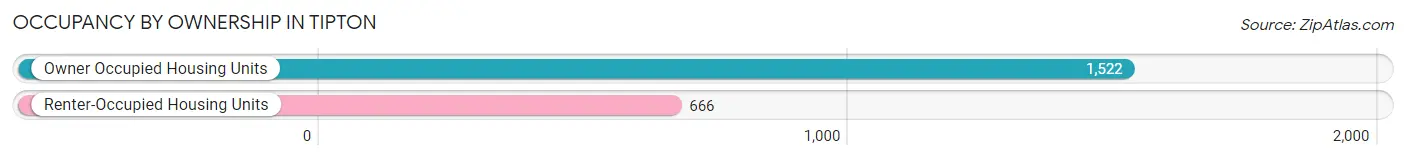
| Occupancy | # Housing Units | % Housing Units |
| Owner Occupied Housing Units | 1,522 | 69.6% |
| Renter-Occupied Housing Units | 666 | 30.4% |
| Total Occupied Housing Units | 2,188 | 100.0% |
Occupancy by Household Size in Tipton
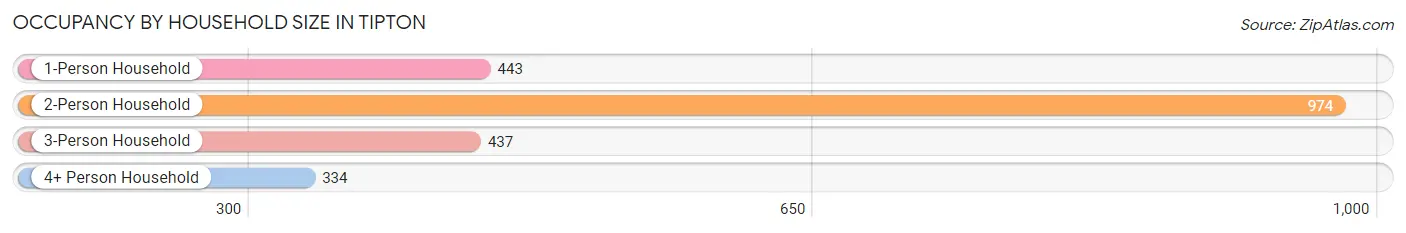
| Household Size | # Housing Units | % Housing Units |
| 1-Person Household | 443 | 20.3% |
| 2-Person Household | 974 | 44.5% |
| 3-Person Household | 437 | 20.0% |
| 4+ Person Household | 334 | 15.3% |
| Total Housing Units | 2,188 | 100.0% |
Occupancy by Ownership by Household Size in Tipton
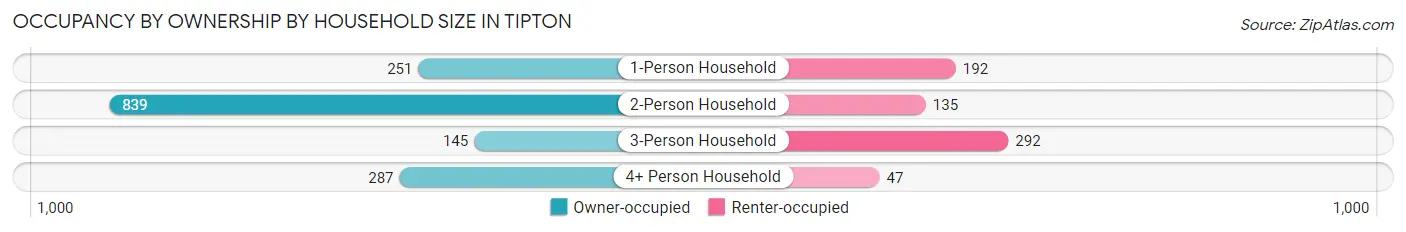
| Household Size | Owner-occupied | Renter-occupied |
| 1-Person Household | 251 (56.7%) | 192 (43.3%) |
| 2-Person Household | 839 (86.1%) | 135 (13.9%) |
| 3-Person Household | 145 (33.2%) | 292 (66.8%) |
| 4+ Person Household | 287 (85.9%) | 47 (14.1%) |
| Total Housing Units | 1,522 (69.6%) | 666 (30.4%) |
Occupancy by Educational Attainment in Tipton
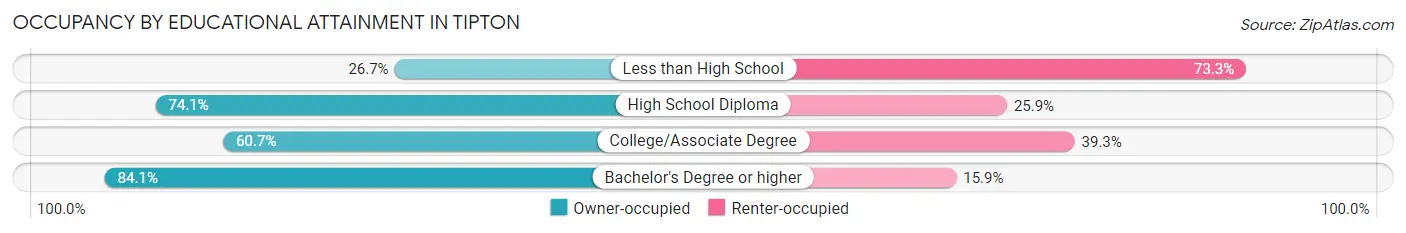
| Household Size | Owner-occupied | Renter-occupied |
| Less than High School | 32 (26.7%) | 88 (73.3%) |
| High School Diploma | 640 (74.1%) | 224 (25.9%) |
| College/Associate Degree | 421 (60.7%) | 273 (39.3%) |
| Bachelor's Degree or higher | 429 (84.1%) | 81 (15.9%) |
Occupancy by Age of Householder in Tipton
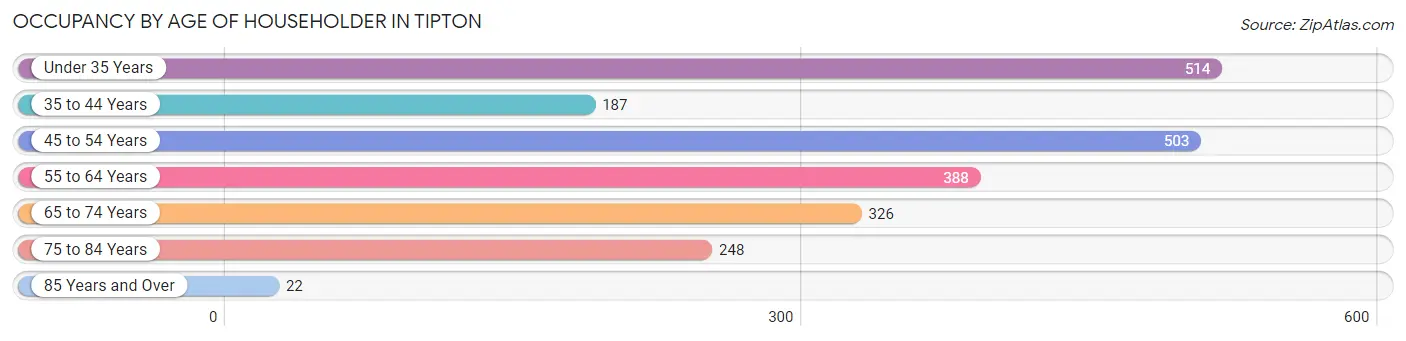
| Age Bracket | # Households | % Households |
| Under 35 Years | 514 | 23.5% |
| 35 to 44 Years | 187 | 8.6% |
| 45 to 54 Years | 503 | 23.0% |
| 55 to 64 Years | 388 | 17.7% |
| 65 to 74 Years | 326 | 14.9% |
| 75 to 84 Years | 248 | 11.3% |
| 85 Years and Over | 22 | 1.0% |
| Total | 2,188 | 100.0% |
Housing Finances in Tipton
Median Income by Occupancy in Tipton
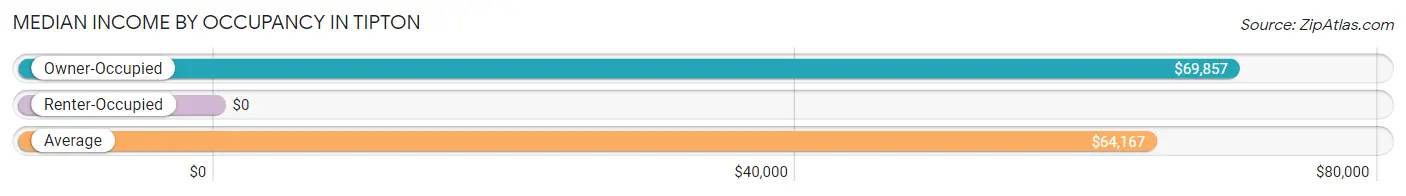
| Occupancy Type | # Households | Median Income |
| Owner-Occupied | 1,522 (69.6%) | $69,857 |
| Renter-Occupied | 666 (30.4%) | $0 |
| Average | 2,188 (100.0%) | $64,167 |
Occupancy by Householder Income Bracket in Tipton
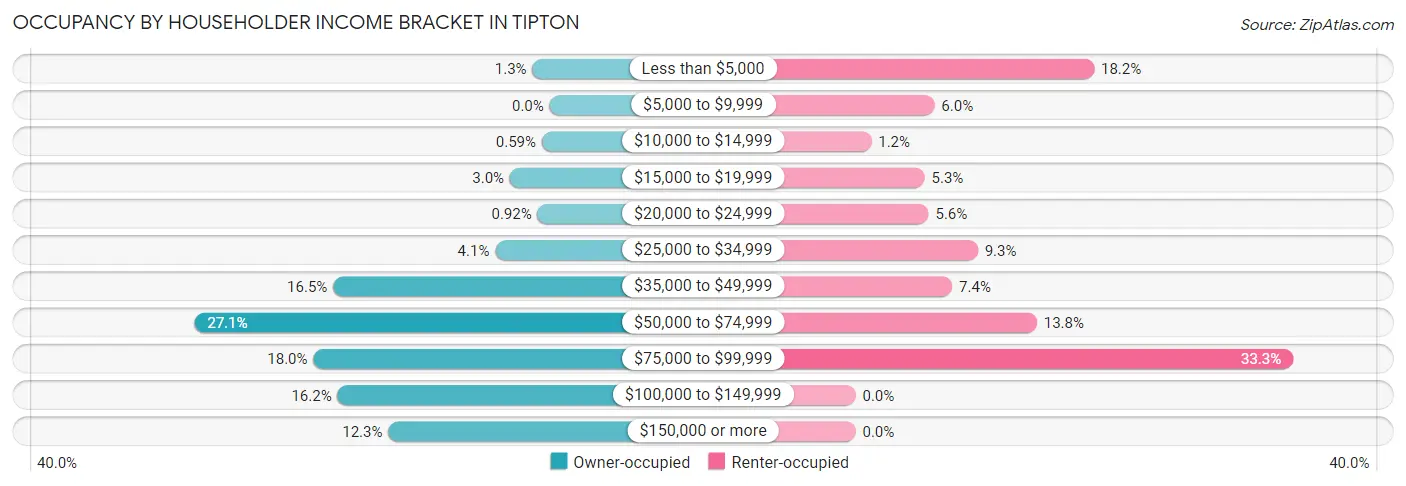
| Income Bracket | Owner-occupied | Renter-occupied |
| Less than $5,000 | 20 (1.3%) | 121 (18.2%) |
| $5,000 to $9,999 | 0 (0.0%) | 40 (6.0%) |
| $10,000 to $14,999 | 9 (0.6%) | 8 (1.2%) |
| $15,000 to $19,999 | 46 (3.0%) | 35 (5.3%) |
| $20,000 to $24,999 | 14 (0.9%) | 37 (5.6%) |
| $25,000 to $34,999 | 63 (4.1%) | 62 (9.3%) |
| $35,000 to $49,999 | 251 (16.5%) | 49 (7.4%) |
| $50,000 to $74,999 | 412 (27.1%) | 92 (13.8%) |
| $75,000 to $99,999 | 274 (18.0%) | 222 (33.3%) |
| $100,000 to $149,999 | 246 (16.2%) | 0 (0.0%) |
| $150,000 or more | 187 (12.3%) | 0 (0.0%) |
| Total | 1,522 (100.0%) | 666 (100.0%) |
Monthly Housing Cost Tiers in Tipton
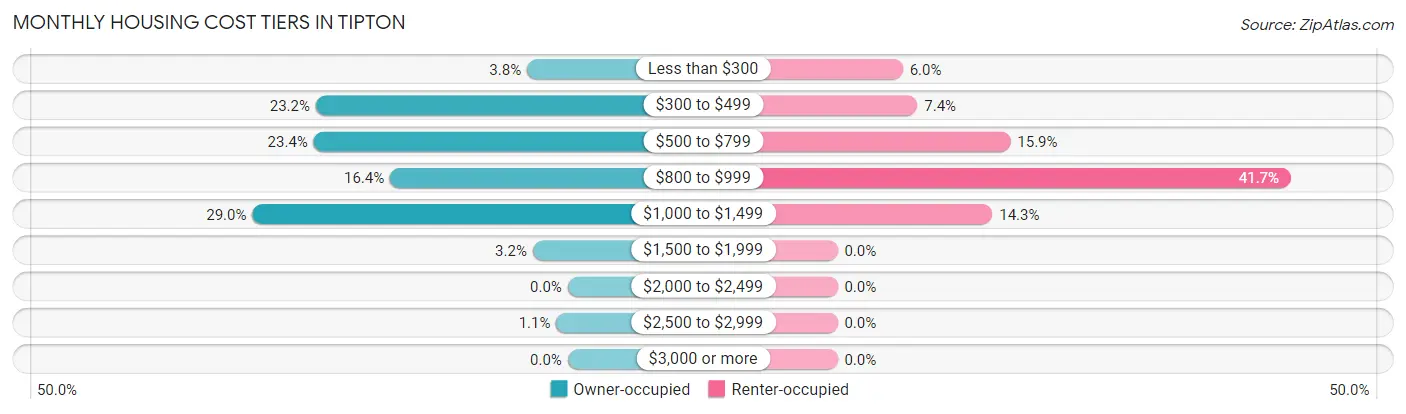
| Monthly Cost | Owner-occupied | Renter-occupied |
| Less than $300 | 57 (3.7%) | 40 (6.0%) |
| $300 to $499 | 353 (23.2%) | 49 (7.4%) |
| $500 to $799 | 356 (23.4%) | 106 (15.9%) |
| $800 to $999 | 249 (16.4%) | 278 (41.7%) |
| $1,000 to $1,499 | 442 (29.0%) | 95 (14.3%) |
| $1,500 to $1,999 | 49 (3.2%) | 0 (0.0%) |
| $2,000 to $2,499 | 0 (0.0%) | 0 (0.0%) |
| $2,500 to $2,999 | 16 (1.1%) | 0 (0.0%) |
| $3,000 or more | 0 (0.0%) | 0 (0.0%) |
| Total | 1,522 (100.0%) | 666 (100.0%) |
Physical Housing Characteristics in Tipton
Housing Structures in Tipton
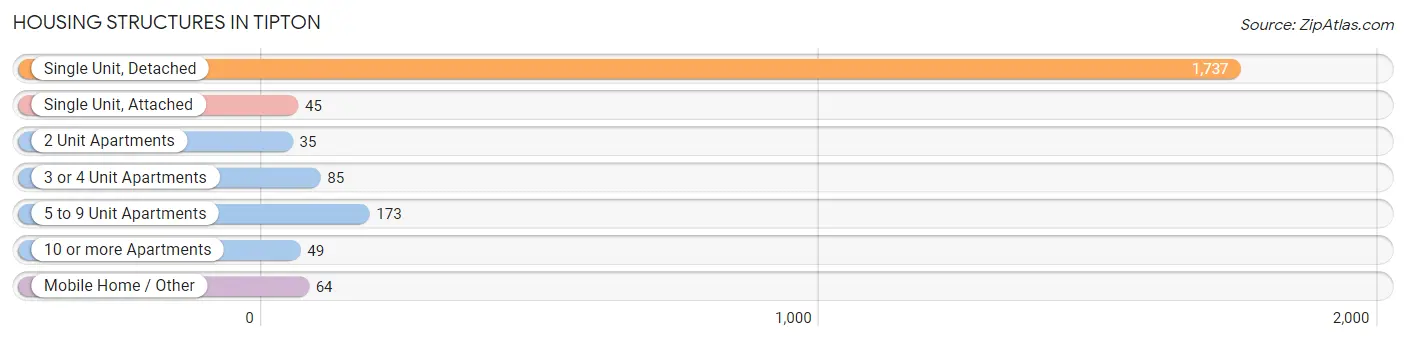
| Structure Type | # Housing Units | % Housing Units |
| Single Unit, Detached | 1,737 | 79.4% |
| Single Unit, Attached | 45 | 2.1% |
| 2 Unit Apartments | 35 | 1.6% |
| 3 or 4 Unit Apartments | 85 | 3.9% |
| 5 to 9 Unit Apartments | 173 | 7.9% |
| 10 or more Apartments | 49 | 2.2% |
| Mobile Home / Other | 64 | 2.9% |
| Total | 2,188 | 100.0% |
Housing Structures by Occupancy in Tipton
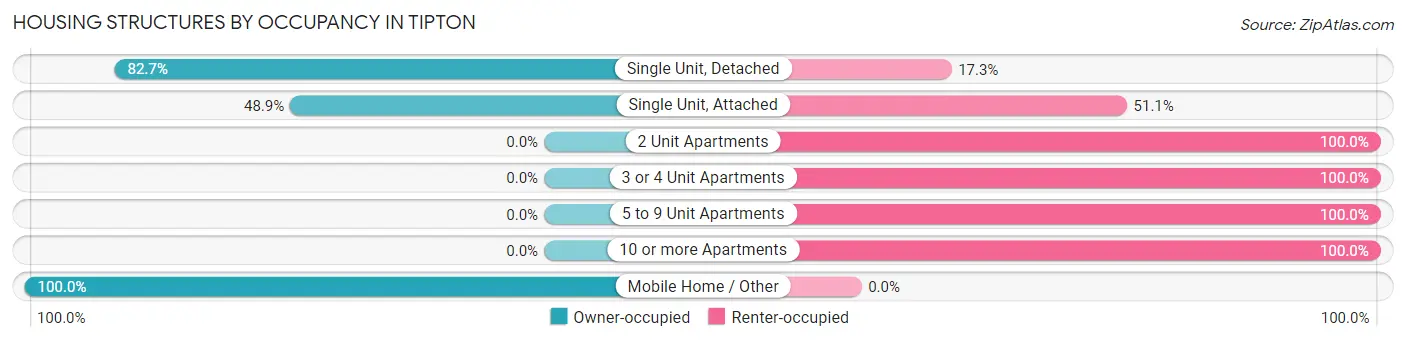
| Structure Type | Owner-occupied | Renter-occupied |
| Single Unit, Detached | 1,436 (82.7%) | 301 (17.3%) |
| Single Unit, Attached | 22 (48.9%) | 23 (51.1%) |
| 2 Unit Apartments | 0 (0.0%) | 35 (100.0%) |
| 3 or 4 Unit Apartments | 0 (0.0%) | 85 (100.0%) |
| 5 to 9 Unit Apartments | 0 (0.0%) | 173 (100.0%) |
| 10 or more Apartments | 0 (0.0%) | 49 (100.0%) |
| Mobile Home / Other | 64 (100.0%) | 0 (0.0%) |
| Total | 1,522 (69.6%) | 666 (30.4%) |
Housing Structures by Number of Rooms in Tipton
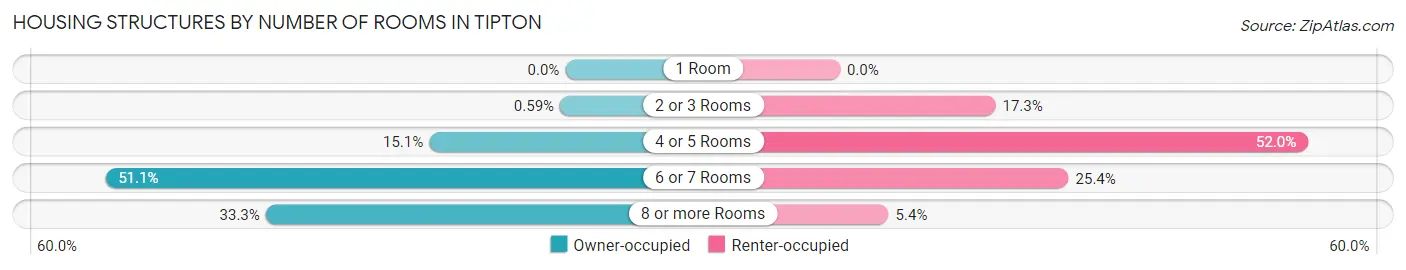
| Number of Rooms | Owner-occupied | Renter-occupied |
| 1 Room | 0 (0.0%) | 0 (0.0%) |
| 2 or 3 Rooms | 9 (0.6%) | 115 (17.3%) |
| 4 or 5 Rooms | 230 (15.1%) | 346 (51.9%) |
| 6 or 7 Rooms | 777 (51.0%) | 169 (25.4%) |
| 8 or more Rooms | 506 (33.3%) | 36 (5.4%) |
| Total | 1,522 (100.0%) | 666 (100.0%) |
Housing Structure by Heating Type in Tipton
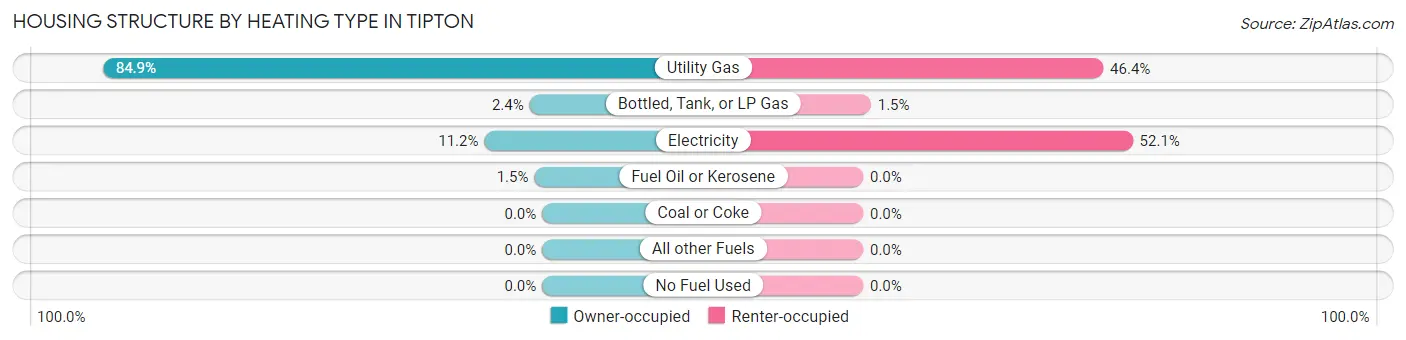
| Heating Type | Owner-occupied | Renter-occupied |
| Utility Gas | 1,292 (84.9%) | 309 (46.4%) |
| Bottled, Tank, or LP Gas | 37 (2.4%) | 10 (1.5%) |
| Electricity | 170 (11.2%) | 347 (52.1%) |
| Fuel Oil or Kerosene | 23 (1.5%) | 0 (0.0%) |
| Coal or Coke | 0 (0.0%) | 0 (0.0%) |
| All other Fuels | 0 (0.0%) | 0 (0.0%) |
| No Fuel Used | 0 (0.0%) | 0 (0.0%) |
| Total | 1,522 (100.0%) | 666 (100.0%) |
Household Vehicle Usage in Tipton
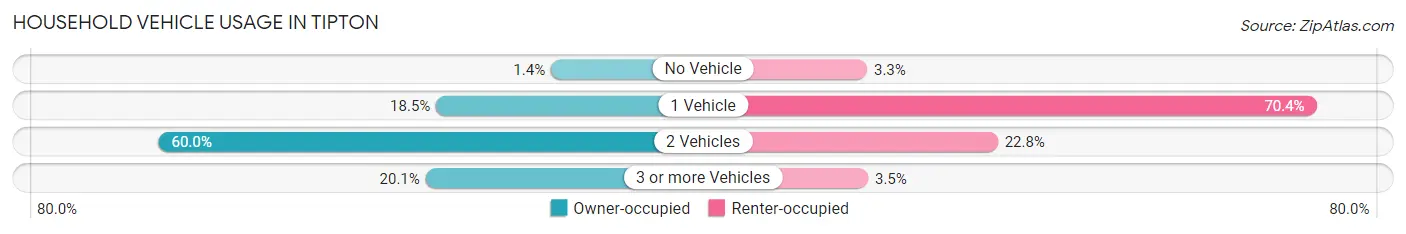
| Vehicles per Household | Owner-occupied | Renter-occupied |
| No Vehicle | 21 (1.4%) | 22 (3.3%) |
| 1 Vehicle | 282 (18.5%) | 469 (70.4%) |
| 2 Vehicles | 913 (60.0%) | 152 (22.8%) |
| 3 or more Vehicles | 306 (20.1%) | 23 (3.5%) |
| Total | 1,522 (100.0%) | 666 (100.0%) |
Real Estate & Mortgages in Tipton
Real Estate and Mortgage Overview in Tipton
| Characteristic | Without Mortgage | With Mortgage |
| Housing Units | 582 | 940 |
| Median Property Value | $158,800 | $133,700 |
| Median Household Income | $56,170 | $169 |
| Monthly Housing Costs | $369 | $0 |
| Real Estate Taxes | $1,218 | $27 |
Property Value by Mortgage Status in Tipton
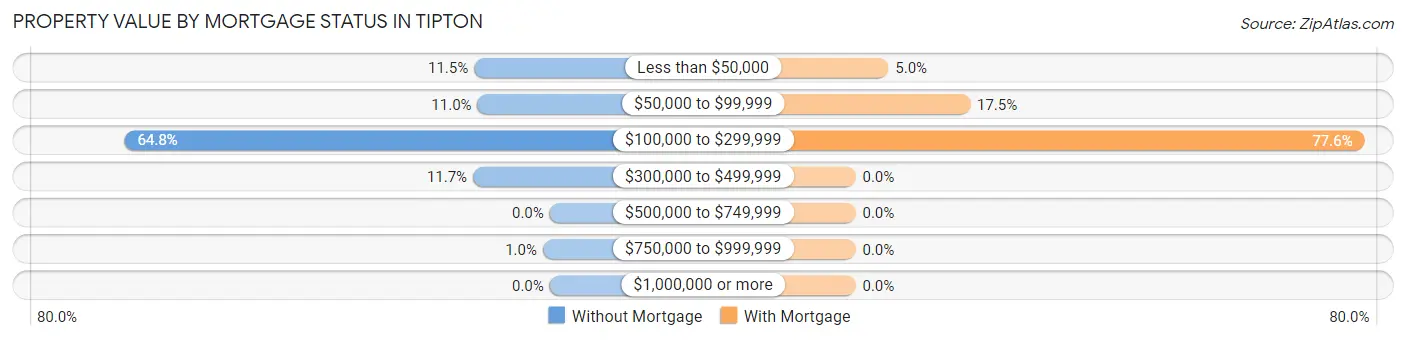
| Property Value | Without Mortgage | With Mortgage |
| Less than $50,000 | 67 (11.5%) | 47 (5.0%) |
| $50,000 to $99,999 | 64 (11.0%) | 164 (17.4%) |
| $100,000 to $299,999 | 377 (64.8%) | 729 (77.5%) |
| $300,000 to $499,999 | 68 (11.7%) | 0 (0.0%) |
| $500,000 to $749,999 | 0 (0.0%) | 0 (0.0%) |
| $750,000 to $999,999 | 6 (1.0%) | 0 (0.0%) |
| $1,000,000 or more | 0 (0.0%) | 0 (0.0%) |
| Total | 582 (100.0%) | 940 (100.0%) |
Household Income by Mortgage Status in Tipton
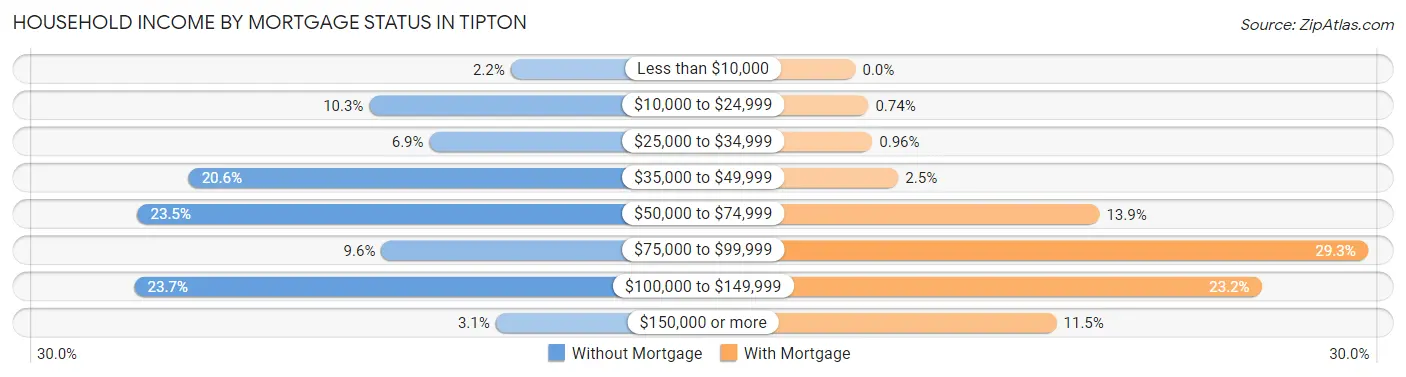
| Household Income | Without Mortgage | With Mortgage |
| Less than $10,000 | 13 (2.2%) | 0 (0.0%) |
| $10,000 to $24,999 | 60 (10.3%) | 7 (0.7%) |
| $25,000 to $34,999 | 40 (6.9%) | 9 (1.0%) |
| $35,000 to $49,999 | 120 (20.6%) | 23 (2.5%) |
| $50,000 to $74,999 | 137 (23.5%) | 131 (13.9%) |
| $75,000 to $99,999 | 56 (9.6%) | 275 (29.3%) |
| $100,000 to $149,999 | 138 (23.7%) | 218 (23.2%) |
| $150,000 or more | 18 (3.1%) | 108 (11.5%) |
| Total | 582 (100.0%) | 940 (100.0%) |
Property Value to Household Income Ratio in Tipton
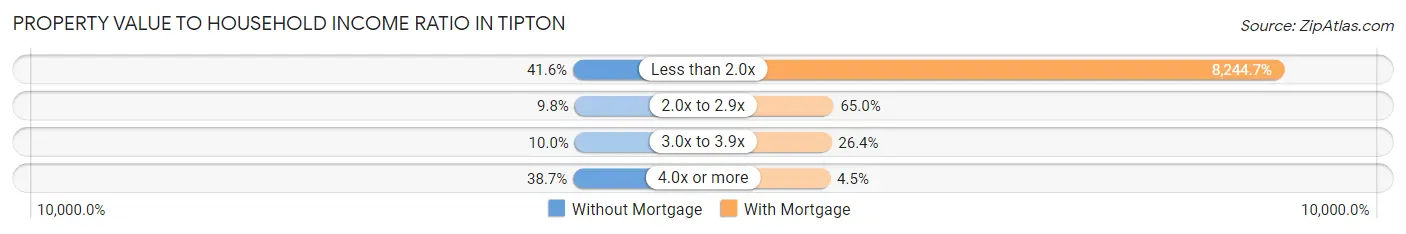
| Value-to-Income Ratio | Without Mortgage | With Mortgage |
| Less than 2.0x | 242 (41.6%) | 77,500 (8,244.7%) |
| 2.0x to 2.9x | 57 (9.8%) | 611 (65.0%) |
| 3.0x to 3.9x | 58 (10.0%) | 248 (26.4%) |
| 4.0x or more | 225 (38.7%) | 42 (4.5%) |
| Total | 582 (100.0%) | 940 (100.0%) |
Real Estate Taxes by Mortgage Status in Tipton
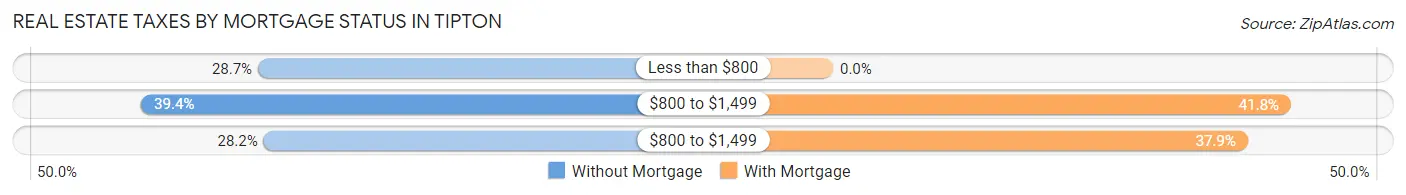
| Property Taxes | Without Mortgage | With Mortgage |
| Less than $800 | 167 (28.7%) | 0 (0.0%) |
| $800 to $1,499 | 229 (39.4%) | 393 (41.8%) |
| $800 to $1,499 | 164 (28.2%) | 356 (37.9%) |
| Total | 582 (100.0%) | 940 (100.0%) |
Health & Disability in Tipton
Health Insurance Coverage by Age in Tipton
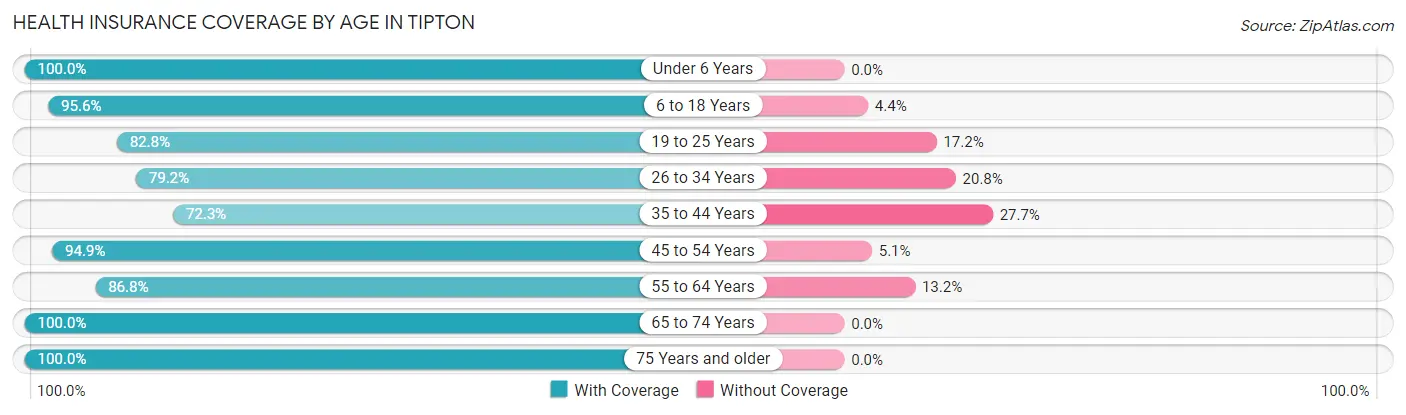
| Age Bracket | With Coverage | Without Coverage |
| Under 6 Years | 362 (100.0%) | 0 (0.0%) |
| 6 to 18 Years | 673 (95.6%) | 31 (4.4%) |
| 19 to 25 Years | 265 (82.8%) | 55 (17.2%) |
| 26 to 34 Years | 645 (79.2%) | 169 (20.8%) |
| 35 to 44 Years | 332 (72.3%) | 127 (27.7%) |
| 45 to 54 Years | 758 (94.9%) | 41 (5.1%) |
| 55 to 64 Years | 573 (86.8%) | 87 (13.2%) |
| 65 to 74 Years | 444 (100.0%) | 0 (0.0%) |
| 75 Years and older | 478 (100.0%) | 0 (0.0%) |
| Total | 4,530 (89.9%) | 510 (10.1%) |
Health Insurance Coverage by Citizenship Status in Tipton
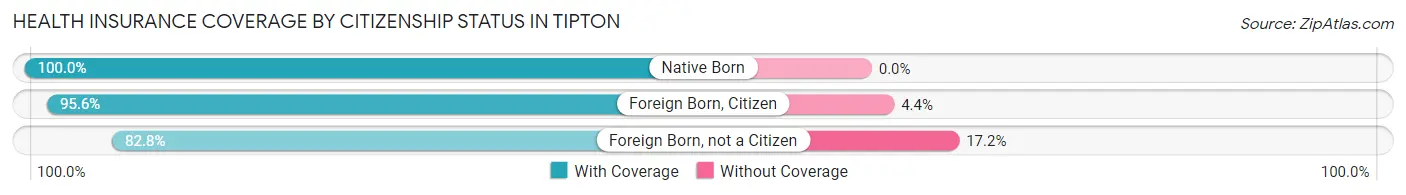
| Citizenship Status | With Coverage | Without Coverage |
| Native Born | 362 (100.0%) | 0 (0.0%) |
| Foreign Born, Citizen | 673 (95.6%) | 31 (4.4%) |
| Foreign Born, not a Citizen | 265 (82.8%) | 55 (17.2%) |
Health Insurance Coverage by Household Income in Tipton
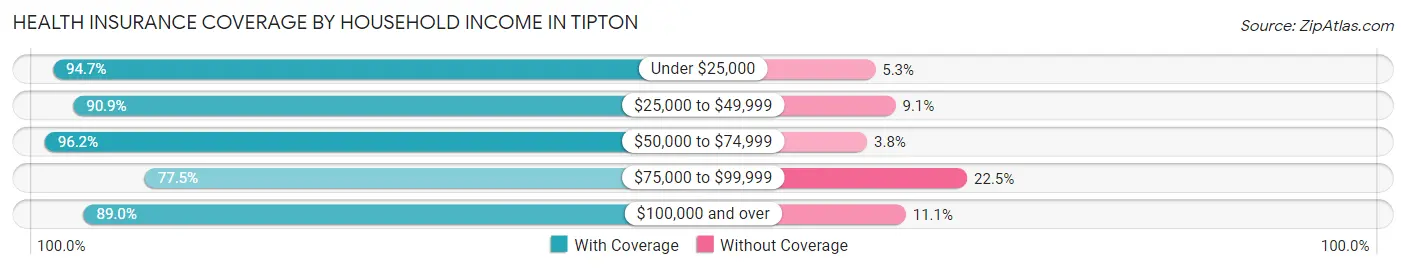
| Household Income | With Coverage | Without Coverage |
| Under $25,000 | 496 (94.7%) | 28 (5.3%) |
| $25,000 to $49,999 | 786 (90.9%) | 79 (9.1%) |
| $50,000 to $74,999 | 1,520 (96.2%) | 60 (3.8%) |
| $75,000 to $99,999 | 770 (77.5%) | 224 (22.5%) |
| $100,000 and over | 958 (88.9%) | 119 (11.1%) |
Public vs Private Health Insurance Coverage by Age in Tipton
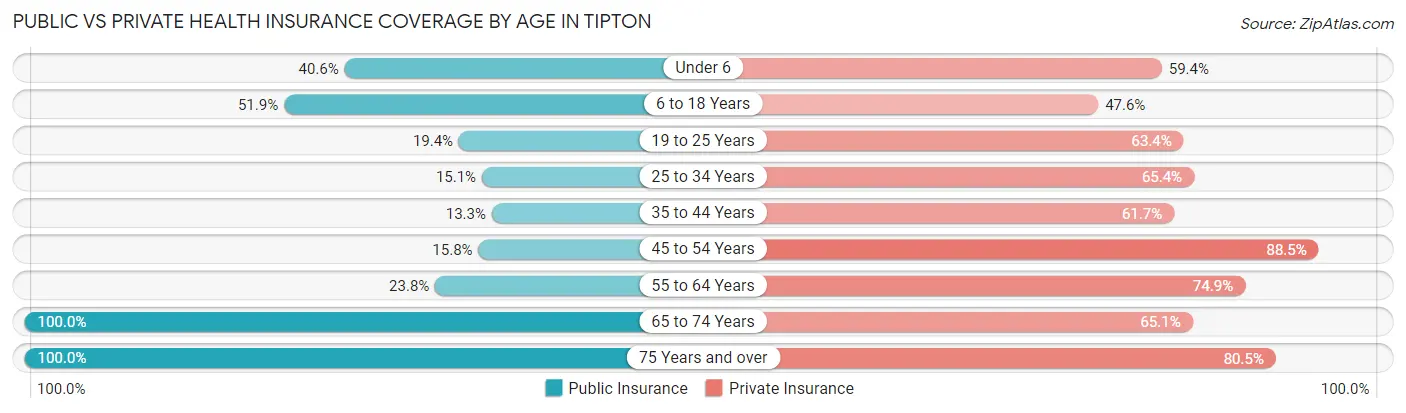
| Age Bracket | Public Insurance | Private Insurance |
| Under 6 | 147 (40.6%) | 215 (59.4%) |
| 6 to 18 Years | 365 (51.8%) | 335 (47.6%) |
| 19 to 25 Years | 62 (19.4%) | 203 (63.4%) |
| 25 to 34 Years | 123 (15.1%) | 532 (65.4%) |
| 35 to 44 Years | 61 (13.3%) | 283 (61.7%) |
| 45 to 54 Years | 126 (15.8%) | 707 (88.5%) |
| 55 to 64 Years | 157 (23.8%) | 494 (74.9%) |
| 65 to 74 Years | 444 (100.0%) | 289 (65.1%) |
| 75 Years and over | 478 (100.0%) | 385 (80.5%) |
| Total | 1,963 (39.0%) | 3,443 (68.3%) |
Disability Status by Sex by Age in Tipton
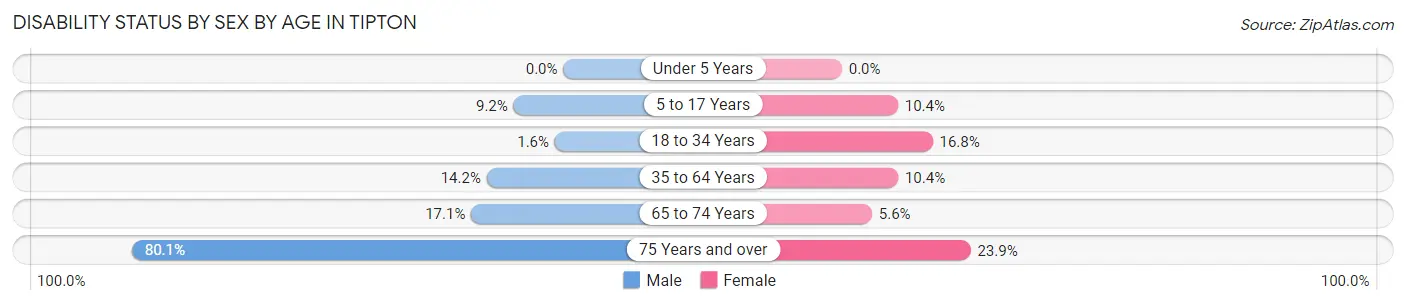
| Age Bracket | Male | Female |
| Under 5 Years | 0 (0.0%) | 0 (0.0%) |
| 5 to 17 Years | 41 (9.2%) | 26 (10.4%) |
| 18 to 34 Years | 11 (1.6%) | 80 (16.8%) |
| 35 to 64 Years | 131 (14.2%) | 104 (10.4%) |
| 65 to 74 Years | 33 (17.1%) | 14 (5.6%) |
| 75 Years and over | 185 (80.1%) | 59 (23.9%) |
Disability Class by Sex by Age in Tipton
Disability Class: Hearing Difficulty
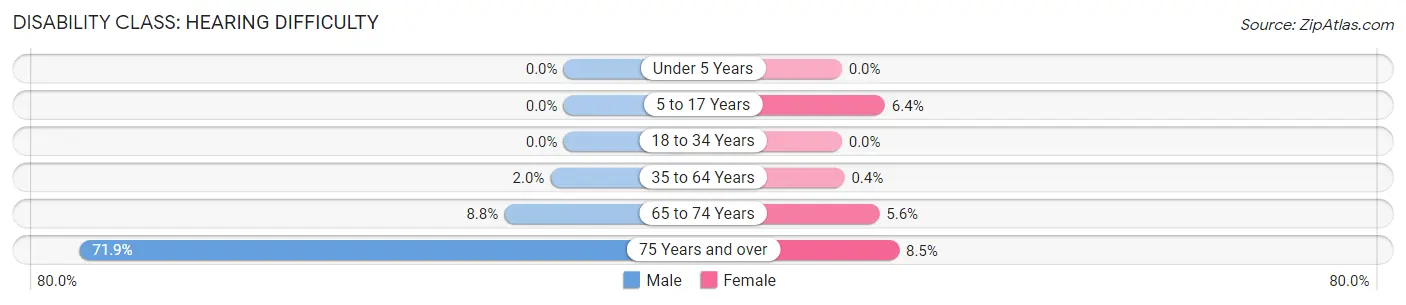
| Age Bracket | Male | Female |
| Under 5 Years | 0 (0.0%) | 0 (0.0%) |
| 5 to 17 Years | 0 (0.0%) | 16 (6.4%) |
| 18 to 34 Years | 0 (0.0%) | 0 (0.0%) |
| 35 to 64 Years | 18 (1.9%) | 4 (0.4%) |
| 65 to 74 Years | 17 (8.8%) | 14 (5.6%) |
| 75 Years and over | 166 (71.9%) | 21 (8.5%) |
Disability Class: Vision Difficulty
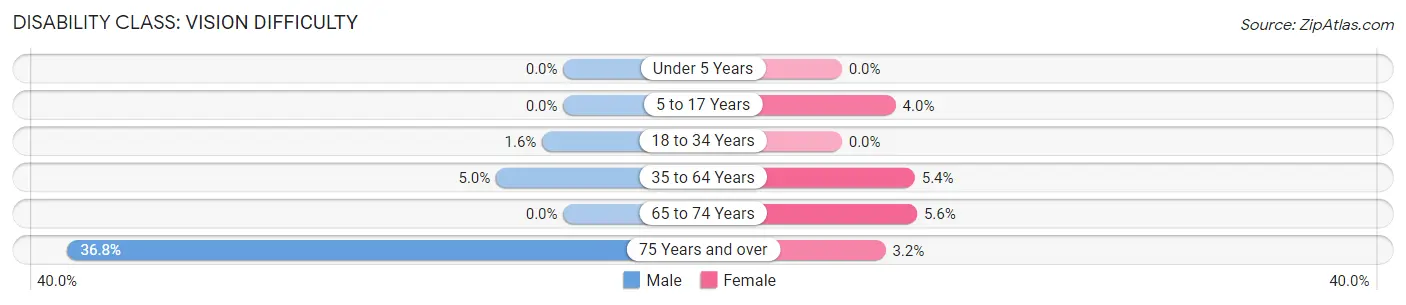
| Age Bracket | Male | Female |
| Under 5 Years | 0 (0.0%) | 0 (0.0%) |
| 5 to 17 Years | 0 (0.0%) | 10 (4.0%) |
| 18 to 34 Years | 11 (1.6%) | 0 (0.0%) |
| 35 to 64 Years | 46 (5.0%) | 54 (5.4%) |
| 65 to 74 Years | 0 (0.0%) | 14 (5.6%) |
| 75 Years and over | 85 (36.8%) | 8 (3.2%) |
Disability Class: Cognitive Difficulty
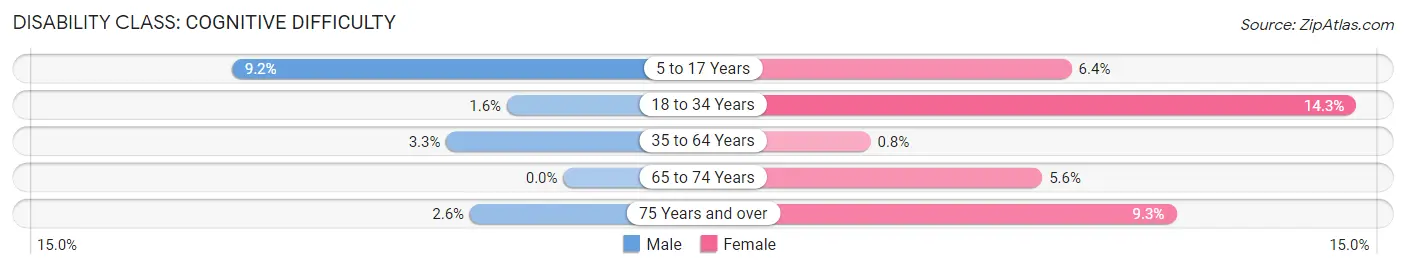
| Age Bracket | Male | Female |
| 5 to 17 Years | 41 (9.2%) | 16 (6.4%) |
| 18 to 34 Years | 11 (1.6%) | 68 (14.3%) |
| 35 to 64 Years | 30 (3.3%) | 8 (0.8%) |
| 65 to 74 Years | 0 (0.0%) | 14 (5.6%) |
| 75 Years and over | 6 (2.6%) | 23 (9.3%) |
Disability Class: Ambulatory Difficulty
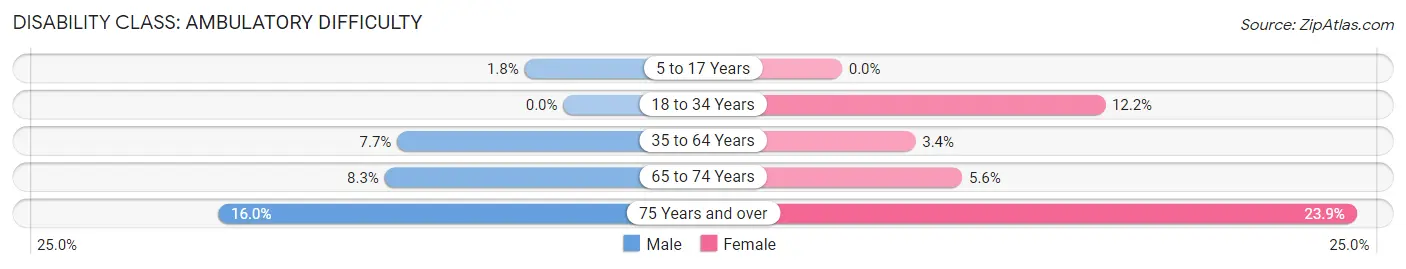
| Age Bracket | Male | Female |
| 5 to 17 Years | 8 (1.8%) | 0 (0.0%) |
| 18 to 34 Years | 0 (0.0%) | 58 (12.2%) |
| 35 to 64 Years | 71 (7.7%) | 34 (3.4%) |
| 65 to 74 Years | 16 (8.3%) | 14 (5.6%) |
| 75 Years and over | 37 (16.0%) | 59 (23.9%) |
Disability Class: Self-Care Difficulty
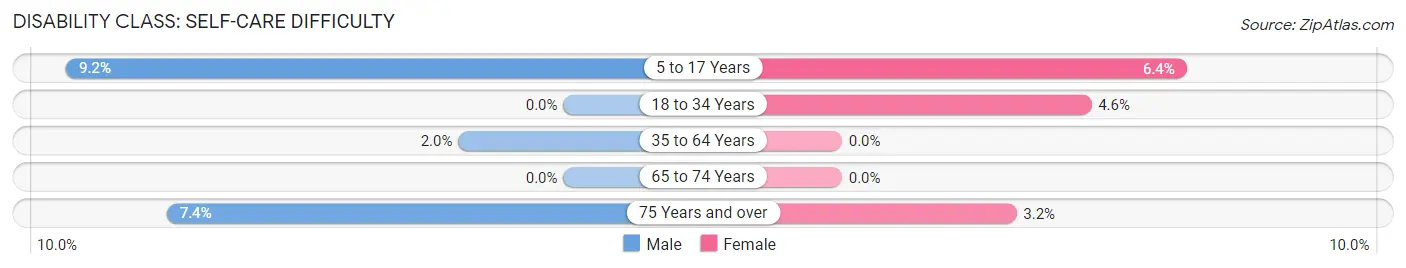
| Age Bracket | Male | Female |
| 5 to 17 Years | 41 (9.2%) | 16 (6.4%) |
| 18 to 34 Years | 0 (0.0%) | 22 (4.6%) |
| 35 to 64 Years | 18 (1.9%) | 0 (0.0%) |
| 65 to 74 Years | 0 (0.0%) | 0 (0.0%) |
| 75 Years and over | 17 (7.4%) | 8 (3.2%) |
Technology Access in Tipton
Computing Device Access in Tipton
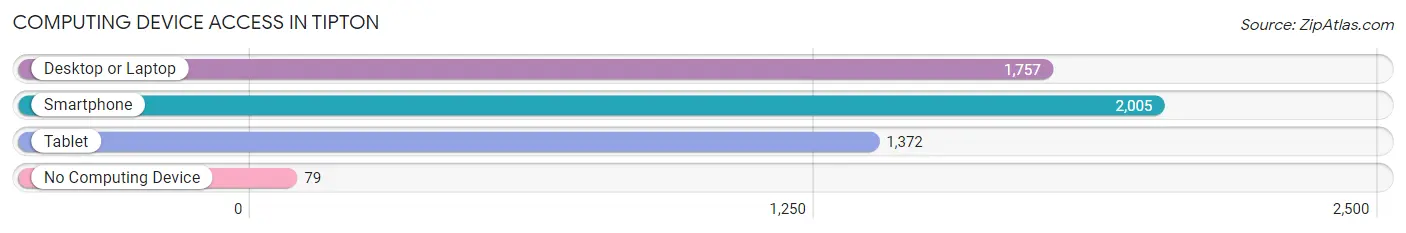
| Device Type | # Households | % Households |
| Desktop or Laptop | 1,757 | 80.3% |
| Smartphone | 2,005 | 91.6% |
| Tablet | 1,372 | 62.7% |
| No Computing Device | 79 | 3.6% |
| Total | 2,188 | 100.0% |
Internet Access in Tipton
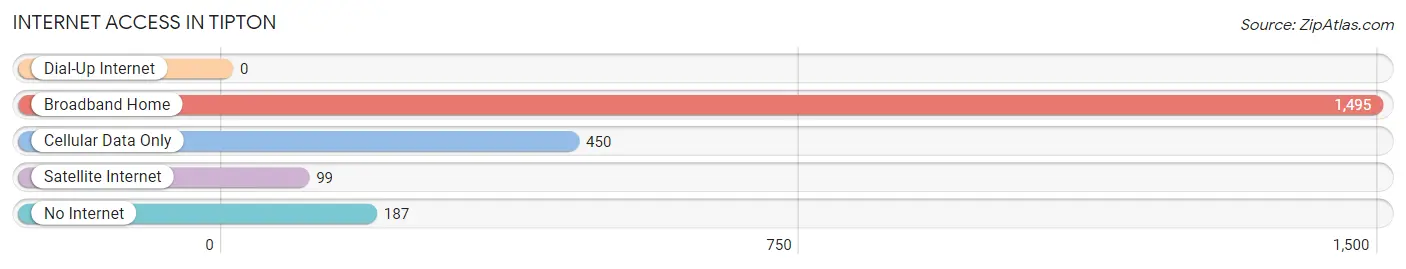
| Internet Type | # Households | % Households |
| Dial-Up Internet | 0 | 0.0% |
| Broadband Home | 1,495 | 68.3% |
| Cellular Data Only | 450 | 20.6% |
| Satellite Internet | 99 | 4.5% |
| No Internet | 187 | 8.6% |
| Total | 2,188 | 100.0% |
Tipton Summary
Tipton, Indiana is a small city located in the central part of the state, about 40 miles north of Indianapolis. It is the county seat of Tipton County and has a population of about 5,000 people. The city was founded in 1844 and was named after General John Tipton, a hero of the War of 1812.
Geography
Tipton is located in the central part of Indiana, about 40 miles north of Indianapolis. It is situated in the Tipton Plain, a flat area of land that is part of the Central Till Plain. The city is bordered by the Wildcat Creek to the east and the Tippecanoe River to the west. The city is located in a humid continental climate zone, with hot summers and cold winters.
Economy
Tipton's economy is largely based on agriculture and manufacturing. The city is home to several large agricultural companies, including Cargill, ADM, and Dow AgroSciences. The city also has a number of manufacturing companies, including Tipton Manufacturing, which produces automotive parts, and Tipton Tool and Die, which produces industrial tools.
Demographics
As of the 2010 census, the population of Tipton was 5,106. The racial makeup of the city was 95.3% White, 0.7% African American, 0.3% Native American, 0.4% Asian, 0.1% Pacific Islander, 1.2% from other races, and 2.1% from two or more races. Hispanic or Latino of any race were 3.2% of the population.
The median household income in Tipton was $41,945, and the median family income was $50,945. The per capita income for the city was $20,845. About 11.2% of families and 14.2% of the population were below the poverty line, including 19.2% of those under age 18 and 8.2% of those age 65 or over.
Education
Tipton is served by the Tipton Community School Corporation, which consists of three elementary schools, one middle school, and one high school. The city is also home to Ivy Tech Community College, which offers a variety of associate degree and certificate programs.
Conclusion
Tipton, Indiana is a small city located in the central part of the state, about 40 miles north of Indianapolis. It is the county seat of Tipton County and has a population of about 5,000 people. The city's economy is largely based on agriculture and manufacturing, and it is served by the Tipton Community School Corporation and Ivy Tech Community College. The city has a diverse population and a median household income of $41,945.
Common Questions
What is Per Capita Income in Tipton?
Per Capita income in Tipton is $30,457.
What is the Median Family Income in Tipton?
Median Family Income in Tipton is $69,109.
What is the Median Household income in Tipton?
Median Household Income in Tipton is $64,167.
What is Income or Wage Gap in Tipton?
Income or Wage Gap in Tipton is 35.8%.
Women in Tipton earn 64.2 cents for every dollar earned by a man.
What is Inequality or Gini Index in Tipton?
Inequality or Gini Index in Tipton is 0.37.
What is the Total Population of Tipton?
Total Population of Tipton is 5,255.
What is the Total Male Population of Tipton?
Total Male Population of Tipton is 2,714.
What is the Total Female Population of Tipton?
Total Female Population of Tipton is 2,541.
What is the Ratio of Males per 100 Females in Tipton?
There are 106.81 Males per 100 Females in Tipton.
What is the Ratio of Females per 100 Males in Tipton?
There are 93.63 Females per 100 Males in Tipton.
What is the Median Population Age in Tipton?
Median Population Age in Tipton is 41.8 Years.
What is the Average Family Size in Tipton
Average Family Size in Tipton is 2.6 People.
What is the Average Household Size in Tipton
Average Household Size in Tipton is 2.3 People.
How Large is the Labor Force in Tipton?
There are 2,696 People in the Labor Forcein in Tipton.
What is the Percentage of People in the Labor Force in Tipton?
61.1% of People are in the Labor Force in Tipton.
What is the Unemployment Rate in Tipton?
Unemployment Rate in Tipton is 5.1%.