Darby, MT Map & Demographics
Darby Map
Darby Overview
$31,650
PER CAPITA INCOME
$46,875
AVG FAMILY INCOME
$39,583
AVG HOUSEHOLD INCOME
27.3%
WAGE / INCOME GAP [ % ]
72.7¢/ $1
WAGE / INCOME GAP [ $ ]
0.55
INEQUALITY / GINI INDEX
610
TOTAL POPULATION
365
MALE POPULATION
245
FEMALE POPULATION
148.98
MALES / 100 FEMALES
67.12
FEMALES / 100 MALES
52.8
MEDIAN AGE
2.3
AVG FAMILY SIZE
1.8
AVG HOUSEHOLD SIZE
286
LABOR FORCE [ PEOPLE ]
52.1%
PERCENT IN LABOR FORCE
2.8%
UNEMPLOYMENT RATE
Darby Zip Codes
Darby Area Codes
Income in Darby
Income Overview in Darby
Per Capita Income in Darby is $31,650, while median incomes of families and households are $46,875 and $39,583 respectively.
| Characteristic | Number | Measure |
| Per Capita Income | 610 | $31,650 |
| Median Family Income | 164 | $46,875 |
| Mean Family Income | 164 | $90,289 |
| Median Household Income | 333 | $39,583 |
| Mean Household Income | 333 | $57,234 |
| Income Deficit | 164 | $0 |
| Wage / Income Gap (%) | 610 | 27.27% |
| Wage / Income Gap ($) | 610 | 72.73¢ per $1 |
| Gini / Inequality Index | 610 | 0.55 |
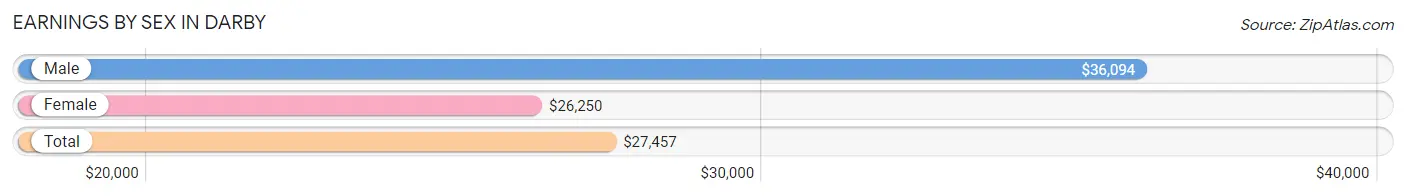
Earnings by Sex in Darby
Average Earnings in Darby are $27,457, $36,094 for men and $26,250 for women, a difference of 27.3%.
| Sex | Number | Average Earnings |
| Male | 149 (51.7%) | $36,094 |
| Female | 139 (48.3%) | $26,250 |
| Total | 288 (100.0%) | $27,457 |
Earnings by Sex by Income Bracket in Darby
The most common earnings brackets in Darby are $25,000 to $29,999 for men (21 | 14.1%) and $25,000 to $29,999 for women (52 | 37.4%).
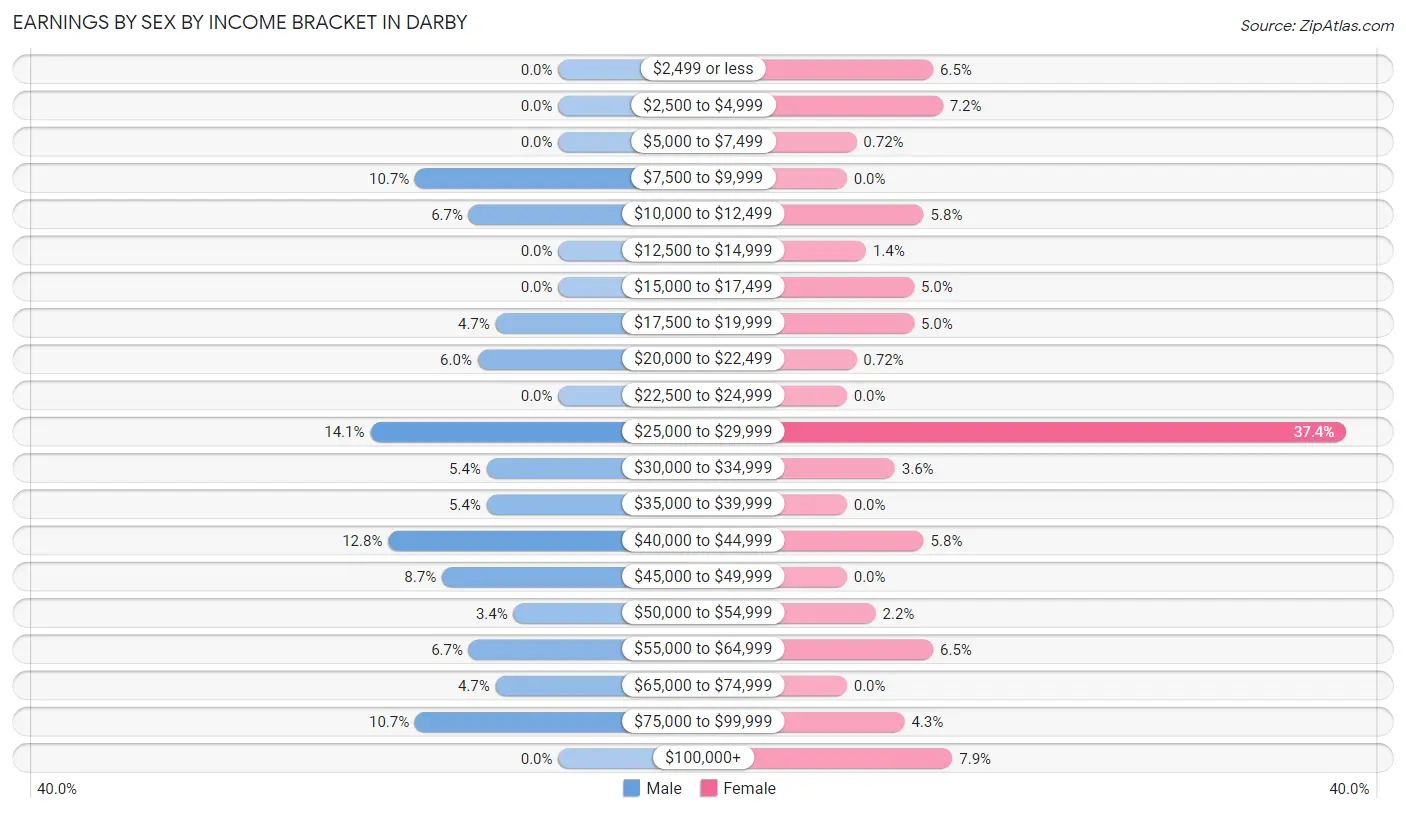
| Income | Male | Female |
| $2,499 or less | 0 (0.0%) | 9 (6.5%) |
| $2,500 to $4,999 | 0 (0.0%) | 10 (7.2%) |
| $5,000 to $7,499 | 0 (0.0%) | 1 (0.7%) |
| $7,500 to $9,999 | 16 (10.7%) | 0 (0.0%) |
| $10,000 to $12,499 | 10 (6.7%) | 8 (5.8%) |
| $12,500 to $14,999 | 0 (0.0%) | 2 (1.4%) |
| $15,000 to $17,499 | 0 (0.0%) | 7 (5.0%) |
| $17,500 to $19,999 | 7 (4.7%) | 7 (5.0%) |
| $20,000 to $22,499 | 9 (6.0%) | 1 (0.7%) |
| $22,500 to $24,999 | 0 (0.0%) | 0 (0.0%) |
| $25,000 to $29,999 | 21 (14.1%) | 52 (37.4%) |
| $30,000 to $34,999 | 8 (5.4%) | 5 (3.6%) |
| $35,000 to $39,999 | 8 (5.4%) | 0 (0.0%) |
| $40,000 to $44,999 | 19 (12.8%) | 8 (5.8%) |
| $45,000 to $49,999 | 13 (8.7%) | 0 (0.0%) |
| $50,000 to $54,999 | 5 (3.4%) | 3 (2.2%) |
| $55,000 to $64,999 | 10 (6.7%) | 9 (6.5%) |
| $65,000 to $74,999 | 7 (4.7%) | 0 (0.0%) |
| $75,000 to $99,999 | 16 (10.7%) | 6 (4.3%) |
| $100,000+ | 0 (0.0%) | 11 (7.9%) |
| Total | 149 (100.0%) | 139 (100.0%) |
Earnings by Sex by Educational Attainment in Darby
Average earnings in Darby are $40,125 for men and $26,276 for women, a difference of 34.5%. Men with an educational attainment of less than high school enjoy the highest average annual earnings of $73,750, while those with high school diploma education earn the least with $31,094. Women with an educational attainment of high school diploma earn the most with the average annual earnings of $25,506, while those with high school diploma education have the smallest earnings of $25,506.
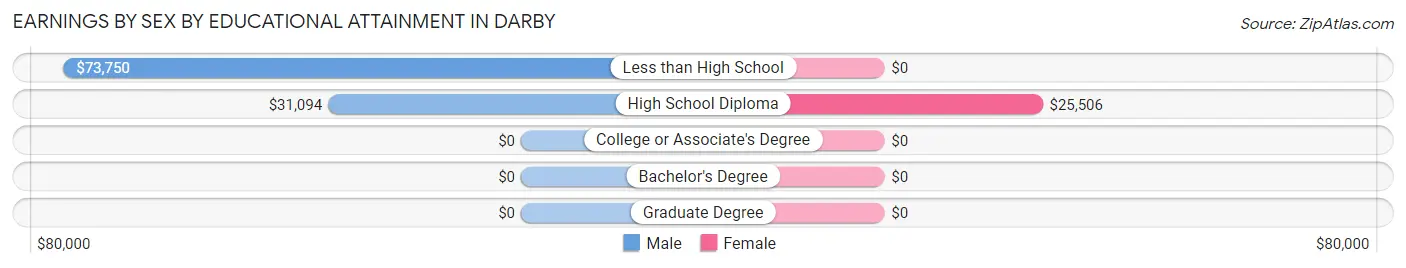
| Educational Attainment | Male Income | Female Income |
| Less than High School | $73,750 | $0 |
| High School Diploma | $31,094 | $25,506 |
| College or Associate's Degree | - | - |
| Bachelor's Degree | - | - |
| Graduate Degree | - | - |
| Total | $40,125 | $26,276 |
Family Income in Darby
Family Income Brackets in Darby
According to the Darby family income data, there are 64 families falling into the $35,000 to $49,999 income range, which is the most common income bracket and makes up 39.0% of all families.
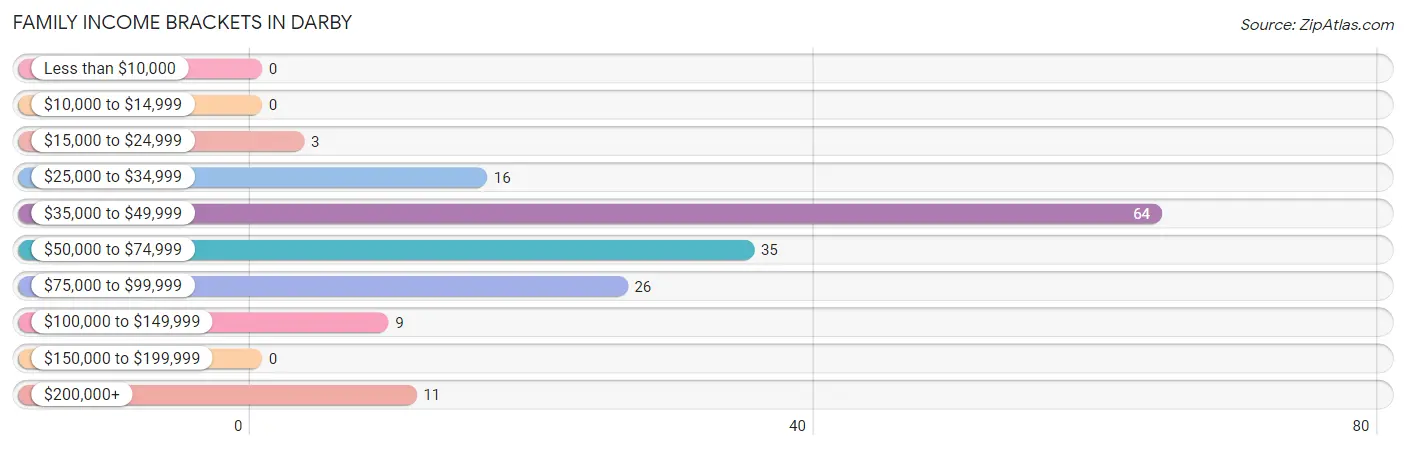
| Income Bracket | # Families | % Families |
| Less than $10,000 | 0 | 0.0% |
| $10,000 to $14,999 | 0 | 0.0% |
| $15,000 to $24,999 | 3 | 1.8% |
| $25,000 to $34,999 | 16 | 9.8% |
| $35,000 to $49,999 | 64 | 39.0% |
| $50,000 to $74,999 | 35 | 21.3% |
| $75,000 to $99,999 | 26 | 15.9% |
| $100,000 to $149,999 | 9 | 5.5% |
| $150,000 to $199,999 | 0 | 0.0% |
| $200,000+ | 11 | 6.7% |
Family Income by Famaliy Size in Darby
3-person families (29 | 17.7%) account for the highest median family income in Darby with $97,768 per family, while 3-person families (29 | 17.7%) have the highest median income of $32,589 per family member.
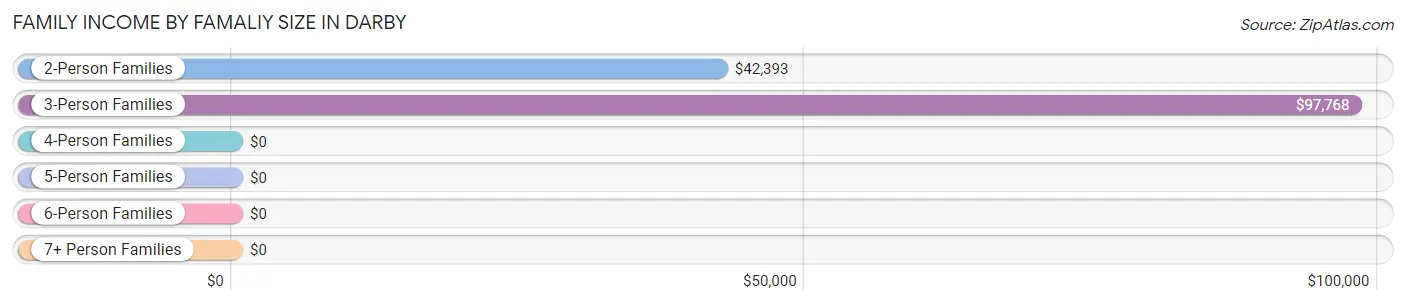
| Income Bracket | # Families | Median Income |
| 2-Person Families | 123 (75.0%) | $42,393 |
| 3-Person Families | 29 (17.7%) | $97,768 |
| 4-Person Families | 12 (7.3%) | $0 |
| 5-Person Families | 0 (0.0%) | $0 |
| 6-Person Families | 0 (0.0%) | $0 |
| 7+ Person Families | 0 (0.0%) | $0 |
| Total | 164 (100.0%) | $46,875 |
Family Income by Number of Earners in Darby
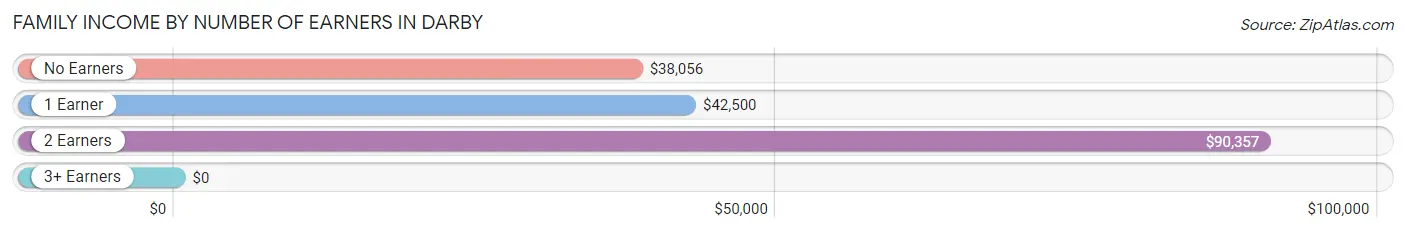
| Number of Earners | # Families | Median Income |
| No Earners | 26 (15.9%) | $38,056 |
| 1 Earner | 86 (52.4%) | $42,500 |
| 2 Earners | 52 (31.7%) | $90,357 |
| 3+ Earners | 0 (0.0%) | $0 |
| Total | 164 (100.0%) | $46,875 |
Household Income in Darby
Household Income Brackets in Darby
With 75 households falling in the category, the $35,000 to $49,999 income range is the most frequent in Darby, accounting for 22.5% of all households.
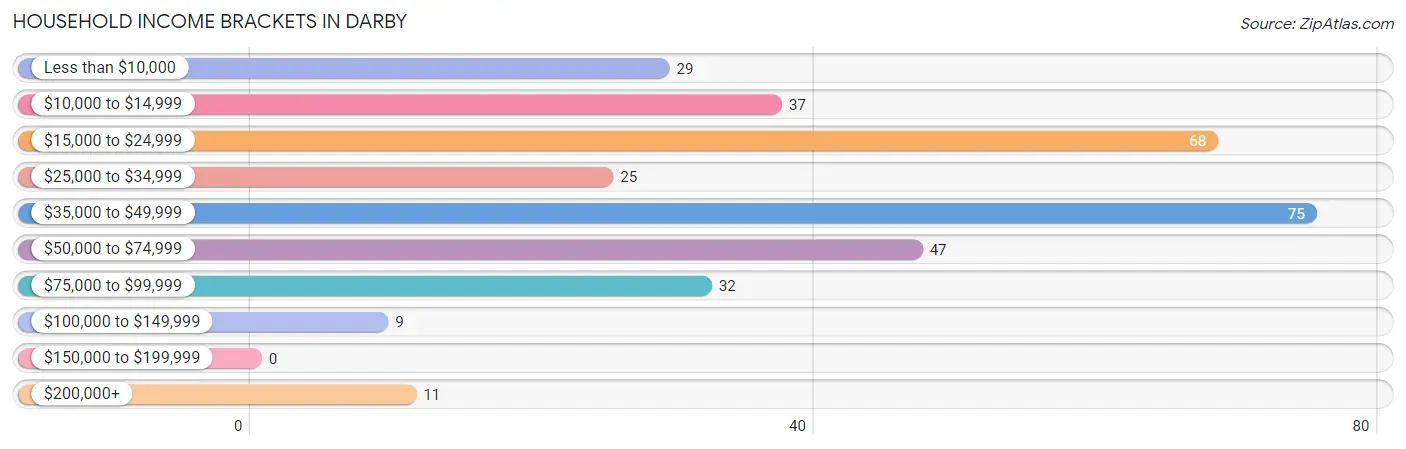
| Income Bracket | # Households | % Households |
| Less than $10,000 | 29 | 8.7% |
| $10,000 to $14,999 | 37 | 11.1% |
| $15,000 to $24,999 | 68 | 20.4% |
| $25,000 to $34,999 | 25 | 7.5% |
| $35,000 to $49,999 | 75 | 22.5% |
| $50,000 to $74,999 | 47 | 14.1% |
| $75,000 to $99,999 | 32 | 9.6% |
| $100,000 to $149,999 | 9 | 2.7% |
| $150,000 to $199,999 | 0 | 0.0% |
| $200,000+ | 11 | 3.3% |
Household Income by Householder Age in Darby
The median household income in Darby is $39,583, with the highest median household income of $41,889 found in the 25 to 44 years age bracket for the primary householder. A total of 120 households (36.0%) fall into this category.
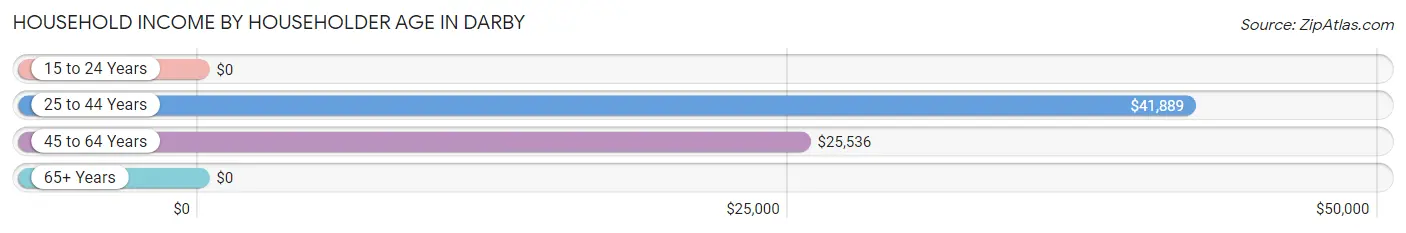
| Income Bracket | # Households | Median Income |
| 15 to 24 Years | 0 (0.0%) | $0 |
| 25 to 44 Years | 120 (36.0%) | $41,889 |
| 45 to 64 Years | 129 (38.7%) | $25,536 |
| 65+ Years | 84 (25.2%) | $0 |
| Total | 333 (100.0%) | $39,583 |
Poverty in Darby
Income Below Poverty by Sex and Age in Darby
With 18.1% poverty level for males and 26.1% for females among the residents of Darby, 55 to 64 year old males and 16 and 17 year old females are the most vulnerable to poverty, with 40 males (48.8%) and 1 females (100.0%) in their respective age groups living below the poverty level.
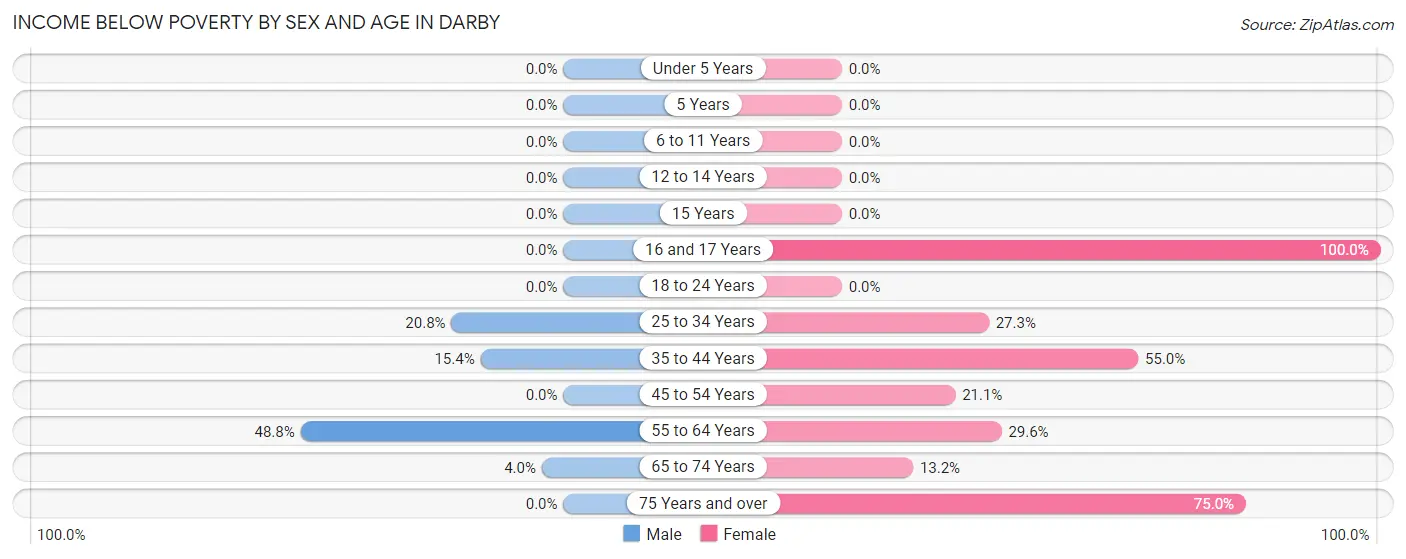
| Age Bracket | Male | Female |
| Under 5 Years | 0 (0.0%) | 0 (0.0%) |
| 5 Years | 0 (0.0%) | 0 (0.0%) |
| 6 to 11 Years | 0 (0.0%) | 0 (0.0%) |
| 12 to 14 Years | 0 (0.0%) | 0 (0.0%) |
| 15 Years | 0 (0.0%) | 0 (0.0%) |
| 16 and 17 Years | 0 (0.0%) | 1 (100.0%) |
| 18 to 24 Years | 0 (0.0%) | 0 (0.0%) |
| 25 to 34 Years | 16 (20.8%) | 15 (27.3%) |
| 35 to 44 Years | 8 (15.4%) | 11 (55.0%) |
| 45 to 54 Years | 0 (0.0%) | 8 (21.0%) |
| 55 to 64 Years | 40 (48.8%) | 16 (29.6%) |
| 65 to 74 Years | 2 (4.0%) | 7 (13.2%) |
| 75 Years and over | 0 (0.0%) | 6 (75.0%) |
| Total | 66 (18.1%) | 64 (26.1%) |
Income Above Poverty by Sex and Age in Darby
According to the poverty statistics in Darby, males aged under 5 years and females aged 5 years are the age groups that are most secure financially, with 100.0% of males and 100.0% of females in these age groups living above the poverty line.
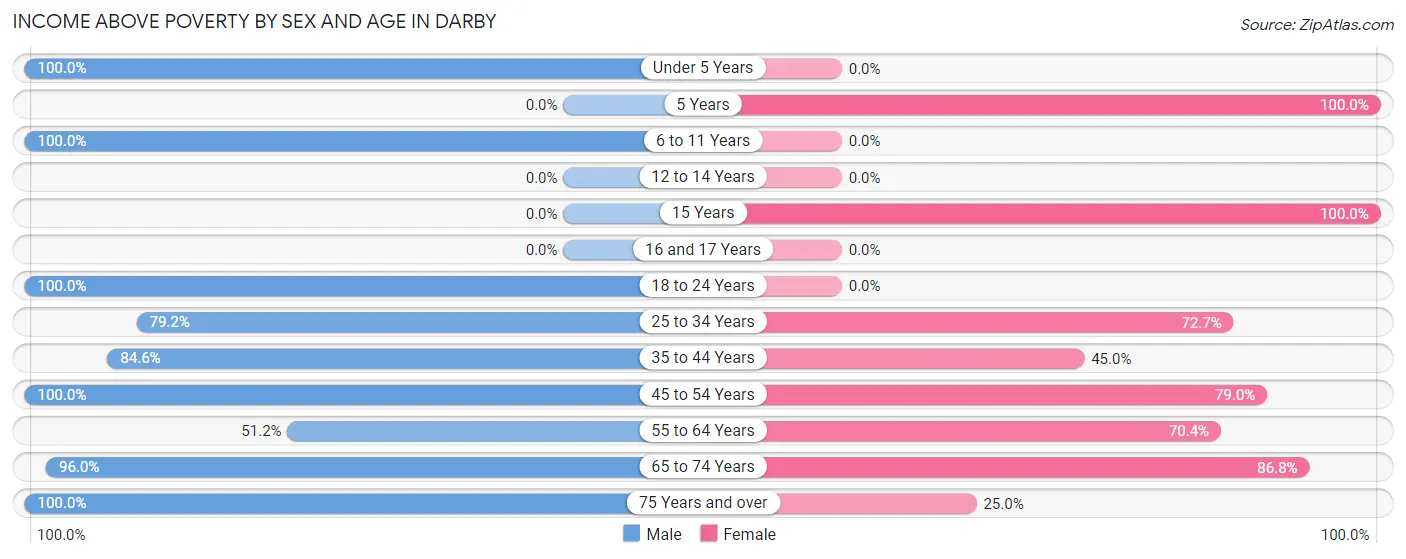
| Age Bracket | Male | Female |
| Under 5 Years | 13 (100.0%) | 0 (0.0%) |
| 5 Years | 0 (0.0%) | 6 (100.0%) |
| 6 to 11 Years | 32 (100.0%) | 0 (0.0%) |
| 12 to 14 Years | 0 (0.0%) | 0 (0.0%) |
| 15 Years | 0 (0.0%) | 10 (100.0%) |
| 16 and 17 Years | 0 (0.0%) | 0 (0.0%) |
| 18 to 24 Years | 10 (100.0%) | 0 (0.0%) |
| 25 to 34 Years | 61 (79.2%) | 40 (72.7%) |
| 35 to 44 Years | 44 (84.6%) | 9 (45.0%) |
| 45 to 54 Years | 33 (100.0%) | 30 (78.9%) |
| 55 to 64 Years | 42 (51.2%) | 38 (70.4%) |
| 65 to 74 Years | 48 (96.0%) | 46 (86.8%) |
| 75 Years and over | 16 (100.0%) | 2 (25.0%) |
| Total | 299 (81.9%) | 181 (73.9%) |
Income Below Poverty Among Married-Couple Families in Darby
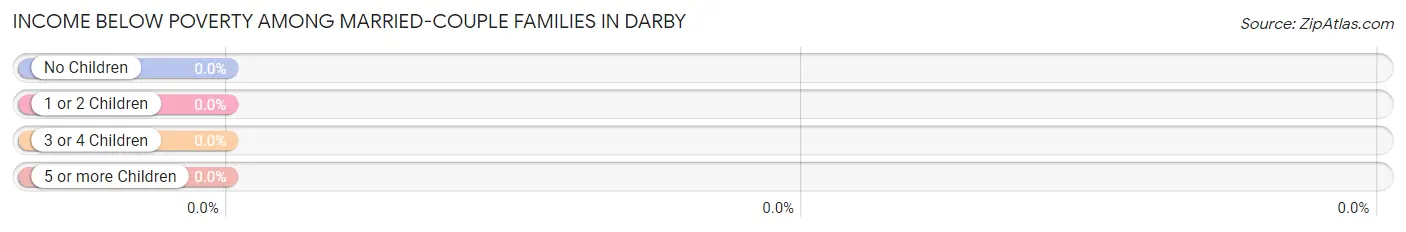
| Children | Above Poverty | Below Poverty |
| No Children | 116 (100.0%) | 0 (0.0%) |
| 1 or 2 Children | 8 (100.0%) | 0 (0.0%) |
| 3 or 4 Children | 0 (0.0%) | 0 (0.0%) |
| 5 or more Children | 0 (0.0%) | 0 (0.0%) |
| Total | 124 (100.0%) | 0 (0.0%) |
Income Below Poverty Among Single-Parent Households in Darby
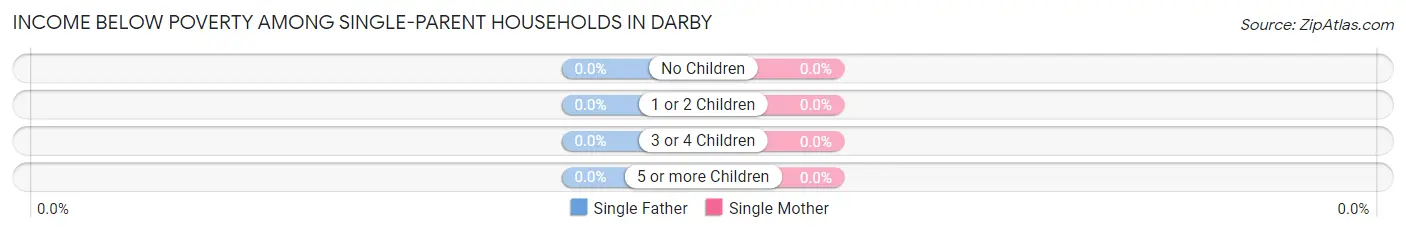
| Children | Single Father | Single Mother |
| No Children | 0 (0.0%) | 0 (0.0%) |
| 1 or 2 Children | 0 (0.0%) | 0 (0.0%) |
| 3 or 4 Children | 0 (0.0%) | 0 (0.0%) |
| 5 or more Children | 0 (0.0%) | 0 (0.0%) |
| Total | 0 (0.0%) | 0 (0.0%) |
Income Below Poverty Among Married-Couple vs Single-Parent Households in Darby
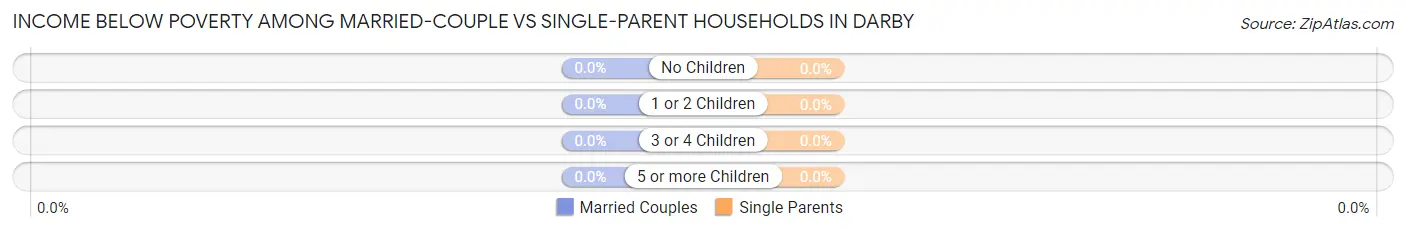
| Children | Married-Couple Families | Single-Parent Households |
| No Children | 0 (0.0%) | 0 (0.0%) |
| 1 or 2 Children | 0 (0.0%) | 0 (0.0%) |
| 3 or 4 Children | 0 (0.0%) | 0 (0.0%) |
| 5 or more Children | 0 (0.0%) | 0 (0.0%) |
| Total | 0 (0.0%) | 0 (0.0%) |
Race in Darby
The most populous races in Darby are White / Caucasian (487 | 79.8%), Asian (64 | 10.5%), and Two or more Races (47 | 7.7%).
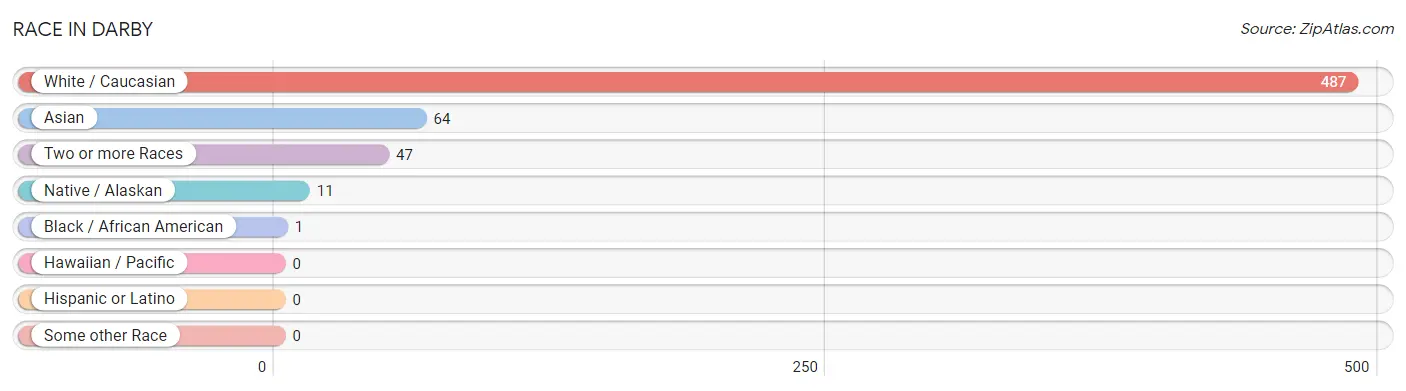
| Race | # Population | % Population |
| Asian | 64 | 10.5% |
| Black / African American | 1 | 0.2% |
| Hawaiian / Pacific | 0 | 0.0% |
| Hispanic or Latino | 0 | 0.0% |
| Native / Alaskan | 11 | 1.8% |
| White / Caucasian | 487 | 79.8% |
| Two or more Races | 47 | 7.7% |
| Some other Race | 0 | 0.0% |
| Total | 610 | 100.0% |
Ancestry in Darby
The most populous ancestries reported in Darby are Irish (157 | 25.7%), German (140 | 23.0%), English (91 | 14.9%), Malaysian (54 | 8.8%), and Italian (50 | 8.2%), together accounting for 80.7% of all Darby residents.
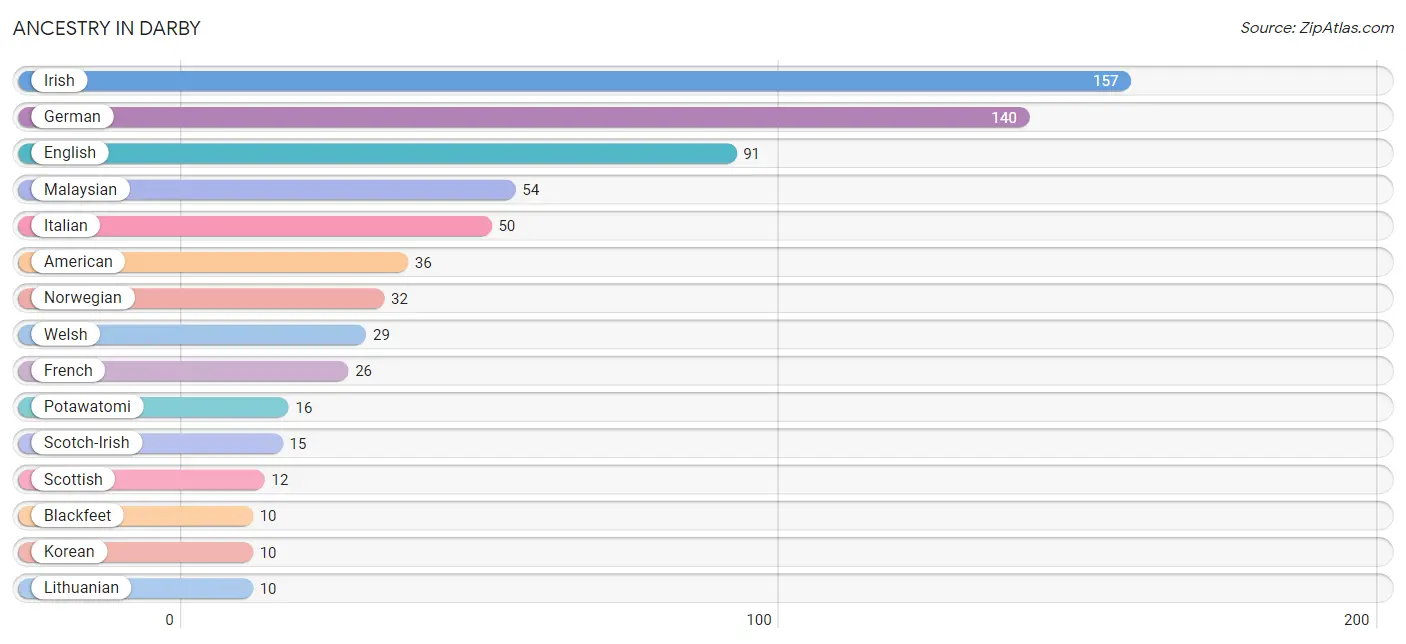
| Ancestry | # Population | % Population |
| American | 36 | 5.9% |
| Austrian | 3 | 0.5% |
| Bhutanese | 5 | 0.8% |
| Blackfeet | 10 | 1.6% |
| Cherokee | 7 | 1.1% |
| Cree | 1 | 0.2% |
| Danish | 7 | 1.1% |
| English | 91 | 14.9% |
| European | 3 | 0.5% |
| French | 26 | 4.3% |
| French Canadian | 7 | 1.1% |
| German | 140 | 23.0% |
| Irish | 157 | 25.7% |
| Italian | 50 | 8.2% |
| Korean | 10 | 1.6% |
| Lithuanian | 10 | 1.6% |
| Malaysian | 54 | 8.8% |
| Northern European | 2 | 0.3% |
| Norwegian | 32 | 5.2% |
| Potawatomi | 16 | 2.6% |
| Scotch-Irish | 15 | 2.5% |
| Scottish | 12 | 2.0% |
| Swedish | 7 | 1.1% |
| Welsh | 29 | 4.8% | View All 24 Rows |
Immigrants in Darby
The most numerous immigrant groups reported in Darby came from England (12 | 2.0%), Europe (12 | 2.0%), Northern Europe (12 | 2.0%), Asia (5 | 0.8%), and Eastern Asia (5 | 0.8%), together accounting for 7.5% of all Darby residents.
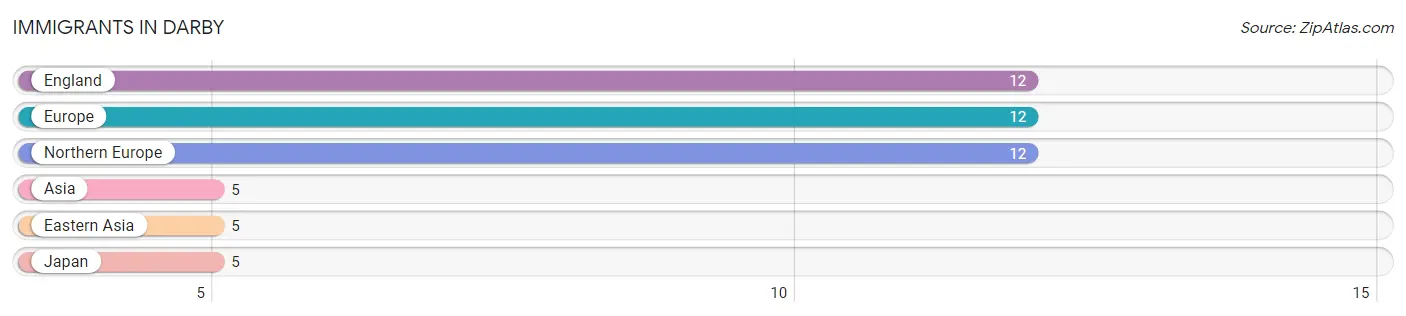
| Immigration Origin | # Population | % Population |
| Asia | 5 | 0.8% |
| Eastern Asia | 5 | 0.8% |
| England | 12 | 2.0% |
| Europe | 12 | 2.0% |
| Japan | 5 | 0.8% |
| Northern Europe | 12 | 2.0% | View All 6 Rows |
Sex and Age in Darby
Sex and Age in Darby
The most populous age groups in Darby are 30 to 34 Years (55 | 15.1%) for men and 25 to 29 Years (50 | 20.4%) for women.
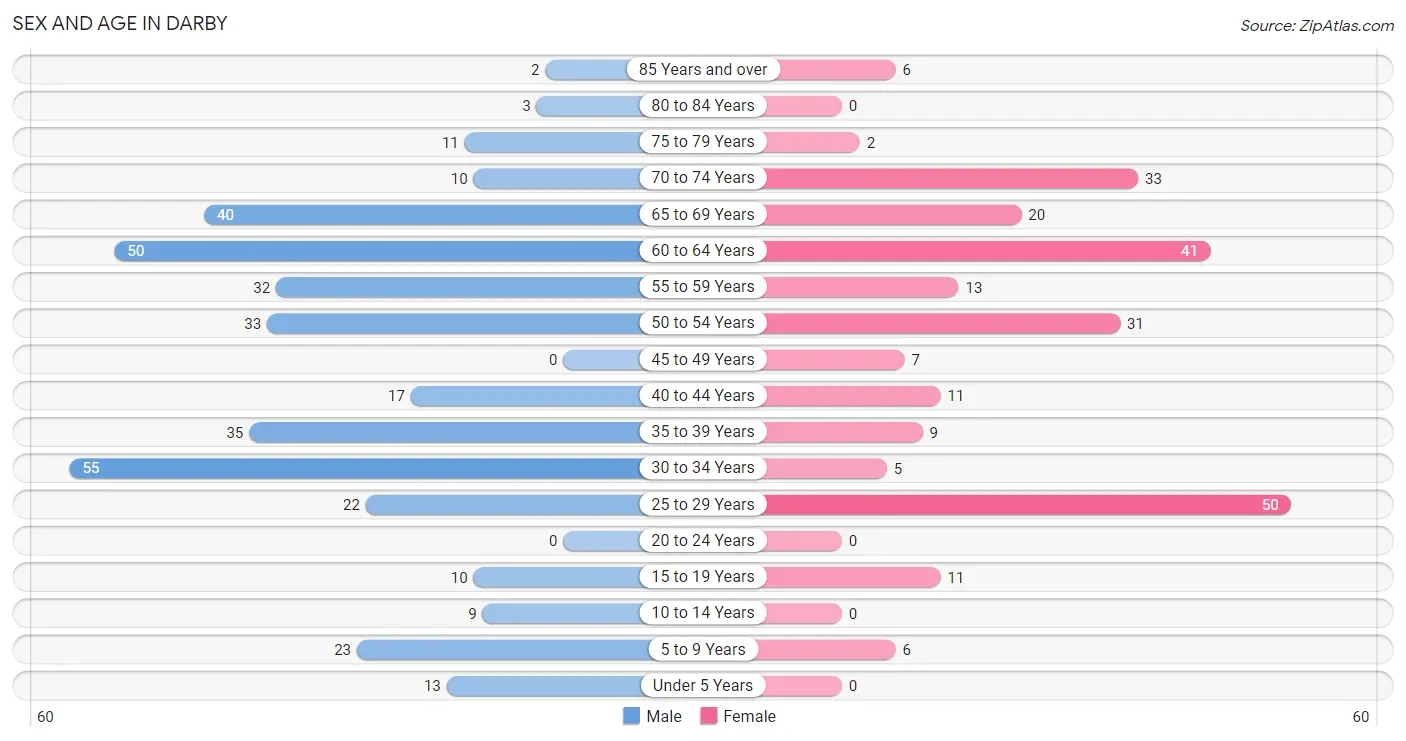
| Age Bracket | Male | Female |
| Under 5 Years | 13 (3.6%) | 0 (0.0%) |
| 5 to 9 Years | 23 (6.3%) | 6 (2.5%) |
| 10 to 14 Years | 9 (2.5%) | 0 (0.0%) |
| 15 to 19 Years | 10 (2.7%) | 11 (4.5%) |
| 20 to 24 Years | 0 (0.0%) | 0 (0.0%) |
| 25 to 29 Years | 22 (6.0%) | 50 (20.4%) |
| 30 to 34 Years | 55 (15.1%) | 5 (2.0%) |
| 35 to 39 Years | 35 (9.6%) | 9 (3.7%) |
| 40 to 44 Years | 17 (4.7%) | 11 (4.5%) |
| 45 to 49 Years | 0 (0.0%) | 7 (2.9%) |
| 50 to 54 Years | 33 (9.0%) | 31 (12.7%) |
| 55 to 59 Years | 32 (8.8%) | 13 (5.3%) |
| 60 to 64 Years | 50 (13.7%) | 41 (16.7%) |
| 65 to 69 Years | 40 (11.0%) | 20 (8.2%) |
| 70 to 74 Years | 10 (2.7%) | 33 (13.5%) |
| 75 to 79 Years | 11 (3.0%) | 2 (0.8%) |
| 80 to 84 Years | 3 (0.8%) | 0 (0.0%) |
| 85 Years and over | 2 (0.5%) | 6 (2.5%) |
| Total | 365 (100.0%) | 245 (100.0%) |
Families and Households in Darby
Median Family Size in Darby
The median family size in Darby is 2.31 persons per family, with single female/mother families (7 | 4.3%) accounting for the largest median family size of 3.71 persons per family. On the other hand, married-couple families (124 | 75.6%) represent the smallest median family size with 2.05 persons per family.
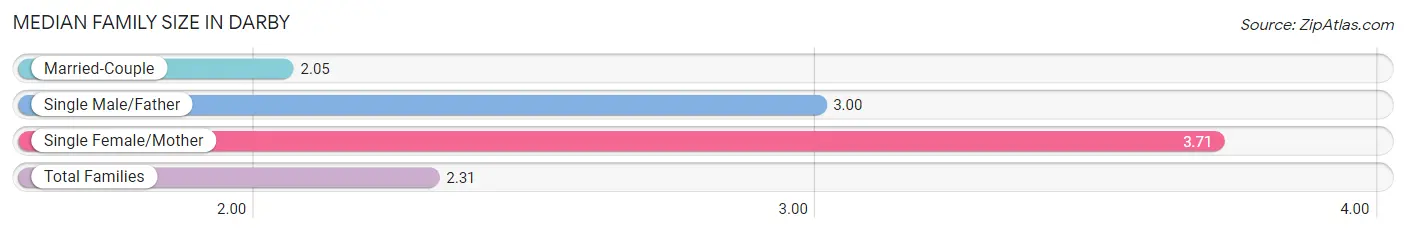
| Family Type | # Families | Family Size |
| Married-Couple | 124 (75.6%) | 2.05 |
| Single Male/Father | 33 (20.1%) | 3.00 |
| Single Female/Mother | 7 (4.3%) | 3.71 |
| Total Families | 164 (100.0%) | 2.31 |
Median Household Size in Darby
The median household size in Darby is 1.82 persons per household, with single female/mother households (7 | 2.1%) accounting for the largest median household size of 5.14 persons per household. non-family households (169 | 50.7%) represent the smallest median household size with 1.12 persons per household.
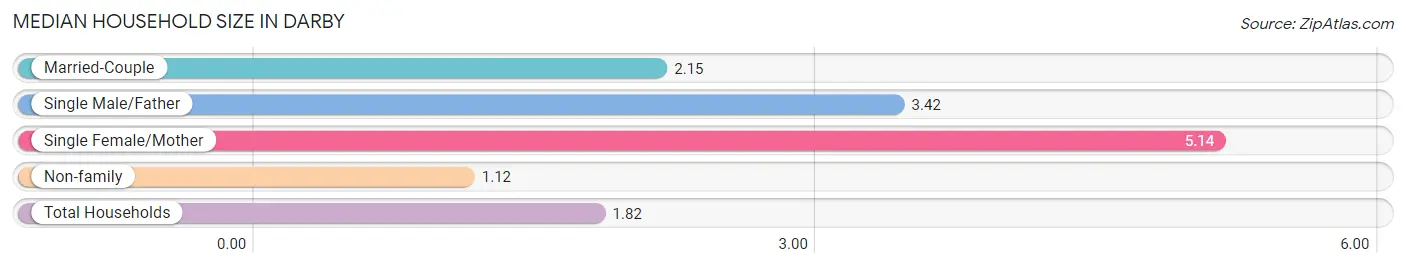
| Household Type | # Households | Household Size |
| Married-Couple | 124 (37.2%) | 2.15 |
| Single Male/Father | 33 (9.9%) | 3.42 |
| Single Female/Mother | 7 (2.1%) | 5.14 |
| Non-family | 169 (50.7%) | 1.12 |
| Total Households | 333 (100.0%) | 1.82 |
Household Size by Marriage Status in Darby
Out of a total of 333 households in Darby, 164 (49.2%) are family households, while 169 (50.7%) are nonfamily households. The most numerous type of family households are 2-person households, comprising 112, and the most common type of nonfamily households are 1-person households, comprising 145.
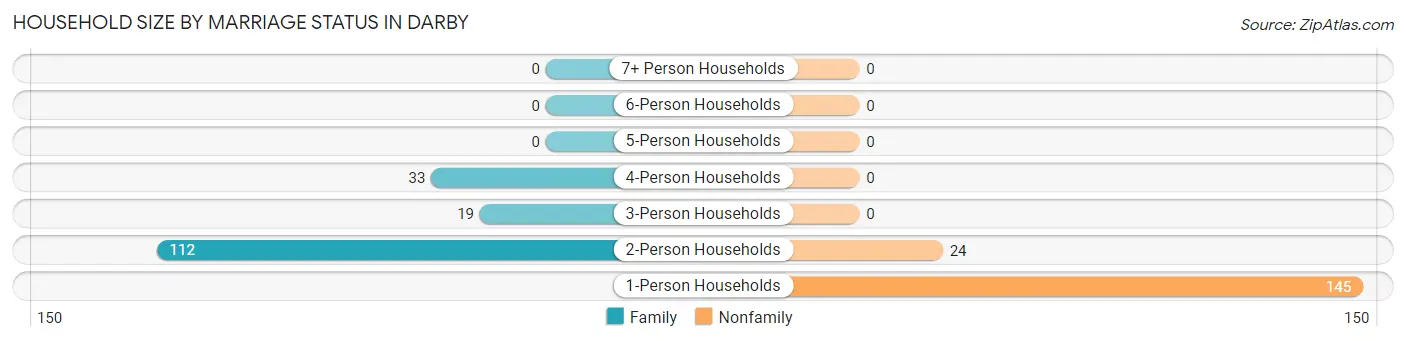
| Household Size | Family Households | Nonfamily Households |
| 1-Person Households | - | 145 (43.5%) |
| 2-Person Households | 112 (33.6%) | 24 (7.2%) |
| 3-Person Households | 19 (5.7%) | 0 (0.0%) |
| 4-Person Households | 33 (9.9%) | 0 (0.0%) |
| 5-Person Households | 0 (0.0%) | 0 (0.0%) |
| 6-Person Households | 0 (0.0%) | 0 (0.0%) |
| 7+ Person Households | 0 (0.0%) | 0 (0.0%) |
| Total | 164 (49.2%) | 169 (50.7%) |
Female Fertility in Darby
Fertility by Age in Darby
| Age Bracket | Women with Births | Births / 1,000 Women |
| 15 to 19 years | 0 (0.0%) | 0.0 |
| 20 to 34 years | 0 (0.0%) | 0.0 |
| 35 to 50 years | 0 (0.0%) | 0.0 |
| Total | 0 (0.0%) | 0.0 |
Fertility by Age by Marriage Status in Darby
| Age Bracket | Married | Unmarried |
| 15 to 19 years | 0 (0.0%) | 0 (0.0%) |
| 20 to 34 years | 0 (0.0%) | 0 (0.0%) |
| 35 to 50 years | 0 (0.0%) | 0 (0.0%) |
| Total | 0 (0.0%) | 0 (0.0%) |
Fertility by Education in Darby
| Educational Attainment | Women with Births | Births / 1,000 Women |
| Less than High School | 0 (0.0%) | 0.0 |
| High School Diploma | 0 (0.0%) | 0.0 |
| College or Associate's Degree | 0 (0.0%) | 0.0 |
| Bachelor's Degree | 0 (0.0%) | 0.0 |
| Graduate Degree | 0 (0.0%) | 0.0 |
| Total | 0 (0.0%) | 0.0 |
Fertility by Education by Marriage Status in Darby
| Educational Attainment | Married | Unmarried |
| Less than High School | 0 (0.0%) | 0 (0.0%) |
| High School Diploma | 0 (0.0%) | 0 (0.0%) |
| College or Associate's Degree | 0 (0.0%) | 0 (0.0%) |
| Bachelor's Degree | 0 (0.0%) | 0 (0.0%) |
| Graduate Degree | 0 (0.0%) | 0 (0.0%) |
| Total | 0 (0.0%) | 0 (0.0%) |
Employment Characteristics in Darby
Employment by Class of Employer in Darby
Among the 270 employed individuals in Darby, private company employees (170 | 63.0%), local government employees (41 | 15.2%), and self-employed (not incorporated) (23 | 8.5%) make up the most common classes of employment.
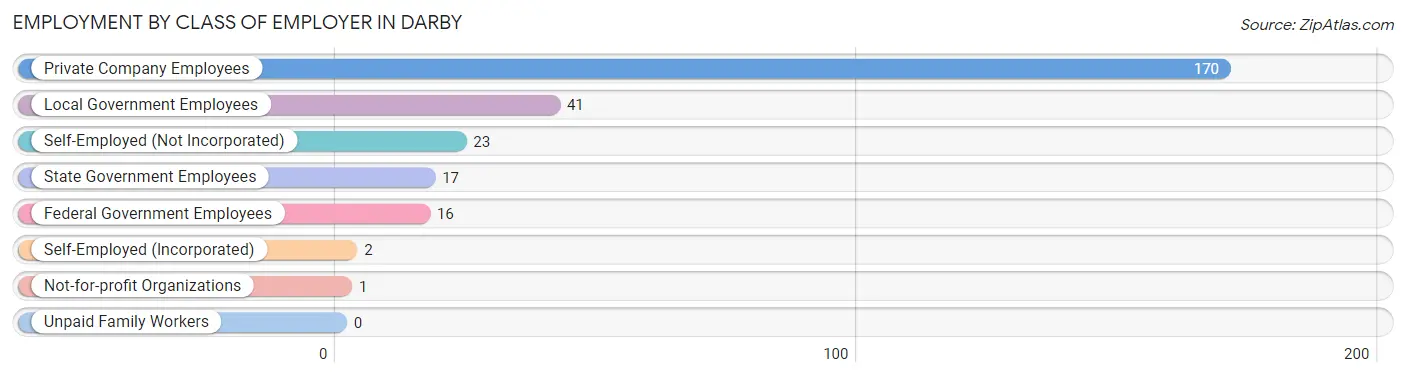
| Employer Class | # Employees | % Employees |
| Private Company Employees | 170 | 63.0% |
| Self-Employed (Incorporated) | 2 | 0.7% |
| Self-Employed (Not Incorporated) | 23 | 8.5% |
| Not-for-profit Organizations | 1 | 0.4% |
| Local Government Employees | 41 | 15.2% |
| State Government Employees | 17 | 6.3% |
| Federal Government Employees | 16 | 5.9% |
| Unpaid Family Workers | 0 | 0.0% |
| Total | 270 | 100.0% |
Employment Status by Age in Darby
According to the labor force statistics for Darby, out of the total population over 16 years of age (549), 52.1% or 286 individuals are in the labor force, with 2.8% or 8 of them unemployed. The age group with the highest labor force participation rate is 16 to 19 years, with 100.0% or 11 individuals in the labor force. Within the labor force, the 55 to 59 years age range has the highest percentage of unemployed individuals, with 50.0% or 8 of them being unemployed.
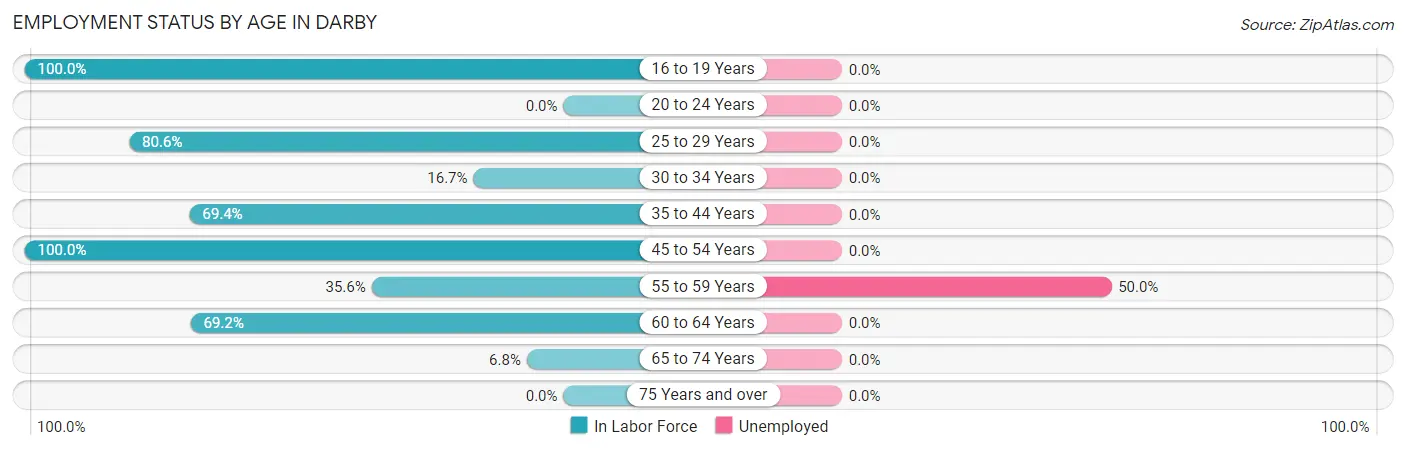
| Age Bracket | In Labor Force | Unemployed |
| 16 to 19 Years | 11 (100.0%) | 0 (0.0%) |
| 20 to 24 Years | 0 (0.0%) | 0 (0.0%) |
| 25 to 29 Years | 58 (80.6%) | 0 (0.0%) |
| 30 to 34 Years | 10 (16.7%) | 0 (0.0%) |
| 35 to 44 Years | 50 (69.4%) | 0 (0.0%) |
| 45 to 54 Years | 71 (100.0%) | 0 (0.0%) |
| 55 to 59 Years | 16 (35.6%) | 8 (50.0%) |
| 60 to 64 Years | 63 (69.2%) | 0 (0.0%) |
| 65 to 74 Years | 7 (6.8%) | 0 (0.0%) |
| 75 Years and over | 0 (0.0%) | 0 (0.0%) |
| Total | 286 (52.1%) | 8 (2.8%) |
Employment Status by Educational Attainment in Darby
According to labor force statistics for Darby, 65.2% of individuals (268) out of the total population between 25 and 64 years of age (411) are in the labor force, with 3.0% or 8 of them being unemployed. The group with the highest labor force participation rate are those with the educational attainment of college / associate degree, with 77.1% or 54 individuals in the labor force. Within the labor force, individuals with high school diploma education have the highest percentage of unemployment, with 5.6% or 8 of them being unemployed.
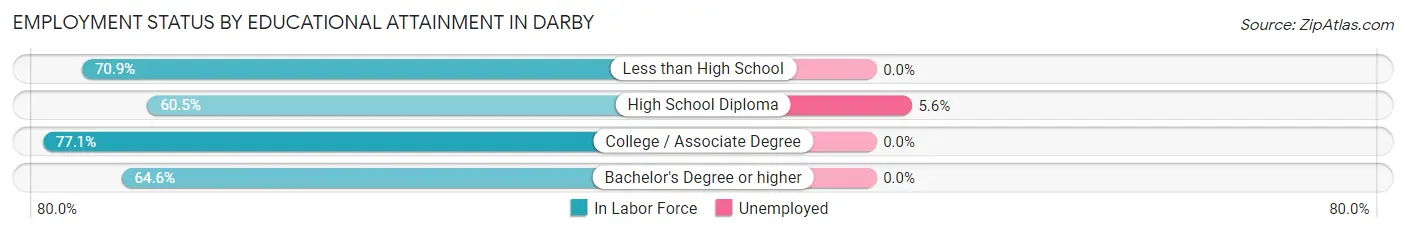
| Educational Attainment | In Labor Force | Unemployed |
| Less than High School | 39 (70.9%) | 0 (0.0%) |
| High School Diploma | 144 (60.5%) | 13 (5.6%) |
| College / Associate Degree | 54 (77.1%) | 0 (0.0%) |
| Bachelor's Degree or higher | 31 (64.6%) | 0 (0.0%) |
| Total | 268 (65.2%) | 12 (3.0%) |
Employment Occupations by Sex in Darby
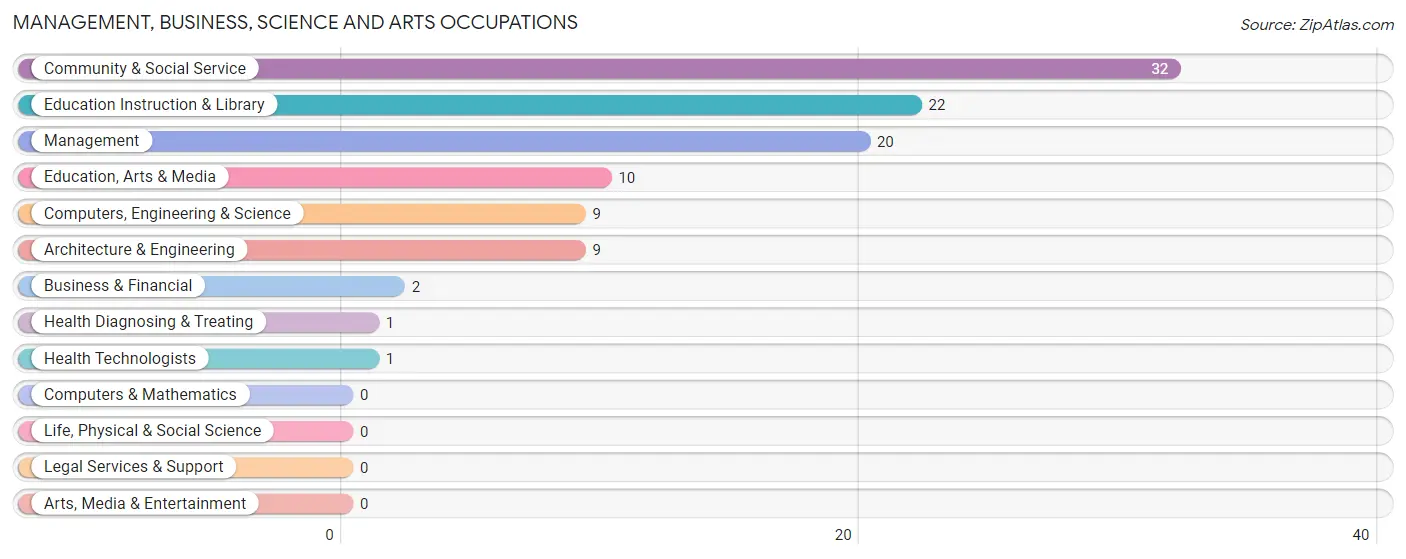
Management, Business, Science and Arts Occupations
The most common Management, Business, Science and Arts occupations in Darby are Community & Social Service (32 | 11.5%), Education Instruction & Library (22 | 7.9%), Management (20 | 7.2%), Education, Arts & Media (10 | 3.6%), and Computers, Engineering & Science (9 | 3.2%).
Management, Business, Science and Arts Occupations by Sex
Within the Management, Business, Science and Arts occupations in Darby, the most male-oriented occupations are Computers, Engineering & Science (100.0%), Architecture & Engineering (100.0%), and Education, Arts & Media (100.0%), while the most female-oriented occupations are Business & Financial (100.0%), Health Diagnosing & Treating (100.0%), and Health Technologists (100.0%).
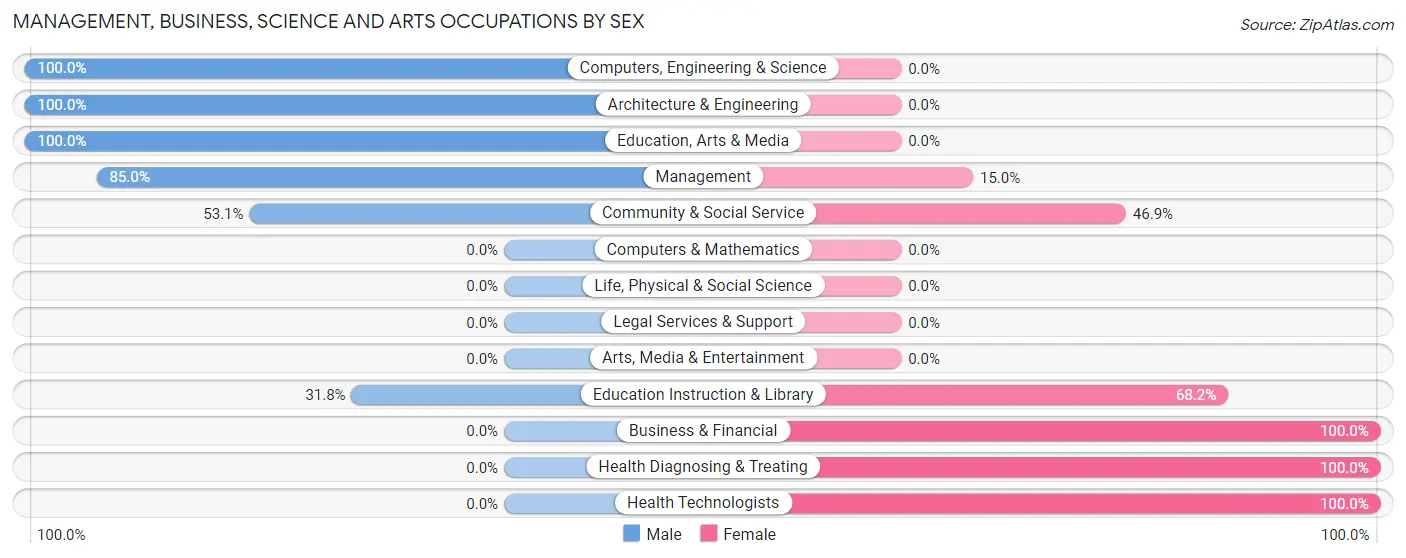
| Occupation | Male | Female |
| Management | 17 (85.0%) | 3 (15.0%) |
| Business & Financial | 0 (0.0%) | 2 (100.0%) |
| Computers, Engineering & Science | 9 (100.0%) | 0 (0.0%) |
| Computers & Mathematics | 0 (0.0%) | 0 (0.0%) |
| Architecture & Engineering | 9 (100.0%) | 0 (0.0%) |
| Life, Physical & Social Science | 0 (0.0%) | 0 (0.0%) |
| Community & Social Service | 17 (53.1%) | 15 (46.9%) |
| Education, Arts & Media | 10 (100.0%) | 0 (0.0%) |
| Legal Services & Support | 0 (0.0%) | 0 (0.0%) |
| Education Instruction & Library | 7 (31.8%) | 15 (68.2%) |
| Arts, Media & Entertainment | 0 (0.0%) | 0 (0.0%) |
| Health Diagnosing & Treating | 0 (0.0%) | 1 (100.0%) |
| Health Technologists | 0 (0.0%) | 1 (100.0%) |
| Total (Category) | 43 (67.2%) | 21 (32.8%) |
| Total (Overall) | 149 (53.6%) | 129 (46.4%) |
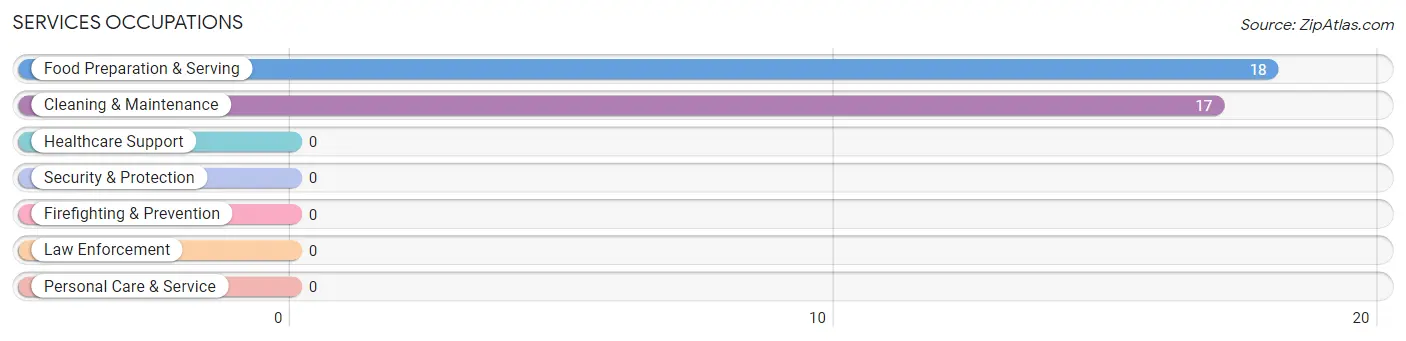
Services Occupations
The most common Services occupations in Darby are Food Preparation & Serving (18 | 6.5%), and Cleaning & Maintenance (17 | 6.1%).
Services Occupations by Sex
Within the Services occupations in Darby, the most male-oriented occupations are Food Preparation & Serving (94.4%), and Cleaning & Maintenance (82.4%), while the most female-oriented occupations are Cleaning & Maintenance (17.6%), and Food Preparation & Serving (5.6%).
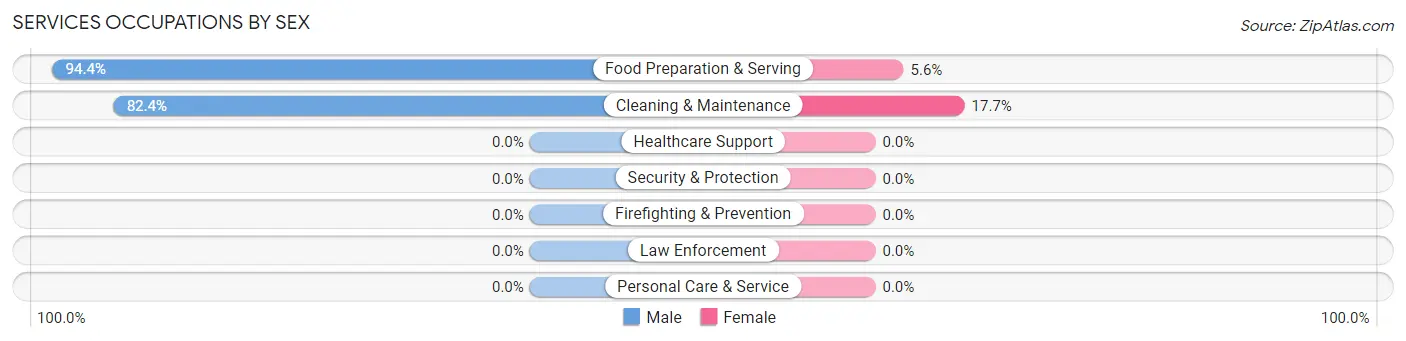
| Occupation | Male | Female |
| Healthcare Support | 0 (0.0%) | 0 (0.0%) |
| Security & Protection | 0 (0.0%) | 0 (0.0%) |
| Firefighting & Prevention | 0 (0.0%) | 0 (0.0%) |
| Law Enforcement | 0 (0.0%) | 0 (0.0%) |
| Food Preparation & Serving | 17 (94.4%) | 1 (5.6%) |
| Cleaning & Maintenance | 14 (82.4%) | 3 (17.6%) |
| Personal Care & Service | 0 (0.0%) | 0 (0.0%) |
| Total (Category) | 31 (88.6%) | 4 (11.4%) |
| Total (Overall) | 149 (53.6%) | 129 (46.4%) |
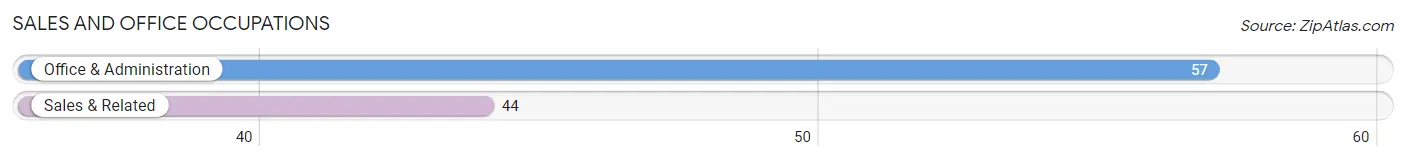
Sales and Office Occupations
The most common Sales and Office occupations in Darby are Office & Administration (57 | 20.5%), and Sales & Related (44 | 15.8%).
Sales and Office Occupations by Sex
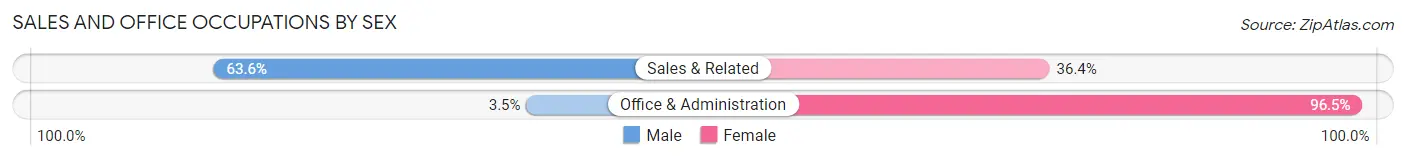
| Occupation | Male | Female |
| Sales & Related | 28 (63.6%) | 16 (36.4%) |
| Office & Administration | 2 (3.5%) | 55 (96.5%) |
| Total (Category) | 30 (29.7%) | 71 (70.3%) |
| Total (Overall) | 149 (53.6%) | 129 (46.4%) |
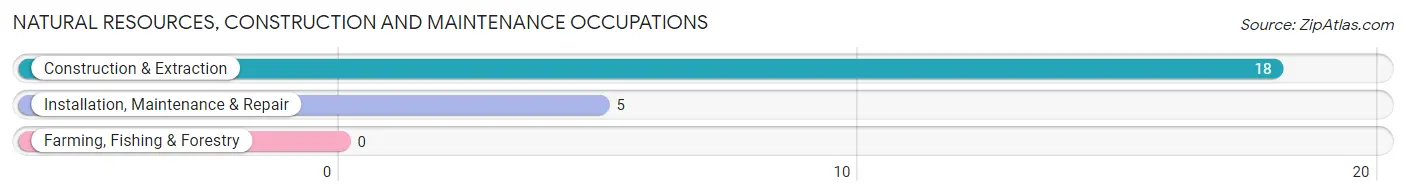
Natural Resources, Construction and Maintenance Occupations
The most common Natural Resources, Construction and Maintenance occupations in Darby are Construction & Extraction (18 | 6.5%), and Installation, Maintenance & Repair (5 | 1.8%).
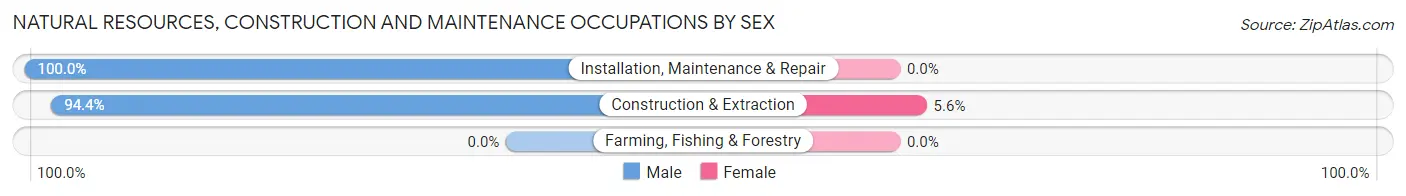
Natural Resources, Construction and Maintenance Occupations by Sex
| Occupation | Male | Female |
| Farming, Fishing & Forestry | 0 (0.0%) | 0 (0.0%) |
| Construction & Extraction | 17 (94.4%) | 1 (5.6%) |
| Installation, Maintenance & Repair | 5 (100.0%) | 0 (0.0%) |
| Total (Category) | 22 (95.7%) | 1 (4.3%) |
| Total (Overall) | 149 (53.6%) | 129 (46.4%) |
Production, Transportation and Moving Occupations
The most common Production, Transportation and Moving occupations in Darby are Transportation (35 | 12.6%), Production (12 | 4.3%), and Material Moving (8 | 2.9%).
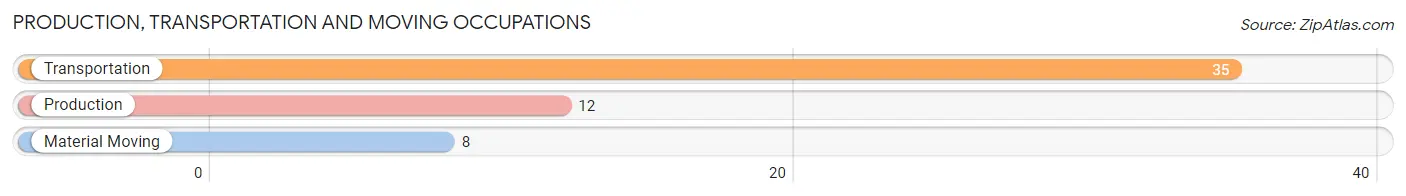
Production, Transportation and Moving Occupations by Sex
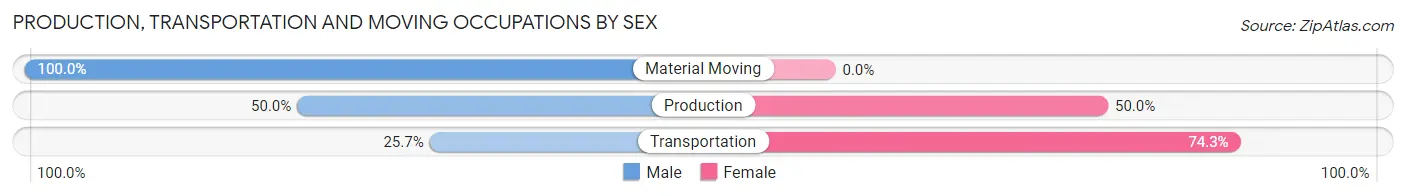
| Occupation | Male | Female |
| Production | 6 (50.0%) | 6 (50.0%) |
| Transportation | 9 (25.7%) | 26 (74.3%) |
| Material Moving | 8 (100.0%) | 0 (0.0%) |
| Total (Category) | 23 (41.8%) | 32 (58.2%) |
| Total (Overall) | 149 (53.6%) | 129 (46.4%) |
Employment Industries by Sex in Darby
Employment Industries in Darby
The major employment industries in Darby include Finance & Insurance (50 | 18.0%), Educational Services (46 | 16.6%), Construction (43 | 15.5%), Retail Trade (34 | 12.2%), and Transportation & Warehousing (27 | 9.7%).
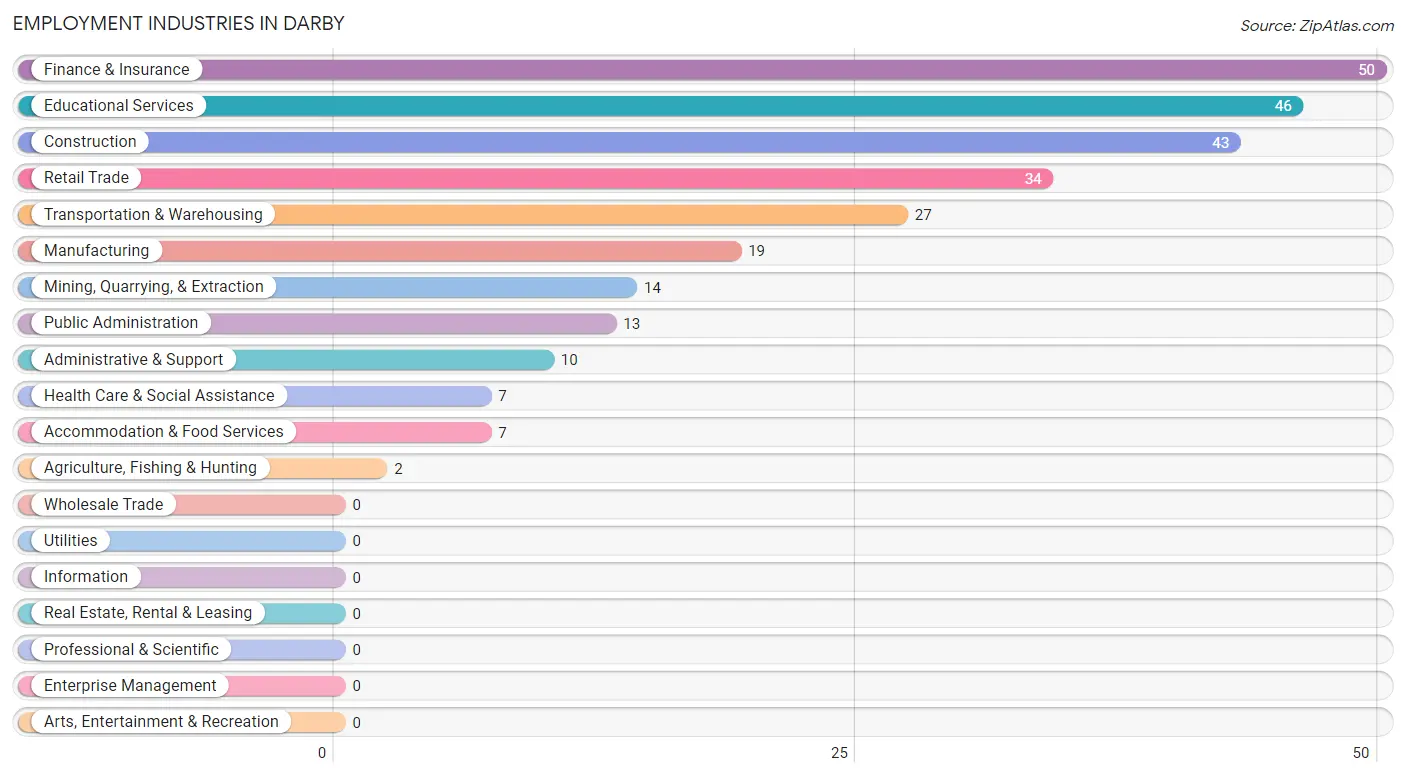
Employment Industries by Sex in Darby
The Darby industries that see more men than women are Mining, Quarrying, & Extraction (100.0%), Construction (100.0%), and Accommodation & Food Services (100.0%), whereas the industries that tend to have a higher number of women are Agriculture, Fishing & Hunting (100.0%), Finance & Insurance (100.0%), and Health Care & Social Assistance (100.0%).
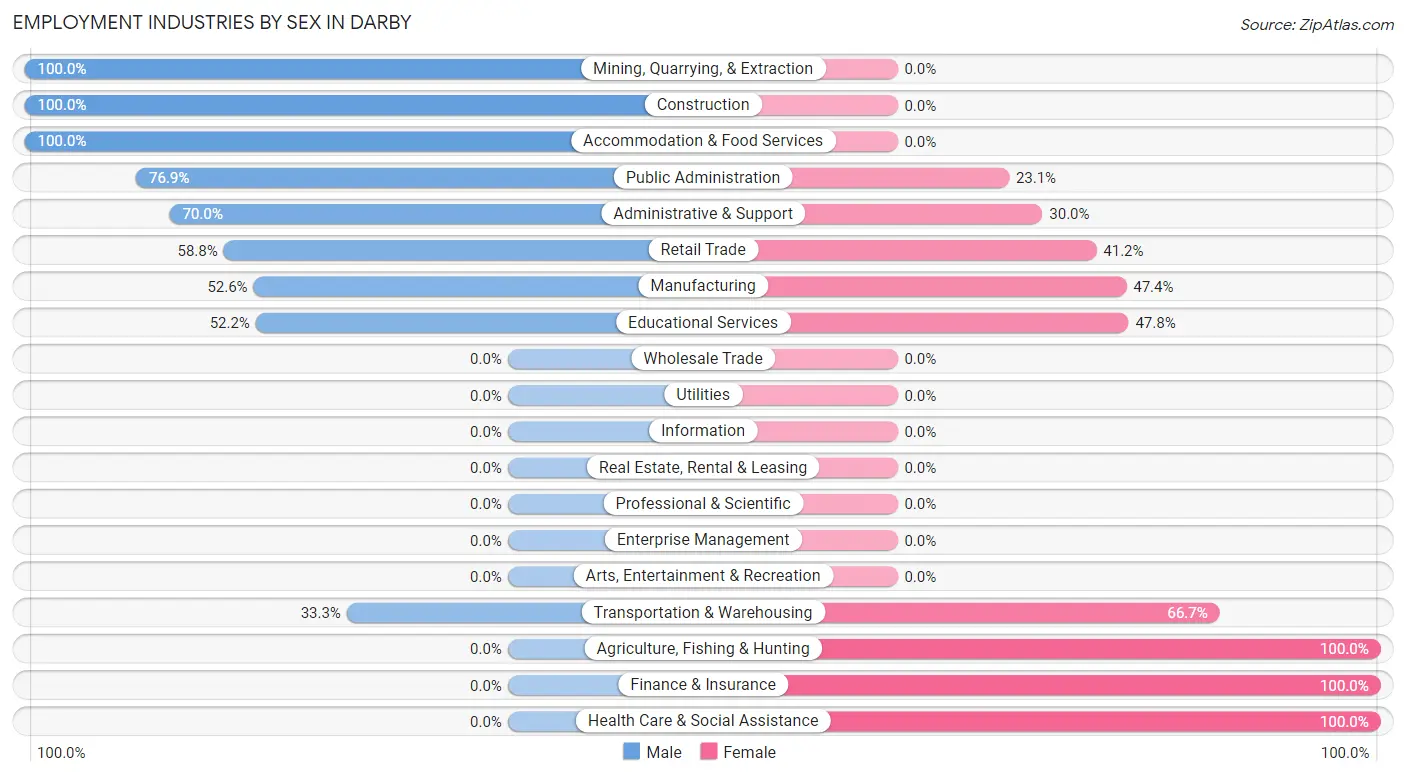
| Industry | Male | Female |
| Agriculture, Fishing & Hunting | 0 (0.0%) | 2 (100.0%) |
| Mining, Quarrying, & Extraction | 14 (100.0%) | 0 (0.0%) |
| Construction | 43 (100.0%) | 0 (0.0%) |
| Manufacturing | 10 (52.6%) | 9 (47.4%) |
| Wholesale Trade | 0 (0.0%) | 0 (0.0%) |
| Retail Trade | 20 (58.8%) | 14 (41.2%) |
| Transportation & Warehousing | 9 (33.3%) | 18 (66.7%) |
| Utilities | 0 (0.0%) | 0 (0.0%) |
| Information | 0 (0.0%) | 0 (0.0%) |
| Finance & Insurance | 0 (0.0%) | 50 (100.0%) |
| Real Estate, Rental & Leasing | 0 (0.0%) | 0 (0.0%) |
| Professional & Scientific | 0 (0.0%) | 0 (0.0%) |
| Enterprise Management | 0 (0.0%) | 0 (0.0%) |
| Administrative & Support | 7 (70.0%) | 3 (30.0%) |
| Educational Services | 24 (52.2%) | 22 (47.8%) |
| Health Care & Social Assistance | 0 (0.0%) | 7 (100.0%) |
| Arts, Entertainment & Recreation | 0 (0.0%) | 0 (0.0%) |
| Accommodation & Food Services | 7 (100.0%) | 0 (0.0%) |
| Public Administration | 10 (76.9%) | 3 (23.1%) |
| Total | 149 (53.6%) | 129 (46.4%) |
Education in Darby
School Enrollment in Darby
The most common levels of schooling among the 59 students in Darby are elementary school (23 | 39.0%), high school (21 | 35.6%), and middle school (9 | 15.2%).
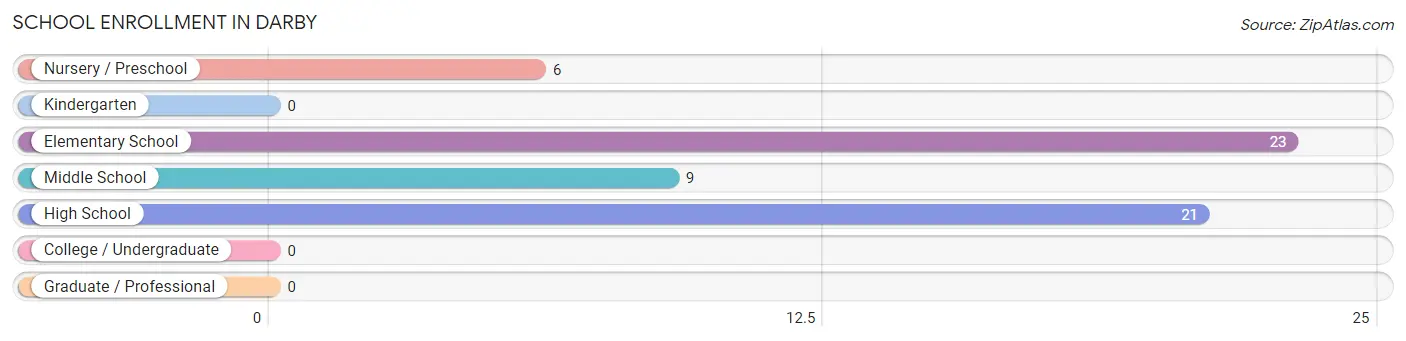
| School Level | # Students | % Students |
| Nursery / Preschool | 6 | 10.2% |
| Kindergarten | 0 | 0.0% |
| Elementary School | 23 | 39.0% |
| Middle School | 9 | 15.2% |
| High School | 21 | 35.6% |
| College / Undergraduate | 0 | 0.0% |
| Graduate / Professional | 0 | 0.0% |
| Total | 59 | 100.0% |
School Enrollment by Age by Funding Source in Darby
Out of a total of 59 students who are enrolled in schools in Darby, 1 (1.7%) attend a private institution, while the remaining 58 (98.3%) are enrolled in public schools. The age group of 15 to 17 year olds has the highest likelihood of being enrolled in private schools, with 1 (9.1% in the age bracket) enrolled. Conversely, the age group of 5 to 9 year old has the lowest likelihood of being enrolled in a private school, with 29 (100.0% in the age bracket) attending a public institution.
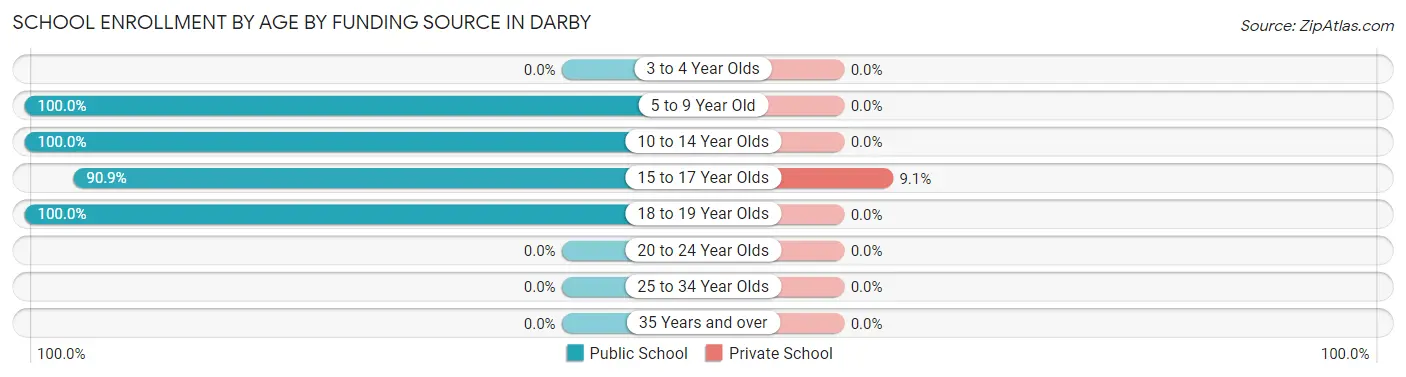
| Age Bracket | Public School | Private School |
| 3 to 4 Year Olds | 0 (0.0%) | 0 (0.0%) |
| 5 to 9 Year Old | 29 (100.0%) | 0 (0.0%) |
| 10 to 14 Year Olds | 9 (100.0%) | 0 (0.0%) |
| 15 to 17 Year Olds | 10 (90.9%) | 1 (9.1%) |
| 18 to 19 Year Olds | 10 (100.0%) | 0 (0.0%) |
| 20 to 24 Year Olds | 0 (0.0%) | 0 (0.0%) |
| 25 to 34 Year Olds | 0 (0.0%) | 0 (0.0%) |
| 35 Years and over | 0 (0.0%) | 0 (0.0%) |
| Total | 58 (98.3%) | 1 (1.7%) |
Educational Attainment by Field of Study in Darby
Psychology (12 | 16.7%), education (12 | 16.7%), arts & humanities (10 | 13.9%), science & technology (9 | 12.5%), and literature & languages (9 | 12.5%) are the most common fields of study among 72 individuals in Darby who have obtained a bachelor's degree or higher.
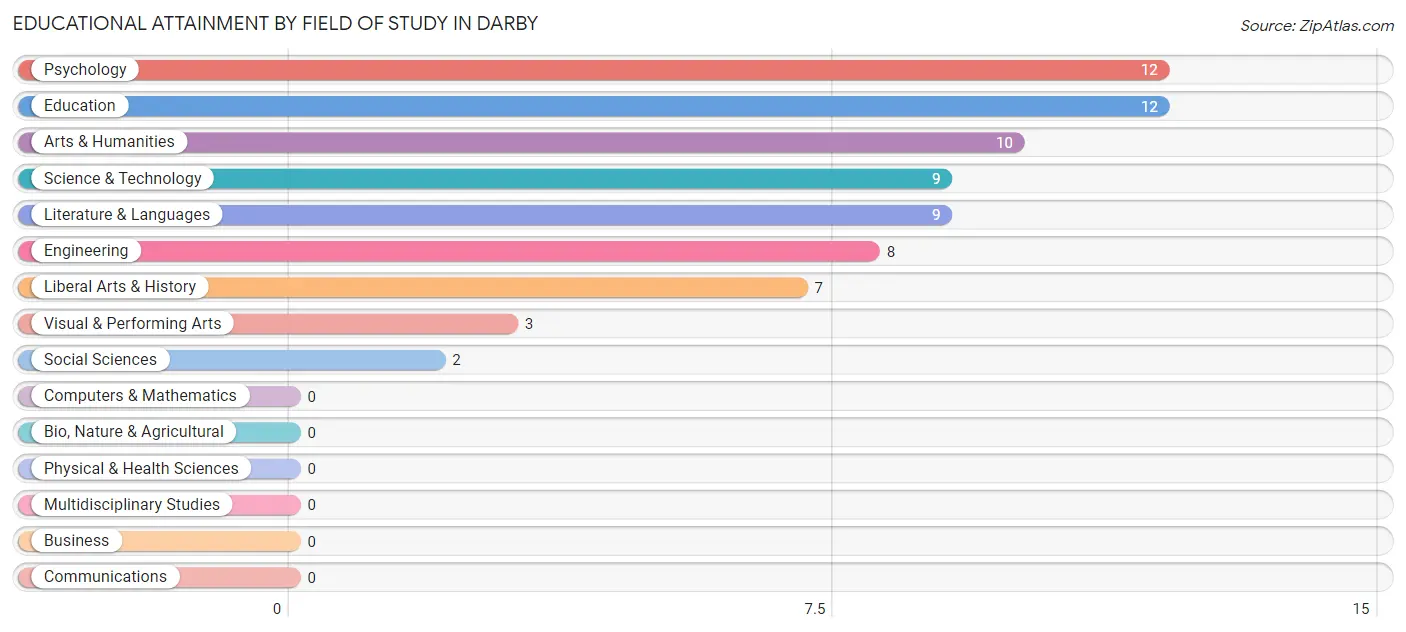
| Field of Study | # Graduates | % Graduates |
| Computers & Mathematics | 0 | 0.0% |
| Bio, Nature & Agricultural | 0 | 0.0% |
| Physical & Health Sciences | 0 | 0.0% |
| Psychology | 12 | 16.7% |
| Social Sciences | 2 | 2.8% |
| Engineering | 8 | 11.1% |
| Multidisciplinary Studies | 0 | 0.0% |
| Science & Technology | 9 | 12.5% |
| Business | 0 | 0.0% |
| Education | 12 | 16.7% |
| Literature & Languages | 9 | 12.5% |
| Liberal Arts & History | 7 | 9.7% |
| Visual & Performing Arts | 3 | 4.2% |
| Communications | 0 | 0.0% |
| Arts & Humanities | 10 | 13.9% |
| Total | 72 | 100.0% |
Transportation & Commute in Darby
Vehicle Availability by Sex in Darby
The most prevalent vehicle ownership categories in Darby are males with 3 vehicles (37, accounting for 26.2%) and females with 3 vehicles (83, making up 29.6%).
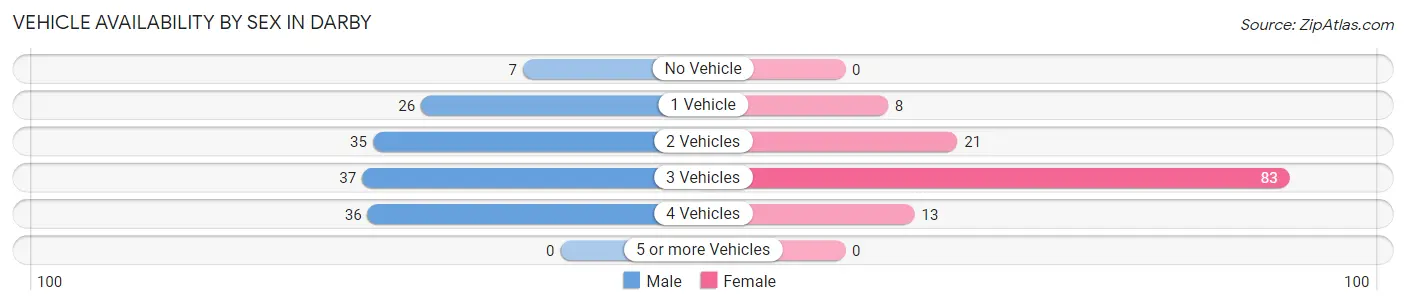
| Vehicles Available | Male | Female |
| No Vehicle | 7 (5.0%) | 0 (0.0%) |
| 1 Vehicle | 26 (18.4%) | 8 (6.4%) |
| 2 Vehicles | 35 (24.8%) | 21 (16.8%) |
| 3 Vehicles | 37 (26.2%) | 83 (66.4%) |
| 4 Vehicles | 36 (25.5%) | 13 (10.4%) |
| 5 or more Vehicles | 0 (0.0%) | 0 (0.0%) |
| Total | 141 (100.0%) | 125 (100.0%) |
Commute Time in Darby
The most frequently occuring commute durations in Darby are 5 to 9 minutes (70 commuters, 27.8%), 30 to 34 minutes (52 commuters, 20.6%), and 25 to 29 minutes (45 commuters, 17.9%).
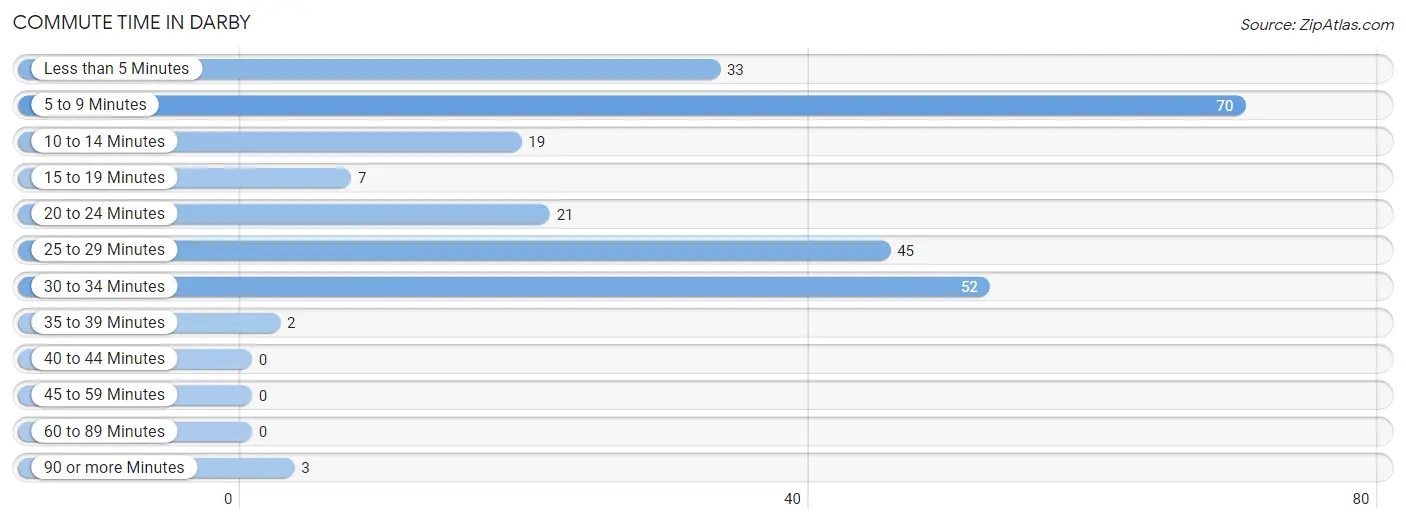
| Commute Time | # Commuters | % Commuters |
| Less than 5 Minutes | 33 | 13.1% |
| 5 to 9 Minutes | 70 | 27.8% |
| 10 to 14 Minutes | 19 | 7.5% |
| 15 to 19 Minutes | 7 | 2.8% |
| 20 to 24 Minutes | 21 | 8.3% |
| 25 to 29 Minutes | 45 | 17.9% |
| 30 to 34 Minutes | 52 | 20.6% |
| 35 to 39 Minutes | 2 | 0.8% |
| 40 to 44 Minutes | 0 | 0.0% |
| 45 to 59 Minutes | 0 | 0.0% |
| 60 to 89 Minutes | 0 | 0.0% |
| 90 or more Minutes | 3 | 1.2% |
Commute Time by Sex in Darby
The most common commute times in Darby are 5 to 9 minutes (47 commuters, 37.6%) for males and 25 to 29 minutes (42 commuters, 33.1%) for females.
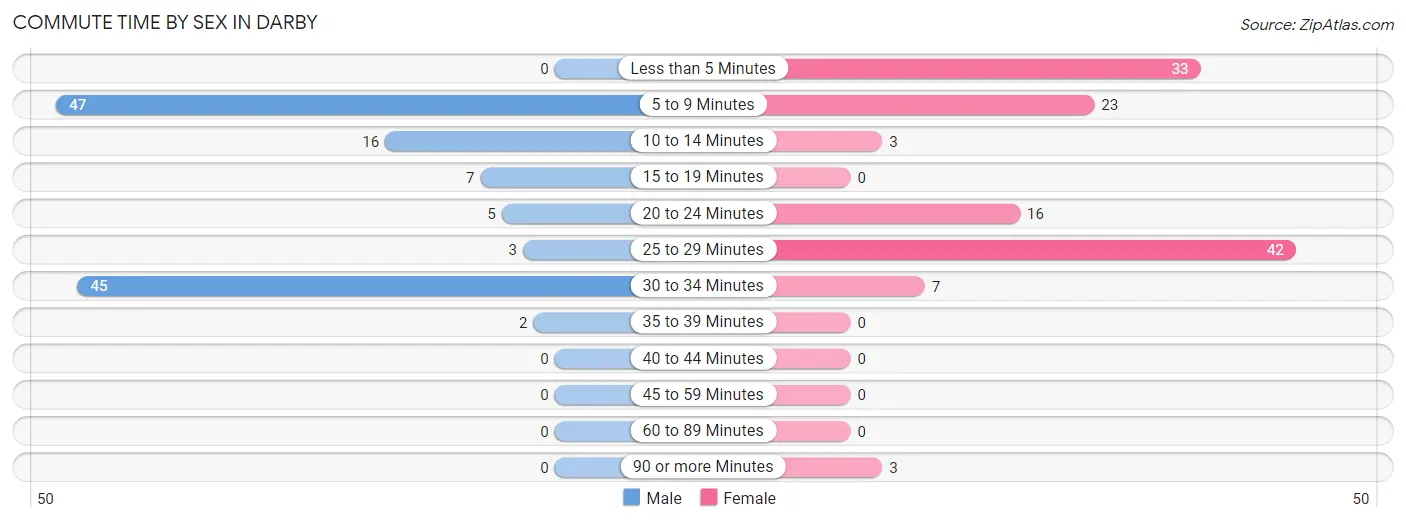
| Commute Time | Male | Female |
| Less than 5 Minutes | 0 (0.0%) | 33 (26.0%) |
| 5 to 9 Minutes | 47 (37.6%) | 23 (18.1%) |
| 10 to 14 Minutes | 16 (12.8%) | 3 (2.4%) |
| 15 to 19 Minutes | 7 (5.6%) | 0 (0.0%) |
| 20 to 24 Minutes | 5 (4.0%) | 16 (12.6%) |
| 25 to 29 Minutes | 3 (2.4%) | 42 (33.1%) |
| 30 to 34 Minutes | 45 (36.0%) | 7 (5.5%) |
| 35 to 39 Minutes | 2 (1.6%) | 0 (0.0%) |
| 40 to 44 Minutes | 0 (0.0%) | 0 (0.0%) |
| 45 to 59 Minutes | 0 (0.0%) | 0 (0.0%) |
| 60 to 89 Minutes | 0 (0.0%) | 0 (0.0%) |
| 90 or more Minutes | 0 (0.0%) | 3 (2.4%) |
Time of Departure to Work by Sex in Darby
The most frequent times of departure to work in Darby are 7:30 AM to 7:59 AM (62, 49.6%) for males and 7:30 AM to 7:59 AM (67, 52.8%) for females.
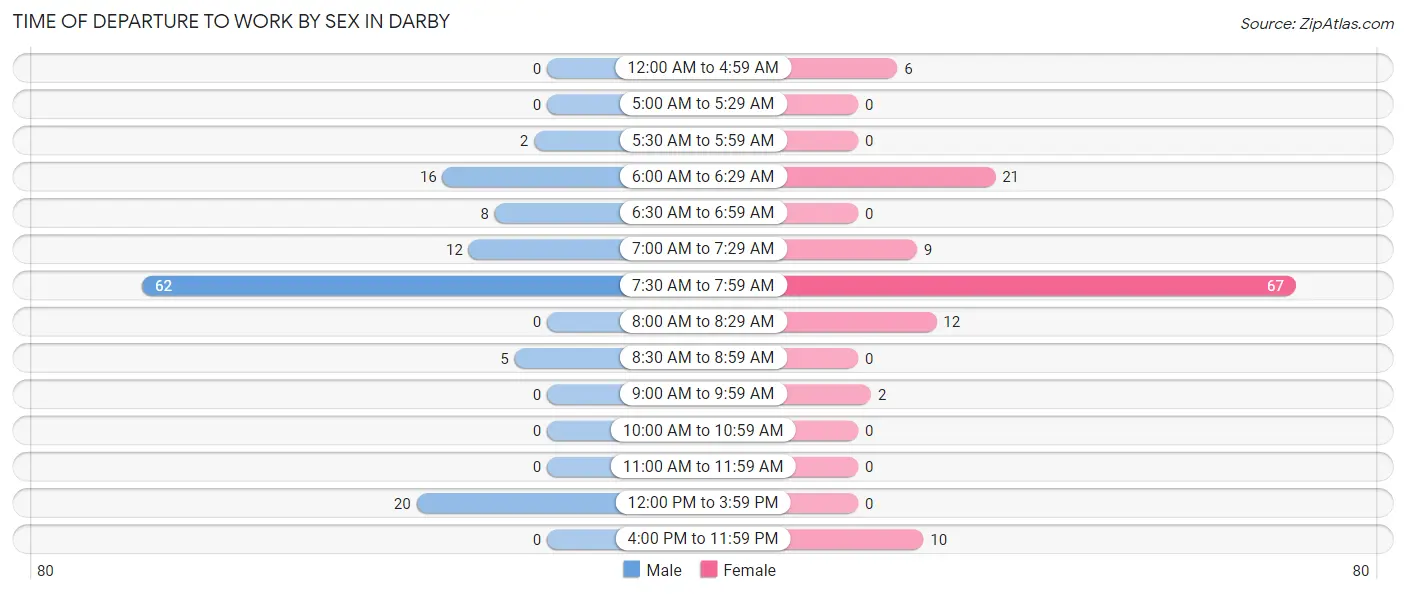
| Time of Departure | Male | Female |
| 12:00 AM to 4:59 AM | 0 (0.0%) | 6 (4.7%) |
| 5:00 AM to 5:29 AM | 0 (0.0%) | 0 (0.0%) |
| 5:30 AM to 5:59 AM | 2 (1.6%) | 0 (0.0%) |
| 6:00 AM to 6:29 AM | 16 (12.8%) | 21 (16.5%) |
| 6:30 AM to 6:59 AM | 8 (6.4%) | 0 (0.0%) |
| 7:00 AM to 7:29 AM | 12 (9.6%) | 9 (7.1%) |
| 7:30 AM to 7:59 AM | 62 (49.6%) | 67 (52.8%) |
| 8:00 AM to 8:29 AM | 0 (0.0%) | 12 (9.5%) |
| 8:30 AM to 8:59 AM | 5 (4.0%) | 0 (0.0%) |
| 9:00 AM to 9:59 AM | 0 (0.0%) | 2 (1.6%) |
| 10:00 AM to 10:59 AM | 0 (0.0%) | 0 (0.0%) |
| 11:00 AM to 11:59 AM | 0 (0.0%) | 0 (0.0%) |
| 12:00 PM to 3:59 PM | 20 (16.0%) | 0 (0.0%) |
| 4:00 PM to 11:59 PM | 0 (0.0%) | 10 (7.9%) |
| Total | 125 (100.0%) | 127 (100.0%) |
Housing Occupancy in Darby
Occupancy by Ownership in Darby
Of the total 333 dwellings in Darby, owner-occupied units account for 157 (47.1%), while renter-occupied units make up 176 (52.8%).
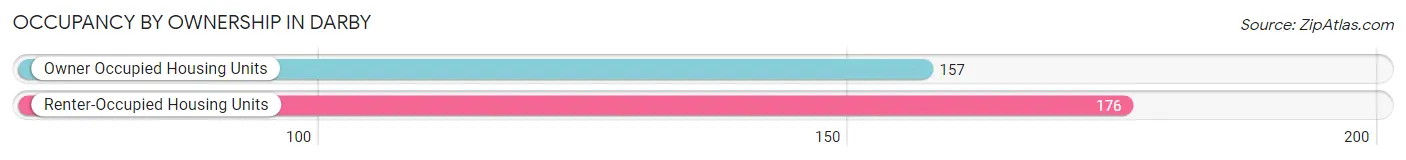
| Occupancy | # Housing Units | % Housing Units |
| Owner Occupied Housing Units | 157 | 47.1% |
| Renter-Occupied Housing Units | 176 | 52.8% |
| Total Occupied Housing Units | 333 | 100.0% |
Occupancy by Household Size in Darby
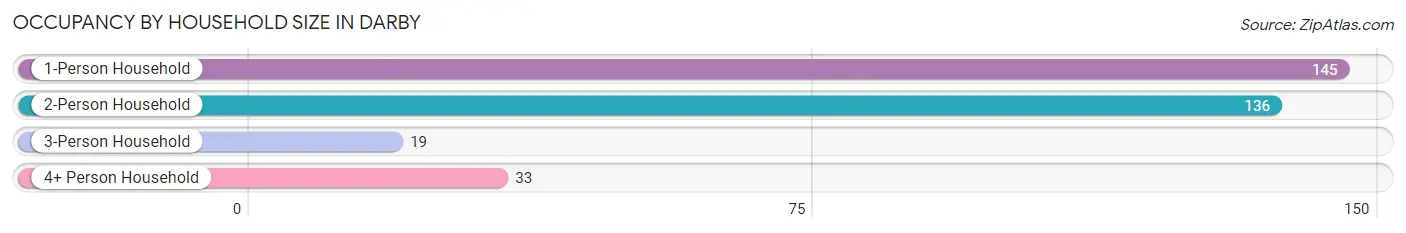
| Household Size | # Housing Units | % Housing Units |
| 1-Person Household | 145 | 43.5% |
| 2-Person Household | 136 | 40.8% |
| 3-Person Household | 19 | 5.7% |
| 4+ Person Household | 33 | 9.9% |
| Total Housing Units | 333 | 100.0% |
Occupancy by Ownership by Household Size in Darby
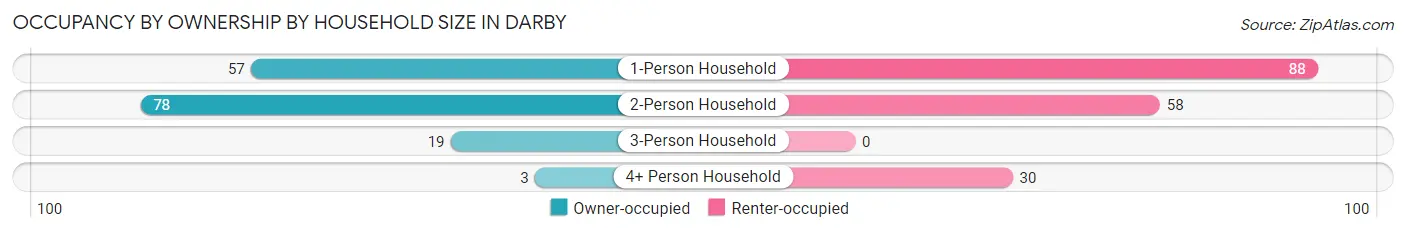
| Household Size | Owner-occupied | Renter-occupied |
| 1-Person Household | 57 (39.3%) | 88 (60.7%) |
| 2-Person Household | 78 (57.4%) | 58 (42.6%) |
| 3-Person Household | 19 (100.0%) | 0 (0.0%) |
| 4+ Person Household | 3 (9.1%) | 30 (90.9%) |
| Total Housing Units | 157 (47.1%) | 176 (52.8%) |
Occupancy by Educational Attainment in Darby
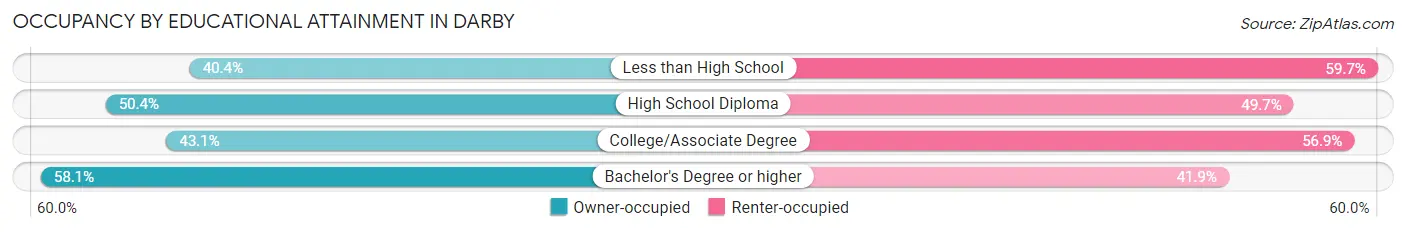
| Household Size | Owner-occupied | Renter-occupied |
| Less than High School | 23 (40.4%) | 34 (59.7%) |
| High School Diploma | 72 (50.3%) | 71 (49.6%) |
| College/Associate Degree | 44 (43.1%) | 58 (56.9%) |
| Bachelor's Degree or higher | 18 (58.1%) | 13 (41.9%) |
Occupancy by Age of Householder in Darby
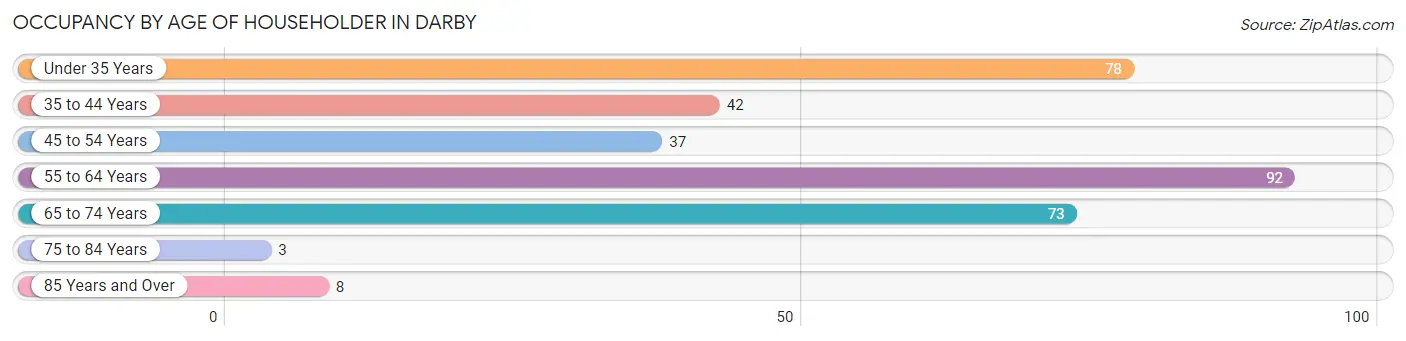
| Age Bracket | # Households | % Households |
| Under 35 Years | 78 | 23.4% |
| 35 to 44 Years | 42 | 12.6% |
| 45 to 54 Years | 37 | 11.1% |
| 55 to 64 Years | 92 | 27.6% |
| 65 to 74 Years | 73 | 21.9% |
| 75 to 84 Years | 3 | 0.9% |
| 85 Years and Over | 8 | 2.4% |
| Total | 333 | 100.0% |
Housing Finances in Darby
Median Income by Occupancy in Darby
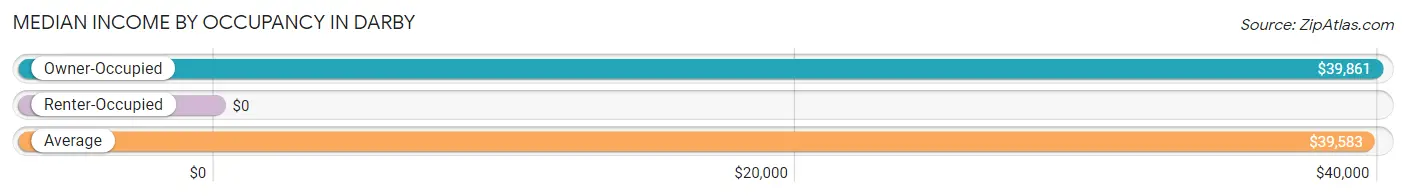
| Occupancy Type | # Households | Median Income |
| Owner-Occupied | 157 (47.1%) | $39,861 |
| Renter-Occupied | 176 (52.8%) | $0 |
| Average | 333 (100.0%) | $39,583 |
Occupancy by Householder Income Bracket in Darby
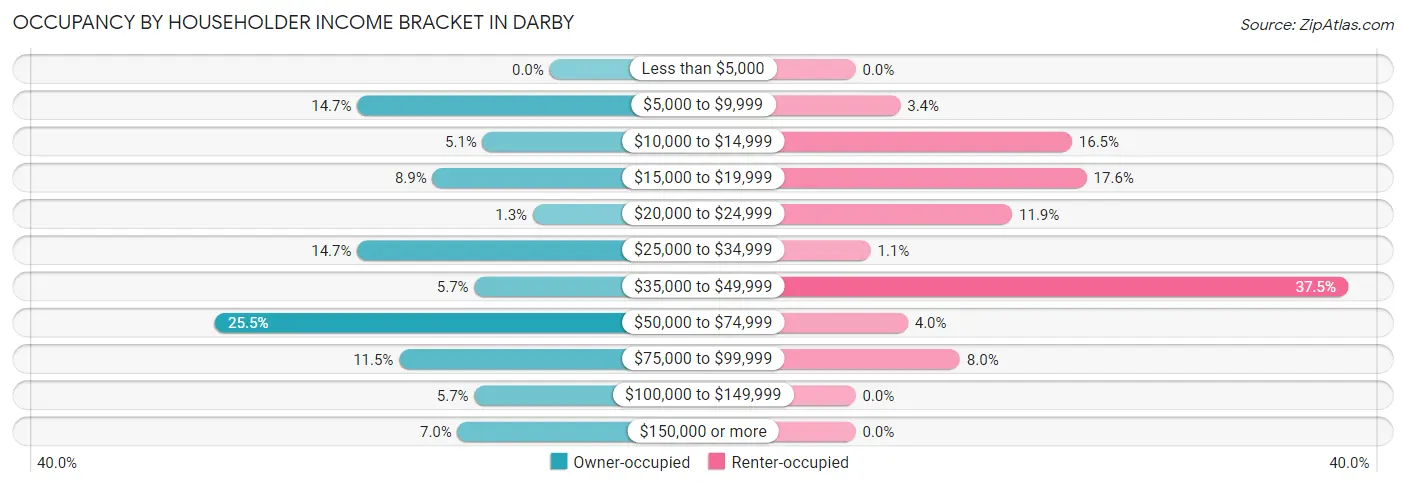
| Income Bracket | Owner-occupied | Renter-occupied |
| Less than $5,000 | 0 (0.0%) | 0 (0.0%) |
| $5,000 to $9,999 | 23 (14.6%) | 6 (3.4%) |
| $10,000 to $14,999 | 8 (5.1%) | 29 (16.5%) |
| $15,000 to $19,999 | 14 (8.9%) | 31 (17.6%) |
| $20,000 to $24,999 | 2 (1.3%) | 21 (11.9%) |
| $25,000 to $34,999 | 23 (14.6%) | 2 (1.1%) |
| $35,000 to $49,999 | 9 (5.7%) | 66 (37.5%) |
| $50,000 to $74,999 | 40 (25.5%) | 7 (4.0%) |
| $75,000 to $99,999 | 18 (11.5%) | 14 (8.0%) |
| $100,000 to $149,999 | 9 (5.7%) | 0 (0.0%) |
| $150,000 or more | 11 (7.0%) | 0 (0.0%) |
| Total | 157 (100.0%) | 176 (100.0%) |
Monthly Housing Cost Tiers in Darby
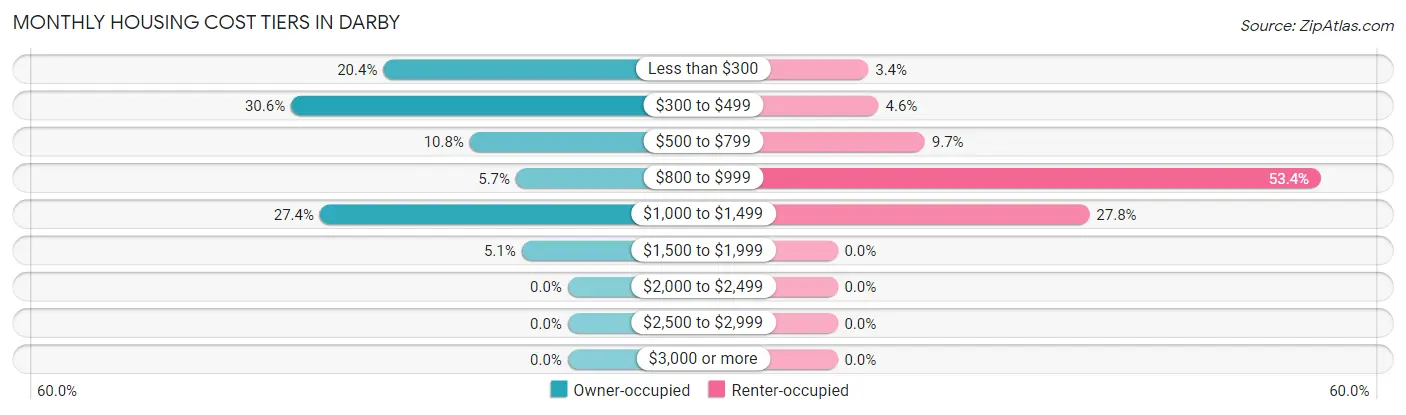
| Monthly Cost | Owner-occupied | Renter-occupied |
| Less than $300 | 32 (20.4%) | 6 (3.4%) |
| $300 to $499 | 48 (30.6%) | 8 (4.5%) |
| $500 to $799 | 17 (10.8%) | 17 (9.7%) |
| $800 to $999 | 9 (5.7%) | 94 (53.4%) |
| $1,000 to $1,499 | 43 (27.4%) | 49 (27.8%) |
| $1,500 to $1,999 | 8 (5.1%) | 0 (0.0%) |
| $2,000 to $2,499 | 0 (0.0%) | 0 (0.0%) |
| $2,500 to $2,999 | 0 (0.0%) | 0 (0.0%) |
| $3,000 or more | 0 (0.0%) | 0 (0.0%) |
| Total | 157 (100.0%) | 176 (100.0%) |
Physical Housing Characteristics in Darby
Housing Structures in Darby
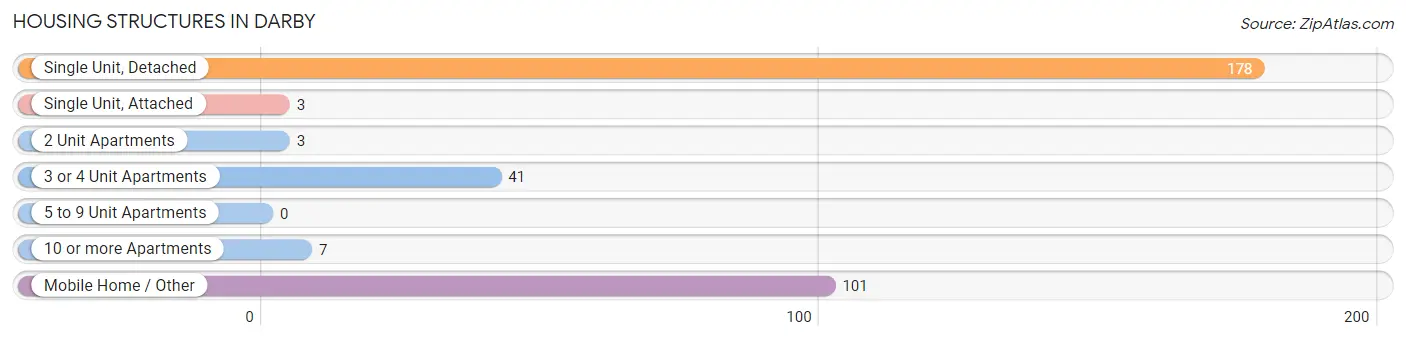
| Structure Type | # Housing Units | % Housing Units |
| Single Unit, Detached | 178 | 53.4% |
| Single Unit, Attached | 3 | 0.9% |
| 2 Unit Apartments | 3 | 0.9% |
| 3 or 4 Unit Apartments | 41 | 12.3% |
| 5 to 9 Unit Apartments | 0 | 0.0% |
| 10 or more Apartments | 7 | 2.1% |
| Mobile Home / Other | 101 | 30.3% |
| Total | 333 | 100.0% |
Housing Structures by Occupancy in Darby
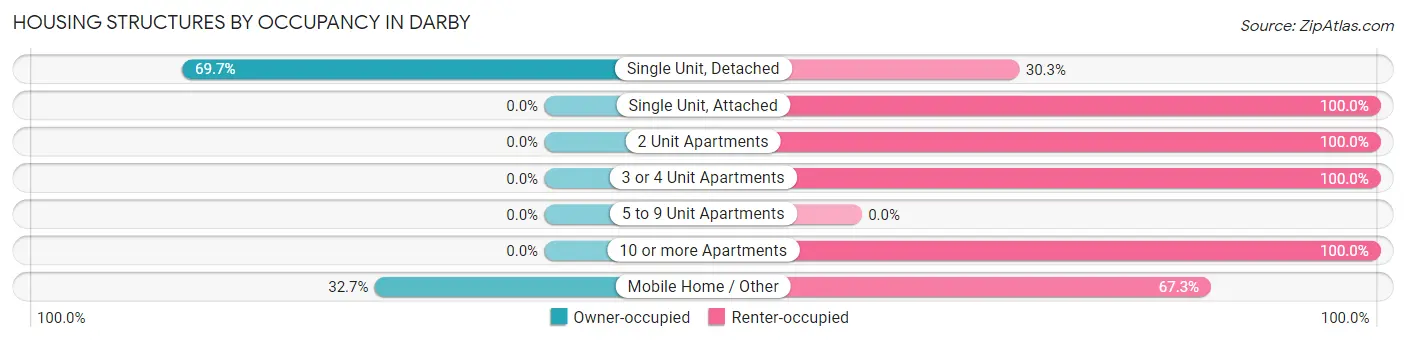
| Structure Type | Owner-occupied | Renter-occupied |
| Single Unit, Detached | 124 (69.7%) | 54 (30.3%) |
| Single Unit, Attached | 0 (0.0%) | 3 (100.0%) |
| 2 Unit Apartments | 0 (0.0%) | 3 (100.0%) |
| 3 or 4 Unit Apartments | 0 (0.0%) | 41 (100.0%) |
| 5 to 9 Unit Apartments | 0 (0.0%) | 0 (0.0%) |
| 10 or more Apartments | 0 (0.0%) | 7 (100.0%) |
| Mobile Home / Other | 33 (32.7%) | 68 (67.3%) |
| Total | 157 (47.1%) | 176 (52.8%) |
Housing Structures by Number of Rooms in Darby
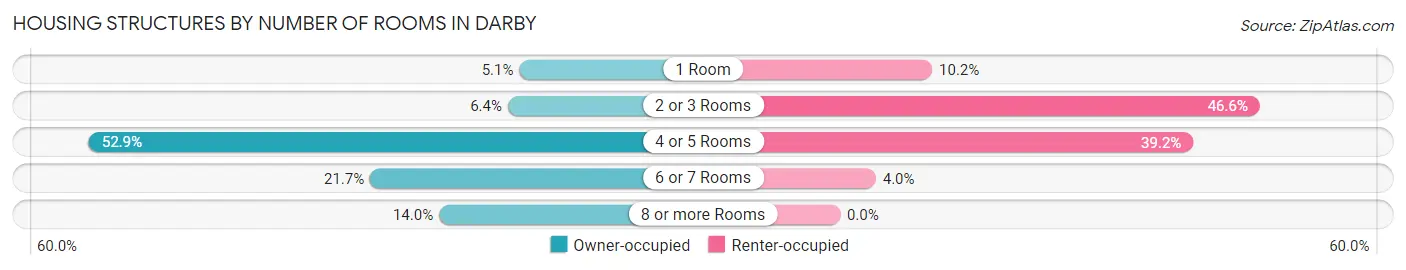
| Number of Rooms | Owner-occupied | Renter-occupied |
| 1 Room | 8 (5.1%) | 18 (10.2%) |
| 2 or 3 Rooms | 10 (6.4%) | 82 (46.6%) |
| 4 or 5 Rooms | 83 (52.9%) | 69 (39.2%) |
| 6 or 7 Rooms | 34 (21.7%) | 7 (4.0%) |
| 8 or more Rooms | 22 (14.0%) | 0 (0.0%) |
| Total | 157 (100.0%) | 176 (100.0%) |
Housing Structure by Heating Type in Darby
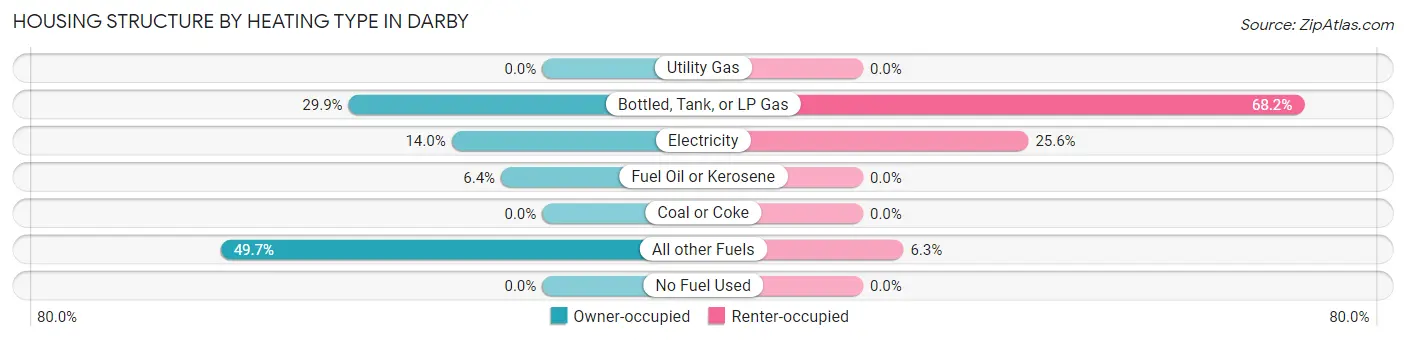
| Heating Type | Owner-occupied | Renter-occupied |
| Utility Gas | 0 (0.0%) | 0 (0.0%) |
| Bottled, Tank, or LP Gas | 47 (29.9%) | 120 (68.2%) |
| Electricity | 22 (14.0%) | 45 (25.6%) |
| Fuel Oil or Kerosene | 10 (6.4%) | 0 (0.0%) |
| Coal or Coke | 0 (0.0%) | 0 (0.0%) |
| All other Fuels | 78 (49.7%) | 11 (6.2%) |
| No Fuel Used | 0 (0.0%) | 0 (0.0%) |
| Total | 157 (100.0%) | 176 (100.0%) |
Household Vehicle Usage in Darby
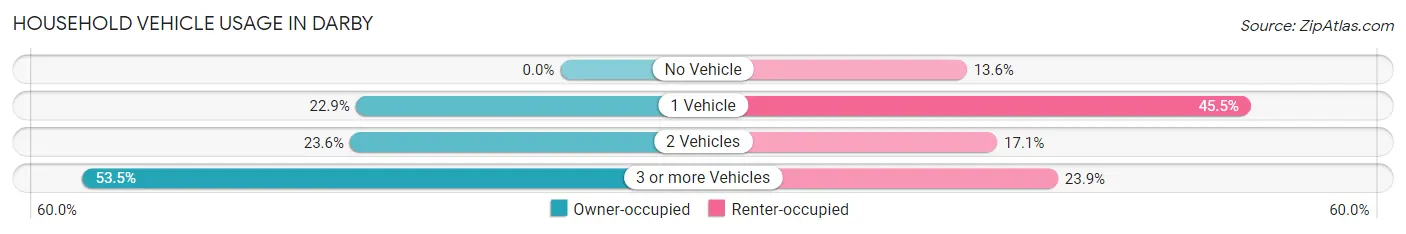
| Vehicles per Household | Owner-occupied | Renter-occupied |
| No Vehicle | 0 (0.0%) | 24 (13.6%) |
| 1 Vehicle | 36 (22.9%) | 80 (45.5%) |
| 2 Vehicles | 37 (23.6%) | 30 (17.1%) |
| 3 or more Vehicles | 84 (53.5%) | 42 (23.9%) |
| Total | 157 (100.0%) | 176 (100.0%) |
Real Estate & Mortgages in Darby
Real Estate and Mortgage Overview in Darby
| Characteristic | Without Mortgage | With Mortgage |
| Housing Units | 98 | 59 |
| Median Property Value | $166,700 | $222,500 |
| Median Household Income | $30,833 | $0 |
| Monthly Housing Costs | $331 | $0 |
| Real Estate Taxes | $811 | $0 |
Property Value by Mortgage Status in Darby
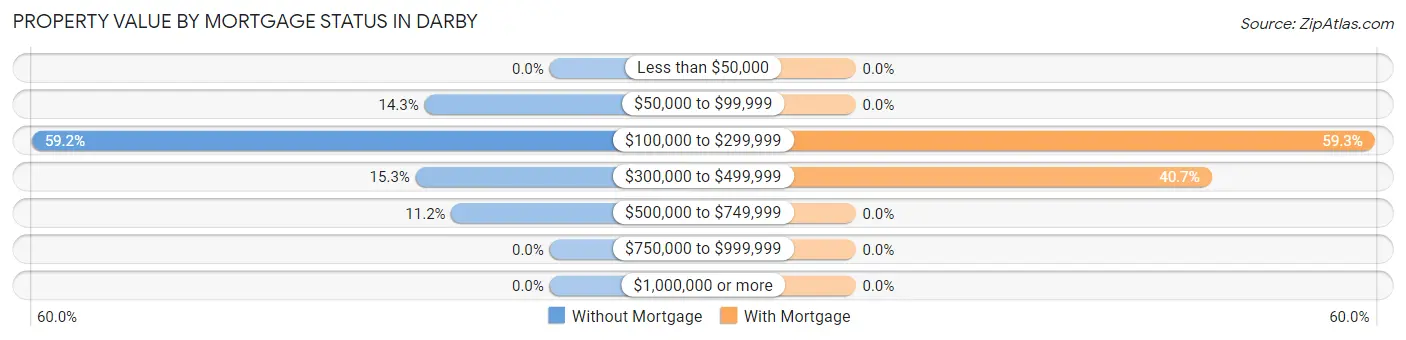
| Property Value | Without Mortgage | With Mortgage |
| Less than $50,000 | 0 (0.0%) | 0 (0.0%) |
| $50,000 to $99,999 | 14 (14.3%) | 0 (0.0%) |
| $100,000 to $299,999 | 58 (59.2%) | 35 (59.3%) |
| $300,000 to $499,999 | 15 (15.3%) | 24 (40.7%) |
| $500,000 to $749,999 | 11 (11.2%) | 0 (0.0%) |
| $750,000 to $999,999 | 0 (0.0%) | 0 (0.0%) |
| $1,000,000 or more | 0 (0.0%) | 0 (0.0%) |
| Total | 98 (100.0%) | 59 (100.0%) |
Household Income by Mortgage Status in Darby
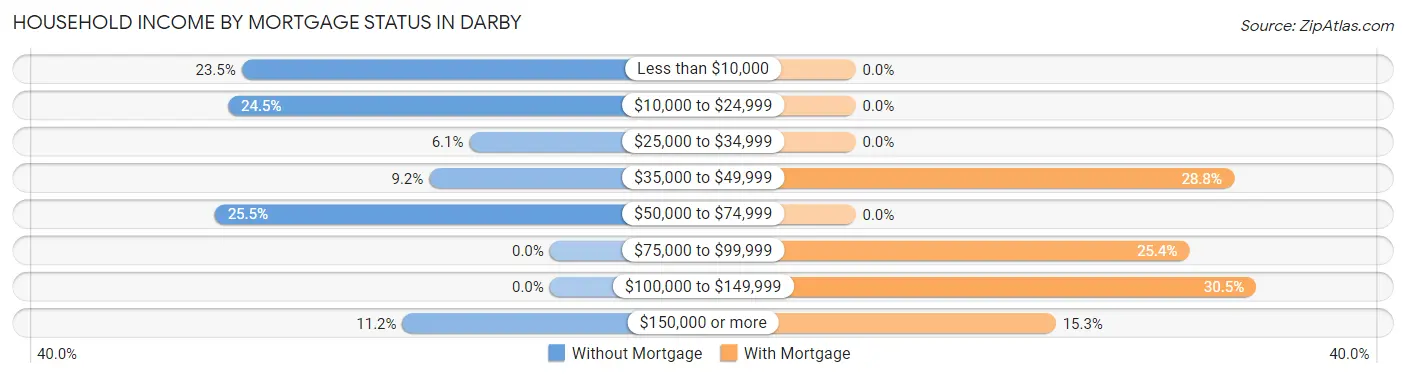
| Household Income | Without Mortgage | With Mortgage |
| Less than $10,000 | 23 (23.5%) | 0 (0.0%) |
| $10,000 to $24,999 | 24 (24.5%) | 0 (0.0%) |
| $25,000 to $34,999 | 6 (6.1%) | 0 (0.0%) |
| $35,000 to $49,999 | 9 (9.2%) | 17 (28.8%) |
| $50,000 to $74,999 | 25 (25.5%) | 0 (0.0%) |
| $75,000 to $99,999 | 0 (0.0%) | 15 (25.4%) |
| $100,000 to $149,999 | 0 (0.0%) | 18 (30.5%) |
| $150,000 or more | 11 (11.2%) | 9 (15.2%) |
| Total | 98 (100.0%) | 59 (100.0%) |
Property Value to Household Income Ratio in Darby
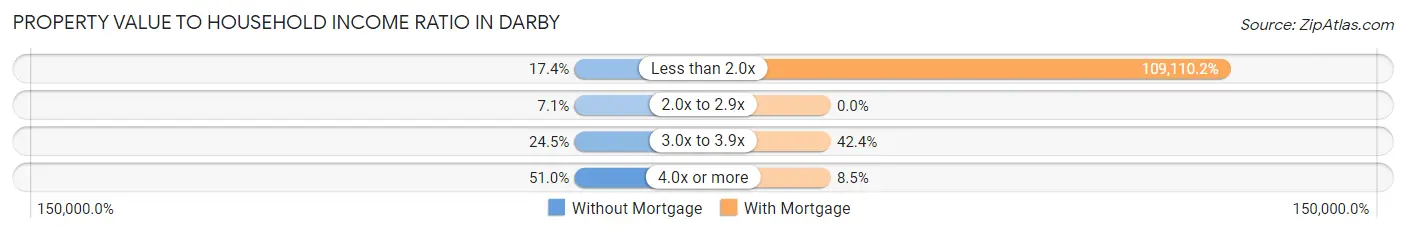
| Value-to-Income Ratio | Without Mortgage | With Mortgage |
| Less than 2.0x | 17 (17.3%) | 64,375 (109,110.2%) |
| 2.0x to 2.9x | 7 (7.1%) | 0 (0.0%) |
| 3.0x to 3.9x | 24 (24.5%) | 25 (42.4%) |
| 4.0x or more | 50 (51.0%) | 5 (8.5%) |
| Total | 98 (100.0%) | 59 (100.0%) |
Real Estate Taxes by Mortgage Status in Darby
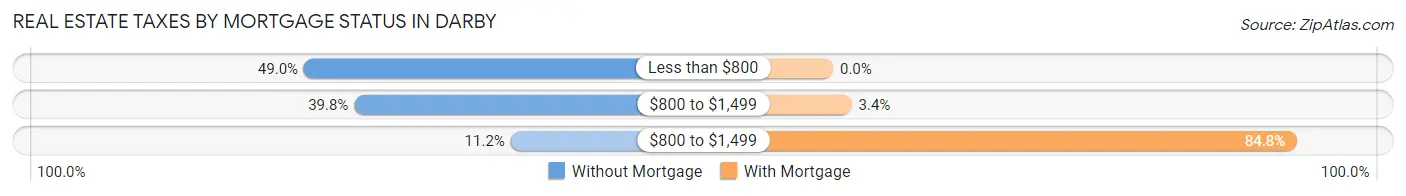
| Property Taxes | Without Mortgage | With Mortgage |
| Less than $800 | 48 (49.0%) | 0 (0.0%) |
| $800 to $1,499 | 39 (39.8%) | 2 (3.4%) |
| $800 to $1,499 | 11 (11.2%) | 50 (84.8%) |
| Total | 98 (100.0%) | 59 (100.0%) |
Health & Disability in Darby
Health Insurance Coverage by Age in Darby
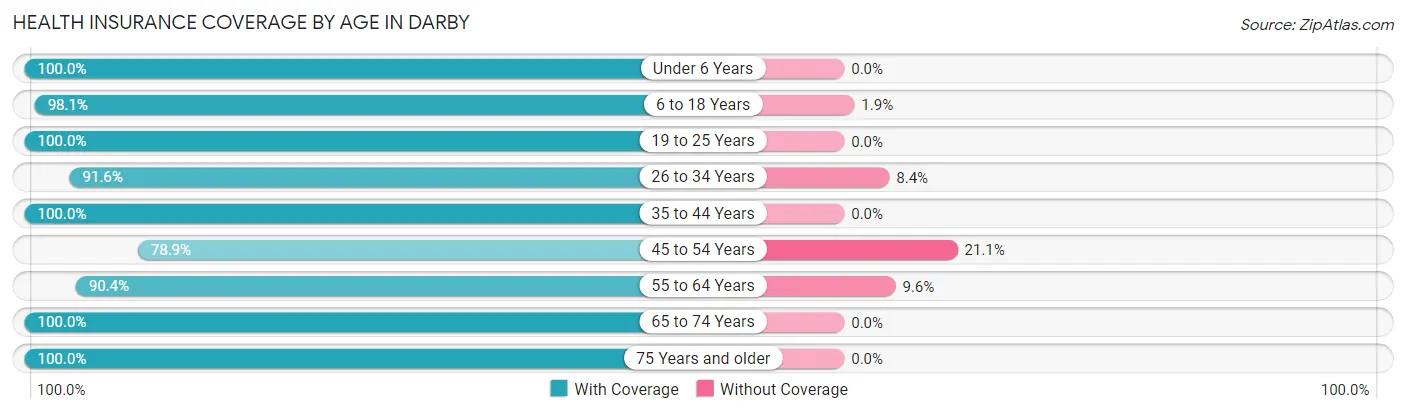
| Age Bracket | With Coverage | Without Coverage |
| Under 6 Years | 19 (100.0%) | 0 (0.0%) |
| 6 to 18 Years | 52 (98.1%) | 1 (1.9%) |
| 19 to 25 Years | 1 (100.0%) | 0 (0.0%) |
| 26 to 34 Years | 120 (91.6%) | 11 (8.4%) |
| 35 to 44 Years | 72 (100.0%) | 0 (0.0%) |
| 45 to 54 Years | 56 (78.9%) | 15 (21.1%) |
| 55 to 64 Years | 123 (90.4%) | 13 (9.6%) |
| 65 to 74 Years | 103 (100.0%) | 0 (0.0%) |
| 75 Years and older | 24 (100.0%) | 0 (0.0%) |
| Total | 570 (93.4%) | 40 (6.6%) |
Health Insurance Coverage by Citizenship Status in Darby
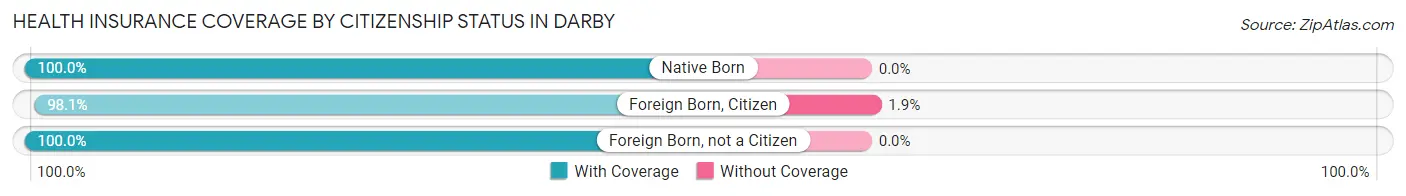
| Citizenship Status | With Coverage | Without Coverage |
| Native Born | 19 (100.0%) | 0 (0.0%) |
| Foreign Born, Citizen | 52 (98.1%) | 1 (1.9%) |
| Foreign Born, not a Citizen | 1 (100.0%) | 0 (0.0%) |
Health Insurance Coverage by Household Income in Darby
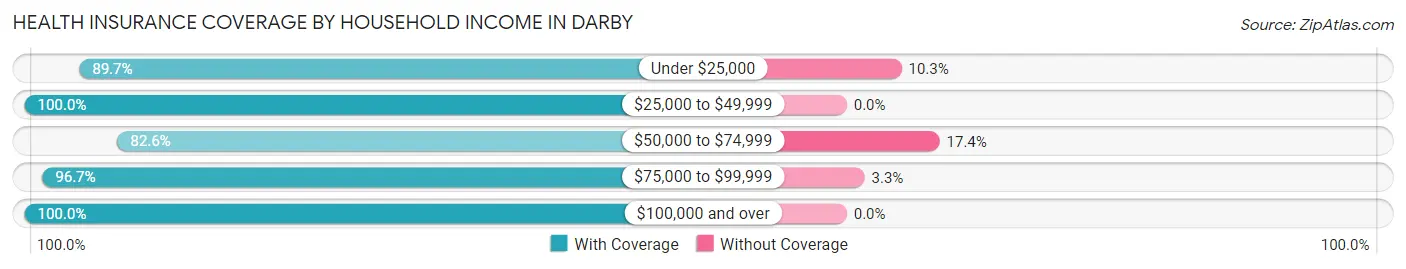
| Household Income | With Coverage | Without Coverage |
| Under $25,000 | 140 (89.7%) | 16 (10.3%) |
| $25,000 to $49,999 | 191 (100.0%) | 0 (0.0%) |
| $50,000 to $74,999 | 95 (82.6%) | 20 (17.4%) |
| $75,000 to $99,999 | 87 (96.7%) | 3 (3.3%) |
| $100,000 and over | 53 (100.0%) | 0 (0.0%) |
Public vs Private Health Insurance Coverage by Age in Darby
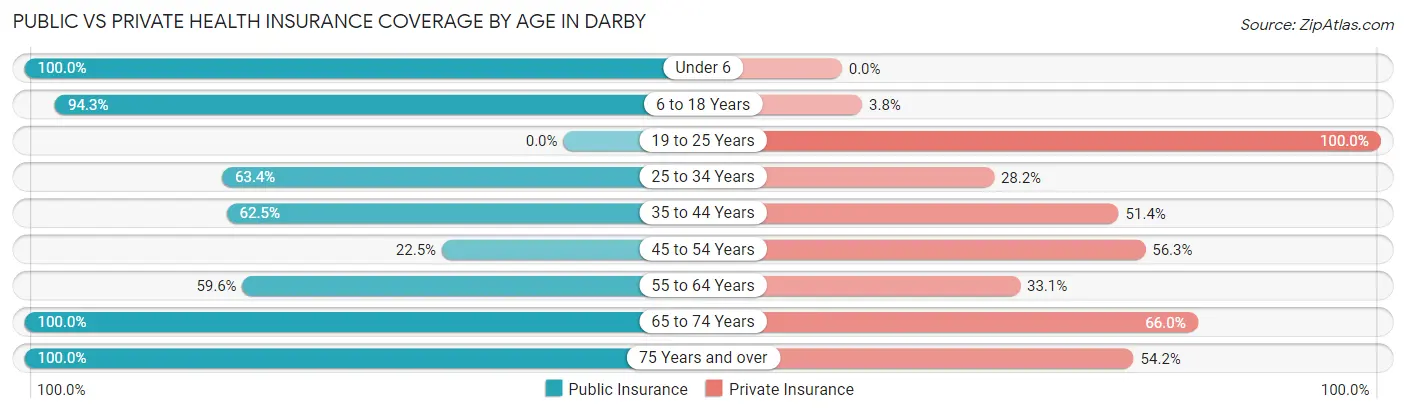
| Age Bracket | Public Insurance | Private Insurance |
| Under 6 | 19 (100.0%) | 0 (0.0%) |
| 6 to 18 Years | 50 (94.3%) | 2 (3.8%) |
| 19 to 25 Years | 0 (0.0%) | 1 (100.0%) |
| 25 to 34 Years | 83 (63.4%) | 37 (28.2%) |
| 35 to 44 Years | 45 (62.5%) | 37 (51.4%) |
| 45 to 54 Years | 16 (22.5%) | 40 (56.3%) |
| 55 to 64 Years | 81 (59.6%) | 45 (33.1%) |
| 65 to 74 Years | 103 (100.0%) | 68 (66.0%) |
| 75 Years and over | 24 (100.0%) | 13 (54.2%) |
| Total | 421 (69.0%) | 243 (39.8%) |
Disability Status by Sex by Age in Darby
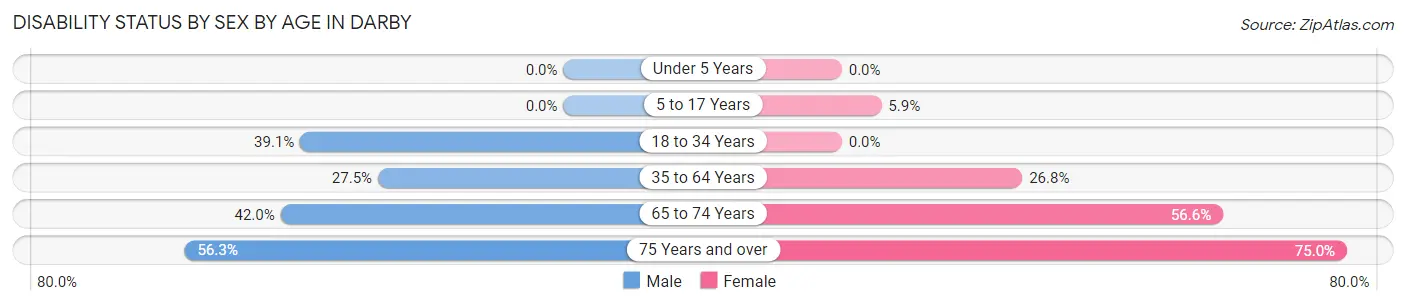
| Age Bracket | Male | Female |
| Under 5 Years | 0 (0.0%) | 0 (0.0%) |
| 5 to 17 Years | 0 (0.0%) | 1 (5.9%) |
| 18 to 34 Years | 34 (39.1%) | 0 (0.0%) |
| 35 to 64 Years | 46 (27.5%) | 30 (26.8%) |
| 65 to 74 Years | 21 (42.0%) | 30 (56.6%) |
| 75 Years and over | 9 (56.2%) | 6 (75.0%) |
Disability Class by Sex by Age in Darby
Disability Class: Hearing Difficulty
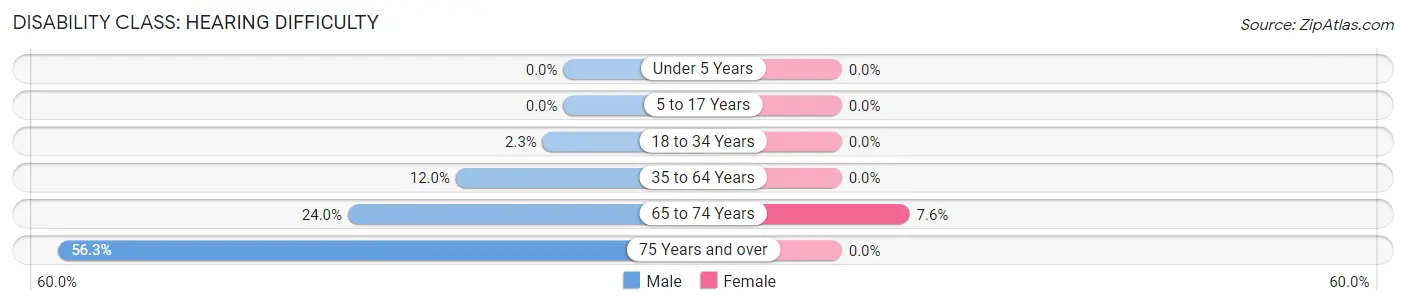
| Age Bracket | Male | Female |
| Under 5 Years | 0 (0.0%) | 0 (0.0%) |
| 5 to 17 Years | 0 (0.0%) | 0 (0.0%) |
| 18 to 34 Years | 2 (2.3%) | 0 (0.0%) |
| 35 to 64 Years | 20 (12.0%) | 0 (0.0%) |
| 65 to 74 Years | 12 (24.0%) | 4 (7.5%) |
| 75 Years and over | 9 (56.2%) | 0 (0.0%) |
Disability Class: Vision Difficulty
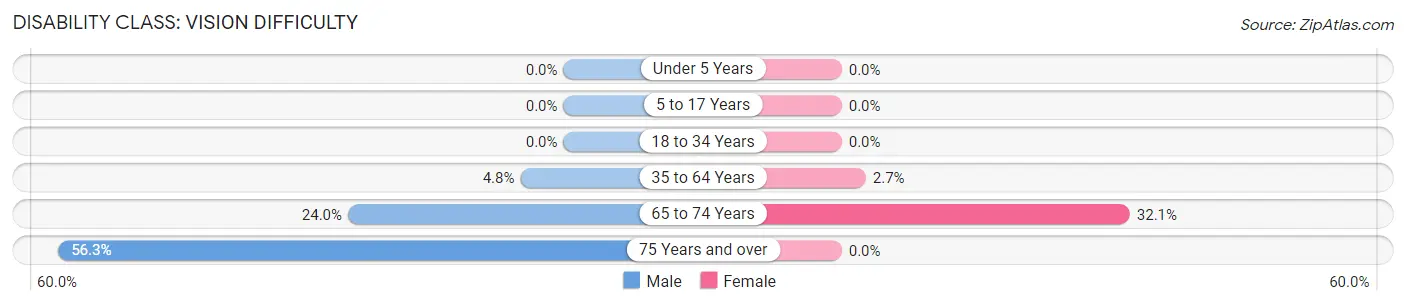
| Age Bracket | Male | Female |
| Under 5 Years | 0 (0.0%) | 0 (0.0%) |
| 5 to 17 Years | 0 (0.0%) | 0 (0.0%) |
| 18 to 34 Years | 0 (0.0%) | 0 (0.0%) |
| 35 to 64 Years | 8 (4.8%) | 3 (2.7%) |
| 65 to 74 Years | 12 (24.0%) | 17 (32.1%) |
| 75 Years and over | 9 (56.2%) | 0 (0.0%) |
Disability Class: Cognitive Difficulty
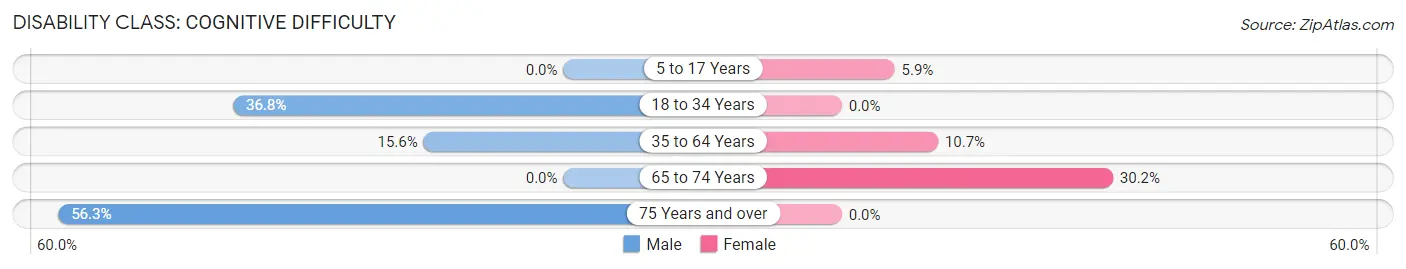
| Age Bracket | Male | Female |
| 5 to 17 Years | 0 (0.0%) | 1 (5.9%) |
| 18 to 34 Years | 32 (36.8%) | 0 (0.0%) |
| 35 to 64 Years | 26 (15.6%) | 12 (10.7%) |
| 65 to 74 Years | 0 (0.0%) | 16 (30.2%) |
| 75 Years and over | 9 (56.2%) | 0 (0.0%) |
Disability Class: Ambulatory Difficulty
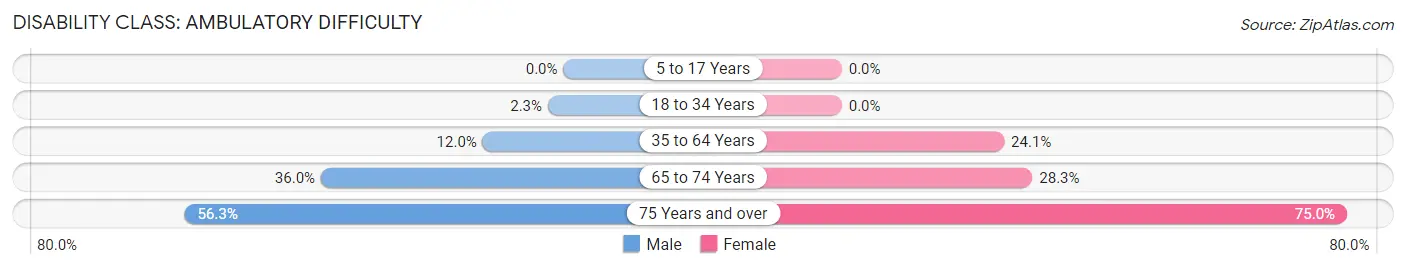
| Age Bracket | Male | Female |
| 5 to 17 Years | 0 (0.0%) | 0 (0.0%) |
| 18 to 34 Years | 2 (2.3%) | 0 (0.0%) |
| 35 to 64 Years | 20 (12.0%) | 27 (24.1%) |
| 65 to 74 Years | 18 (36.0%) | 15 (28.3%) |
| 75 Years and over | 9 (56.2%) | 6 (75.0%) |
Disability Class: Self-Care Difficulty
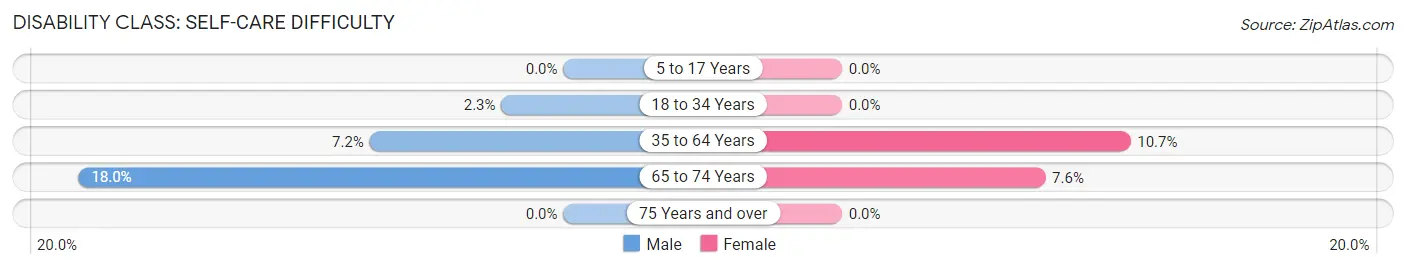
| Age Bracket | Male | Female |
| 5 to 17 Years | 0 (0.0%) | 0 (0.0%) |
| 18 to 34 Years | 2 (2.3%) | 0 (0.0%) |
| 35 to 64 Years | 12 (7.2%) | 12 (10.7%) |
| 65 to 74 Years | 9 (18.0%) | 4 (7.5%) |
| 75 Years and over | 0 (0.0%) | 0 (0.0%) |
Technology Access in Darby
Computing Device Access in Darby
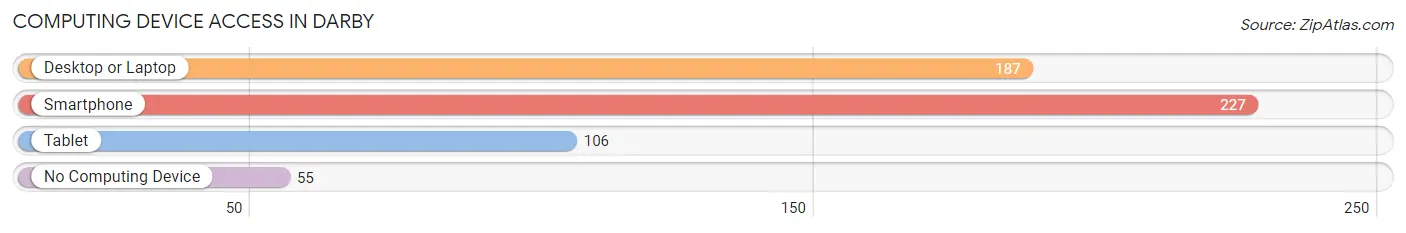
| Device Type | # Households | % Households |
| Desktop or Laptop | 187 | 56.2% |
| Smartphone | 227 | 68.2% |
| Tablet | 106 | 31.8% |
| No Computing Device | 55 | 16.5% |
| Total | 333 | 100.0% |
Internet Access in Darby
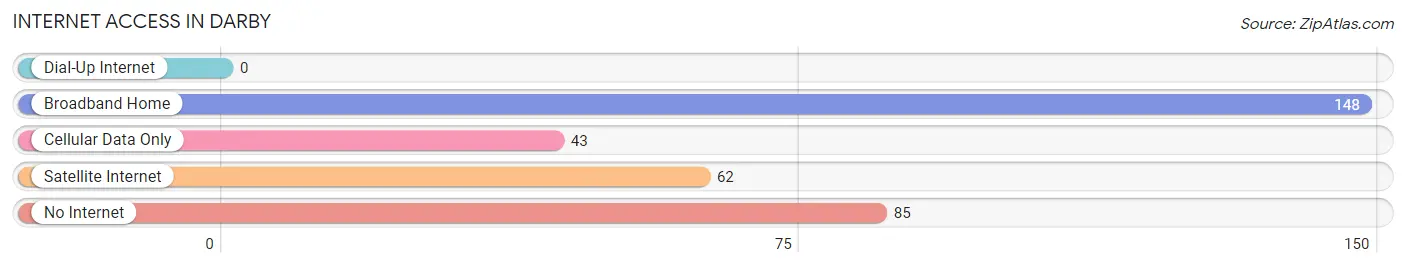
| Internet Type | # Households | % Households |
| Dial-Up Internet | 0 | 0.0% |
| Broadband Home | 148 | 44.4% |
| Cellular Data Only | 43 | 12.9% |
| Satellite Internet | 62 | 18.6% |
| No Internet | 85 | 25.5% |
| Total | 333 | 100.0% |
Darby Summary
Darby, Montana is a small town located in the Bitterroot Valley of Ravalli County, Montana. The town is situated at the confluence of the East and West forks of the Bitterroot River, and is surrounded by the Bitterroot Mountains. The town has a population of 1,072 people, according to the 2010 census.
History
The area around Darby was first inhabited by the Salish-Kootenai people, who lived in the area for thousands of years before the arrival of European settlers. The first European settlers arrived in the area in the late 1800s, and the town of Darby was officially founded in 1891. The town was named after the nearby Darby Creek, which was named after a local rancher, John Darby.
The town quickly grew, and by the early 1900s, it had become a bustling center of commerce and industry. The town was home to several sawmills, a flour mill, a creamery, and a number of other businesses. The town also had a railroad station, which connected it to the rest of the state.
In the early 1900s, the town was also home to a large Chinese population, which had come to the area to work in the mines and on the railroads. The Chinese population eventually dwindled, and by the 1950s, the town had become predominantly white.
Geography
Darby is located in the Bitterroot Valley of Ravalli County, Montana. The town is situated at the confluence of the East and West forks of the Bitterroot River, and is surrounded by the Bitterroot Mountains. The town is located at an elevation of 3,845 feet, and has a total area of 1.2 square miles.
The climate in Darby is semi-arid, with hot summers and cold winters. The average annual temperature is 44.3 degrees Fahrenheit, and the average annual precipitation is 16.3 inches.
Economy
The economy of Darby is largely based on tourism and agriculture. The town is home to several tourist attractions, including the Bitterroot Valley Museum, the Darby Pioneer Museum, and the Bitterroot National Forest. The town is also home to several wineries, and is a popular destination for outdoor recreation.
Agriculture is also an important part of the local economy. The town is home to several farms, and the surrounding area is known for its production of hay, wheat, barley, and other crops.
Demographics
According to the 2010 census, the population of Darby is 1,072 people. The town is predominantly white, with a small Hispanic population. The median household income is $37,500, and the median home value is $179,000. The town has a high rate of homeownership, with nearly 80% of the population owning their own homes.
The town is served by the Darby School District, which includes an elementary school, a middle school, and a high school. The town is also home to a branch of the University of Montana, which offers a variety of degree programs.
Conclusion
Darby, Montana is a small town located in the Bitterroot Valley of Ravalli County, Montana. The town is situated at the confluence of the East and West forks of the Bitterroot River, and is surrounded by the Bitterroot Mountains. The town has a population of 1,072 people, according to the 2010 census. The economy of Darby is largely based on tourism and agriculture, and the town is home to several tourist attractions and wineries. The town is predominantly white, with a small Hispanic population, and the median household income is $37,500. The town is served by the Darby School District, and is home to a branch of the University of Montana.
Common Questions
What is Per Capita Income in Darby?
Per Capita income in Darby is $31,650.
What is the Median Family Income in Darby?
Median Family Income in Darby is $46,875.
What is the Median Household income in Darby?
Median Household Income in Darby is $39,583.
What is Income or Wage Gap in Darby?
Income or Wage Gap in Darby is 27.3%.
Women in Darby earn 72.7 cents for every dollar earned by a man.
What is Inequality or Gini Index in Darby?
Inequality or Gini Index in Darby is 0.55.
What is the Total Population of Darby?
Total Population of Darby is 610.
What is the Total Male Population of Darby?
Total Male Population of Darby is 365.
What is the Total Female Population of Darby?
Total Female Population of Darby is 245.
What is the Ratio of Males per 100 Females in Darby?
There are 148.98 Males per 100 Females in Darby.
What is the Ratio of Females per 100 Males in Darby?
There are 67.12 Females per 100 Males in Darby.
What is the Median Population Age in Darby?
Median Population Age in Darby is 52.8 Years.
What is the Average Family Size in Darby
Average Family Size in Darby is 2.3 People.
What is the Average Household Size in Darby
Average Household Size in Darby is 1.8 People.
How Large is the Labor Force in Darby?
There are 286 People in the Labor Forcein in Darby.
What is the Percentage of People in the Labor Force in Darby?
52.1% of People are in the Labor Force in Darby.
What is the Unemployment Rate in Darby?
Unemployment Rate in Darby is 2.8%.