Parkerfield, KS Map & Demographics
Parkerfield Map
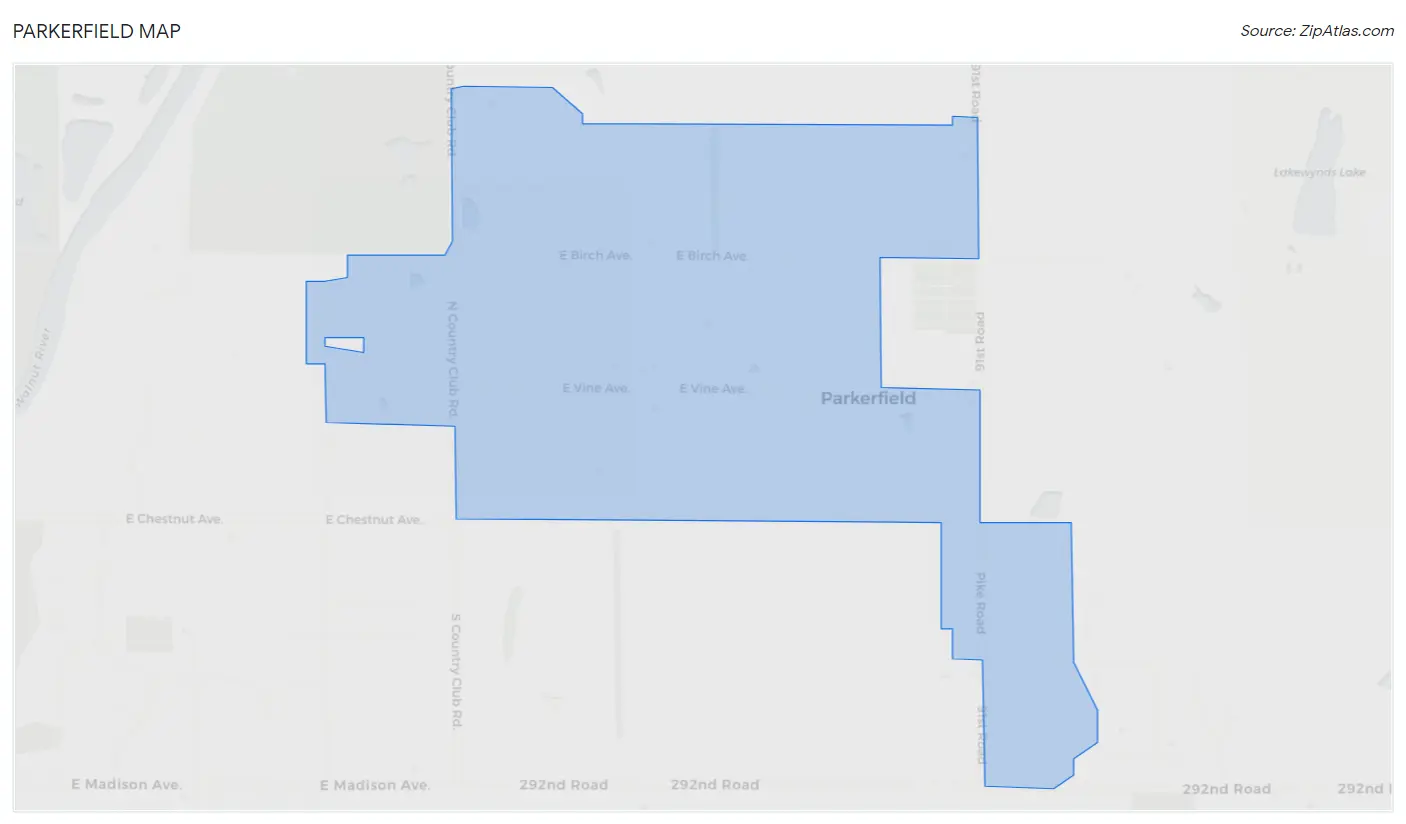
Parkerfield Overview
$41,652
PER CAPITA INCOME
$123,750
AVG FAMILY INCOME
$103,438
AVG HOUSEHOLD INCOME
71.7%
WAGE / INCOME GAP [ % ]
28.3¢/ $1
WAGE / INCOME GAP [ $ ]
0.28
INEQUALITY / GINI INDEX
564
TOTAL POPULATION
257
MALE POPULATION
307
FEMALE POPULATION
83.71
MALES / 100 FEMALES
119.46
FEMALES / 100 MALES
49.5
MEDIAN AGE
3.1
AVG FAMILY SIZE
2.7
AVG HOUSEHOLD SIZE
221
LABOR FORCE [ PEOPLE ]
42.7%
PERCENT IN LABOR FORCE
2.3%
UNEMPLOYMENT RATE
Parkerfield Area Codes
Income in Parkerfield
Income Overview in Parkerfield
Per Capita Income in Parkerfield is $41,652, while median incomes of families and households are $123,750 and $103,438 respectively.
| Characteristic | Number | Measure |
| Per Capita Income | 564 | $41,652 |
| Median Family Income | 170 | $123,750 |
| Mean Family Income | 170 | $117,154 |
| Median Household Income | 211 | $103,438 |
| Mean Household Income | 211 | $106,712 |
| Income Deficit | 170 | $0 |
| Wage / Income Gap (%) | 564 | 71.69% |
| Wage / Income Gap ($) | 564 | 28.31¢ per $1 |
| Gini / Inequality Index | 564 | 0.28 |
Earnings by Sex in Parkerfield
Average Earnings in Parkerfield are $34,102, $90,197 for men and $25,536 for women, a difference of 71.7%.
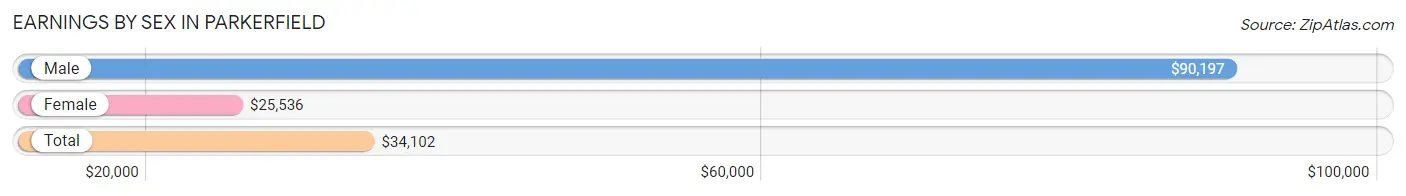
| Sex | Number | Average Earnings |
| Male | 142 (47.2%) | $90,197 |
| Female | 159 (52.8%) | $25,536 |
| Total | 301 (100.0%) | $34,102 |
Earnings by Sex by Income Bracket in Parkerfield
The most common earnings brackets in Parkerfield are $75,000 to $99,999 for men (52 | 36.6%) and $7,500 to $9,999 for women (51 | 32.1%).
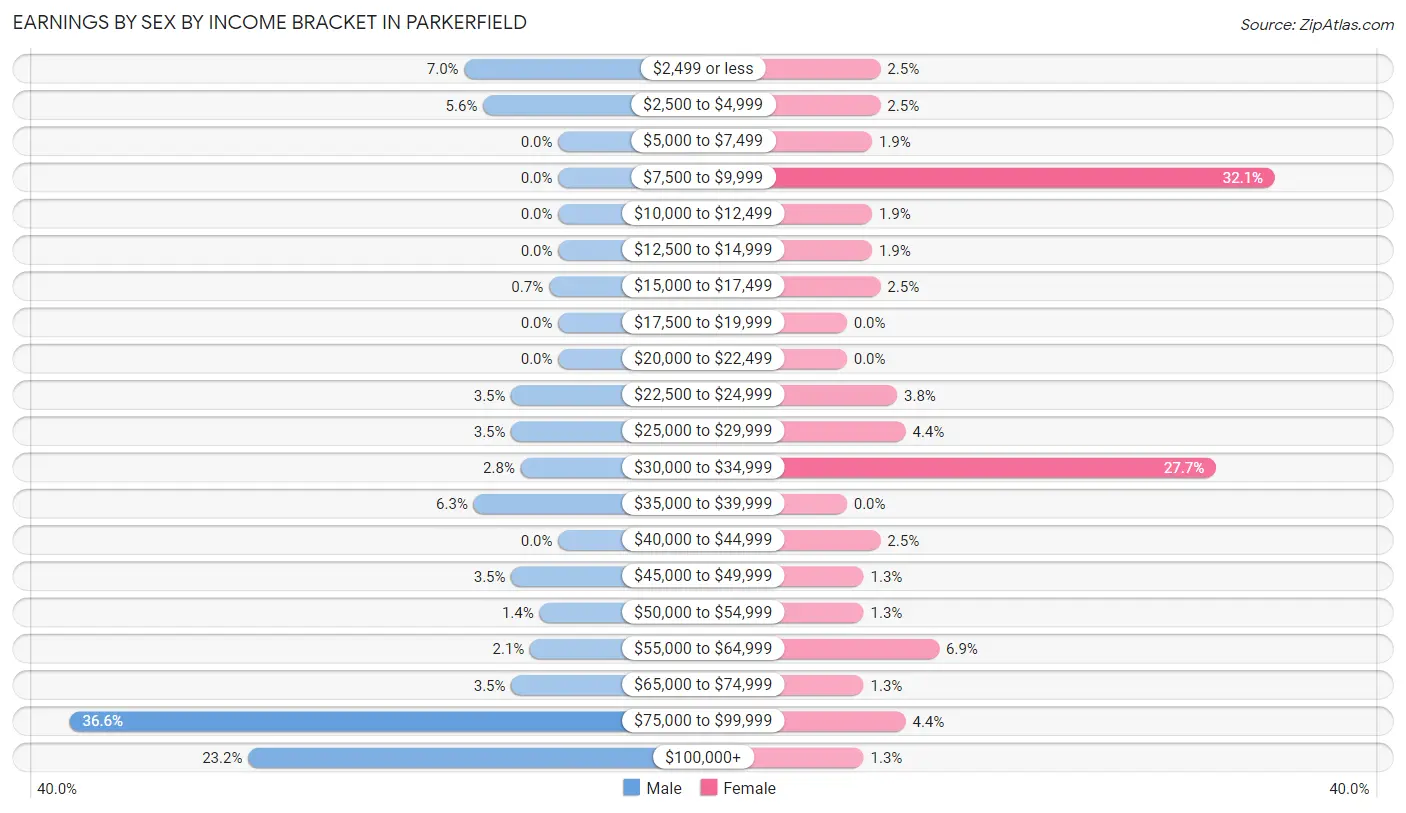
| Income | Male | Female |
| $2,499 or less | 10 (7.0%) | 4 (2.5%) |
| $2,500 to $4,999 | 8 (5.6%) | 4 (2.5%) |
| $5,000 to $7,499 | 0 (0.0%) | 3 (1.9%) |
| $7,500 to $9,999 | 0 (0.0%) | 51 (32.1%) |
| $10,000 to $12,499 | 0 (0.0%) | 3 (1.9%) |
| $12,500 to $14,999 | 0 (0.0%) | 3 (1.9%) |
| $15,000 to $17,499 | 1 (0.7%) | 4 (2.5%) |
| $17,500 to $19,999 | 0 (0.0%) | 0 (0.0%) |
| $20,000 to $22,499 | 0 (0.0%) | 0 (0.0%) |
| $22,500 to $24,999 | 5 (3.5%) | 6 (3.8%) |
| $25,000 to $29,999 | 5 (3.5%) | 7 (4.4%) |
| $30,000 to $34,999 | 4 (2.8%) | 44 (27.7%) |
| $35,000 to $39,999 | 9 (6.3%) | 0 (0.0%) |
| $40,000 to $44,999 | 0 (0.0%) | 4 (2.5%) |
| $45,000 to $49,999 | 5 (3.5%) | 2 (1.3%) |
| $50,000 to $54,999 | 2 (1.4%) | 2 (1.3%) |
| $55,000 to $64,999 | 3 (2.1%) | 11 (6.9%) |
| $65,000 to $74,999 | 5 (3.5%) | 2 (1.3%) |
| $75,000 to $99,999 | 52 (36.6%) | 7 (4.4%) |
| $100,000+ | 33 (23.2%) | 2 (1.3%) |
| Total | 142 (100.0%) | 159 (100.0%) |
Earnings by Sex by Educational Attainment in Parkerfield
Average earnings in Parkerfield are $90,691 for men and $33,792 for women, a difference of 62.7%. Men with an educational attainment of graduate degree enjoy the highest average annual earnings of $134,375, while those with college or associate's degree education earn the least with $91,382. Women with an educational attainment of bachelor's degree earn the most with the average annual earnings of $50,625, while those with college or associate's degree education have the smallest earnings of $33,348.
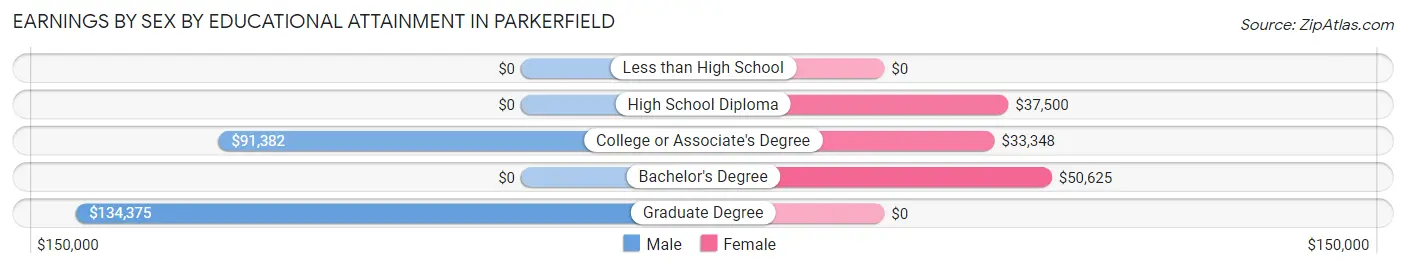
| Educational Attainment | Male Income | Female Income |
| Less than High School | - | - |
| High School Diploma | - | - |
| College or Associate's Degree | $91,382 | $33,348 |
| Bachelor's Degree | - | - |
| Graduate Degree | $134,375 | $0 |
| Total | $90,691 | $33,792 |
Family Income in Parkerfield
Family Income Brackets in Parkerfield
According to the Parkerfield family income data, there are 68 families falling into the $100,000 to $149,999 income range, which is the most common income bracket and makes up 40.0% of all families.
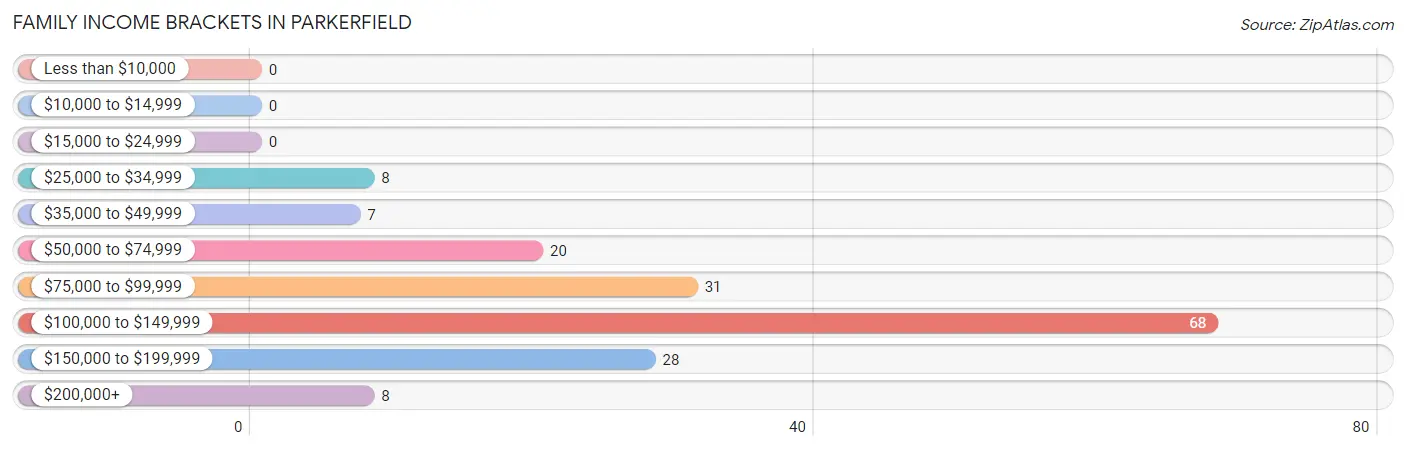
| Income Bracket | # Families | % Families |
| Less than $10,000 | 0 | 0.0% |
| $10,000 to $14,999 | 0 | 0.0% |
| $15,000 to $24,999 | 0 | 0.0% |
| $25,000 to $34,999 | 8 | 4.7% |
| $35,000 to $49,999 | 7 | 4.1% |
| $50,000 to $74,999 | 20 | 11.8% |
| $75,000 to $99,999 | 31 | 18.2% |
| $100,000 to $149,999 | 68 | 40.0% |
| $150,000 to $199,999 | 28 | 16.5% |
| $200,000+ | 8 | 4.7% |
Family Income by Famaliy Size in Parkerfield
5-person families (7 | 4.1%) account for the highest median family income in Parkerfield with $140,625 per family, while 2-person families (103 | 60.6%) have the highest median income of $43,720 per family member.
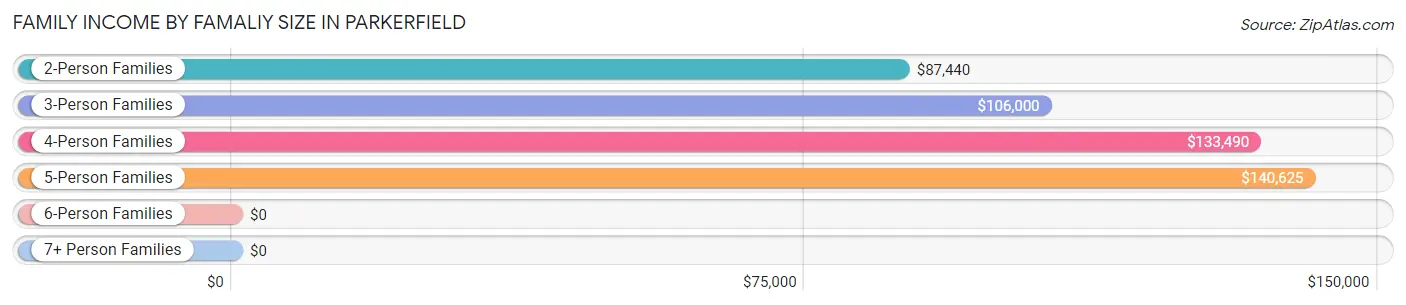
| Income Bracket | # Families | Median Income |
| 2-Person Families | 103 (60.6%) | $87,440 |
| 3-Person Families | 16 (9.4%) | $106,000 |
| 4-Person Families | 39 (22.9%) | $133,490 |
| 5-Person Families | 7 (4.1%) | $140,625 |
| 6-Person Families | 3 (1.8%) | $0 |
| 7+ Person Families | 2 (1.2%) | $0 |
| Total | 170 (100.0%) | $123,750 |
Family Income by Number of Earners in Parkerfield
The median family income in Parkerfield is $123,750, with families comprising 2 earners (45) having the highest median family income of $145,625, while families with no earners (52) have the lowest median family income of $85,476, accounting for 26.5% and 30.6% of families, respectively.
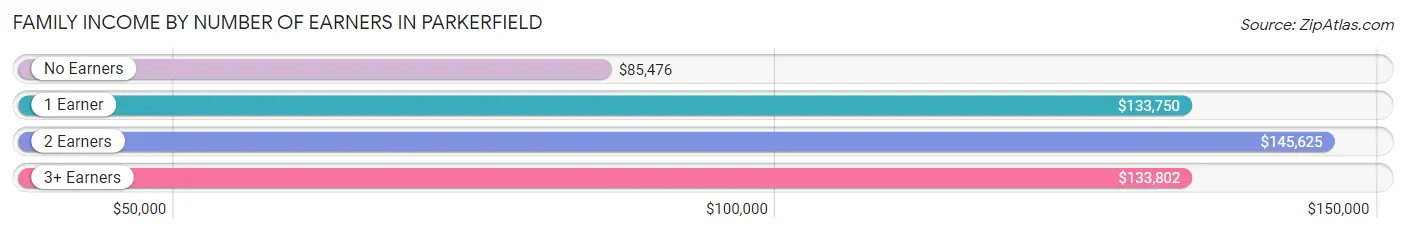
| Number of Earners | # Families | Median Income |
| No Earners | 52 (30.6%) | $85,476 |
| 1 Earner | 36 (21.2%) | $133,750 |
| 2 Earners | 45 (26.5%) | $145,625 |
| 3+ Earners | 37 (21.8%) | $133,802 |
| Total | 170 (100.0%) | $123,750 |
Household Income in Parkerfield
Household Income Brackets in Parkerfield
With 68 households falling in the category, the $100,000 to $149,999 income range is the most frequent in Parkerfield, accounting for 32.2% of all households.
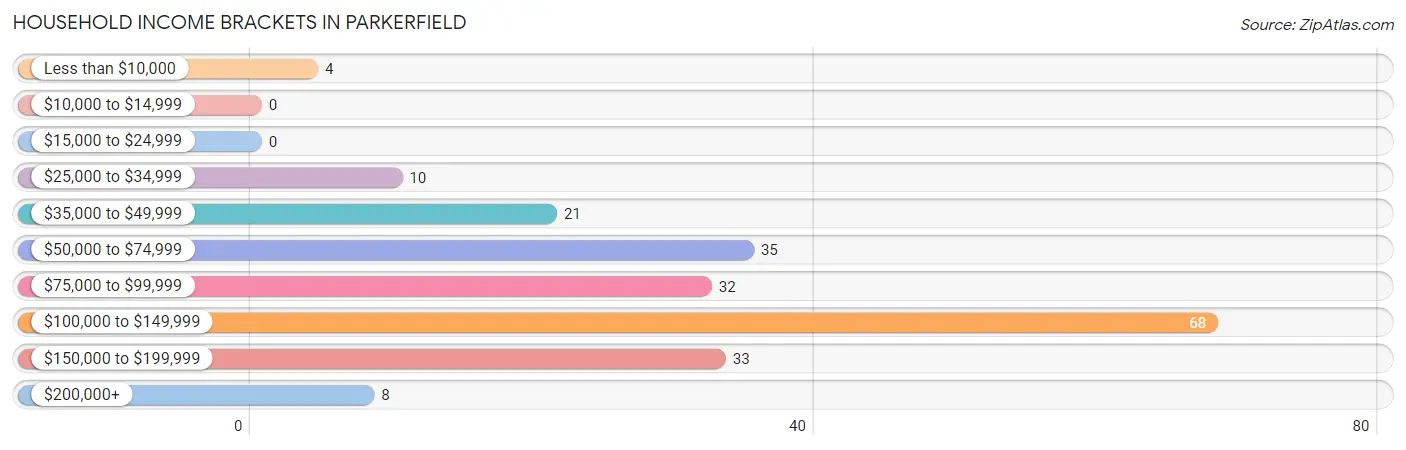
| Income Bracket | # Households | % Households |
| Less than $10,000 | 4 | 1.9% |
| $10,000 to $14,999 | 0 | 0.0% |
| $15,000 to $24,999 | 0 | 0.0% |
| $25,000 to $34,999 | 10 | 4.7% |
| $35,000 to $49,999 | 21 | 10.0% |
| $50,000 to $74,999 | 35 | 16.6% |
| $75,000 to $99,999 | 32 | 15.2% |
| $100,000 to $149,999 | 68 | 32.2% |
| $150,000 to $199,999 | 33 | 15.6% |
| $200,000+ | 8 | 3.8% |
Household Income by Householder Age in Parkerfield
The median household income in Parkerfield is $103,438, with the highest median household income of $133,304 found in the 25 to 44 years age bracket for the primary householder. A total of 56 households (26.5%) fall into this category.
| Income Bracket | # Households | Median Income |
| 15 to 24 Years | 0 (0.0%) | $0 |
| 25 to 44 Years | 56 (26.5%) | $133,304 |
| 45 to 64 Years | 51 (24.2%) | $132,250 |
| 65+ Years | 104 (49.3%) | $83,750 |
| Total | 211 (100.0%) | $103,438 |
Poverty in Parkerfield
Income Below Poverty by Sex and Age in Parkerfield
With 0.8% poverty level for males and 1.6% for females among the residents of Parkerfield, 65 to 74 year old males and 18 to 24 year old females are the most vulnerable to poverty, with 2 males (3.5%) and 3 females (4.5%) in their respective age groups living below the poverty level.
| Age Bracket | Male | Female |
| Under 5 Years | 0 (0.0%) | 0 (0.0%) |
| 5 Years | 0 (0.0%) | 0 (0.0%) |
| 6 to 11 Years | 0 (0.0%) | 0 (0.0%) |
| 12 to 14 Years | 0 (0.0%) | 0 (0.0%) |
| 15 Years | 0 (0.0%) | 0 (0.0%) |
| 16 and 17 Years | 0 (0.0%) | 0 (0.0%) |
| 18 to 24 Years | 0 (0.0%) | 3 (4.5%) |
| 25 to 34 Years | 0 (0.0%) | 0 (0.0%) |
| 35 to 44 Years | 0 (0.0%) | 0 (0.0%) |
| 45 to 54 Years | 0 (0.0%) | 0 (0.0%) |
| 55 to 64 Years | 0 (0.0%) | 0 (0.0%) |
| 65 to 74 Years | 2 (3.5%) | 2 (2.7%) |
| 75 Years and over | 0 (0.0%) | 0 (0.0%) |
| Total | 2 (0.8%) | 5 (1.6%) |
Income Above Poverty by Sex and Age in Parkerfield
According to the poverty statistics in Parkerfield, males aged under 5 years and females aged under 5 years are the age groups that are most secure financially, with 100.0% of males and 100.0% of females in these age groups living above the poverty line.
| Age Bracket | Male | Female |
| Under 5 Years | 4 (100.0%) | 5 (100.0%) |
| 5 Years | 0 (0.0%) | 2 (100.0%) |
| 6 to 11 Years | 10 (100.0%) | 11 (100.0%) |
| 12 to 14 Years | 10 (100.0%) | 2 (100.0%) |
| 15 Years | 3 (100.0%) | 0 (0.0%) |
| 16 and 17 Years | 2 (100.0%) | 31 (100.0%) |
| 18 to 24 Years | 15 (100.0%) | 64 (95.5%) |
| 25 to 34 Years | 28 (100.0%) | 4 (100.0%) |
| 35 to 44 Years | 23 (100.0%) | 37 (100.0%) |
| 45 to 54 Years | 45 (100.0%) | 11 (100.0%) |
| 55 to 64 Years | 41 (100.0%) | 37 (100.0%) |
| 65 to 74 Years | 55 (96.5%) | 72 (97.3%) |
| 75 Years and over | 19 (100.0%) | 26 (100.0%) |
| Total | 255 (99.2%) | 302 (98.4%) |
Income Below Poverty Among Married-Couple Families in Parkerfield
| Children | Above Poverty | Below Poverty |
| No Children | 116 (100.0%) | 0 (0.0%) |
| 1 or 2 Children | 39 (100.0%) | 0 (0.0%) |
| 3 or 4 Children | 6 (100.0%) | 0 (0.0%) |
| 5 or more Children | 2 (100.0%) | 0 (0.0%) |
| Total | 163 (100.0%) | 0 (0.0%) |
Income Below Poverty Among Single-Parent Households in Parkerfield
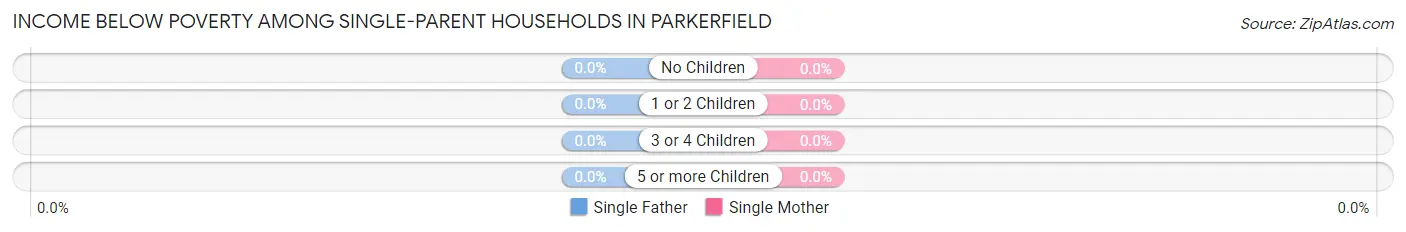
| Children | Single Father | Single Mother |
| No Children | 0 (0.0%) | 0 (0.0%) |
| 1 or 2 Children | 0 (0.0%) | 0 (0.0%) |
| 3 or 4 Children | 0 (0.0%) | 0 (0.0%) |
| 5 or more Children | 0 (0.0%) | 0 (0.0%) |
| Total | 0 (0.0%) | 0 (0.0%) |
Income Below Poverty Among Married-Couple vs Single-Parent Households in Parkerfield
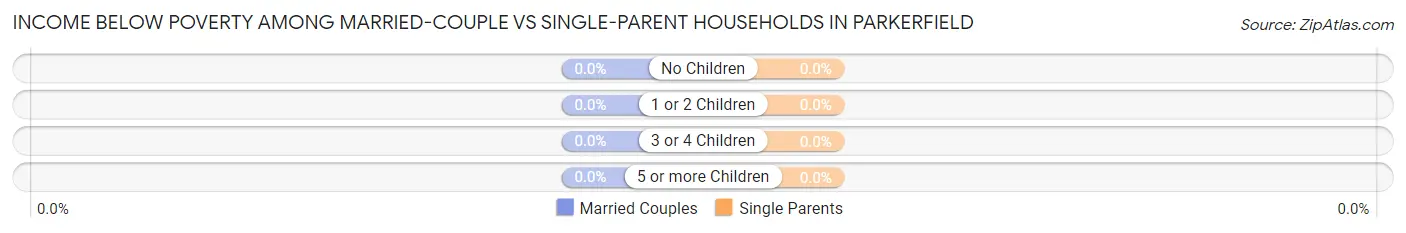
| Children | Married-Couple Families | Single-Parent Households |
| No Children | 0 (0.0%) | 0 (0.0%) |
| 1 or 2 Children | 0 (0.0%) | 0 (0.0%) |
| 3 or 4 Children | 0 (0.0%) | 0 (0.0%) |
| 5 or more Children | 0 (0.0%) | 0 (0.0%) |
| Total | 0 (0.0%) | 0 (0.0%) |
Race in Parkerfield
The most populous races in Parkerfield are White / Caucasian (390 | 69.2%), Asian (132 | 23.4%), and Two or more Races (29 | 5.1%).
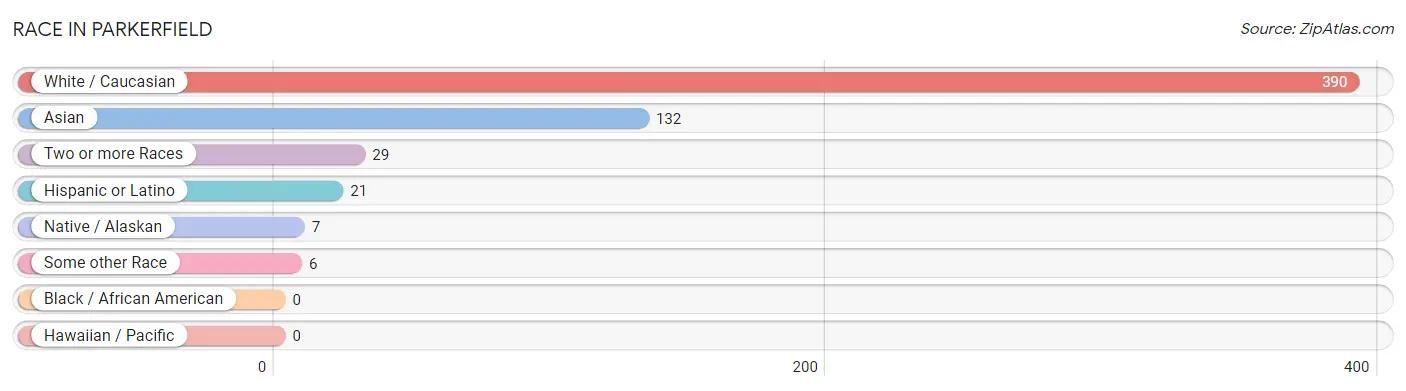
| Race | # Population | % Population |
| Asian | 132 | 23.4% |
| Black / African American | 0 | 0.0% |
| Hawaiian / Pacific | 0 | 0.0% |
| Hispanic or Latino | 21 | 3.7% |
| Native / Alaskan | 7 | 1.2% |
| White / Caucasian | 390 | 69.2% |
| Two or more Races | 29 | 5.1% |
| Some other Race | 6 | 1.1% |
| Total | 564 | 100.0% |
Ancestry in Parkerfield
The most populous ancestries reported in Parkerfield are Malaysian (130 | 23.1%), German (111 | 19.7%), English (100 | 17.7%), Irish (79 | 14.0%), and American (42 | 7.4%), together accounting for 81.9% of all Parkerfield residents.
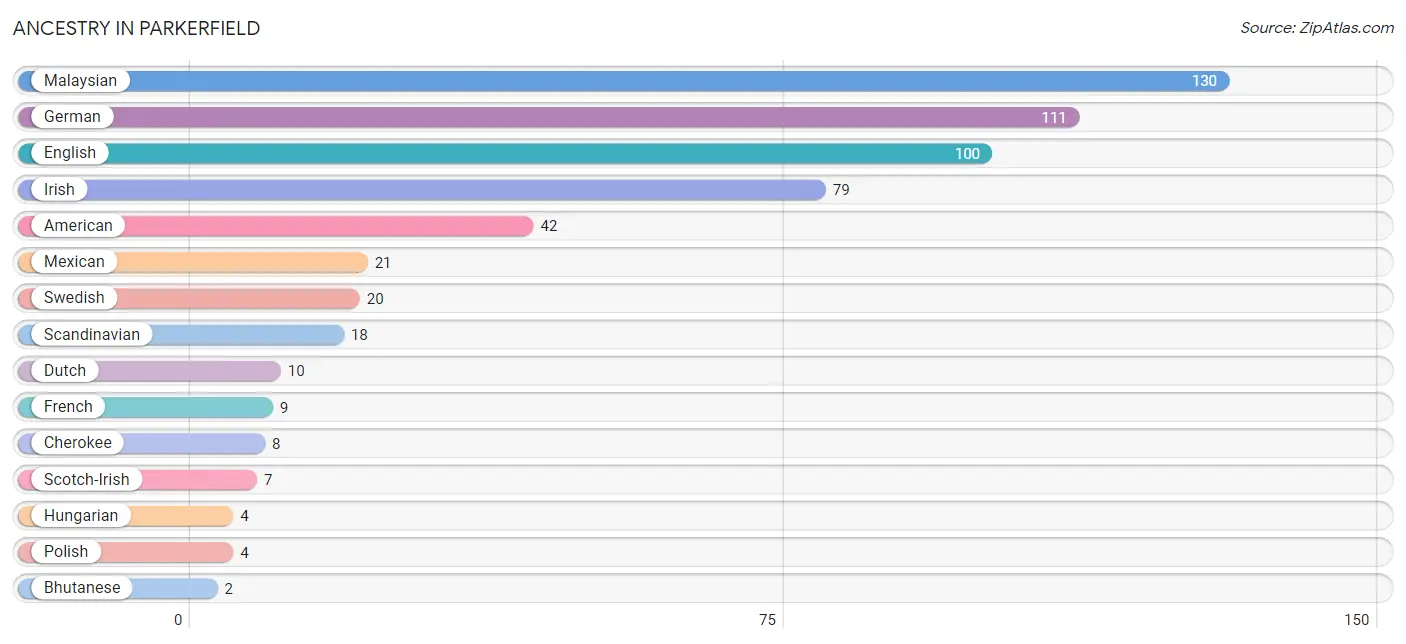
| Ancestry | # Population | % Population |
| American | 42 | 7.4% |
| Austrian | 1 | 0.2% |
| Bhutanese | 2 | 0.4% |
| Cherokee | 8 | 1.4% |
| Choctaw | 1 | 0.2% |
| Czechoslovakian | 1 | 0.2% |
| Dutch | 10 | 1.8% |
| English | 100 | 17.7% |
| French | 9 | 1.6% |
| German | 111 | 19.7% |
| Hungarian | 4 | 0.7% |
| Irish | 79 | 14.0% |
| Italian | 2 | 0.4% |
| Malaysian | 130 | 23.1% |
| Mexican | 21 | 3.7% |
| Northern European | 2 | 0.4% |
| Polish | 4 | 0.7% |
| Potawatomi | 2 | 0.4% |
| Scandinavian | 18 | 3.2% |
| Scotch-Irish | 7 | 1.2% |
| Swedish | 20 | 3.5% | View All 21 Rows |
Immigrants in Parkerfield
The most numerous immigrant groups reported in Parkerfield came from Asia (63 | 11.2%), Laos (61 | 10.8%), South Eastern Asia (61 | 10.8%), Eastern Asia (2 | 0.4%), and Japan (2 | 0.4%), together accounting for 33.5% of all Parkerfield residents.
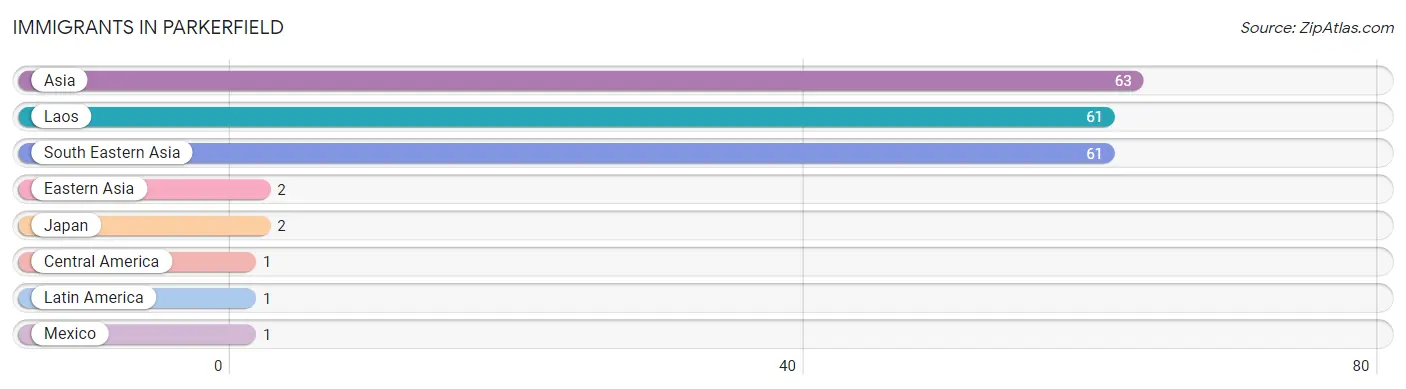
| Immigration Origin | # Population | % Population |
| Asia | 63 | 11.2% |
| Central America | 1 | 0.2% |
| Eastern Asia | 2 | 0.4% |
| Japan | 2 | 0.4% |
| Laos | 61 | 10.8% |
| Latin America | 1 | 0.2% |
| Mexico | 1 | 0.2% |
| South Eastern Asia | 61 | 10.8% | View All 8 Rows |
Sex and Age in Parkerfield
Sex and Age in Parkerfield
The most populous age groups in Parkerfield are 70 to 74 Years (44 | 17.1%) for men and 15 to 19 Years (86 | 28.0%) for women.
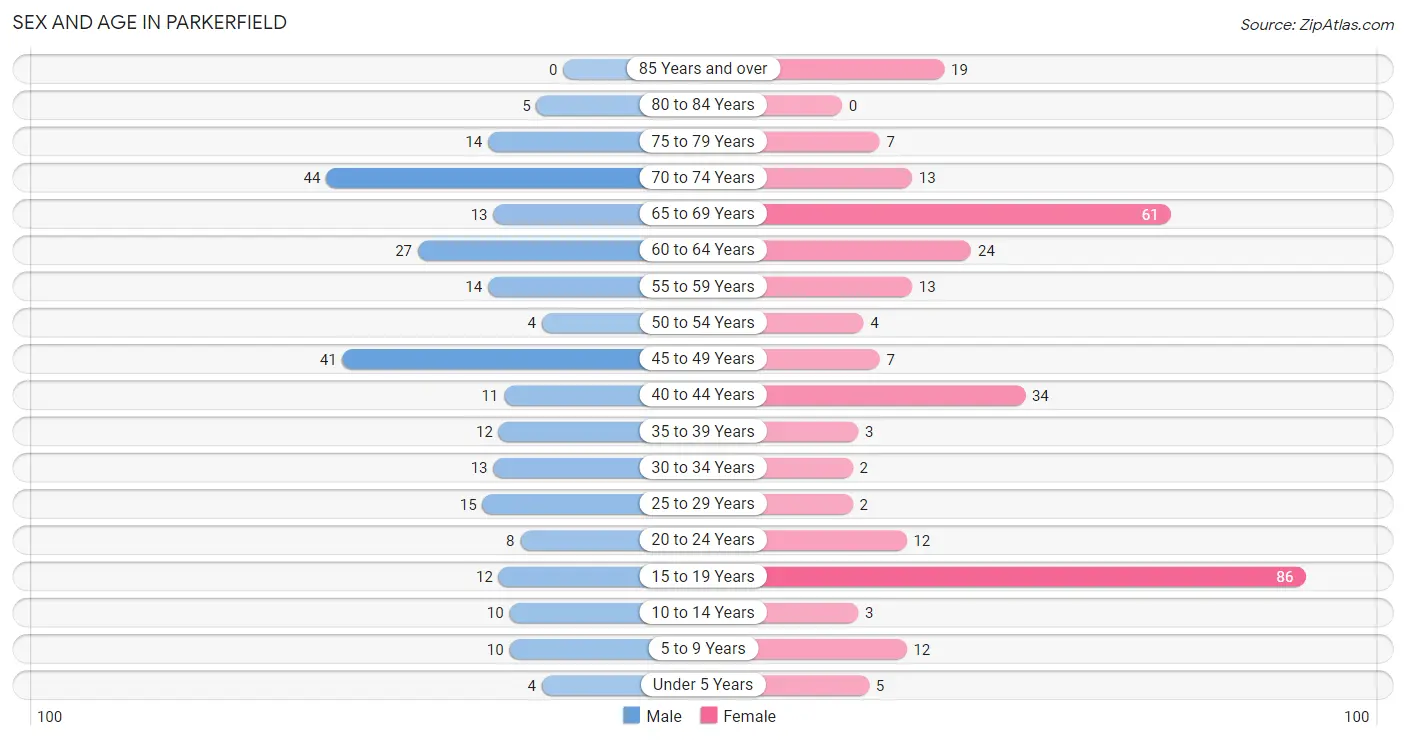
| Age Bracket | Male | Female |
| Under 5 Years | 4 (1.6%) | 5 (1.6%) |
| 5 to 9 Years | 10 (3.9%) | 12 (3.9%) |
| 10 to 14 Years | 10 (3.9%) | 3 (1.0%) |
| 15 to 19 Years | 12 (4.7%) | 86 (28.0%) |
| 20 to 24 Years | 8 (3.1%) | 12 (3.9%) |
| 25 to 29 Years | 15 (5.8%) | 2 (0.6%) |
| 30 to 34 Years | 13 (5.1%) | 2 (0.6%) |
| 35 to 39 Years | 12 (4.7%) | 3 (1.0%) |
| 40 to 44 Years | 11 (4.3%) | 34 (11.1%) |
| 45 to 49 Years | 41 (16.0%) | 7 (2.3%) |
| 50 to 54 Years | 4 (1.6%) | 4 (1.3%) |
| 55 to 59 Years | 14 (5.4%) | 13 (4.2%) |
| 60 to 64 Years | 27 (10.5%) | 24 (7.8%) |
| 65 to 69 Years | 13 (5.1%) | 61 (19.9%) |
| 70 to 74 Years | 44 (17.1%) | 13 (4.2%) |
| 75 to 79 Years | 14 (5.4%) | 7 (2.3%) |
| 80 to 84 Years | 5 (1.9%) | 0 (0.0%) |
| 85 Years and over | 0 (0.0%) | 19 (6.2%) |
| Total | 257 (100.0%) | 307 (100.0%) |
Families and Households in Parkerfield
Median Family Size in Parkerfield
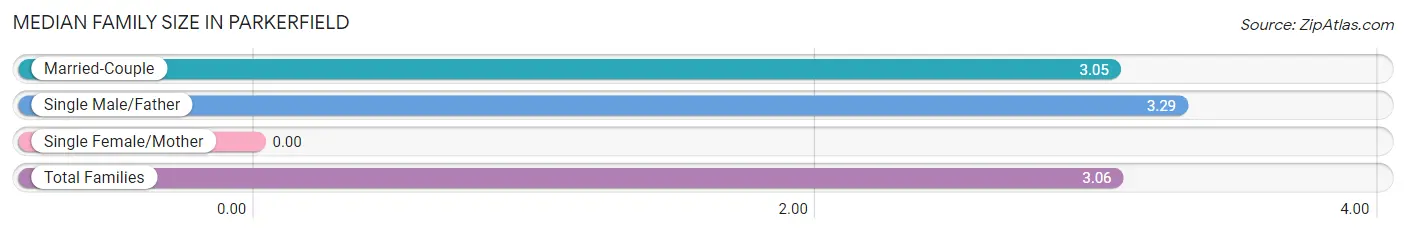
| Family Type | # Families | Family Size |
| Married-Couple | 163 (95.9%) | 3.05 |
| Single Male/Father | 7 (4.1%) | 3.29 |
| Single Female/Mother | 0 (0.0%) | - |
| Total Families | 170 (100.0%) | 3.06 |
Median Household Size in Parkerfield
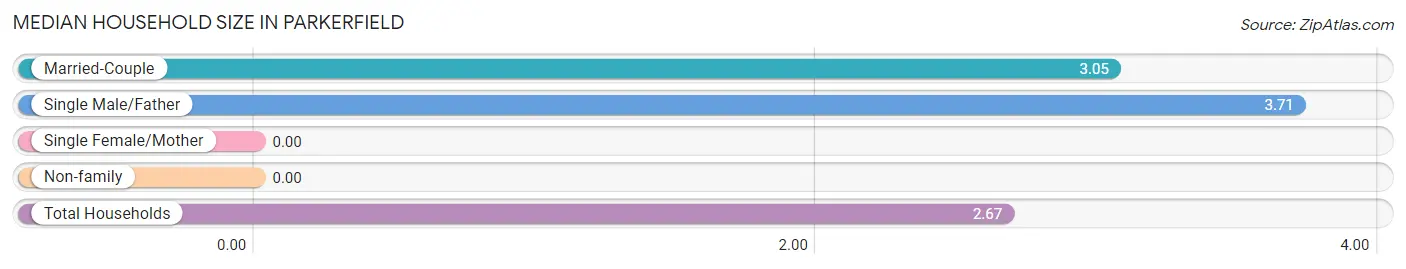
| Household Type | # Households | Household Size |
| Married-Couple | 163 (77.2%) | 3.05 |
| Single Male/Father | 7 (3.3%) | 3.71 |
| Single Female/Mother | 0 (0.0%) | - |
| Non-family | 41 (19.4%) | - |
| Total Households | 211 (100.0%) | 2.67 |
Household Size by Marriage Status in Parkerfield
Out of a total of 211 households in Parkerfield, 170 (80.6%) are family households, while 41 (19.4%) are nonfamily households. The most numerous type of family households are 2-person households, comprising 101, and the most common type of nonfamily households are 1-person households, comprising 41.
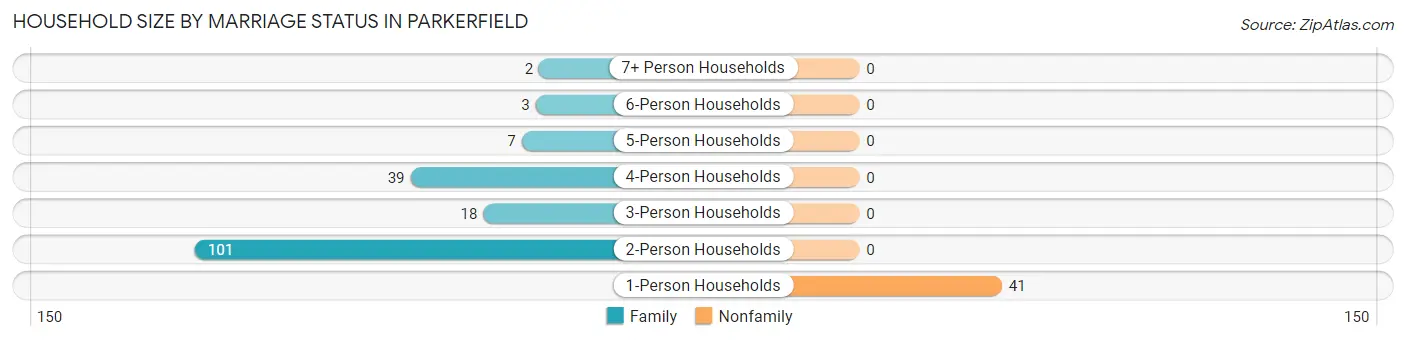
| Household Size | Family Households | Nonfamily Households |
| 1-Person Households | - | 41 (19.4%) |
| 2-Person Households | 101 (47.9%) | 0 (0.0%) |
| 3-Person Households | 18 (8.5%) | 0 (0.0%) |
| 4-Person Households | 39 (18.5%) | 0 (0.0%) |
| 5-Person Households | 7 (3.3%) | 0 (0.0%) |
| 6-Person Households | 3 (1.4%) | 0 (0.0%) |
| 7+ Person Households | 2 (0.9%) | 0 (0.0%) |
| Total | 170 (80.6%) | 41 (19.4%) |
Female Fertility in Parkerfield
Fertility by Age in Parkerfield
Average fertility rate in Parkerfield is 7.0 births per 1,000 women. Women in the age bracket of 20 to 34 years have the highest fertility rate with 63.0 births per 1,000 women. Women in the age bracket of 20 to 34 years acount for 100.0% of all women with births.
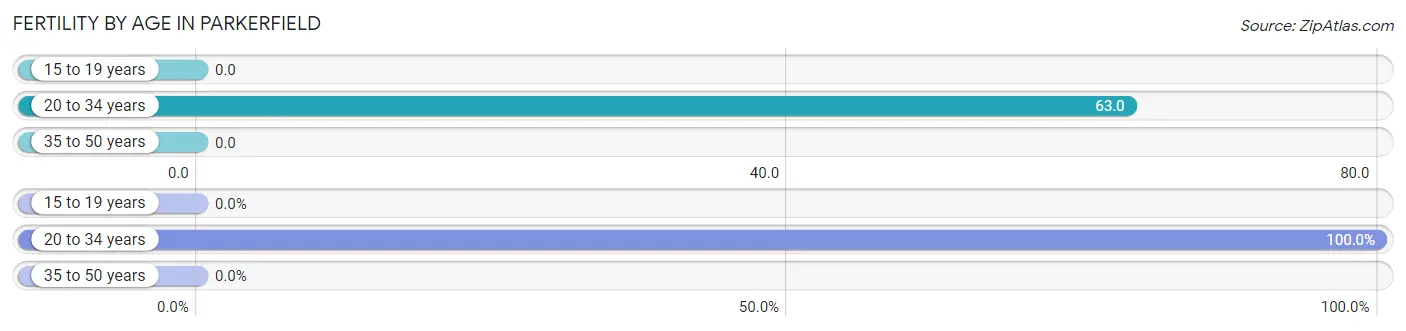
| Age Bracket | Women with Births | Births / 1,000 Women |
| 15 to 19 years | 0 (0.0%) | 0.0 |
| 20 to 34 years | 1 (100.0%) | 63.0 |
| 35 to 50 years | 0 (0.0%) | 0.0 |
| Total | 1 (100.0%) | 7.0 |
Fertility by Age by Marriage Status in Parkerfield
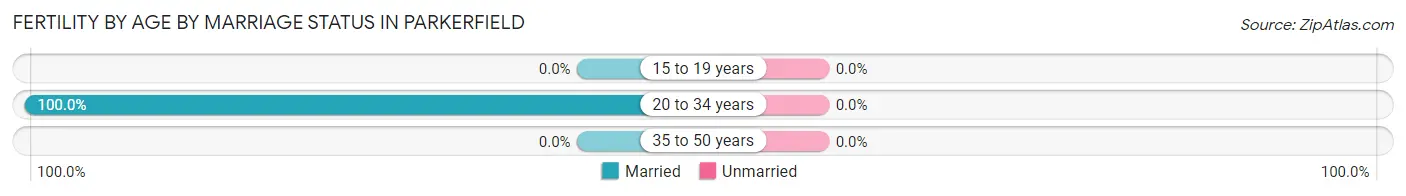
| Age Bracket | Married | Unmarried |
| 15 to 19 years | 0 (0.0%) | 0 (0.0%) |
| 20 to 34 years | 1 (100.0%) | 0 (0.0%) |
| 35 to 50 years | 0 (0.0%) | 0 (0.0%) |
| Total | 1 (100.0%) | 0 (0.0%) |
Fertility by Education in Parkerfield
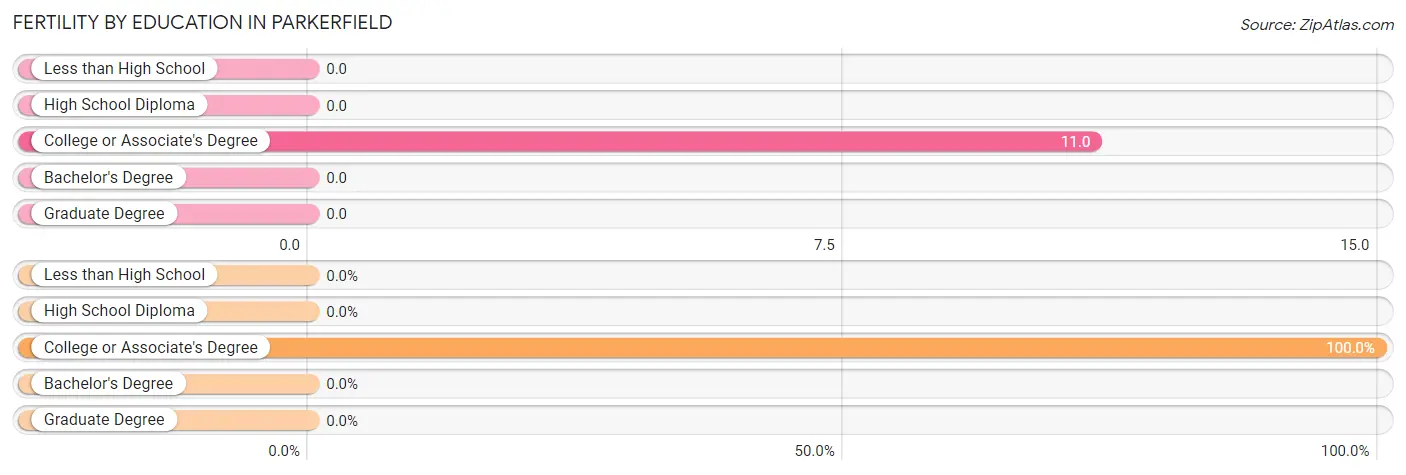
| Educational Attainment | Women with Births | Births / 1,000 Women |
| Less than High School | 0 (0.0%) | 0.0 |
| High School Diploma | 0 (0.0%) | 0.0 |
| College or Associate's Degree | 1 (100.0%) | 11.0 |
| Bachelor's Degree | 0 (0.0%) | 0.0 |
| Graduate Degree | 0 (0.0%) | 0.0 |
| Total | 1 (100.0%) | 7.0 |
Fertility by Education by Marriage Status in Parkerfield
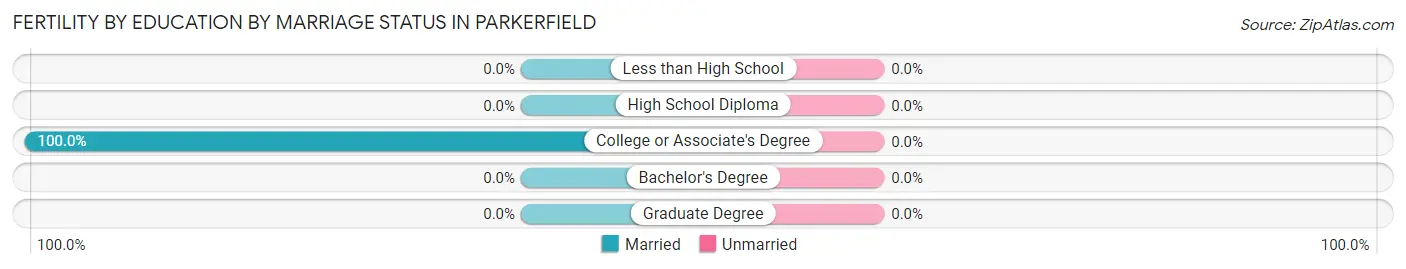
| Educational Attainment | Married | Unmarried |
| Less than High School | 0 (0.0%) | 0 (0.0%) |
| High School Diploma | 0 (0.0%) | 0 (0.0%) |
| College or Associate's Degree | 1 (100.0%) | 0 (0.0%) |
| Bachelor's Degree | 0 (0.0%) | 0 (0.0%) |
| Graduate Degree | 0 (0.0%) | 0 (0.0%) |
| Total | 1 (100.0%) | 0 (0.0%) |
Employment Characteristics in Parkerfield
Employment by Class of Employer in Parkerfield
Among the 216 employed individuals in Parkerfield, private company employees (140 | 64.8%), not-for-profit organizations (30 | 13.9%), and local government employees (16 | 7.4%) make up the most common classes of employment.
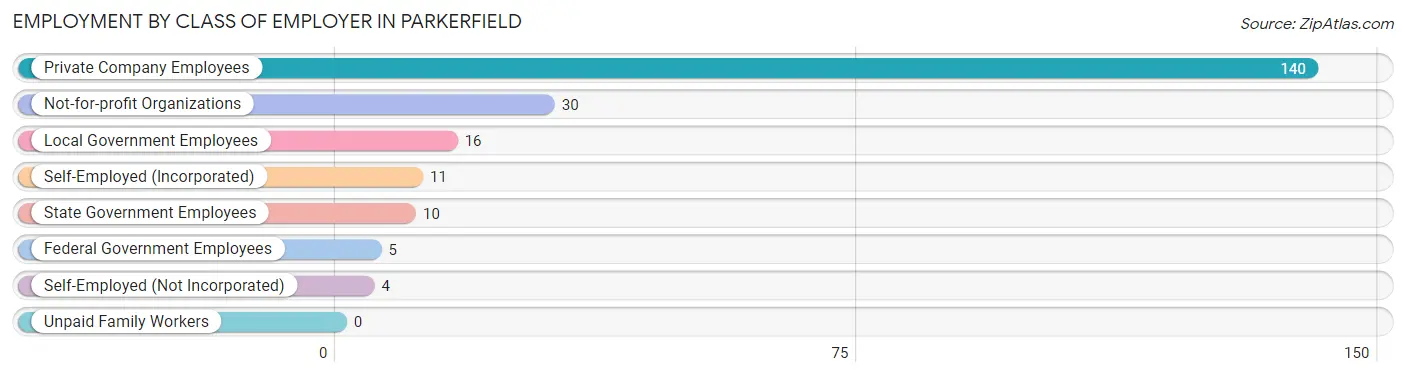
| Employer Class | # Employees | % Employees |
| Private Company Employees | 140 | 64.8% |
| Self-Employed (Incorporated) | 11 | 5.1% |
| Self-Employed (Not Incorporated) | 4 | 1.8% |
| Not-for-profit Organizations | 30 | 13.9% |
| Local Government Employees | 16 | 7.4% |
| State Government Employees | 10 | 4.6% |
| Federal Government Employees | 5 | 2.3% |
| Unpaid Family Workers | 0 | 0.0% |
| Total | 216 | 100.0% |
Employment Status by Age in Parkerfield
According to the labor force statistics for Parkerfield, out of the total population over 16 years of age (517), 42.7% or 221 individuals are in the labor force, with 2.3% or 5 of them unemployed. The age group with the highest labor force participation rate is 55 to 59 years, with 100.0% or 27 individuals in the labor force. Within the labor force, the 20 to 24 years age range has the highest percentage of unemployed individuals, with 31.3% or 5 of them being unemployed.
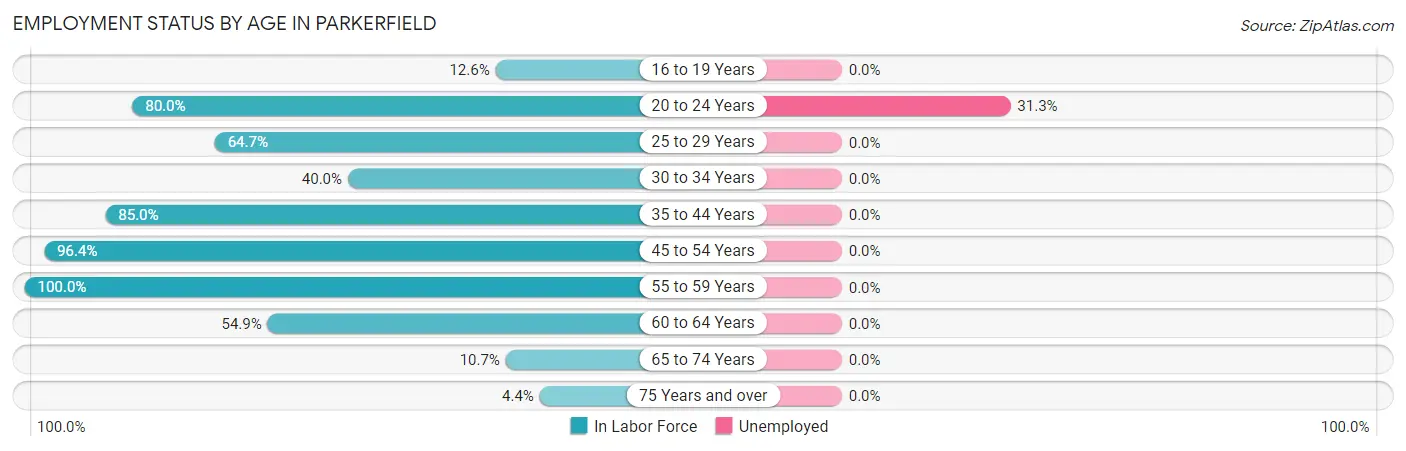
| Age Bracket | In Labor Force | Unemployed |
| 16 to 19 Years | 12 (12.6%) | 0 (0.0%) |
| 20 to 24 Years | 16 (80.0%) | 5 (31.3%) |
| 25 to 29 Years | 11 (64.7%) | 0 (0.0%) |
| 30 to 34 Years | 6 (40.0%) | 0 (0.0%) |
| 35 to 44 Years | 51 (85.0%) | 0 (0.0%) |
| 45 to 54 Years | 54 (96.4%) | 0 (0.0%) |
| 55 to 59 Years | 27 (100.0%) | 0 (0.0%) |
| 60 to 64 Years | 28 (54.9%) | 0 (0.0%) |
| 65 to 74 Years | 14 (10.7%) | 0 (0.0%) |
| 75 Years and over | 2 (4.4%) | 0 (0.0%) |
| Total | 221 (42.7%) | 5 (2.3%) |
Employment Status by Educational Attainment in Parkerfield
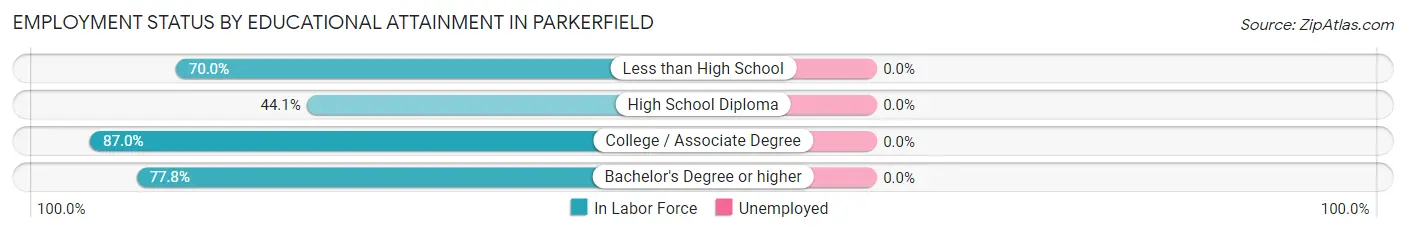
| Educational Attainment | In Labor Force | Unemployed |
| Less than High School | 7 (70.0%) | 0 (0.0%) |
| High School Diploma | 15 (44.1%) | 0 (0.0%) |
| College / Associate Degree | 127 (87.0%) | 0 (0.0%) |
| Bachelor's Degree or higher | 28 (77.8%) | 0 (0.0%) |
| Total | 177 (78.3%) | 0 (0.0%) |
Employment Occupations by Sex in Parkerfield
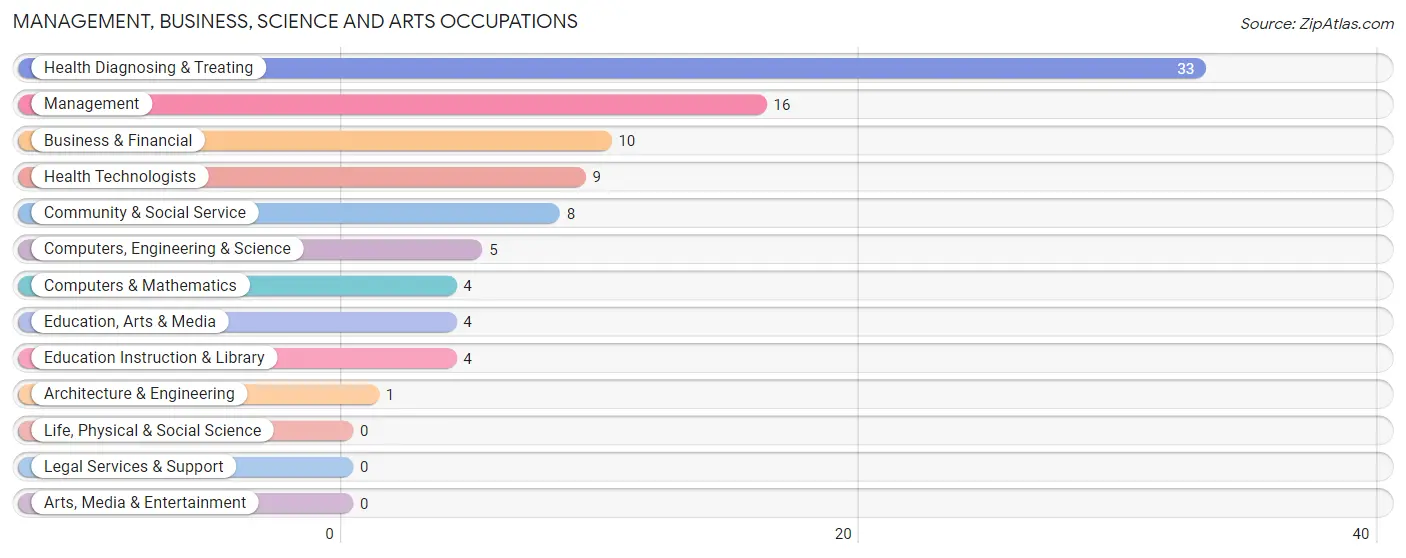
Management, Business, Science and Arts Occupations
The most common Management, Business, Science and Arts occupations in Parkerfield are Health Diagnosing & Treating (33 | 15.3%), Management (16 | 7.4%), Business & Financial (10 | 4.6%), Health Technologists (9 | 4.2%), and Community & Social Service (8 | 3.7%).
Management, Business, Science and Arts Occupations by Sex
Within the Management, Business, Science and Arts occupations in Parkerfield, the most male-oriented occupations are Architecture & Engineering (100.0%), Health Technologists (55.6%), and Education, Arts & Media (50.0%), while the most female-oriented occupations are Computers & Mathematics (100.0%), Health Diagnosing & Treating (84.9%), and Management (81.2%).
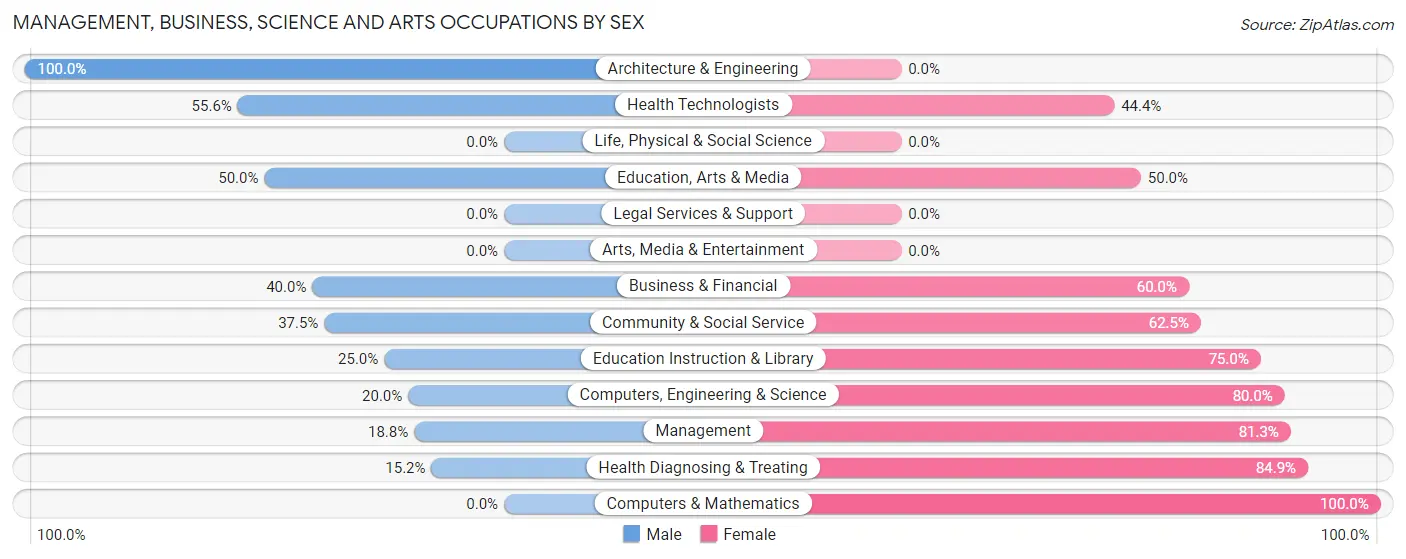
| Occupation | Male | Female |
| Management | 3 (18.8%) | 13 (81.2%) |
| Business & Financial | 4 (40.0%) | 6 (60.0%) |
| Computers, Engineering & Science | 1 (20.0%) | 4 (80.0%) |
| Computers & Mathematics | 0 (0.0%) | 4 (100.0%) |
| Architecture & Engineering | 1 (100.0%) | 0 (0.0%) |
| Life, Physical & Social Science | 0 (0.0%) | 0 (0.0%) |
| Community & Social Service | 3 (37.5%) | 5 (62.5%) |
| Education, Arts & Media | 2 (50.0%) | 2 (50.0%) |
| Legal Services & Support | 0 (0.0%) | 0 (0.0%) |
| Education Instruction & Library | 1 (25.0%) | 3 (75.0%) |
| Arts, Media & Entertainment | 0 (0.0%) | 0 (0.0%) |
| Health Diagnosing & Treating | 5 (15.1%) | 28 (84.9%) |
| Health Technologists | 5 (55.6%) | 4 (44.4%) |
| Total (Category) | 16 (22.2%) | 56 (77.8%) |
| Total (Overall) | 112 (51.8%) | 104 (48.1%) |
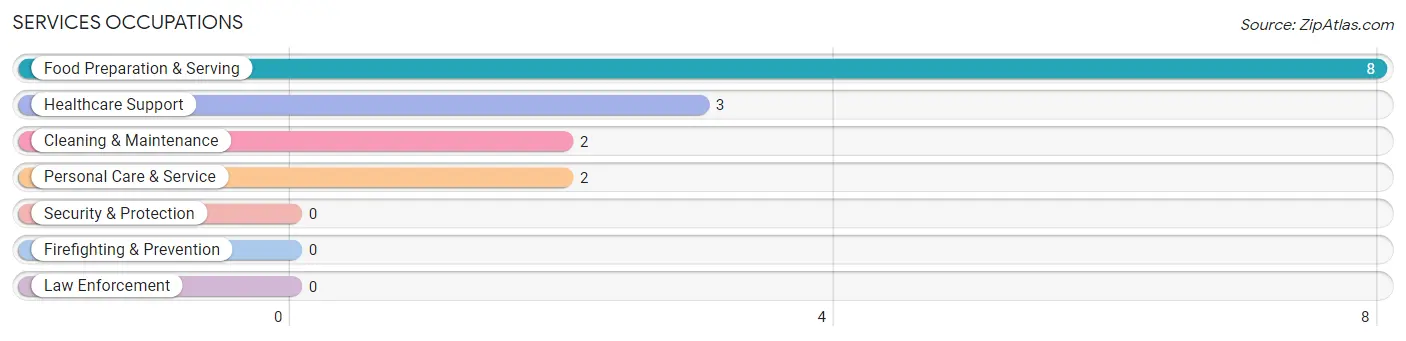
Services Occupations
The most common Services occupations in Parkerfield are Food Preparation & Serving (8 | 3.7%), Healthcare Support (3 | 1.4%), Cleaning & Maintenance (2 | 0.9%), and Personal Care & Service (2 | 0.9%).
Services Occupations by Sex
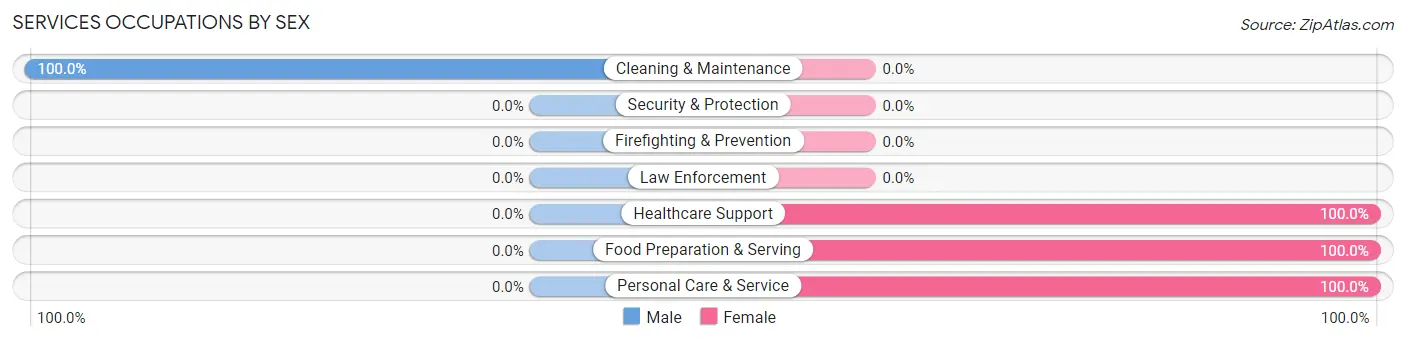
| Occupation | Male | Female |
| Healthcare Support | 0 (0.0%) | 3 (100.0%) |
| Security & Protection | 0 (0.0%) | 0 (0.0%) |
| Firefighting & Prevention | 0 (0.0%) | 0 (0.0%) |
| Law Enforcement | 0 (0.0%) | 0 (0.0%) |
| Food Preparation & Serving | 0 (0.0%) | 8 (100.0%) |
| Cleaning & Maintenance | 2 (100.0%) | 0 (0.0%) |
| Personal Care & Service | 0 (0.0%) | 2 (100.0%) |
| Total (Category) | 2 (13.3%) | 13 (86.7%) |
| Total (Overall) | 112 (51.8%) | 104 (48.1%) |
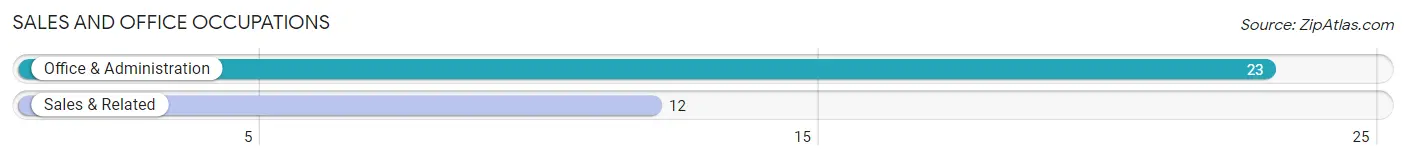
Sales and Office Occupations
The most common Sales and Office occupations in Parkerfield are Office & Administration (23 | 10.6%), and Sales & Related (12 | 5.6%).
Sales and Office Occupations by Sex
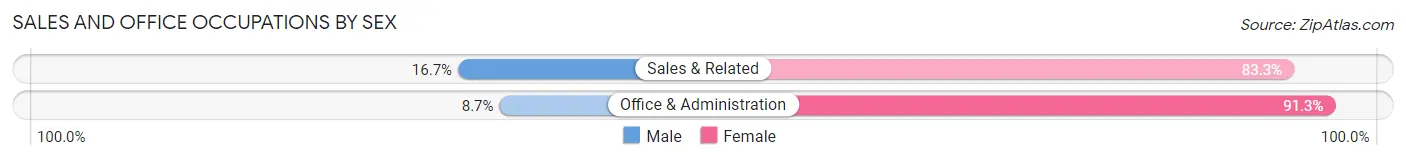
| Occupation | Male | Female |
| Sales & Related | 2 (16.7%) | 10 (83.3%) |
| Office & Administration | 2 (8.7%) | 21 (91.3%) |
| Total (Category) | 4 (11.4%) | 31 (88.6%) |
| Total (Overall) | 112 (51.8%) | 104 (48.1%) |
Natural Resources, Construction and Maintenance Occupations
The most common Natural Resources, Construction and Maintenance occupations in Parkerfield are Installation, Maintenance & Repair (59 | 27.3%), and Construction & Extraction (7 | 3.2%).
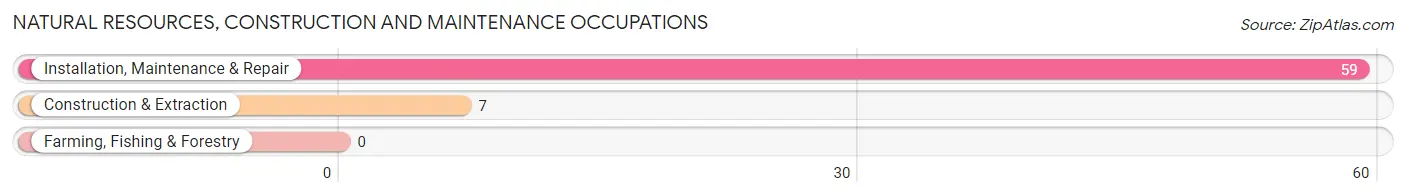
Natural Resources, Construction and Maintenance Occupations by Sex
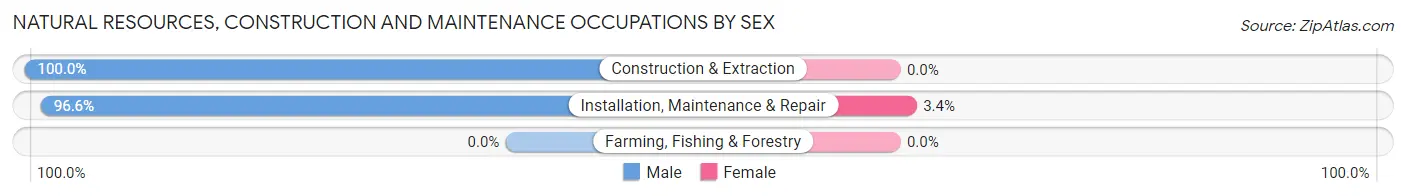
| Occupation | Male | Female |
| Farming, Fishing & Forestry | 0 (0.0%) | 0 (0.0%) |
| Construction & Extraction | 7 (100.0%) | 0 (0.0%) |
| Installation, Maintenance & Repair | 57 (96.6%) | 2 (3.4%) |
| Total (Category) | 64 (97.0%) | 2 (3.0%) |
| Total (Overall) | 112 (51.8%) | 104 (48.1%) |
Production, Transportation and Moving Occupations
The most common Production, Transportation and Moving occupations in Parkerfield are Production (14 | 6.5%), Transportation (10 | 4.6%), and Material Moving (4 | 1.8%).
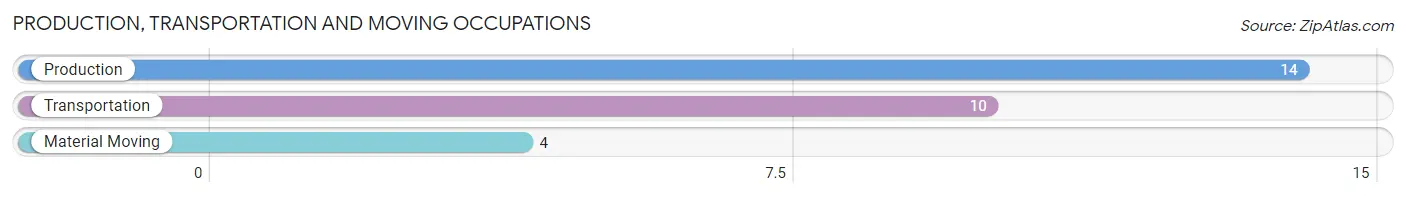
Production, Transportation and Moving Occupations by Sex
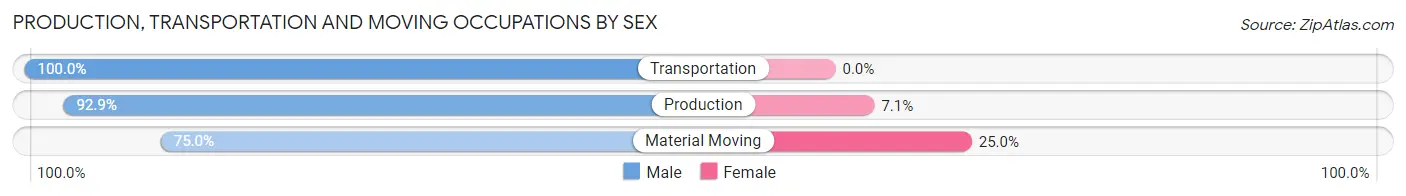
| Occupation | Male | Female |
| Production | 13 (92.9%) | 1 (7.1%) |
| Transportation | 10 (100.0%) | 0 (0.0%) |
| Material Moving | 3 (75.0%) | 1 (25.0%) |
| Total (Category) | 26 (92.9%) | 2 (7.1%) |
| Total (Overall) | 112 (51.8%) | 104 (48.1%) |
Employment Industries by Sex in Parkerfield
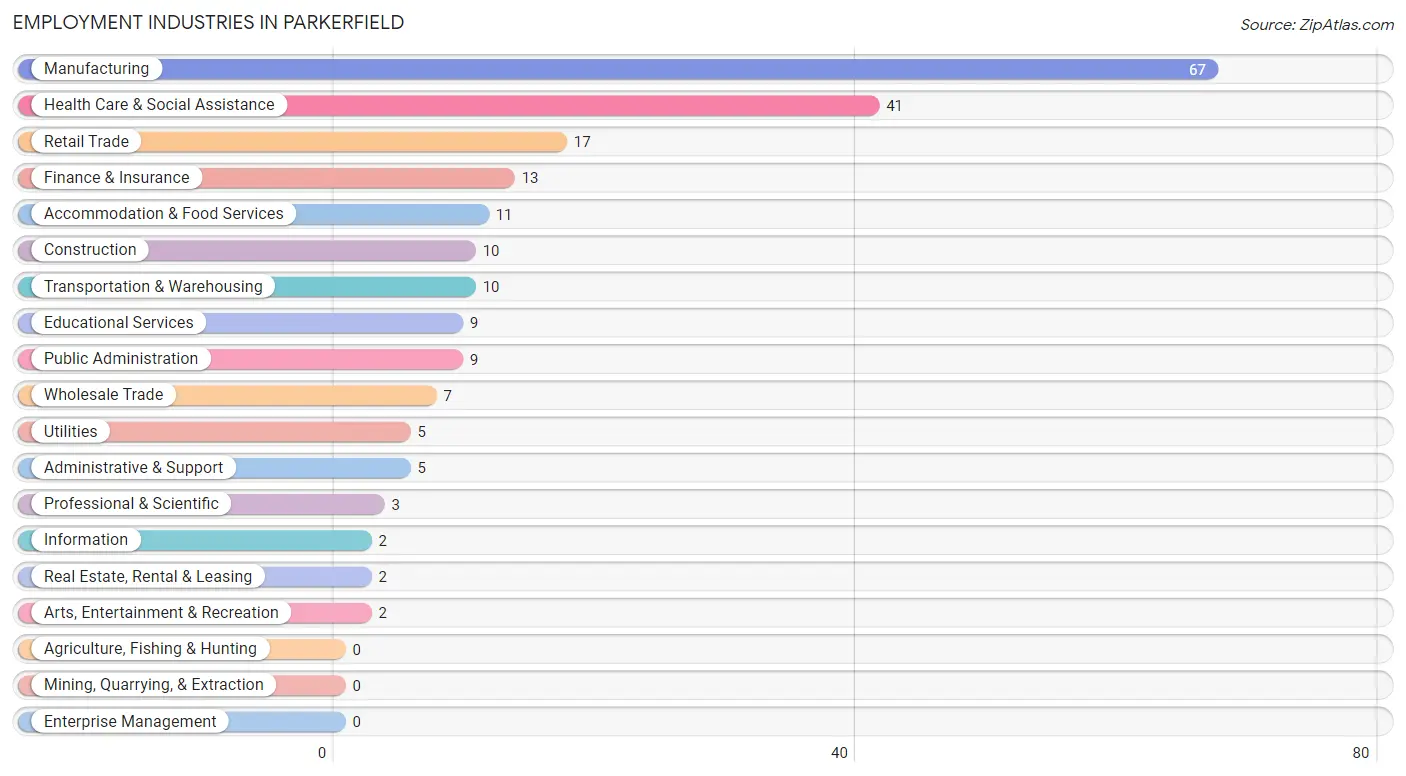
Employment Industries in Parkerfield
The major employment industries in Parkerfield include Manufacturing (67 | 31.0%), Health Care & Social Assistance (41 | 19.0%), Retail Trade (17 | 7.9%), Finance & Insurance (13 | 6.0%), and Accommodation & Food Services (11 | 5.1%).
Employment Industries by Sex in Parkerfield
The Parkerfield industries that see more men than women are Construction (100.0%), Utilities (100.0%), and Professional & Scientific (100.0%), whereas the industries that tend to have a higher number of women are Information (100.0%), Real Estate, Rental & Leasing (100.0%), and Arts, Entertainment & Recreation (100.0%).
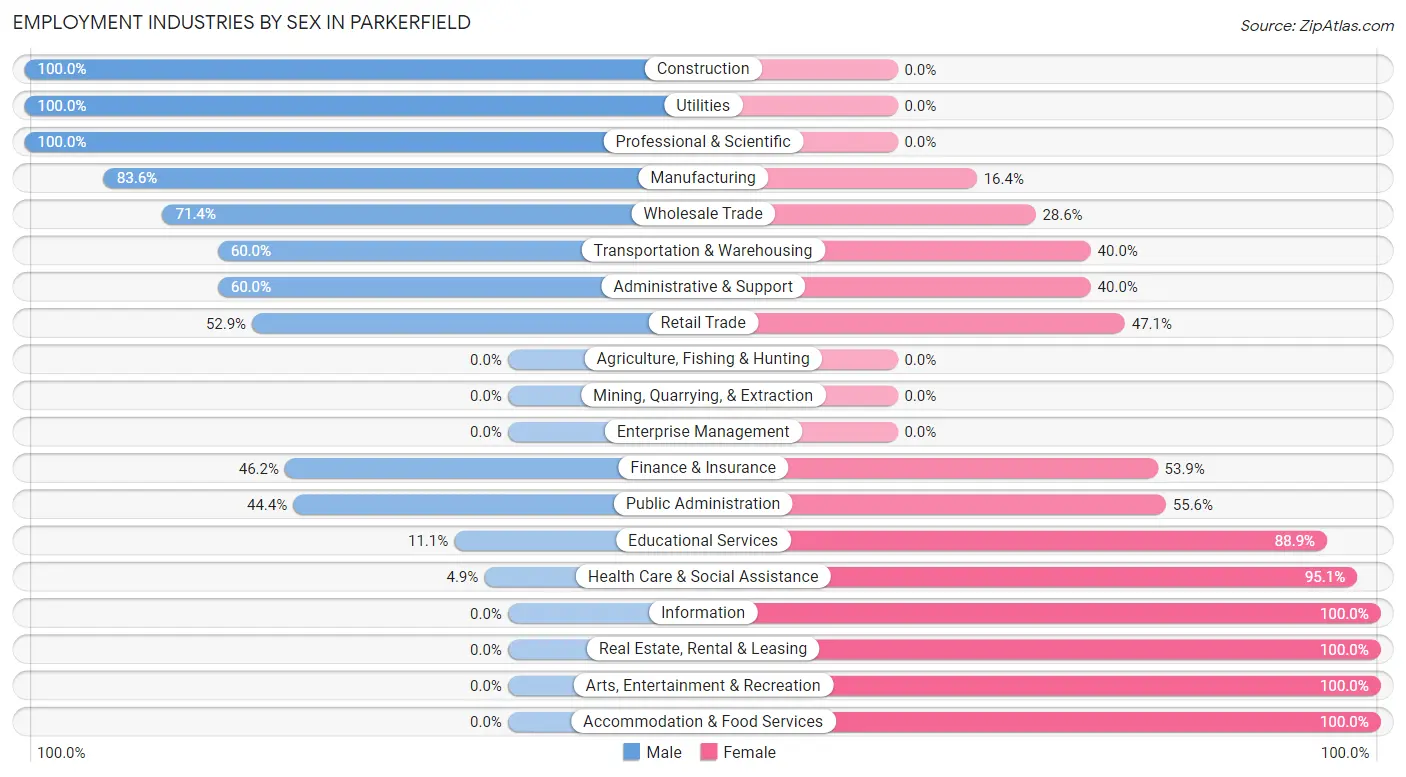
| Industry | Male | Female |
| Agriculture, Fishing & Hunting | 0 (0.0%) | 0 (0.0%) |
| Mining, Quarrying, & Extraction | 0 (0.0%) | 0 (0.0%) |
| Construction | 10 (100.0%) | 0 (0.0%) |
| Manufacturing | 56 (83.6%) | 11 (16.4%) |
| Wholesale Trade | 5 (71.4%) | 2 (28.6%) |
| Retail Trade | 9 (52.9%) | 8 (47.1%) |
| Transportation & Warehousing | 6 (60.0%) | 4 (40.0%) |
| Utilities | 5 (100.0%) | 0 (0.0%) |
| Information | 0 (0.0%) | 2 (100.0%) |
| Finance & Insurance | 6 (46.2%) | 7 (53.8%) |
| Real Estate, Rental & Leasing | 0 (0.0%) | 2 (100.0%) |
| Professional & Scientific | 3 (100.0%) | 0 (0.0%) |
| Enterprise Management | 0 (0.0%) | 0 (0.0%) |
| Administrative & Support | 3 (60.0%) | 2 (40.0%) |
| Educational Services | 1 (11.1%) | 8 (88.9%) |
| Health Care & Social Assistance | 2 (4.9%) | 39 (95.1%) |
| Arts, Entertainment & Recreation | 0 (0.0%) | 2 (100.0%) |
| Accommodation & Food Services | 0 (0.0%) | 11 (100.0%) |
| Public Administration | 4 (44.4%) | 5 (55.6%) |
| Total | 112 (51.8%) | 104 (48.1%) |
Education in Parkerfield
School Enrollment in Parkerfield
The most common levels of schooling among the 139 students in Parkerfield are college / undergraduate (58 | 41.7%), high school (43 | 30.9%), and elementary school (21 | 15.1%).
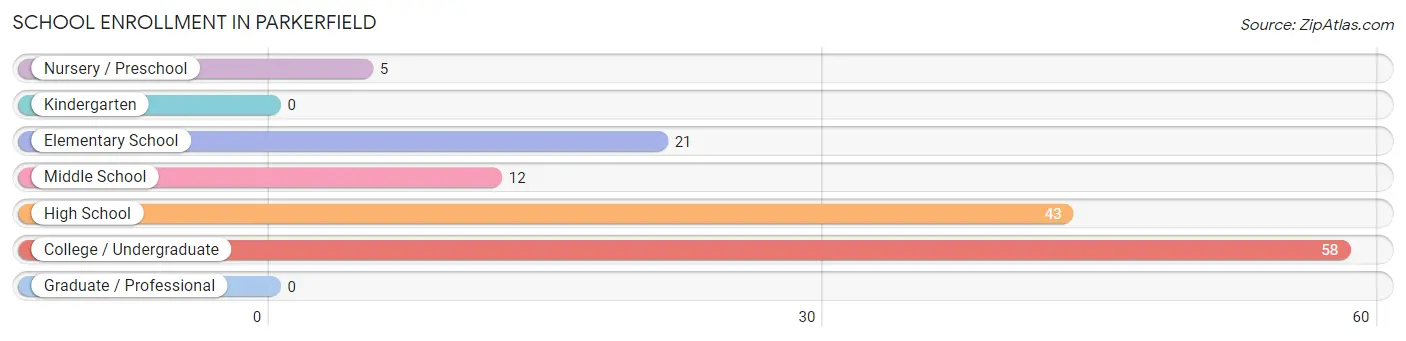
| School Level | # Students | % Students |
| Nursery / Preschool | 5 | 3.6% |
| Kindergarten | 0 | 0.0% |
| Elementary School | 21 | 15.1% |
| Middle School | 12 | 8.6% |
| High School | 43 | 30.9% |
| College / Undergraduate | 58 | 41.7% |
| Graduate / Professional | 0 | 0.0% |
| Total | 139 | 100.0% |
School Enrollment by Age by Funding Source in Parkerfield
Out of a total of 139 students who are enrolled in schools in Parkerfield, 4 (2.9%) attend a private institution, while the remaining 135 (97.1%) are enrolled in public schools. The age group of 3 to 4 year olds has the highest likelihood of being enrolled in private schools, with 1 (33.3% in the age bracket) enrolled. Conversely, the age group of 15 to 17 year olds has the lowest likelihood of being enrolled in a private school, with 36 (100.0% in the age bracket) attending a public institution.
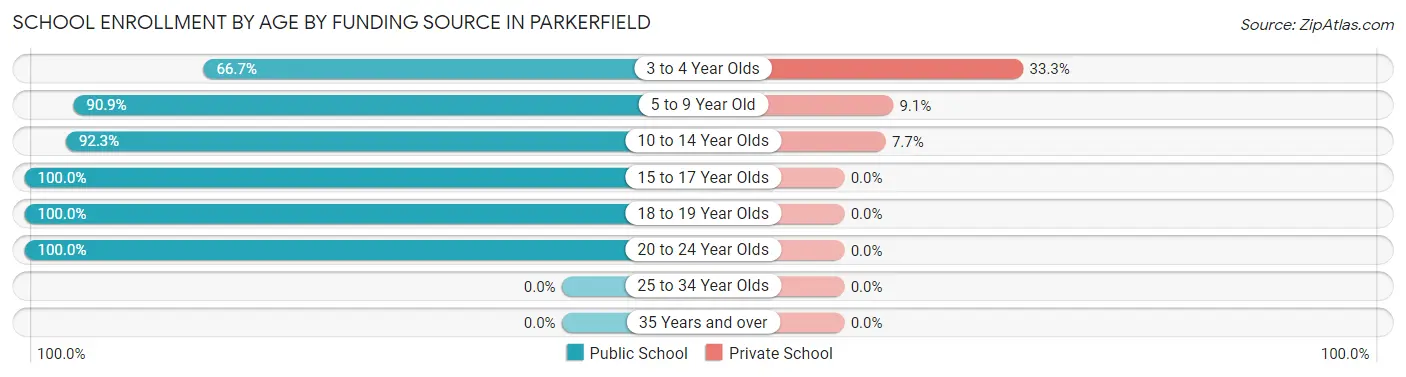
| Age Bracket | Public School | Private School |
| 3 to 4 Year Olds | 2 (66.7%) | 1 (33.3%) |
| 5 to 9 Year Old | 20 (90.9%) | 2 (9.1%) |
| 10 to 14 Year Olds | 12 (92.3%) | 1 (7.7%) |
| 15 to 17 Year Olds | 36 (100.0%) | 0 (0.0%) |
| 18 to 19 Year Olds | 62 (100.0%) | 0 (0.0%) |
| 20 to 24 Year Olds | 3 (100.0%) | 0 (0.0%) |
| 25 to 34 Year Olds | 0 (0.0%) | 0 (0.0%) |
| 35 Years and over | 0 (0.0%) | 0 (0.0%) |
| Total | 135 (97.1%) | 4 (2.9%) |
Educational Attainment by Field of Study in Parkerfield
Science & technology (23 | 24.2%), business (23 | 24.2%), education (19 | 20.0%), arts & humanities (7 | 7.4%), and visual & performing arts (6 | 6.3%) are the most common fields of study among 95 individuals in Parkerfield who have obtained a bachelor's degree or higher.
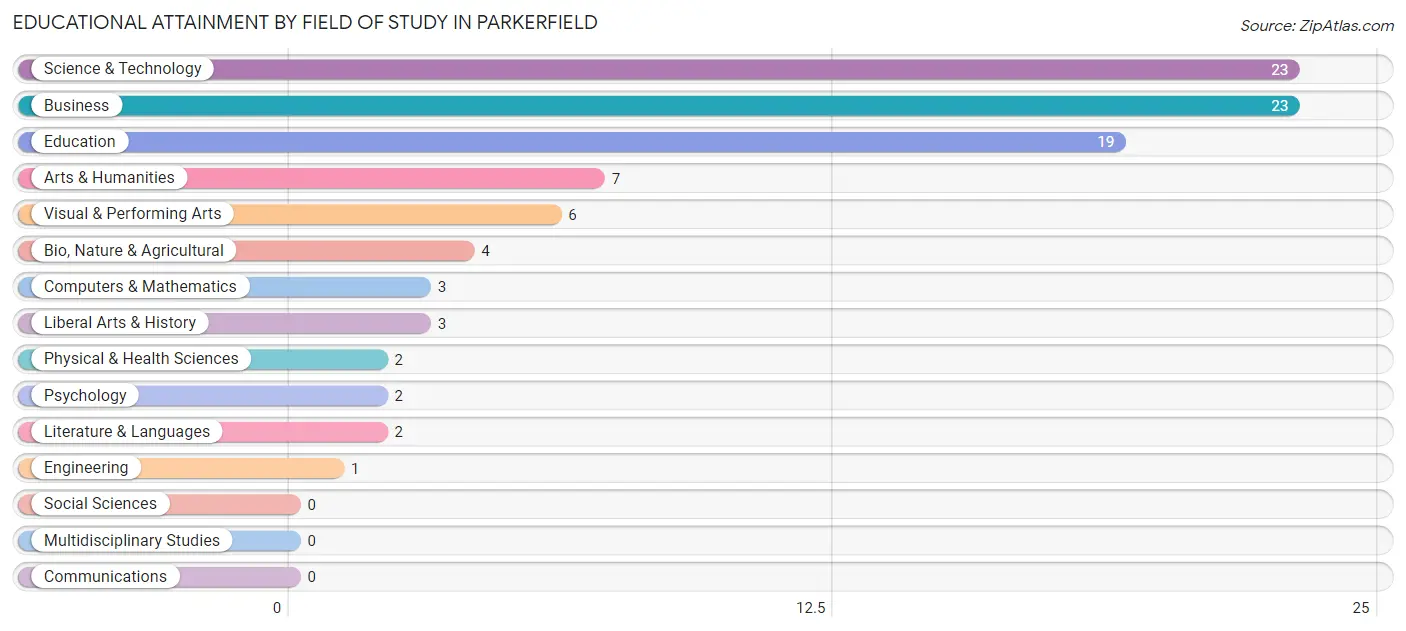
| Field of Study | # Graduates | % Graduates |
| Computers & Mathematics | 3 | 3.2% |
| Bio, Nature & Agricultural | 4 | 4.2% |
| Physical & Health Sciences | 2 | 2.1% |
| Psychology | 2 | 2.1% |
| Social Sciences | 0 | 0.0% |
| Engineering | 1 | 1.1% |
| Multidisciplinary Studies | 0 | 0.0% |
| Science & Technology | 23 | 24.2% |
| Business | 23 | 24.2% |
| Education | 19 | 20.0% |
| Literature & Languages | 2 | 2.1% |
| Liberal Arts & History | 3 | 3.2% |
| Visual & Performing Arts | 6 | 6.3% |
| Communications | 0 | 0.0% |
| Arts & Humanities | 7 | 7.4% |
| Total | 95 | 100.0% |
Transportation & Commute in Parkerfield
Vehicle Availability by Sex in Parkerfield
The most prevalent vehicle ownership categories in Parkerfield are males with 4 vehicles (52, accounting for 46.4%) and females with 4 vehicles (39, making up 50.0%).
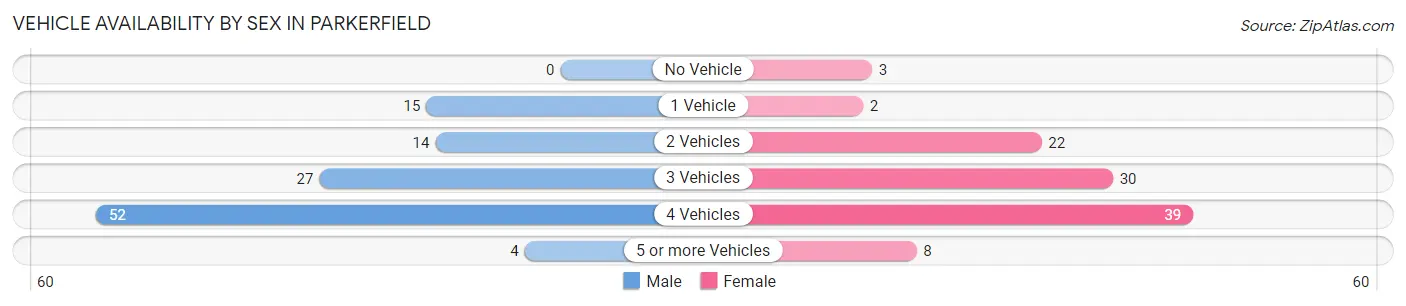
| Vehicles Available | Male | Female |
| No Vehicle | 0 (0.0%) | 3 (2.9%) |
| 1 Vehicle | 15 (13.4%) | 2 (1.9%) |
| 2 Vehicles | 14 (12.5%) | 22 (21.1%) |
| 3 Vehicles | 27 (24.1%) | 30 (28.8%) |
| 4 Vehicles | 52 (46.4%) | 39 (37.5%) |
| 5 or more Vehicles | 4 (3.6%) | 8 (7.7%) |
| Total | 112 (100.0%) | 104 (100.0%) |
Commute Time in Parkerfield
The most frequently occuring commute durations in Parkerfield are 10 to 14 minutes (66 commuters, 31.9%), 20 to 24 minutes (66 commuters, 31.9%), and 15 to 19 minutes (27 commuters, 13.0%).
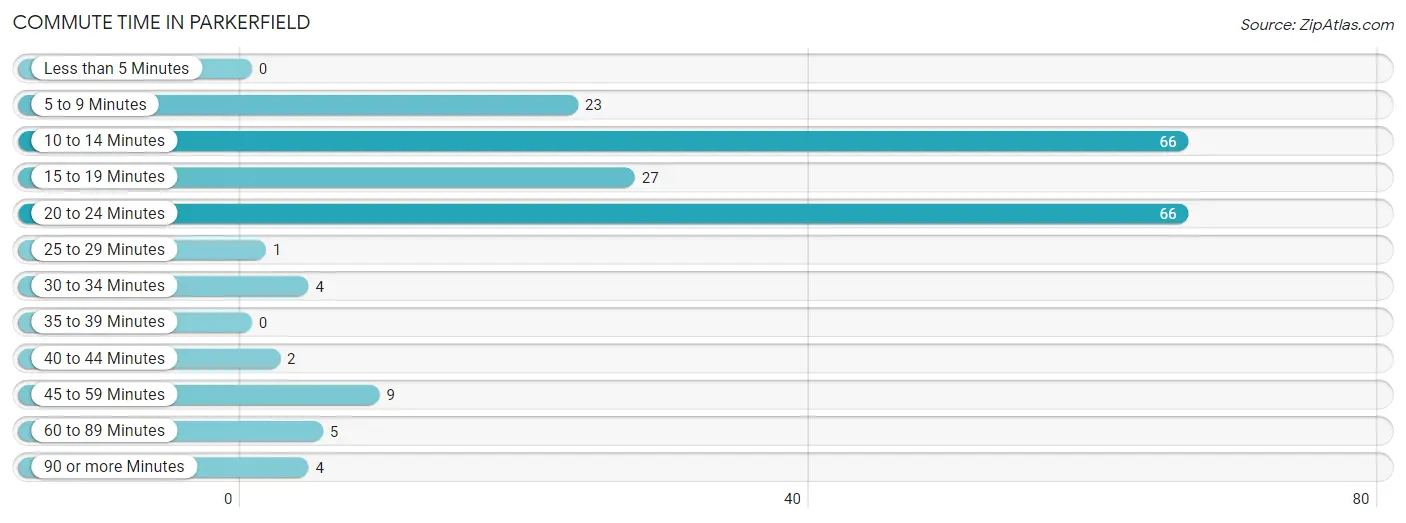
| Commute Time | # Commuters | % Commuters |
| Less than 5 Minutes | 0 | 0.0% |
| 5 to 9 Minutes | 23 | 11.1% |
| 10 to 14 Minutes | 66 | 31.9% |
| 15 to 19 Minutes | 27 | 13.0% |
| 20 to 24 Minutes | 66 | 31.9% |
| 25 to 29 Minutes | 1 | 0.5% |
| 30 to 34 Minutes | 4 | 1.9% |
| 35 to 39 Minutes | 0 | 0.0% |
| 40 to 44 Minutes | 2 | 1.0% |
| 45 to 59 Minutes | 9 | 4.3% |
| 60 to 89 Minutes | 5 | 2.4% |
| 90 or more Minutes | 4 | 1.9% |
Commute Time by Sex in Parkerfield
The most common commute times in Parkerfield are 20 to 24 minutes (40 commuters, 36.0%) for males and 10 to 14 minutes (38 commuters, 39.6%) for females.
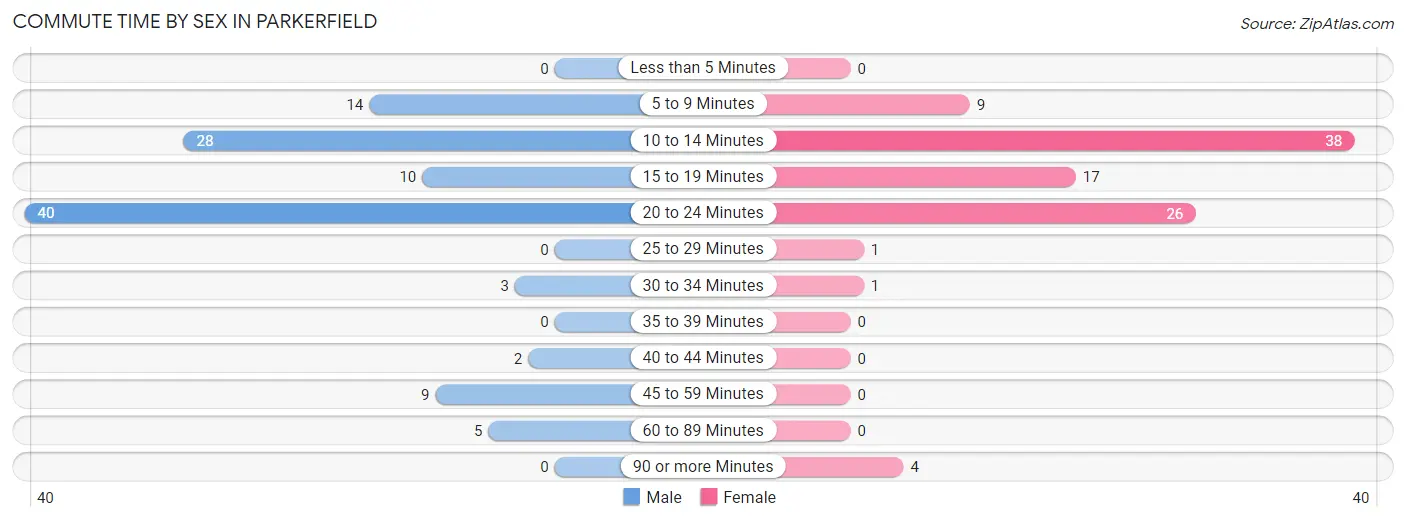
| Commute Time | Male | Female |
| Less than 5 Minutes | 0 (0.0%) | 0 (0.0%) |
| 5 to 9 Minutes | 14 (12.6%) | 9 (9.4%) |
| 10 to 14 Minutes | 28 (25.2%) | 38 (39.6%) |
| 15 to 19 Minutes | 10 (9.0%) | 17 (17.7%) |
| 20 to 24 Minutes | 40 (36.0%) | 26 (27.1%) |
| 25 to 29 Minutes | 0 (0.0%) | 1 (1.0%) |
| 30 to 34 Minutes | 3 (2.7%) | 1 (1.0%) |
| 35 to 39 Minutes | 0 (0.0%) | 0 (0.0%) |
| 40 to 44 Minutes | 2 (1.8%) | 0 (0.0%) |
| 45 to 59 Minutes | 9 (8.1%) | 0 (0.0%) |
| 60 to 89 Minutes | 5 (4.5%) | 0 (0.0%) |
| 90 or more Minutes | 0 (0.0%) | 4 (4.2%) |
Time of Departure to Work by Sex in Parkerfield
The most frequent times of departure to work in Parkerfield are 12:00 PM to 3:59 PM (42, 37.8%) for males and 6:00 AM to 6:29 AM (24, 25.0%) for females.
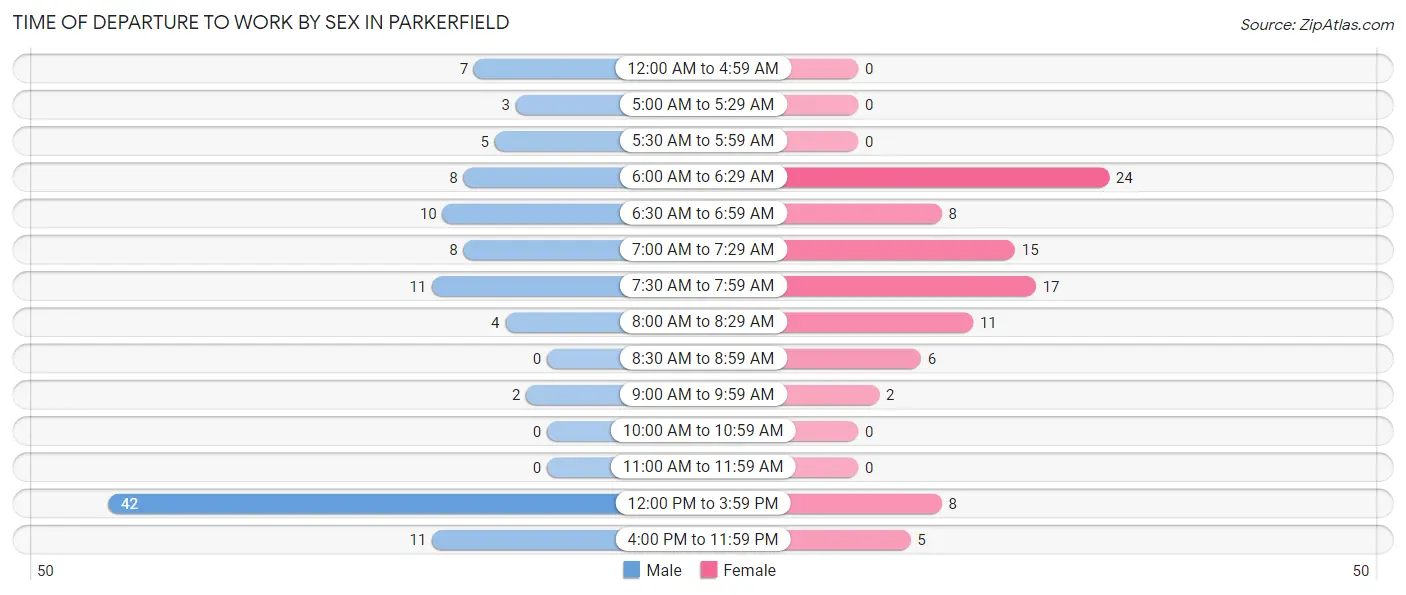
| Time of Departure | Male | Female |
| 12:00 AM to 4:59 AM | 7 (6.3%) | 0 (0.0%) |
| 5:00 AM to 5:29 AM | 3 (2.7%) | 0 (0.0%) |
| 5:30 AM to 5:59 AM | 5 (4.5%) | 0 (0.0%) |
| 6:00 AM to 6:29 AM | 8 (7.2%) | 24 (25.0%) |
| 6:30 AM to 6:59 AM | 10 (9.0%) | 8 (8.3%) |
| 7:00 AM to 7:29 AM | 8 (7.2%) | 15 (15.6%) |
| 7:30 AM to 7:59 AM | 11 (9.9%) | 17 (17.7%) |
| 8:00 AM to 8:29 AM | 4 (3.6%) | 11 (11.5%) |
| 8:30 AM to 8:59 AM | 0 (0.0%) | 6 (6.2%) |
| 9:00 AM to 9:59 AM | 2 (1.8%) | 2 (2.1%) |
| 10:00 AM to 10:59 AM | 0 (0.0%) | 0 (0.0%) |
| 11:00 AM to 11:59 AM | 0 (0.0%) | 0 (0.0%) |
| 12:00 PM to 3:59 PM | 42 (37.8%) | 8 (8.3%) |
| 4:00 PM to 11:59 PM | 11 (9.9%) | 5 (5.2%) |
| Total | 111 (100.0%) | 96 (100.0%) |
Housing Occupancy in Parkerfield
Occupancy by Ownership in Parkerfield
Of the total 211 dwellings in Parkerfield, owner-occupied units account for 209 (99.1%), while renter-occupied units make up 2 (0.9%).
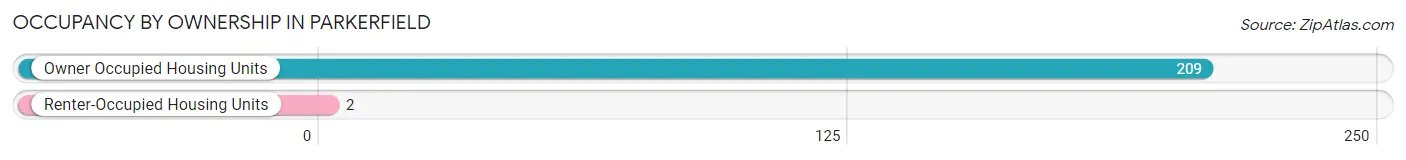
| Occupancy | # Housing Units | % Housing Units |
| Owner Occupied Housing Units | 209 | 99.1% |
| Renter-Occupied Housing Units | 2 | 0.9% |
| Total Occupied Housing Units | 211 | 100.0% |
Occupancy by Household Size in Parkerfield
| Household Size | # Housing Units | % Housing Units |
| 1-Person Household | 41 | 19.4% |
| 2-Person Household | 101 | 47.9% |
| 3-Person Household | 18 | 8.5% |
| 4+ Person Household | 51 | 24.2% |
| Total Housing Units | 211 | 100.0% |
Occupancy by Ownership by Household Size in Parkerfield
| Household Size | Owner-occupied | Renter-occupied |
| 1-Person Household | 41 (100.0%) | 0 (0.0%) |
| 2-Person Household | 101 (100.0%) | 0 (0.0%) |
| 3-Person Household | 18 (100.0%) | 0 (0.0%) |
| 4+ Person Household | 49 (96.1%) | 2 (3.9%) |
| Total Housing Units | 209 (99.1%) | 2 (0.9%) |
Occupancy by Educational Attainment in Parkerfield
| Household Size | Owner-occupied | Renter-occupied |
| Less than High School | 1 (100.0%) | 0 (0.0%) |
| High School Diploma | 53 (96.4%) | 2 (3.6%) |
| College/Associate Degree | 106 (100.0%) | 0 (0.0%) |
| Bachelor's Degree or higher | 49 (100.0%) | 0 (0.0%) |
Occupancy by Age of Householder in Parkerfield
| Age Bracket | # Households | % Households |
| Under 35 Years | 12 | 5.7% |
| 35 to 44 Years | 44 | 20.8% |
| 45 to 54 Years | 8 | 3.8% |
| 55 to 64 Years | 43 | 20.4% |
| 65 to 74 Years | 71 | 33.7% |
| 75 to 84 Years | 14 | 6.6% |
| 85 Years and Over | 19 | 9.0% |
| Total | 211 | 100.0% |
Housing Finances in Parkerfield
Median Income by Occupancy in Parkerfield
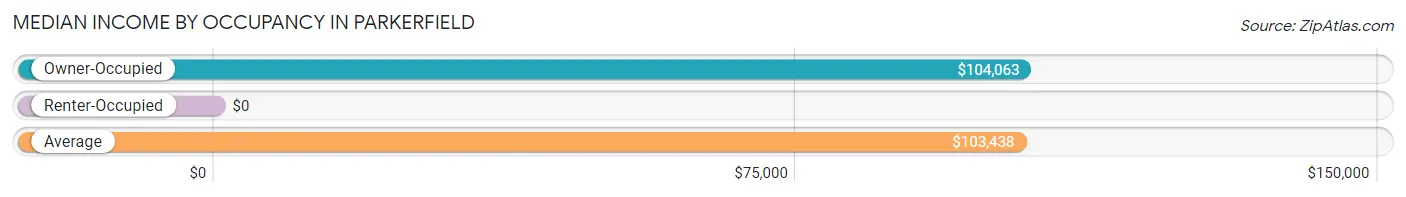
| Occupancy Type | # Households | Median Income |
| Owner-Occupied | 209 (99.1%) | $104,063 |
| Renter-Occupied | 2 (0.9%) | $0 |
| Average | 211 (100.0%) | $103,438 |
Occupancy by Householder Income Bracket in Parkerfield
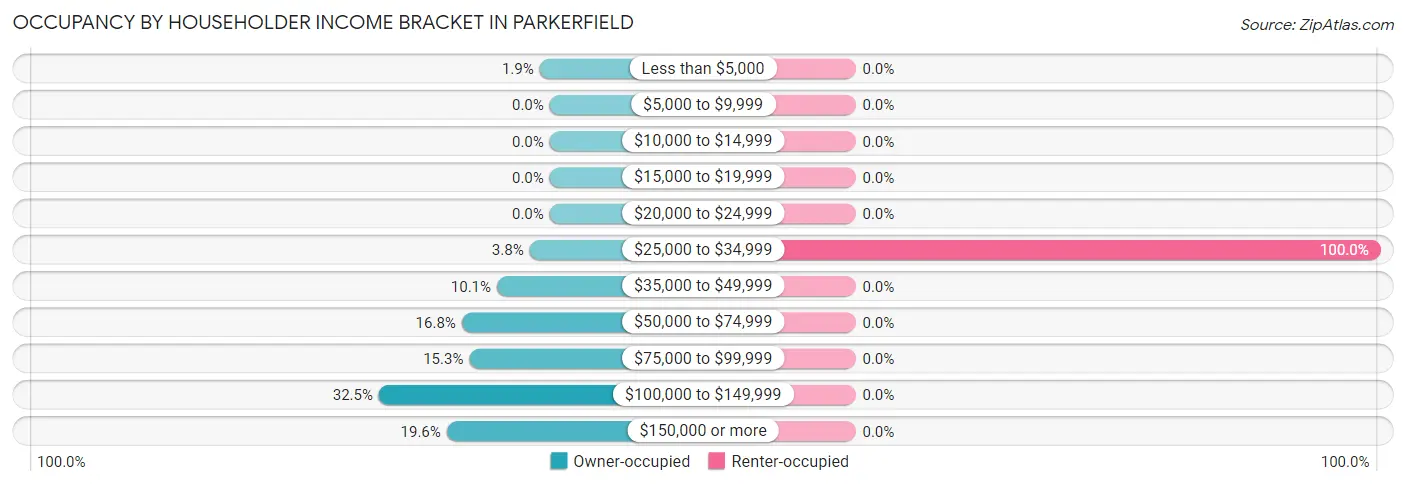
| Income Bracket | Owner-occupied | Renter-occupied |
| Less than $5,000 | 4 (1.9%) | 0 (0.0%) |
| $5,000 to $9,999 | 0 (0.0%) | 0 (0.0%) |
| $10,000 to $14,999 | 0 (0.0%) | 0 (0.0%) |
| $15,000 to $19,999 | 0 (0.0%) | 0 (0.0%) |
| $20,000 to $24,999 | 0 (0.0%) | 0 (0.0%) |
| $25,000 to $34,999 | 8 (3.8%) | 2 (100.0%) |
| $35,000 to $49,999 | 21 (10.1%) | 0 (0.0%) |
| $50,000 to $74,999 | 35 (16.8%) | 0 (0.0%) |
| $75,000 to $99,999 | 32 (15.3%) | 0 (0.0%) |
| $100,000 to $149,999 | 68 (32.5%) | 0 (0.0%) |
| $150,000 or more | 41 (19.6%) | 0 (0.0%) |
| Total | 209 (100.0%) | 2 (100.0%) |
Monthly Housing Cost Tiers in Parkerfield
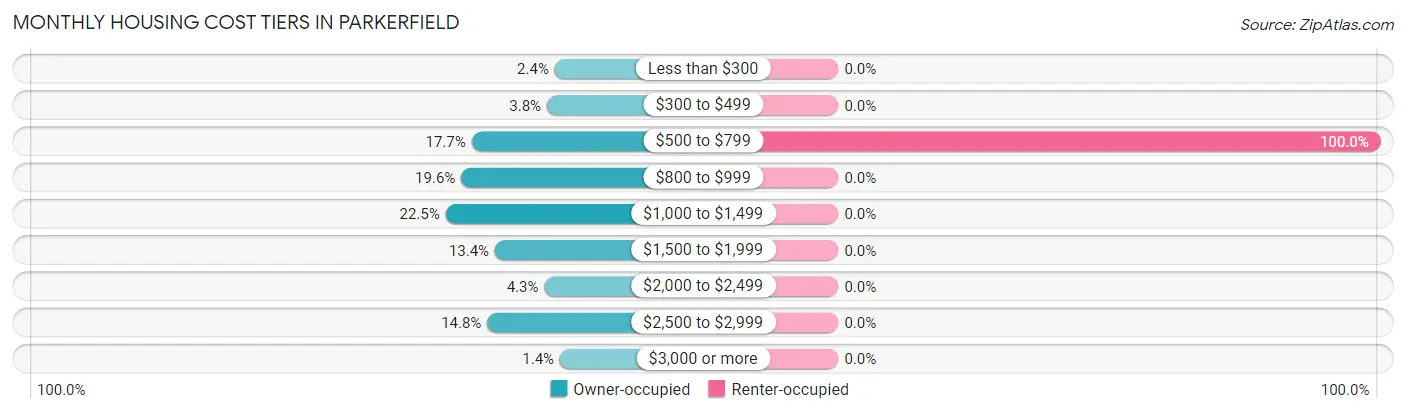
| Monthly Cost | Owner-occupied | Renter-occupied |
| Less than $300 | 5 (2.4%) | 0 (0.0%) |
| $300 to $499 | 8 (3.8%) | 0 (0.0%) |
| $500 to $799 | 37 (17.7%) | 2 (100.0%) |
| $800 to $999 | 41 (19.6%) | 0 (0.0%) |
| $1,000 to $1,499 | 47 (22.5%) | 0 (0.0%) |
| $1,500 to $1,999 | 28 (13.4%) | 0 (0.0%) |
| $2,000 to $2,499 | 9 (4.3%) | 0 (0.0%) |
| $2,500 to $2,999 | 31 (14.8%) | 0 (0.0%) |
| $3,000 or more | 3 (1.4%) | 0 (0.0%) |
| Total | 209 (100.0%) | 2 (100.0%) |
Physical Housing Characteristics in Parkerfield
Housing Structures in Parkerfield
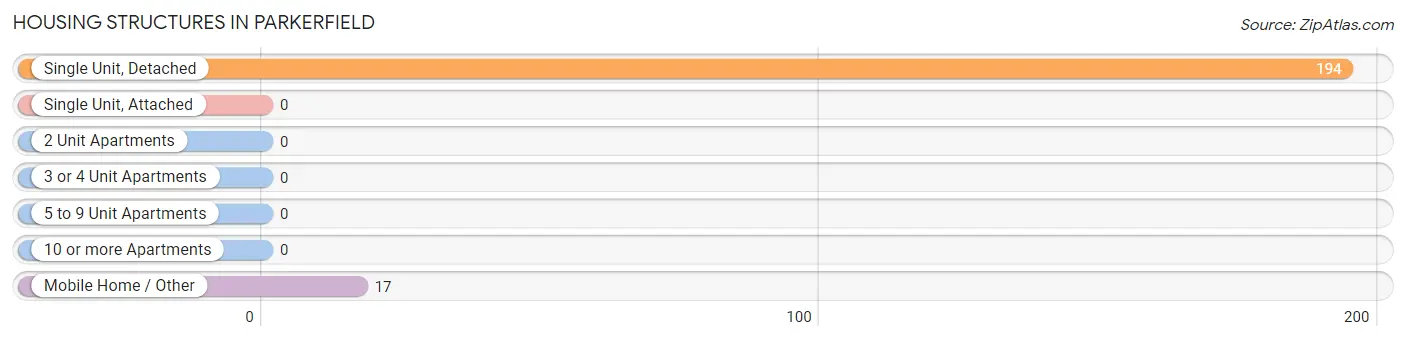
| Structure Type | # Housing Units | % Housing Units |
| Single Unit, Detached | 194 | 91.9% |
| Single Unit, Attached | 0 | 0.0% |
| 2 Unit Apartments | 0 | 0.0% |
| 3 or 4 Unit Apartments | 0 | 0.0% |
| 5 to 9 Unit Apartments | 0 | 0.0% |
| 10 or more Apartments | 0 | 0.0% |
| Mobile Home / Other | 17 | 8.1% |
| Total | 211 | 100.0% |
Housing Structures by Occupancy in Parkerfield
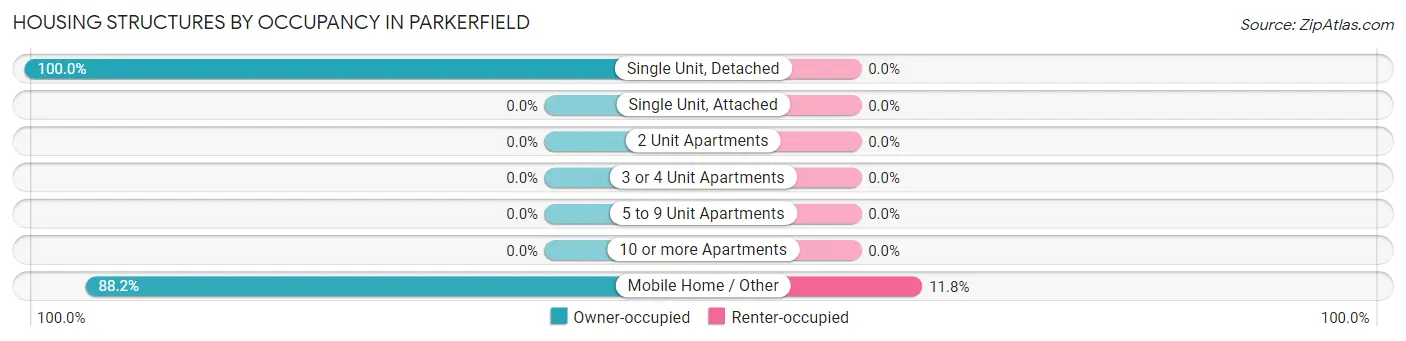
| Structure Type | Owner-occupied | Renter-occupied |
| Single Unit, Detached | 194 (100.0%) | 0 (0.0%) |
| Single Unit, Attached | 0 (0.0%) | 0 (0.0%) |
| 2 Unit Apartments | 0 (0.0%) | 0 (0.0%) |
| 3 or 4 Unit Apartments | 0 (0.0%) | 0 (0.0%) |
| 5 to 9 Unit Apartments | 0 (0.0%) | 0 (0.0%) |
| 10 or more Apartments | 0 (0.0%) | 0 (0.0%) |
| Mobile Home / Other | 15 (88.2%) | 2 (11.8%) |
| Total | 209 (99.1%) | 2 (0.9%) |
Housing Structures by Number of Rooms in Parkerfield
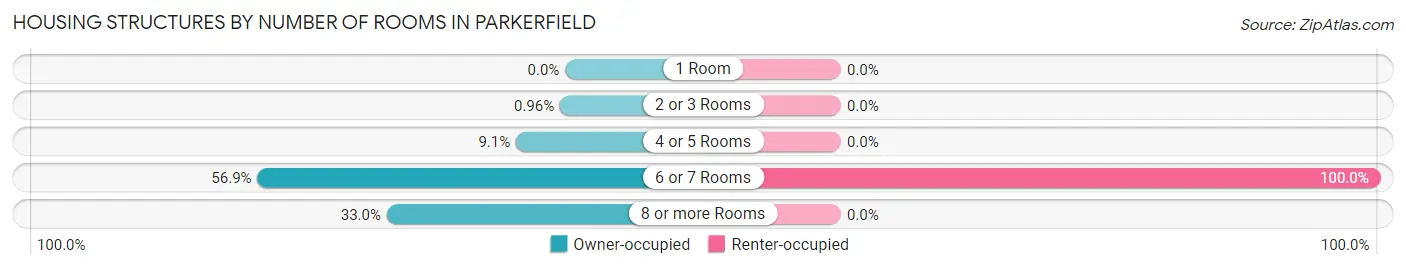
| Number of Rooms | Owner-occupied | Renter-occupied |
| 1 Room | 0 (0.0%) | 0 (0.0%) |
| 2 or 3 Rooms | 2 (1.0%) | 0 (0.0%) |
| 4 or 5 Rooms | 19 (9.1%) | 0 (0.0%) |
| 6 or 7 Rooms | 119 (56.9%) | 2 (100.0%) |
| 8 or more Rooms | 69 (33.0%) | 0 (0.0%) |
| Total | 209 (100.0%) | 2 (100.0%) |
Housing Structure by Heating Type in Parkerfield
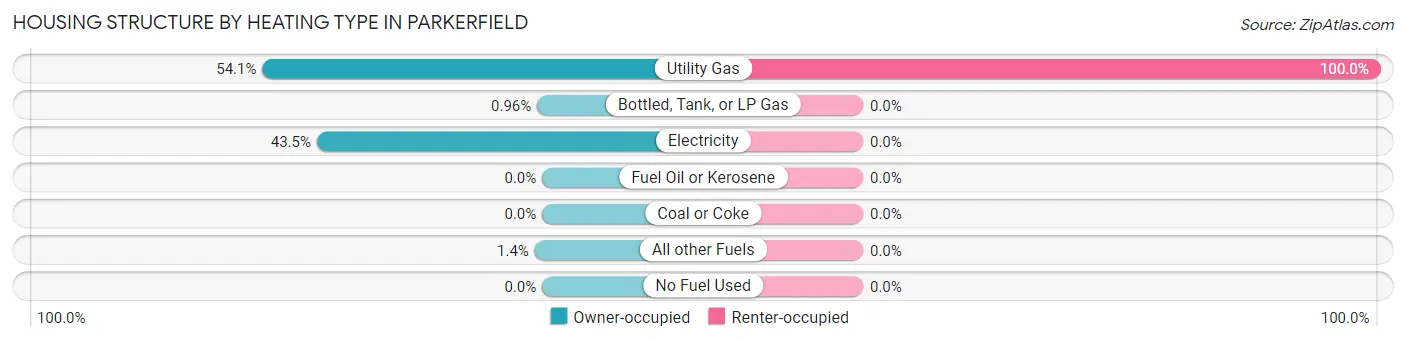
| Heating Type | Owner-occupied | Renter-occupied |
| Utility Gas | 113 (54.1%) | 2 (100.0%) |
| Bottled, Tank, or LP Gas | 2 (1.0%) | 0 (0.0%) |
| Electricity | 91 (43.5%) | 0 (0.0%) |
| Fuel Oil or Kerosene | 0 (0.0%) | 0 (0.0%) |
| Coal or Coke | 0 (0.0%) | 0 (0.0%) |
| All other Fuels | 3 (1.4%) | 0 (0.0%) |
| No Fuel Used | 0 (0.0%) | 0 (0.0%) |
| Total | 209 (100.0%) | 2 (100.0%) |
Household Vehicle Usage in Parkerfield
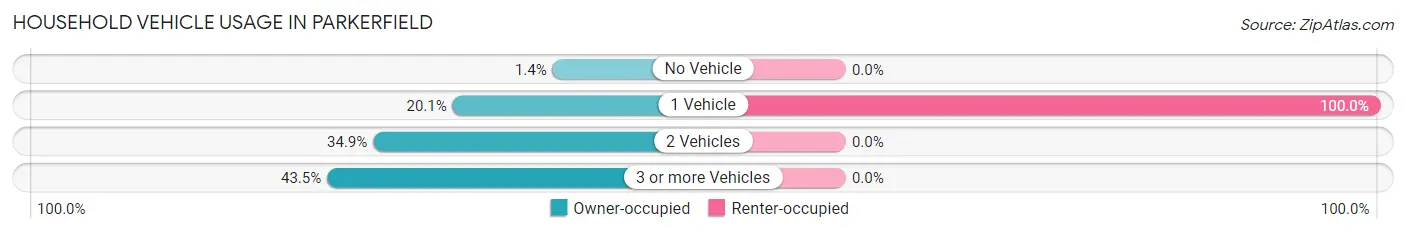
| Vehicles per Household | Owner-occupied | Renter-occupied |
| No Vehicle | 3 (1.4%) | 0 (0.0%) |
| 1 Vehicle | 42 (20.1%) | 2 (100.0%) |
| 2 Vehicles | 73 (34.9%) | 0 (0.0%) |
| 3 or more Vehicles | 91 (43.5%) | 0 (0.0%) |
| Total | 209 (100.0%) | 2 (100.0%) |
Real Estate & Mortgages in Parkerfield
Real Estate and Mortgage Overview in Parkerfield
| Characteristic | Without Mortgage | With Mortgage |
| Housing Units | 85 | 124 |
| Median Property Value | $172,200 | $213,200 |
| Median Household Income | $74,250 | $19 |
| Monthly Housing Costs | $779 | $3 |
| Real Estate Taxes | $3,083 | $0 |
Property Value by Mortgage Status in Parkerfield
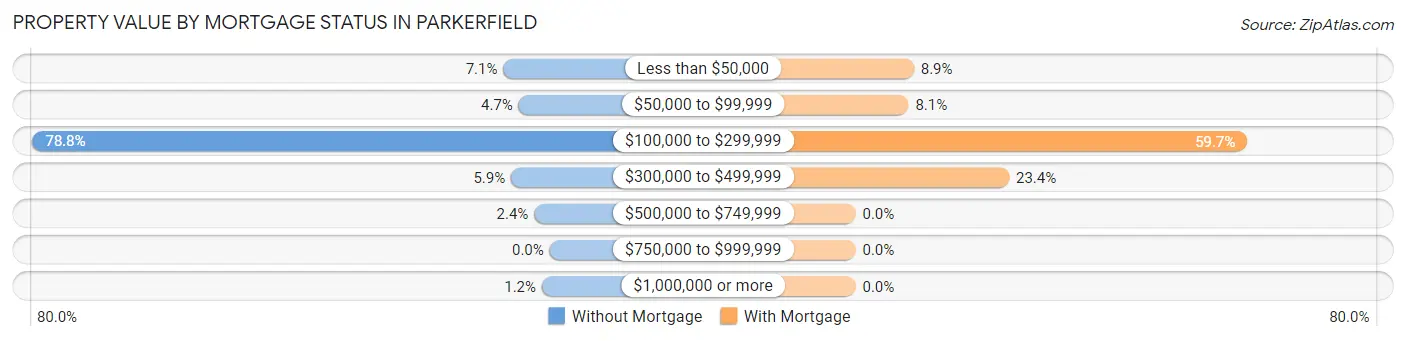
| Property Value | Without Mortgage | With Mortgage |
| Less than $50,000 | 6 (7.1%) | 11 (8.9%) |
| $50,000 to $99,999 | 4 (4.7%) | 10 (8.1%) |
| $100,000 to $299,999 | 67 (78.8%) | 74 (59.7%) |
| $300,000 to $499,999 | 5 (5.9%) | 29 (23.4%) |
| $500,000 to $749,999 | 2 (2.4%) | 0 (0.0%) |
| $750,000 to $999,999 | 0 (0.0%) | 0 (0.0%) |
| $1,000,000 or more | 1 (1.2%) | 0 (0.0%) |
| Total | 85 (100.0%) | 124 (100.0%) |
Household Income by Mortgage Status in Parkerfield
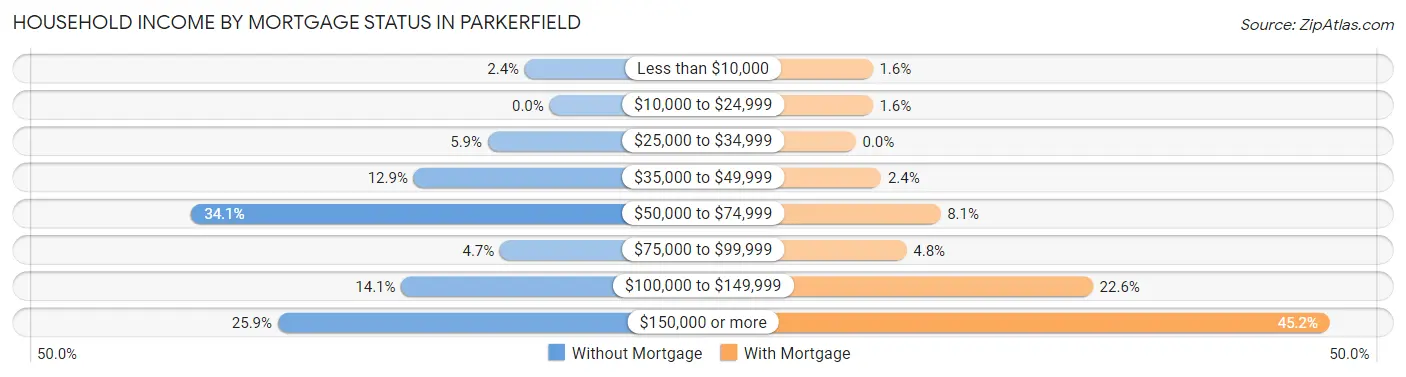
| Household Income | Without Mortgage | With Mortgage |
| Less than $10,000 | 2 (2.4%) | 2 (1.6%) |
| $10,000 to $24,999 | 0 (0.0%) | 2 (1.6%) |
| $25,000 to $34,999 | 5 (5.9%) | 0 (0.0%) |
| $35,000 to $49,999 | 11 (12.9%) | 3 (2.4%) |
| $50,000 to $74,999 | 29 (34.1%) | 10 (8.1%) |
| $75,000 to $99,999 | 4 (4.7%) | 6 (4.8%) |
| $100,000 to $149,999 | 12 (14.1%) | 28 (22.6%) |
| $150,000 or more | 22 (25.9%) | 56 (45.2%) |
| Total | 85 (100.0%) | 124 (100.0%) |
Property Value to Household Income Ratio in Parkerfield
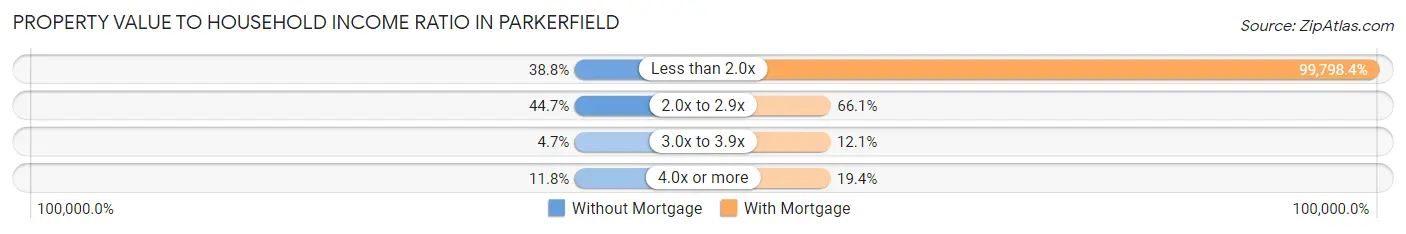
| Value-to-Income Ratio | Without Mortgage | With Mortgage |
| Less than 2.0x | 33 (38.8%) | 123,750 (99,798.4%) |
| 2.0x to 2.9x | 38 (44.7%) | 82 (66.1%) |
| 3.0x to 3.9x | 4 (4.7%) | 15 (12.1%) |
| 4.0x or more | 10 (11.8%) | 24 (19.4%) |
| Total | 85 (100.0%) | 124 (100.0%) |
Real Estate Taxes by Mortgage Status in Parkerfield
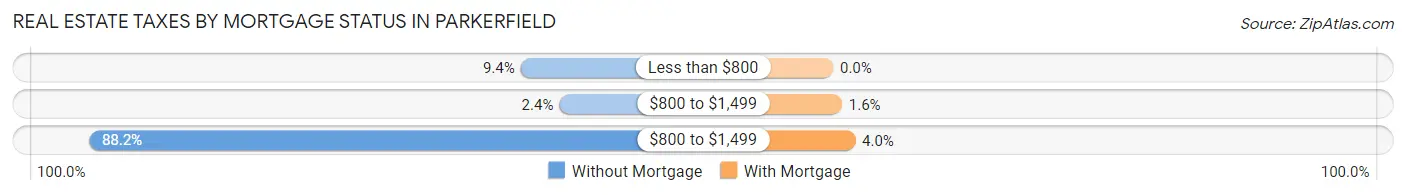
| Property Taxes | Without Mortgage | With Mortgage |
| Less than $800 | 8 (9.4%) | 0 (0.0%) |
| $800 to $1,499 | 2 (2.4%) | 2 (1.6%) |
| $800 to $1,499 | 75 (88.2%) | 5 (4.0%) |
| Total | 85 (100.0%) | 124 (100.0%) |
Health & Disability in Parkerfield
Health Insurance Coverage by Age in Parkerfield
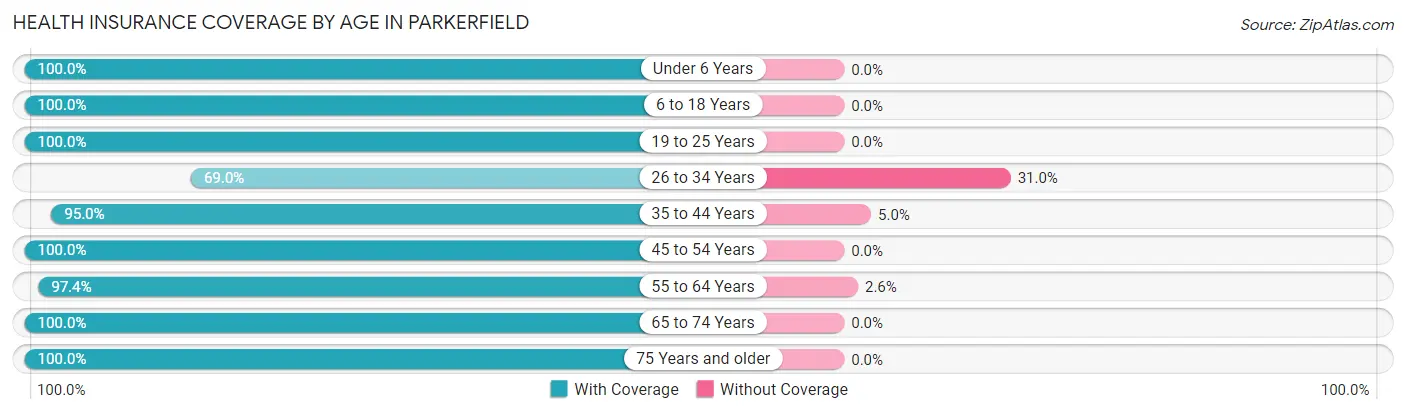
| Age Bracket | With Coverage | Without Coverage |
| Under 6 Years | 11 (100.0%) | 0 (0.0%) |
| 6 to 18 Years | 77 (100.0%) | 0 (0.0%) |
| 19 to 25 Years | 77 (100.0%) | 0 (0.0%) |
| 26 to 34 Years | 20 (69.0%) | 9 (31.0%) |
| 35 to 44 Years | 57 (95.0%) | 3 (5.0%) |
| 45 to 54 Years | 56 (100.0%) | 0 (0.0%) |
| 55 to 64 Years | 76 (97.4%) | 2 (2.6%) |
| 65 to 74 Years | 131 (100.0%) | 0 (0.0%) |
| 75 Years and older | 45 (100.0%) | 0 (0.0%) |
| Total | 550 (97.5%) | 14 (2.5%) |
Health Insurance Coverage by Citizenship Status in Parkerfield
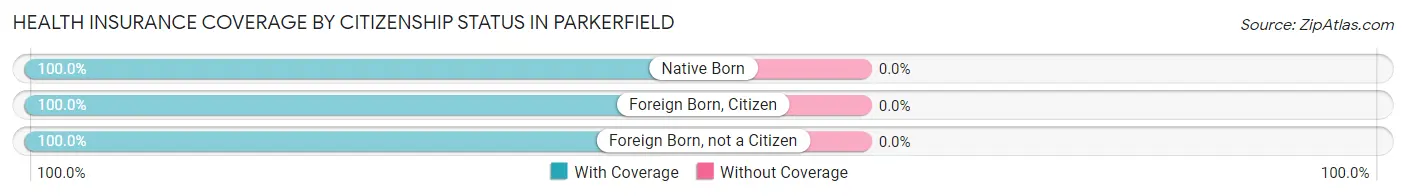
| Citizenship Status | With Coverage | Without Coverage |
| Native Born | 11 (100.0%) | 0 (0.0%) |
| Foreign Born, Citizen | 77 (100.0%) | 0 (0.0%) |
| Foreign Born, not a Citizen | 77 (100.0%) | 0 (0.0%) |
Health Insurance Coverage by Household Income in Parkerfield
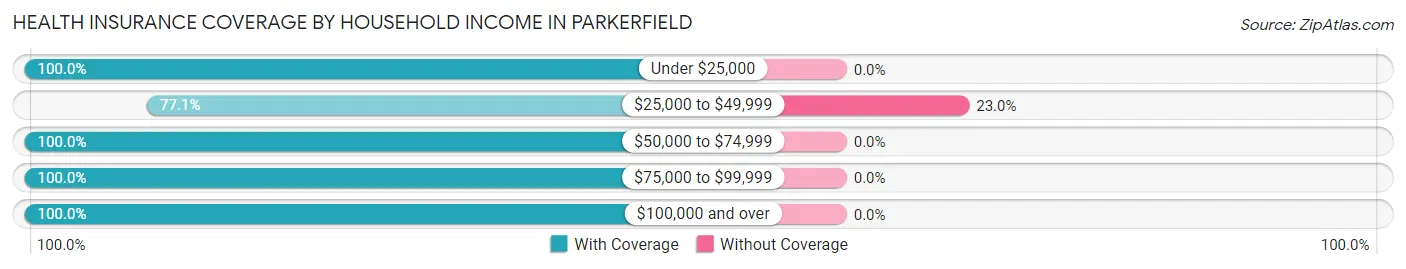
| Household Income | With Coverage | Without Coverage |
| Under $25,000 | 4 (100.0%) | 0 (0.0%) |
| $25,000 to $49,999 | 47 (77.0%) | 14 (23.0%) |
| $50,000 to $74,999 | 62 (100.0%) | 0 (0.0%) |
| $75,000 to $99,999 | 70 (100.0%) | 0 (0.0%) |
| $100,000 and over | 367 (100.0%) | 0 (0.0%) |
Public vs Private Health Insurance Coverage by Age in Parkerfield
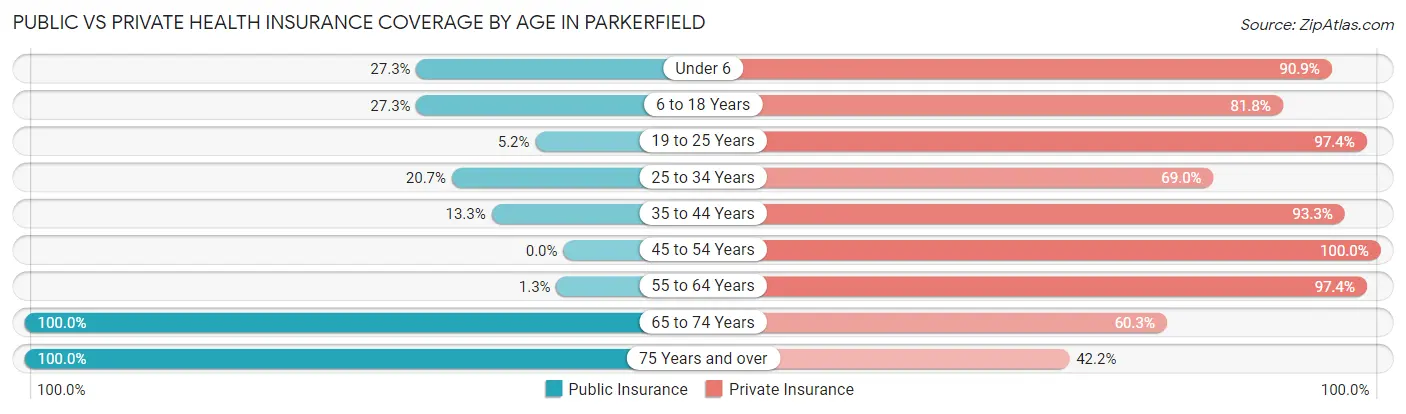
| Age Bracket | Public Insurance | Private Insurance |
| Under 6 | 3 (27.3%) | 10 (90.9%) |
| 6 to 18 Years | 21 (27.3%) | 63 (81.8%) |
| 19 to 25 Years | 4 (5.2%) | 75 (97.4%) |
| 25 to 34 Years | 6 (20.7%) | 20 (69.0%) |
| 35 to 44 Years | 8 (13.3%) | 56 (93.3%) |
| 45 to 54 Years | 0 (0.0%) | 56 (100.0%) |
| 55 to 64 Years | 1 (1.3%) | 76 (97.4%) |
| 65 to 74 Years | 131 (100.0%) | 79 (60.3%) |
| 75 Years and over | 45 (100.0%) | 19 (42.2%) |
| Total | 219 (38.8%) | 454 (80.5%) |
Disability Status by Sex by Age in Parkerfield
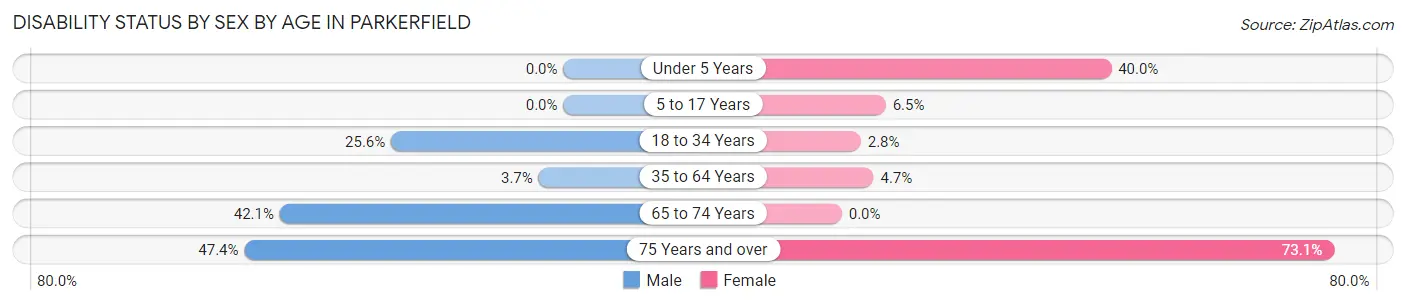
| Age Bracket | Male | Female |
| Under 5 Years | 0 (0.0%) | 2 (40.0%) |
| 5 to 17 Years | 0 (0.0%) | 3 (6.5%) |
| 18 to 34 Years | 11 (25.6%) | 2 (2.8%) |
| 35 to 64 Years | 4 (3.7%) | 4 (4.7%) |
| 65 to 74 Years | 24 (42.1%) | 0 (0.0%) |
| 75 Years and over | 9 (47.4%) | 19 (73.1%) |
Disability Class by Sex by Age in Parkerfield
Disability Class: Hearing Difficulty
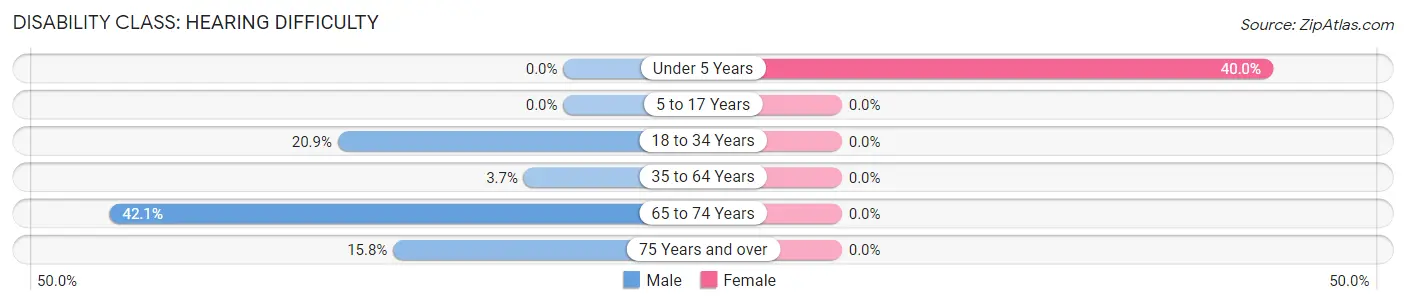
| Age Bracket | Male | Female |
| Under 5 Years | 0 (0.0%) | 2 (40.0%) |
| 5 to 17 Years | 0 (0.0%) | 0 (0.0%) |
| 18 to 34 Years | 9 (20.9%) | 0 (0.0%) |
| 35 to 64 Years | 4 (3.7%) | 0 (0.0%) |
| 65 to 74 Years | 24 (42.1%) | 0 (0.0%) |
| 75 Years and over | 3 (15.8%) | 0 (0.0%) |
Disability Class: Vision Difficulty
| Age Bracket | Male | Female |
| Under 5 Years | 0 (0.0%) | 0 (0.0%) |
| 5 to 17 Years | 0 (0.0%) | 0 (0.0%) |
| 18 to 34 Years | 0 (0.0%) | 0 (0.0%) |
| 35 to 64 Years | 0 (0.0%) | 0 (0.0%) |
| 65 to 74 Years | 0 (0.0%) | 0 (0.0%) |
| 75 Years and over | 0 (0.0%) | 0 (0.0%) |
Disability Class: Cognitive Difficulty
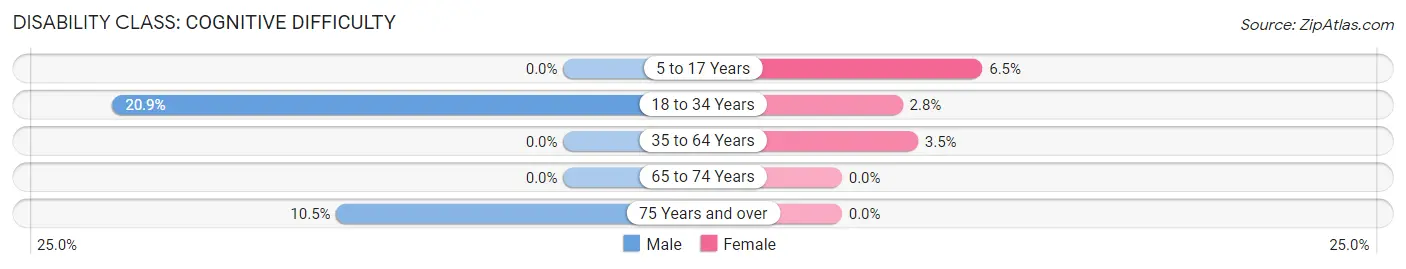
| Age Bracket | Male | Female |
| 5 to 17 Years | 0 (0.0%) | 3 (6.5%) |
| 18 to 34 Years | 9 (20.9%) | 2 (2.8%) |
| 35 to 64 Years | 0 (0.0%) | 3 (3.5%) |
| 65 to 74 Years | 0 (0.0%) | 0 (0.0%) |
| 75 Years and over | 2 (10.5%) | 0 (0.0%) |
Disability Class: Ambulatory Difficulty
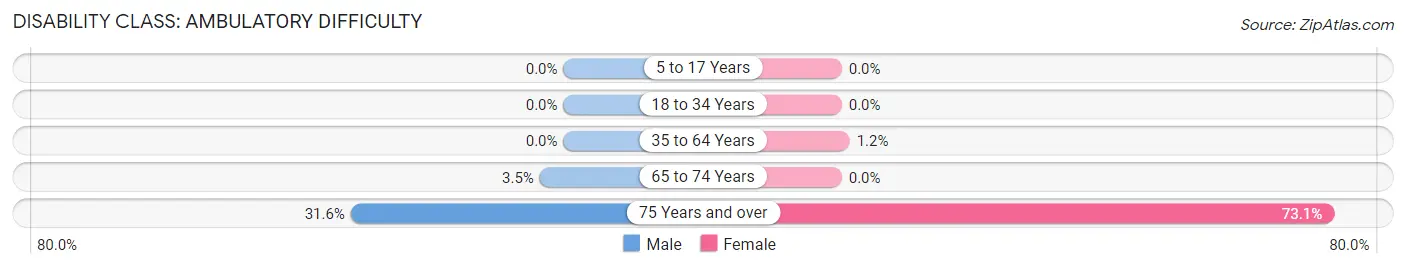
| Age Bracket | Male | Female |
| 5 to 17 Years | 0 (0.0%) | 0 (0.0%) |
| 18 to 34 Years | 0 (0.0%) | 0 (0.0%) |
| 35 to 64 Years | 0 (0.0%) | 1 (1.2%) |
| 65 to 74 Years | 2 (3.5%) | 0 (0.0%) |
| 75 Years and over | 6 (31.6%) | 19 (73.1%) |
Disability Class: Self-Care Difficulty
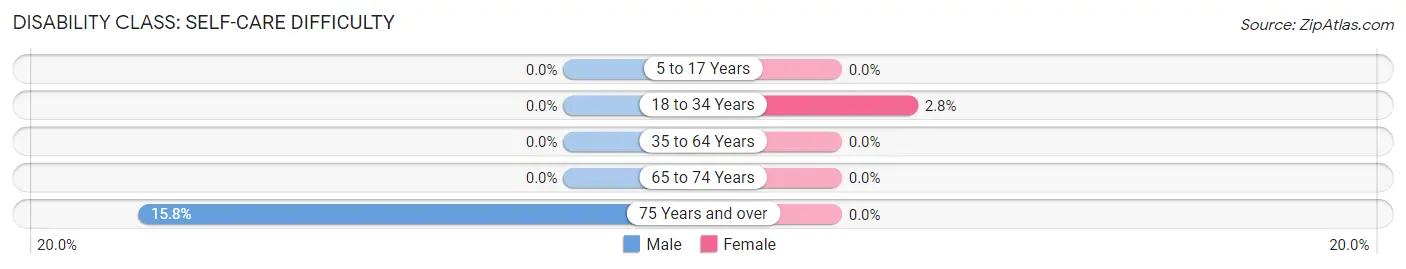
| Age Bracket | Male | Female |
| 5 to 17 Years | 0 (0.0%) | 0 (0.0%) |
| 18 to 34 Years | 0 (0.0%) | 2 (2.8%) |
| 35 to 64 Years | 0 (0.0%) | 0 (0.0%) |
| 65 to 74 Years | 0 (0.0%) | 0 (0.0%) |
| 75 Years and over | 3 (15.8%) | 0 (0.0%) |
Technology Access in Parkerfield
Computing Device Access in Parkerfield
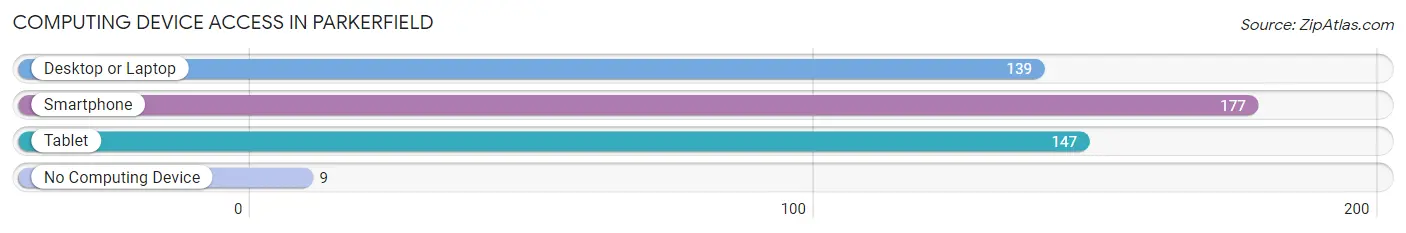
| Device Type | # Households | % Households |
| Desktop or Laptop | 139 | 65.9% |
| Smartphone | 177 | 83.9% |
| Tablet | 147 | 69.7% |
| No Computing Device | 9 | 4.3% |
| Total | 211 | 100.0% |
Internet Access in Parkerfield
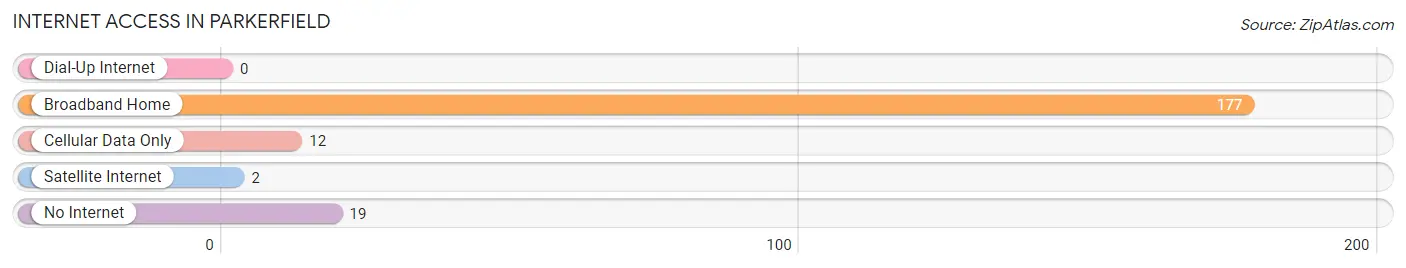
| Internet Type | # Households | % Households |
| Dial-Up Internet | 0 | 0.0% |
| Broadband Home | 177 | 83.9% |
| Cellular Data Only | 12 | 5.7% |
| Satellite Internet | 2 | 0.9% |
| No Internet | 19 | 9.0% |
| Total | 211 | 100.0% |
Parkerfield Summary
Parkerfield, Kansas is a small unincorporated community located in the southeastern corner of Cowley County, Kansas. It is situated on the banks of the Arkansas River, approximately 10 miles south of Winfield, the county seat. The population of Parkerfield was estimated to be around 200 in 2020.
History
Parkerfield was founded in 1887 by a group of settlers from Missouri. The town was named after the Parker family, who were among the first settlers. The town was originally a farming community, but it soon became a trading center for the surrounding area. The first post office was established in 1887, and the first school was built in 1889.
In the early 1900s, Parkerfield was a thriving community with a population of over 500. It had several stores, a bank, a hotel, a blacksmith shop, a livery stable, and a newspaper. The town also had a flour mill, a sawmill, and a cotton gin.
Geography
Parkerfield is located in the southeastern corner of Cowley County, Kansas. It is situated on the banks of the Arkansas River, approximately 10 miles south of Winfield, the county seat. The town is located in the Arkansas River Valley, which is part of the Great Plains region of the United States. The area is characterized by rolling hills and flat plains.
The climate in Parkerfield is typical of the Great Plains region, with hot summers and cold winters. The average annual temperature is around 55°F (13°C). The average annual precipitation is around 25 inches (63 cm).
Economy
The economy of Parkerfield is largely based on agriculture. The town is surrounded by farms and ranches, and the main crops grown in the area are wheat, corn, and soybeans. The town also has a few small businesses, including a grocery store, a hardware store, and a restaurant.
Demographics
The population of Parkerfield was estimated to be around 200 in 2020. The racial makeup of the town is predominantly white, with a small minority of African Americans. The median household income is around $35,000, and the median home value is around $90,000. The town has a high rate of poverty, with around 25% of the population living below the poverty line.
Conclusion
Parkerfield, Kansas is a small unincorporated community located in the southeastern corner of Cowley County, Kansas. It is situated on the banks of the Arkansas River, approximately 10 miles south of Winfield, the county seat. The population of Parkerfield was estimated to be around 200 in 2020. The town is largely agricultural, with the main crops being wheat, corn, and soybeans. The town also has a few small businesses, including a grocery store, a hardware store, and a restaurant. The racial makeup of the town is predominantly white, with a small minority of African Americans. The median household income is around $35,000, and the median home value is around $90,000. The town has a high rate of poverty, with around 25% of the population living below the poverty line.
Common Questions
What is Per Capita Income in Parkerfield?
Per Capita income in Parkerfield is $41,652.
What is the Median Family Income in Parkerfield?
Median Family Income in Parkerfield is $123,750.
What is the Median Household income in Parkerfield?
Median Household Income in Parkerfield is $103,438.
What is Income or Wage Gap in Parkerfield?
Income or Wage Gap in Parkerfield is 71.7%.
Women in Parkerfield earn 28.3 cents for every dollar earned by a man.
What is Inequality or Gini Index in Parkerfield?
Inequality or Gini Index in Parkerfield is 0.28.
What is the Total Population of Parkerfield?
Total Population of Parkerfield is 564.
What is the Total Male Population of Parkerfield?
Total Male Population of Parkerfield is 257.
What is the Total Female Population of Parkerfield?
Total Female Population of Parkerfield is 307.
What is the Ratio of Males per 100 Females in Parkerfield?
There are 83.71 Males per 100 Females in Parkerfield.
What is the Ratio of Females per 100 Males in Parkerfield?
There are 119.46 Females per 100 Males in Parkerfield.
What is the Median Population Age in Parkerfield?
Median Population Age in Parkerfield is 49.5 Years.
What is the Average Family Size in Parkerfield
Average Family Size in Parkerfield is 3.1 People.
What is the Average Household Size in Parkerfield
Average Household Size in Parkerfield is 2.7 People.
How Large is the Labor Force in Parkerfield?
There are 221 People in the Labor Forcein in Parkerfield.
What is the Percentage of People in the Labor Force in Parkerfield?
42.7% of People are in the Labor Force in Parkerfield.
What is the Unemployment Rate in Parkerfield?
Unemployment Rate in Parkerfield is 2.3%.