Alto, GA Map & Demographics
Alto Map
Alto Overview
$19,240
PER CAPITA INCOME
$72,639
AVG FAMILY INCOME
$59,375
AVG HOUSEHOLD INCOME
24.8%
WAGE / INCOME GAP [ % ]
75.2¢/ $1
WAGE / INCOME GAP [ $ ]
0.38
INEQUALITY / GINI INDEX
1,328
TOTAL POPULATION
599
MALE POPULATION
729
FEMALE POPULATION
82.17
MALES / 100 FEMALES
121.70
FEMALES / 100 MALES
30.3
MEDIAN AGE
4.5
AVG FAMILY SIZE
4.1
AVG HOUSEHOLD SIZE
571
LABOR FORCE [ PEOPLE ]
64.6%
PERCENT IN LABOR FORCE
4.4%
UNEMPLOYMENT RATE
Alto Zip Codes
Alto Area Codes
Income in Alto
Income Overview in Alto
Per Capita Income in Alto is $19,240, while median incomes of families and households are $72,639 and $59,375 respectively.
| Characteristic | Number | Measure |
| Per Capita Income | 1,328 | $19,240 |
| Median Family Income | 265 | $72,639 |
| Mean Family Income | 265 | $73,311 |
| Median Household Income | 327 | $59,375 |
| Mean Household Income | 327 | $68,656 |
| Income Deficit | 265 | $0 |
| Wage / Income Gap (%) | 1,328 | 24.82% |
| Wage / Income Gap ($) | 1,328 | 75.18¢ per $1 |
| Gini / Inequality Index | 1,328 | 0.38 |
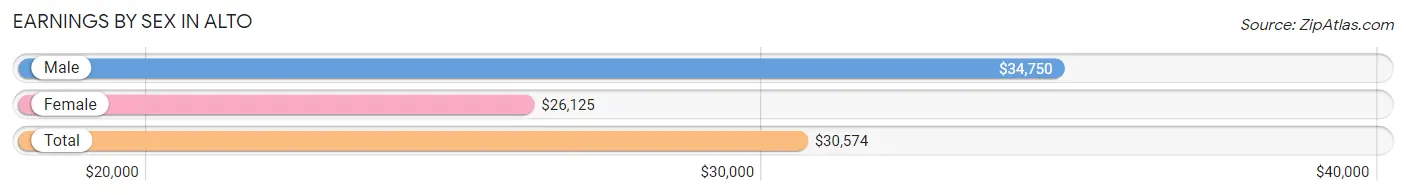
Earnings by Sex in Alto
Average Earnings in Alto are $30,574, $34,750 for men and $26,125 for women, a difference of 24.8%.
| Sex | Number | Average Earnings |
| Male | 300 (53.5%) | $34,750 |
| Female | 261 (46.5%) | $26,125 |
| Total | 561 (100.0%) | $30,574 |
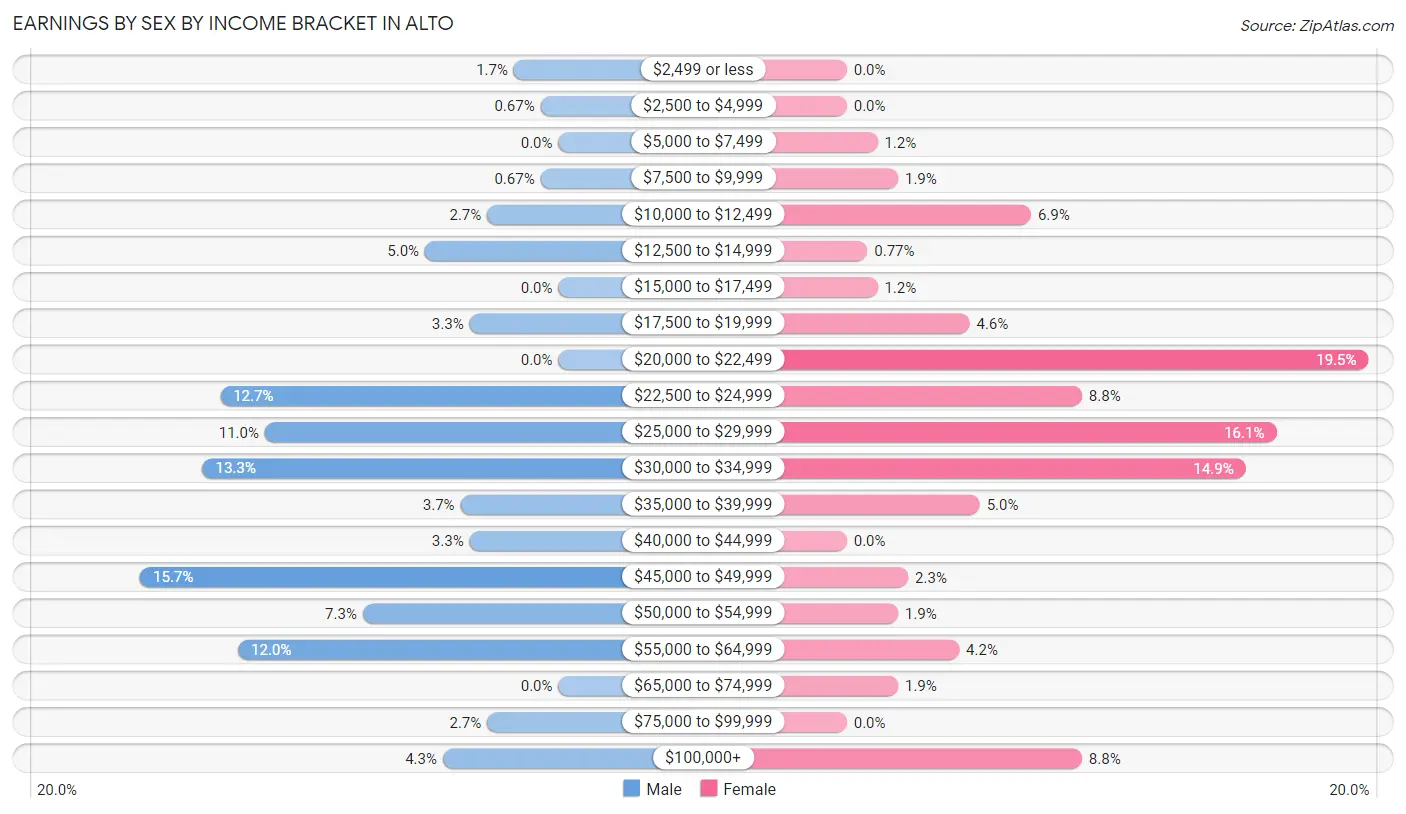
Earnings by Sex by Income Bracket in Alto
The most common earnings brackets in Alto are $45,000 to $49,999 for men (47 | 15.7%) and $20,000 to $22,499 for women (51 | 19.5%).
| Income | Male | Female |
| $2,499 or less | 5 (1.7%) | 0 (0.0%) |
| $2,500 to $4,999 | 2 (0.7%) | 0 (0.0%) |
| $5,000 to $7,499 | 0 (0.0%) | 3 (1.1%) |
| $7,500 to $9,999 | 2 (0.7%) | 5 (1.9%) |
| $10,000 to $12,499 | 8 (2.7%) | 18 (6.9%) |
| $12,500 to $14,999 | 15 (5.0%) | 2 (0.8%) |
| $15,000 to $17,499 | 0 (0.0%) | 3 (1.1%) |
| $17,500 to $19,999 | 10 (3.3%) | 12 (4.6%) |
| $20,000 to $22,499 | 0 (0.0%) | 51 (19.5%) |
| $22,500 to $24,999 | 38 (12.7%) | 23 (8.8%) |
| $25,000 to $29,999 | 33 (11.0%) | 42 (16.1%) |
| $30,000 to $34,999 | 40 (13.3%) | 39 (14.9%) |
| $35,000 to $39,999 | 11 (3.7%) | 13 (5.0%) |
| $40,000 to $44,999 | 10 (3.3%) | 0 (0.0%) |
| $45,000 to $49,999 | 47 (15.7%) | 6 (2.3%) |
| $50,000 to $54,999 | 22 (7.3%) | 5 (1.9%) |
| $55,000 to $64,999 | 36 (12.0%) | 11 (4.2%) |
| $65,000 to $74,999 | 0 (0.0%) | 5 (1.9%) |
| $75,000 to $99,999 | 8 (2.7%) | 0 (0.0%) |
| $100,000+ | 13 (4.3%) | 23 (8.8%) |
| Total | 300 (100.0%) | 261 (100.0%) |
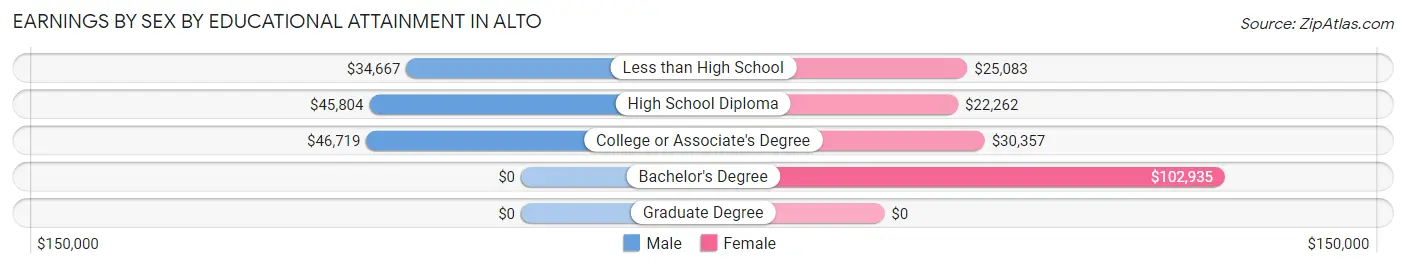
Earnings by Sex by Educational Attainment in Alto
Average earnings in Alto are $45,000 for men and $26,792 for women, a difference of 40.5%. Men with an educational attainment of college or associate's degree enjoy the highest average annual earnings of $46,719, while those with less than high school education earn the least with $34,667. Women with an educational attainment of bachelor's degree earn the most with the average annual earnings of $102,935, while those with high school diploma education have the smallest earnings of $22,262.
| Educational Attainment | Male Income | Female Income |
| Less than High School | $34,667 | $25,083 |
| High School Diploma | $45,804 | $22,262 |
| College or Associate's Degree | $46,719 | $30,357 |
| Bachelor's Degree | - | - |
| Graduate Degree | - | - |
| Total | $45,000 | $26,792 |
Family Income in Alto
Family Income Brackets in Alto
According to the Alto family income data, there are 82 families falling into the $75,000 to $99,999 income range, which is the most common income bracket and makes up 30.9% of all families. Conversely, the less than $10,000 income bracket is the least frequent group with only 6 families (2.3%) belonging to this category.
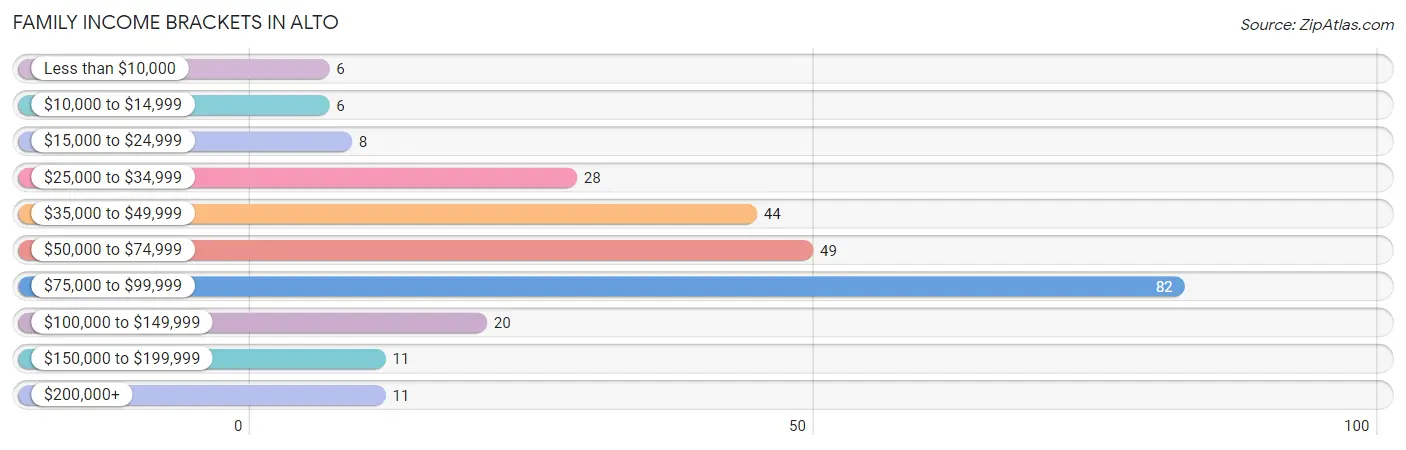
| Income Bracket | # Families | % Families |
| Less than $10,000 | 6 | 2.3% |
| $10,000 to $14,999 | 6 | 2.3% |
| $15,000 to $24,999 | 8 | 3.0% |
| $25,000 to $34,999 | 28 | 10.6% |
| $35,000 to $49,999 | 44 | 16.6% |
| $50,000 to $74,999 | 49 | 18.5% |
| $75,000 to $99,999 | 82 | 30.9% |
| $100,000 to $149,999 | 20 | 7.5% |
| $150,000 to $199,999 | 11 | 4.2% |
| $200,000+ | 11 | 4.2% |
Family Income by Famaliy Size in Alto
6-person families (33 | 12.4%) account for the highest median family income in Alto with $82,054 per family, while 3-person families (30 | 11.3%) have the highest median income of $23,958 per family member.
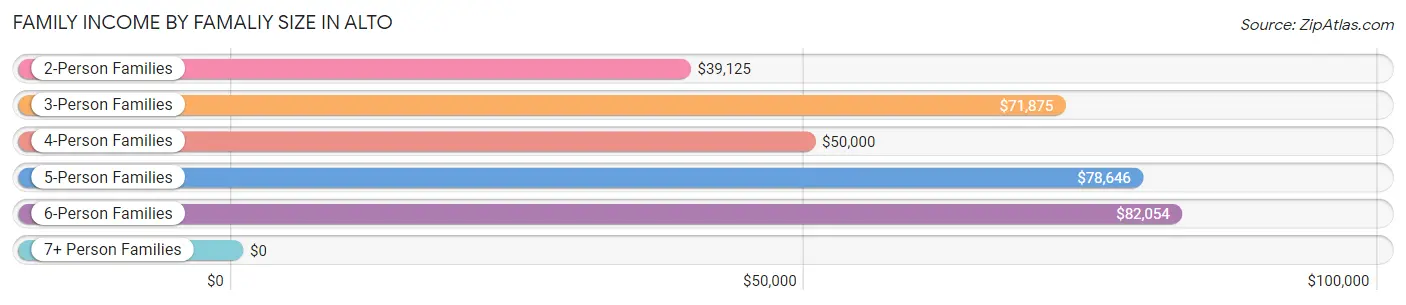
| Income Bracket | # Families | Median Income |
| 2-Person Families | 83 (31.3%) | $39,125 |
| 3-Person Families | 30 (11.3%) | $71,875 |
| 4-Person Families | 68 (25.7%) | $50,000 |
| 5-Person Families | 51 (19.3%) | $78,646 |
| 6-Person Families | 33 (12.4%) | $82,054 |
| 7+ Person Families | 0 (0.0%) | $0 |
| Total | 265 (100.0%) | $72,639 |
Family Income by Number of Earners in Alto
The median family income in Alto is $72,639, with families comprising 3+ earners (71) having the highest median family income of $79,875, while families with no earners (26) have the lowest median family income of $25,000, accounting for 26.8% and 9.8% of families, respectively.
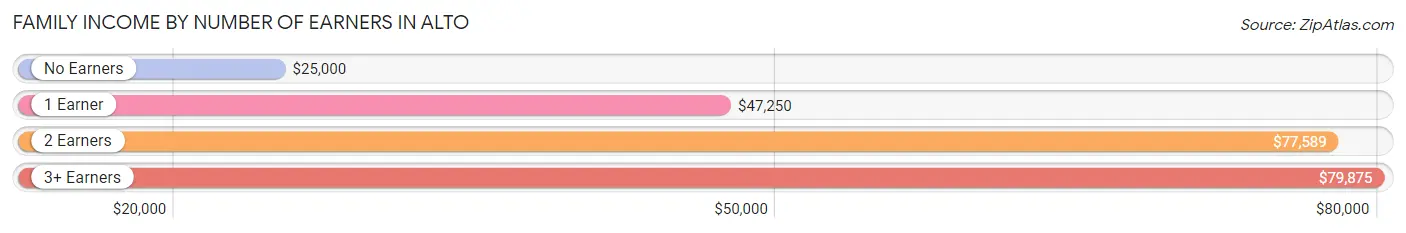
| Number of Earners | # Families | Median Income |
| No Earners | 26 (9.8%) | $25,000 |
| 1 Earner | 99 (37.4%) | $47,250 |
| 2 Earners | 69 (26.0%) | $77,589 |
| 3+ Earners | 71 (26.8%) | $79,875 |
| Total | 265 (100.0%) | $72,639 |
Household Income in Alto
Household Income Brackets in Alto
With 77 households falling in the category, the $75,000 to $99,999 income range is the most frequent in Alto, accounting for 23.5% of all households. In contrast, only 8 households (2.5%) fall into the $10,000 to $14,999 income bracket, making it the least populous group.
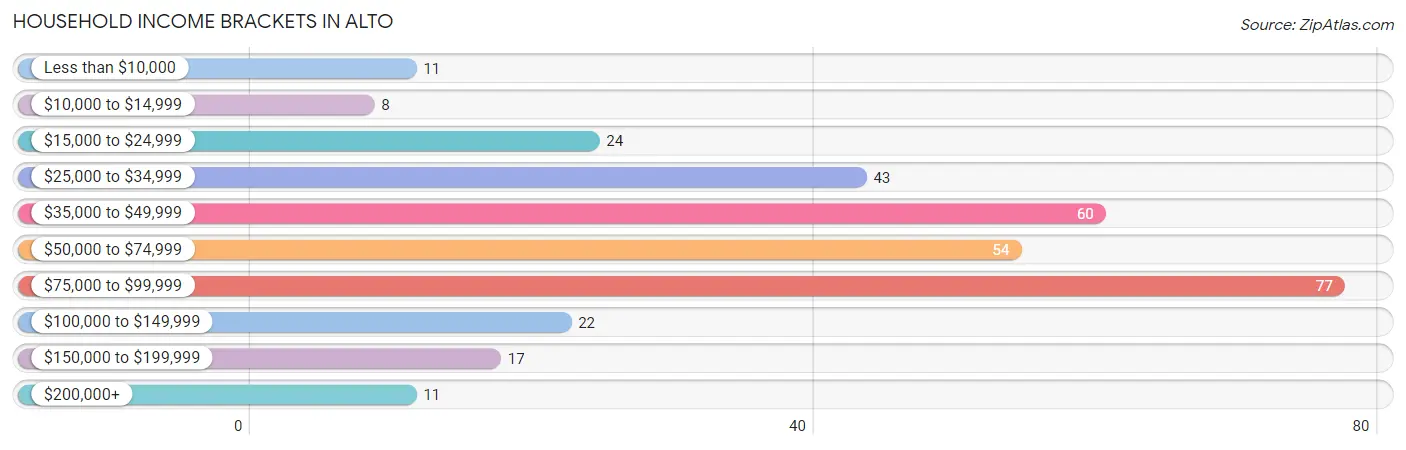
| Income Bracket | # Households | % Households |
| Less than $10,000 | 11 | 3.4% |
| $10,000 to $14,999 | 8 | 2.4% |
| $15,000 to $24,999 | 24 | 7.3% |
| $25,000 to $34,999 | 43 | 13.1% |
| $35,000 to $49,999 | 60 | 18.3% |
| $50,000 to $74,999 | 54 | 16.5% |
| $75,000 to $99,999 | 77 | 23.5% |
| $100,000 to $149,999 | 22 | 6.7% |
| $150,000 to $199,999 | 17 | 5.2% |
| $200,000+ | 11 | 3.4% |
Household Income by Householder Age in Alto
The median household income in Alto is $59,375, with the highest median household income of $73,889 found in the 25 to 44 years age bracket for the primary householder. A total of 106 households (32.4%) fall into this category. Meanwhile, the 65+ years age bracket for the primary householder has the lowest median household income of $0, with 47 households (14.4%) in this group.
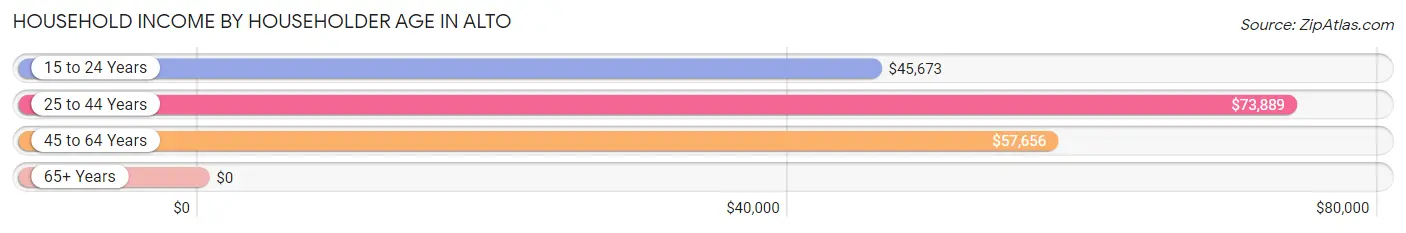
| Income Bracket | # Households | Median Income |
| 15 to 24 Years | 19 (5.8%) | $45,673 |
| 25 to 44 Years | 106 (32.4%) | $73,889 |
| 45 to 64 Years | 155 (47.4%) | $57,656 |
| 65+ Years | 47 (14.4%) | $0 |
| Total | 327 (100.0%) | $59,375 |
Poverty in Alto
Income Below Poverty by Sex and Age in Alto
With 10.0% poverty level for males and 9.2% for females among the residents of Alto, 16 and 17 year old males and 16 and 17 year old females are the most vulnerable to poverty, with 16 males (100.0%) and 13 females (28.9%) in their respective age groups living below the poverty level.
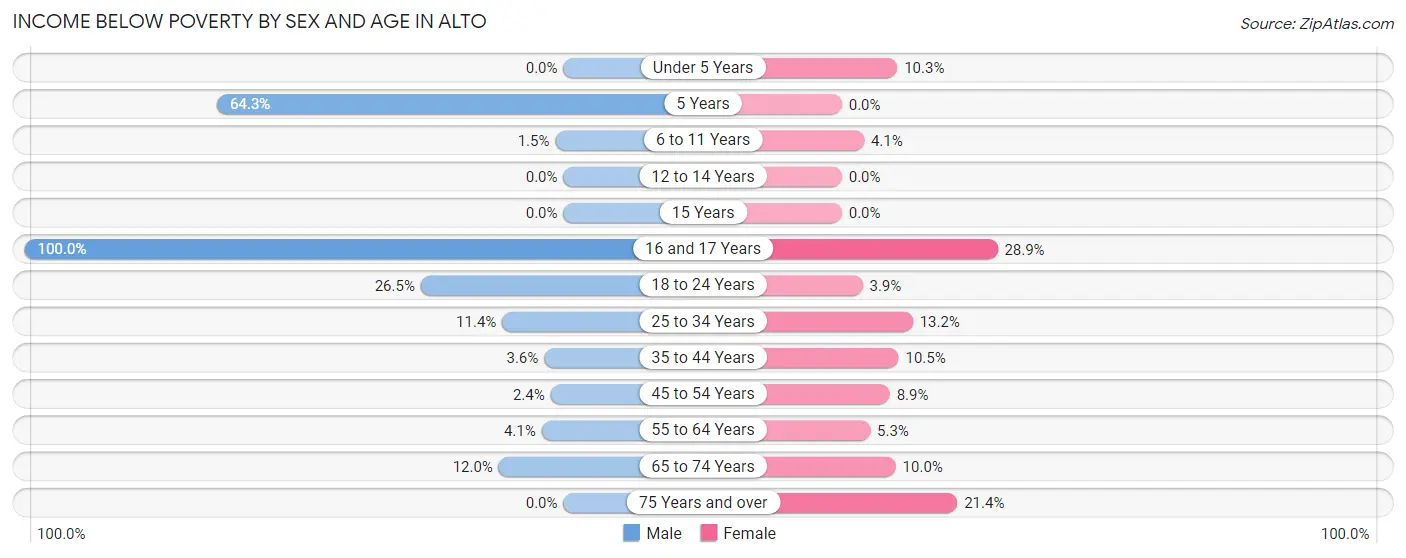
| Age Bracket | Male | Female |
| Under 5 Years | 0 (0.0%) | 7 (10.3%) |
| 5 Years | 9 (64.3%) | 0 (0.0%) |
| 6 to 11 Years | 2 (1.5%) | 4 (4.1%) |
| 12 to 14 Years | 0 (0.0%) | 0 (0.0%) |
| 15 Years | 0 (0.0%) | 0 (0.0%) |
| 16 and 17 Years | 16 (100.0%) | 13 (28.9%) |
| 18 to 24 Years | 18 (26.5%) | 1 (3.8%) |
| 25 to 34 Years | 5 (11.4%) | 10 (13.2%) |
| 35 to 44 Years | 2 (3.6%) | 12 (10.5%) |
| 45 to 54 Years | 2 (2.4%) | 4 (8.9%) |
| 55 to 64 Years | 3 (4.1%) | 7 (5.3%) |
| 65 to 74 Years | 3 (12.0%) | 3 (10.0%) |
| 75 Years and over | 0 (0.0%) | 6 (21.4%) |
| Total | 60 (10.0%) | 67 (9.2%) |
Income Above Poverty by Sex and Age in Alto
According to the poverty statistics in Alto, males aged under 5 years and females aged 5 years are the age groups that are most secure financially, with 100.0% of males and 100.0% of females in these age groups living above the poverty line.
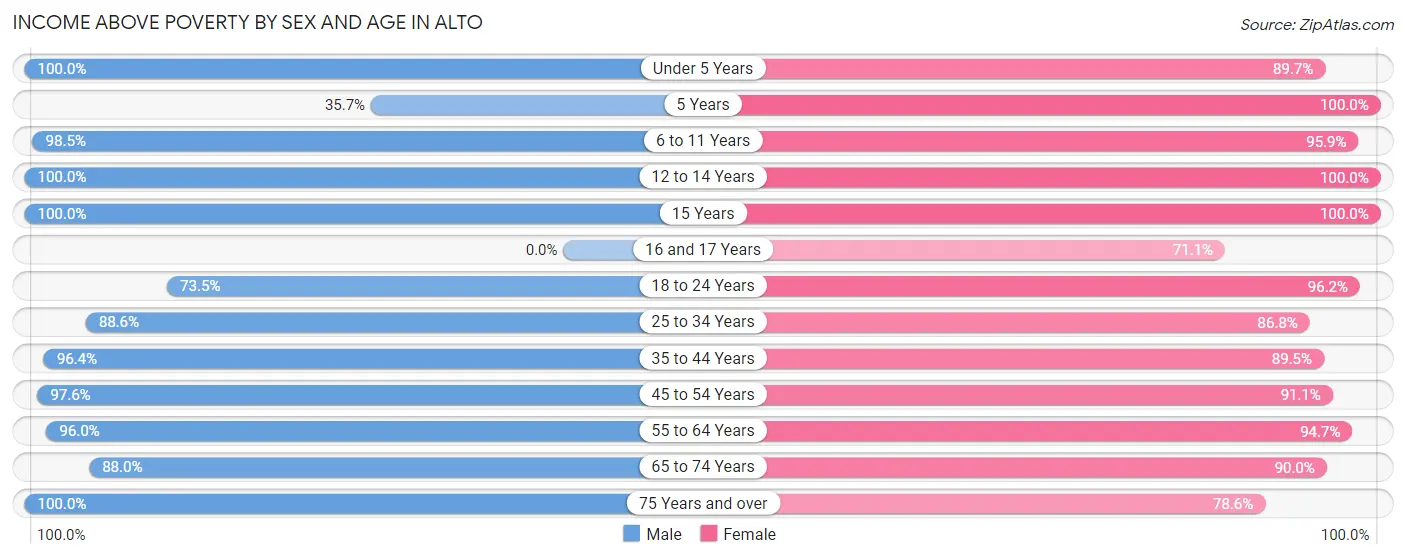
| Age Bracket | Male | Female |
| Under 5 Years | 24 (100.0%) | 61 (89.7%) |
| 5 Years | 5 (35.7%) | 21 (100.0%) |
| 6 to 11 Years | 131 (98.5%) | 93 (95.9%) |
| 12 to 14 Years | 30 (100.0%) | 36 (100.0%) |
| 15 Years | 11 (100.0%) | 10 (100.0%) |
| 16 and 17 Years | 0 (0.0%) | 32 (71.1%) |
| 18 to 24 Years | 50 (73.5%) | 25 (96.2%) |
| 25 to 34 Years | 39 (88.6%) | 66 (86.8%) |
| 35 to 44 Years | 54 (96.4%) | 102 (89.5%) |
| 45 to 54 Years | 82 (97.6%) | 41 (91.1%) |
| 55 to 64 Years | 71 (96.0%) | 126 (94.7%) |
| 65 to 74 Years | 22 (88.0%) | 27 (90.0%) |
| 75 Years and over | 20 (100.0%) | 22 (78.6%) |
| Total | 539 (90.0%) | 662 (90.8%) |
Income Below Poverty Among Married-Couple Families in Alto
The poverty statistics for married-couple families in Alto show that 7.0% or 14 of the total 200 families live below the poverty line. Families with 3 or 4 children have the highest poverty rate of 23.5%, comprising of 4 families. On the other hand, families with 1 or 2 children have the lowest poverty rate of 3.6%, which includes 4 families.
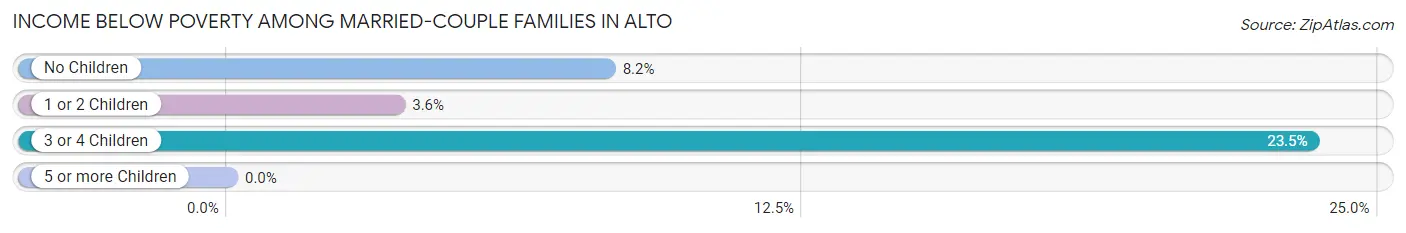
| Children | Above Poverty | Below Poverty |
| No Children | 67 (91.8%) | 6 (8.2%) |
| 1 or 2 Children | 106 (96.4%) | 4 (3.6%) |
| 3 or 4 Children | 13 (76.5%) | 4 (23.5%) |
| 5 or more Children | 0 (0.0%) | 0 (0.0%) |
| Total | 186 (93.0%) | 14 (7.0%) |
Income Below Poverty Among Single-Parent Households in Alto
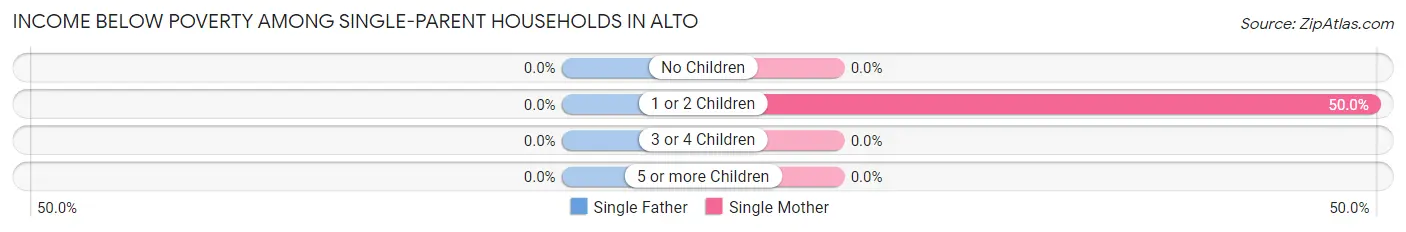
| Children | Single Father | Single Mother |
| No Children | 0 (0.0%) | 0 (0.0%) |
| 1 or 2 Children | 0 (0.0%) | 14 (50.0%) |
| 3 or 4 Children | 0 (0.0%) | 0 (0.0%) |
| 5 or more Children | 0 (0.0%) | 0 (0.0%) |
| Total | 0 (0.0%) | 14 (43.8%) |
Income Below Poverty Among Married-Couple vs Single-Parent Households in Alto
The poverty data for Alto shows that 14 of the married-couple family households (7.0%) and 14 of the single-parent households (21.5%) are living below the poverty level. Within the married-couple family households, those with 3 or 4 children have the highest poverty rate, with 4 households (23.5%) falling below the poverty line. Among the single-parent households, those with 1 or 2 children have the highest poverty rate, with 14 household (27.5%) living below poverty.
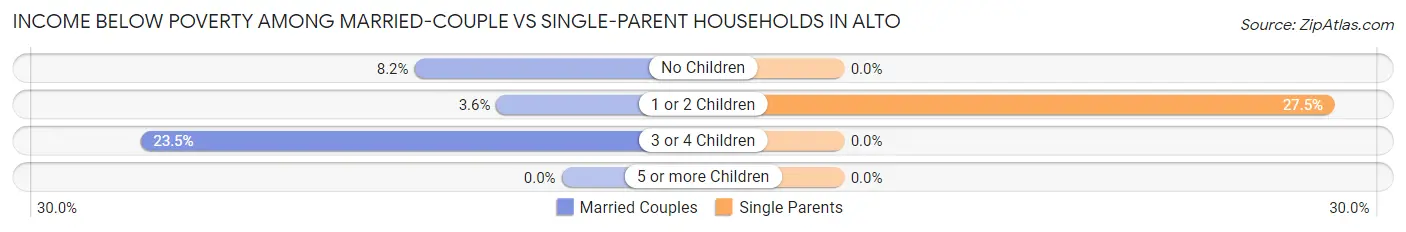
| Children | Married-Couple Families | Single-Parent Households |
| No Children | 6 (8.2%) | 0 (0.0%) |
| 1 or 2 Children | 4 (3.6%) | 14 (27.5%) |
| 3 or 4 Children | 4 (23.5%) | 0 (0.0%) |
| 5 or more Children | 0 (0.0%) | 0 (0.0%) |
| Total | 14 (7.0%) | 14 (21.5%) |
Race in Alto
The most populous races in Alto are Hispanic or Latino (745 | 56.1%), White / Caucasian (736 | 55.4%), and Some other Race (424 | 31.9%).
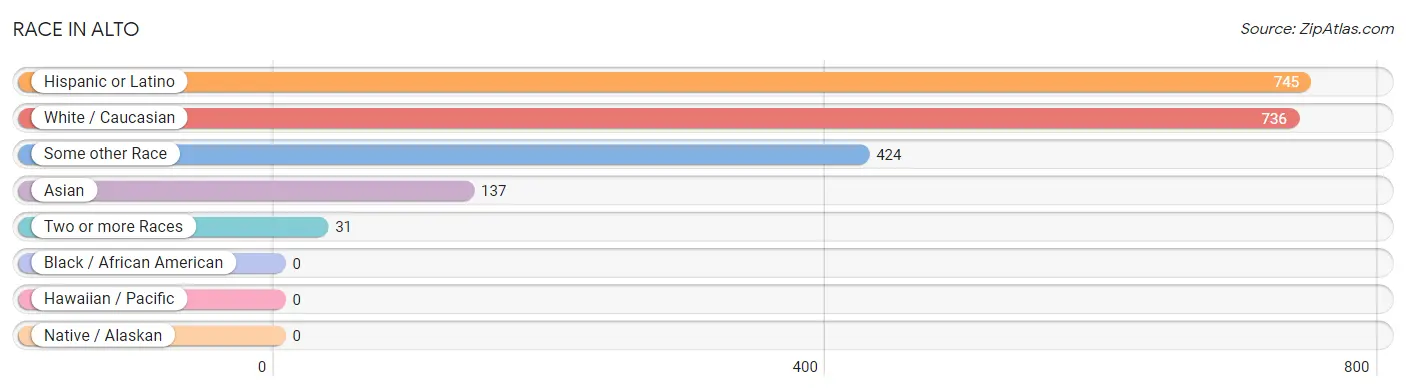
| Race | # Population | % Population |
| Asian | 137 | 10.3% |
| Black / African American | 0 | 0.0% |
| Hawaiian / Pacific | 0 | 0.0% |
| Hispanic or Latino | 745 | 56.1% |
| Native / Alaskan | 0 | 0.0% |
| White / Caucasian | 736 | 55.4% |
| Two or more Races | 31 | 2.3% |
| Some other Race | 424 | 31.9% |
| Total | 1,328 | 100.0% |
Ancestry in Alto
The most populous ancestries reported in Alto are Mexican (666 | 50.1%), American (86 | 6.5%), Sri Lankan (80 | 6.0%), Central American (76 | 5.7%), and Guatemalan (76 | 5.7%), together accounting for 74.1% of all Alto residents.
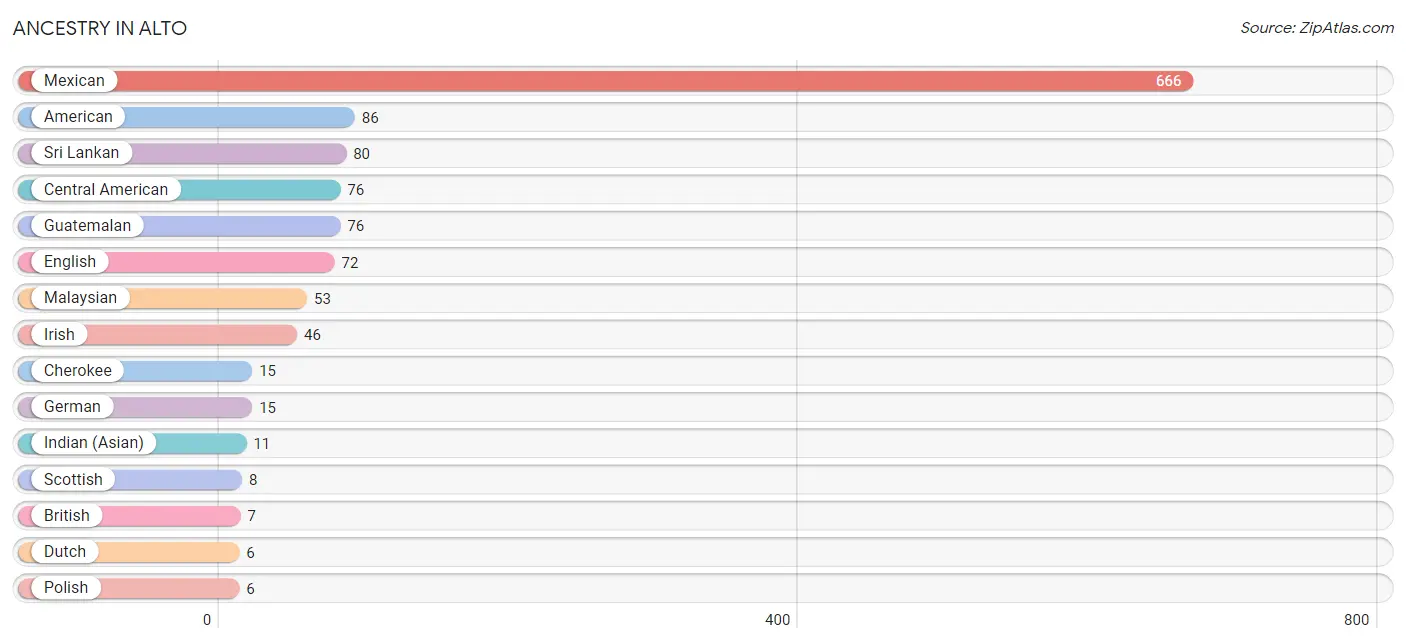
| Ancestry | # Population | % Population |
| American | 86 | 6.5% |
| British | 7 | 0.5% |
| Central American | 76 | 5.7% |
| Central American Indian | 4 | 0.3% |
| Cherokee | 15 | 1.1% |
| Dutch | 6 | 0.4% |
| English | 72 | 5.4% |
| European | 2 | 0.2% |
| French | 5 | 0.4% |
| German | 15 | 1.1% |
| Guatemalan | 76 | 5.7% |
| Indian (Asian) | 11 | 0.8% |
| Irish | 46 | 3.5% |
| Italian | 4 | 0.3% |
| Malaysian | 53 | 4.0% |
| Mexican | 666 | 50.1% |
| Mexican American Indian | 4 | 0.3% |
| Polish | 6 | 0.4% |
| Puerto Rican | 3 | 0.2% |
| Scottish | 8 | 0.6% |
| Sri Lankan | 80 | 6.0% |
| Welsh | 4 | 0.3% | View All 22 Rows |
Immigrants in Alto
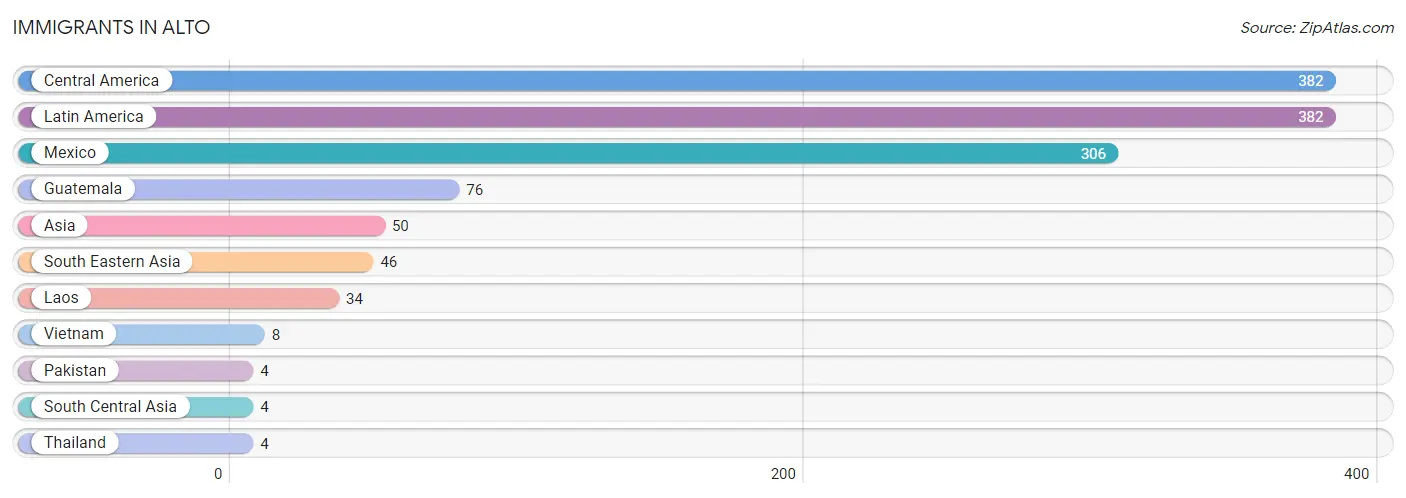
The most numerous immigrant groups reported in Alto came from Central America (382 | 28.8%), Latin America (382 | 28.8%), Mexico (306 | 23.0%), Guatemala (76 | 5.7%), and Asia (50 | 3.8%), together accounting for 90.1% of all Alto residents.
| Immigration Origin | # Population | % Population |
| Asia | 50 | 3.8% |
| Central America | 382 | 28.8% |
| Guatemala | 76 | 5.7% |
| Laos | 34 | 2.6% |
| Latin America | 382 | 28.8% |
| Mexico | 306 | 23.0% |
| Pakistan | 4 | 0.3% |
| South Central Asia | 4 | 0.3% |
| South Eastern Asia | 46 | 3.5% |
| Thailand | 4 | 0.3% |
| Vietnam | 8 | 0.6% | View All 11 Rows |
Sex and Age in Alto
Sex and Age in Alto
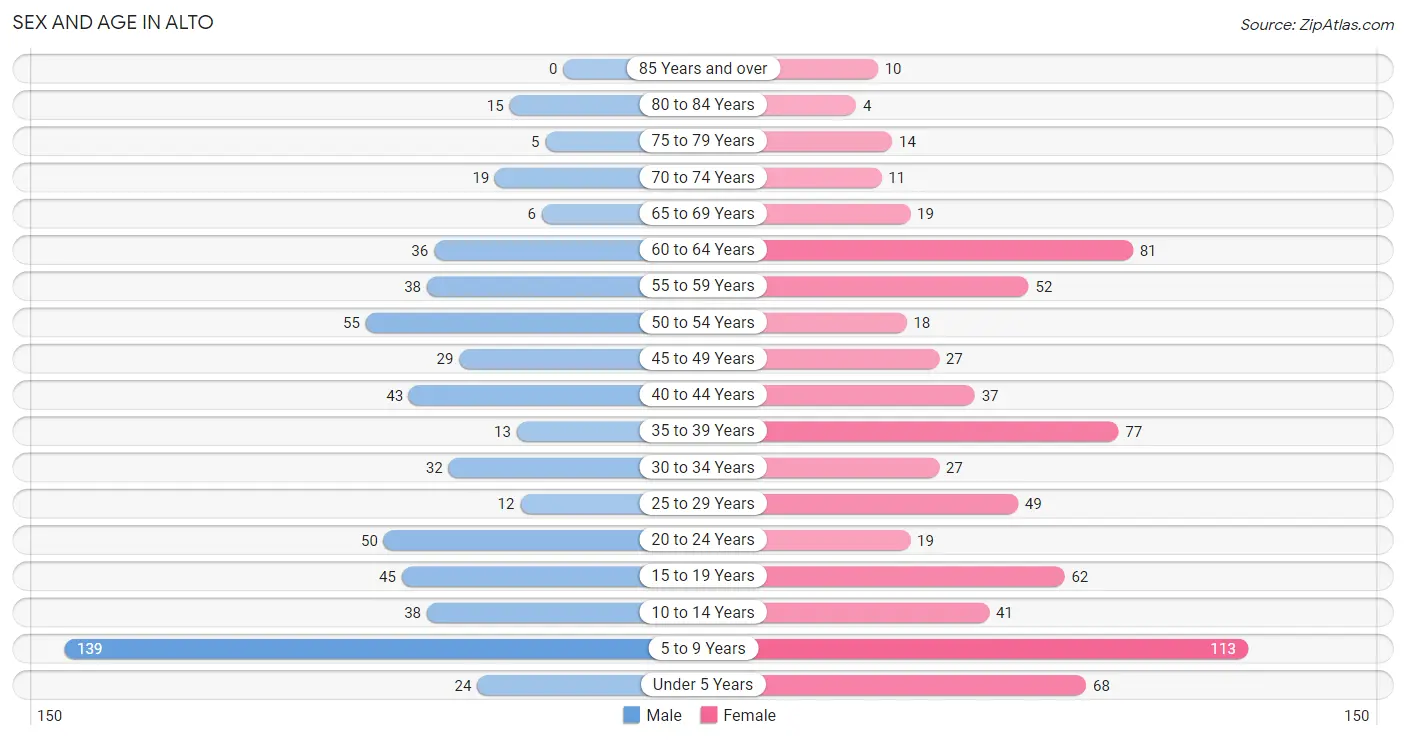
The most populous age groups in Alto are 5 to 9 Years (139 | 23.2%) for men and 5 to 9 Years (113 | 15.5%) for women.
| Age Bracket | Male | Female |
| Under 5 Years | 24 (4.0%) | 68 (9.3%) |
| 5 to 9 Years | 139 (23.2%) | 113 (15.5%) |
| 10 to 14 Years | 38 (6.3%) | 41 (5.6%) |
| 15 to 19 Years | 45 (7.5%) | 62 (8.5%) |
| 20 to 24 Years | 50 (8.4%) | 19 (2.6%) |
| 25 to 29 Years | 12 (2.0%) | 49 (6.7%) |
| 30 to 34 Years | 32 (5.3%) | 27 (3.7%) |
| 35 to 39 Years | 13 (2.2%) | 77 (10.6%) |
| 40 to 44 Years | 43 (7.2%) | 37 (5.1%) |
| 45 to 49 Years | 29 (4.8%) | 27 (3.7%) |
| 50 to 54 Years | 55 (9.2%) | 18 (2.5%) |
| 55 to 59 Years | 38 (6.3%) | 52 (7.1%) |
| 60 to 64 Years | 36 (6.0%) | 81 (11.1%) |
| 65 to 69 Years | 6 (1.0%) | 19 (2.6%) |
| 70 to 74 Years | 19 (3.2%) | 11 (1.5%) |
| 75 to 79 Years | 5 (0.8%) | 14 (1.9%) |
| 80 to 84 Years | 15 (2.5%) | 4 (0.5%) |
| 85 Years and over | 0 (0.0%) | 10 (1.4%) |
| Total | 599 (100.0%) | 729 (100.0%) |
Families and Households in Alto
Median Family Size in Alto
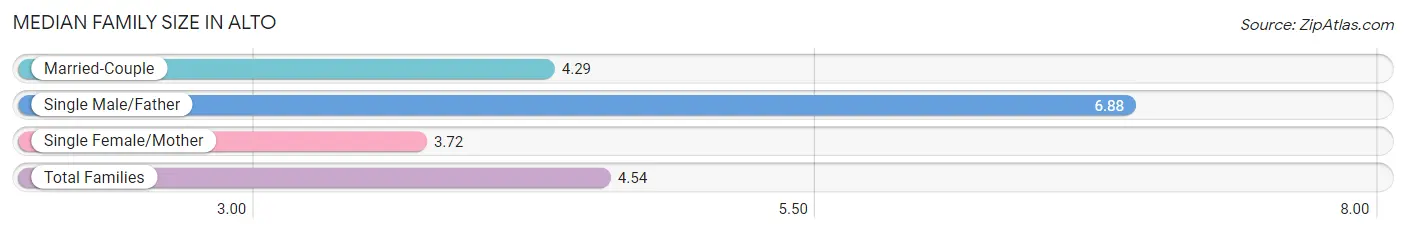
The median family size in Alto is 4.54 persons per family, with single male/father families (33 | 12.4%) accounting for the largest median family size of 6.88 persons per family. On the other hand, single female/mother families (32 | 12.1%) represent the smallest median family size with 3.72 persons per family.
| Family Type | # Families | Family Size |
| Married-Couple | 200 (75.5%) | 4.29 |
| Single Male/Father | 33 (12.4%) | 6.88 |
| Single Female/Mother | 32 (12.1%) | 3.72 |
| Total Families | 265 (100.0%) | 4.54 |
Median Household Size in Alto
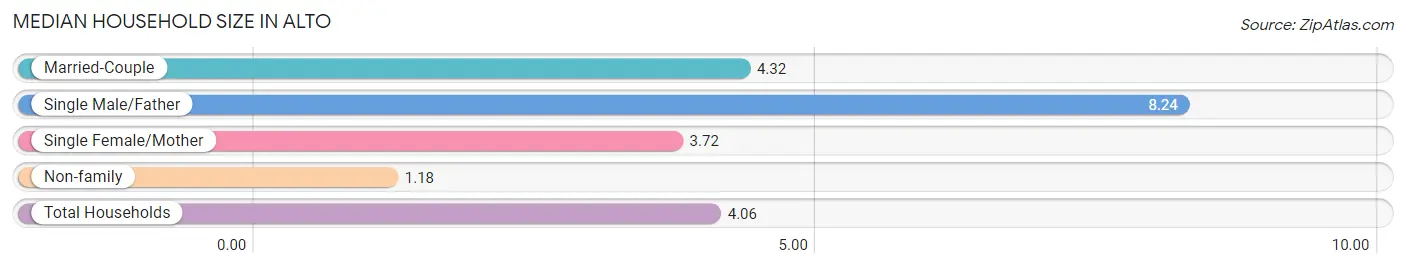
The median household size in Alto is 4.06 persons per household, with single male/father households (33 | 10.1%) accounting for the largest median household size of 8.24 persons per household. non-family households (62 | 19.0%) represent the smallest median household size with 1.18 persons per household.
| Household Type | # Households | Household Size |
| Married-Couple | 200 (61.2%) | 4.32 |
| Single Male/Father | 33 (10.1%) | 8.24 |
| Single Female/Mother | 32 (9.8%) | 3.72 |
| Non-family | 62 (19.0%) | 1.18 |
| Total Households | 327 (100.0%) | 4.06 |
Household Size by Marriage Status in Alto
Out of a total of 327 households in Alto, 265 (81.0%) are family households, while 62 (19.0%) are nonfamily households. The most numerous type of family households are 2-person households, comprising 75, and the most common type of nonfamily households are 1-person households, comprising 55.
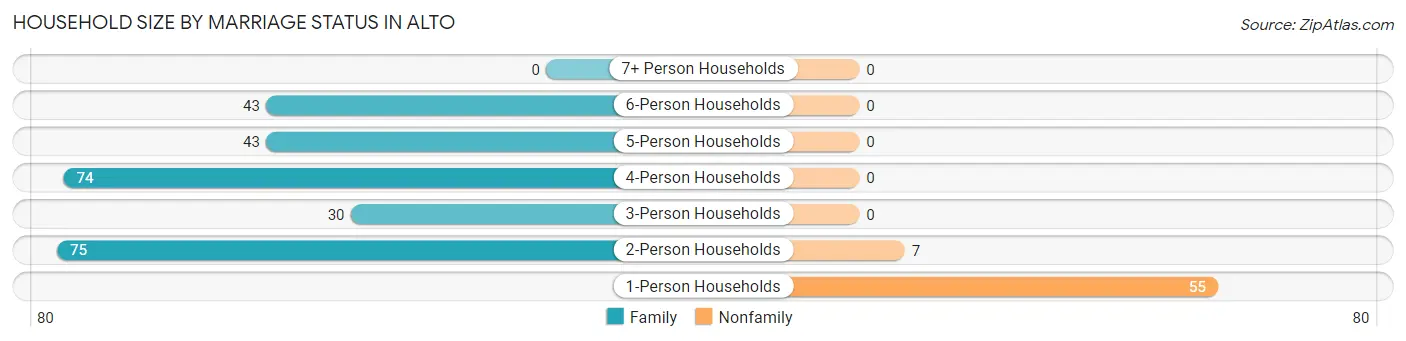
| Household Size | Family Households | Nonfamily Households |
| 1-Person Households | - | 55 (16.8%) |
| 2-Person Households | 75 (22.9%) | 7 (2.1%) |
| 3-Person Households | 30 (9.2%) | 0 (0.0%) |
| 4-Person Households | 74 (22.6%) | 0 (0.0%) |
| 5-Person Households | 43 (13.2%) | 0 (0.0%) |
| 6-Person Households | 43 (13.2%) | 0 (0.0%) |
| 7+ Person Households | 0 (0.0%) | 0 (0.0%) |
| Total | 265 (81.0%) | 62 (19.0%) |
Female Fertility in Alto
Fertility by Age in Alto
Average fertility rate in Alto is 60.0 births per 1,000 women. Women in the age bracket of 20 to 34 years have the highest fertility rate with 147.0 births per 1,000 women. Women in the age bracket of 20 to 34 years acount for 77.8% of all women with births.
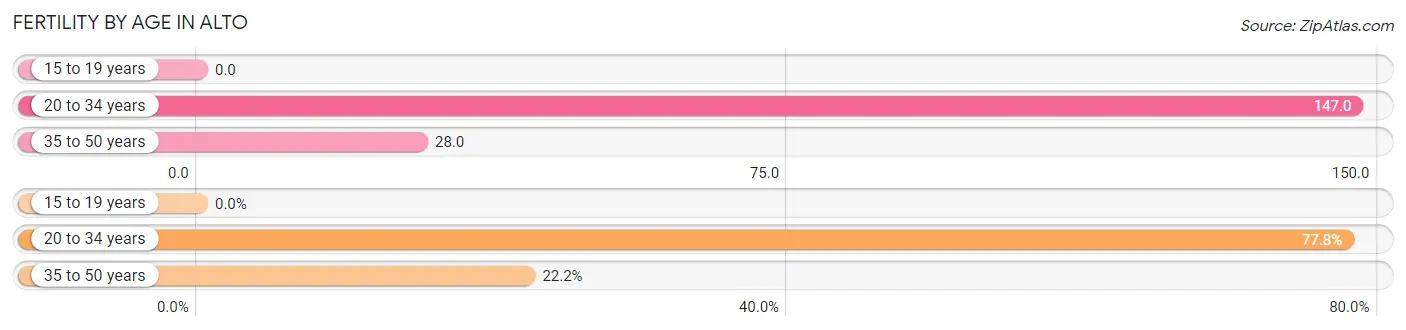
| Age Bracket | Women with Births | Births / 1,000 Women |
| 15 to 19 years | 0 (0.0%) | 0.0 |
| 20 to 34 years | 14 (77.8%) | 147.0 |
| 35 to 50 years | 4 (22.2%) | 28.0 |
| Total | 18 (100.0%) | 60.0 |
Fertility by Age by Marriage Status in Alto
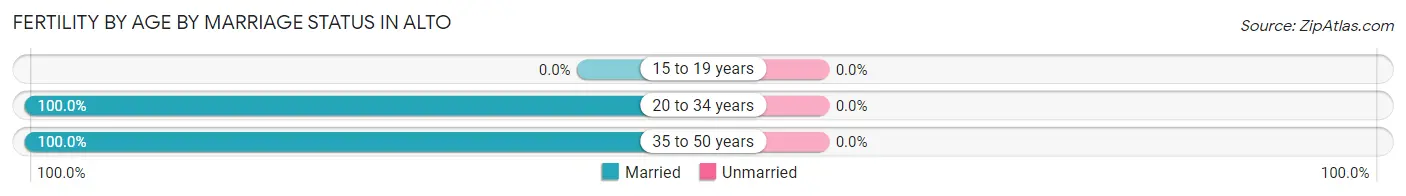
| Age Bracket | Married | Unmarried |
| 15 to 19 years | 0 (0.0%) | 0 (0.0%) |
| 20 to 34 years | 14 (100.0%) | 0 (0.0%) |
| 35 to 50 years | 4 (100.0%) | 0 (0.0%) |
| Total | 18 (100.0%) | 0 (0.0%) |
Fertility by Education in Alto
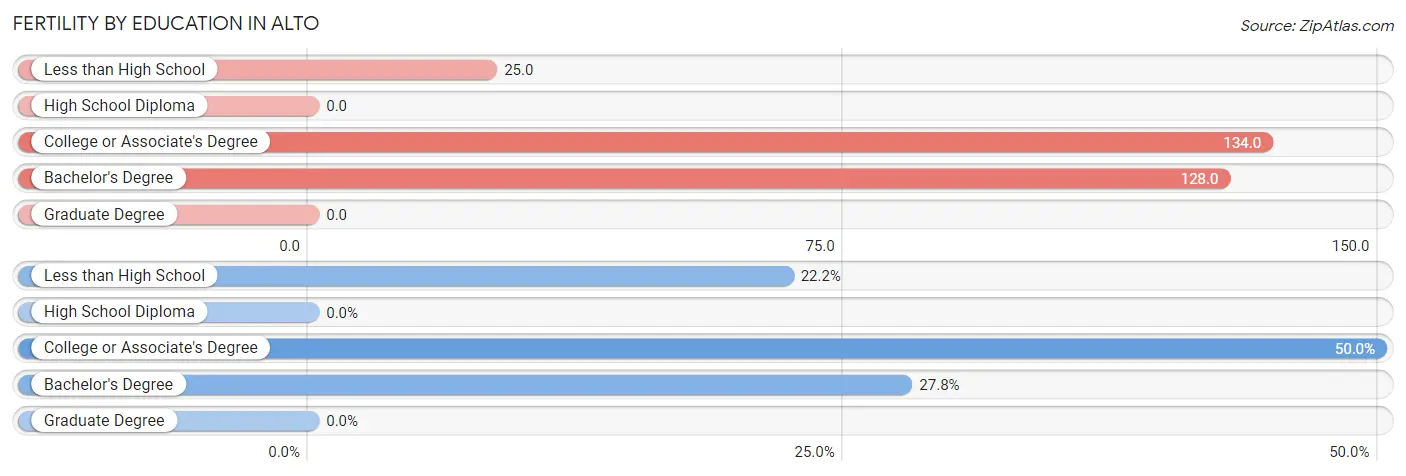
| Educational Attainment | Women with Births | Births / 1,000 Women |
| Less than High School | 4 (22.2%) | 25.0 |
| High School Diploma | 0 (0.0%) | 0.0 |
| College or Associate's Degree | 9 (50.0%) | 134.0 |
| Bachelor's Degree | 5 (27.8%) | 128.0 |
| Graduate Degree | 0 (0.0%) | 0.0 |
| Total | 18 (100.0%) | 60.0 |
Fertility by Education by Marriage Status in Alto
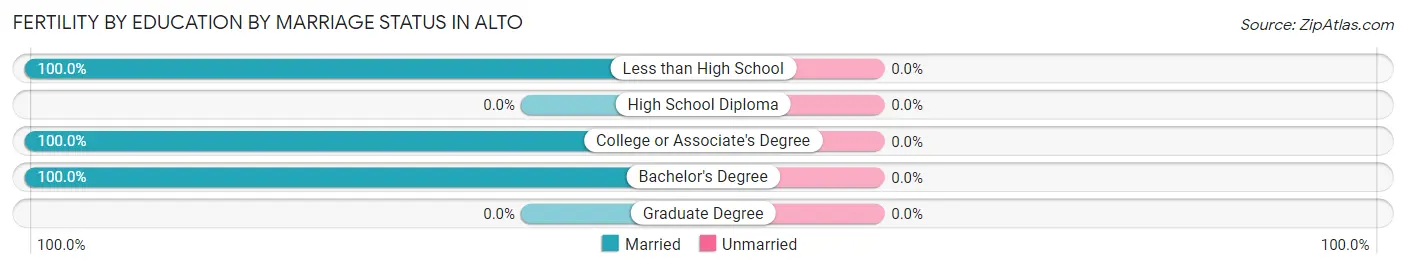
| Educational Attainment | Married | Unmarried |
| Less than High School | 4 (100.0%) | 0 (0.0%) |
| High School Diploma | 0 (0.0%) | 0 (0.0%) |
| College or Associate's Degree | 9 (100.0%) | 0 (0.0%) |
| Bachelor's Degree | 5 (100.0%) | 0 (0.0%) |
| Graduate Degree | 0 (0.0%) | 0 (0.0%) |
| Total | 18 (100.0%) | 0 (0.0%) |
Employment Characteristics in Alto
Employment by Class of Employer in Alto
Among the 544 employed individuals in Alto, private company employees (488 | 89.7%), state government employees (23 | 4.2%), and local government employees (15 | 2.8%) make up the most common classes of employment.
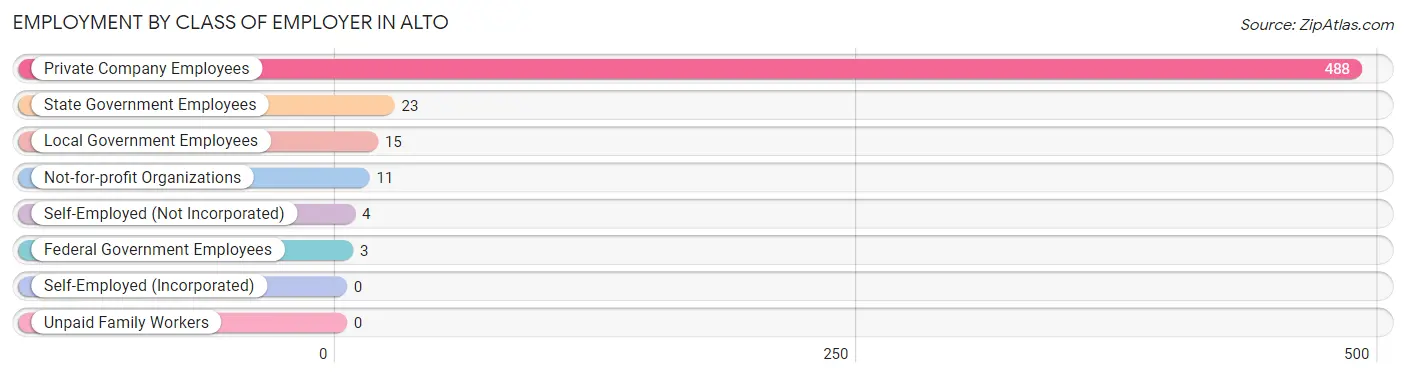
| Employer Class | # Employees | % Employees |
| Private Company Employees | 488 | 89.7% |
| Self-Employed (Incorporated) | 0 | 0.0% |
| Self-Employed (Not Incorporated) | 4 | 0.7% |
| Not-for-profit Organizations | 11 | 2.0% |
| Local Government Employees | 15 | 2.8% |
| State Government Employees | 23 | 4.2% |
| Federal Government Employees | 3 | 0.5% |
| Unpaid Family Workers | 0 | 0.0% |
| Total | 544 | 100.0% |
Employment Status by Age in Alto
According to the labor force statistics for Alto, out of the total population over 16 years of age (884), 64.6% or 571 individuals are in the labor force, with 4.4% or 25 of them unemployed. The age group with the highest labor force participation rate is 20 to 24 years, with 91.3% or 63 individuals in the labor force. Within the labor force, the 20 to 24 years age range has the highest percentage of unemployed individuals, with 27.0% or 17 of them being unemployed.
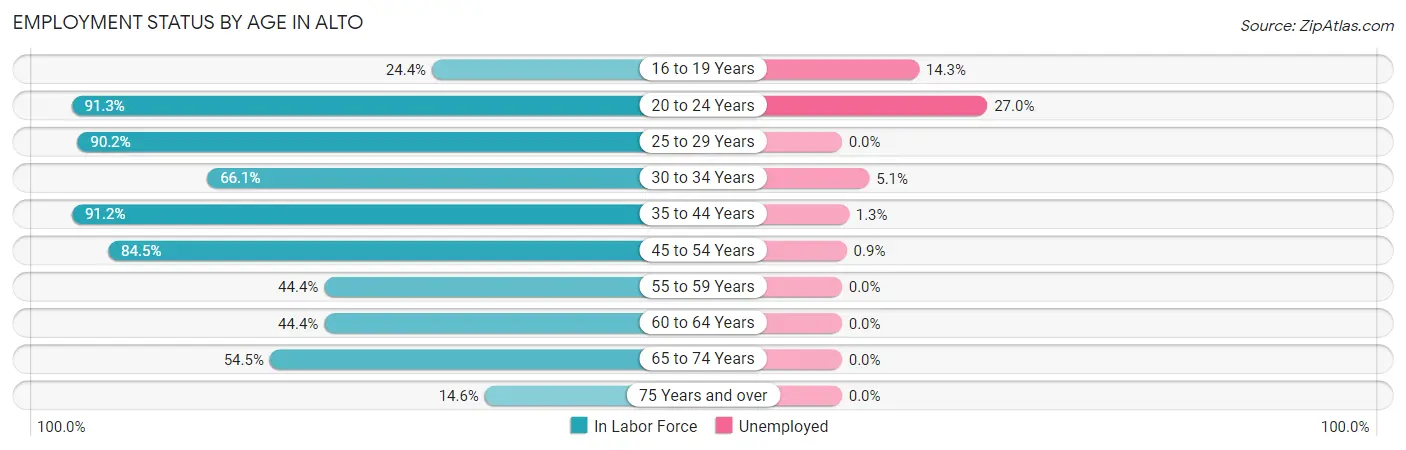
| Age Bracket | In Labor Force | Unemployed |
| 16 to 19 Years | 21 (24.4%) | 3 (14.3%) |
| 20 to 24 Years | 63 (91.3%) | 17 (27.0%) |
| 25 to 29 Years | 55 (90.2%) | 0 (0.0%) |
| 30 to 34 Years | 39 (66.1%) | 2 (5.1%) |
| 35 to 44 Years | 155 (91.2%) | 2 (1.3%) |
| 45 to 54 Years | 109 (84.5%) | 1 (0.9%) |
| 55 to 59 Years | 40 (44.4%) | 0 (0.0%) |
| 60 to 64 Years | 52 (44.4%) | 0 (0.0%) |
| 65 to 74 Years | 30 (54.5%) | 0 (0.0%) |
| 75 Years and over | 7 (14.6%) | 0 (0.0%) |
| Total | 571 (64.6%) | 25 (4.4%) |
Employment Status by Educational Attainment in Alto
According to labor force statistics for Alto, 71.9% of individuals (450) out of the total population between 25 and 64 years of age (626) are in the labor force, with 1.1% or 5 of them being unemployed. The group with the highest labor force participation rate are those with the educational attainment of bachelor's degree or higher, with 91.9% or 57 individuals in the labor force. Within the labor force, individuals with high school diploma education have the highest percentage of unemployment, with 3.4% or 4 of them being unemployed.
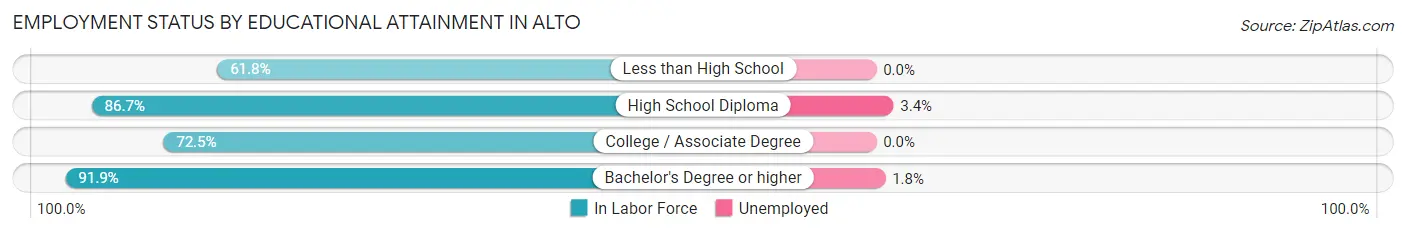
| Educational Attainment | In Labor Force | Unemployed |
| Less than High School | 202 (61.8%) | 0 (0.0%) |
| High School Diploma | 117 (86.7%) | 5 (3.4%) |
| College / Associate Degree | 74 (72.5%) | 0 (0.0%) |
| Bachelor's Degree or higher | 57 (91.9%) | 1 (1.8%) |
| Total | 450 (71.9%) | 7 (1.1%) |
Employment Occupations by Sex in Alto
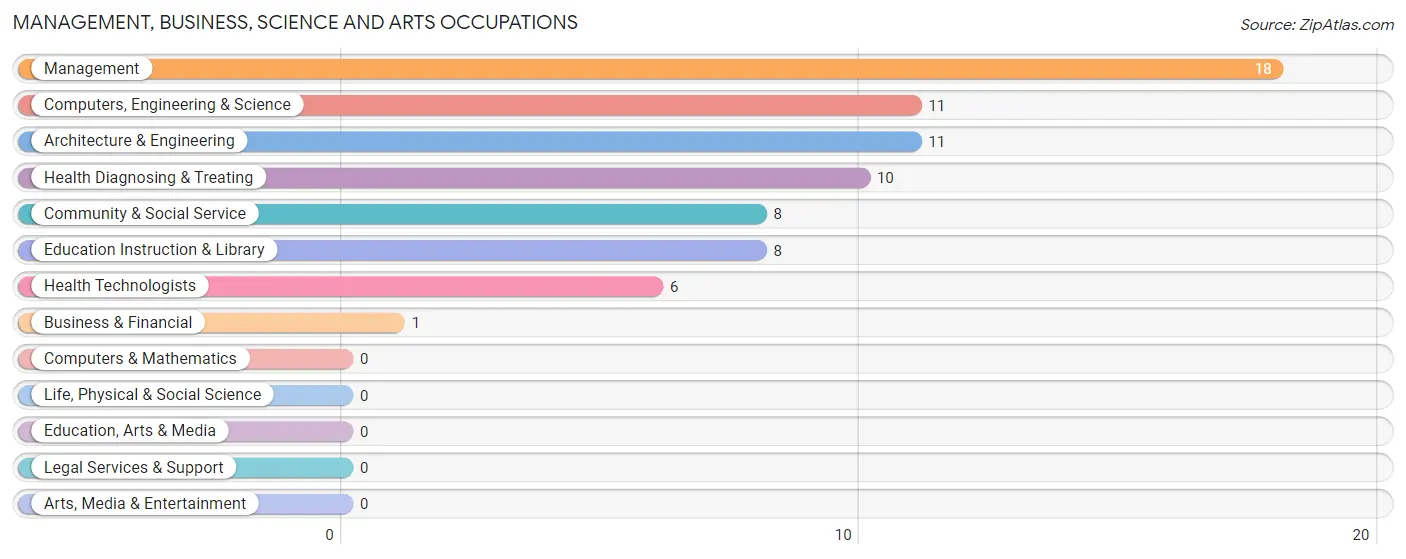
Management, Business, Science and Arts Occupations
The most common Management, Business, Science and Arts occupations in Alto are Management (18 | 3.3%), Computers, Engineering & Science (11 | 2.0%), Architecture & Engineering (11 | 2.0%), Health Diagnosing & Treating (10 | 1.8%), and Community & Social Service (8 | 1.5%).
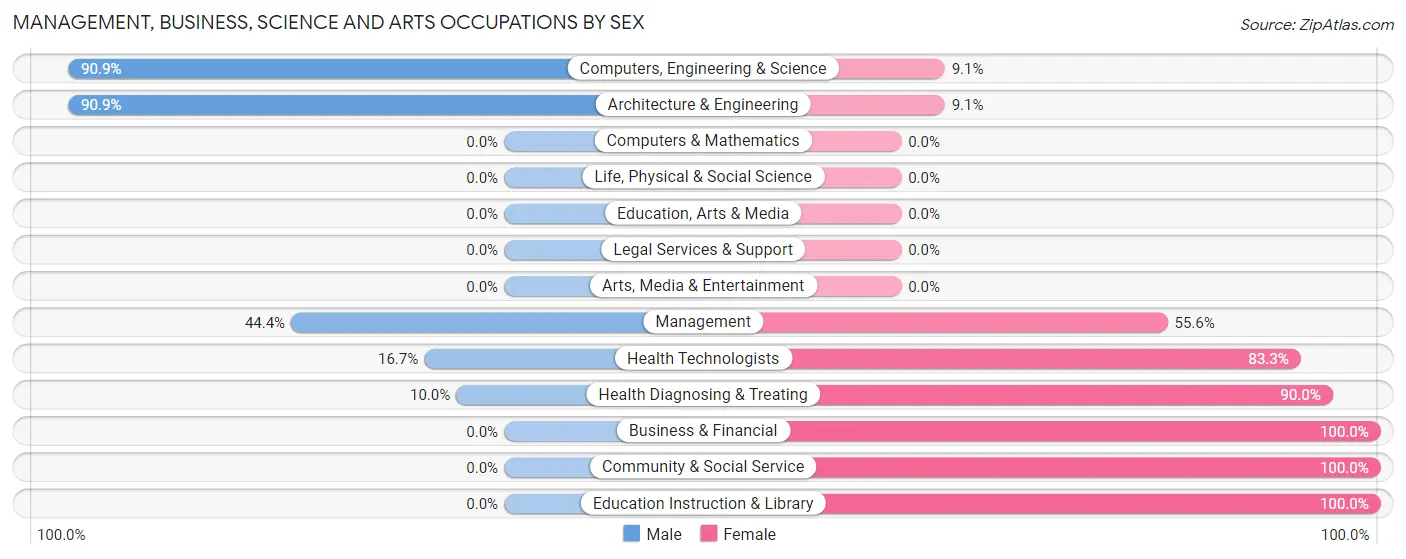
Management, Business, Science and Arts Occupations by Sex
Within the Management, Business, Science and Arts occupations in Alto, the most male-oriented occupations are Computers, Engineering & Science (90.9%), Architecture & Engineering (90.9%), and Management (44.4%), while the most female-oriented occupations are Business & Financial (100.0%), Community & Social Service (100.0%), and Education Instruction & Library (100.0%).
| Occupation | Male | Female |
| Management | 8 (44.4%) | 10 (55.6%) |
| Business & Financial | 0 (0.0%) | 1 (100.0%) |
| Computers, Engineering & Science | 10 (90.9%) | 1 (9.1%) |
| Computers & Mathematics | 0 (0.0%) | 0 (0.0%) |
| Architecture & Engineering | 10 (90.9%) | 1 (9.1%) |
| Life, Physical & Social Science | 0 (0.0%) | 0 (0.0%) |
| Community & Social Service | 0 (0.0%) | 8 (100.0%) |
| Education, Arts & Media | 0 (0.0%) | 0 (0.0%) |
| Legal Services & Support | 0 (0.0%) | 0 (0.0%) |
| Education Instruction & Library | 0 (0.0%) | 8 (100.0%) |
| Arts, Media & Entertainment | 0 (0.0%) | 0 (0.0%) |
| Health Diagnosing & Treating | 1 (10.0%) | 9 (90.0%) |
| Health Technologists | 1 (16.7%) | 5 (83.3%) |
| Total (Category) | 19 (39.6%) | 29 (60.4%) |
| Total (Overall) | 294 (53.8%) | 252 (46.2%) |
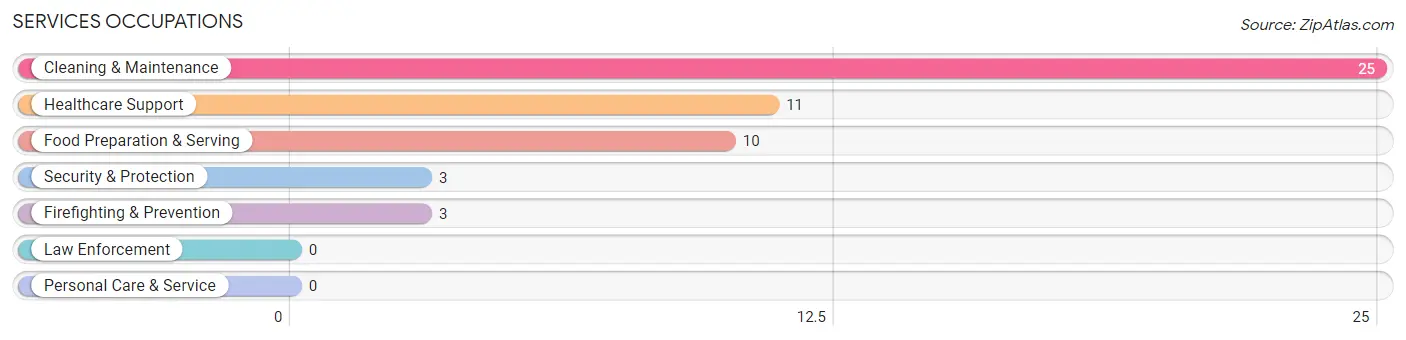
Services Occupations
The most common Services occupations in Alto are Cleaning & Maintenance (25 | 4.6%), Healthcare Support (11 | 2.0%), Food Preparation & Serving (10 | 1.8%), Security & Protection (3 | 0.5%), and Firefighting & Prevention (3 | 0.5%).
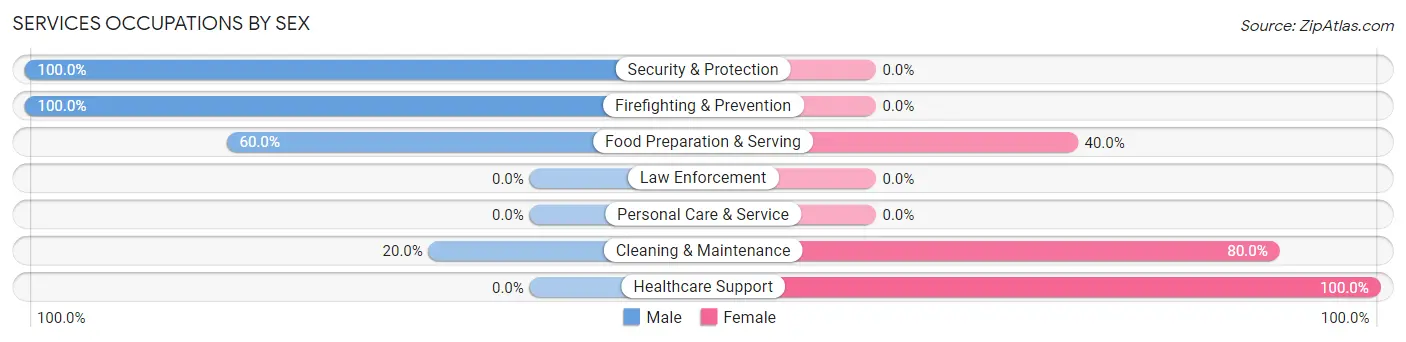
Services Occupations by Sex
Within the Services occupations in Alto, the most male-oriented occupations are Security & Protection (100.0%), Firefighting & Prevention (100.0%), and Food Preparation & Serving (60.0%), while the most female-oriented occupations are Healthcare Support (100.0%), Cleaning & Maintenance (80.0%), and Food Preparation & Serving (40.0%).
| Occupation | Male | Female |
| Healthcare Support | 0 (0.0%) | 11 (100.0%) |
| Security & Protection | 3 (100.0%) | 0 (0.0%) |
| Firefighting & Prevention | 3 (100.0%) | 0 (0.0%) |
| Law Enforcement | 0 (0.0%) | 0 (0.0%) |
| Food Preparation & Serving | 6 (60.0%) | 4 (40.0%) |
| Cleaning & Maintenance | 5 (20.0%) | 20 (80.0%) |
| Personal Care & Service | 0 (0.0%) | 0 (0.0%) |
| Total (Category) | 14 (28.6%) | 35 (71.4%) |
| Total (Overall) | 294 (53.8%) | 252 (46.2%) |
Sales and Office Occupations
The most common Sales and Office occupations in Alto are Office & Administration (76 | 13.9%), and Sales & Related (19 | 3.5%).
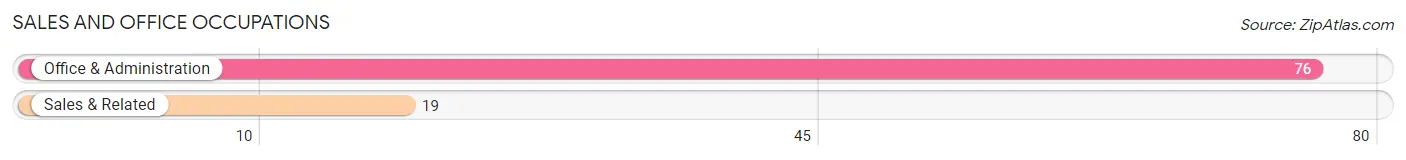
Sales and Office Occupations by Sex
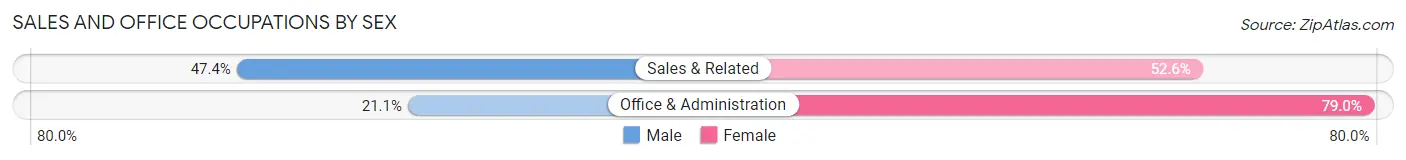
| Occupation | Male | Female |
| Sales & Related | 9 (47.4%) | 10 (52.6%) |
| Office & Administration | 16 (21.0%) | 60 (78.9%) |
| Total (Category) | 25 (26.3%) | 70 (73.7%) |
| Total (Overall) | 294 (53.8%) | 252 (46.2%) |
Natural Resources, Construction and Maintenance Occupations
The most common Natural Resources, Construction and Maintenance occupations in Alto are Construction & Extraction (74 | 13.6%), and Installation, Maintenance & Repair (49 | 9.0%).
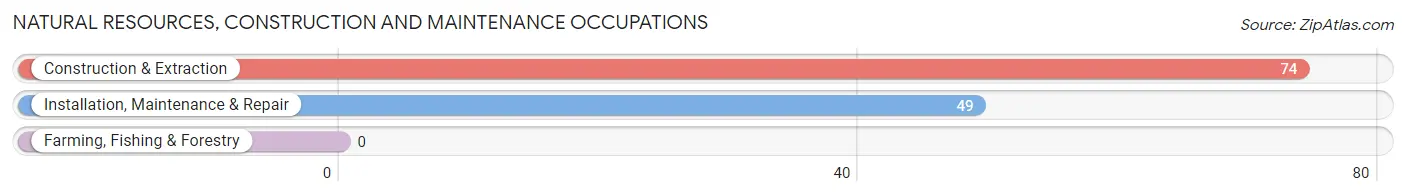
Natural Resources, Construction and Maintenance Occupations by Sex
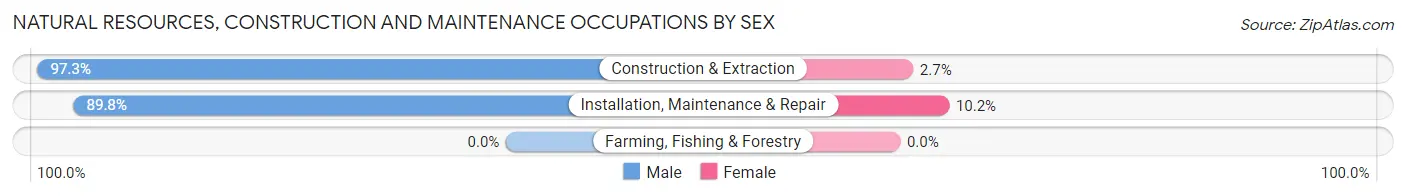
| Occupation | Male | Female |
| Farming, Fishing & Forestry | 0 (0.0%) | 0 (0.0%) |
| Construction & Extraction | 72 (97.3%) | 2 (2.7%) |
| Installation, Maintenance & Repair | 44 (89.8%) | 5 (10.2%) |
| Total (Category) | 116 (94.3%) | 7 (5.7%) |
| Total (Overall) | 294 (53.8%) | 252 (46.2%) |
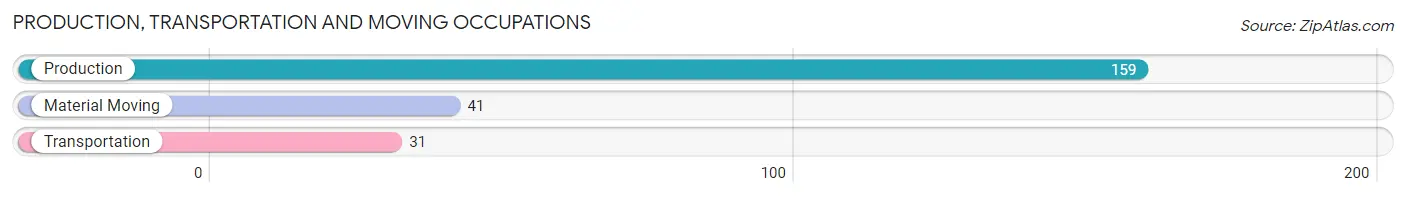
Production, Transportation and Moving Occupations
The most common Production, Transportation and Moving occupations in Alto are Production (159 | 29.1%), Material Moving (41 | 7.5%), and Transportation (31 | 5.7%).
Production, Transportation and Moving Occupations by Sex
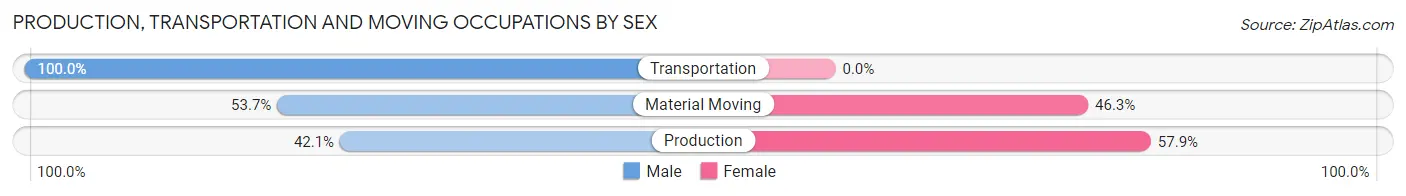
| Occupation | Male | Female |
| Production | 67 (42.1%) | 92 (57.9%) |
| Transportation | 31 (100.0%) | 0 (0.0%) |
| Material Moving | 22 (53.7%) | 19 (46.3%) |
| Total (Category) | 120 (51.9%) | 111 (48.0%) |
| Total (Overall) | 294 (53.8%) | 252 (46.2%) |
Employment Industries by Sex in Alto
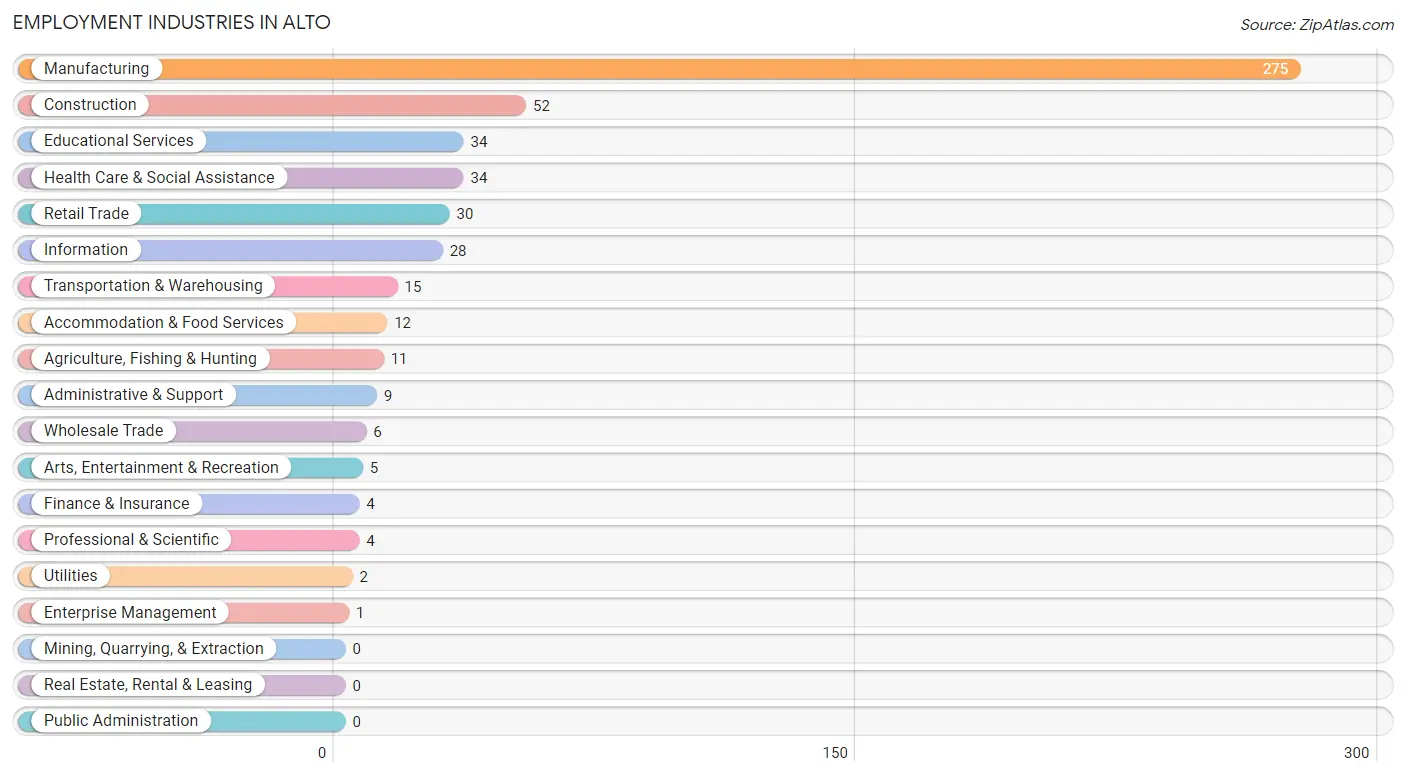
Employment Industries in Alto
The major employment industries in Alto include Manufacturing (275 | 50.4%), Construction (52 | 9.5%), Educational Services (34 | 6.2%), Health Care & Social Assistance (34 | 6.2%), and Retail Trade (30 | 5.5%).
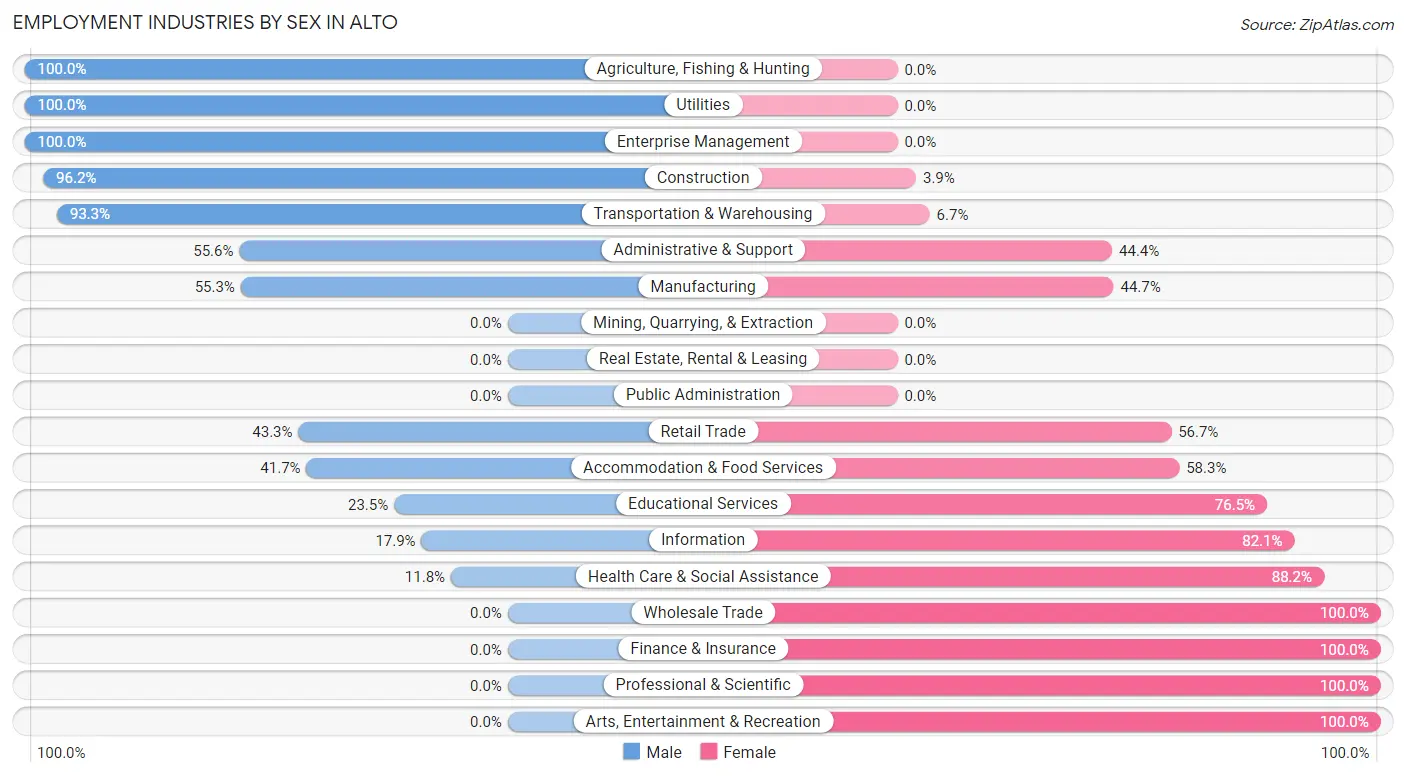
Employment Industries by Sex in Alto
The Alto industries that see more men than women are Agriculture, Fishing & Hunting (100.0%), Utilities (100.0%), and Enterprise Management (100.0%), whereas the industries that tend to have a higher number of women are Wholesale Trade (100.0%), Finance & Insurance (100.0%), and Professional & Scientific (100.0%).
| Industry | Male | Female |
| Agriculture, Fishing & Hunting | 11 (100.0%) | 0 (0.0%) |
| Mining, Quarrying, & Extraction | 0 (0.0%) | 0 (0.0%) |
| Construction | 50 (96.2%) | 2 (3.8%) |
| Manufacturing | 152 (55.3%) | 123 (44.7%) |
| Wholesale Trade | 0 (0.0%) | 6 (100.0%) |
| Retail Trade | 13 (43.3%) | 17 (56.7%) |
| Transportation & Warehousing | 14 (93.3%) | 1 (6.7%) |
| Utilities | 2 (100.0%) | 0 (0.0%) |
| Information | 5 (17.9%) | 23 (82.1%) |
| Finance & Insurance | 0 (0.0%) | 4 (100.0%) |
| Real Estate, Rental & Leasing | 0 (0.0%) | 0 (0.0%) |
| Professional & Scientific | 0 (0.0%) | 4 (100.0%) |
| Enterprise Management | 1 (100.0%) | 0 (0.0%) |
| Administrative & Support | 5 (55.6%) | 4 (44.4%) |
| Educational Services | 8 (23.5%) | 26 (76.5%) |
| Health Care & Social Assistance | 4 (11.8%) | 30 (88.2%) |
| Arts, Entertainment & Recreation | 0 (0.0%) | 5 (100.0%) |
| Accommodation & Food Services | 5 (41.7%) | 7 (58.3%) |
| Public Administration | 0 (0.0%) | 0 (0.0%) |
| Total | 294 (53.8%) | 252 (46.2%) |
Education in Alto
School Enrollment in Alto
The most common levels of schooling among the 462 students in Alto are elementary school (225 | 48.7%), high school (79 | 17.1%), and middle school (67 | 14.5%).
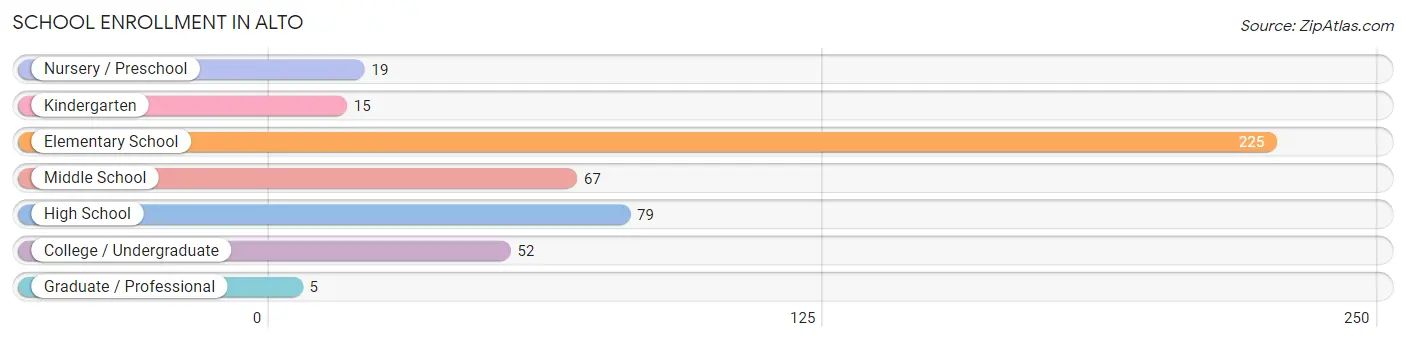
| School Level | # Students | % Students |
| Nursery / Preschool | 19 | 4.1% |
| Kindergarten | 15 | 3.3% |
| Elementary School | 225 | 48.7% |
| Middle School | 67 | 14.5% |
| High School | 79 | 17.1% |
| College / Undergraduate | 52 | 11.3% |
| Graduate / Professional | 5 | 1.1% |
| Total | 462 | 100.0% |
School Enrollment by Age by Funding Source in Alto
Out of a total of 462 students who are enrolled in schools in Alto, 10 (2.2%) attend a private institution, while the remaining 452 (97.8%) are enrolled in public schools. The age group of 35 years and over has the highest likelihood of being enrolled in private schools, with 4 (80.0% in the age bracket) enrolled. Conversely, the age group of 15 to 17 year olds has the lowest likelihood of being enrolled in a private school, with 79 (100.0% in the age bracket) attending a public institution.
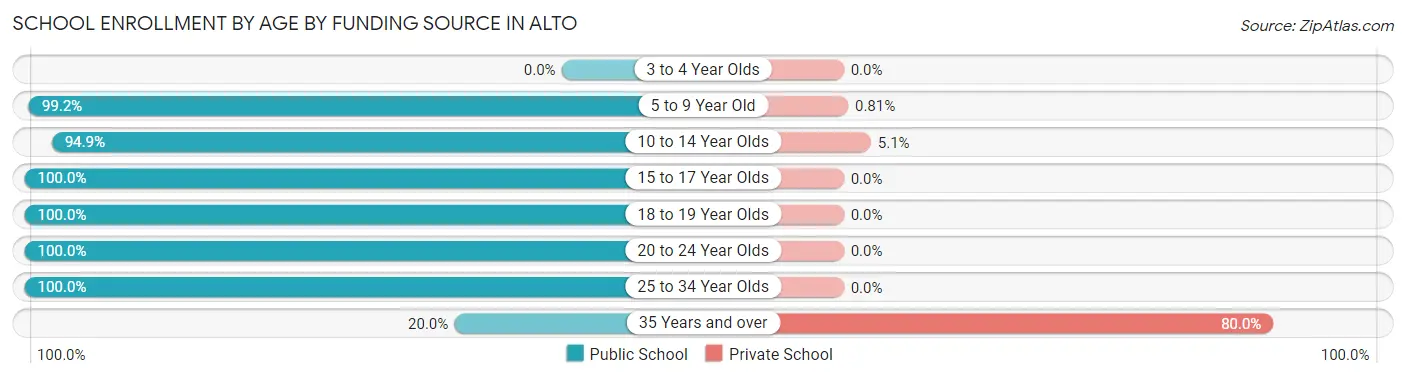
| Age Bracket | Public School | Private School |
| 3 to 4 Year Olds | 0 (0.0%) | 0 (0.0%) |
| 5 to 9 Year Old | 245 (99.2%) | 2 (0.8%) |
| 10 to 14 Year Olds | 75 (94.9%) | 4 (5.1%) |
| 15 to 17 Year Olds | 79 (100.0%) | 0 (0.0%) |
| 18 to 19 Year Olds | 7 (100.0%) | 0 (0.0%) |
| 20 to 24 Year Olds | 26 (100.0%) | 0 (0.0%) |
| 25 to 34 Year Olds | 19 (100.0%) | 0 (0.0%) |
| 35 Years and over | 1 (20.0%) | 4 (80.0%) |
| Total | 452 (97.8%) | 10 (2.2%) |
Educational Attainment by Field of Study in Alto
Literature & languages (23 | 28.7%), education (12 | 15.0%), bio, nature & agricultural (9 | 11.3%), business (9 | 11.3%), and social sciences (5 | 6.2%) are the most common fields of study among 80 individuals in Alto who have obtained a bachelor's degree or higher.
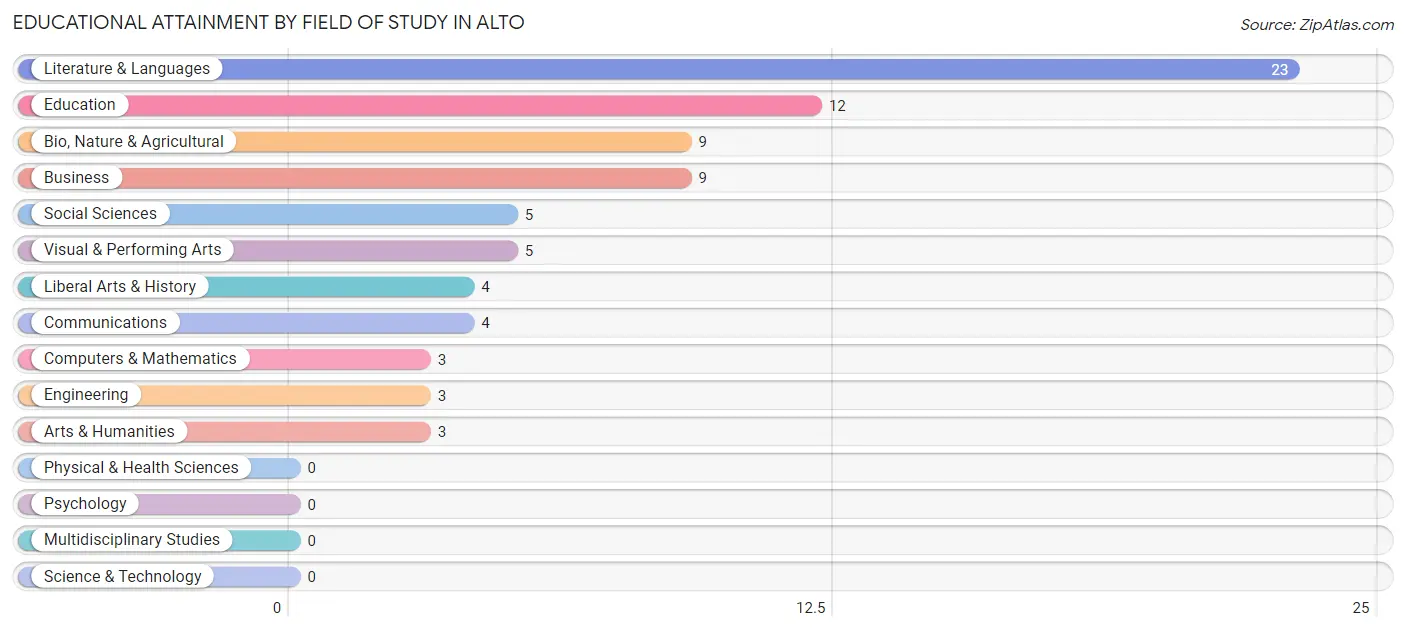
| Field of Study | # Graduates | % Graduates |
| Computers & Mathematics | 3 | 3.7% |
| Bio, Nature & Agricultural | 9 | 11.3% |
| Physical & Health Sciences | 0 | 0.0% |
| Psychology | 0 | 0.0% |
| Social Sciences | 5 | 6.2% |
| Engineering | 3 | 3.7% |
| Multidisciplinary Studies | 0 | 0.0% |
| Science & Technology | 0 | 0.0% |
| Business | 9 | 11.3% |
| Education | 12 | 15.0% |
| Literature & Languages | 23 | 28.7% |
| Liberal Arts & History | 4 | 5.0% |
| Visual & Performing Arts | 5 | 6.2% |
| Communications | 4 | 5.0% |
| Arts & Humanities | 3 | 3.7% |
| Total | 80 | 100.0% |
Transportation & Commute in Alto
Vehicle Availability by Sex in Alto
The most prevalent vehicle ownership categories in Alto are males with 3 vehicles (92, accounting for 31.5%) and females with 3 vehicles (39, making up 36.5%).
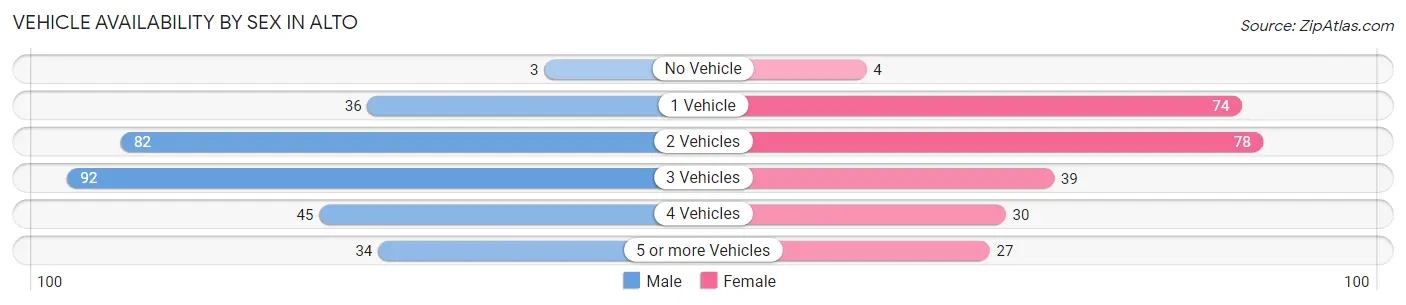
| Vehicles Available | Male | Female |
| No Vehicle | 3 (1.0%) | 4 (1.6%) |
| 1 Vehicle | 36 (12.3%) | 74 (29.4%) |
| 2 Vehicles | 82 (28.1%) | 78 (30.9%) |
| 3 Vehicles | 92 (31.5%) | 39 (15.5%) |
| 4 Vehicles | 45 (15.4%) | 30 (11.9%) |
| 5 or more Vehicles | 34 (11.6%) | 27 (10.7%) |
| Total | 292 (100.0%) | 252 (100.0%) |
Commute Time in Alto
The most frequently occuring commute durations in Alto are 10 to 14 minutes (112 commuters, 20.8%), 30 to 34 minutes (104 commuters, 19.3%), and 5 to 9 minutes (85 commuters, 15.8%).
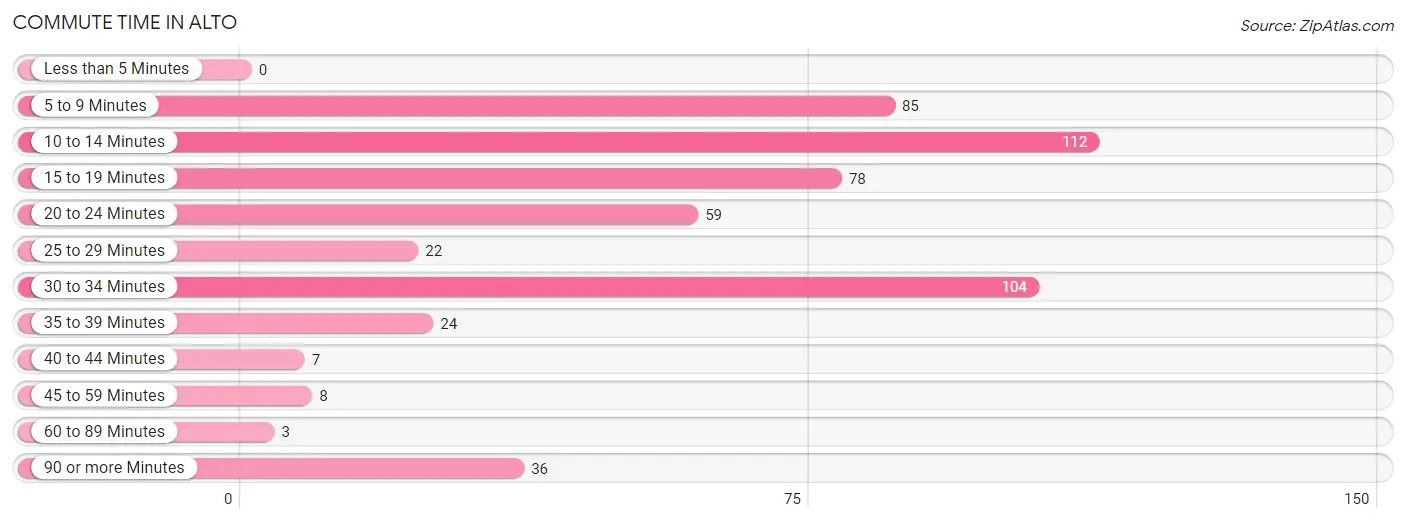
| Commute Time | # Commuters | % Commuters |
| Less than 5 Minutes | 0 | 0.0% |
| 5 to 9 Minutes | 85 | 15.8% |
| 10 to 14 Minutes | 112 | 20.8% |
| 15 to 19 Minutes | 78 | 14.5% |
| 20 to 24 Minutes | 59 | 11.0% |
| 25 to 29 Minutes | 22 | 4.1% |
| 30 to 34 Minutes | 104 | 19.3% |
| 35 to 39 Minutes | 24 | 4.5% |
| 40 to 44 Minutes | 7 | 1.3% |
| 45 to 59 Minutes | 8 | 1.5% |
| 60 to 89 Minutes | 3 | 0.6% |
| 90 or more Minutes | 36 | 6.7% |
Commute Time by Sex in Alto
The most common commute times in Alto are 30 to 34 minutes (84 commuters, 29.0%) for males and 5 to 9 minutes (55 commuters, 22.2%) for females.
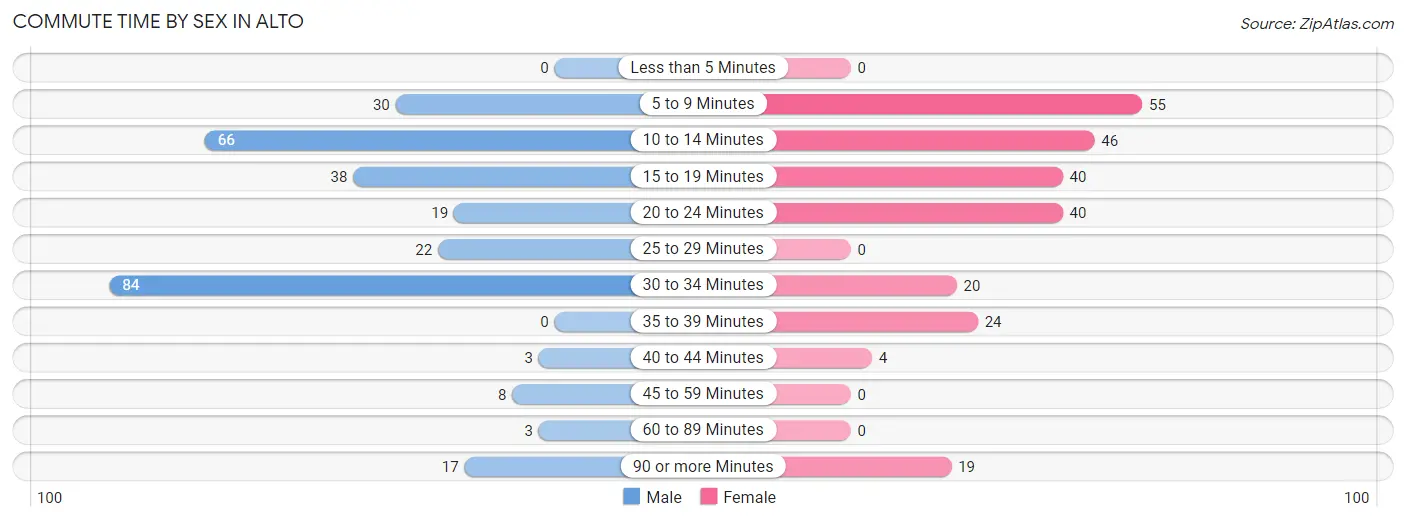
| Commute Time | Male | Female |
| Less than 5 Minutes | 0 (0.0%) | 0 (0.0%) |
| 5 to 9 Minutes | 30 (10.3%) | 55 (22.2%) |
| 10 to 14 Minutes | 66 (22.8%) | 46 (18.5%) |
| 15 to 19 Minutes | 38 (13.1%) | 40 (16.1%) |
| 20 to 24 Minutes | 19 (6.6%) | 40 (16.1%) |
| 25 to 29 Minutes | 22 (7.6%) | 0 (0.0%) |
| 30 to 34 Minutes | 84 (29.0%) | 20 (8.1%) |
| 35 to 39 Minutes | 0 (0.0%) | 24 (9.7%) |
| 40 to 44 Minutes | 3 (1.0%) | 4 (1.6%) |
| 45 to 59 Minutes | 8 (2.8%) | 0 (0.0%) |
| 60 to 89 Minutes | 3 (1.0%) | 0 (0.0%) |
| 90 or more Minutes | 17 (5.9%) | 19 (7.7%) |
Time of Departure to Work by Sex in Alto
The most frequent times of departure to work in Alto are 6:00 AM to 6:29 AM (50, 17.2%) for males and 7:00 AM to 7:29 AM (86, 34.7%) for females.
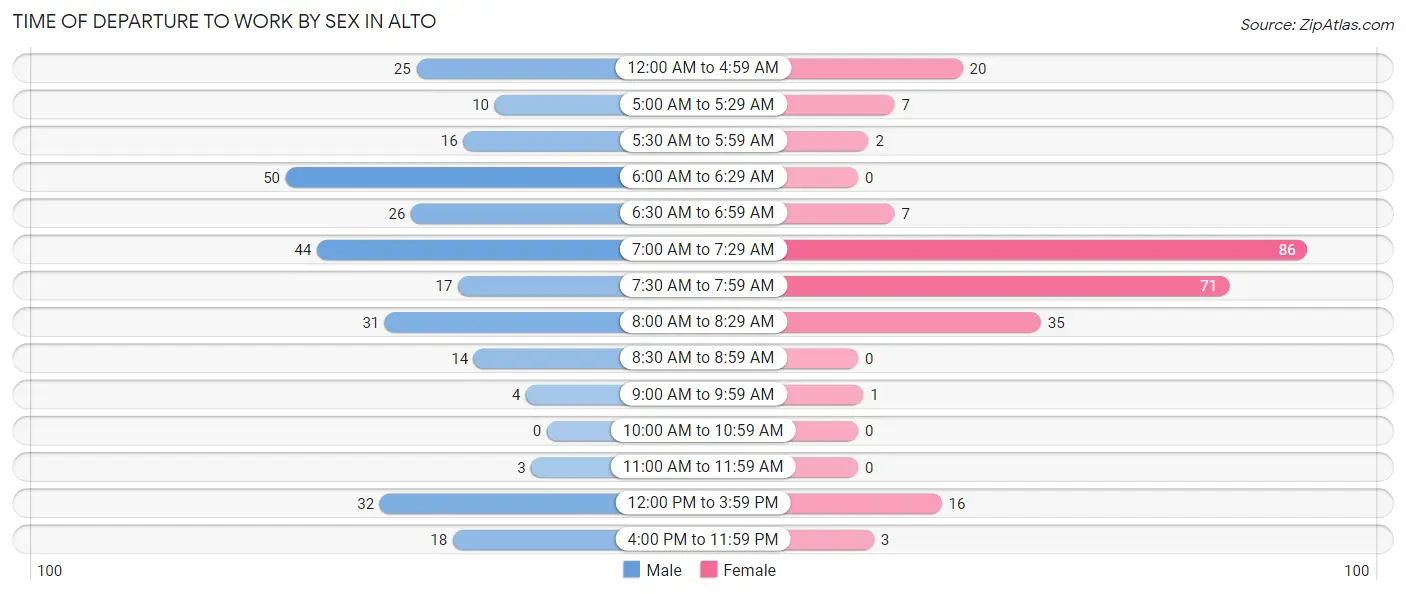
| Time of Departure | Male | Female |
| 12:00 AM to 4:59 AM | 25 (8.6%) | 20 (8.1%) |
| 5:00 AM to 5:29 AM | 10 (3.5%) | 7 (2.8%) |
| 5:30 AM to 5:59 AM | 16 (5.5%) | 2 (0.8%) |
| 6:00 AM to 6:29 AM | 50 (17.2%) | 0 (0.0%) |
| 6:30 AM to 6:59 AM | 26 (9.0%) | 7 (2.8%) |
| 7:00 AM to 7:29 AM | 44 (15.2%) | 86 (34.7%) |
| 7:30 AM to 7:59 AM | 17 (5.9%) | 71 (28.6%) |
| 8:00 AM to 8:29 AM | 31 (10.7%) | 35 (14.1%) |
| 8:30 AM to 8:59 AM | 14 (4.8%) | 0 (0.0%) |
| 9:00 AM to 9:59 AM | 4 (1.4%) | 1 (0.4%) |
| 10:00 AM to 10:59 AM | 0 (0.0%) | 0 (0.0%) |
| 11:00 AM to 11:59 AM | 3 (1.0%) | 0 (0.0%) |
| 12:00 PM to 3:59 PM | 32 (11.0%) | 16 (6.5%) |
| 4:00 PM to 11:59 PM | 18 (6.2%) | 3 (1.2%) |
| Total | 290 (100.0%) | 248 (100.0%) |
Housing Occupancy in Alto
Occupancy by Ownership in Alto
Of the total 327 dwellings in Alto, owner-occupied units account for 231 (70.6%), while renter-occupied units make up 96 (29.4%).
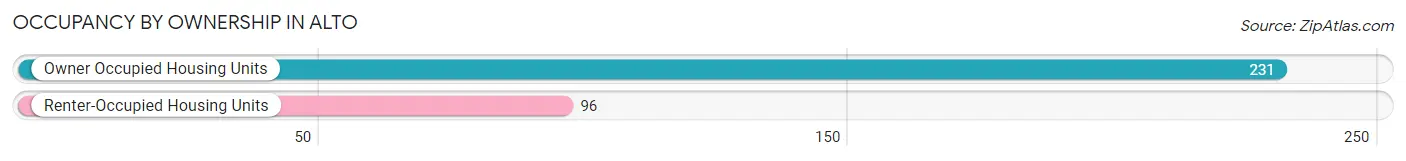
| Occupancy | # Housing Units | % Housing Units |
| Owner Occupied Housing Units | 231 | 70.6% |
| Renter-Occupied Housing Units | 96 | 29.4% |
| Total Occupied Housing Units | 327 | 100.0% |
Occupancy by Household Size in Alto
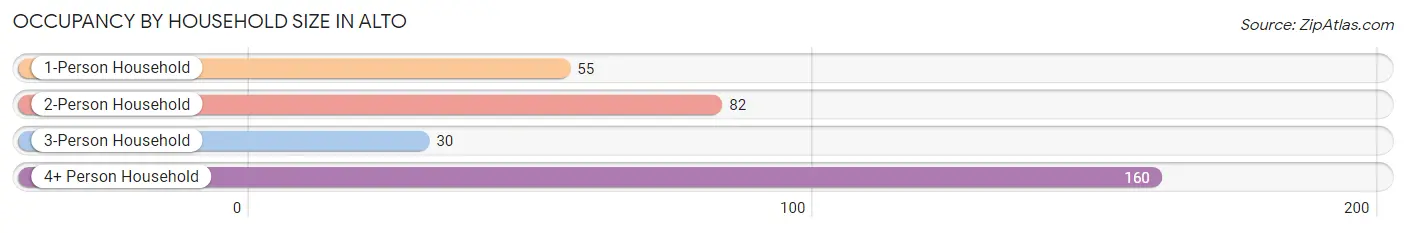
| Household Size | # Housing Units | % Housing Units |
| 1-Person Household | 55 | 16.8% |
| 2-Person Household | 82 | 25.1% |
| 3-Person Household | 30 | 9.2% |
| 4+ Person Household | 160 | 48.9% |
| Total Housing Units | 327 | 100.0% |
Occupancy by Ownership by Household Size in Alto
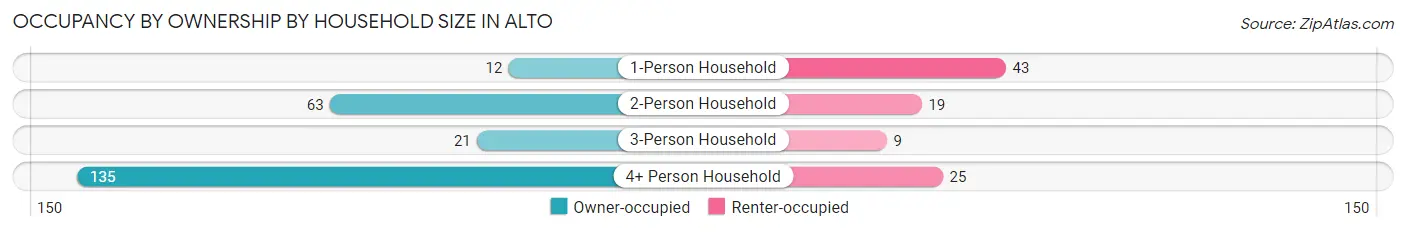
| Household Size | Owner-occupied | Renter-occupied |
| 1-Person Household | 12 (21.8%) | 43 (78.2%) |
| 2-Person Household | 63 (76.8%) | 19 (23.2%) |
| 3-Person Household | 21 (70.0%) | 9 (30.0%) |
| 4+ Person Household | 135 (84.4%) | 25 (15.6%) |
| Total Housing Units | 231 (70.6%) | 96 (29.4%) |
Occupancy by Educational Attainment in Alto
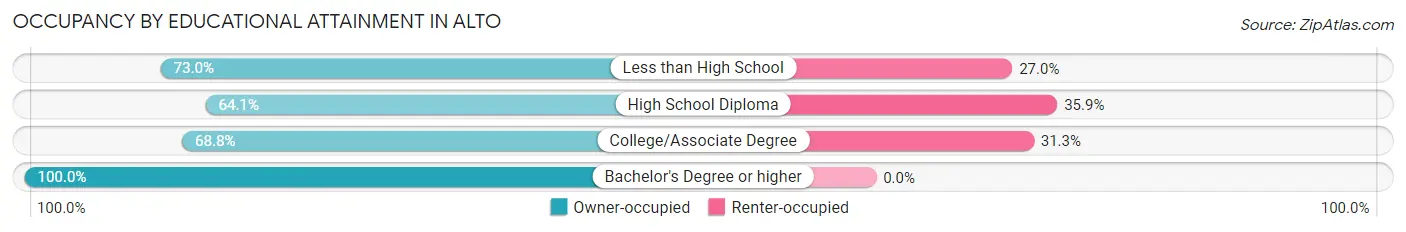
| Household Size | Owner-occupied | Renter-occupied |
| Less than High School | 92 (73.0%) | 34 (27.0%) |
| High School Diploma | 75 (64.1%) | 42 (35.9%) |
| College/Associate Degree | 44 (68.8%) | 20 (31.2%) |
| Bachelor's Degree or higher | 20 (100.0%) | 0 (0.0%) |
Occupancy by Age of Householder in Alto
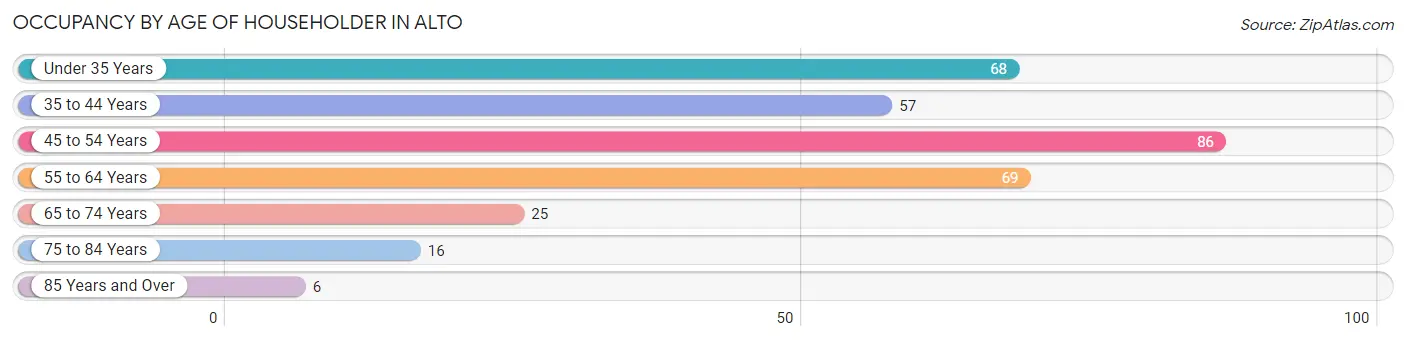
| Age Bracket | # Households | % Households |
| Under 35 Years | 68 | 20.8% |
| 35 to 44 Years | 57 | 17.4% |
| 45 to 54 Years | 86 | 26.3% |
| 55 to 64 Years | 69 | 21.1% |
| 65 to 74 Years | 25 | 7.6% |
| 75 to 84 Years | 16 | 4.9% |
| 85 Years and Over | 6 | 1.8% |
| Total | 327 | 100.0% |
Housing Finances in Alto
Median Income by Occupancy in Alto
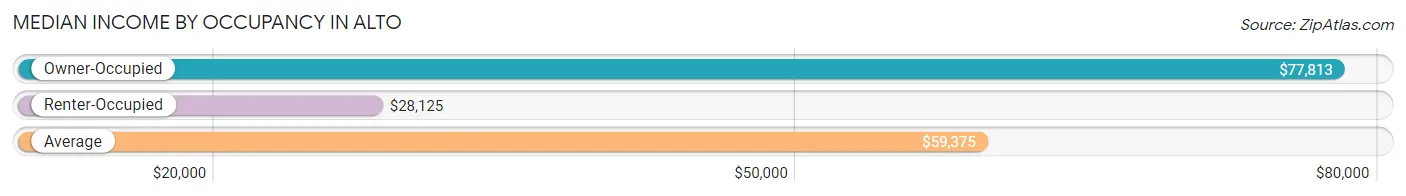
| Occupancy Type | # Households | Median Income |
| Owner-Occupied | 231 (70.6%) | $77,813 |
| Renter-Occupied | 96 (29.4%) | $28,125 |
| Average | 327 (100.0%) | $59,375 |
Occupancy by Householder Income Bracket in Alto
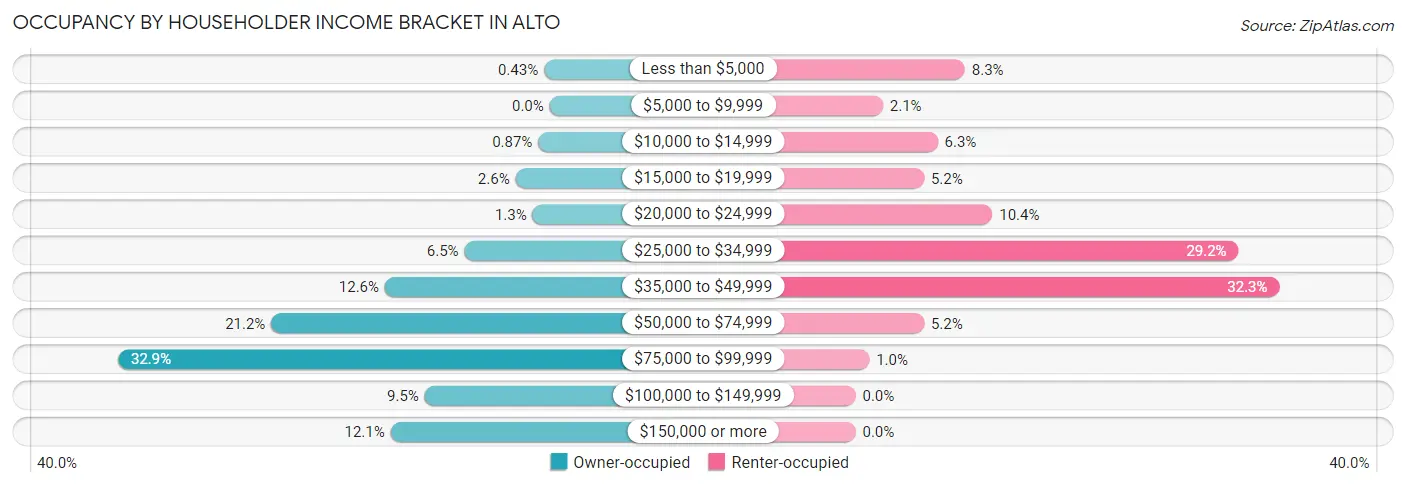
| Income Bracket | Owner-occupied | Renter-occupied |
| Less than $5,000 | 1 (0.4%) | 8 (8.3%) |
| $5,000 to $9,999 | 0 (0.0%) | 2 (2.1%) |
| $10,000 to $14,999 | 2 (0.9%) | 6 (6.2%) |
| $15,000 to $19,999 | 6 (2.6%) | 5 (5.2%) |
| $20,000 to $24,999 | 3 (1.3%) | 10 (10.4%) |
| $25,000 to $34,999 | 15 (6.5%) | 28 (29.2%) |
| $35,000 to $49,999 | 29 (12.6%) | 31 (32.3%) |
| $50,000 to $74,999 | 49 (21.2%) | 5 (5.2%) |
| $75,000 to $99,999 | 76 (32.9%) | 1 (1.0%) |
| $100,000 to $149,999 | 22 (9.5%) | 0 (0.0%) |
| $150,000 or more | 28 (12.1%) | 0 (0.0%) |
| Total | 231 (100.0%) | 96 (100.0%) |
Monthly Housing Cost Tiers in Alto
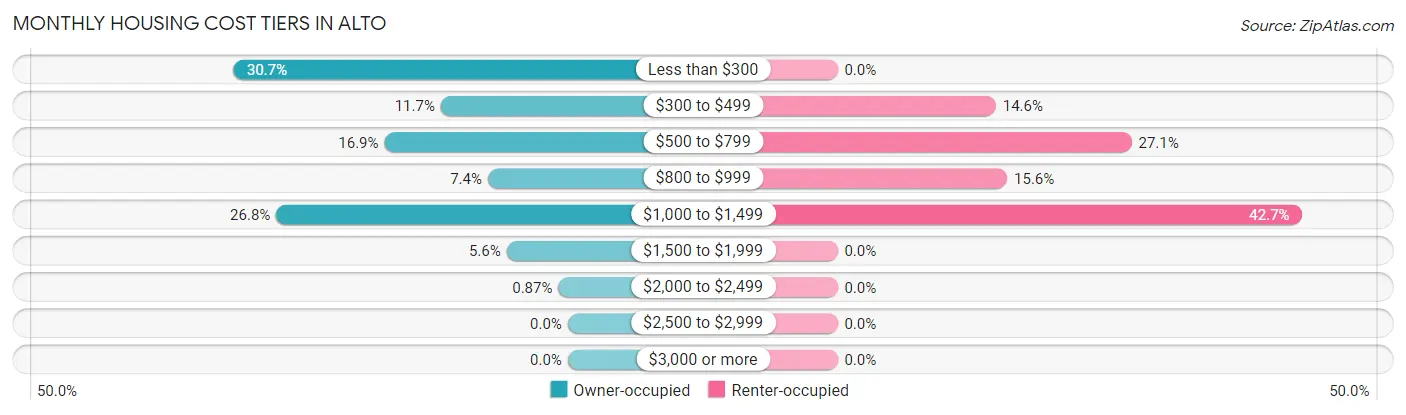
| Monthly Cost | Owner-occupied | Renter-occupied |
| Less than $300 | 71 (30.7%) | 0 (0.0%) |
| $300 to $499 | 27 (11.7%) | 14 (14.6%) |
| $500 to $799 | 39 (16.9%) | 26 (27.1%) |
| $800 to $999 | 17 (7.4%) | 15 (15.6%) |
| $1,000 to $1,499 | 62 (26.8%) | 41 (42.7%) |
| $1,500 to $1,999 | 13 (5.6%) | 0 (0.0%) |
| $2,000 to $2,499 | 2 (0.9%) | 0 (0.0%) |
| $2,500 to $2,999 | 0 (0.0%) | 0 (0.0%) |
| $3,000 or more | 0 (0.0%) | 0 (0.0%) |
| Total | 231 (100.0%) | 96 (100.0%) |
Physical Housing Characteristics in Alto
Housing Structures in Alto
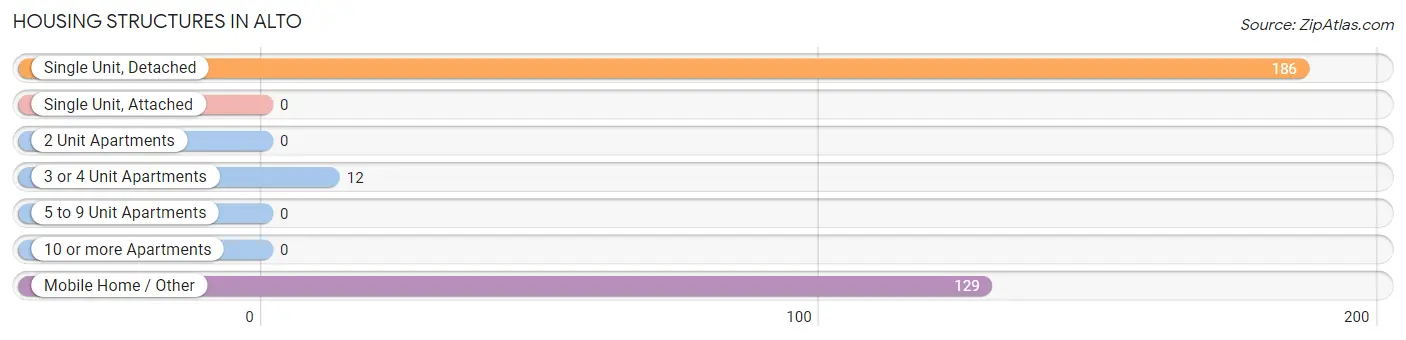
| Structure Type | # Housing Units | % Housing Units |
| Single Unit, Detached | 186 | 56.9% |
| Single Unit, Attached | 0 | 0.0% |
| 2 Unit Apartments | 0 | 0.0% |
| 3 or 4 Unit Apartments | 12 | 3.7% |
| 5 to 9 Unit Apartments | 0 | 0.0% |
| 10 or more Apartments | 0 | 0.0% |
| Mobile Home / Other | 129 | 39.5% |
| Total | 327 | 100.0% |
Housing Structures by Occupancy in Alto
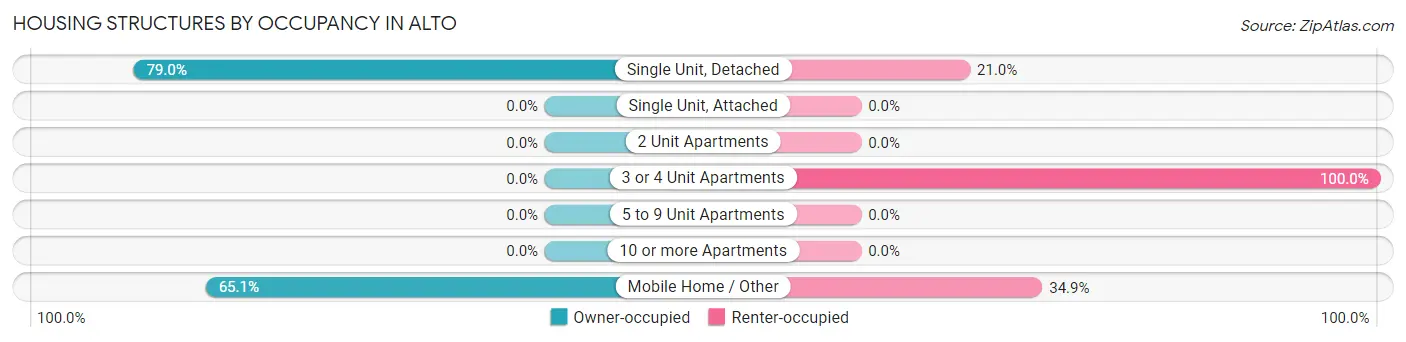
| Structure Type | Owner-occupied | Renter-occupied |
| Single Unit, Detached | 147 (79.0%) | 39 (21.0%) |
| Single Unit, Attached | 0 (0.0%) | 0 (0.0%) |
| 2 Unit Apartments | 0 (0.0%) | 0 (0.0%) |
| 3 or 4 Unit Apartments | 0 (0.0%) | 12 (100.0%) |
| 5 to 9 Unit Apartments | 0 (0.0%) | 0 (0.0%) |
| 10 or more Apartments | 0 (0.0%) | 0 (0.0%) |
| Mobile Home / Other | 84 (65.1%) | 45 (34.9%) |
| Total | 231 (70.6%) | 96 (29.4%) |
Housing Structures by Number of Rooms in Alto
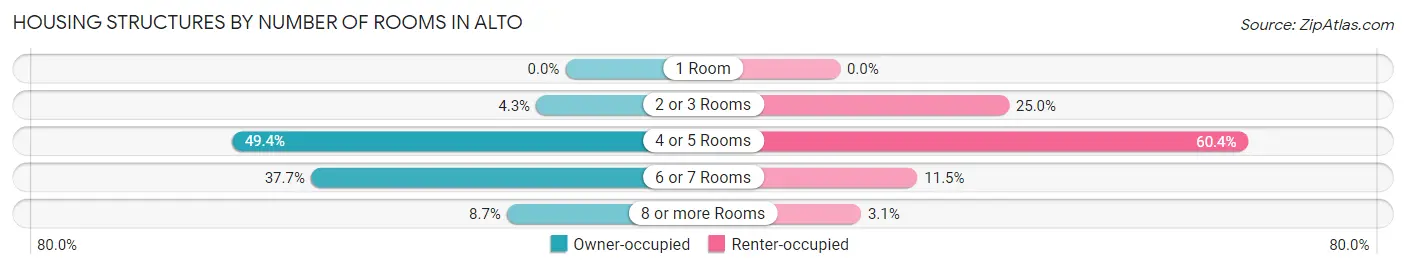
| Number of Rooms | Owner-occupied | Renter-occupied |
| 1 Room | 0 (0.0%) | 0 (0.0%) |
| 2 or 3 Rooms | 10 (4.3%) | 24 (25.0%) |
| 4 or 5 Rooms | 114 (49.3%) | 58 (60.4%) |
| 6 or 7 Rooms | 87 (37.7%) | 11 (11.5%) |
| 8 or more Rooms | 20 (8.7%) | 3 (3.1%) |
| Total | 231 (100.0%) | 96 (100.0%) |
Housing Structure by Heating Type in Alto
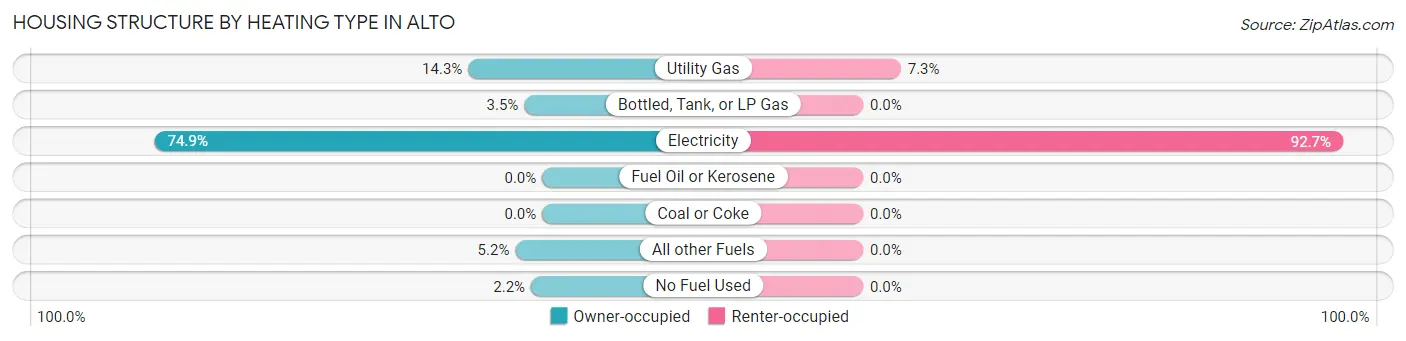
| Heating Type | Owner-occupied | Renter-occupied |
| Utility Gas | 33 (14.3%) | 7 (7.3%) |
| Bottled, Tank, or LP Gas | 8 (3.5%) | 0 (0.0%) |
| Electricity | 173 (74.9%) | 89 (92.7%) |
| Fuel Oil or Kerosene | 0 (0.0%) | 0 (0.0%) |
| Coal or Coke | 0 (0.0%) | 0 (0.0%) |
| All other Fuels | 12 (5.2%) | 0 (0.0%) |
| No Fuel Used | 5 (2.2%) | 0 (0.0%) |
| Total | 231 (100.0%) | 96 (100.0%) |
Household Vehicle Usage in Alto
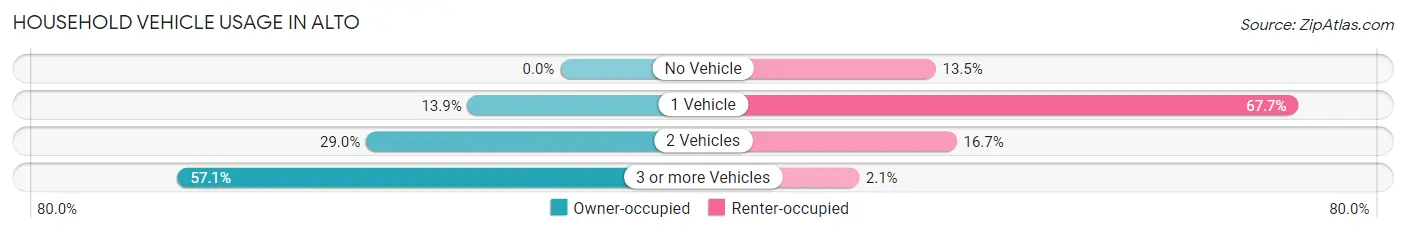
| Vehicles per Household | Owner-occupied | Renter-occupied |
| No Vehicle | 0 (0.0%) | 13 (13.5%) |
| 1 Vehicle | 32 (13.9%) | 65 (67.7%) |
| 2 Vehicles | 67 (29.0%) | 16 (16.7%) |
| 3 or more Vehicles | 132 (57.1%) | 2 (2.1%) |
| Total | 231 (100.0%) | 96 (100.0%) |
Real Estate & Mortgages in Alto
Real Estate and Mortgage Overview in Alto
| Characteristic | Without Mortgage | With Mortgage |
| Housing Units | 135 | 96 |
| Median Property Value | $119,300 | $159,500 |
| Median Household Income | $77,538 | $1 |
| Monthly Housing Costs | $296 | $0 |
| Real Estate Taxes | $440 | $9 |
Property Value by Mortgage Status in Alto
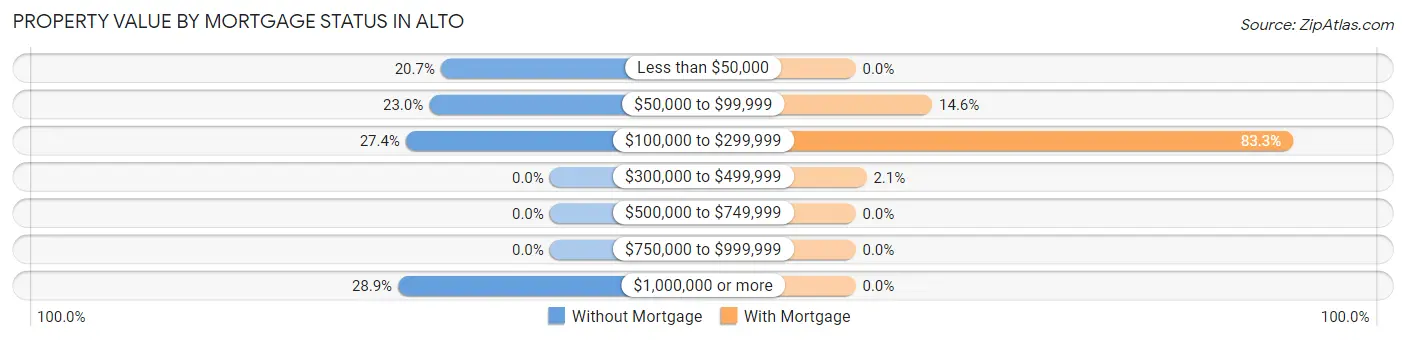
| Property Value | Without Mortgage | With Mortgage |
| Less than $50,000 | 28 (20.7%) | 0 (0.0%) |
| $50,000 to $99,999 | 31 (23.0%) | 14 (14.6%) |
| $100,000 to $299,999 | 37 (27.4%) | 80 (83.3%) |
| $300,000 to $499,999 | 0 (0.0%) | 2 (2.1%) |
| $500,000 to $749,999 | 0 (0.0%) | 0 (0.0%) |
| $750,000 to $999,999 | 0 (0.0%) | 0 (0.0%) |
| $1,000,000 or more | 39 (28.9%) | 0 (0.0%) |
| Total | 135 (100.0%) | 96 (100.0%) |
Household Income by Mortgage Status in Alto
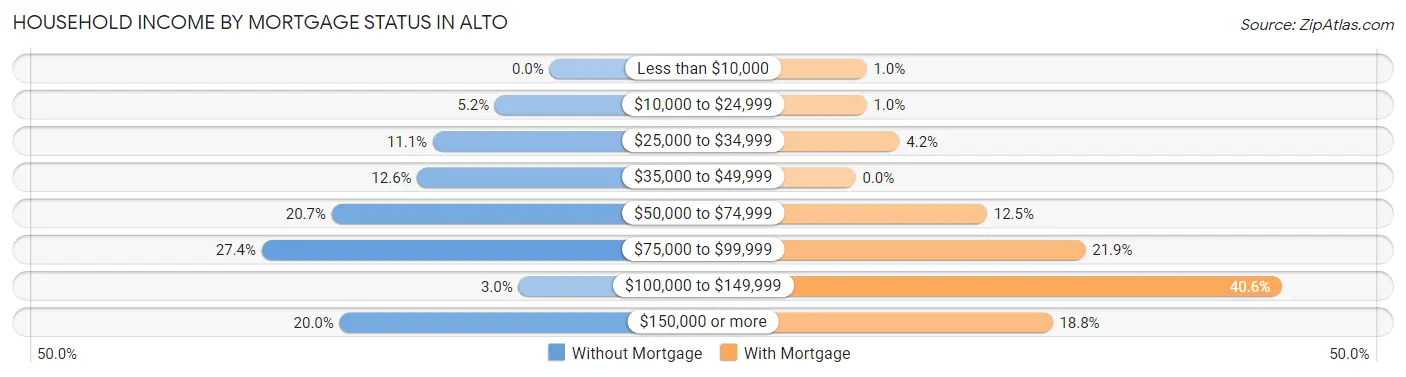
| Household Income | Without Mortgage | With Mortgage |
| Less than $10,000 | 0 (0.0%) | 1 (1.0%) |
| $10,000 to $24,999 | 7 (5.2%) | 1 (1.0%) |
| $25,000 to $34,999 | 15 (11.1%) | 4 (4.2%) |
| $35,000 to $49,999 | 17 (12.6%) | 0 (0.0%) |
| $50,000 to $74,999 | 28 (20.7%) | 12 (12.5%) |
| $75,000 to $99,999 | 37 (27.4%) | 21 (21.9%) |
| $100,000 to $149,999 | 4 (3.0%) | 39 (40.6%) |
| $150,000 or more | 27 (20.0%) | 18 (18.8%) |
| Total | 135 (100.0%) | 96 (100.0%) |
Property Value to Household Income Ratio in Alto
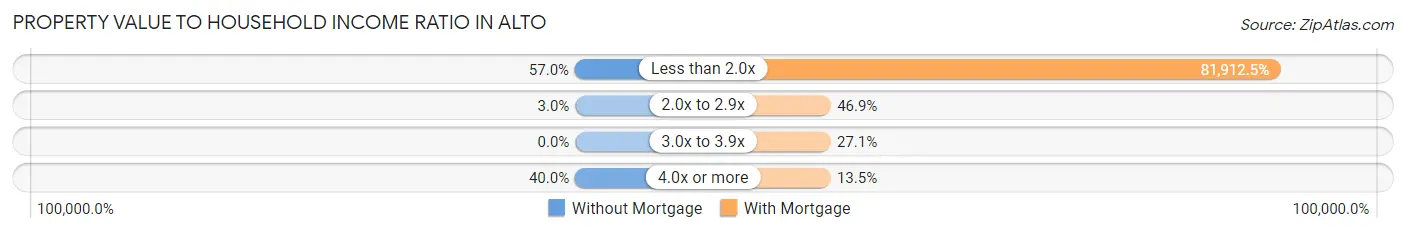
| Value-to-Income Ratio | Without Mortgage | With Mortgage |
| Less than 2.0x | 77 (57.0%) | 78,636 (81,912.5%) |
| 2.0x to 2.9x | 4 (3.0%) | 45 (46.9%) |
| 3.0x to 3.9x | 0 (0.0%) | 26 (27.1%) |
| 4.0x or more | 54 (40.0%) | 13 (13.5%) |
| Total | 135 (100.0%) | 96 (100.0%) |
Real Estate Taxes by Mortgage Status in Alto
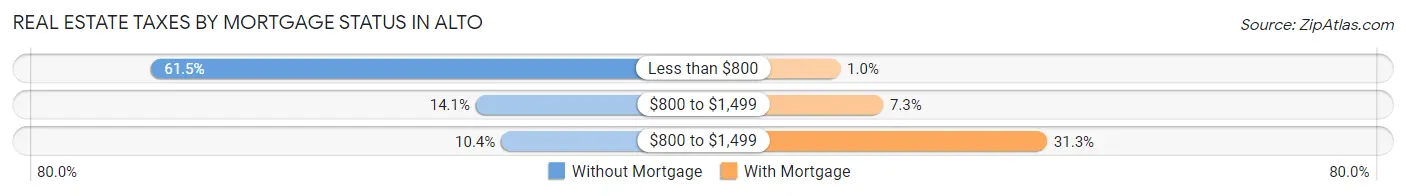
| Property Taxes | Without Mortgage | With Mortgage |
| Less than $800 | 83 (61.5%) | 1 (1.0%) |
| $800 to $1,499 | 19 (14.1%) | 7 (7.3%) |
| $800 to $1,499 | 14 (10.4%) | 30 (31.2%) |
| Total | 135 (100.0%) | 96 (100.0%) |
Health & Disability in Alto
Health Insurance Coverage by Age in Alto
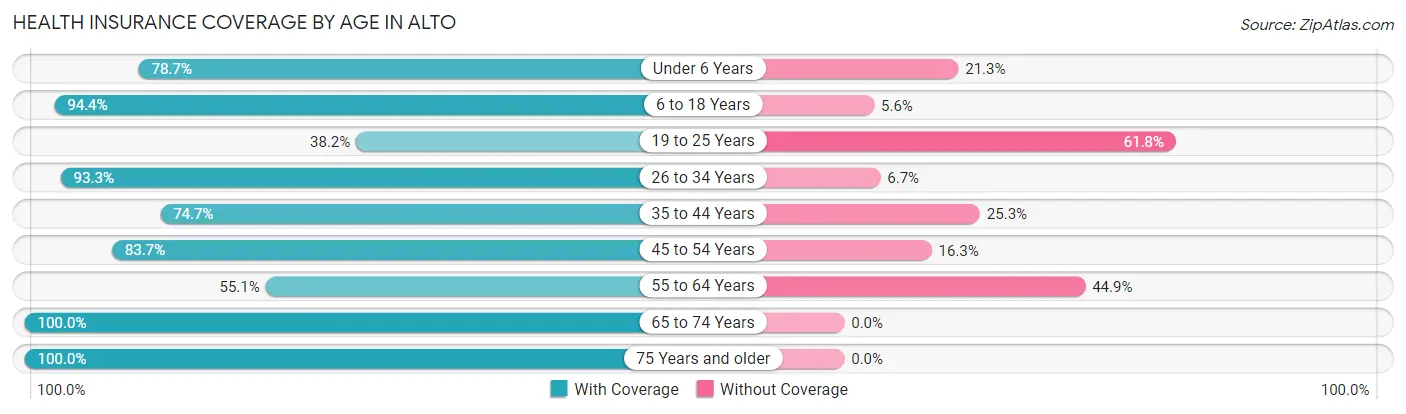
| Age Bracket | With Coverage | Without Coverage |
| Under 6 Years | 100 (78.7%) | 27 (21.3%) |
| 6 to 18 Years | 357 (94.4%) | 21 (5.6%) |
| 19 to 25 Years | 42 (38.2%) | 68 (61.8%) |
| 26 to 34 Years | 97 (93.3%) | 7 (6.7%) |
| 35 to 44 Years | 127 (74.7%) | 43 (25.3%) |
| 45 to 54 Years | 108 (83.7%) | 21 (16.3%) |
| 55 to 64 Years | 114 (55.1%) | 93 (44.9%) |
| 65 to 74 Years | 55 (100.0%) | 0 (0.0%) |
| 75 Years and older | 48 (100.0%) | 0 (0.0%) |
| Total | 1,048 (78.9%) | 280 (21.1%) |
Health Insurance Coverage by Citizenship Status in Alto
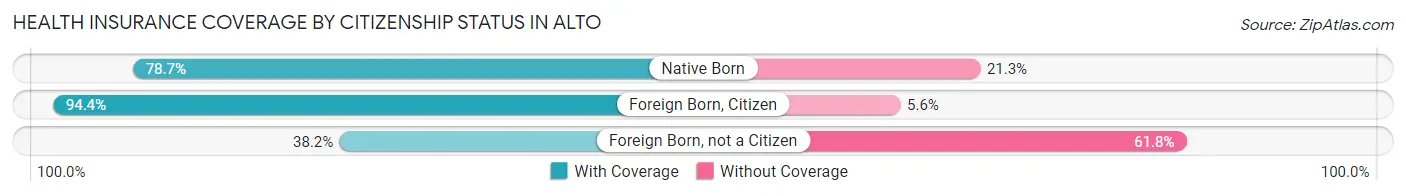
| Citizenship Status | With Coverage | Without Coverage |
| Native Born | 100 (78.7%) | 27 (21.3%) |
| Foreign Born, Citizen | 357 (94.4%) | 21 (5.6%) |
| Foreign Born, not a Citizen | 42 (38.2%) | 68 (61.8%) |
Health Insurance Coverage by Household Income in Alto
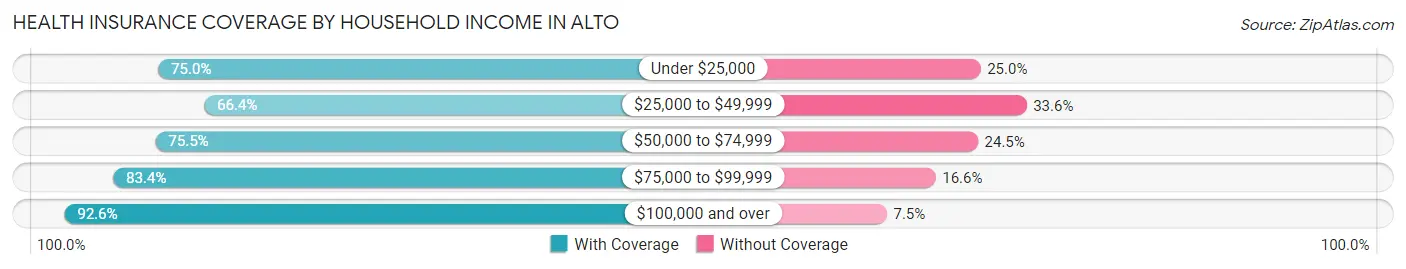
| Household Income | With Coverage | Without Coverage |
| Under $25,000 | 48 (75.0%) | 16 (25.0%) |
| $25,000 to $49,999 | 233 (66.4%) | 118 (33.6%) |
| $50,000 to $74,999 | 194 (75.5%) | 63 (24.5%) |
| $75,000 to $99,999 | 312 (83.4%) | 62 (16.6%) |
| $100,000 and over | 261 (92.5%) | 21 (7.4%) |
Public vs Private Health Insurance Coverage by Age in Alto
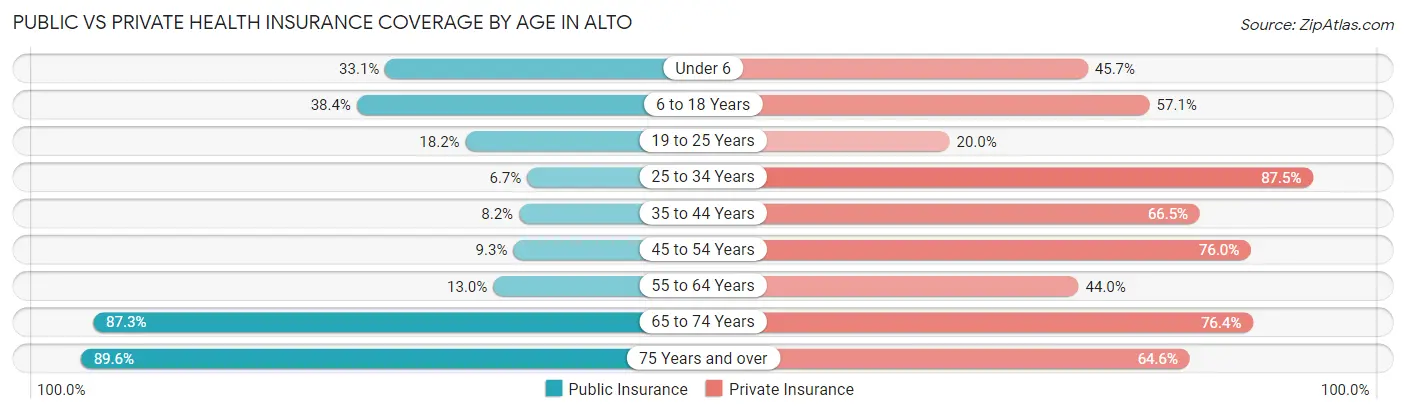
| Age Bracket | Public Insurance | Private Insurance |
| Under 6 | 42 (33.1%) | 58 (45.7%) |
| 6 to 18 Years | 145 (38.4%) | 216 (57.1%) |
| 19 to 25 Years | 20 (18.2%) | 22 (20.0%) |
| 25 to 34 Years | 7 (6.7%) | 91 (87.5%) |
| 35 to 44 Years | 14 (8.2%) | 113 (66.5%) |
| 45 to 54 Years | 12 (9.3%) | 98 (76.0%) |
| 55 to 64 Years | 27 (13.0%) | 91 (44.0%) |
| 65 to 74 Years | 48 (87.3%) | 42 (76.4%) |
| 75 Years and over | 43 (89.6%) | 31 (64.6%) |
| Total | 358 (27.0%) | 762 (57.4%) |
Disability Status by Sex by Age in Alto
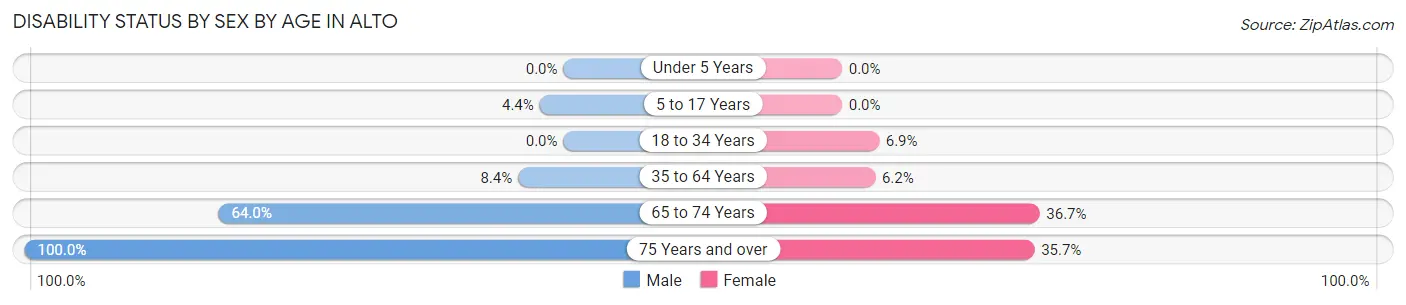
| Age Bracket | Male | Female |
| Under 5 Years | 0 (0.0%) | 0 (0.0%) |
| 5 to 17 Years | 9 (4.4%) | 0 (0.0%) |
| 18 to 34 Years | 0 (0.0%) | 7 (6.9%) |
| 35 to 64 Years | 18 (8.4%) | 18 (6.2%) |
| 65 to 74 Years | 16 (64.0%) | 11 (36.7%) |
| 75 Years and over | 20 (100.0%) | 10 (35.7%) |
Disability Class by Sex by Age in Alto
Disability Class: Hearing Difficulty
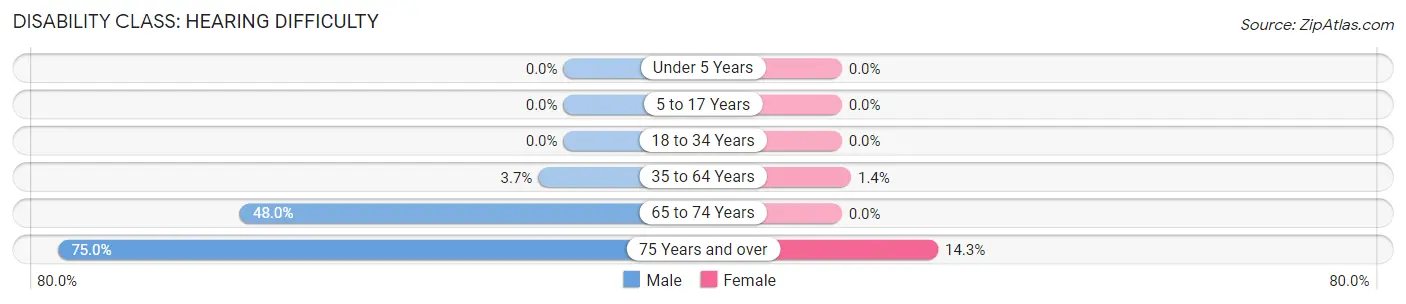
| Age Bracket | Male | Female |
| Under 5 Years | 0 (0.0%) | 0 (0.0%) |
| 5 to 17 Years | 0 (0.0%) | 0 (0.0%) |
| 18 to 34 Years | 0 (0.0%) | 0 (0.0%) |
| 35 to 64 Years | 8 (3.7%) | 4 (1.4%) |
| 65 to 74 Years | 12 (48.0%) | 0 (0.0%) |
| 75 Years and over | 15 (75.0%) | 4 (14.3%) |
Disability Class: Vision Difficulty
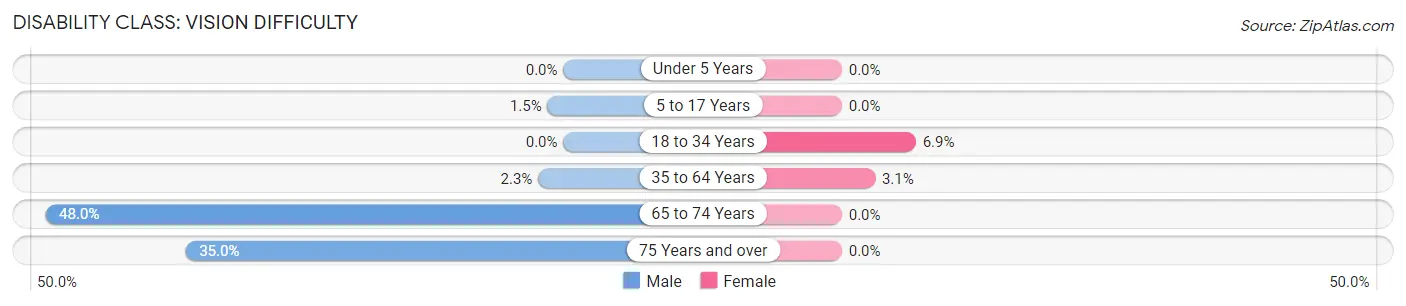
| Age Bracket | Male | Female |
| Under 5 Years | 0 (0.0%) | 0 (0.0%) |
| 5 to 17 Years | 3 (1.5%) | 0 (0.0%) |
| 18 to 34 Years | 0 (0.0%) | 7 (6.9%) |
| 35 to 64 Years | 5 (2.3%) | 9 (3.1%) |
| 65 to 74 Years | 12 (48.0%) | 0 (0.0%) |
| 75 Years and over | 7 (35.0%) | 0 (0.0%) |
Disability Class: Cognitive Difficulty
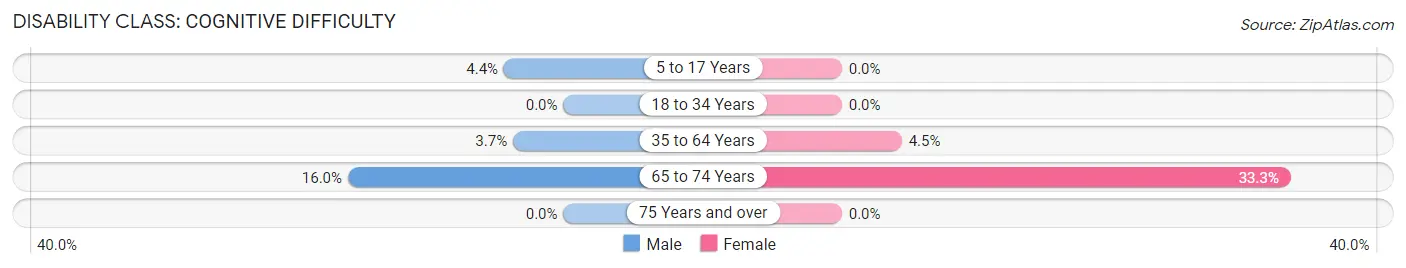
| Age Bracket | Male | Female |
| 5 to 17 Years | 9 (4.4%) | 0 (0.0%) |
| 18 to 34 Years | 0 (0.0%) | 0 (0.0%) |
| 35 to 64 Years | 8 (3.7%) | 13 (4.4%) |
| 65 to 74 Years | 4 (16.0%) | 10 (33.3%) |
| 75 Years and over | 0 (0.0%) | 0 (0.0%) |
Disability Class: Ambulatory Difficulty
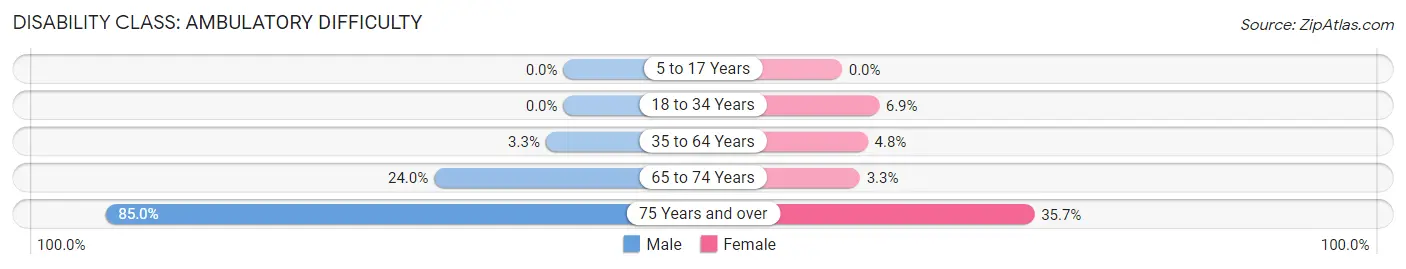
| Age Bracket | Male | Female |
| 5 to 17 Years | 0 (0.0%) | 0 (0.0%) |
| 18 to 34 Years | 0 (0.0%) | 7 (6.9%) |
| 35 to 64 Years | 7 (3.3%) | 14 (4.8%) |
| 65 to 74 Years | 6 (24.0%) | 1 (3.3%) |
| 75 Years and over | 17 (85.0%) | 10 (35.7%) |
Disability Class: Self-Care Difficulty
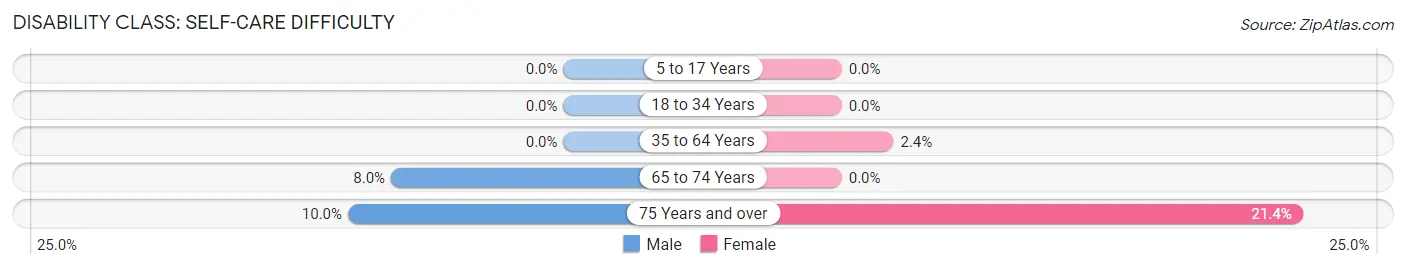
| Age Bracket | Male | Female |
| 5 to 17 Years | 0 (0.0%) | 0 (0.0%) |
| 18 to 34 Years | 0 (0.0%) | 0 (0.0%) |
| 35 to 64 Years | 0 (0.0%) | 7 (2.4%) |
| 65 to 74 Years | 2 (8.0%) | 0 (0.0%) |
| 75 Years and over | 2 (10.0%) | 6 (21.4%) |
Technology Access in Alto
Computing Device Access in Alto
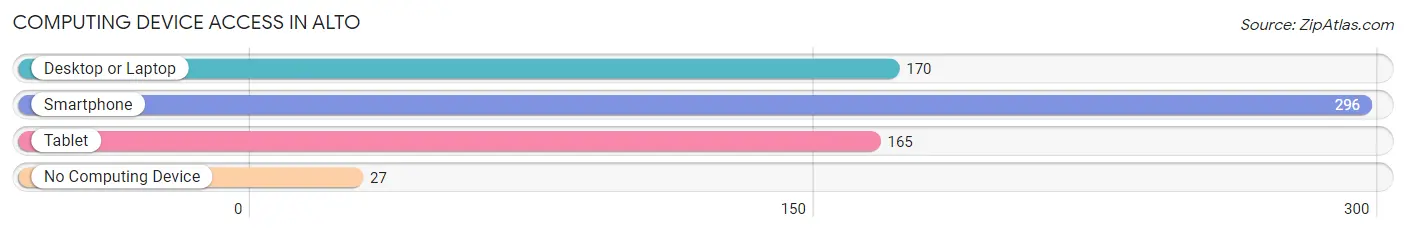
| Device Type | # Households | % Households |
| Desktop or Laptop | 170 | 52.0% |
| Smartphone | 296 | 90.5% |
| Tablet | 165 | 50.5% |
| No Computing Device | 27 | 8.3% |
| Total | 327 | 100.0% |
Internet Access in Alto
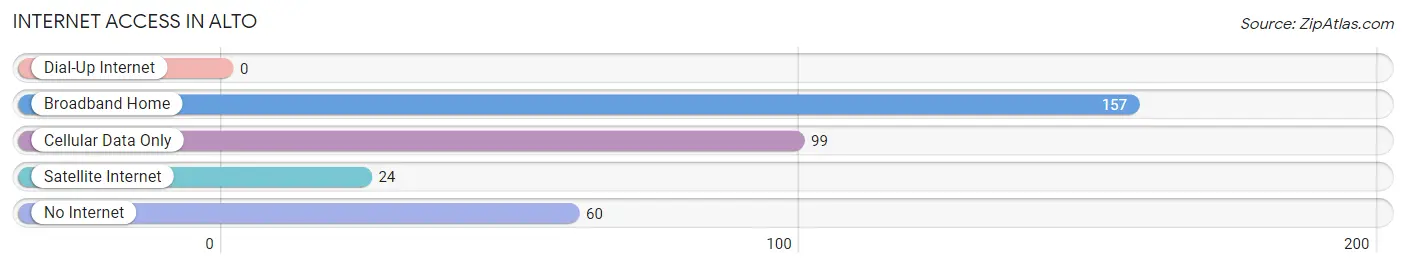
| Internet Type | # Households | % Households |
| Dial-Up Internet | 0 | 0.0% |
| Broadband Home | 157 | 48.0% |
| Cellular Data Only | 99 | 30.3% |
| Satellite Internet | 24 | 7.3% |
| No Internet | 60 | 18.3% |
| Total | 327 | 100.0% |
Alto Summary
Alto is a small town located in Habersham County, Georgia, United States. It is situated in the foothills of the Blue Ridge Mountains, approximately 90 miles northeast of Atlanta. The town has a population of approximately 1,400 people and covers an area of 1.2 square miles.
History
Alto was founded in 1883 by a group of settlers from North Carolina. The town was named after the nearby Alto Creek, which was named after the Latin word for “high”. The town was originally a farming community, but it soon developed into a small industrial center. In the early 1900s, Alto was home to several cotton mills, a sawmill, and a gristmill.
In the 1920s, Alto began to experience a period of growth and prosperity. The town was home to several stores, a bank, a hotel, and a movie theater. The town also had its own newspaper, the Alto Herald.
In the 1950s, Alto began to experience a decline in population and industry. The cotton mills and other factories closed, and many of the town’s businesses moved away. In the 1970s, the town began to experience a resurgence in population and industry. The town was home to several new businesses, including a furniture store, a grocery store, and a restaurant.
Geography
Alto is located in the foothills of the Blue Ridge Mountains in Habersham County, Georgia. The town is situated at an elevation of 1,400 feet above sea level. The town is surrounded by several small mountains, including Mount Alto, which is the highest peak in the area. The town is located approximately 90 miles northeast of Atlanta.
The town is located in a humid subtropical climate zone, with hot summers and mild winters. The average annual temperature is around 60 degrees Fahrenheit. The town receives an average of 48 inches of precipitation per year, with most of it falling in the form of rain.
Economy
Alto’s economy is largely based on agriculture and tourism. The town is home to several farms, which produce a variety of crops, including corn, soybeans, and hay. The town is also home to several wineries, which produce a variety of wines.
The town is also home to several small businesses, including restaurants, stores, and a furniture store. The town is also home to several manufacturing companies, which produce a variety of products, including furniture, clothing, and electronics.
Demographics
As of the 2010 census, Alto had a population of 1,400 people. The town is predominantly white, with approximately 95% of the population being white. The town is also home to a small Hispanic population, with approximately 4% of the population being Hispanic. The town is also home to a small African American population, with approximately 1% of the population being African American.
The median household income in Alto is approximately $35,000 per year. The median home value in Alto is approximately $150,000. The town has a poverty rate of approximately 15%.
Conclusion
Alto is a small town located in Habersham County, Georgia. The town has a population of approximately 1,400 people and covers an area of 1.2 square miles. The town was founded in 1883 and was originally a farming community. In the early 1900s, Alto was home to several cotton mills, a sawmill, and a gristmill. In the 1950s, Alto began to experience a decline in population and industry. In the 1970s, the town began to experience a resurgence in population and industry. The town’s economy is largely based on agriculture and tourism. The town is predominantly white, with approximately 95% of the population being white. The median household income in Alto is approximately $35,000 per year.
Common Questions
What is Per Capita Income in Alto?
Per Capita income in Alto is $19,240.
What is the Median Family Income in Alto?
Median Family Income in Alto is $72,639.
What is the Median Household income in Alto?
Median Household Income in Alto is $59,375.
What is Income or Wage Gap in Alto?
Income or Wage Gap in Alto is 24.8%.
Women in Alto earn 75.2 cents for every dollar earned by a man.
What is Inequality or Gini Index in Alto?
Inequality or Gini Index in Alto is 0.38.
What is the Total Population of Alto?
Total Population of Alto is 1,328.
What is the Total Male Population of Alto?
Total Male Population of Alto is 599.
What is the Total Female Population of Alto?
Total Female Population of Alto is 729.
What is the Ratio of Males per 100 Females in Alto?
There are 82.17 Males per 100 Females in Alto.
What is the Ratio of Females per 100 Males in Alto?
There are 121.70 Females per 100 Males in Alto.
What is the Median Population Age in Alto?
Median Population Age in Alto is 30.3 Years.
What is the Average Family Size in Alto
Average Family Size in Alto is 4.5 People.
What is the Average Household Size in Alto
Average Household Size in Alto is 4.1 People.
How Large is the Labor Force in Alto?
There are 571 People in the Labor Forcein in Alto.
What is the Percentage of People in the Labor Force in Alto?
64.6% of People are in the Labor Force in Alto.
What is the Unemployment Rate in Alto?
Unemployment Rate in Alto is 4.4%.