Bushyhead, OK Map & Demographics
Bushyhead Map
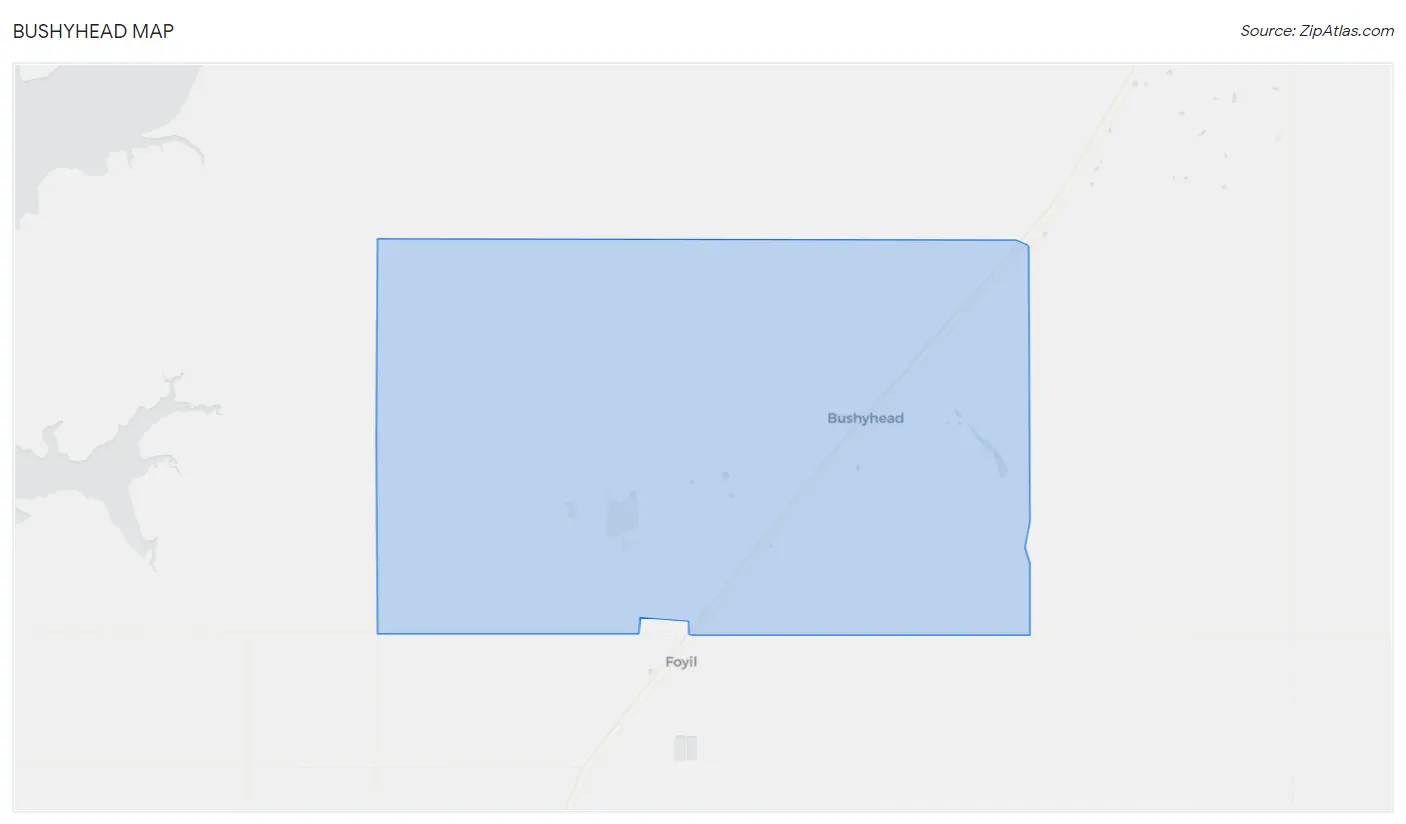
Bushyhead Overview
$25,677
PER CAPITA INCOME
$49,643
AVG FAMILY INCOME
$48,816
AVG HOUSEHOLD INCOME
34.3%
WAGE / INCOME GAP [ % ]
65.7¢/ $1
WAGE / INCOME GAP [ $ ]
0.43
INEQUALITY / GINI INDEX
1,444
TOTAL POPULATION
770
MALE POPULATION
674
FEMALE POPULATION
114.24
MALES / 100 FEMALES
87.53
FEMALES / 100 MALES
34.5
MEDIAN AGE
3.2
AVG FAMILY SIZE
2.9
AVG HOUSEHOLD SIZE
704
LABOR FORCE [ PEOPLE ]
60.9%
PERCENT IN LABOR FORCE
10.4%
UNEMPLOYMENT RATE
Income in Bushyhead
Income Overview in Bushyhead
Per Capita Income in Bushyhead is $25,677, while median incomes of families and households are $49,643 and $48,816 respectively.
| Characteristic | Number | Measure |
| Per Capita Income | 1,444 | $25,677 |
| Median Family Income | 384 | $49,643 |
| Mean Family Income | 384 | $79,518 |
| Median Household Income | 492 | $48,816 |
| Mean Household Income | 492 | $71,697 |
| Income Deficit | 384 | $0 |
| Wage / Income Gap (%) | 1,444 | 34.30% |
| Wage / Income Gap ($) | 1,444 | 65.70¢ per $1 |
| Gini / Inequality Index | 1,444 | 0.43 |
Earnings by Sex in Bushyhead
Average Earnings in Bushyhead are $22,955, $32,792 for men and $21,545 for women, a difference of 34.3%.
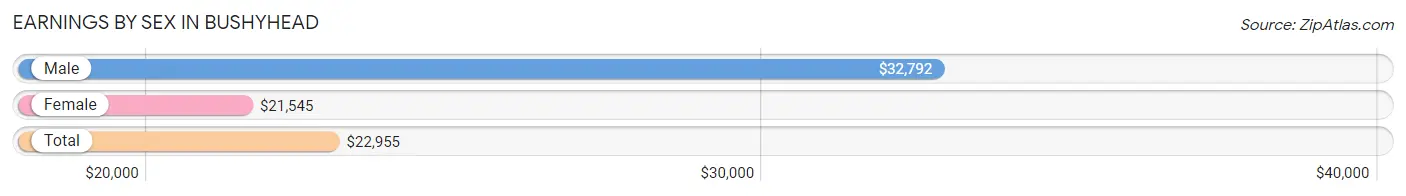
| Sex | Number | Average Earnings |
| Male | 401 (54.8%) | $32,792 |
| Female | 331 (45.2%) | $21,545 |
| Total | 732 (100.0%) | $22,955 |
Earnings by Sex by Income Bracket in Bushyhead
The most common earnings brackets in Bushyhead are $15,000 to $17,499 for men (54 | 13.5%) and $20,000 to $22,499 for women (72 | 21.7%).
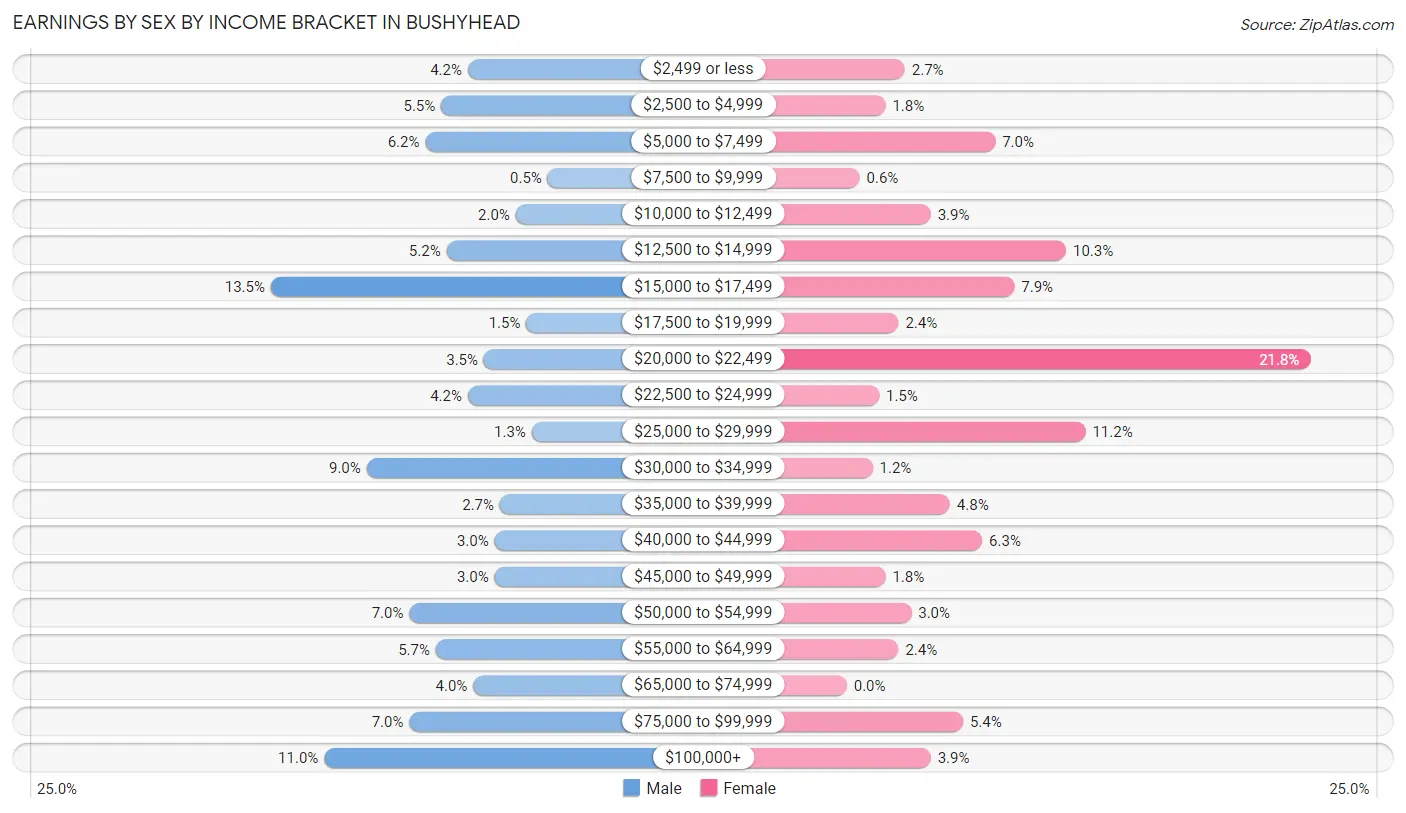
| Income | Male | Female |
| $2,499 or less | 17 (4.2%) | 9 (2.7%) |
| $2,500 to $4,999 | 22 (5.5%) | 6 (1.8%) |
| $5,000 to $7,499 | 25 (6.2%) | 23 (7.0%) |
| $7,500 to $9,999 | 2 (0.5%) | 2 (0.6%) |
| $10,000 to $12,499 | 8 (2.0%) | 13 (3.9%) |
| $12,500 to $14,999 | 21 (5.2%) | 34 (10.3%) |
| $15,000 to $17,499 | 54 (13.5%) | 26 (7.9%) |
| $17,500 to $19,999 | 6 (1.5%) | 8 (2.4%) |
| $20,000 to $22,499 | 14 (3.5%) | 72 (21.7%) |
| $22,500 to $24,999 | 17 (4.2%) | 5 (1.5%) |
| $25,000 to $29,999 | 5 (1.3%) | 37 (11.2%) |
| $30,000 to $34,999 | 36 (9.0%) | 4 (1.2%) |
| $35,000 to $39,999 | 11 (2.7%) | 16 (4.8%) |
| $40,000 to $44,999 | 12 (3.0%) | 21 (6.3%) |
| $45,000 to $49,999 | 12 (3.0%) | 6 (1.8%) |
| $50,000 to $54,999 | 28 (7.0%) | 10 (3.0%) |
| $55,000 to $64,999 | 23 (5.7%) | 8 (2.4%) |
| $65,000 to $74,999 | 16 (4.0%) | 0 (0.0%) |
| $75,000 to $99,999 | 28 (7.0%) | 18 (5.4%) |
| $100,000+ | 44 (11.0%) | 13 (3.9%) |
| Total | 401 (100.0%) | 331 (100.0%) |
Earnings by Sex by Educational Attainment in Bushyhead
Average earnings in Bushyhead are $34,500 for men and $22,222 for women, a difference of 35.6%. Men with an educational attainment of high school diploma enjoy the highest average annual earnings of $38,636, while those with less than high school education earn the least with $2,499. Women with an educational attainment of college or associate's degree earn the most with the average annual earnings of $29,286, while those with high school diploma education have the smallest earnings of $21,346.
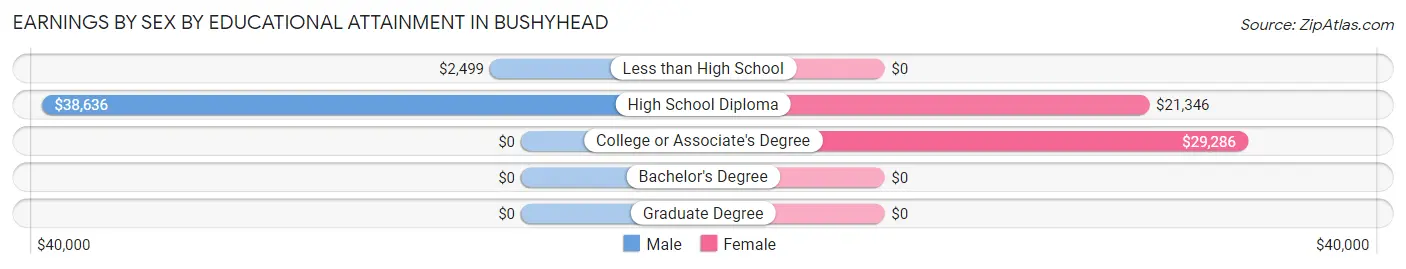
| Educational Attainment | Male Income | Female Income |
| Less than High School | $2,499 | $0 |
| High School Diploma | $38,636 | $21,346 |
| College or Associate's Degree | - | - |
| Bachelor's Degree | - | - |
| Graduate Degree | - | - |
| Total | $34,500 | $22,222 |
Family Income in Bushyhead
Family Income Brackets in Bushyhead
According to the Bushyhead family income data, there are 135 families falling into the $35,000 to $49,999 income range, which is the most common income bracket and makes up 35.2% of all families.
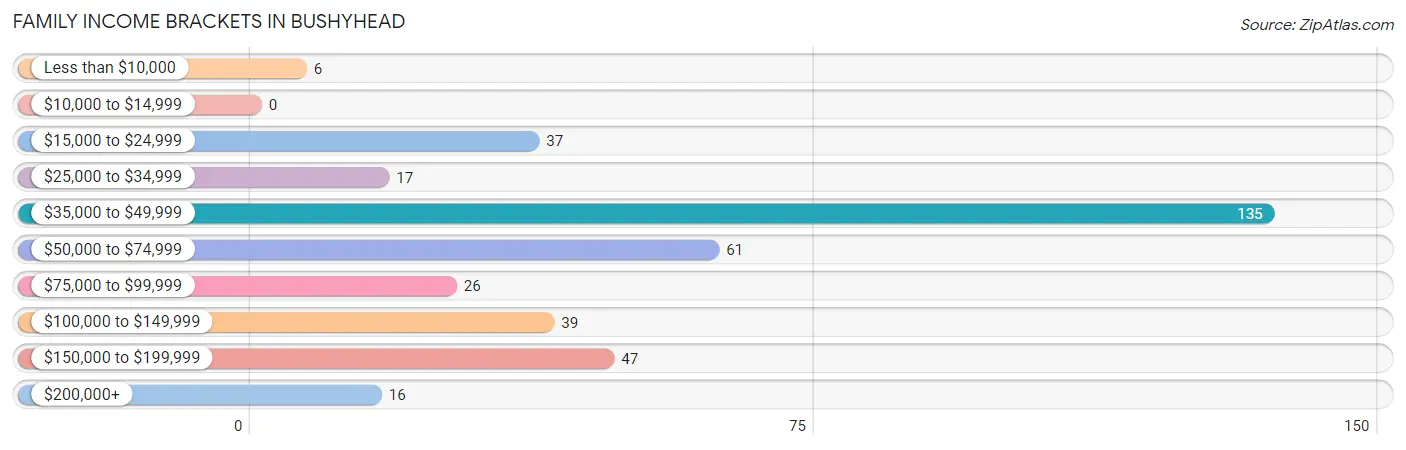
| Income Bracket | # Families | % Families |
| Less than $10,000 | 6 | 1.6% |
| $10,000 to $14,999 | 0 | 0.0% |
| $15,000 to $24,999 | 37 | 9.6% |
| $25,000 to $34,999 | 17 | 4.4% |
| $35,000 to $49,999 | 135 | 35.2% |
| $50,000 to $74,999 | 61 | 15.9% |
| $75,000 to $99,999 | 26 | 6.8% |
| $100,000 to $149,999 | 39 | 10.2% |
| $150,000 to $199,999 | 47 | 12.2% |
| $200,000+ | 16 | 4.2% |
Family Income by Famaliy Size in Bushyhead
3-person families (97 | 25.3%) account for the highest median family income in Bushyhead with $66,750 per family, while 2-person families (128 | 33.3%) have the highest median income of $31,562 per family member.
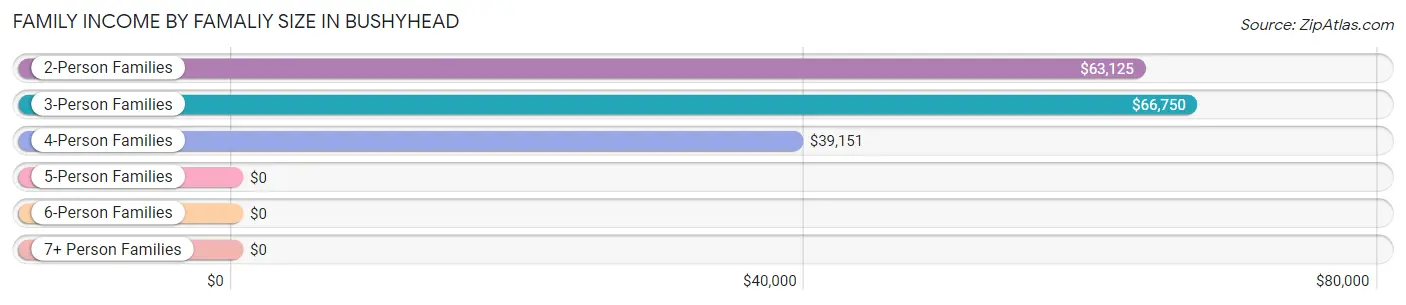
| Income Bracket | # Families | Median Income |
| 2-Person Families | 128 (33.3%) | $63,125 |
| 3-Person Families | 97 (25.3%) | $66,750 |
| 4-Person Families | 116 (30.2%) | $39,151 |
| 5-Person Families | 31 (8.1%) | $0 |
| 6-Person Families | 0 (0.0%) | $0 |
| 7+ Person Families | 12 (3.1%) | $0 |
| Total | 384 (100.0%) | $49,643 |
Family Income by Number of Earners in Bushyhead
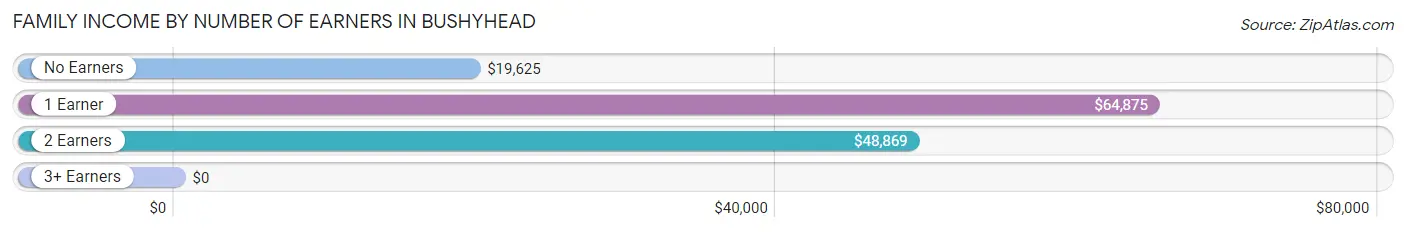
| Number of Earners | # Families | Median Income |
| No Earners | 31 (8.1%) | $19,625 |
| 1 Earner | 153 (39.8%) | $64,875 |
| 2 Earners | 187 (48.7%) | $48,869 |
| 3+ Earners | 13 (3.4%) | $0 |
| Total | 384 (100.0%) | $49,643 |
Household Income in Bushyhead
Household Income Brackets in Bushyhead
With 140 households falling in the category, the $35,000 to $49,999 income range is the most frequent in Bushyhead, accounting for 28.5% of all households. In contrast, only 6 households (1.2%) fall into the less than $10,000 income bracket, making it the least populous group.
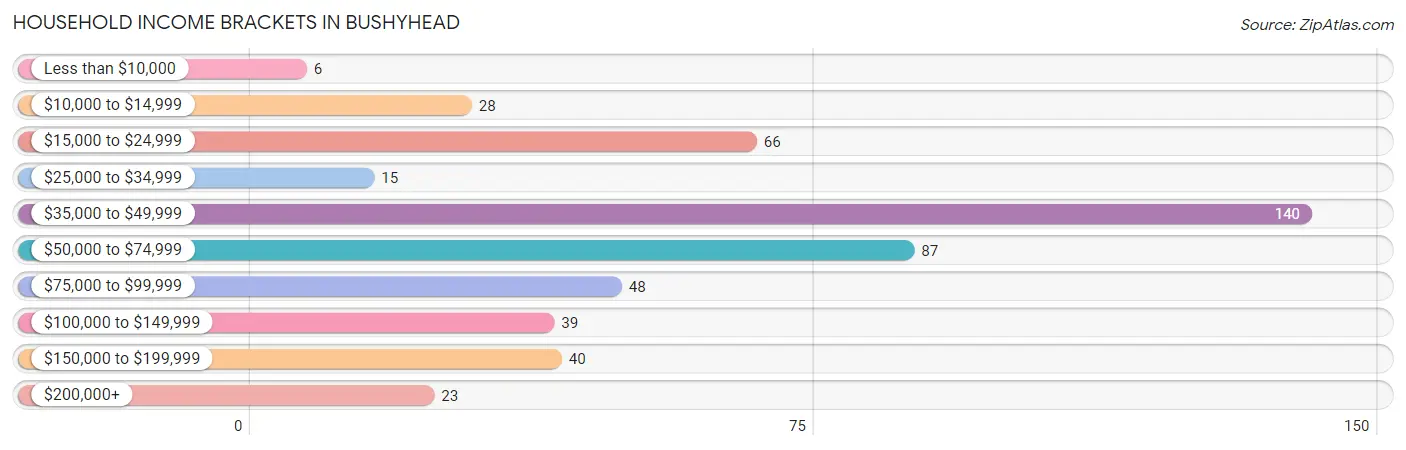
| Income Bracket | # Households | % Households |
| Less than $10,000 | 6 | 1.2% |
| $10,000 to $14,999 | 28 | 5.7% |
| $15,000 to $24,999 | 66 | 13.4% |
| $25,000 to $34,999 | 15 | 3.0% |
| $35,000 to $49,999 | 140 | 28.5% |
| $50,000 to $74,999 | 87 | 17.7% |
| $75,000 to $99,999 | 48 | 9.8% |
| $100,000 to $149,999 | 39 | 7.9% |
| $150,000 to $199,999 | 40 | 8.1% |
| $200,000+ | 23 | 4.7% |
Household Income by Householder Age in Bushyhead
The median household income in Bushyhead is $48,816, with the highest median household income of $65,139 found in the 45 to 64 years age bracket for the primary householder. A total of 227 households (46.1%) fall into this category. Meanwhile, the 15 to 24 years age bracket for the primary householder has the lowest median household income of $0, with 15 households (3.0%) in this group.
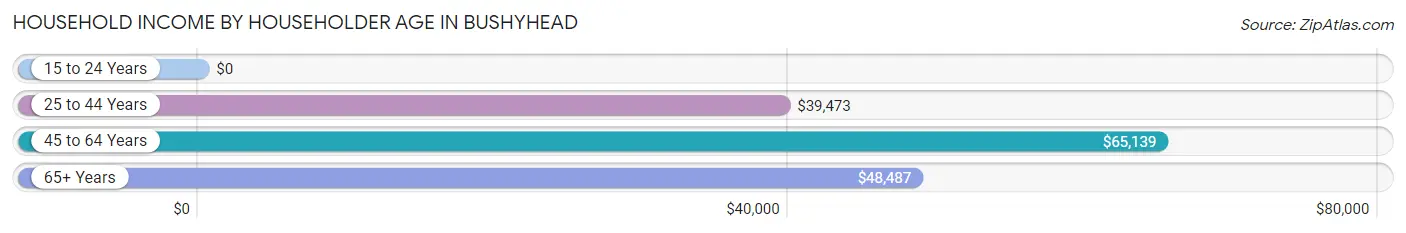
| Income Bracket | # Households | Median Income |
| 15 to 24 Years | 15 (3.0%) | $0 |
| 25 to 44 Years | 153 (31.1%) | $39,473 |
| 45 to 64 Years | 227 (46.1%) | $65,139 |
| 65+ Years | 97 (19.7%) | $48,487 |
| Total | 492 (100.0%) | $48,816 |
Poverty in Bushyhead
Income Below Poverty by Sex and Age in Bushyhead
With 15.4% poverty level for males and 11.1% for females among the residents of Bushyhead, 15 year old males and 16 and 17 year old females are the most vulnerable to poverty, with 10 males (100.0%) and 6 females (100.0%) in their respective age groups living below the poverty level.
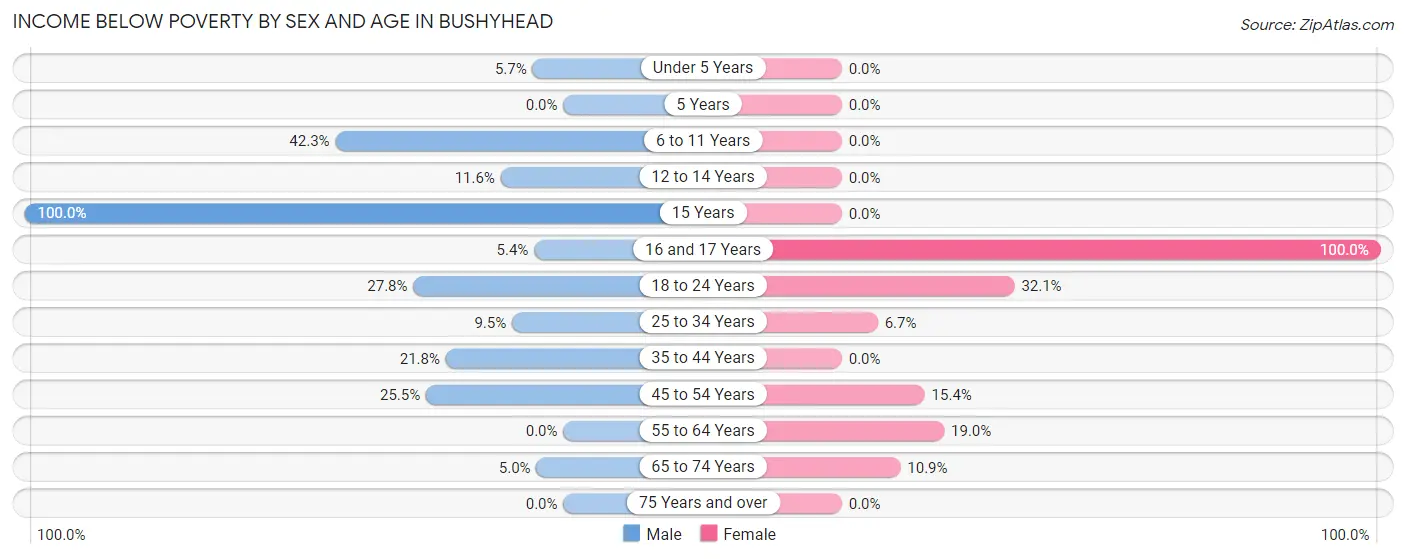
| Age Bracket | Male | Female |
| Under 5 Years | 2 (5.7%) | 0 (0.0%) |
| 5 Years | 0 (0.0%) | 0 (0.0%) |
| 6 to 11 Years | 11 (42.3%) | 0 (0.0%) |
| 12 to 14 Years | 5 (11.6%) | 0 (0.0%) |
| 15 Years | 10 (100.0%) | 0 (0.0%) |
| 16 and 17 Years | 2 (5.4%) | 6 (100.0%) |
| 18 to 24 Years | 27 (27.8%) | 25 (32.1%) |
| 25 to 34 Years | 8 (9.5%) | 9 (6.7%) |
| 35 to 44 Years | 24 (21.8%) | 0 (0.0%) |
| 45 to 54 Years | 26 (25.5%) | 14 (15.4%) |
| 55 to 64 Years | 0 (0.0%) | 15 (19.0%) |
| 65 to 74 Years | 3 (5.0%) | 5 (10.9%) |
| 75 Years and over | 0 (0.0%) | 0 (0.0%) |
| Total | 118 (15.4%) | 74 (11.1%) |
Income Above Poverty by Sex and Age in Bushyhead
According to the poverty statistics in Bushyhead, males aged 5 years and females aged under 5 years are the age groups that are most secure financially, with 100.0% of males and 100.0% of females in these age groups living above the poverty line.
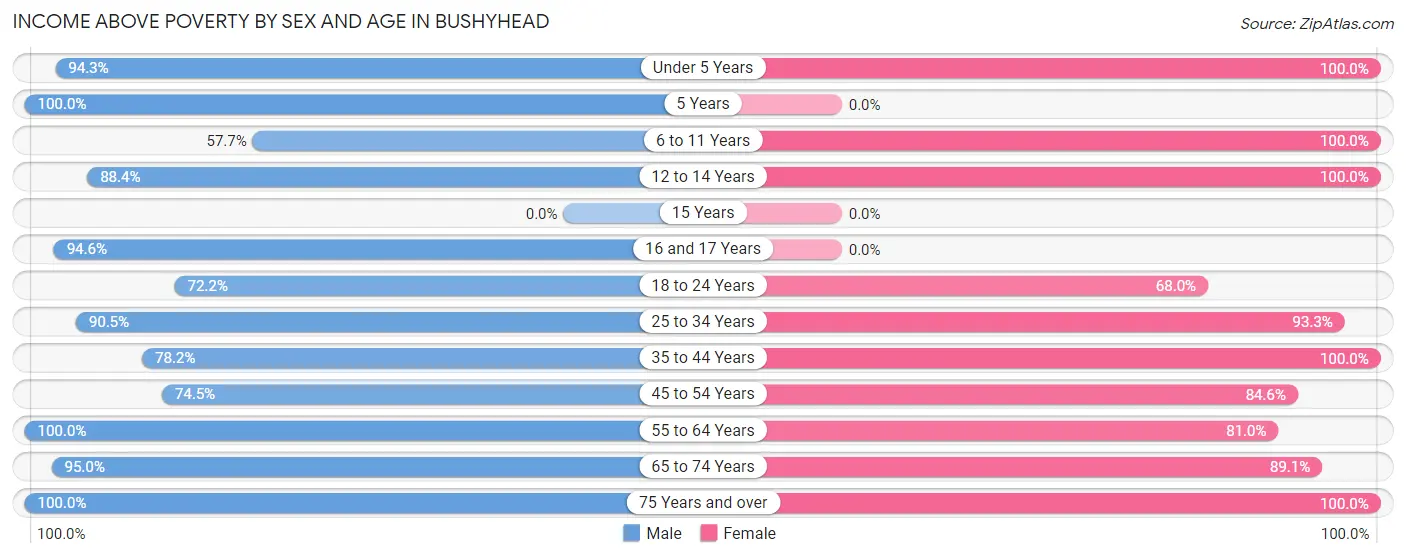
| Age Bracket | Male | Female |
| Under 5 Years | 33 (94.3%) | 42 (100.0%) |
| 5 Years | 34 (100.0%) | 0 (0.0%) |
| 6 to 11 Years | 15 (57.7%) | 80 (100.0%) |
| 12 to 14 Years | 38 (88.4%) | 11 (100.0%) |
| 15 Years | 0 (0.0%) | 0 (0.0%) |
| 16 and 17 Years | 35 (94.6%) | 0 (0.0%) |
| 18 to 24 Years | 70 (72.2%) | 53 (67.9%) |
| 25 to 34 Years | 76 (90.5%) | 126 (93.3%) |
| 35 to 44 Years | 86 (78.2%) | 82 (100.0%) |
| 45 to 54 Years | 76 (74.5%) | 77 (84.6%) |
| 55 to 64 Years | 108 (100.0%) | 64 (81.0%) |
| 65 to 74 Years | 57 (95.0%) | 41 (89.1%) |
| 75 Years and over | 19 (100.0%) | 15 (100.0%) |
| Total | 647 (84.6%) | 591 (88.9%) |
Income Below Poverty Among Married-Couple Families in Bushyhead
The poverty statistics for married-couple families in Bushyhead show that 7.0% or 21 of the total 298 families live below the poverty line. Families with 3 or 4 children have the highest poverty rate of 15.4%, comprising of 2 families. On the other hand, families with no children have the lowest poverty rate of 0.0%, which includes 0 families.
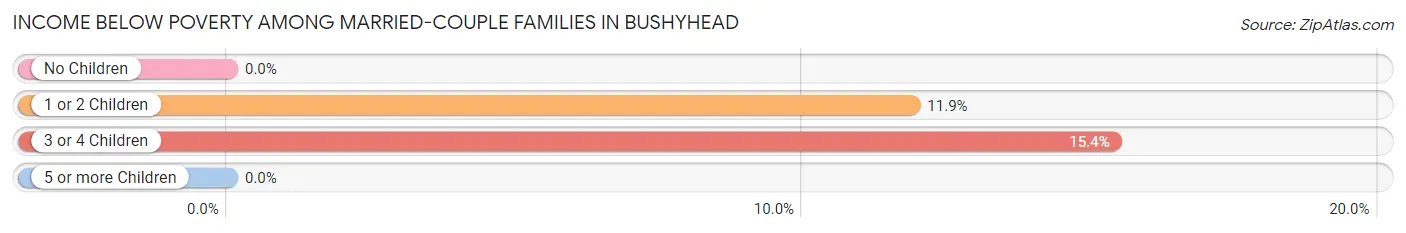
| Children | Above Poverty | Below Poverty |
| No Children | 125 (100.0%) | 0 (0.0%) |
| 1 or 2 Children | 141 (88.1%) | 19 (11.9%) |
| 3 or 4 Children | 11 (84.6%) | 2 (15.4%) |
| 5 or more Children | 0 (0.0%) | 0 (0.0%) |
| Total | 277 (92.9%) | 21 (7.0%) |
Income Below Poverty Among Single-Parent Households in Bushyhead
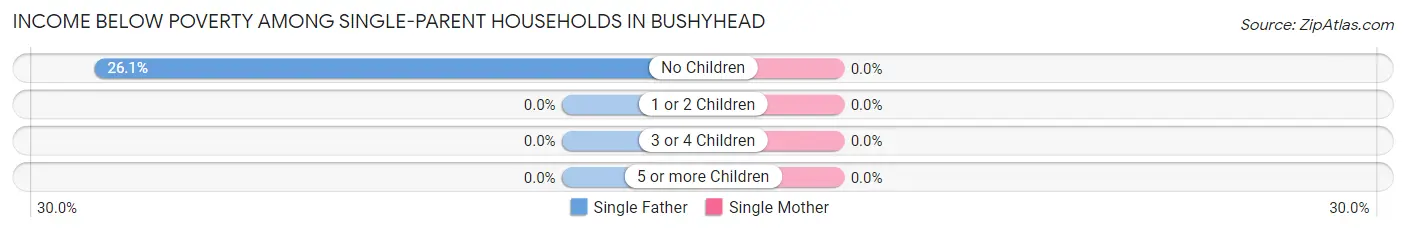
| Children | Single Father | Single Mother |
| No Children | 6 (26.1%) | 0 (0.0%) |
| 1 or 2 Children | 0 (0.0%) | 0 (0.0%) |
| 3 or 4 Children | 0 (0.0%) | 0 (0.0%) |
| 5 or more Children | 0 (0.0%) | 0 (0.0%) |
| Total | 6 (8.7%) | 0 (0.0%) |
Income Below Poverty Among Married-Couple vs Single-Parent Households in Bushyhead
The poverty data for Bushyhead shows that 21 of the married-couple family households (7.0%) and 6 of the single-parent households (7.0%) are living below the poverty level. Within the married-couple family households, those with 3 or 4 children have the highest poverty rate, with 2 households (15.4%) falling below the poverty line. Among the single-parent households, those with no children have the highest poverty rate, with 6 household (18.2%) living below poverty.
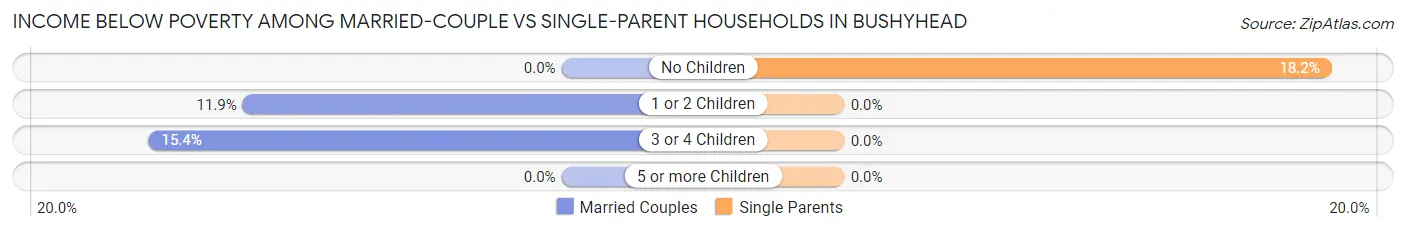
| Children | Married-Couple Families | Single-Parent Households |
| No Children | 0 (0.0%) | 6 (18.2%) |
| 1 or 2 Children | 19 (11.9%) | 0 (0.0%) |
| 3 or 4 Children | 2 (15.4%) | 0 (0.0%) |
| 5 or more Children | 0 (0.0%) | 0 (0.0%) |
| Total | 21 (7.0%) | 6 (7.0%) |
Race in Bushyhead
The most populous races in Bushyhead are White / Caucasian (1,049 | 72.7%), Native / Alaskan (198 | 13.7%), and Two or more Races (155 | 10.7%).
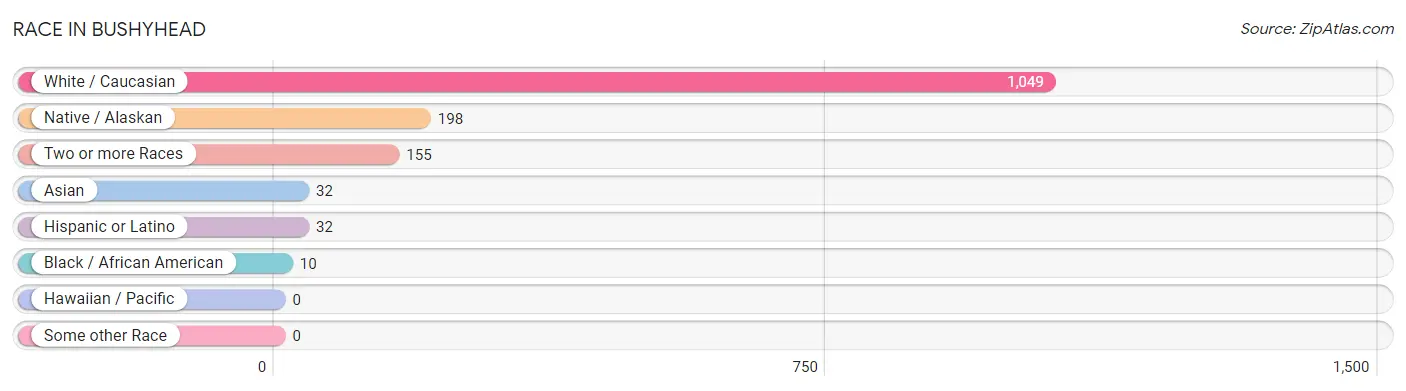
| Race | # Population | % Population |
| Asian | 32 | 2.2% |
| Black / African American | 10 | 0.7% |
| Hawaiian / Pacific | 0 | 0.0% |
| Hispanic or Latino | 32 | 2.2% |
| Native / Alaskan | 198 | 13.7% |
| White / Caucasian | 1,049 | 72.7% |
| Two or more Races | 155 | 10.7% |
| Some other Race | 0 | 0.0% |
| Total | 1,444 | 100.0% |
Ancestry in Bushyhead
The most populous ancestries reported in Bushyhead are Cherokee (259 | 17.9%), English (112 | 7.8%), Irish (105 | 7.3%), German (102 | 7.1%), and American (78 | 5.4%), together accounting for 45.4% of all Bushyhead residents.
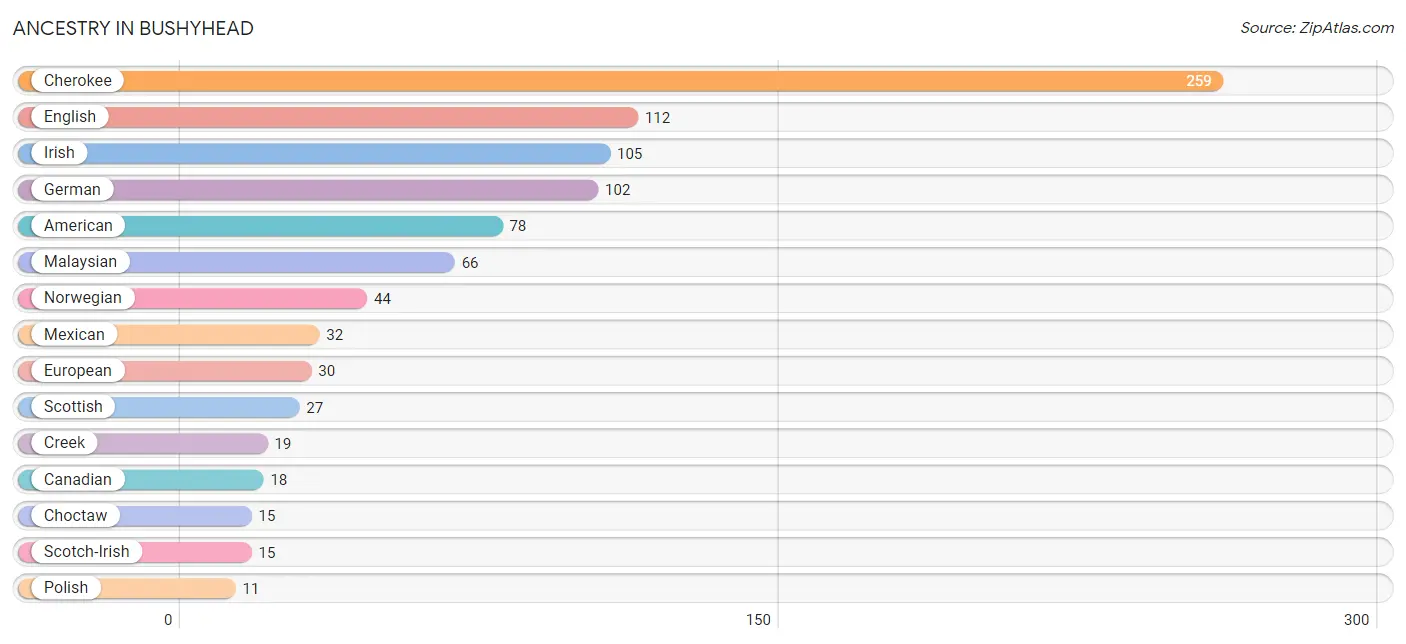
| Ancestry | # Population | % Population |
| American | 78 | 5.4% |
| Canadian | 18 | 1.3% |
| Cherokee | 259 | 17.9% |
| Choctaw | 15 | 1.0% |
| Creek | 19 | 1.3% |
| Dutch West Indian | 4 | 0.3% |
| English | 112 | 7.8% |
| European | 30 | 2.1% |
| French | 6 | 0.4% |
| German | 102 | 7.1% |
| Irish | 105 | 7.3% |
| Italian | 6 | 0.4% |
| Malaysian | 66 | 4.6% |
| Mexican | 32 | 2.2% |
| Norwegian | 44 | 3.0% |
| Polish | 11 | 0.8% |
| Scandinavian | 4 | 0.3% |
| Scotch-Irish | 15 | 1.0% |
| Scottish | 27 | 1.9% |
| Swedish | 9 | 0.6% |
| Welsh | 5 | 0.4% | View All 21 Rows |
Immigrants in Bushyhead
The most numerous immigrant groups reported in Bushyhead came from Asia (32 | 2.2%), Laos (32 | 2.2%), South Eastern Asia (32 | 2.2%), Central America (4 | 0.3%), and Latin America (4 | 0.3%), together accounting for 7.2% of all Bushyhead residents.
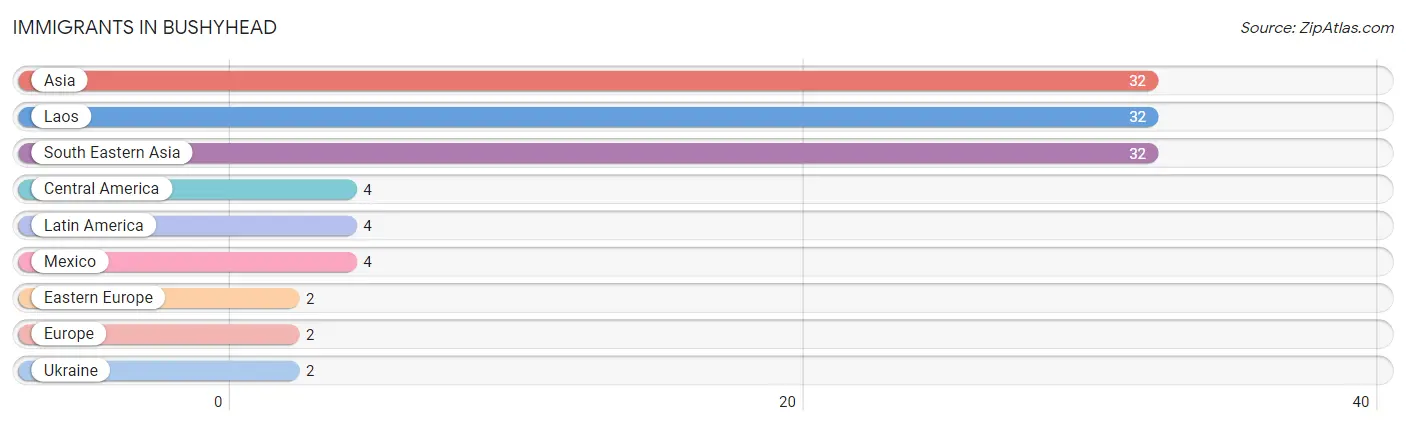
| Immigration Origin | # Population | % Population |
| Asia | 32 | 2.2% |
| Central America | 4 | 0.3% |
| Eastern Europe | 2 | 0.1% |
| Europe | 2 | 0.1% |
| Laos | 32 | 2.2% |
| Latin America | 4 | 0.3% |
| Mexico | 4 | 0.3% |
| South Eastern Asia | 32 | 2.2% |
| Ukraine | 2 | 0.1% | View All 9 Rows |
Sex and Age in Bushyhead
Sex and Age in Bushyhead
The most populous age groups in Bushyhead are 15 to 19 Years (97 | 12.6%) for men and 30 to 34 Years (97 | 14.4%) for women.
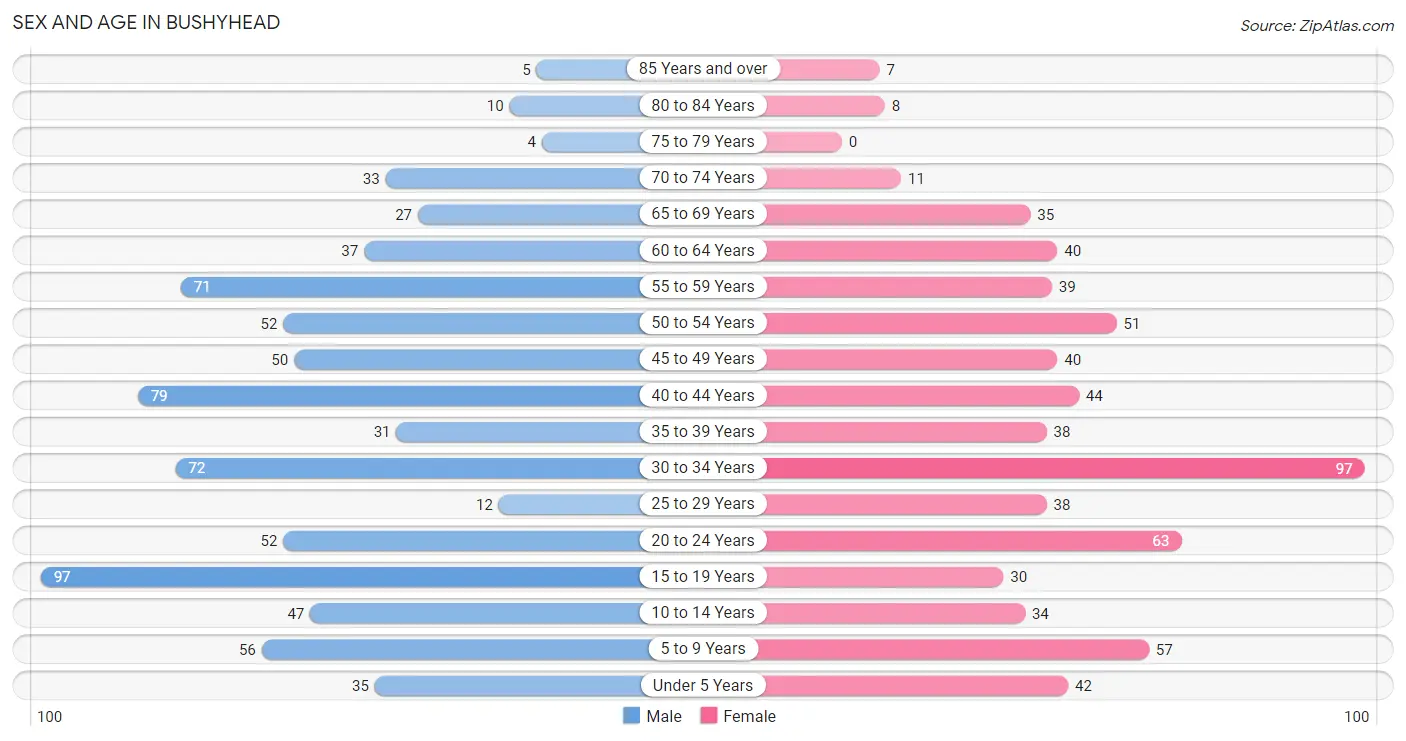
| Age Bracket | Male | Female |
| Under 5 Years | 35 (4.5%) | 42 (6.2%) |
| 5 to 9 Years | 56 (7.3%) | 57 (8.5%) |
| 10 to 14 Years | 47 (6.1%) | 34 (5.0%) |
| 15 to 19 Years | 97 (12.6%) | 30 (4.4%) |
| 20 to 24 Years | 52 (6.8%) | 63 (9.3%) |
| 25 to 29 Years | 12 (1.6%) | 38 (5.6%) |
| 30 to 34 Years | 72 (9.3%) | 97 (14.4%) |
| 35 to 39 Years | 31 (4.0%) | 38 (5.6%) |
| 40 to 44 Years | 79 (10.3%) | 44 (6.5%) |
| 45 to 49 Years | 50 (6.5%) | 40 (5.9%) |
| 50 to 54 Years | 52 (6.8%) | 51 (7.6%) |
| 55 to 59 Years | 71 (9.2%) | 39 (5.8%) |
| 60 to 64 Years | 37 (4.8%) | 40 (5.9%) |
| 65 to 69 Years | 27 (3.5%) | 35 (5.2%) |
| 70 to 74 Years | 33 (4.3%) | 11 (1.6%) |
| 75 to 79 Years | 4 (0.5%) | 0 (0.0%) |
| 80 to 84 Years | 10 (1.3%) | 8 (1.2%) |
| 85 Years and over | 5 (0.6%) | 7 (1.0%) |
| Total | 770 (100.0%) | 674 (100.0%) |
Families and Households in Bushyhead
Median Family Size in Bushyhead
The median family size in Bushyhead is 3.24 persons per family, with single male/father families (69 | 18.0%) accounting for the largest median family size of 3.35 persons per family. On the other hand, single female/mother families (17 | 4.4%) represent the smallest median family size with 2.47 persons per family.
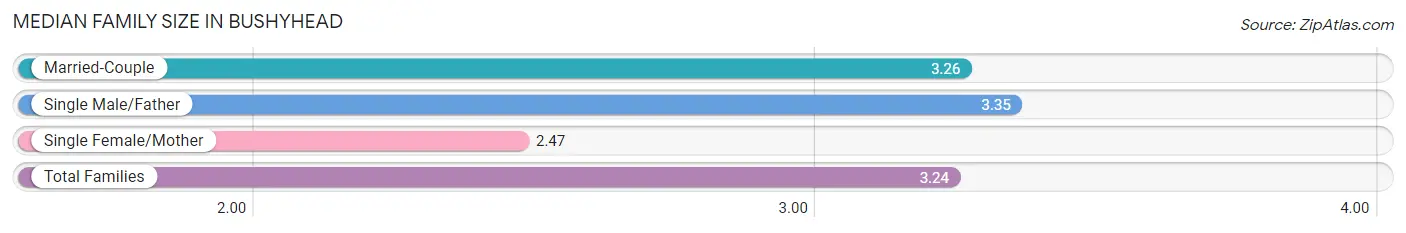
| Family Type | # Families | Family Size |
| Married-Couple | 298 (77.6%) | 3.26 |
| Single Male/Father | 69 (18.0%) | 3.35 |
| Single Female/Mother | 17 (4.4%) | 2.47 |
| Total Families | 384 (100.0%) | 3.24 |
Median Household Size in Bushyhead
The median household size in Bushyhead is 2.88 persons per household, with single male/father households (69 | 14.0%) accounting for the largest median household size of 4.14 persons per household. non-family households (108 | 22.0%) represent the smallest median household size with 1.10 persons per household.
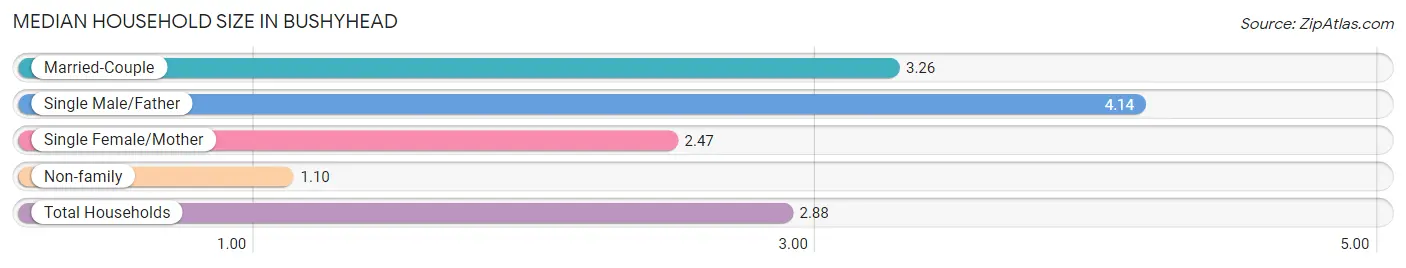
| Household Type | # Households | Household Size |
| Married-Couple | 298 (60.6%) | 3.26 |
| Single Male/Father | 69 (14.0%) | 4.14 |
| Single Female/Mother | 17 (3.5%) | 2.47 |
| Non-family | 108 (22.0%) | 1.10 |
| Total Households | 492 (100.0%) | 2.88 |
Household Size by Marriage Status in Bushyhead
Out of a total of 492 households in Bushyhead, 384 (78.0%) are family households, while 108 (22.0%) are nonfamily households. The most numerous type of family households are 2-person households, comprising 121, and the most common type of nonfamily households are 1-person households, comprising 101.
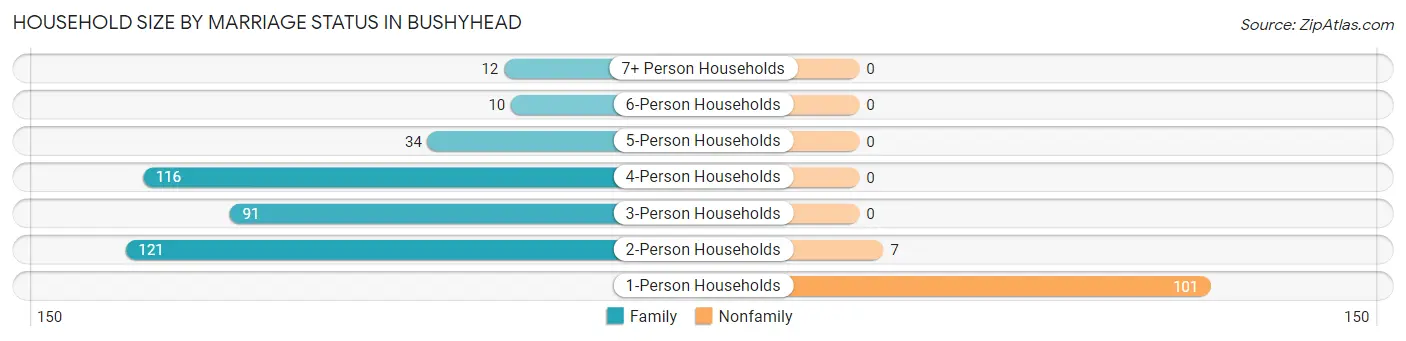
| Household Size | Family Households | Nonfamily Households |
| 1-Person Households | - | 101 (20.5%) |
| 2-Person Households | 121 (24.6%) | 7 (1.4%) |
| 3-Person Households | 91 (18.5%) | 0 (0.0%) |
| 4-Person Households | 116 (23.6%) | 0 (0.0%) |
| 5-Person Households | 34 (6.9%) | 0 (0.0%) |
| 6-Person Households | 10 (2.0%) | 0 (0.0%) |
| 7+ Person Households | 12 (2.4%) | 0 (0.0%) |
| Total | 384 (78.0%) | 108 (22.0%) |
Female Fertility in Bushyhead
Fertility by Age in Bushyhead
Average fertility rate in Bushyhead is 144.0 births per 1,000 women. Women in the age bracket of 20 to 34 years have the highest fertility rate with 258.0 births per 1,000 women. Women in the age bracket of 20 to 34 years acount for 100.0% of all women with births.
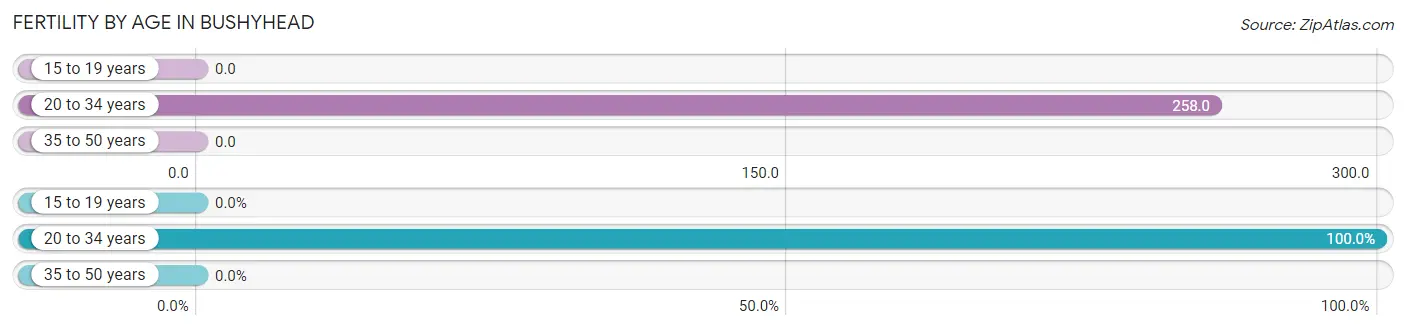
| Age Bracket | Women with Births | Births / 1,000 Women |
| 15 to 19 years | 0 (0.0%) | 0.0 |
| 20 to 34 years | 51 (100.0%) | 258.0 |
| 35 to 50 years | 0 (0.0%) | 0.0 |
| Total | 51 (100.0%) | 144.0 |
Fertility by Age by Marriage Status in Bushyhead
60.8% of women with births (51) in Bushyhead are married. The highest percentage of unmarried women with births falls into 20 to 34 years age bracket with 39.2% of them unmarried at the time of birth, while the lowest percentage of unmarried women with births belong to 20 to 34 years age bracket with 39.2% of them unmarried.
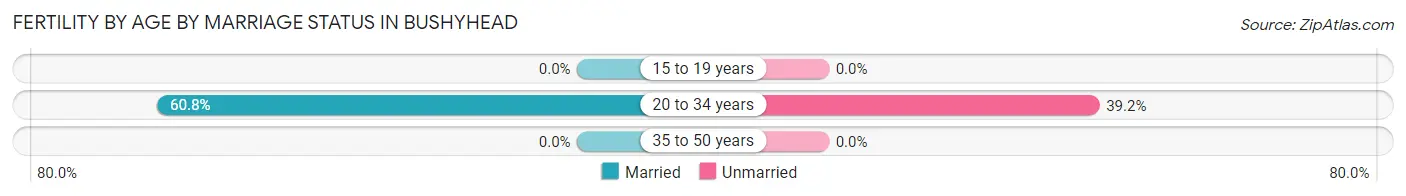
| Age Bracket | Married | Unmarried |
| 15 to 19 years | 0 (0.0%) | 0 (0.0%) |
| 20 to 34 years | 31 (60.8%) | 20 (39.2%) |
| 35 to 50 years | 0 (0.0%) | 0 (0.0%) |
| Total | 31 (60.8%) | 20 (39.2%) |
Fertility by Education in Bushyhead
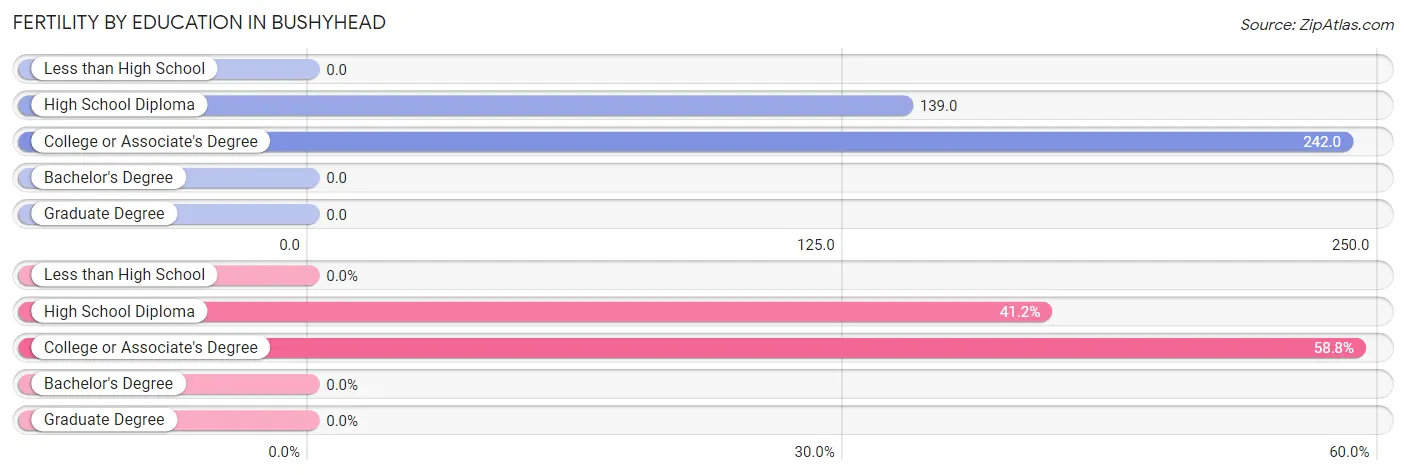
| Educational Attainment | Women with Births | Births / 1,000 Women |
| Less than High School | 0 (0.0%) | 0.0 |
| High School Diploma | 21 (41.2%) | 139.0 |
| College or Associate's Degree | 30 (58.8%) | 242.0 |
| Bachelor's Degree | 0 (0.0%) | 0.0 |
| Graduate Degree | 0 (0.0%) | 0.0 |
| Total | 51 (100.0%) | 144.0 |
Fertility by Education by Marriage Status in Bushyhead
39.2% of women with births in Bushyhead are unmarried. Women with the educational attainment of high school diploma are most likely to be married with 100.0% of them married at childbirth, while women with the educational attainment of college or associate's degree are least likely to be married with 66.7% of them unmarried at childbirth.
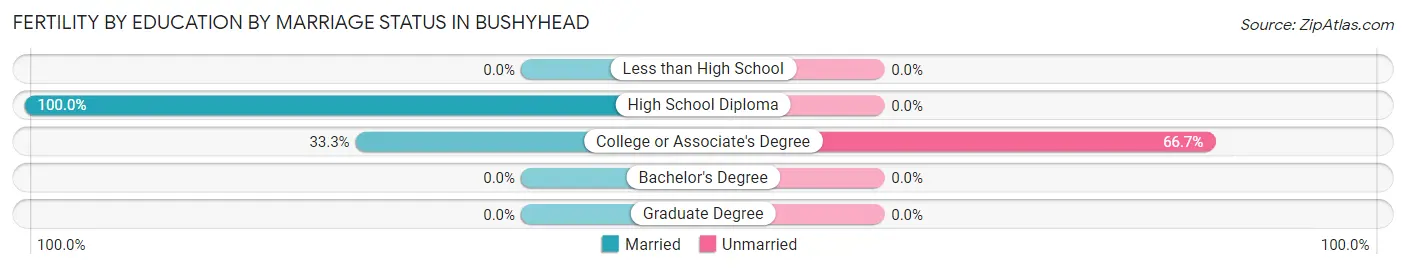
| Educational Attainment | Married | Unmarried |
| Less than High School | 0 (0.0%) | 0 (0.0%) |
| High School Diploma | 21 (100.0%) | 0 (0.0%) |
| College or Associate's Degree | 10 (33.3%) | 20 (66.7%) |
| Bachelor's Degree | 0 (0.0%) | 0 (0.0%) |
| Graduate Degree | 0 (0.0%) | 0 (0.0%) |
| Total | 31 (60.8%) | 20 (39.2%) |
Employment Characteristics in Bushyhead
Employment by Class of Employer in Bushyhead
Among the 631 employed individuals in Bushyhead, private company employees (493 | 78.1%), local government employees (39 | 6.2%), and not-for-profit organizations (36 | 5.7%) make up the most common classes of employment.
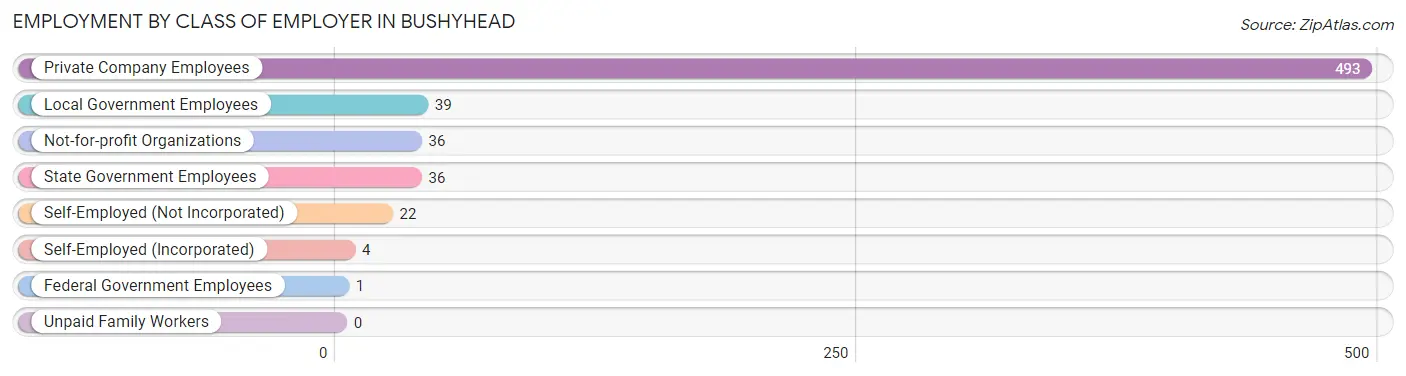
| Employer Class | # Employees | % Employees |
| Private Company Employees | 493 | 78.1% |
| Self-Employed (Incorporated) | 4 | 0.6% |
| Self-Employed (Not Incorporated) | 22 | 3.5% |
| Not-for-profit Organizations | 36 | 5.7% |
| Local Government Employees | 39 | 6.2% |
| State Government Employees | 36 | 5.7% |
| Federal Government Employees | 1 | 0.2% |
| Unpaid Family Workers | 0 | 0.0% |
| Total | 631 | 100.0% |
Employment Status by Age in Bushyhead
According to the labor force statistics for Bushyhead, out of the total population over 16 years of age (1,156), 60.9% or 704 individuals are in the labor force, with 10.4% or 73 of them unemployed. The age group with the highest labor force participation rate is 30 to 34 years, with 89.9% or 152 individuals in the labor force. Within the labor force, the 35 to 44 years age range has the highest percentage of unemployed individuals, with 31.3% or 47 of them being unemployed.
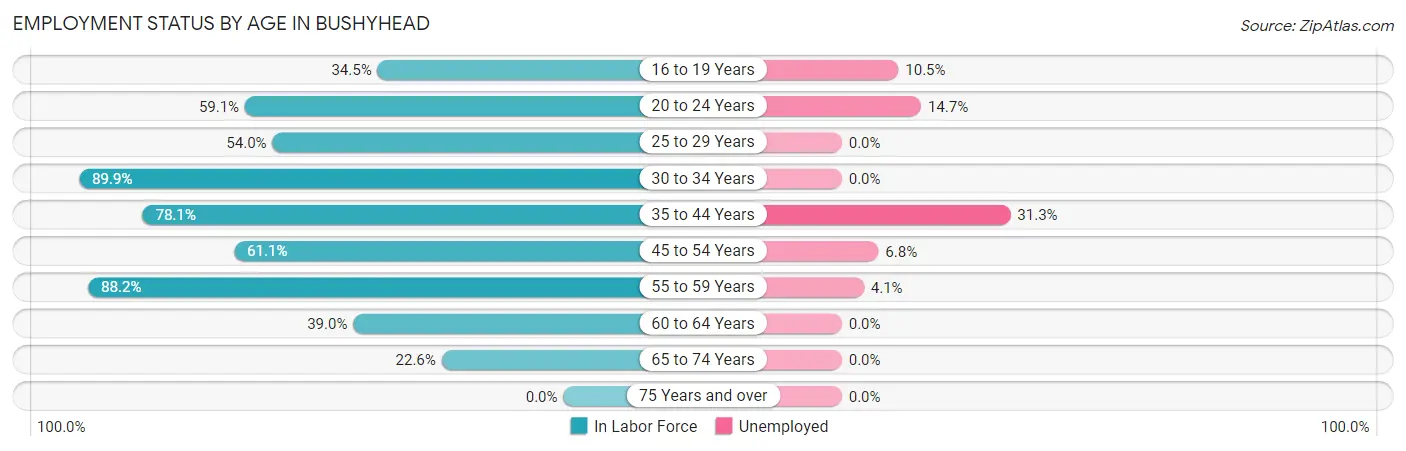
| Age Bracket | In Labor Force | Unemployed |
| 16 to 19 Years | 38 (34.5%) | 4 (10.5%) |
| 20 to 24 Years | 68 (59.1%) | 10 (14.7%) |
| 25 to 29 Years | 27 (54.0%) | 0 (0.0%) |
| 30 to 34 Years | 152 (89.9%) | 0 (0.0%) |
| 35 to 44 Years | 150 (78.1%) | 47 (31.3%) |
| 45 to 54 Years | 118 (61.1%) | 8 (6.8%) |
| 55 to 59 Years | 97 (88.2%) | 4 (4.1%) |
| 60 to 64 Years | 30 (39.0%) | 0 (0.0%) |
| 65 to 74 Years | 24 (22.6%) | 0 (0.0%) |
| 75 Years and over | 0 (0.0%) | 0 (0.0%) |
| Total | 704 (60.9%) | 73 (10.4%) |
Employment Status by Educational Attainment in Bushyhead
According to labor force statistics for Bushyhead, 72.6% of individuals (574) out of the total population between 25 and 64 years of age (791) are in the labor force, with 10.3% or 59 of them being unemployed. The group with the highest labor force participation rate are those with the educational attainment of high school diploma, with 79.8% or 347 individuals in the labor force. Within the labor force, individuals with bachelor's degree or higher education have the highest percentage of unemployment, with 22.2% or 4 of them being unemployed.
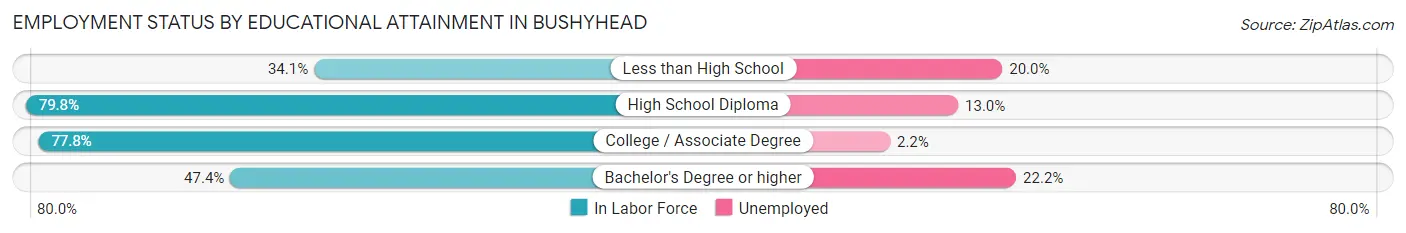
| Educational Attainment | In Labor Force | Unemployed |
| Less than High School | 30 (34.1%) | 18 (20.0%) |
| High School Diploma | 347 (79.8%) | 57 (13.0%) |
| College / Associate Degree | 179 (77.8%) | 5 (2.2%) |
| Bachelor's Degree or higher | 18 (47.4%) | 8 (22.2%) |
| Total | 574 (72.6%) | 81 (10.3%) |
Employment Occupations by Sex in Bushyhead
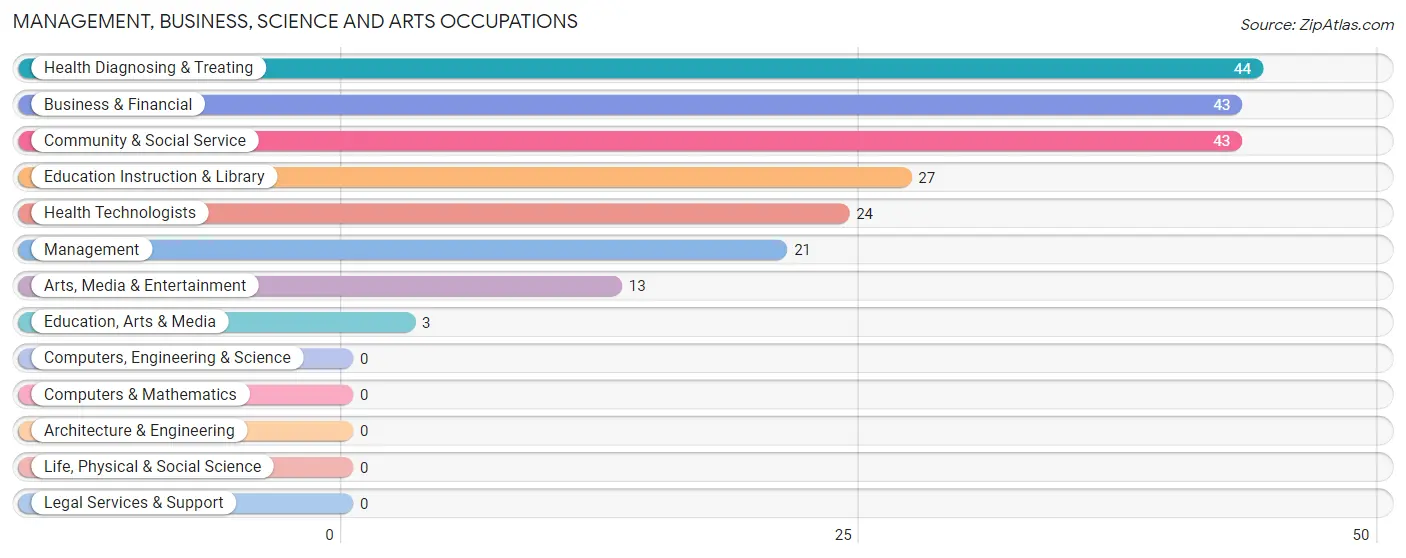
Management, Business, Science and Arts Occupations
The most common Management, Business, Science and Arts occupations in Bushyhead are Health Diagnosing & Treating (44 | 7.0%), Business & Financial (43 | 6.8%), Community & Social Service (43 | 6.8%), Education Instruction & Library (27 | 4.3%), and Health Technologists (24 | 3.8%).
Management, Business, Science and Arts Occupations by Sex
Within the Management, Business, Science and Arts occupations in Bushyhead, the most male-oriented occupations are Arts, Media & Entertainment (100.0%), Management (66.7%), and Business & Financial (65.1%), while the most female-oriented occupations are Education, Arts & Media (100.0%), Education Instruction & Library (100.0%), and Health Technologists (100.0%).
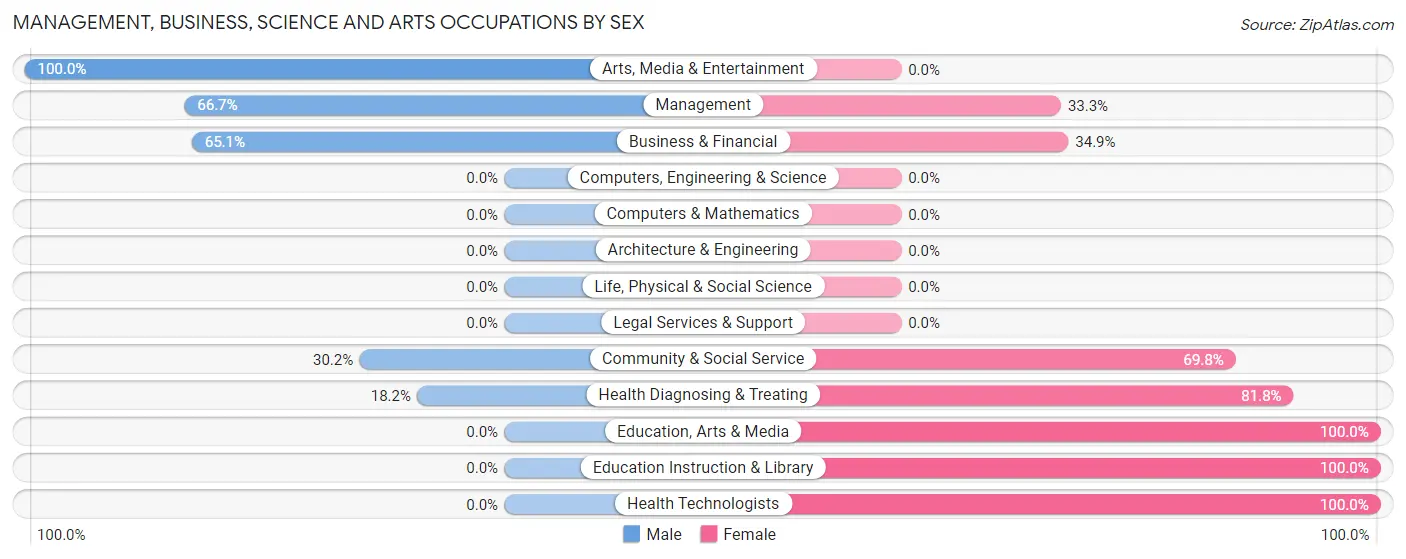
| Occupation | Male | Female |
| Management | 14 (66.7%) | 7 (33.3%) |
| Business & Financial | 28 (65.1%) | 15 (34.9%) |
| Computers, Engineering & Science | 0 (0.0%) | 0 (0.0%) |
| Computers & Mathematics | 0 (0.0%) | 0 (0.0%) |
| Architecture & Engineering | 0 (0.0%) | 0 (0.0%) |
| Life, Physical & Social Science | 0 (0.0%) | 0 (0.0%) |
| Community & Social Service | 13 (30.2%) | 30 (69.8%) |
| Education, Arts & Media | 0 (0.0%) | 3 (100.0%) |
| Legal Services & Support | 0 (0.0%) | 0 (0.0%) |
| Education Instruction & Library | 0 (0.0%) | 27 (100.0%) |
| Arts, Media & Entertainment | 13 (100.0%) | 0 (0.0%) |
| Health Diagnosing & Treating | 8 (18.2%) | 36 (81.8%) |
| Health Technologists | 0 (0.0%) | 24 (100.0%) |
| Total (Category) | 63 (41.7%) | 88 (58.3%) |
| Total (Overall) | 323 (51.2%) | 308 (48.8%) |
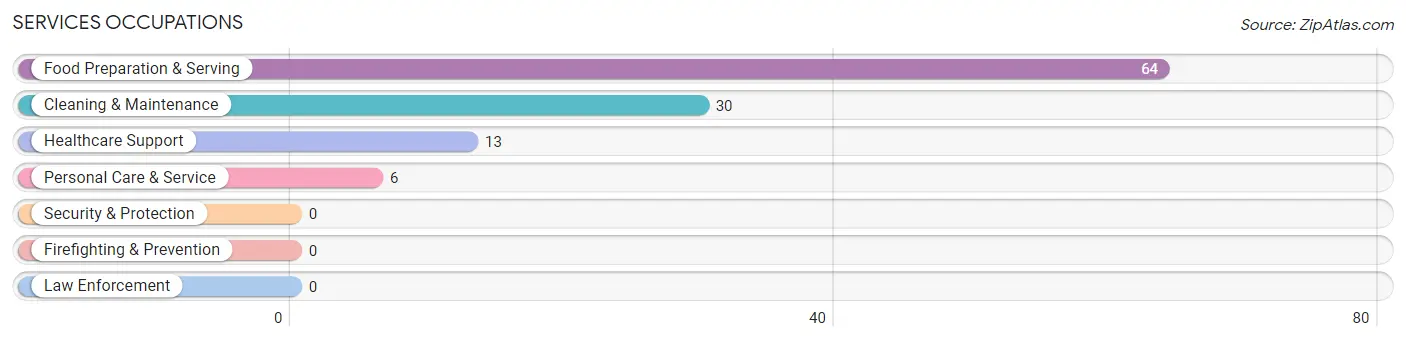
Services Occupations
The most common Services occupations in Bushyhead are Food Preparation & Serving (64 | 10.1%), Cleaning & Maintenance (30 | 4.8%), Healthcare Support (13 | 2.1%), and Personal Care & Service (6 | 0.9%).
Services Occupations by Sex
Within the Services occupations in Bushyhead, the most male-oriented occupations are Healthcare Support (61.5%), Cleaning & Maintenance (43.3%), and Food Preparation & Serving (7.8%), while the most female-oriented occupations are Personal Care & Service (100.0%), Food Preparation & Serving (92.2%), and Cleaning & Maintenance (56.7%).
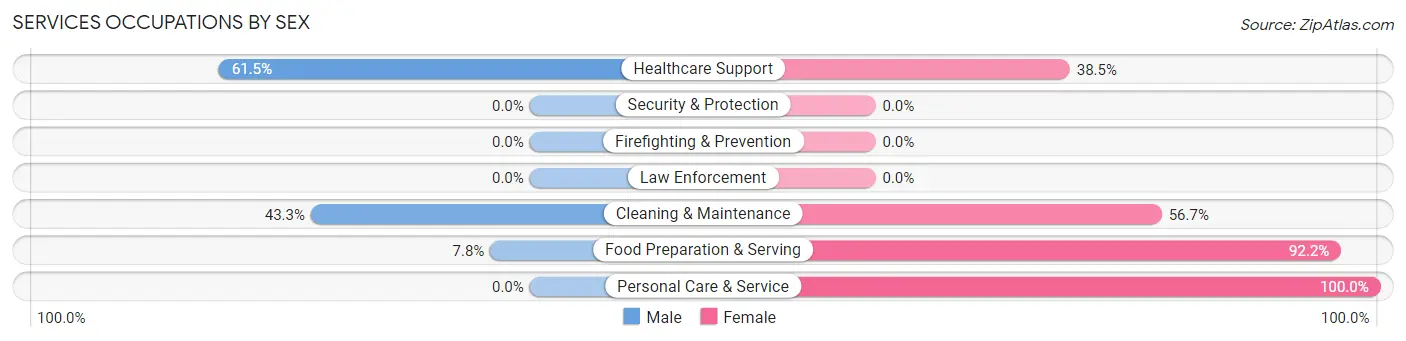
| Occupation | Male | Female |
| Healthcare Support | 8 (61.5%) | 5 (38.5%) |
| Security & Protection | 0 (0.0%) | 0 (0.0%) |
| Firefighting & Prevention | 0 (0.0%) | 0 (0.0%) |
| Law Enforcement | 0 (0.0%) | 0 (0.0%) |
| Food Preparation & Serving | 5 (7.8%) | 59 (92.2%) |
| Cleaning & Maintenance | 13 (43.3%) | 17 (56.7%) |
| Personal Care & Service | 0 (0.0%) | 6 (100.0%) |
| Total (Category) | 26 (23.0%) | 87 (77.0%) |
| Total (Overall) | 323 (51.2%) | 308 (48.8%) |
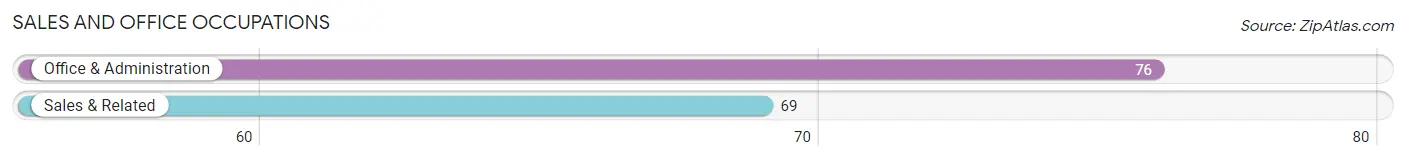
Sales and Office Occupations
The most common Sales and Office occupations in Bushyhead are Office & Administration (76 | 12.0%), and Sales & Related (69 | 10.9%).
Sales and Office Occupations by Sex
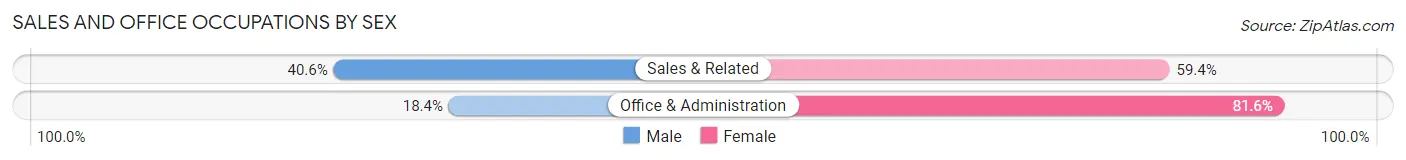
| Occupation | Male | Female |
| Sales & Related | 28 (40.6%) | 41 (59.4%) |
| Office & Administration | 14 (18.4%) | 62 (81.6%) |
| Total (Category) | 42 (29.0%) | 103 (71.0%) |
| Total (Overall) | 323 (51.2%) | 308 (48.8%) |
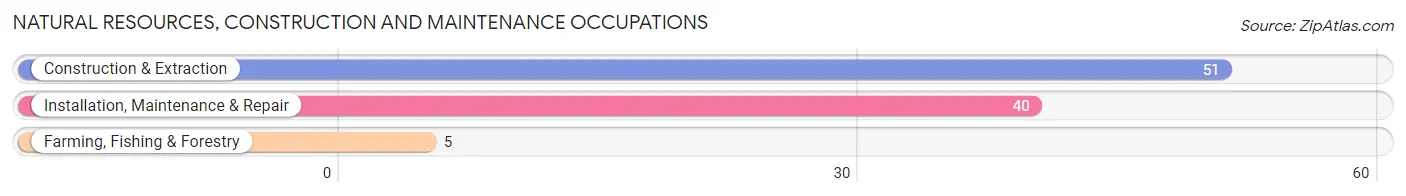
Natural Resources, Construction and Maintenance Occupations
The most common Natural Resources, Construction and Maintenance occupations in Bushyhead are Construction & Extraction (51 | 8.1%), Installation, Maintenance & Repair (40 | 6.3%), and Farming, Fishing & Forestry (5 | 0.8%).
Natural Resources, Construction and Maintenance Occupations by Sex
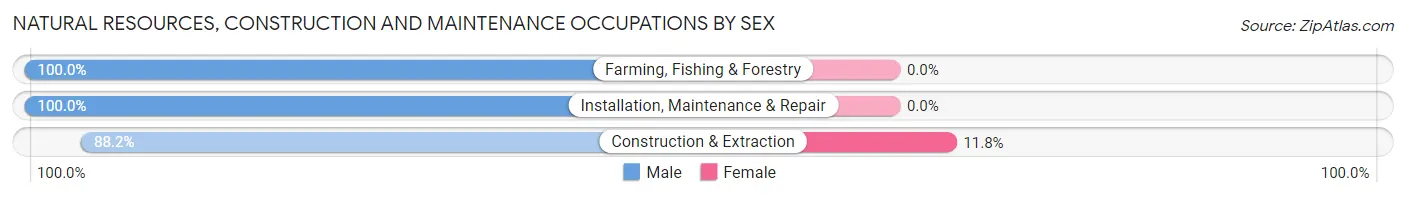
| Occupation | Male | Female |
| Farming, Fishing & Forestry | 5 (100.0%) | 0 (0.0%) |
| Construction & Extraction | 45 (88.2%) | 6 (11.8%) |
| Installation, Maintenance & Repair | 40 (100.0%) | 0 (0.0%) |
| Total (Category) | 90 (93.8%) | 6 (6.2%) |
| Total (Overall) | 323 (51.2%) | 308 (48.8%) |
Production, Transportation and Moving Occupations
The most common Production, Transportation and Moving occupations in Bushyhead are Production (48 | 7.6%), Transportation (45 | 7.1%), and Material Moving (33 | 5.2%).
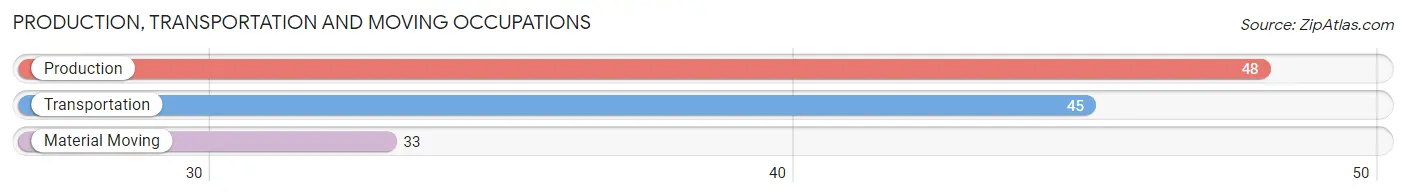
Production, Transportation and Moving Occupations by Sex
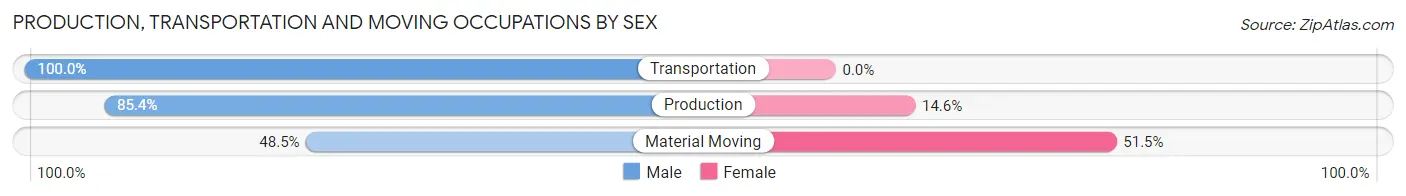
| Occupation | Male | Female |
| Production | 41 (85.4%) | 7 (14.6%) |
| Transportation | 45 (100.0%) | 0 (0.0%) |
| Material Moving | 16 (48.5%) | 17 (51.5%) |
| Total (Category) | 102 (80.9%) | 24 (19.1%) |
| Total (Overall) | 323 (51.2%) | 308 (48.8%) |
Employment Industries by Sex in Bushyhead
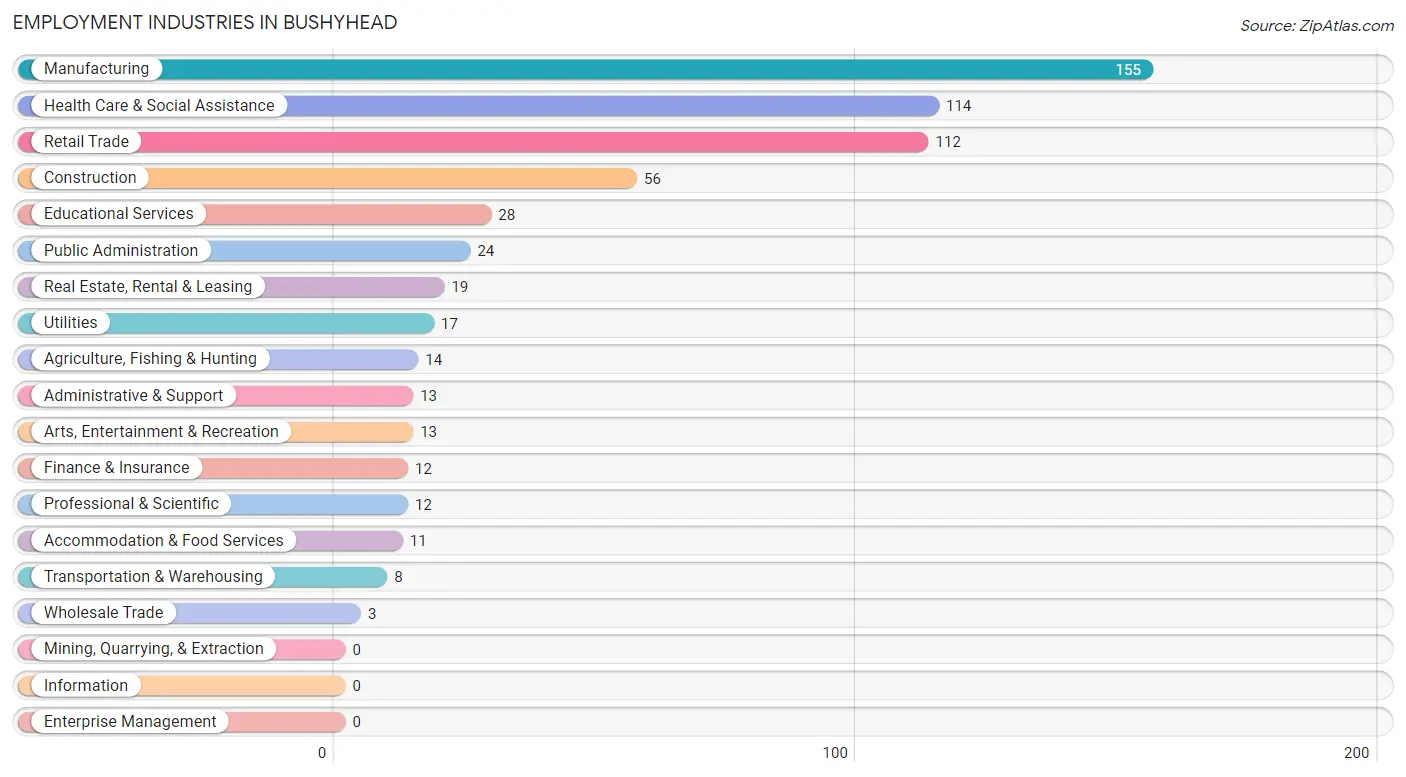
Employment Industries in Bushyhead
The major employment industries in Bushyhead include Manufacturing (155 | 24.6%), Health Care & Social Assistance (114 | 18.1%), Retail Trade (112 | 17.7%), Construction (56 | 8.9%), and Educational Services (28 | 4.4%).
Employment Industries by Sex in Bushyhead
The Bushyhead industries that see more men than women are Wholesale Trade (100.0%), Transportation & Warehousing (100.0%), and Real Estate, Rental & Leasing (100.0%), whereas the industries that tend to have a higher number of women are Finance & Insurance (100.0%), Health Care & Social Assistance (100.0%), and Educational Services (96.4%).
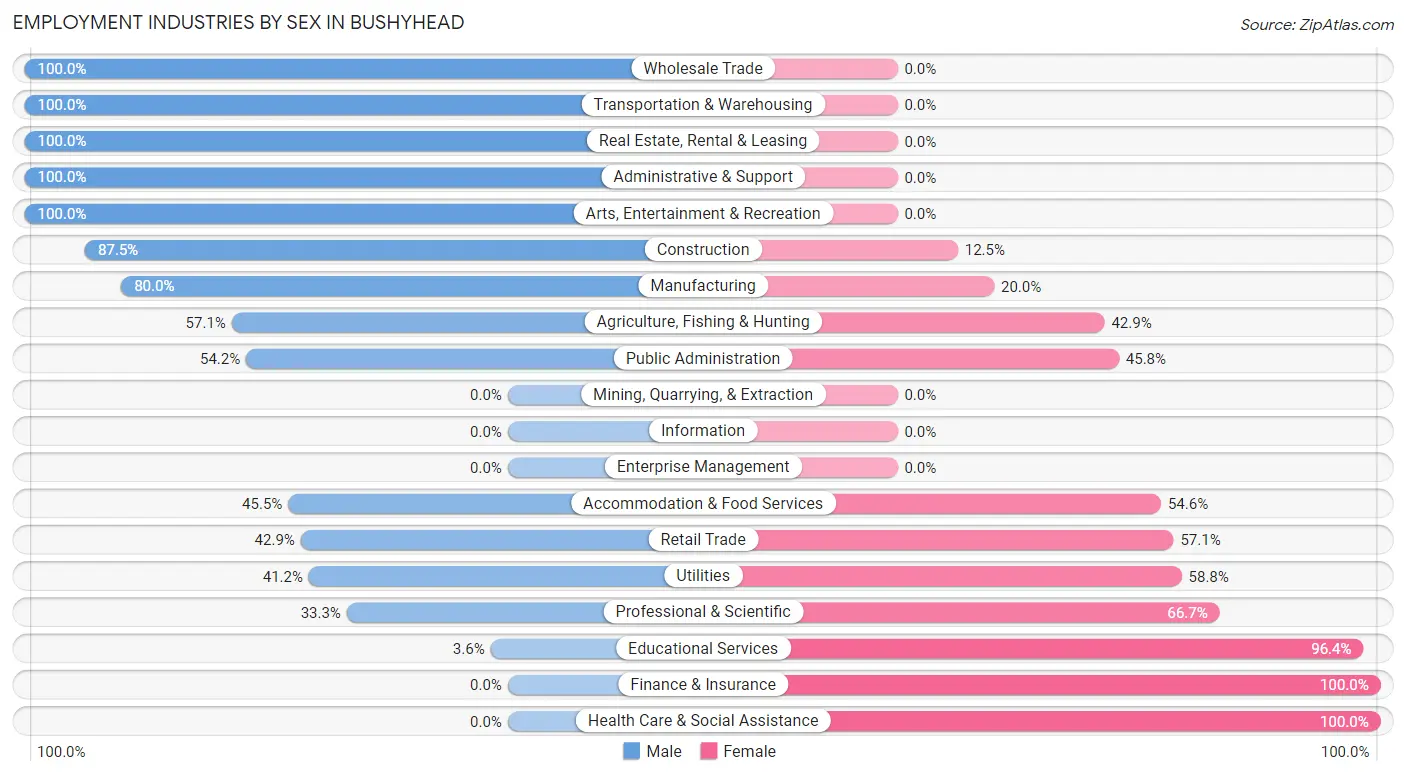
| Industry | Male | Female |
| Agriculture, Fishing & Hunting | 8 (57.1%) | 6 (42.9%) |
| Mining, Quarrying, & Extraction | 0 (0.0%) | 0 (0.0%) |
| Construction | 49 (87.5%) | 7 (12.5%) |
| Manufacturing | 124 (80.0%) | 31 (20.0%) |
| Wholesale Trade | 3 (100.0%) | 0 (0.0%) |
| Retail Trade | 48 (42.9%) | 64 (57.1%) |
| Transportation & Warehousing | 8 (100.0%) | 0 (0.0%) |
| Utilities | 7 (41.2%) | 10 (58.8%) |
| Information | 0 (0.0%) | 0 (0.0%) |
| Finance & Insurance | 0 (0.0%) | 12 (100.0%) |
| Real Estate, Rental & Leasing | 19 (100.0%) | 0 (0.0%) |
| Professional & Scientific | 4 (33.3%) | 8 (66.7%) |
| Enterprise Management | 0 (0.0%) | 0 (0.0%) |
| Administrative & Support | 13 (100.0%) | 0 (0.0%) |
| Educational Services | 1 (3.6%) | 27 (96.4%) |
| Health Care & Social Assistance | 0 (0.0%) | 114 (100.0%) |
| Arts, Entertainment & Recreation | 13 (100.0%) | 0 (0.0%) |
| Accommodation & Food Services | 5 (45.5%) | 6 (54.5%) |
| Public Administration | 13 (54.2%) | 11 (45.8%) |
| Total | 323 (51.2%) | 308 (48.8%) |
Education in Bushyhead
School Enrollment in Bushyhead
The most common levels of schooling among the 353 students in Bushyhead are high school (109 | 30.9%), elementary school (79 | 22.4%), and college / undergraduate (59 | 16.7%).
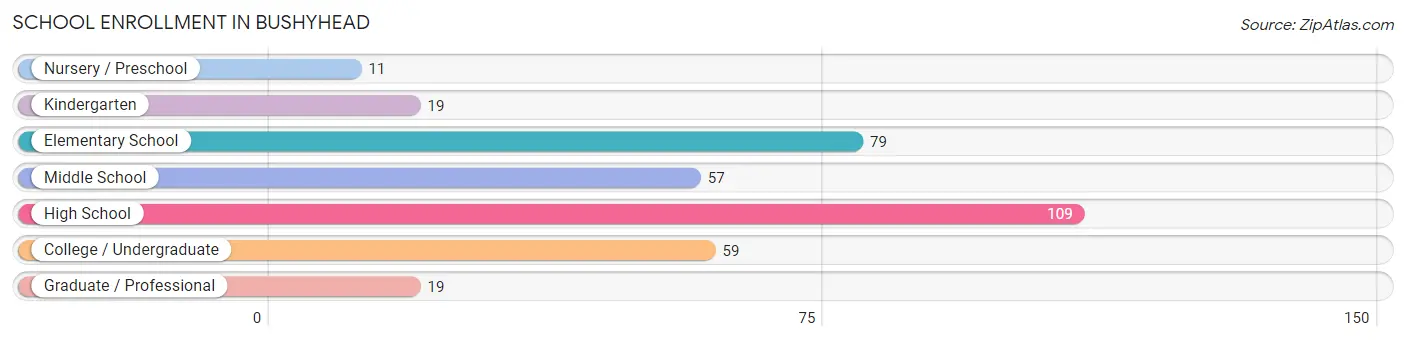
| School Level | # Students | % Students |
| Nursery / Preschool | 11 | 3.1% |
| Kindergarten | 19 | 5.4% |
| Elementary School | 79 | 22.4% |
| Middle School | 57 | 16.2% |
| High School | 109 | 30.9% |
| College / Undergraduate | 59 | 16.7% |
| Graduate / Professional | 19 | 5.4% |
| Total | 353 | 100.0% |
School Enrollment by Age by Funding Source in Bushyhead
Out of a total of 353 students who are enrolled in schools in Bushyhead, 15 (4.2%) attend a private institution, while the remaining 338 (95.8%) are enrolled in public schools. The age group of 35 years and over has the highest likelihood of being enrolled in private schools, with 13 (72.2% in the age bracket) enrolled. Conversely, the age group of 5 to 9 year old has the lowest likelihood of being enrolled in a private school, with 90 (100.0% in the age bracket) attending a public institution.
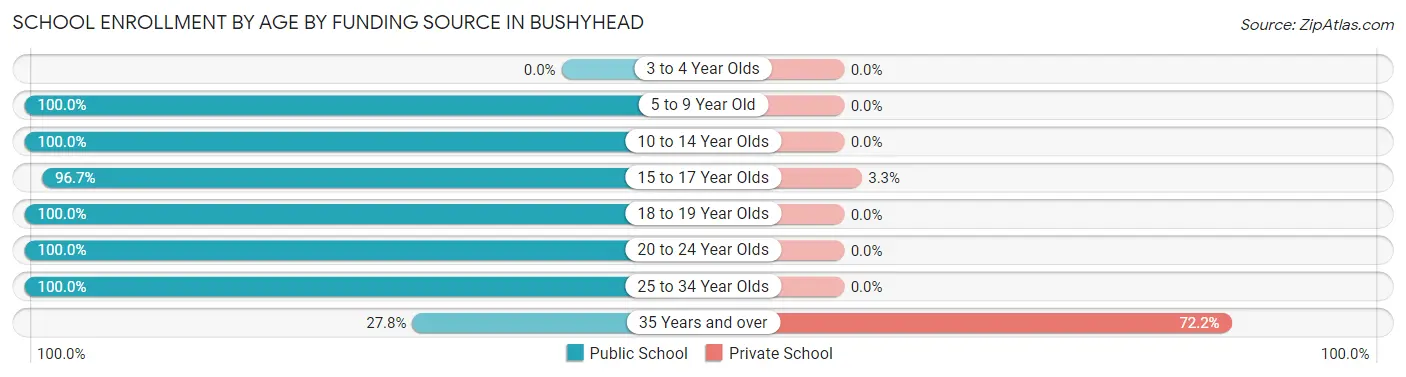
| Age Bracket | Public School | Private School |
| 3 to 4 Year Olds | 0 (0.0%) | 0 (0.0%) |
| 5 to 9 Year Old | 90 (100.0%) | 0 (0.0%) |
| 10 to 14 Year Olds | 81 (100.0%) | 0 (0.0%) |
| 15 to 17 Year Olds | 59 (96.7%) | 2 (3.3%) |
| 18 to 19 Year Olds | 34 (100.0%) | 0 (0.0%) |
| 20 to 24 Year Olds | 63 (100.0%) | 0 (0.0%) |
| 25 to 34 Year Olds | 6 (100.0%) | 0 (0.0%) |
| 35 Years and over | 5 (27.8%) | 13 (72.2%) |
| Total | 338 (95.8%) | 15 (4.2%) |
Educational Attainment by Field of Study in Bushyhead
Business (19 | 36.5%), science & technology (13 | 25.0%), social sciences (7 | 13.5%), engineering (6 | 11.5%), and education (5 | 9.6%) are the most common fields of study among 52 individuals in Bushyhead who have obtained a bachelor's degree or higher.
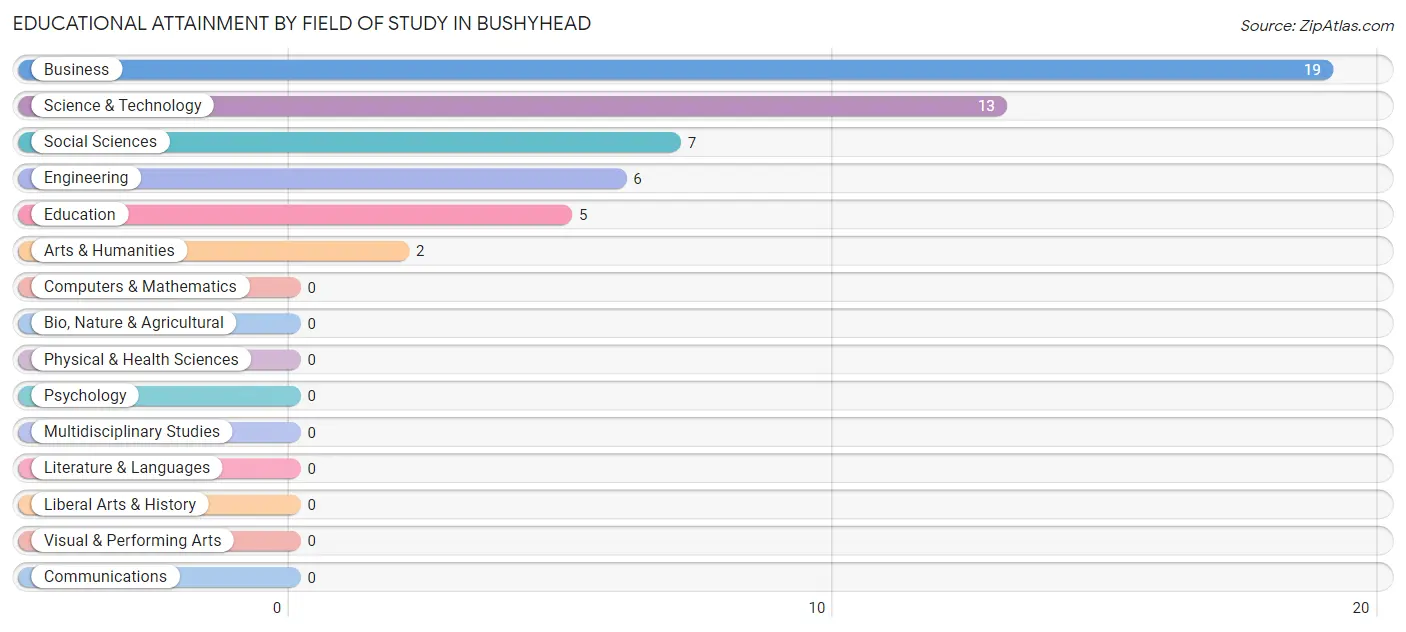
| Field of Study | # Graduates | % Graduates |
| Computers & Mathematics | 0 | 0.0% |
| Bio, Nature & Agricultural | 0 | 0.0% |
| Physical & Health Sciences | 0 | 0.0% |
| Psychology | 0 | 0.0% |
| Social Sciences | 7 | 13.5% |
| Engineering | 6 | 11.5% |
| Multidisciplinary Studies | 0 | 0.0% |
| Science & Technology | 13 | 25.0% |
| Business | 19 | 36.5% |
| Education | 5 | 9.6% |
| Literature & Languages | 0 | 0.0% |
| Liberal Arts & History | 0 | 0.0% |
| Visual & Performing Arts | 0 | 0.0% |
| Communications | 0 | 0.0% |
| Arts & Humanities | 2 | 3.8% |
| Total | 52 | 100.0% |
Transportation & Commute in Bushyhead
Vehicle Availability by Sex in Bushyhead
The most prevalent vehicle ownership categories in Bushyhead are males with 3 vehicles (118, accounting for 37.2%) and females with 3 vehicles (99, making up 38.3%).
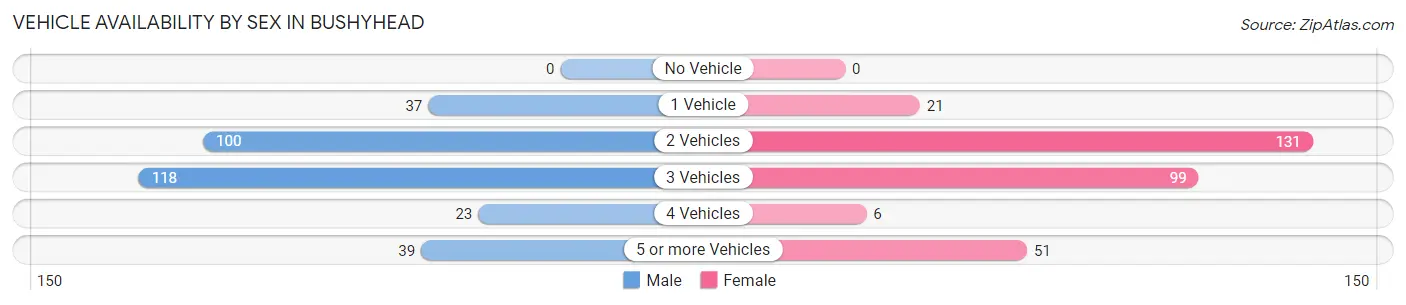
| Vehicles Available | Male | Female |
| No Vehicle | 0 (0.0%) | 0 (0.0%) |
| 1 Vehicle | 37 (11.7%) | 21 (6.8%) |
| 2 Vehicles | 100 (31.6%) | 131 (42.5%) |
| 3 Vehicles | 118 (37.2%) | 99 (32.1%) |
| 4 Vehicles | 23 (7.3%) | 6 (1.9%) |
| 5 or more Vehicles | 39 (12.3%) | 51 (16.6%) |
| Total | 317 (100.0%) | 308 (100.0%) |
Commute Time in Bushyhead
The most frequently occuring commute durations in Bushyhead are 15 to 19 minutes (105 commuters, 17.7%), 45 to 59 minutes (105 commuters, 17.7%), and 30 to 34 minutes (88 commuters, 14.8%).
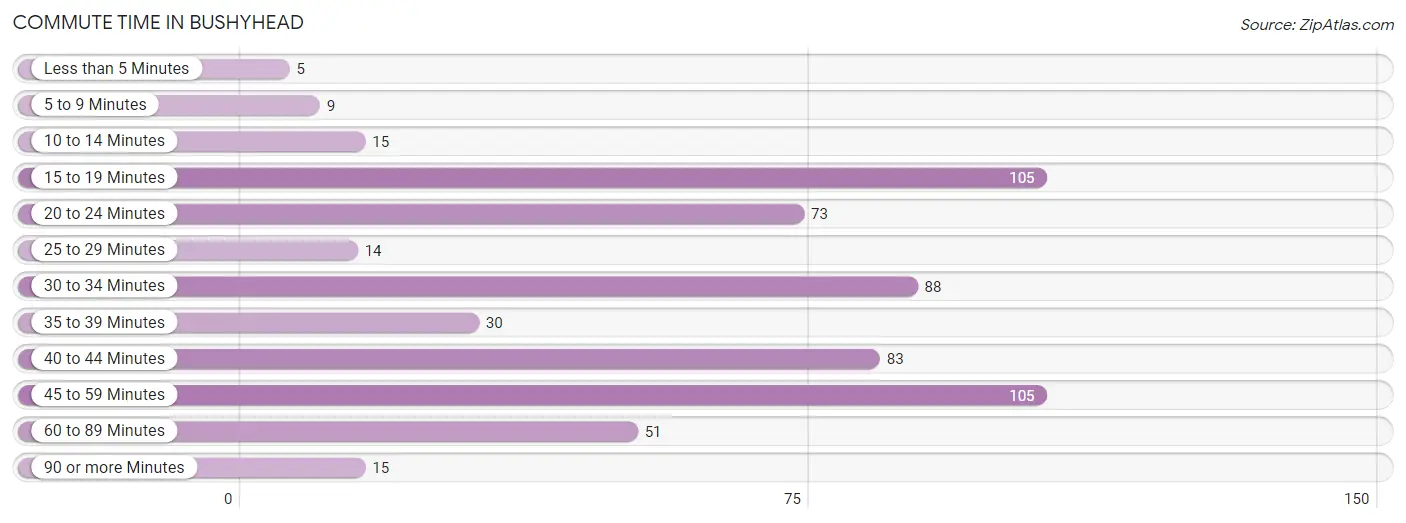
| Commute Time | # Commuters | % Commuters |
| Less than 5 Minutes | 5 | 0.8% |
| 5 to 9 Minutes | 9 | 1.5% |
| 10 to 14 Minutes | 15 | 2.5% |
| 15 to 19 Minutes | 105 | 17.7% |
| 20 to 24 Minutes | 73 | 12.3% |
| 25 to 29 Minutes | 14 | 2.4% |
| 30 to 34 Minutes | 88 | 14.8% |
| 35 to 39 Minutes | 30 | 5.1% |
| 40 to 44 Minutes | 83 | 14.0% |
| 45 to 59 Minutes | 105 | 17.7% |
| 60 to 89 Minutes | 51 | 8.6% |
| 90 or more Minutes | 15 | 2.5% |
Commute Time by Sex in Bushyhead
The most common commute times in Bushyhead are 30 to 34 minutes (66 commuters, 23.2%) for males and 40 to 44 minutes (73 commuters, 23.7%) for females.
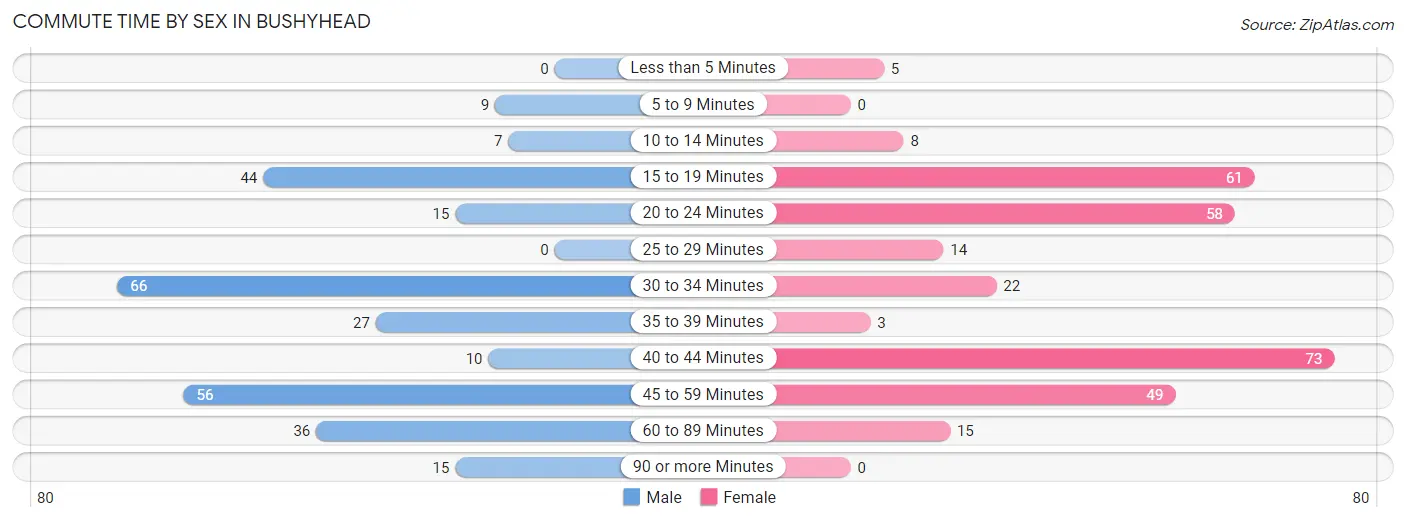
| Commute Time | Male | Female |
| Less than 5 Minutes | 0 (0.0%) | 5 (1.6%) |
| 5 to 9 Minutes | 9 (3.2%) | 0 (0.0%) |
| 10 to 14 Minutes | 7 (2.5%) | 8 (2.6%) |
| 15 to 19 Minutes | 44 (15.4%) | 61 (19.8%) |
| 20 to 24 Minutes | 15 (5.3%) | 58 (18.8%) |
| 25 to 29 Minutes | 0 (0.0%) | 14 (4.5%) |
| 30 to 34 Minutes | 66 (23.2%) | 22 (7.1%) |
| 35 to 39 Minutes | 27 (9.5%) | 3 (1.0%) |
| 40 to 44 Minutes | 10 (3.5%) | 73 (23.7%) |
| 45 to 59 Minutes | 56 (19.7%) | 49 (15.9%) |
| 60 to 89 Minutes | 36 (12.6%) | 15 (4.9%) |
| 90 or more Minutes | 15 (5.3%) | 0 (0.0%) |
Time of Departure to Work by Sex in Bushyhead
The most frequent times of departure to work in Bushyhead are 7:00 AM to 7:29 AM (67, 23.5%) for males and 7:00 AM to 7:29 AM (82, 26.6%) for females.
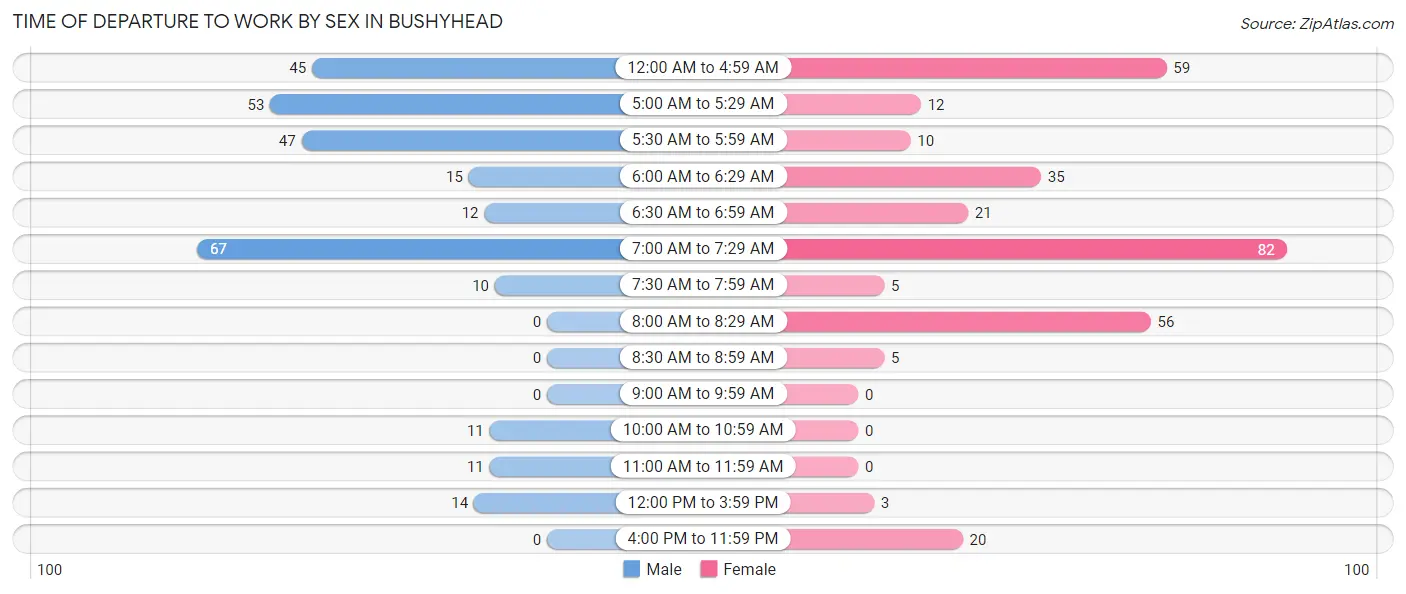
| Time of Departure | Male | Female |
| 12:00 AM to 4:59 AM | 45 (15.8%) | 59 (19.2%) |
| 5:00 AM to 5:29 AM | 53 (18.6%) | 12 (3.9%) |
| 5:30 AM to 5:59 AM | 47 (16.5%) | 10 (3.3%) |
| 6:00 AM to 6:29 AM | 15 (5.3%) | 35 (11.4%) |
| 6:30 AM to 6:59 AM | 12 (4.2%) | 21 (6.8%) |
| 7:00 AM to 7:29 AM | 67 (23.5%) | 82 (26.6%) |
| 7:30 AM to 7:59 AM | 10 (3.5%) | 5 (1.6%) |
| 8:00 AM to 8:29 AM | 0 (0.0%) | 56 (18.2%) |
| 8:30 AM to 8:59 AM | 0 (0.0%) | 5 (1.6%) |
| 9:00 AM to 9:59 AM | 0 (0.0%) | 0 (0.0%) |
| 10:00 AM to 10:59 AM | 11 (3.9%) | 0 (0.0%) |
| 11:00 AM to 11:59 AM | 11 (3.9%) | 0 (0.0%) |
| 12:00 PM to 3:59 PM | 14 (4.9%) | 3 (1.0%) |
| 4:00 PM to 11:59 PM | 0 (0.0%) | 20 (6.5%) |
| Total | 285 (100.0%) | 308 (100.0%) |
Housing Occupancy in Bushyhead
Occupancy by Ownership in Bushyhead
Of the total 492 dwellings in Bushyhead, owner-occupied units account for 432 (87.8%), while renter-occupied units make up 60 (12.2%).
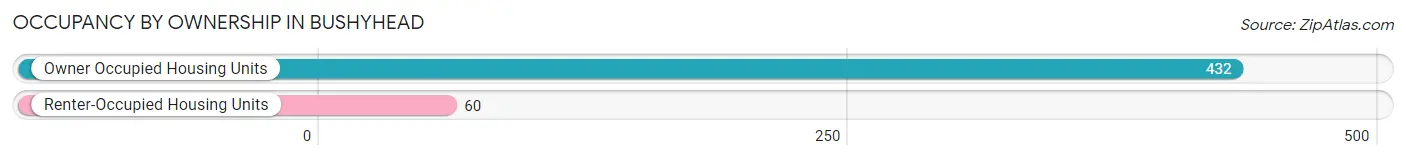
| Occupancy | # Housing Units | % Housing Units |
| Owner Occupied Housing Units | 432 | 87.8% |
| Renter-Occupied Housing Units | 60 | 12.2% |
| Total Occupied Housing Units | 492 | 100.0% |
Occupancy by Household Size in Bushyhead
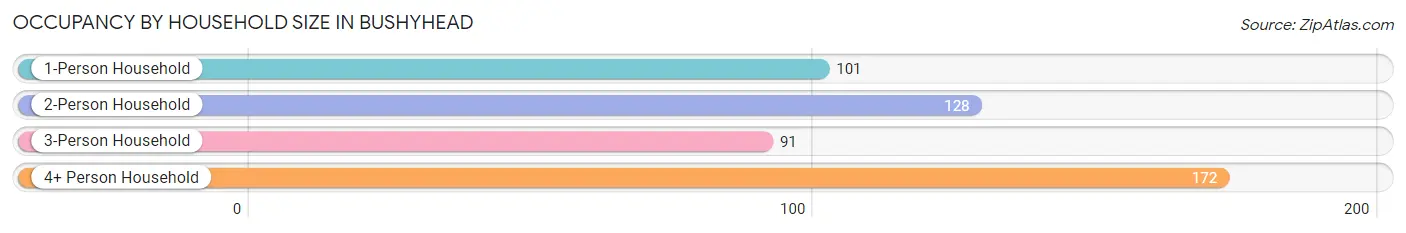
| Household Size | # Housing Units | % Housing Units |
| 1-Person Household | 101 | 20.5% |
| 2-Person Household | 128 | 26.0% |
| 3-Person Household | 91 | 18.5% |
| 4+ Person Household | 172 | 35.0% |
| Total Housing Units | 492 | 100.0% |
Occupancy by Ownership by Household Size in Bushyhead
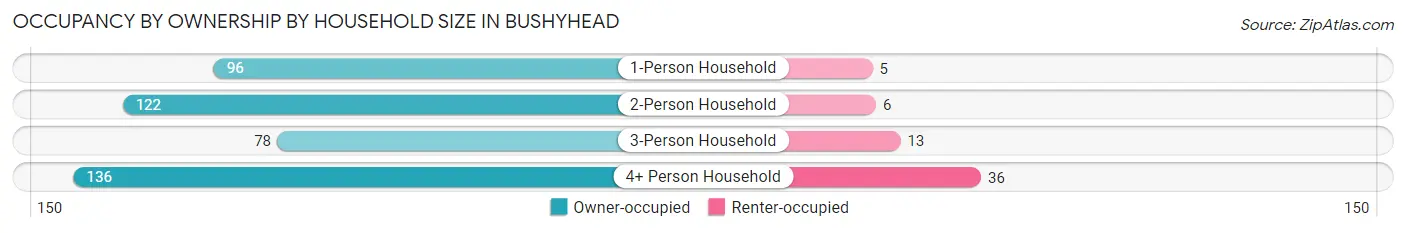
| Household Size | Owner-occupied | Renter-occupied |
| 1-Person Household | 96 (95.1%) | 5 (5.0%) |
| 2-Person Household | 122 (95.3%) | 6 (4.7%) |
| 3-Person Household | 78 (85.7%) | 13 (14.3%) |
| 4+ Person Household | 136 (79.1%) | 36 (20.9%) |
| Total Housing Units | 432 (87.8%) | 60 (12.2%) |
Occupancy by Educational Attainment in Bushyhead
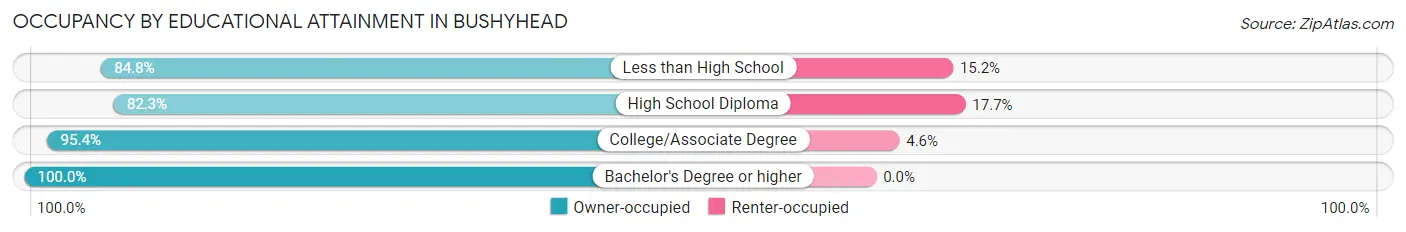
| Household Size | Owner-occupied | Renter-occupied |
| Less than High School | 39 (84.8%) | 7 (15.2%) |
| High School Diploma | 214 (82.3%) | 46 (17.7%) |
| College/Associate Degree | 146 (95.4%) | 7 (4.6%) |
| Bachelor's Degree or higher | 33 (100.0%) | 0 (0.0%) |
Occupancy by Age of Householder in Bushyhead
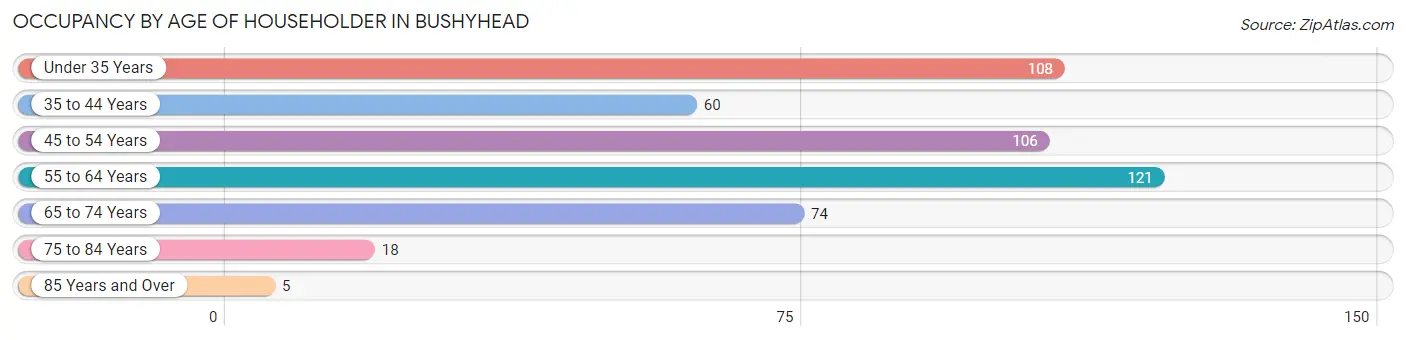
| Age Bracket | # Households | % Households |
| Under 35 Years | 108 | 22.0% |
| 35 to 44 Years | 60 | 12.2% |
| 45 to 54 Years | 106 | 21.5% |
| 55 to 64 Years | 121 | 24.6% |
| 65 to 74 Years | 74 | 15.0% |
| 75 to 84 Years | 18 | 3.7% |
| 85 Years and Over | 5 | 1.0% |
| Total | 492 | 100.0% |
Housing Finances in Bushyhead
Median Income by Occupancy in Bushyhead
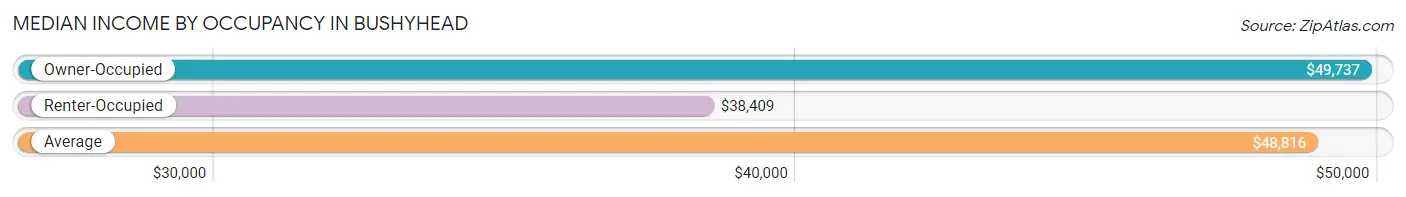
| Occupancy Type | # Households | Median Income |
| Owner-Occupied | 432 (87.8%) | $49,737 |
| Renter-Occupied | 60 (12.2%) | $38,409 |
| Average | 492 (100.0%) | $48,816 |
Occupancy by Householder Income Bracket in Bushyhead
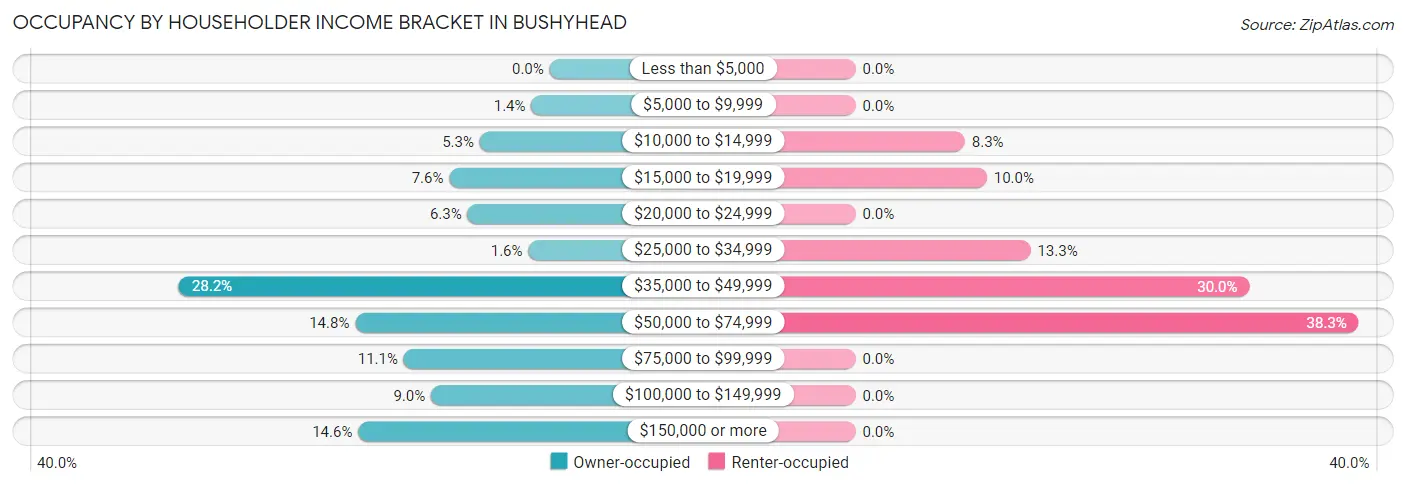
| Income Bracket | Owner-occupied | Renter-occupied |
| Less than $5,000 | 0 (0.0%) | 0 (0.0%) |
| $5,000 to $9,999 | 6 (1.4%) | 0 (0.0%) |
| $10,000 to $14,999 | 23 (5.3%) | 5 (8.3%) |
| $15,000 to $19,999 | 33 (7.6%) | 6 (10.0%) |
| $20,000 to $24,999 | 27 (6.2%) | 0 (0.0%) |
| $25,000 to $34,999 | 7 (1.6%) | 8 (13.3%) |
| $35,000 to $49,999 | 122 (28.2%) | 18 (30.0%) |
| $50,000 to $74,999 | 64 (14.8%) | 23 (38.3%) |
| $75,000 to $99,999 | 48 (11.1%) | 0 (0.0%) |
| $100,000 to $149,999 | 39 (9.0%) | 0 (0.0%) |
| $150,000 or more | 63 (14.6%) | 0 (0.0%) |
| Total | 432 (100.0%) | 60 (100.0%) |
Monthly Housing Cost Tiers in Bushyhead
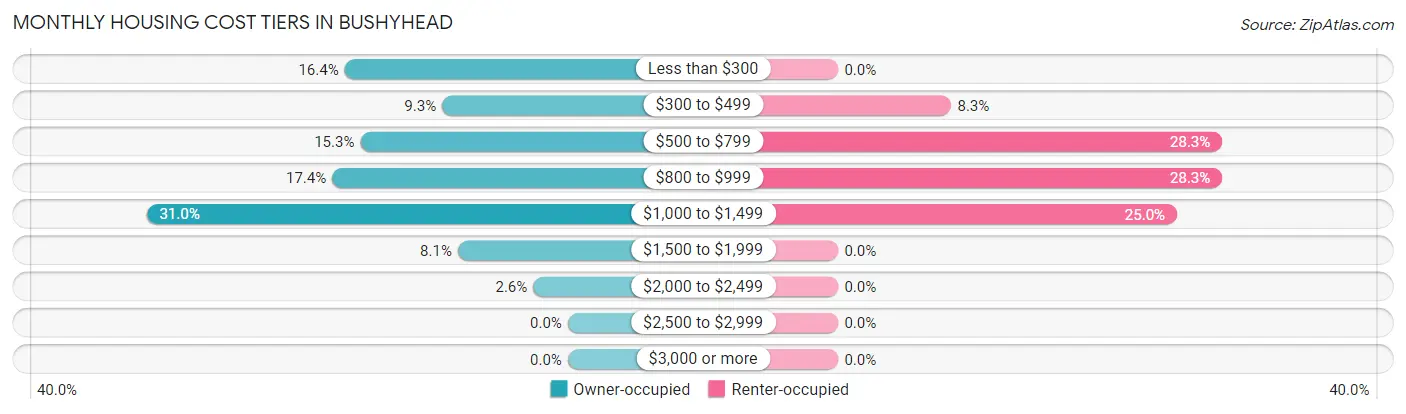
| Monthly Cost | Owner-occupied | Renter-occupied |
| Less than $300 | 71 (16.4%) | 0 (0.0%) |
| $300 to $499 | 40 (9.3%) | 5 (8.3%) |
| $500 to $799 | 66 (15.3%) | 17 (28.3%) |
| $800 to $999 | 75 (17.4%) | 17 (28.3%) |
| $1,000 to $1,499 | 134 (31.0%) | 15 (25.0%) |
| $1,500 to $1,999 | 35 (8.1%) | 0 (0.0%) |
| $2,000 to $2,499 | 11 (2.5%) | 0 (0.0%) |
| $2,500 to $2,999 | 0 (0.0%) | 0 (0.0%) |
| $3,000 or more | 0 (0.0%) | 0 (0.0%) |
| Total | 432 (100.0%) | 60 (100.0%) |
Physical Housing Characteristics in Bushyhead
Housing Structures in Bushyhead
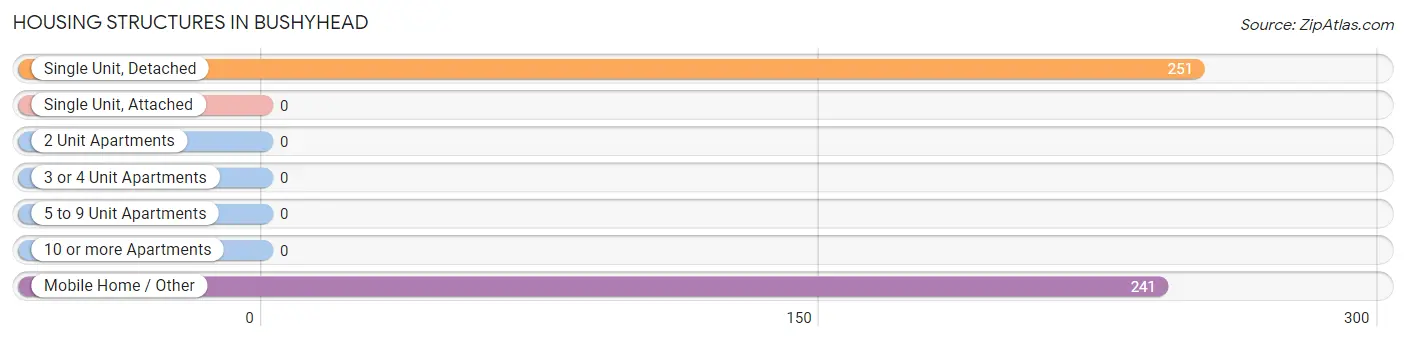
| Structure Type | # Housing Units | % Housing Units |
| Single Unit, Detached | 251 | 51.0% |
| Single Unit, Attached | 0 | 0.0% |
| 2 Unit Apartments | 0 | 0.0% |
| 3 or 4 Unit Apartments | 0 | 0.0% |
| 5 to 9 Unit Apartments | 0 | 0.0% |
| 10 or more Apartments | 0 | 0.0% |
| Mobile Home / Other | 241 | 49.0% |
| Total | 492 | 100.0% |
Housing Structures by Occupancy in Bushyhead
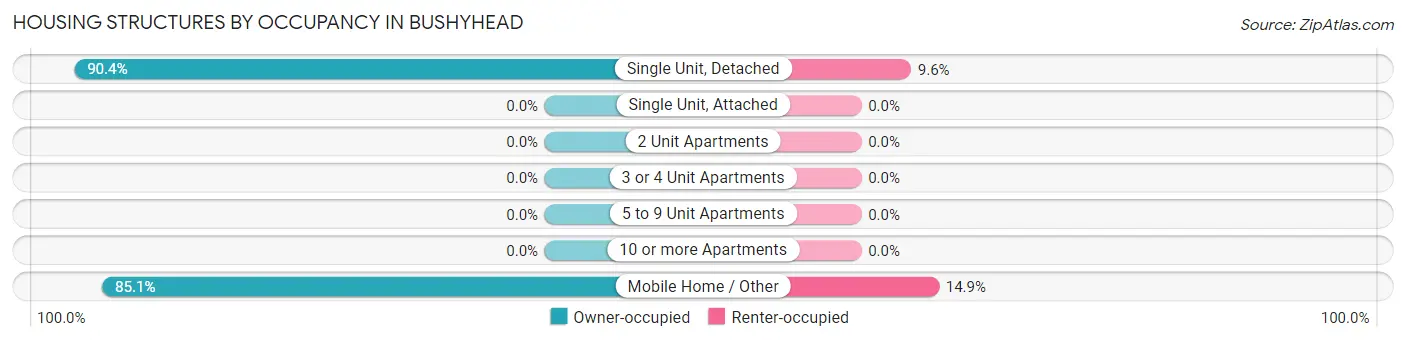
| Structure Type | Owner-occupied | Renter-occupied |
| Single Unit, Detached | 227 (90.4%) | 24 (9.6%) |
| Single Unit, Attached | 0 (0.0%) | 0 (0.0%) |
| 2 Unit Apartments | 0 (0.0%) | 0 (0.0%) |
| 3 or 4 Unit Apartments | 0 (0.0%) | 0 (0.0%) |
| 5 to 9 Unit Apartments | 0 (0.0%) | 0 (0.0%) |
| 10 or more Apartments | 0 (0.0%) | 0 (0.0%) |
| Mobile Home / Other | 205 (85.1%) | 36 (14.9%) |
| Total | 432 (87.8%) | 60 (12.2%) |
Housing Structures by Number of Rooms in Bushyhead
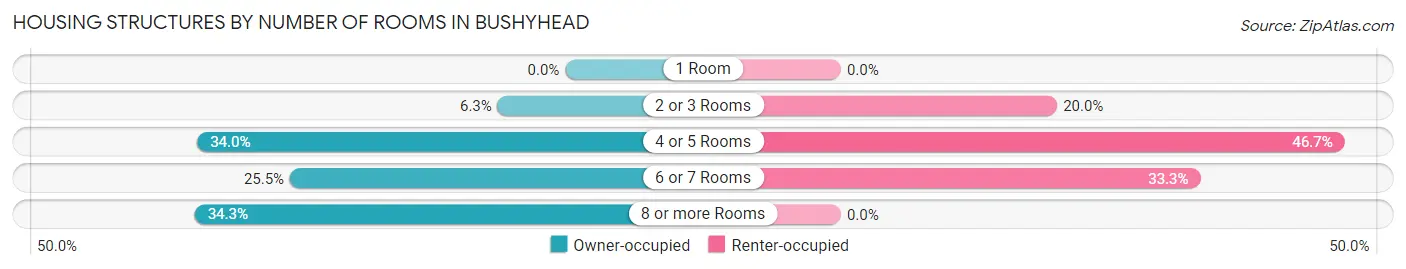
| Number of Rooms | Owner-occupied | Renter-occupied |
| 1 Room | 0 (0.0%) | 0 (0.0%) |
| 2 or 3 Rooms | 27 (6.2%) | 12 (20.0%) |
| 4 or 5 Rooms | 147 (34.0%) | 28 (46.7%) |
| 6 or 7 Rooms | 110 (25.5%) | 20 (33.3%) |
| 8 or more Rooms | 148 (34.3%) | 0 (0.0%) |
| Total | 432 (100.0%) | 60 (100.0%) |
Housing Structure by Heating Type in Bushyhead
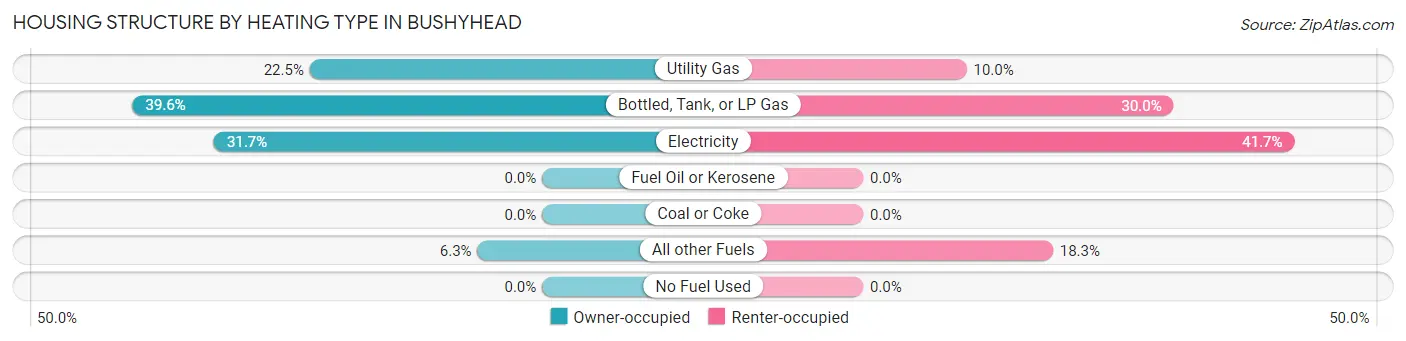
| Heating Type | Owner-occupied | Renter-occupied |
| Utility Gas | 97 (22.5%) | 6 (10.0%) |
| Bottled, Tank, or LP Gas | 171 (39.6%) | 18 (30.0%) |
| Electricity | 137 (31.7%) | 25 (41.7%) |
| Fuel Oil or Kerosene | 0 (0.0%) | 0 (0.0%) |
| Coal or Coke | 0 (0.0%) | 0 (0.0%) |
| All other Fuels | 27 (6.2%) | 11 (18.3%) |
| No Fuel Used | 0 (0.0%) | 0 (0.0%) |
| Total | 432 (100.0%) | 60 (100.0%) |
Household Vehicle Usage in Bushyhead
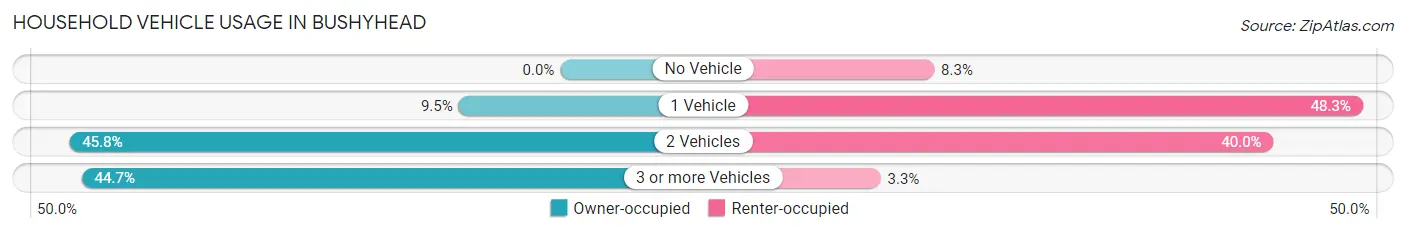
| Vehicles per Household | Owner-occupied | Renter-occupied |
| No Vehicle | 0 (0.0%) | 5 (8.3%) |
| 1 Vehicle | 41 (9.5%) | 29 (48.3%) |
| 2 Vehicles | 198 (45.8%) | 24 (40.0%) |
| 3 or more Vehicles | 193 (44.7%) | 2 (3.3%) |
| Total | 432 (100.0%) | 60 (100.0%) |
Real Estate & Mortgages in Bushyhead
Real Estate and Mortgage Overview in Bushyhead
| Characteristic | Without Mortgage | With Mortgage |
| Housing Units | 227 | 205 |
| Median Property Value | - | - |
| Median Household Income | $38,887 | $59 |
| Monthly Housing Costs | $509 | $0 |
| Real Estate Taxes | $440 | $0 |
Property Value by Mortgage Status in Bushyhead
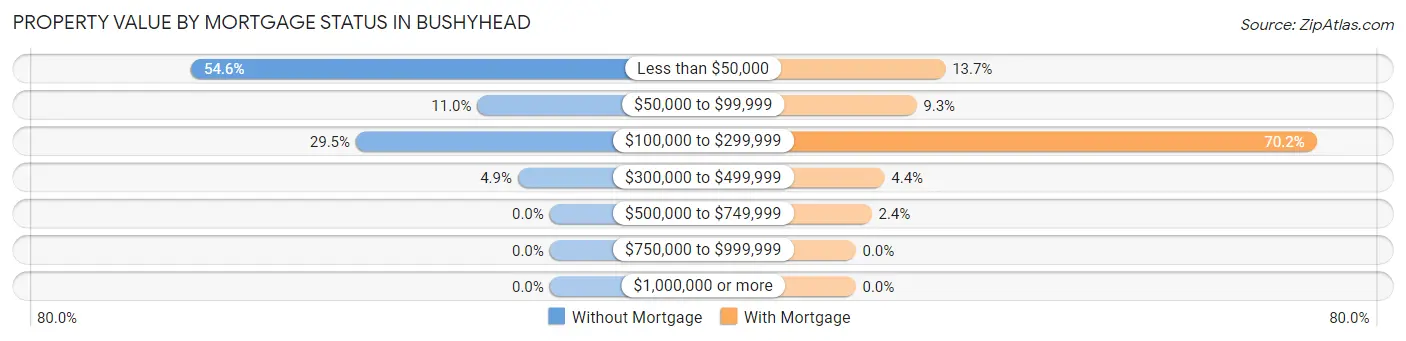
| Property Value | Without Mortgage | With Mortgage |
| Less than $50,000 | 124 (54.6%) | 28 (13.7%) |
| $50,000 to $99,999 | 25 (11.0%) | 19 (9.3%) |
| $100,000 to $299,999 | 67 (29.5%) | 144 (70.2%) |
| $300,000 to $499,999 | 11 (4.9%) | 9 (4.4%) |
| $500,000 to $749,999 | 0 (0.0%) | 5 (2.4%) |
| $750,000 to $999,999 | 0 (0.0%) | 0 (0.0%) |
| $1,000,000 or more | 0 (0.0%) | 0 (0.0%) |
| Total | 227 (100.0%) | 205 (100.0%) |
Household Income by Mortgage Status in Bushyhead
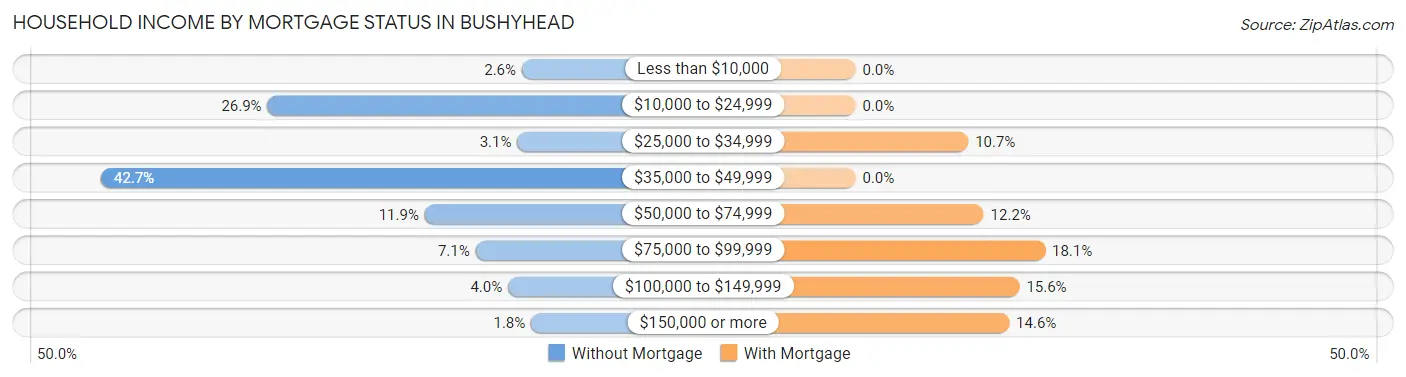
| Household Income | Without Mortgage | With Mortgage |
| Less than $10,000 | 6 (2.6%) | 0 (0.0%) |
| $10,000 to $24,999 | 61 (26.9%) | 0 (0.0%) |
| $25,000 to $34,999 | 7 (3.1%) | 22 (10.7%) |
| $35,000 to $49,999 | 97 (42.7%) | 0 (0.0%) |
| $50,000 to $74,999 | 27 (11.9%) | 25 (12.2%) |
| $75,000 to $99,999 | 16 (7.0%) | 37 (18.0%) |
| $100,000 to $149,999 | 9 (4.0%) | 32 (15.6%) |
| $150,000 or more | 4 (1.8%) | 30 (14.6%) |
| Total | 227 (100.0%) | 205 (100.0%) |
Property Value to Household Income Ratio in Bushyhead
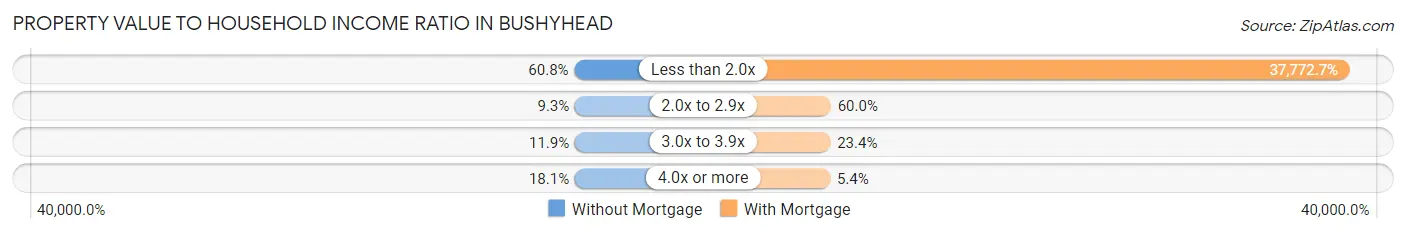
| Value-to-Income Ratio | Without Mortgage | With Mortgage |
| Less than 2.0x | 138 (60.8%) | 77,434 (37,772.7%) |
| 2.0x to 2.9x | 21 (9.2%) | 123 (60.0%) |
| 3.0x to 3.9x | 27 (11.9%) | 48 (23.4%) |
| 4.0x or more | 41 (18.1%) | 11 (5.4%) |
| Total | 227 (100.0%) | 205 (100.0%) |
Real Estate Taxes by Mortgage Status in Bushyhead
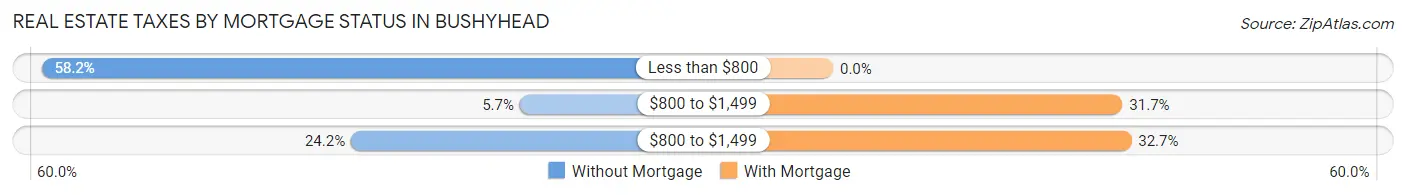
| Property Taxes | Without Mortgage | With Mortgage |
| Less than $800 | 132 (58.2%) | 0 (0.0%) |
| $800 to $1,499 | 13 (5.7%) | 65 (31.7%) |
| $800 to $1,499 | 55 (24.2%) | 67 (32.7%) |
| Total | 227 (100.0%) | 205 (100.0%) |
Health & Disability in Bushyhead
Health Insurance Coverage by Age in Bushyhead
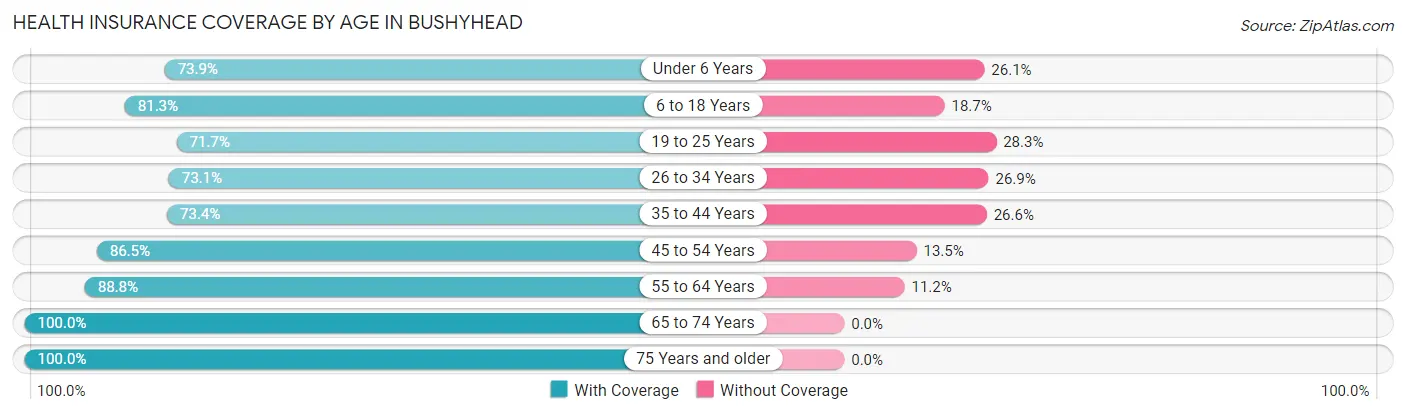
| Age Bracket | With Coverage | Without Coverage |
| Under 6 Years | 82 (73.9%) | 29 (26.1%) |
| 6 to 18 Years | 187 (81.3%) | 43 (18.7%) |
| 19 to 25 Years | 129 (71.7%) | 51 (28.3%) |
| 26 to 34 Years | 144 (73.1%) | 53 (26.9%) |
| 35 to 44 Years | 141 (73.4%) | 51 (26.6%) |
| 45 to 54 Years | 167 (86.5%) | 26 (13.5%) |
| 55 to 64 Years | 166 (88.8%) | 21 (11.2%) |
| 65 to 74 Years | 106 (100.0%) | 0 (0.0%) |
| 75 Years and older | 34 (100.0%) | 0 (0.0%) |
| Total | 1,156 (80.8%) | 274 (19.2%) |
Health Insurance Coverage by Citizenship Status in Bushyhead
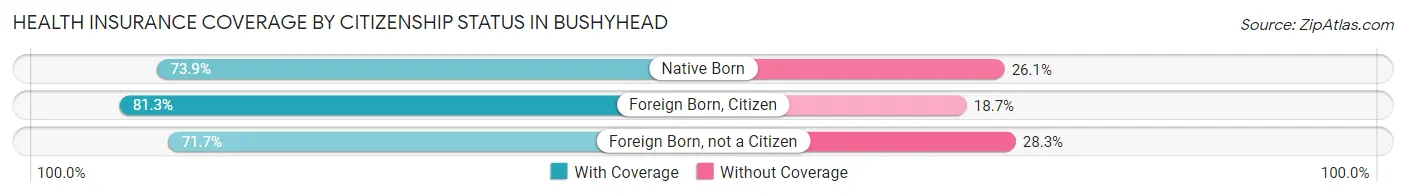
| Citizenship Status | With Coverage | Without Coverage |
| Native Born | 82 (73.9%) | 29 (26.1%) |
| Foreign Born, Citizen | 187 (81.3%) | 43 (18.7%) |
| Foreign Born, not a Citizen | 129 (71.7%) | 51 (28.3%) |
Health Insurance Coverage by Household Income in Bushyhead
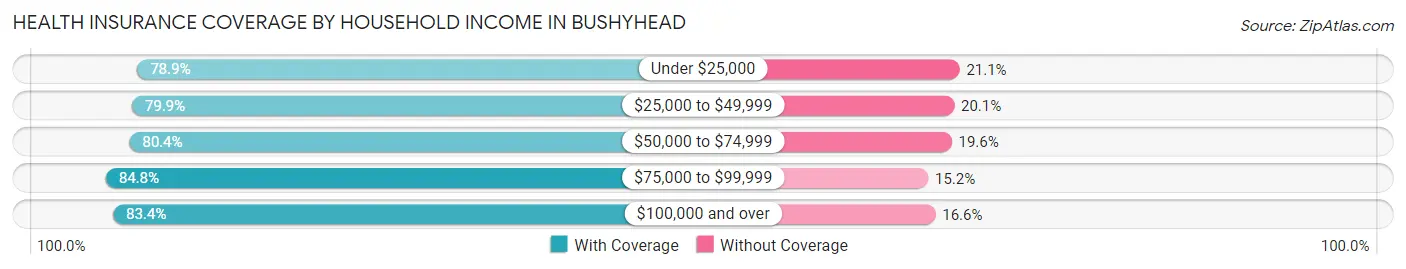
| Household Income | With Coverage | Without Coverage |
| Under $25,000 | 157 (78.9%) | 42 (21.1%) |
| $25,000 to $49,999 | 330 (79.9%) | 83 (20.1%) |
| $50,000 to $74,999 | 254 (80.4%) | 62 (19.6%) |
| $75,000 to $99,999 | 78 (84.8%) | 14 (15.2%) |
| $100,000 and over | 332 (83.4%) | 66 (16.6%) |
Public vs Private Health Insurance Coverage by Age in Bushyhead
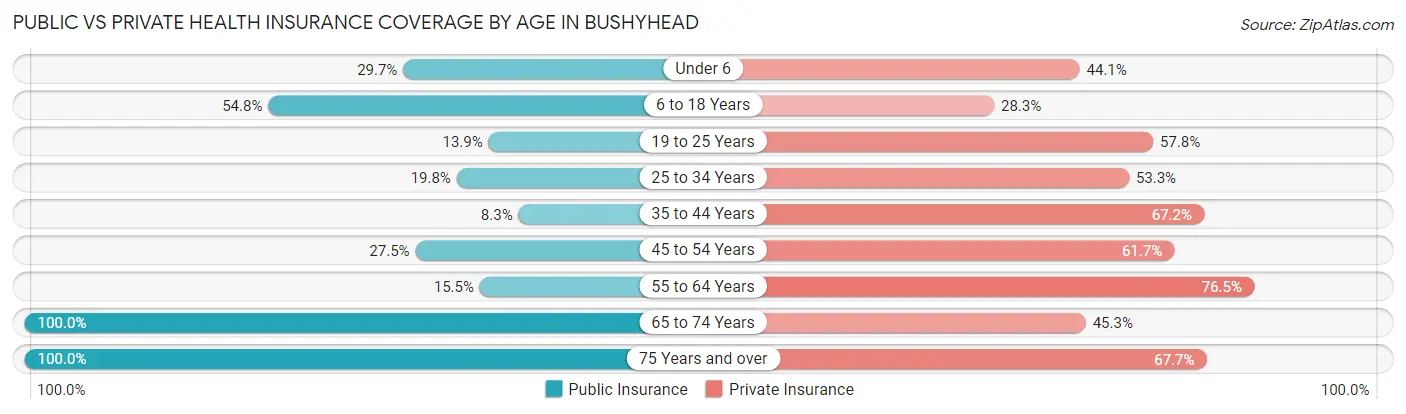
| Age Bracket | Public Insurance | Private Insurance |
| Under 6 | 33 (29.7%) | 49 (44.1%) |
| 6 to 18 Years | 126 (54.8%) | 65 (28.3%) |
| 19 to 25 Years | 25 (13.9%) | 104 (57.8%) |
| 25 to 34 Years | 39 (19.8%) | 105 (53.3%) |
| 35 to 44 Years | 16 (8.3%) | 129 (67.2%) |
| 45 to 54 Years | 53 (27.5%) | 119 (61.7%) |
| 55 to 64 Years | 29 (15.5%) | 143 (76.5%) |
| 65 to 74 Years | 106 (100.0%) | 48 (45.3%) |
| 75 Years and over | 34 (100.0%) | 23 (67.6%) |
| Total | 461 (32.2%) | 785 (54.9%) |
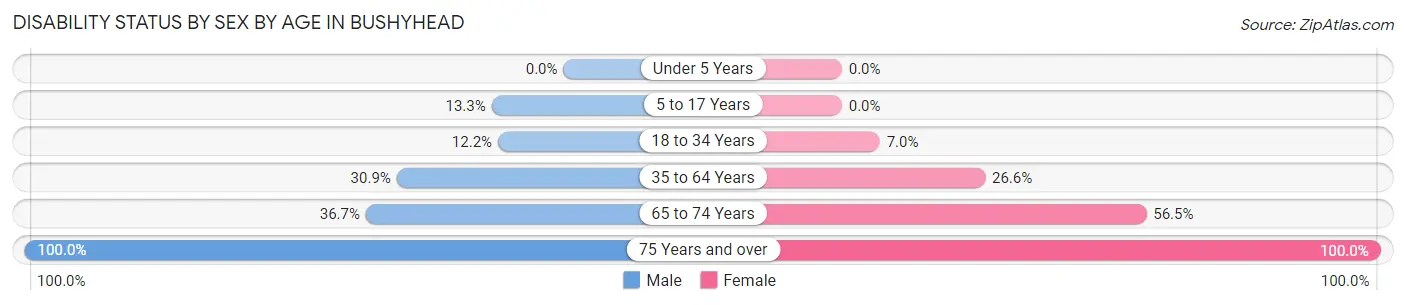
Disability Status by Sex by Age in Bushyhead
| Age Bracket | Male | Female |
| Under 5 Years | 0 (0.0%) | 0 (0.0%) |
| 5 to 17 Years | 20 (13.3%) | 0 (0.0%) |
| 18 to 34 Years | 22 (12.1%) | 15 (7.0%) |
| 35 to 64 Years | 99 (30.9%) | 67 (26.6%) |
| 65 to 74 Years | 22 (36.7%) | 26 (56.5%) |
| 75 Years and over | 19 (100.0%) | 15 (100.0%) |
Disability Class by Sex by Age in Bushyhead
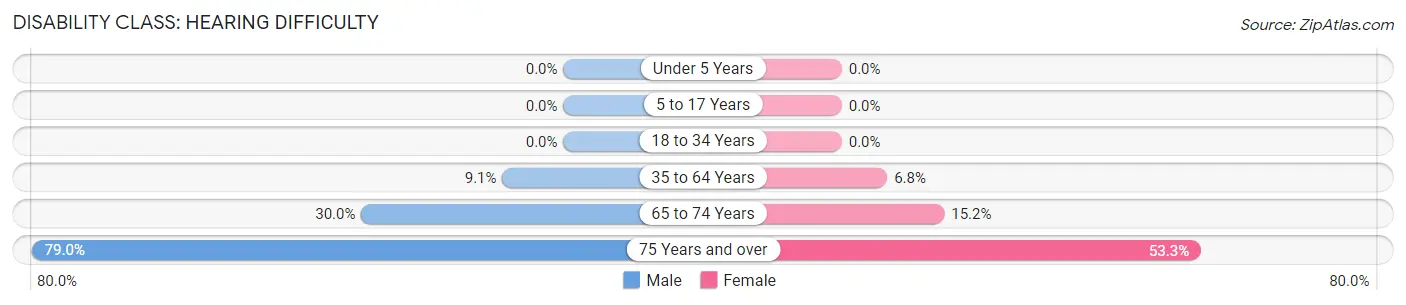
Disability Class: Hearing Difficulty
| Age Bracket | Male | Female |
| Under 5 Years | 0 (0.0%) | 0 (0.0%) |
| 5 to 17 Years | 0 (0.0%) | 0 (0.0%) |
| 18 to 34 Years | 0 (0.0%) | 0 (0.0%) |
| 35 to 64 Years | 29 (9.1%) | 17 (6.8%) |
| 65 to 74 Years | 18 (30.0%) | 7 (15.2%) |
| 75 Years and over | 15 (78.9%) | 8 (53.3%) |
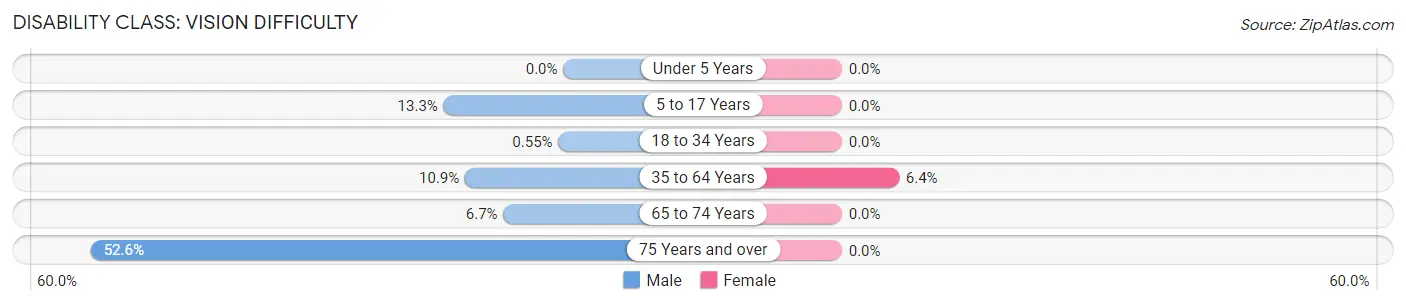
Disability Class: Vision Difficulty
| Age Bracket | Male | Female |
| Under 5 Years | 0 (0.0%) | 0 (0.0%) |
| 5 to 17 Years | 20 (13.3%) | 0 (0.0%) |
| 18 to 34 Years | 1 (0.5%) | 0 (0.0%) |
| 35 to 64 Years | 35 (10.9%) | 16 (6.4%) |
| 65 to 74 Years | 4 (6.7%) | 0 (0.0%) |
| 75 Years and over | 10 (52.6%) | 0 (0.0%) |
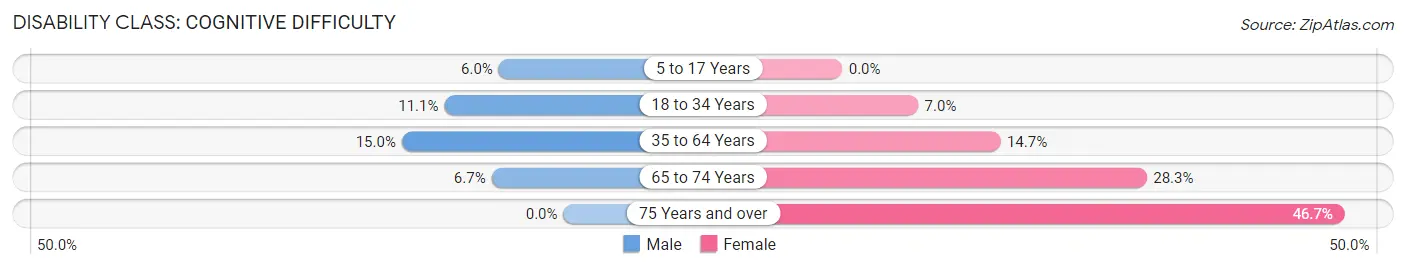
Disability Class: Cognitive Difficulty
| Age Bracket | Male | Female |
| 5 to 17 Years | 9 (6.0%) | 0 (0.0%) |
| 18 to 34 Years | 20 (11.1%) | 15 (7.0%) |
| 35 to 64 Years | 48 (15.0%) | 37 (14.7%) |
| 65 to 74 Years | 4 (6.7%) | 13 (28.3%) |
| 75 Years and over | 0 (0.0%) | 7 (46.7%) |
Disability Class: Ambulatory Difficulty
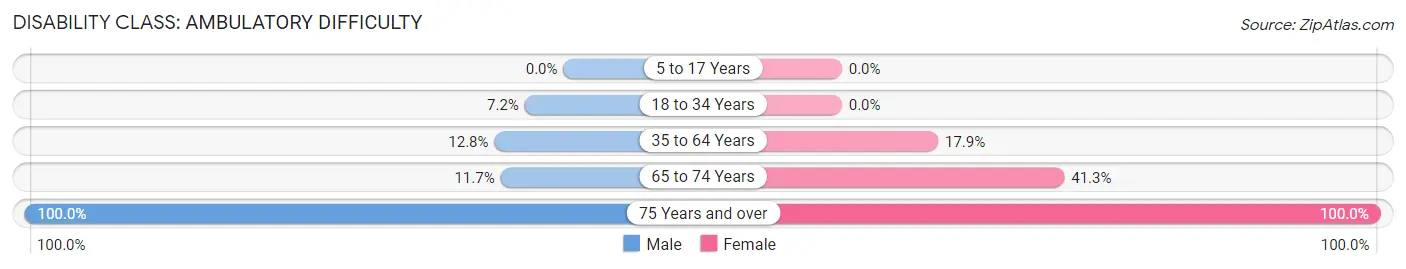
| Age Bracket | Male | Female |
| 5 to 17 Years | 0 (0.0%) | 0 (0.0%) |
| 18 to 34 Years | 13 (7.2%) | 0 (0.0%) |
| 35 to 64 Years | 41 (12.8%) | 45 (17.9%) |
| 65 to 74 Years | 7 (11.7%) | 19 (41.3%) |
| 75 Years and over | 19 (100.0%) | 15 (100.0%) |
Disability Class: Self-Care Difficulty
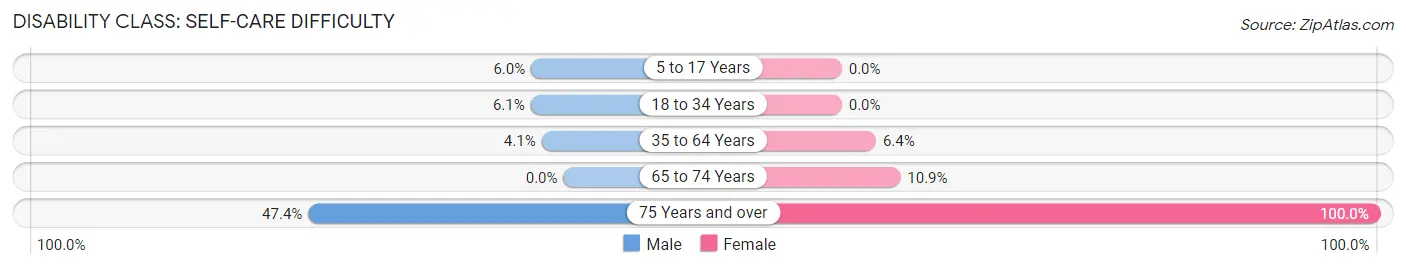
| Age Bracket | Male | Female |
| 5 to 17 Years | 9 (6.0%) | 0 (0.0%) |
| 18 to 34 Years | 11 (6.1%) | 0 (0.0%) |
| 35 to 64 Years | 13 (4.1%) | 16 (6.4%) |
| 65 to 74 Years | 0 (0.0%) | 5 (10.9%) |
| 75 Years and over | 9 (47.4%) | 15 (100.0%) |
Technology Access in Bushyhead
Computing Device Access in Bushyhead
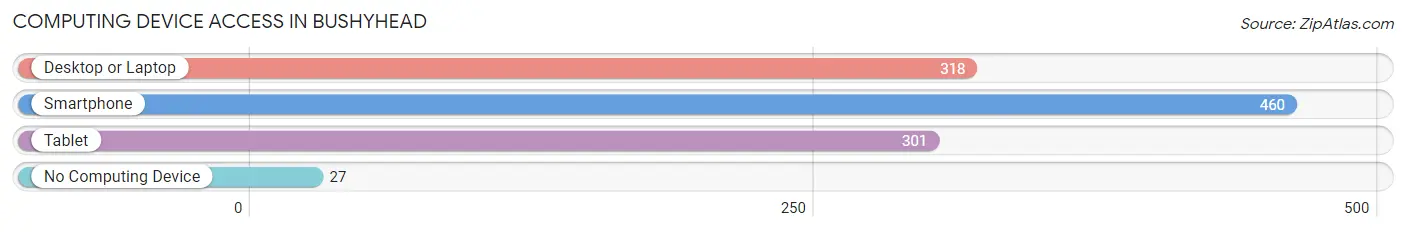
| Device Type | # Households | % Households |
| Desktop or Laptop | 318 | 64.6% |
| Smartphone | 460 | 93.5% |
| Tablet | 301 | 61.2% |
| No Computing Device | 27 | 5.5% |
| Total | 492 | 100.0% |
Internet Access in Bushyhead
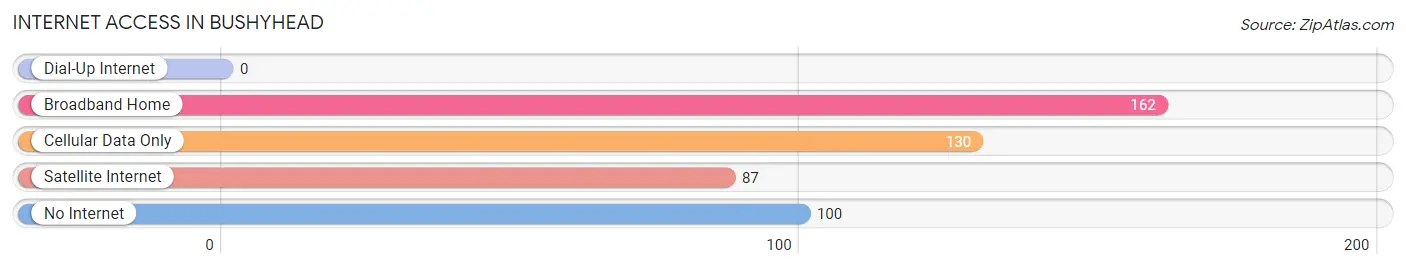
| Internet Type | # Households | % Households |
| Dial-Up Internet | 0 | 0.0% |
| Broadband Home | 162 | 32.9% |
| Cellular Data Only | 130 | 26.4% |
| Satellite Internet | 87 | 17.7% |
| No Internet | 100 | 20.3% |
| Total | 492 | 100.0% |
Bushyhead Summary
Bushyhead is a small unincorporated community located in the northeastern corner of Oklahoma in the United States. It is situated in the foothills of the Ozark Mountains, approximately 10 miles south of the Arkansas border. The town is named after the Cherokee Chief Bushyhead, who was a leader of the Cherokee Nation during the late 19th century.
History
Bushyhead was founded in 1891 by a group of Cherokee settlers who had been relocated from their ancestral lands in the southeastern United States. The town was originally known as “Bushyhead Station” and was a stop on the St. Louis and San Francisco Railway. The town was officially incorporated in 1895 and was named after the Cherokee Chief Bushyhead.
The town grew rapidly in the early 20th century, becoming a center for the local agricultural industry. The town was also home to a number of businesses, including a general store, a blacksmith shop, a hotel, and a post office.
In the mid-20th century, the town began to decline as the local agricultural industry shifted away from the area. The town’s population decreased significantly and many of the businesses closed.
Geography
Bushyhead is located in the foothills of the Ozark Mountains in the northeastern corner of Oklahoma. The town is situated at an elevation of 890 feet and is approximately 10 miles south of the Arkansas border. The town is located in Adair County and is bordered by the towns of Westville to the north, Stilwell to the east, and Watts to the south.
The town is situated in a rural area and is surrounded by rolling hills and forests. The nearby Illinois River provides a scenic backdrop to the town.
Economy
The economy of Bushyhead is largely based on agriculture. The town is home to a number of farms and ranches that produce a variety of crops, including corn, soybeans, wheat, and hay. The town is also home to a number of small businesses, including a general store, a blacksmith shop, and a post office.
Demographics
As of the 2010 census, the population of Bushyhead was 1,072. The town is predominantly white, with approximately 95% of the population identifying as such. The median household income in the town is $35,000, and the median age is 44. The town has a poverty rate of 17.5%.
Common Questions
What is Per Capita Income in Bushyhead?
Per Capita income in Bushyhead is $25,677.
What is the Median Family Income in Bushyhead?
Median Family Income in Bushyhead is $49,643.
What is the Median Household income in Bushyhead?
Median Household Income in Bushyhead is $48,816.
What is Income or Wage Gap in Bushyhead?
Income or Wage Gap in Bushyhead is 34.3%.
Women in Bushyhead earn 65.7 cents for every dollar earned by a man.
What is Inequality or Gini Index in Bushyhead?
Inequality or Gini Index in Bushyhead is 0.43.
What is the Total Population of Bushyhead?
Total Population of Bushyhead is 1,444.
What is the Total Male Population of Bushyhead?
Total Male Population of Bushyhead is 770.
What is the Total Female Population of Bushyhead?
Total Female Population of Bushyhead is 674.
What is the Ratio of Males per 100 Females in Bushyhead?
There are 114.24 Males per 100 Females in Bushyhead.
What is the Ratio of Females per 100 Males in Bushyhead?
There are 87.53 Females per 100 Males in Bushyhead.
What is the Median Population Age in Bushyhead?
Median Population Age in Bushyhead is 34.5 Years.
What is the Average Family Size in Bushyhead
Average Family Size in Bushyhead is 3.2 People.
What is the Average Household Size in Bushyhead
Average Household Size in Bushyhead is 2.9 People.
How Large is the Labor Force in Bushyhead?
There are 704 People in the Labor Forcein in Bushyhead.
What is the Percentage of People in the Labor Force in Bushyhead?
60.9% of People are in the Labor Force in Bushyhead.
What is the Unemployment Rate in Bushyhead?
Unemployment Rate in Bushyhead is 10.4%.