Johnson, AR Map & Demographics
Johnson Map
Johnson Overview
$59,282
PER CAPITA INCOME
$105,714
AVG FAMILY INCOME
$82,386
AVG HOUSEHOLD INCOME
11.9%
WAGE / INCOME GAP [ % ]
88.1¢/ $1
WAGE / INCOME GAP [ $ ]
0.58
INEQUALITY / GINI INDEX
3,605
TOTAL POPULATION
1,683
MALE POPULATION
1,922
FEMALE POPULATION
87.57
MALES / 100 FEMALES
114.20
FEMALES / 100 MALES
31.3
MEDIAN AGE
3.5
AVG FAMILY SIZE
2.7
AVG HOUSEHOLD SIZE
1,844
LABOR FORCE [ PEOPLE ]
69.8%
PERCENT IN LABOR FORCE
1.0%
UNEMPLOYMENT RATE
Johnson Area Codes
Income in Johnson
Income Overview in Johnson
Per Capita Income in Johnson is $59,282, while median incomes of families and households are $105,714 and $82,386 respectively.
| Characteristic | Number | Measure |
| Per Capita Income | 3,605 | $59,282 |
| Median Family Income | 870 | $105,714 |
| Mean Family Income | 870 | $211,247 |
| Median Household Income | 1,347 | $82,386 |
| Mean Household Income | 1,347 | $157,528 |
| Income Deficit | 870 | $0 |
| Wage / Income Gap (%) | 3,605 | 11.91% |
| Wage / Income Gap ($) | 3,605 | 88.09¢ per $1 |
| Gini / Inequality Index | 3,605 | 0.58 |
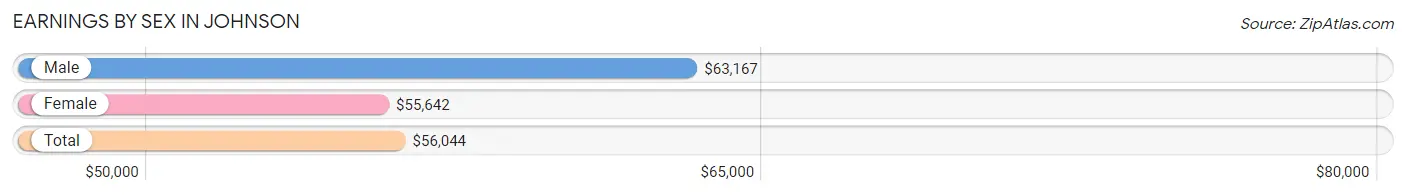
Earnings by Sex in Johnson
Average Earnings in Johnson are $56,044, $63,167 for men and $55,642 for women, a difference of 11.9%.
| Sex | Number | Average Earnings |
| Male | 856 (43.6%) | $63,167 |
| Female | 1,105 (56.4%) | $55,642 |
| Total | 1,961 (100.0%) | $56,044 |
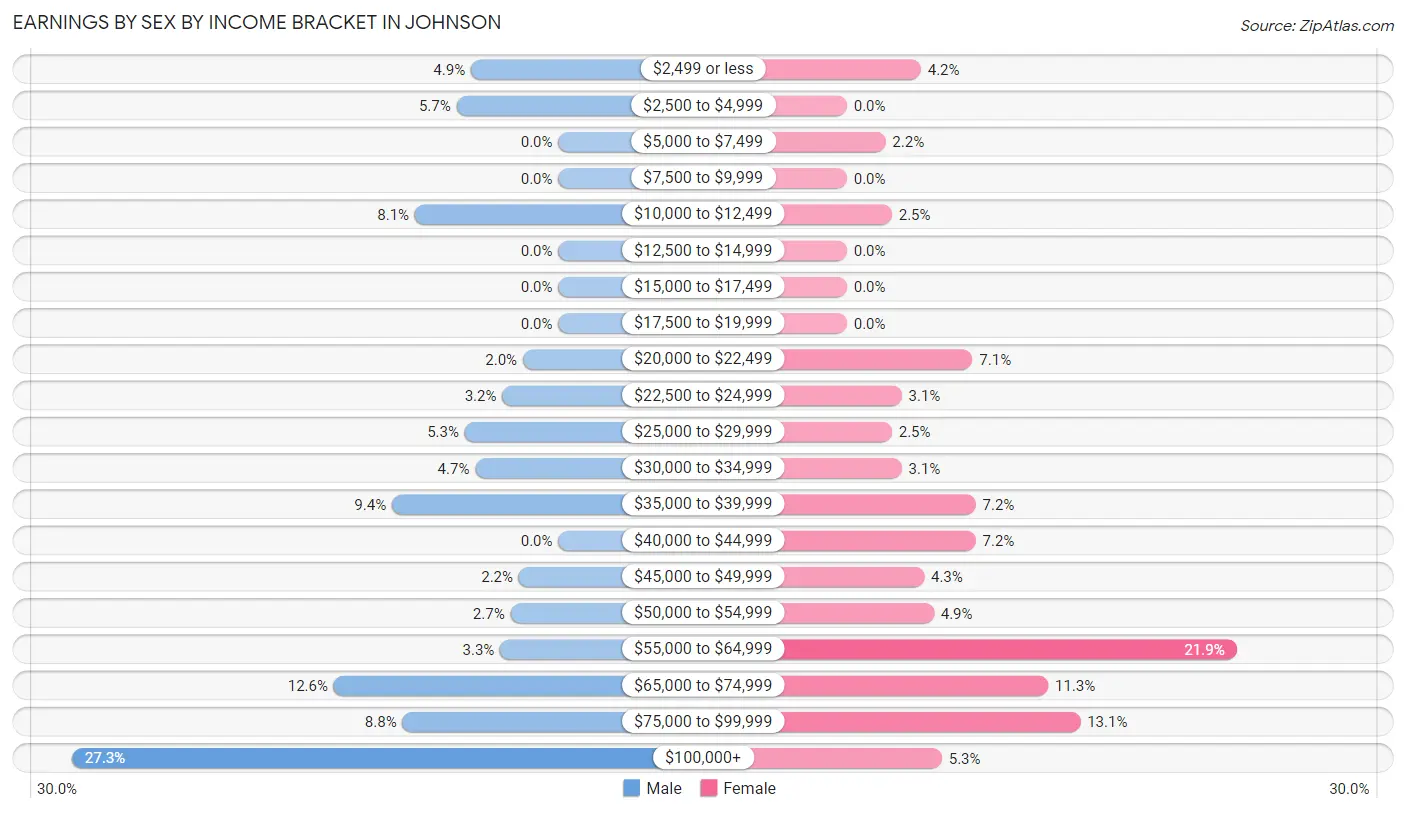
Earnings by Sex by Income Bracket in Johnson
The most common earnings brackets in Johnson are $100,000+ for men (234 | 27.3%) and $55,000 to $64,999 for women (242 | 21.9%).
| Income | Male | Female |
| $2,499 or less | 42 (4.9%) | 46 (4.2%) |
| $2,500 to $4,999 | 49 (5.7%) | 0 (0.0%) |
| $5,000 to $7,499 | 0 (0.0%) | 24 (2.2%) |
| $7,500 to $9,999 | 0 (0.0%) | 0 (0.0%) |
| $10,000 to $12,499 | 69 (8.1%) | 28 (2.5%) |
| $12,500 to $14,999 | 0 (0.0%) | 0 (0.0%) |
| $15,000 to $17,499 | 0 (0.0%) | 0 (0.0%) |
| $17,500 to $19,999 | 0 (0.0%) | 0 (0.0%) |
| $20,000 to $22,499 | 17 (2.0%) | 78 (7.1%) |
| $22,500 to $24,999 | 27 (3.2%) | 34 (3.1%) |
| $25,000 to $29,999 | 45 (5.3%) | 28 (2.5%) |
| $30,000 to $34,999 | 40 (4.7%) | 34 (3.1%) |
| $35,000 to $39,999 | 80 (9.3%) | 80 (7.2%) |
| $40,000 to $44,999 | 0 (0.0%) | 80 (7.2%) |
| $45,000 to $49,999 | 19 (2.2%) | 48 (4.3%) |
| $50,000 to $54,999 | 23 (2.7%) | 54 (4.9%) |
| $55,000 to $64,999 | 28 (3.3%) | 242 (21.9%) |
| $65,000 to $74,999 | 108 (12.6%) | 125 (11.3%) |
| $75,000 to $99,999 | 75 (8.8%) | 145 (13.1%) |
| $100,000+ | 234 (27.3%) | 59 (5.3%) |
| Total | 856 (100.0%) | 1,105 (100.0%) |
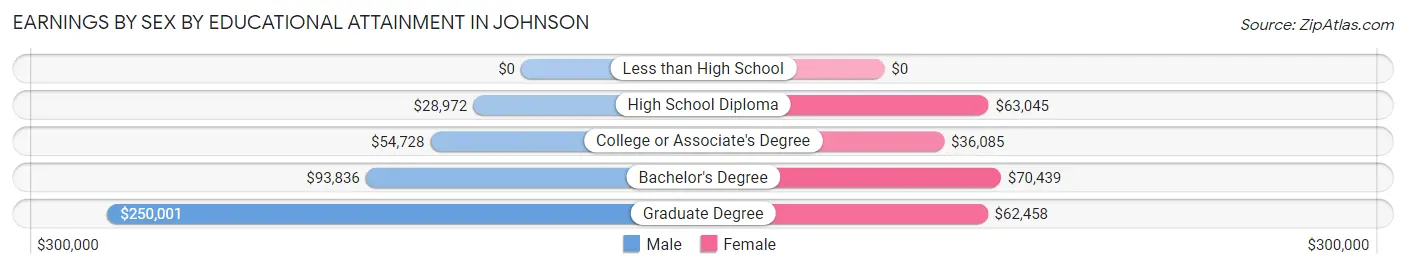
Earnings by Sex by Educational Attainment in Johnson
Average earnings in Johnson are $70,102 for men and $57,344 for women, a difference of 18.2%. Men with an educational attainment of graduate degree enjoy the highest average annual earnings of $250,001, while those with high school diploma education earn the least with $28,972. Women with an educational attainment of bachelor's degree earn the most with the average annual earnings of $70,439, while those with college or associate's degree education have the smallest earnings of $36,085.
| Educational Attainment | Male Income | Female Income |
| Less than High School | - | - |
| High School Diploma | $28,972 | $63,045 |
| College or Associate's Degree | $54,728 | $36,085 |
| Bachelor's Degree | $93,836 | $70,439 |
| Graduate Degree | $250,001 | $62,458 |
| Total | $70,102 | $57,344 |
Family Income in Johnson
Family Income Brackets in Johnson
According to the Johnson family income data, there are 228 families falling into the $100,000 to $149,999 income range, which is the most common income bracket and makes up 26.2% of all families.
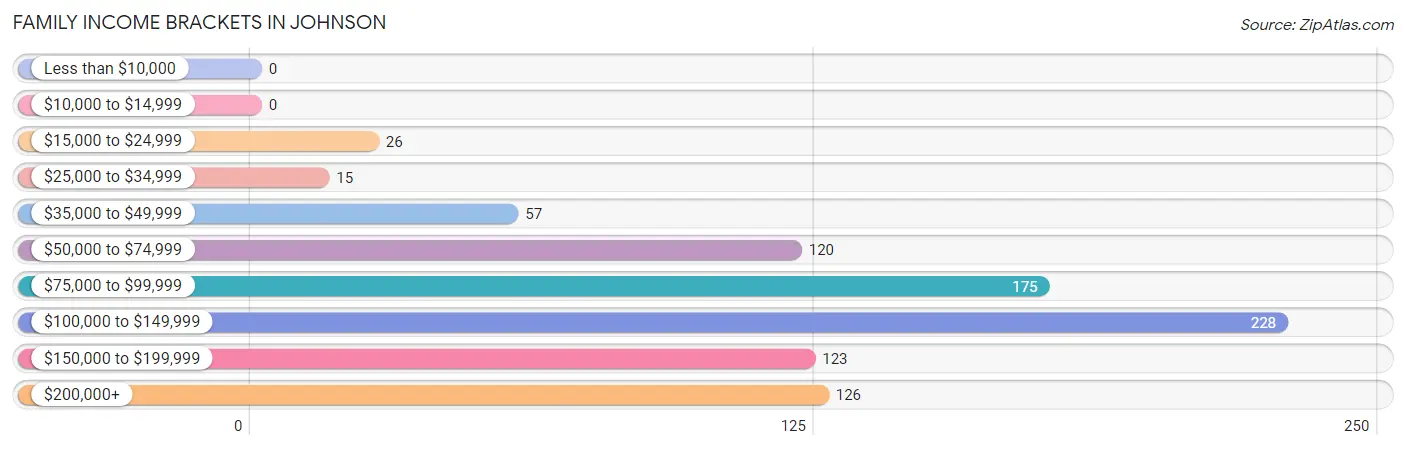
| Income Bracket | # Families | % Families |
| Less than $10,000 | 0 | 0.0% |
| $10,000 to $14,999 | 0 | 0.0% |
| $15,000 to $24,999 | 26 | 3.0% |
| $25,000 to $34,999 | 15 | 1.7% |
| $35,000 to $49,999 | 57 | 6.6% |
| $50,000 to $74,999 | 120 | 13.8% |
| $75,000 to $99,999 | 175 | 20.1% |
| $100,000 to $149,999 | 228 | 26.2% |
| $150,000 to $199,999 | 123 | 14.1% |
| $200,000+ | 126 | 14.5% |
Family Income by Famaliy Size in Johnson
5-person families (79 | 9.1%) account for the highest median family income in Johnson with $105,179 per family, while 2-person families (449 | 51.6%) have the highest median income of $44,604 per family member.
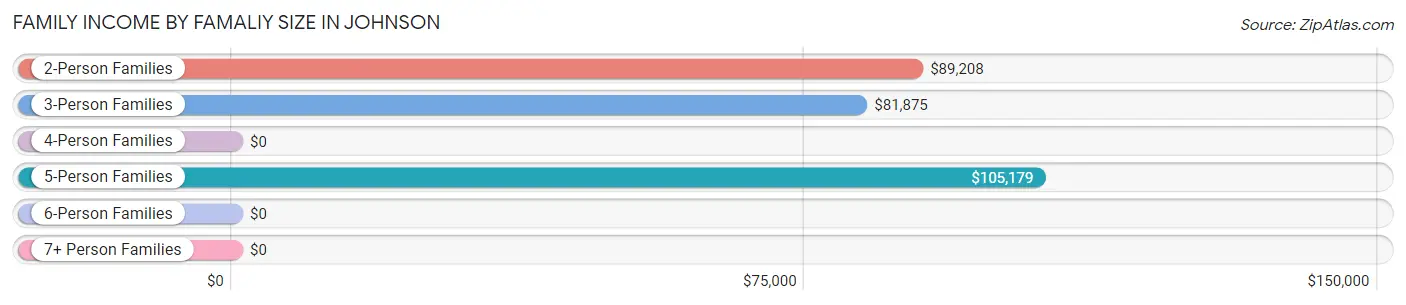
| Income Bracket | # Families | Median Income |
| 2-Person Families | 449 (51.6%) | $89,208 |
| 3-Person Families | 97 (11.2%) | $81,875 |
| 4-Person Families | 134 (15.4%) | $0 |
| 5-Person Families | 79 (9.1%) | $105,179 |
| 6-Person Families | 111 (12.8%) | $0 |
| 7+ Person Families | 0 (0.0%) | $0 |
| Total | 870 (100.0%) | $105,714 |
Family Income by Number of Earners in Johnson
The median family income in Johnson is $105,714, with families comprising 3+ earners (121) having the highest median family income of $135,587, while families with no earners (47) have the lowest median family income of $61,771, accounting for 13.9% and 5.4% of families, respectively.
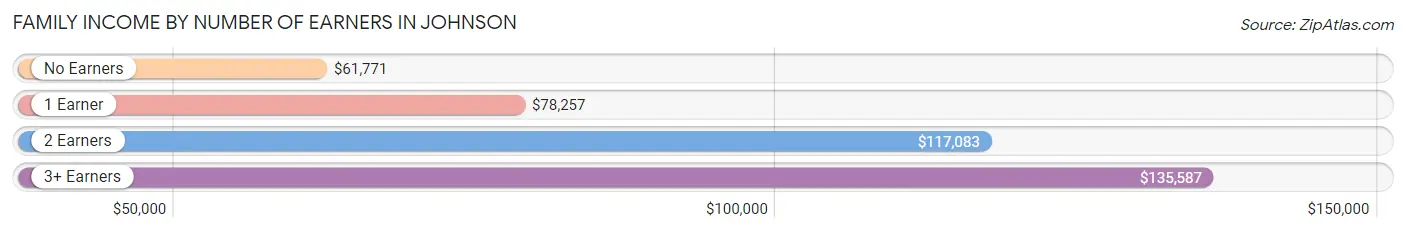
| Number of Earners | # Families | Median Income |
| No Earners | 47 (5.4%) | $61,771 |
| 1 Earner | 311 (35.7%) | $78,257 |
| 2 Earners | 391 (44.9%) | $117,083 |
| 3+ Earners | 121 (13.9%) | $135,587 |
| Total | 870 (100.0%) | $105,714 |
Household Income in Johnson
Household Income Brackets in Johnson
With 303 households falling in the category, the $100,000 to $149,999 income range is the most frequent in Johnson, accounting for 22.5% of all households.
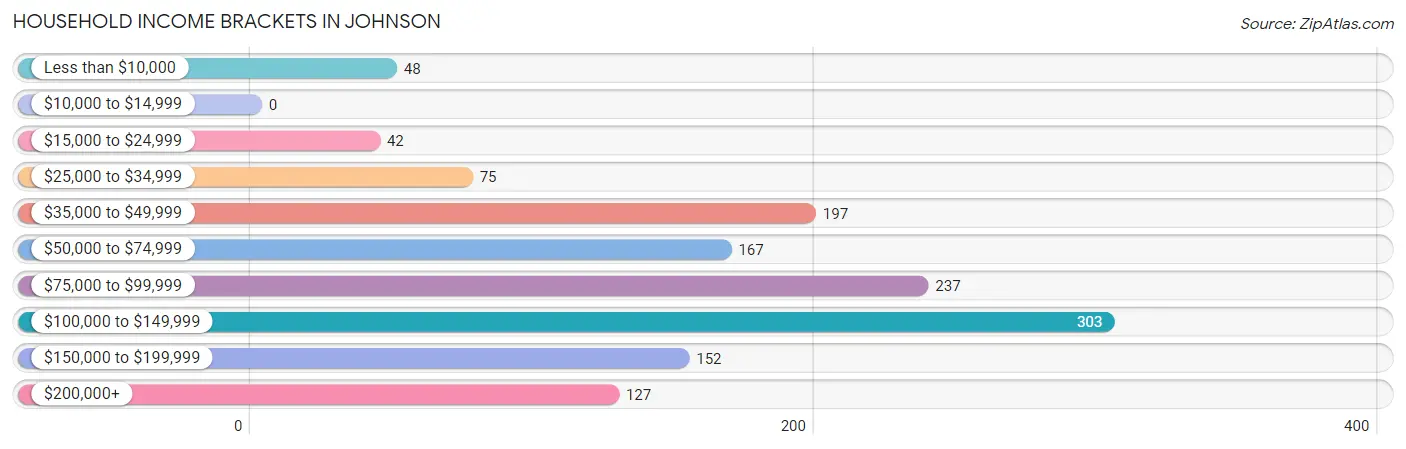
| Income Bracket | # Households | % Households |
| Less than $10,000 | 48 | 3.6% |
| $10,000 to $14,999 | 0 | 0.0% |
| $15,000 to $24,999 | 42 | 3.1% |
| $25,000 to $34,999 | 75 | 5.6% |
| $35,000 to $49,999 | 197 | 14.6% |
| $50,000 to $74,999 | 167 | 12.4% |
| $75,000 to $99,999 | 237 | 17.6% |
| $100,000 to $149,999 | 303 | 22.5% |
| $150,000 to $199,999 | 152 | 11.3% |
| $200,000+ | 127 | 9.4% |
Household Income by Householder Age in Johnson
The median household income in Johnson is $82,386, with the highest median household income of $108,667 found in the 45 to 64 years age bracket for the primary householder. A total of 494 households (36.7%) fall into this category. Meanwhile, the 65+ years age bracket for the primary householder has the lowest median household income of $42,419, with 194 households (14.4%) in this group.
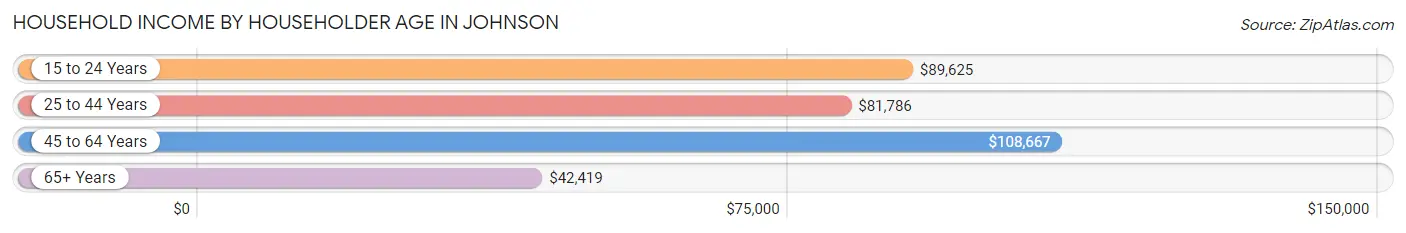
| Income Bracket | # Households | Median Income |
| 15 to 24 Years | 131 (9.7%) | $89,625 |
| 25 to 44 Years | 528 (39.2%) | $81,786 |
| 45 to 64 Years | 494 (36.7%) | $108,667 |
| 65+ Years | 194 (14.4%) | $42,419 |
| Total | 1,347 (100.0%) | $82,386 |
Poverty in Johnson
Income Below Poverty by Sex and Age in Johnson
With 1.4% poverty level for males and 1.5% for females among the residents of Johnson, 35 to 44 year old males and 55 to 64 year old females are the most vulnerable to poverty, with 21 males (9.0%) and 27 females (9.1%) in their respective age groups living below the poverty level.
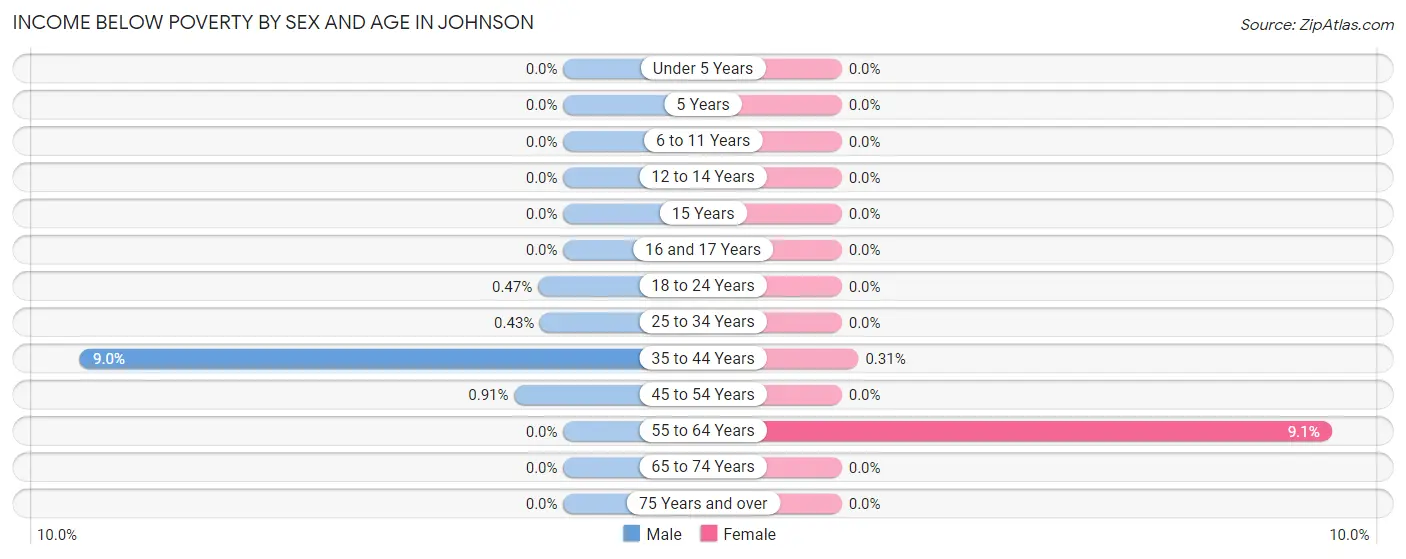
| Age Bracket | Male | Female |
| Under 5 Years | 0 (0.0%) | 0 (0.0%) |
| 5 Years | 0 (0.0%) | 0 (0.0%) |
| 6 to 11 Years | 0 (0.0%) | 0 (0.0%) |
| 12 to 14 Years | 0 (0.0%) | 0 (0.0%) |
| 15 Years | 0 (0.0%) | 0 (0.0%) |
| 16 and 17 Years | 0 (0.0%) | 0 (0.0%) |
| 18 to 24 Years | 1 (0.5%) | 0 (0.0%) |
| 25 to 34 Years | 1 (0.4%) | 0 (0.0%) |
| 35 to 44 Years | 21 (9.0%) | 1 (0.3%) |
| 45 to 54 Years | 1 (0.9%) | 0 (0.0%) |
| 55 to 64 Years | 0 (0.0%) | 27 (9.1%) |
| 65 to 74 Years | 0 (0.0%) | 0 (0.0%) |
| 75 Years and over | 0 (0.0%) | 0 (0.0%) |
| Total | 24 (1.4%) | 28 (1.5%) |
Income Above Poverty by Sex and Age in Johnson
According to the poverty statistics in Johnson, males aged under 5 years and females aged under 5 years are the age groups that are most secure financially, with 100.0% of males and 100.0% of females in these age groups living above the poverty line.
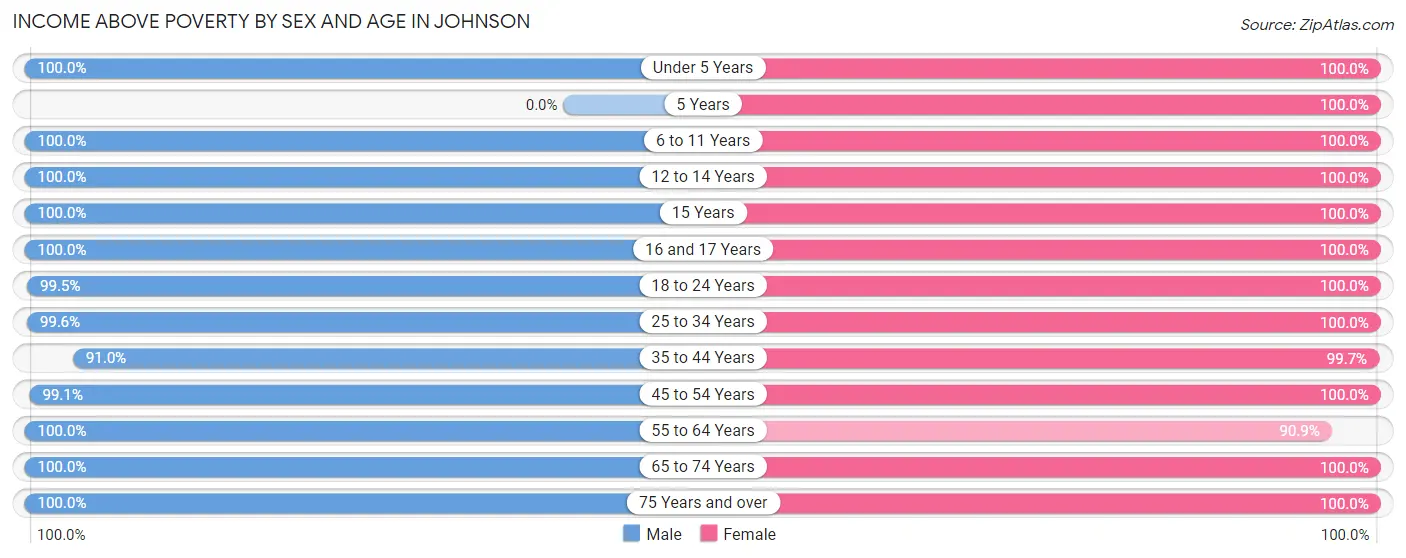
| Age Bracket | Male | Female |
| Under 5 Years | 225 (100.0%) | 52 (100.0%) |
| 5 Years | 0 (0.0%) | 56 (100.0%) |
| 6 to 11 Years | 185 (100.0%) | 235 (100.0%) |
| 12 to 14 Years | 81 (100.0%) | 73 (100.0%) |
| 15 Years | 9 (100.0%) | 47 (100.0%) |
| 16 and 17 Years | 45 (100.0%) | 24 (100.0%) |
| 18 to 24 Years | 213 (99.5%) | 88 (100.0%) |
| 25 to 34 Years | 229 (99.6%) | 376 (100.0%) |
| 35 to 44 Years | 213 (91.0%) | 326 (99.7%) |
| 45 to 54 Years | 109 (99.1%) | 191 (100.0%) |
| 55 to 64 Years | 244 (100.0%) | 270 (90.9%) |
| 65 to 74 Years | 56 (100.0%) | 84 (100.0%) |
| 75 Years and over | 50 (100.0%) | 72 (100.0%) |
| Total | 1,659 (98.6%) | 1,894 (98.5%) |
Income Below Poverty Among Married-Couple Families in Johnson
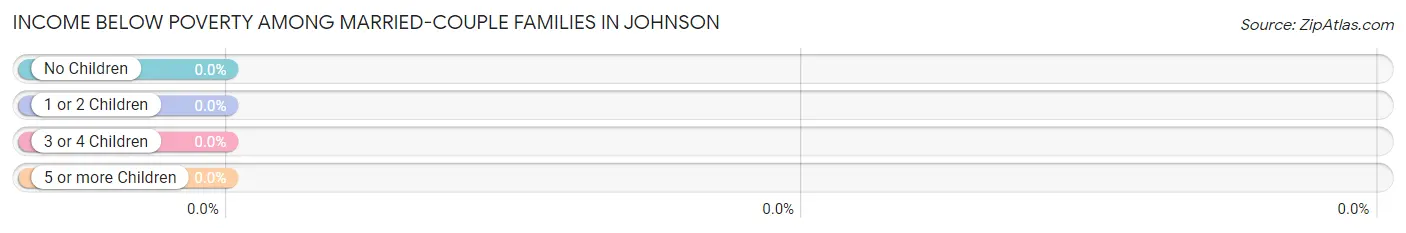
| Children | Above Poverty | Below Poverty |
| No Children | 336 (100.0%) | 0 (0.0%) |
| 1 or 2 Children | 191 (100.0%) | 0 (0.0%) |
| 3 or 4 Children | 114 (100.0%) | 0 (0.0%) |
| 5 or more Children | 0 (0.0%) | 0 (0.0%) |
| Total | 641 (100.0%) | 0 (0.0%) |
Income Below Poverty Among Single-Parent Households in Johnson
| Children | Single Father | Single Mother |
| No Children | 0 (0.0%) | 0 (0.0%) |
| 1 or 2 Children | 0 (0.0%) | 0 (0.0%) |
| 3 or 4 Children | 0 (0.0%) | 0 (0.0%) |
| 5 or more Children | 0 (0.0%) | 0 (0.0%) |
| Total | 0 (0.0%) | 0 (0.0%) |
Income Below Poverty Among Married-Couple vs Single-Parent Households in Johnson
| Children | Married-Couple Families | Single-Parent Households |
| No Children | 0 (0.0%) | 0 (0.0%) |
| 1 or 2 Children | 0 (0.0%) | 0 (0.0%) |
| 3 or 4 Children | 0 (0.0%) | 0 (0.0%) |
| 5 or more Children | 0 (0.0%) | 0 (0.0%) |
| Total | 0 (0.0%) | 0 (0.0%) |
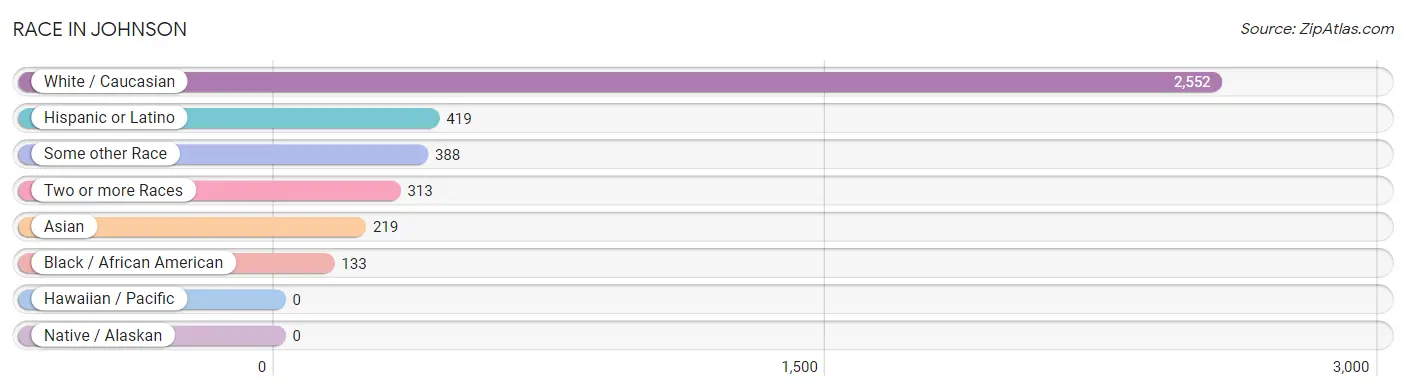
Race in Johnson
The most populous races in Johnson are White / Caucasian (2,552 | 70.8%), Hispanic or Latino (419 | 11.6%), and Some other Race (388 | 10.8%).
| Race | # Population | % Population |
| Asian | 219 | 6.1% |
| Black / African American | 133 | 3.7% |
| Hawaiian / Pacific | 0 | 0.0% |
| Hispanic or Latino | 419 | 11.6% |
| Native / Alaskan | 0 | 0.0% |
| White / Caucasian | 2,552 | 70.8% |
| Two or more Races | 313 | 8.7% |
| Some other Race | 388 | 10.8% |
| Total | 3,605 | 100.0% |
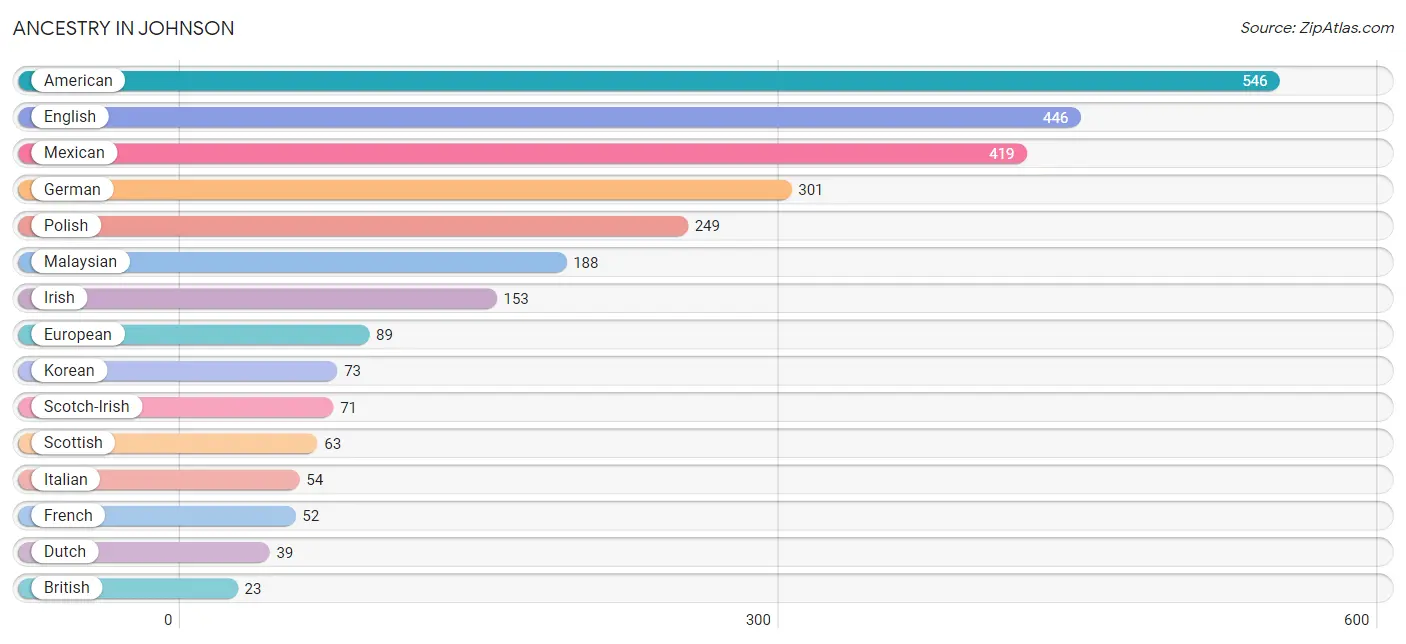
Ancestry in Johnson
The most populous ancestries reported in Johnson are American (546 | 15.1%), English (446 | 12.4%), Mexican (419 | 11.6%), German (301 | 8.4%), and Polish (249 | 6.9%), together accounting for 54.4% of all Johnson residents.
| Ancestry | # Population | % Population |
| American | 546 | 15.1% |
| British | 23 | 0.6% |
| Dutch | 39 | 1.1% |
| English | 446 | 12.4% |
| European | 89 | 2.5% |
| French | 52 | 1.4% |
| German | 301 | 8.4% |
| Indian (Asian) | 5 | 0.1% |
| Irish | 153 | 4.2% |
| Italian | 54 | 1.5% |
| Korean | 73 | 2.0% |
| Malaysian | 188 | 5.2% |
| Mexican | 419 | 11.6% |
| Norwegian | 8 | 0.2% |
| Polish | 249 | 6.9% |
| Russian | 14 | 0.4% |
| Scotch-Irish | 71 | 2.0% |
| Scottish | 63 | 1.8% |
| Swedish | 23 | 0.6% |
| Swiss | 15 | 0.4% |
| Welsh | 12 | 0.3% | View All 21 Rows |
Immigrants in Johnson
The most numerous immigrant groups reported in Johnson came from Central America (399 | 11.1%), Latin America (399 | 11.1%), Mexico (399 | 11.1%), Asia (60 | 1.7%), and South Eastern Asia (60 | 1.7%), together accounting for 36.5% of all Johnson residents.
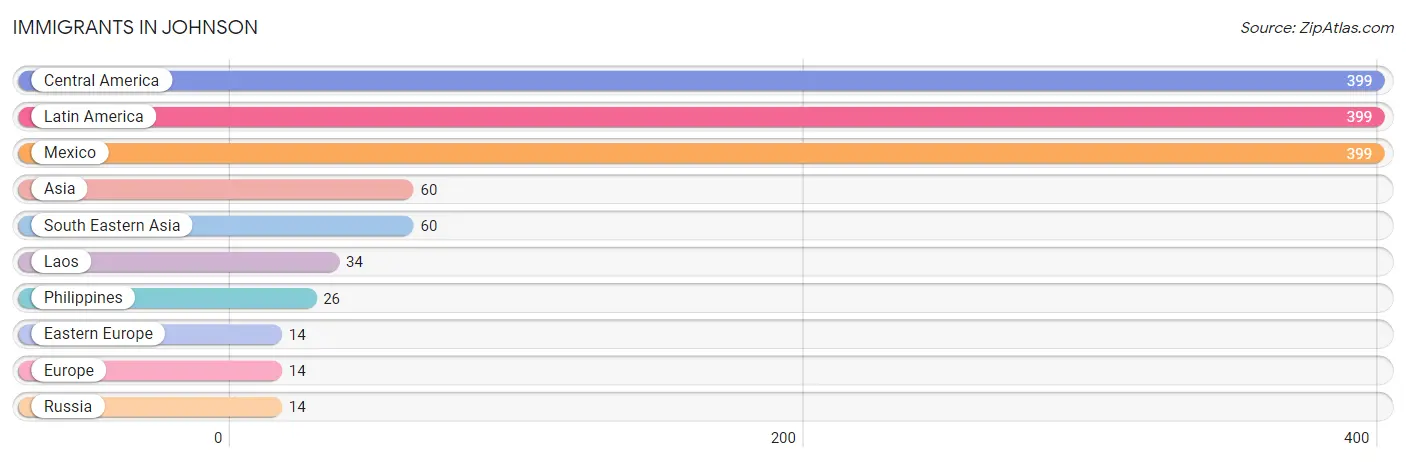
| Immigration Origin | # Population | % Population |
| Asia | 60 | 1.7% |
| Central America | 399 | 11.1% |
| Eastern Europe | 14 | 0.4% |
| Europe | 14 | 0.4% |
| Laos | 34 | 0.9% |
| Latin America | 399 | 11.1% |
| Mexico | 399 | 11.1% |
| Philippines | 26 | 0.7% |
| Russia | 14 | 0.4% |
| South Eastern Asia | 60 | 1.7% | View All 10 Rows |
Sex and Age in Johnson
Sex and Age in Johnson
The most populous age groups in Johnson are Under 5 Years (225 | 13.4%) for men and 5 to 9 Years (269 | 14.0%) for women.
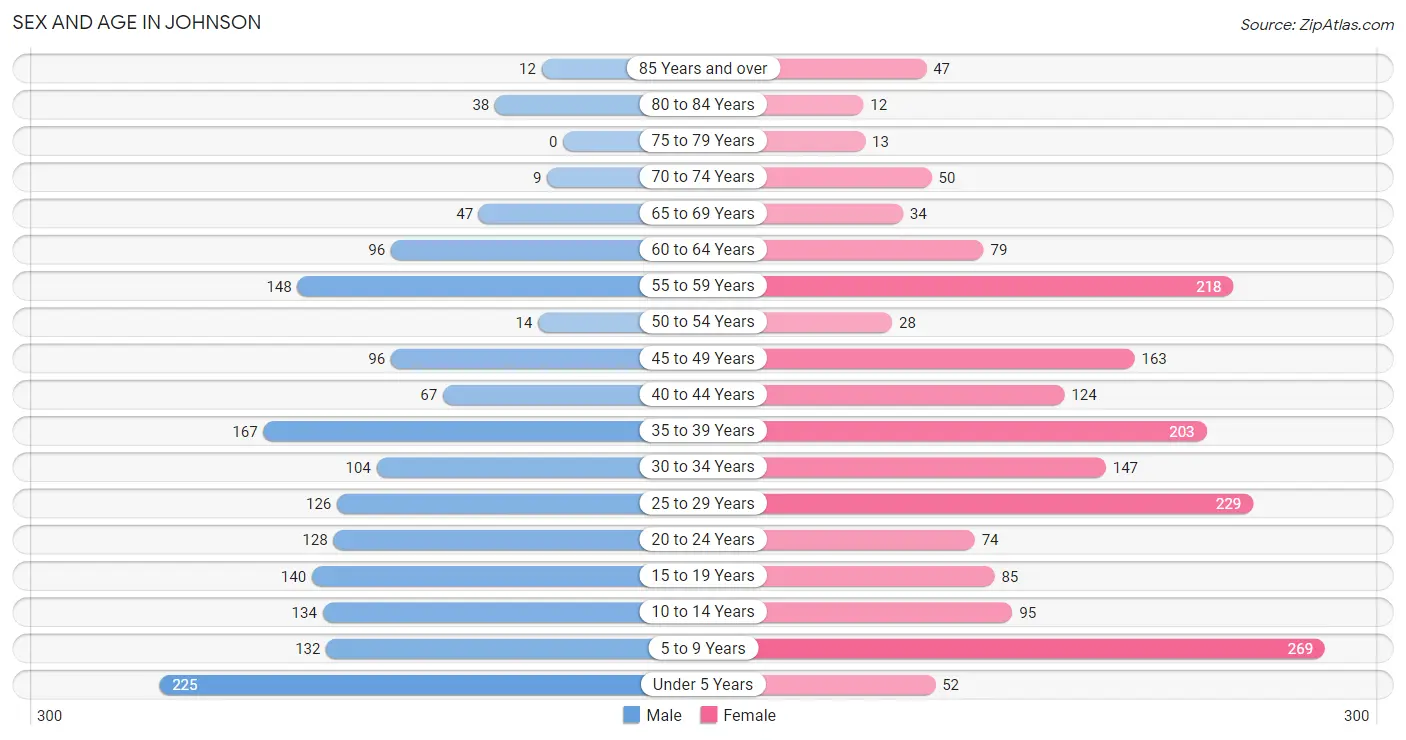
| Age Bracket | Male | Female |
| Under 5 Years | 225 (13.4%) | 52 (2.7%) |
| 5 to 9 Years | 132 (7.8%) | 269 (14.0%) |
| 10 to 14 Years | 134 (8.0%) | 95 (4.9%) |
| 15 to 19 Years | 140 (8.3%) | 85 (4.4%) |
| 20 to 24 Years | 128 (7.6%) | 74 (3.8%) |
| 25 to 29 Years | 126 (7.5%) | 229 (11.9%) |
| 30 to 34 Years | 104 (6.2%) | 147 (7.6%) |
| 35 to 39 Years | 167 (9.9%) | 203 (10.6%) |
| 40 to 44 Years | 67 (4.0%) | 124 (6.5%) |
| 45 to 49 Years | 96 (5.7%) | 163 (8.5%) |
| 50 to 54 Years | 14 (0.8%) | 28 (1.5%) |
| 55 to 59 Years | 148 (8.8%) | 218 (11.3%) |
| 60 to 64 Years | 96 (5.7%) | 79 (4.1%) |
| 65 to 69 Years | 47 (2.8%) | 34 (1.8%) |
| 70 to 74 Years | 9 (0.5%) | 50 (2.6%) |
| 75 to 79 Years | 0 (0.0%) | 13 (0.7%) |
| 80 to 84 Years | 38 (2.3%) | 12 (0.6%) |
| 85 Years and over | 12 (0.7%) | 47 (2.5%) |
| Total | 1,683 (100.0%) | 1,922 (100.0%) |
Families and Households in Johnson
Median Family Size in Johnson
The median family size in Johnson is 3.50 persons per family, with married-couple families (641 | 73.7%) accounting for the largest median family size of 3.72 persons per family. On the other hand, single male/father families (46 | 5.3%) represent the smallest median family size with 2.65 persons per family.
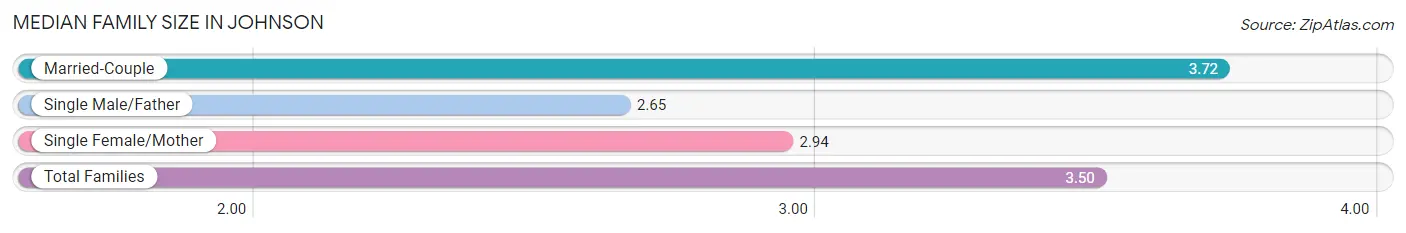
| Family Type | # Families | Family Size |
| Married-Couple | 641 (73.7%) | 3.72 |
| Single Male/Father | 46 (5.3%) | 2.65 |
| Single Female/Mother | 183 (21.0%) | 2.94 |
| Total Families | 870 (100.0%) | 3.50 |
Median Household Size in Johnson
The median household size in Johnson is 2.67 persons per household, with married-couple households (641 | 47.6%) accounting for the largest median household size of 3.72 persons per household. non-family households (477 | 35.4%) represent the smallest median household size with 1.08 persons per household.
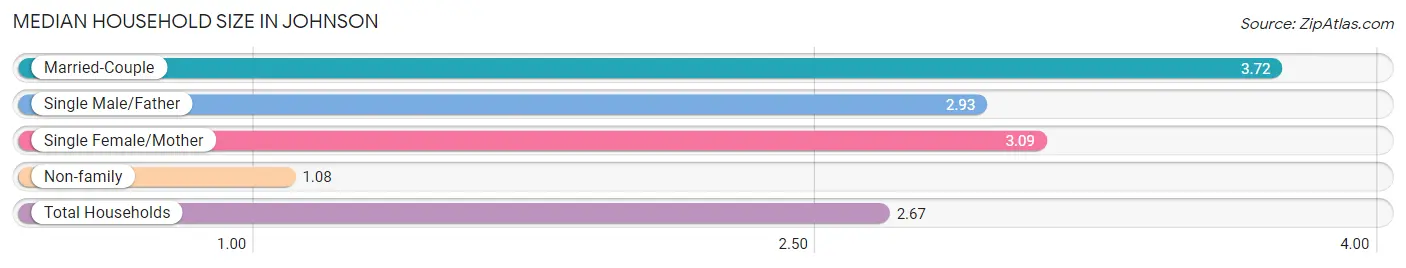
| Household Type | # Households | Household Size |
| Married-Couple | 641 (47.6%) | 3.72 |
| Single Male/Father | 46 (3.4%) | 2.93 |
| Single Female/Mother | 183 (13.6%) | 3.09 |
| Non-family | 477 (35.4%) | 1.08 |
| Total Households | 1,347 (100.0%) | 2.67 |
Household Size by Marriage Status in Johnson
Out of a total of 1,347 households in Johnson, 870 (64.6%) are family households, while 477 (35.4%) are nonfamily households. The most numerous type of family households are 2-person households, comprising 436, and the most common type of nonfamily households are 1-person households, comprising 436.
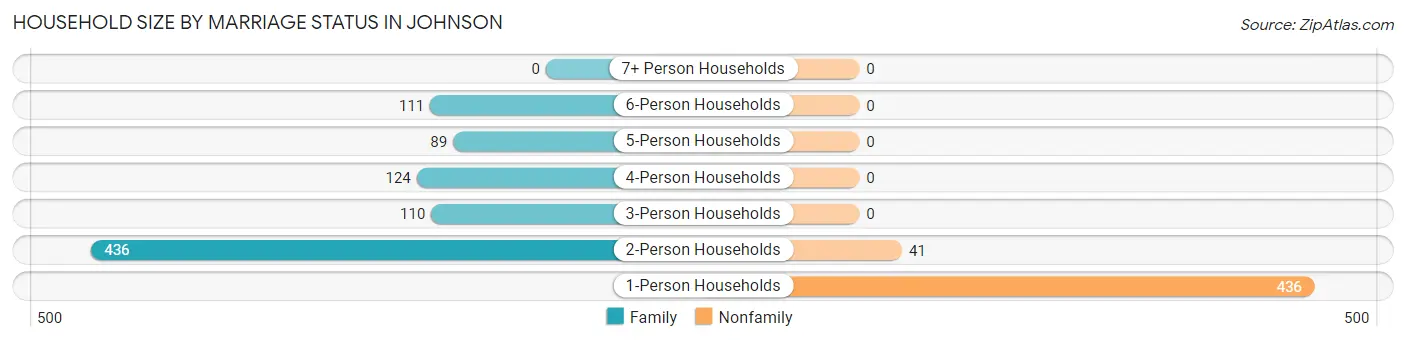
| Household Size | Family Households | Nonfamily Households |
| 1-Person Households | - | 436 (32.4%) |
| 2-Person Households | 436 (32.4%) | 41 (3.0%) |
| 3-Person Households | 110 (8.2%) | 0 (0.0%) |
| 4-Person Households | 124 (9.2%) | 0 (0.0%) |
| 5-Person Households | 89 (6.6%) | 0 (0.0%) |
| 6-Person Households | 111 (8.2%) | 0 (0.0%) |
| 7+ Person Households | 0 (0.0%) | 0 (0.0%) |
| Total | 870 (64.6%) | 477 (35.4%) |
Female Fertility in Johnson
Fertility by Age in Johnson
Average fertility rate in Johnson is 88.0 births per 1,000 women. Women in the age bracket of 20 to 34 years have the highest fertility rate with 200.0 births per 1,000 women. Women in the age bracket of 20 to 34 years acount for 100.0% of all women with births.
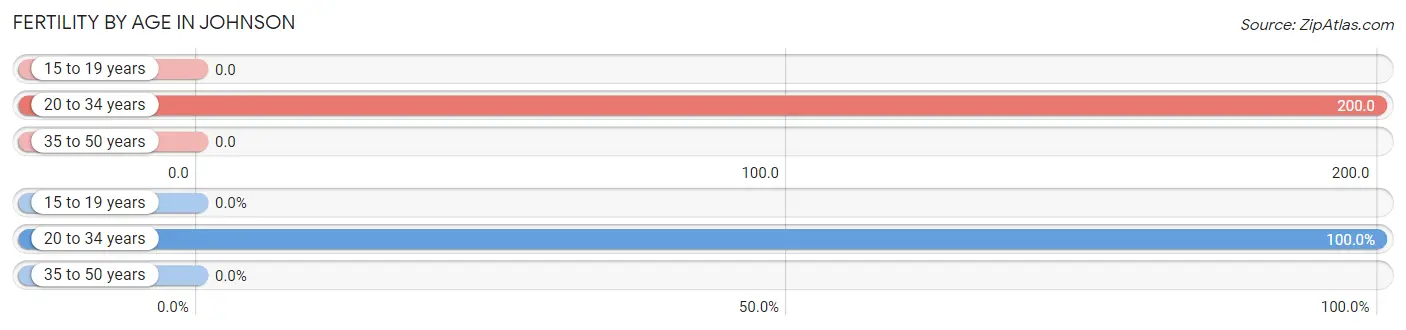
| Age Bracket | Women with Births | Births / 1,000 Women |
| 15 to 19 years | 0 (0.0%) | 0.0 |
| 20 to 34 years | 90 (100.0%) | 200.0 |
| 35 to 50 years | 0 (0.0%) | 0.0 |
| Total | 90 (100.0%) | 88.0 |
Fertility by Age by Marriage Status in Johnson
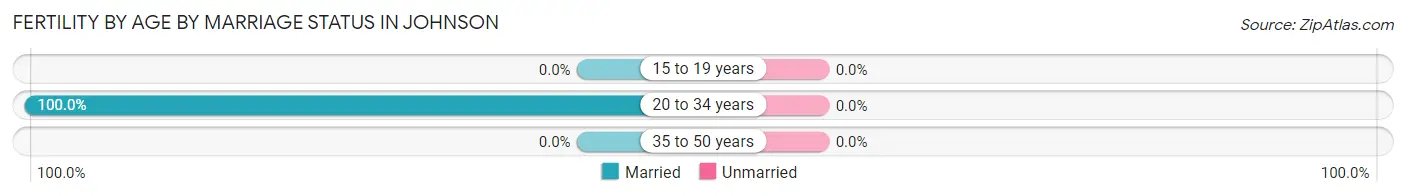
| Age Bracket | Married | Unmarried |
| 15 to 19 years | 0 (0.0%) | 0 (0.0%) |
| 20 to 34 years | 90 (100.0%) | 0 (0.0%) |
| 35 to 50 years | 0 (0.0%) | 0 (0.0%) |
| Total | 90 (100.0%) | 0 (0.0%) |
Fertility by Education in Johnson
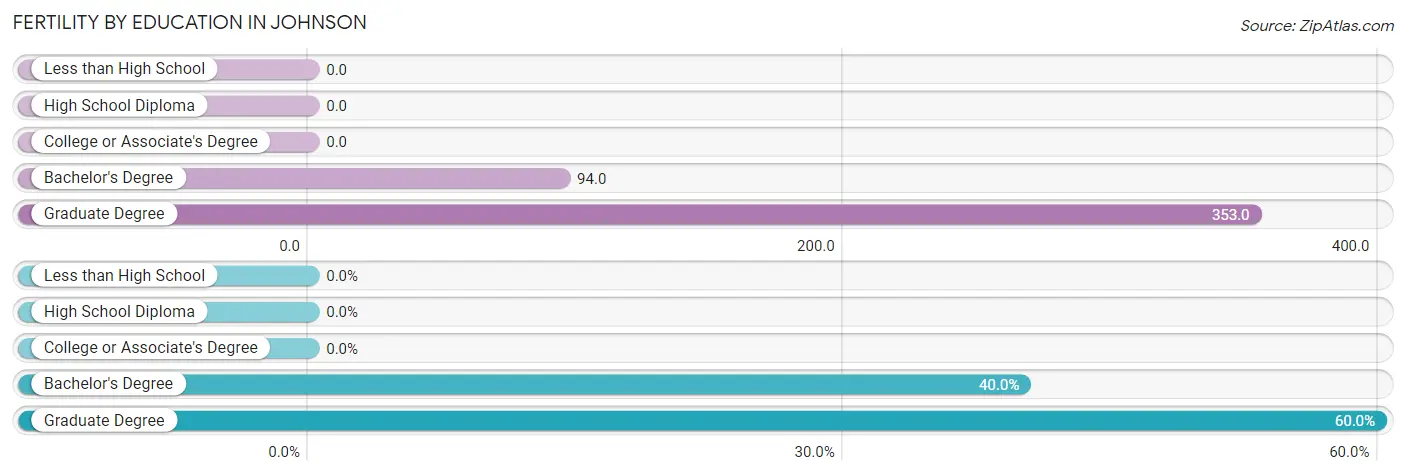
| Educational Attainment | Women with Births | Births / 1,000 Women |
| Less than High School | 0 (0.0%) | 0.0 |
| High School Diploma | 0 (0.0%) | 0.0 |
| College or Associate's Degree | 0 (0.0%) | 0.0 |
| Bachelor's Degree | 36 (40.0%) | 94.0 |
| Graduate Degree | 54 (60.0%) | 353.0 |
| Total | 90 (100.0%) | 88.0 |
Fertility by Education by Marriage Status in Johnson
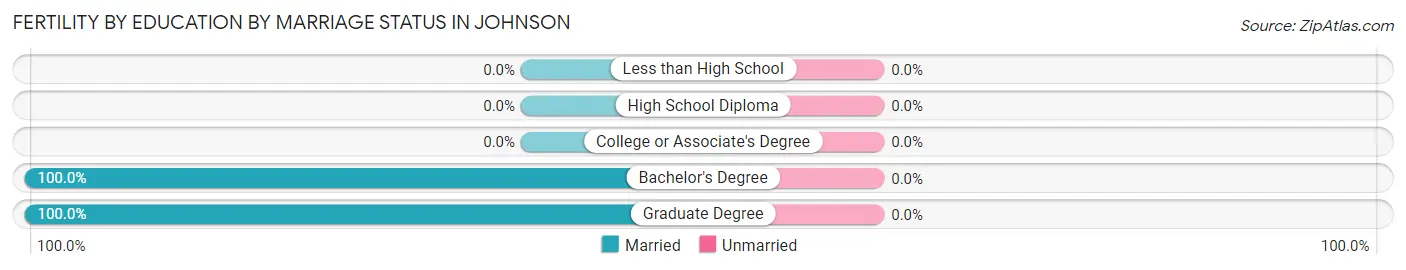
| Educational Attainment | Married | Unmarried |
| Less than High School | 0 (0.0%) | 0 (0.0%) |
| High School Diploma | 0 (0.0%) | 0 (0.0%) |
| College or Associate's Degree | 0 (0.0%) | 0 (0.0%) |
| Bachelor's Degree | 36 (100.0%) | 0 (0.0%) |
| Graduate Degree | 54 (100.0%) | 0 (0.0%) |
| Total | 90 (100.0%) | 0 (0.0%) |
Employment Characteristics in Johnson
Employment by Class of Employer in Johnson
Among the 1,788 employed individuals in Johnson, private company employees (909 | 50.8%), local government employees (297 | 16.6%), and self-employed (not incorporated) (293 | 16.4%) make up the most common classes of employment.
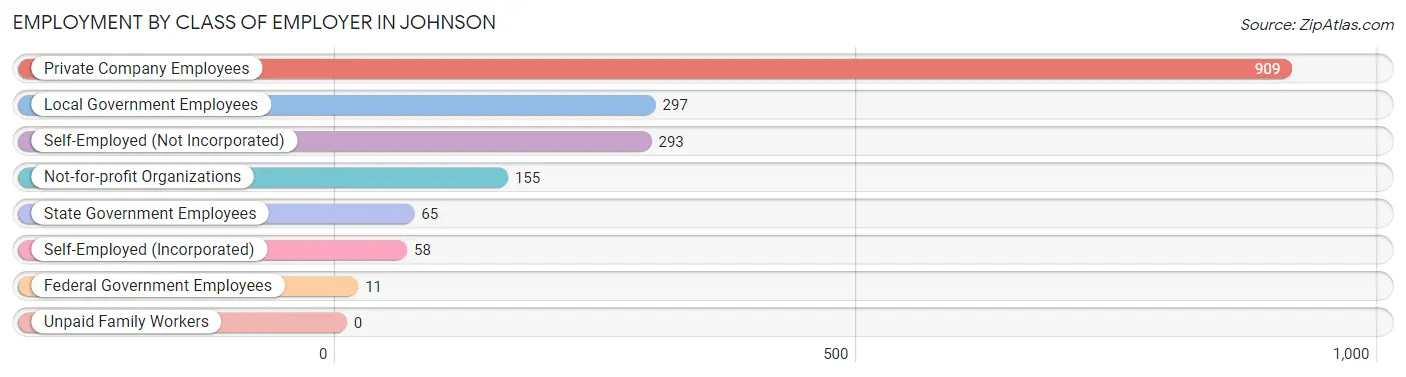
| Employer Class | # Employees | % Employees |
| Private Company Employees | 909 | 50.8% |
| Self-Employed (Incorporated) | 58 | 3.2% |
| Self-Employed (Not Incorporated) | 293 | 16.4% |
| Not-for-profit Organizations | 155 | 8.7% |
| Local Government Employees | 297 | 16.6% |
| State Government Employees | 65 | 3.6% |
| Federal Government Employees | 11 | 0.6% |
| Unpaid Family Workers | 0 | 0.0% |
| Total | 1,788 | 100.0% |
Employment Status by Age in Johnson
According to the labor force statistics for Johnson, out of the total population over 16 years of age (2,642), 69.8% or 1,844 individuals are in the labor force, with 1.0% or 18 of them unemployed. The age group with the highest labor force participation rate is 25 to 29 years, with 100.0% or 355 individuals in the labor force. Within the labor force, the 25 to 29 years age range has the highest percentage of unemployed individuals, with 5.1% or 18 of them being unemployed.
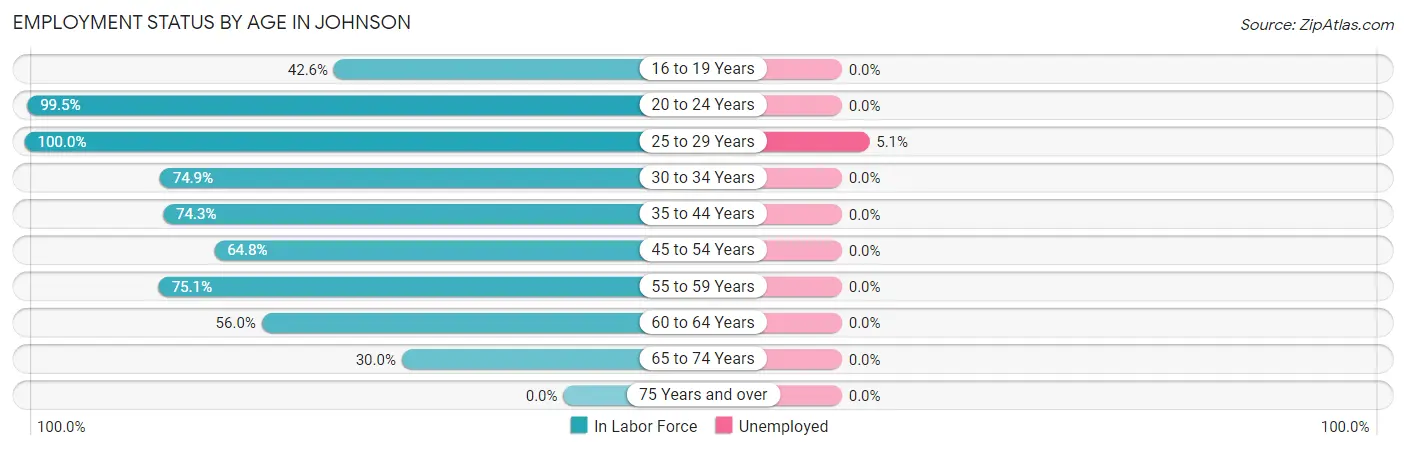
| Age Bracket | In Labor Force | Unemployed |
| 16 to 19 Years | 72 (42.6%) | 0 (0.0%) |
| 20 to 24 Years | 201 (99.5%) | 0 (0.0%) |
| 25 to 29 Years | 355 (100.0%) | 18 (5.1%) |
| 30 to 34 Years | 188 (74.9%) | 0 (0.0%) |
| 35 to 44 Years | 417 (74.3%) | 0 (0.0%) |
| 45 to 54 Years | 195 (64.8%) | 0 (0.0%) |
| 55 to 59 Years | 275 (75.1%) | 0 (0.0%) |
| 60 to 64 Years | 98 (56.0%) | 0 (0.0%) |
| 65 to 74 Years | 42 (30.0%) | 0 (0.0%) |
| 75 Years and over | 0 (0.0%) | 0 (0.0%) |
| Total | 1,844 (69.8%) | 18 (1.0%) |
Employment Status by Educational Attainment in Johnson
According to labor force statistics for Johnson, 76.1% of individuals (1,529) out of the total population between 25 and 64 years of age (2,009) are in the labor force, with 1.2% or 18 of them being unemployed. The group with the highest labor force participation rate are those with the educational attainment of high school diploma, with 92.8% or 361 individuals in the labor force. Within the labor force, individuals with bachelor's degree or higher education have the highest percentage of unemployment, with 2.3% or 18 of them being unemployed.
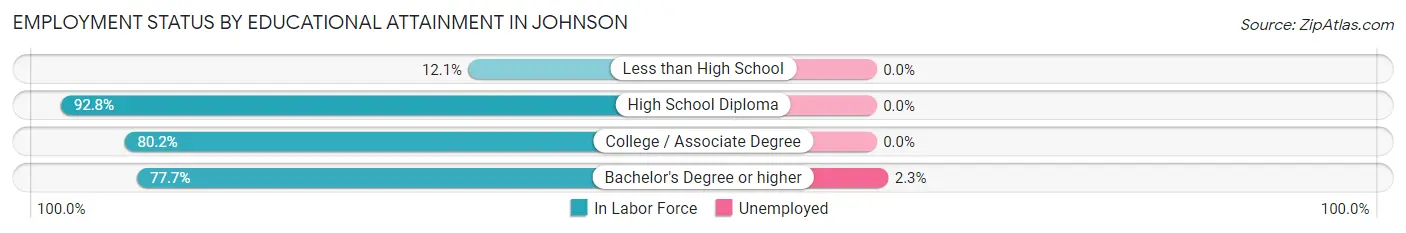
| Educational Attainment | In Labor Force | Unemployed |
| Less than High School | 19 (12.1%) | 0 (0.0%) |
| High School Diploma | 361 (92.8%) | 0 (0.0%) |
| College / Associate Degree | 364 (80.2%) | 0 (0.0%) |
| Bachelor's Degree or higher | 784 (77.7%) | 23 (2.3%) |
| Total | 1,529 (76.1%) | 24 (1.2%) |
Employment Occupations by Sex in Johnson
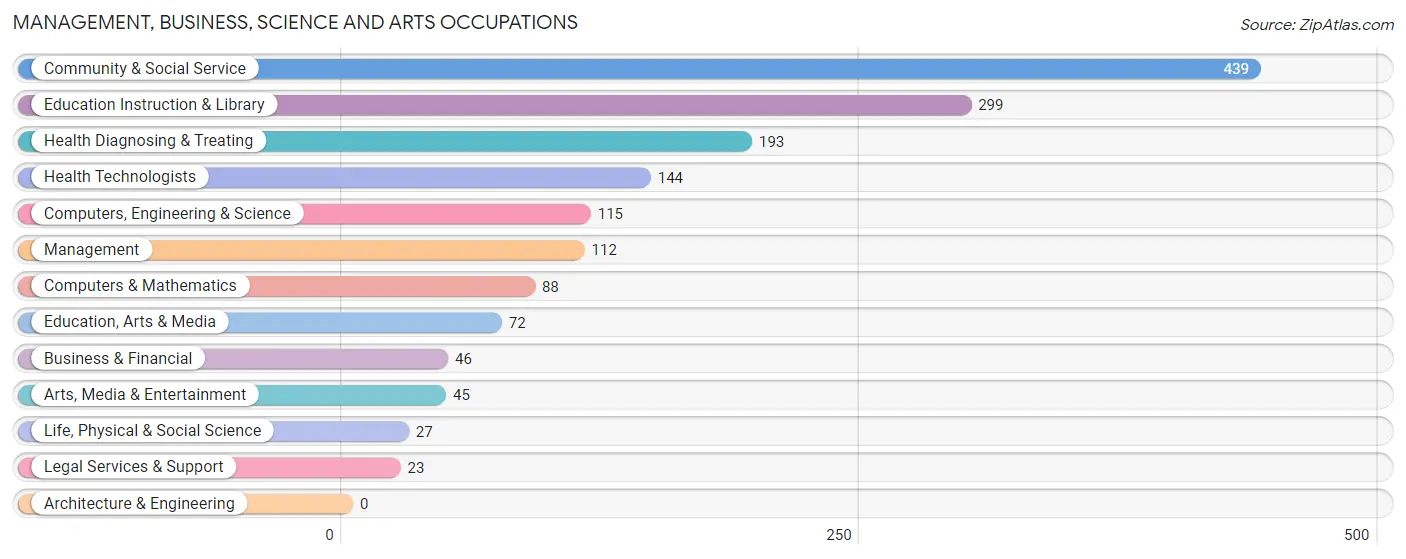
Management, Business, Science and Arts Occupations
The most common Management, Business, Science and Arts occupations in Johnson are Community & Social Service (439 | 24.0%), Education Instruction & Library (299 | 16.4%), Health Diagnosing & Treating (193 | 10.6%), Health Technologists (144 | 7.9%), and Computers, Engineering & Science (115 | 6.3%).
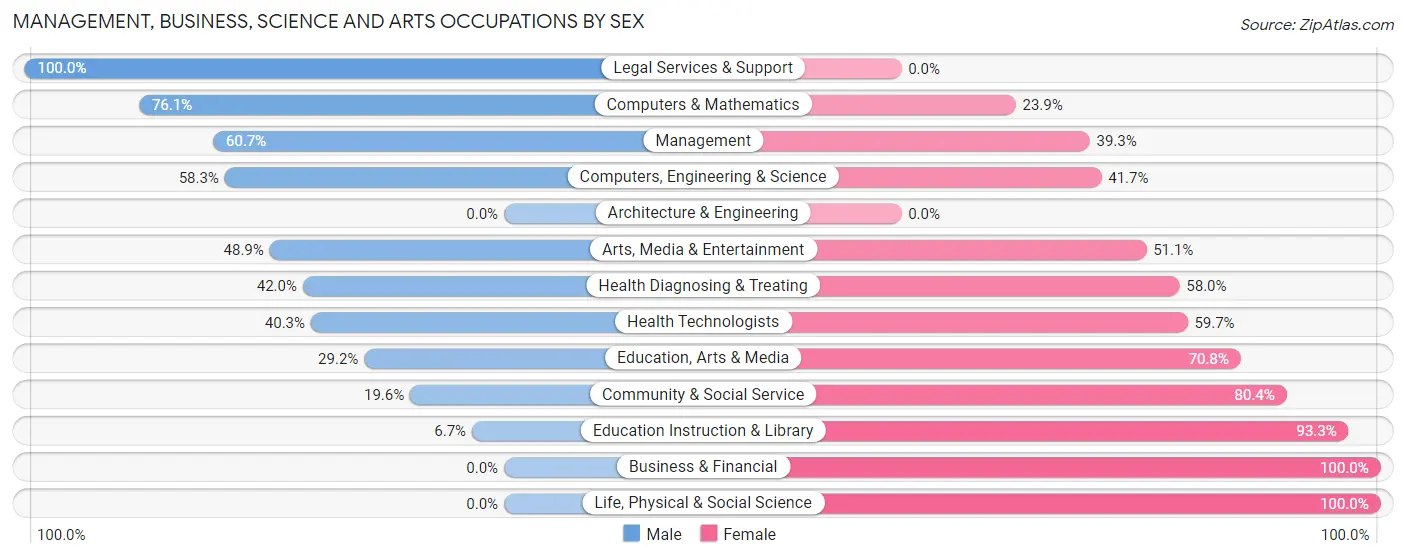
Management, Business, Science and Arts Occupations by Sex
Within the Management, Business, Science and Arts occupations in Johnson, the most male-oriented occupations are Legal Services & Support (100.0%), Computers & Mathematics (76.1%), and Management (60.7%), while the most female-oriented occupations are Business & Financial (100.0%), Life, Physical & Social Science (100.0%), and Education Instruction & Library (93.3%).
| Occupation | Male | Female |
| Management | 68 (60.7%) | 44 (39.3%) |
| Business & Financial | 0 (0.0%) | 46 (100.0%) |
| Computers, Engineering & Science | 67 (58.3%) | 48 (41.7%) |
| Computers & Mathematics | 67 (76.1%) | 21 (23.9%) |
| Architecture & Engineering | 0 (0.0%) | 0 (0.0%) |
| Life, Physical & Social Science | 0 (0.0%) | 27 (100.0%) |
| Community & Social Service | 86 (19.6%) | 353 (80.4%) |
| Education, Arts & Media | 21 (29.2%) | 51 (70.8%) |
| Legal Services & Support | 23 (100.0%) | 0 (0.0%) |
| Education Instruction & Library | 20 (6.7%) | 279 (93.3%) |
| Arts, Media & Entertainment | 22 (48.9%) | 23 (51.1%) |
| Health Diagnosing & Treating | 81 (42.0%) | 112 (58.0%) |
| Health Technologists | 58 (40.3%) | 86 (59.7%) |
| Total (Category) | 302 (33.4%) | 603 (66.6%) |
| Total (Overall) | 802 (44.0%) | 1,023 (56.0%) |
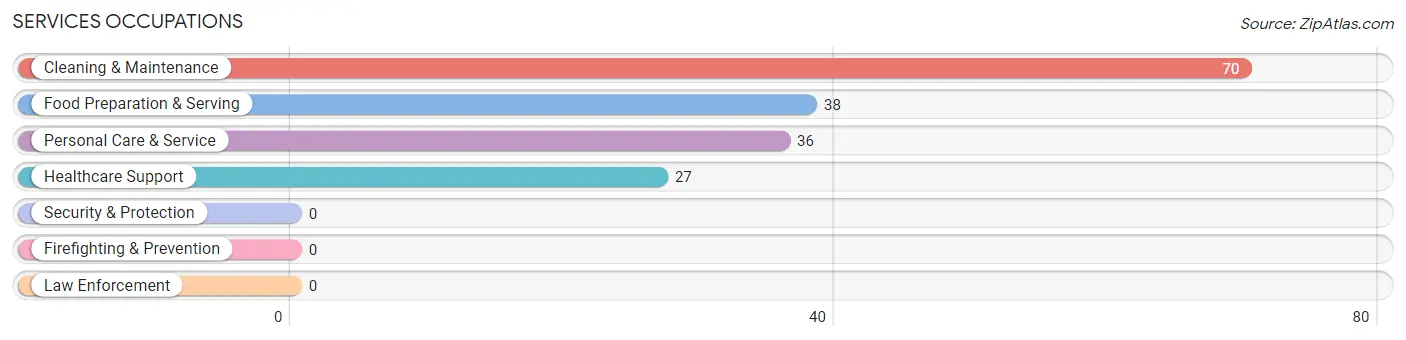
Services Occupations
The most common Services occupations in Johnson are Cleaning & Maintenance (70 | 3.8%), Food Preparation & Serving (38 | 2.1%), Personal Care & Service (36 | 2.0%), and Healthcare Support (27 | 1.5%).
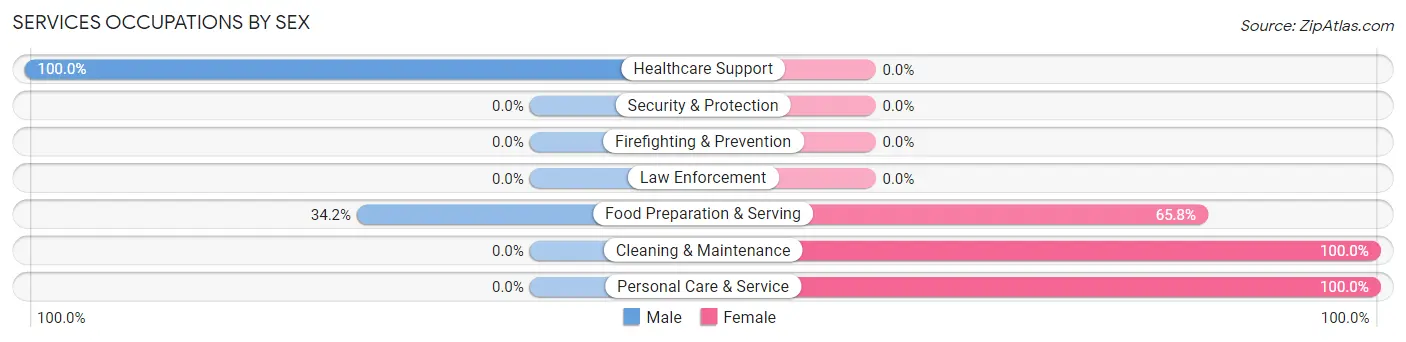
Services Occupations by Sex
Within the Services occupations in Johnson, the most male-oriented occupations are Healthcare Support (100.0%), and Food Preparation & Serving (34.2%), while the most female-oriented occupations are Cleaning & Maintenance (100.0%), Personal Care & Service (100.0%), and Food Preparation & Serving (65.8%).
| Occupation | Male | Female |
| Healthcare Support | 27 (100.0%) | 0 (0.0%) |
| Security & Protection | 0 (0.0%) | 0 (0.0%) |
| Firefighting & Prevention | 0 (0.0%) | 0 (0.0%) |
| Law Enforcement | 0 (0.0%) | 0 (0.0%) |
| Food Preparation & Serving | 13 (34.2%) | 25 (65.8%) |
| Cleaning & Maintenance | 0 (0.0%) | 70 (100.0%) |
| Personal Care & Service | 0 (0.0%) | 36 (100.0%) |
| Total (Category) | 40 (23.4%) | 131 (76.6%) |
| Total (Overall) | 802 (44.0%) | 1,023 (56.0%) |
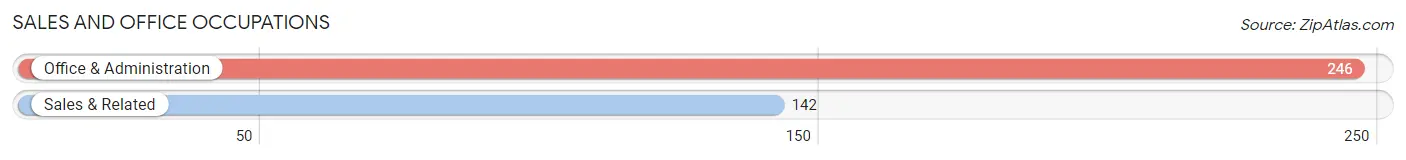
Sales and Office Occupations
The most common Sales and Office occupations in Johnson are Office & Administration (246 | 13.5%), and Sales & Related (142 | 7.8%).
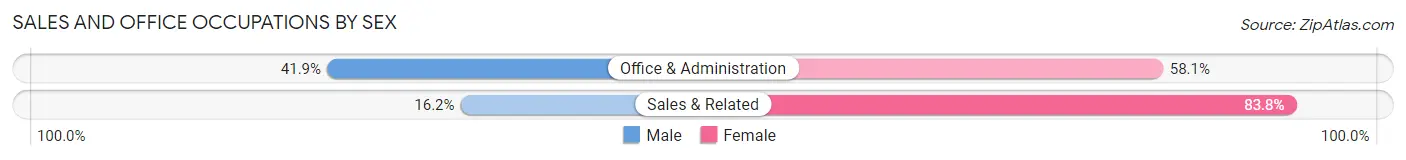
Sales and Office Occupations by Sex
| Occupation | Male | Female |
| Sales & Related | 23 (16.2%) | 119 (83.8%) |
| Office & Administration | 103 (41.9%) | 143 (58.1%) |
| Total (Category) | 126 (32.5%) | 262 (67.5%) |
| Total (Overall) | 802 (44.0%) | 1,023 (56.0%) |
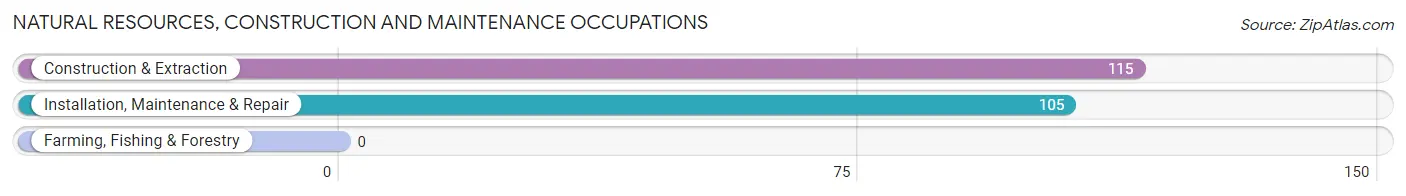
Natural Resources, Construction and Maintenance Occupations
The most common Natural Resources, Construction and Maintenance occupations in Johnson are Construction & Extraction (115 | 6.3%), and Installation, Maintenance & Repair (105 | 5.8%).
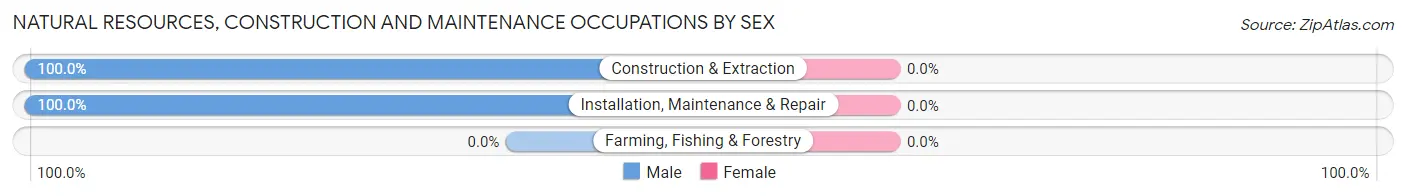
Natural Resources, Construction and Maintenance Occupations by Sex
| Occupation | Male | Female |
| Farming, Fishing & Forestry | 0 (0.0%) | 0 (0.0%) |
| Construction & Extraction | 115 (100.0%) | 0 (0.0%) |
| Installation, Maintenance & Repair | 105 (100.0%) | 0 (0.0%) |
| Total (Category) | 220 (100.0%) | 0 (0.0%) |
| Total (Overall) | 802 (44.0%) | 1,023 (56.0%) |
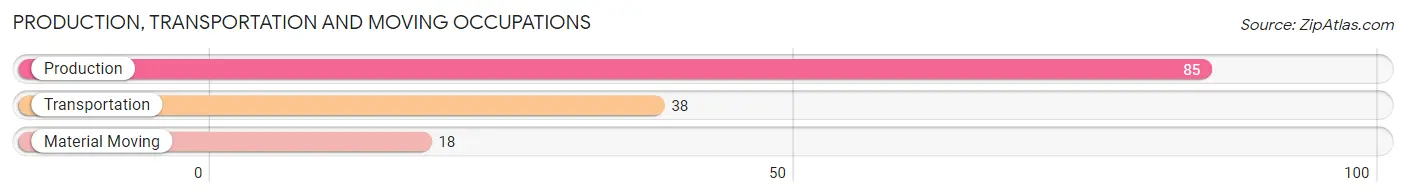
Production, Transportation and Moving Occupations
The most common Production, Transportation and Moving occupations in Johnson are Production (85 | 4.7%), Transportation (38 | 2.1%), and Material Moving (18 | 1.0%).
Production, Transportation and Moving Occupations by Sex
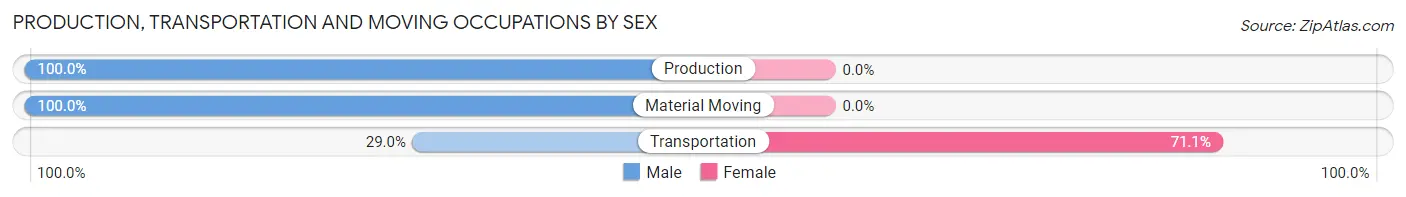
| Occupation | Male | Female |
| Production | 85 (100.0%) | 0 (0.0%) |
| Transportation | 11 (28.9%) | 27 (71.1%) |
| Material Moving | 18 (100.0%) | 0 (0.0%) |
| Total (Category) | 114 (80.8%) | 27 (19.2%) |
| Total (Overall) | 802 (44.0%) | 1,023 (56.0%) |
Employment Industries by Sex in Johnson
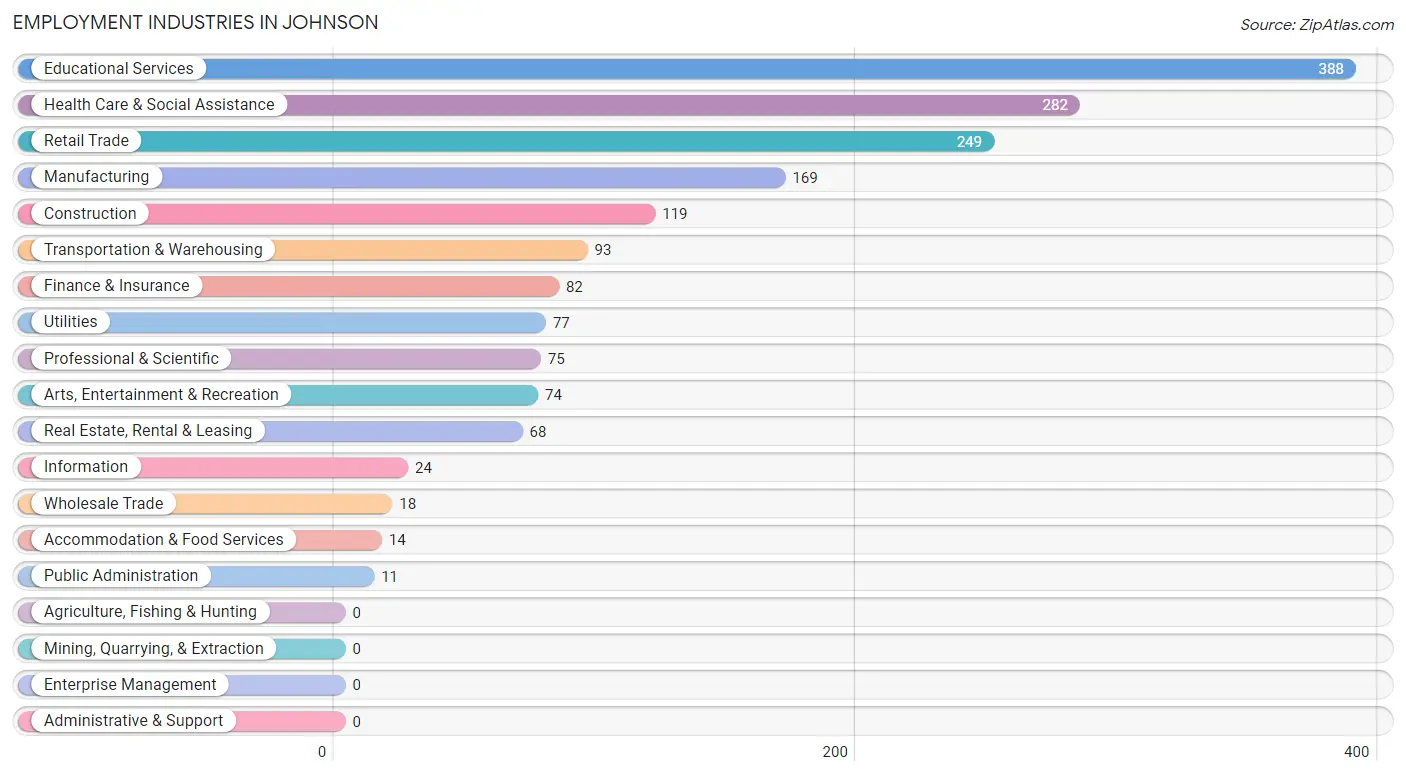
Employment Industries in Johnson
The major employment industries in Johnson include Educational Services (388 | 21.3%), Health Care & Social Assistance (282 | 15.4%), Retail Trade (249 | 13.6%), Manufacturing (169 | 9.3%), and Construction (119 | 6.5%).
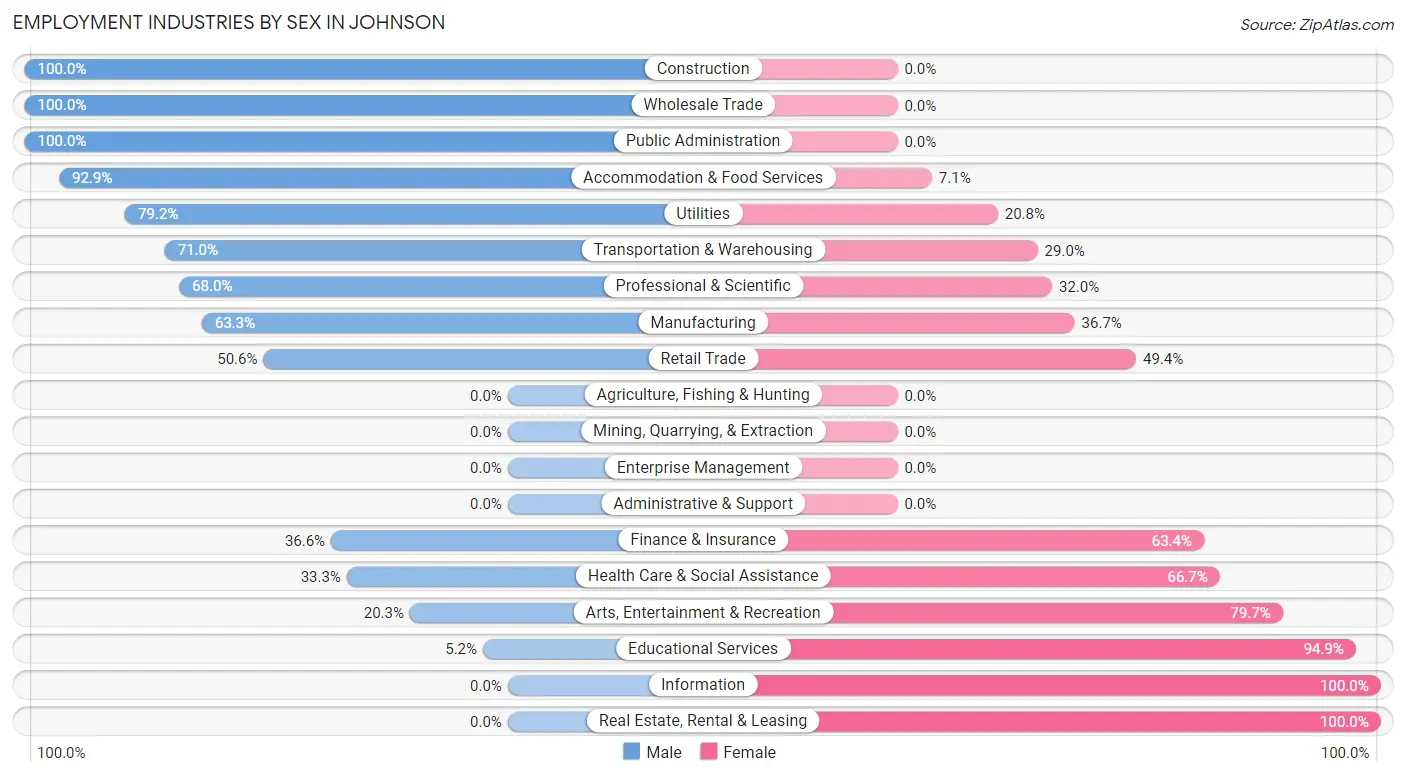
Employment Industries by Sex in Johnson
The Johnson industries that see more men than women are Construction (100.0%), Wholesale Trade (100.0%), and Public Administration (100.0%), whereas the industries that tend to have a higher number of women are Information (100.0%), Real Estate, Rental & Leasing (100.0%), and Educational Services (94.9%).
| Industry | Male | Female |
| Agriculture, Fishing & Hunting | 0 (0.0%) | 0 (0.0%) |
| Mining, Quarrying, & Extraction | 0 (0.0%) | 0 (0.0%) |
| Construction | 119 (100.0%) | 0 (0.0%) |
| Manufacturing | 107 (63.3%) | 62 (36.7%) |
| Wholesale Trade | 18 (100.0%) | 0 (0.0%) |
| Retail Trade | 126 (50.6%) | 123 (49.4%) |
| Transportation & Warehousing | 66 (71.0%) | 27 (29.0%) |
| Utilities | 61 (79.2%) | 16 (20.8%) |
| Information | 0 (0.0%) | 24 (100.0%) |
| Finance & Insurance | 30 (36.6%) | 52 (63.4%) |
| Real Estate, Rental & Leasing | 0 (0.0%) | 68 (100.0%) |
| Professional & Scientific | 51 (68.0%) | 24 (32.0%) |
| Enterprise Management | 0 (0.0%) | 0 (0.0%) |
| Administrative & Support | 0 (0.0%) | 0 (0.0%) |
| Educational Services | 20 (5.1%) | 368 (94.9%) |
| Health Care & Social Assistance | 94 (33.3%) | 188 (66.7%) |
| Arts, Entertainment & Recreation | 15 (20.3%) | 59 (79.7%) |
| Accommodation & Food Services | 13 (92.9%) | 1 (7.1%) |
| Public Administration | 11 (100.0%) | 0 (0.0%) |
| Total | 802 (44.0%) | 1,023 (56.0%) |
Education in Johnson
School Enrollment in Johnson
The most common levels of schooling among the 914 students in Johnson are elementary school (321 | 35.1%), middle school (283 | 31.0%), and high school (151 | 16.5%).
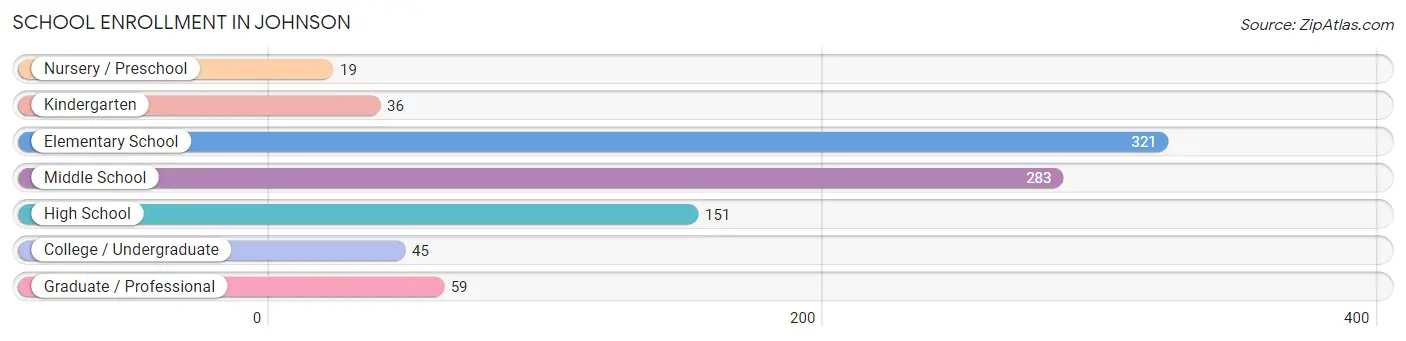
| School Level | # Students | % Students |
| Nursery / Preschool | 19 | 2.1% |
| Kindergarten | 36 | 3.9% |
| Elementary School | 321 | 35.1% |
| Middle School | 283 | 31.0% |
| High School | 151 | 16.5% |
| College / Undergraduate | 45 | 4.9% |
| Graduate / Professional | 59 | 6.5% |
| Total | 914 | 100.0% |
School Enrollment by Age by Funding Source in Johnson
Out of a total of 914 students who are enrolled in schools in Johnson, 202 (22.1%) attend a private institution, while the remaining 712 (77.9%) are enrolled in public schools. The age group of 20 to 24 year olds has the highest likelihood of being enrolled in private schools, with 19 (100.0% in the age bracket) enrolled. Conversely, the age group of 3 to 4 year olds has the lowest likelihood of being enrolled in a private school, with 19 (100.0% in the age bracket) attending a public institution.
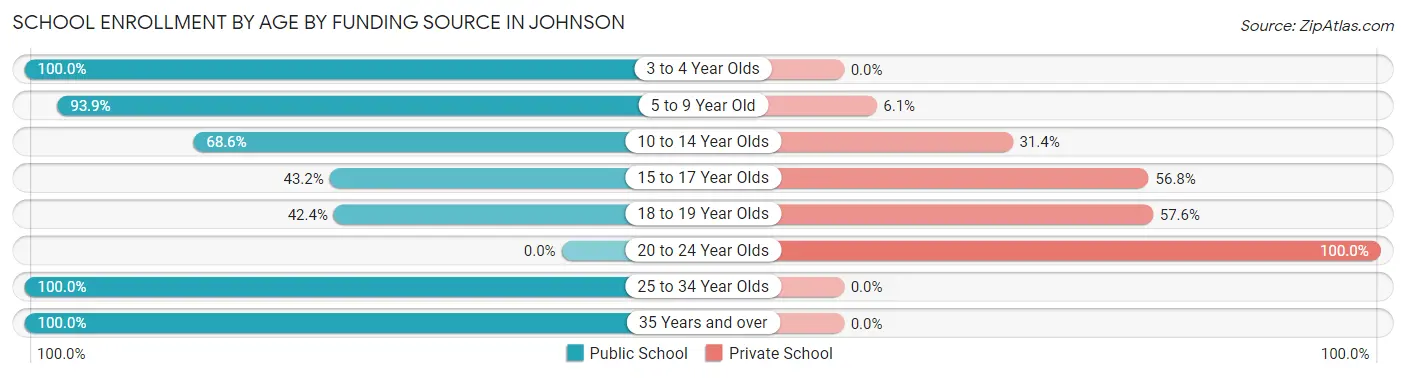
| Age Bracket | Public School | Private School |
| 3 to 4 Year Olds | 19 (100.0%) | 0 (0.0%) |
| 5 to 9 Year Old | 324 (93.9%) | 21 (6.1%) |
| 10 to 14 Year Olds | 157 (68.6%) | 72 (31.4%) |
| 15 to 17 Year Olds | 54 (43.2%) | 71 (56.8%) |
| 18 to 19 Year Olds | 14 (42.4%) | 19 (57.6%) |
| 20 to 24 Year Olds | 0 (0.0%) | 19 (100.0%) |
| 25 to 34 Year Olds | 62 (100.0%) | 0 (0.0%) |
| 35 Years and over | 82 (100.0%) | 0 (0.0%) |
| Total | 712 (77.9%) | 202 (22.1%) |
Educational Attainment by Field of Study in Johnson
Business (194 | 16.5%), bio, nature & agricultural (158 | 13.5%), psychology (148 | 12.6%), education (104 | 8.9%), and science & technology (93 | 7.9%) are the most common fields of study among 1,173 individuals in Johnson who have obtained a bachelor's degree or higher.
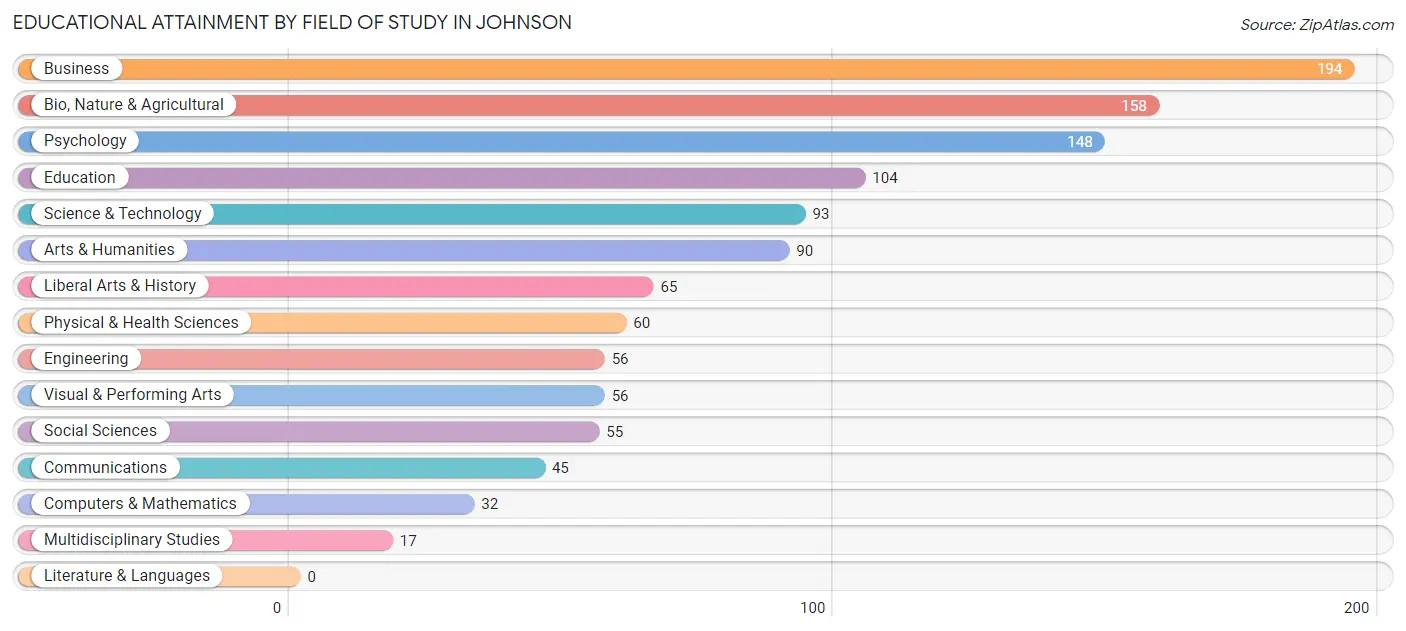
| Field of Study | # Graduates | % Graduates |
| Computers & Mathematics | 32 | 2.7% |
| Bio, Nature & Agricultural | 158 | 13.5% |
| Physical & Health Sciences | 60 | 5.1% |
| Psychology | 148 | 12.6% |
| Social Sciences | 55 | 4.7% |
| Engineering | 56 | 4.8% |
| Multidisciplinary Studies | 17 | 1.5% |
| Science & Technology | 93 | 7.9% |
| Business | 194 | 16.5% |
| Education | 104 | 8.9% |
| Literature & Languages | 0 | 0.0% |
| Liberal Arts & History | 65 | 5.5% |
| Visual & Performing Arts | 56 | 4.8% |
| Communications | 45 | 3.8% |
| Arts & Humanities | 90 | 7.7% |
| Total | 1,173 | 100.0% |
Transportation & Commute in Johnson
Vehicle Availability by Sex in Johnson
The most prevalent vehicle ownership categories in Johnson are males with 2 vehicles (393, accounting for 49.1%) and females with 2 vehicles (476, making up 39.9%).
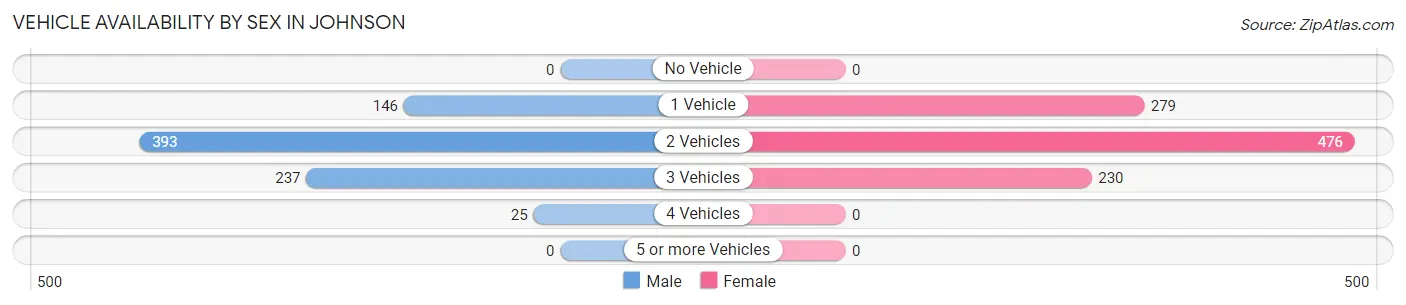
| Vehicles Available | Male | Female |
| No Vehicle | 0 (0.0%) | 0 (0.0%) |
| 1 Vehicle | 146 (18.2%) | 279 (28.3%) |
| 2 Vehicles | 393 (49.1%) | 476 (48.3%) |
| 3 Vehicles | 237 (29.6%) | 230 (23.4%) |
| 4 Vehicles | 25 (3.1%) | 0 (0.0%) |
| 5 or more Vehicles | 0 (0.0%) | 0 (0.0%) |
| Total | 801 (100.0%) | 985 (100.0%) |
Commute Time in Johnson
The most frequently occuring commute durations in Johnson are 20 to 24 minutes (367 commuters, 22.3%), 15 to 19 minutes (293 commuters, 17.8%), and 5 to 9 minutes (259 commuters, 15.7%).
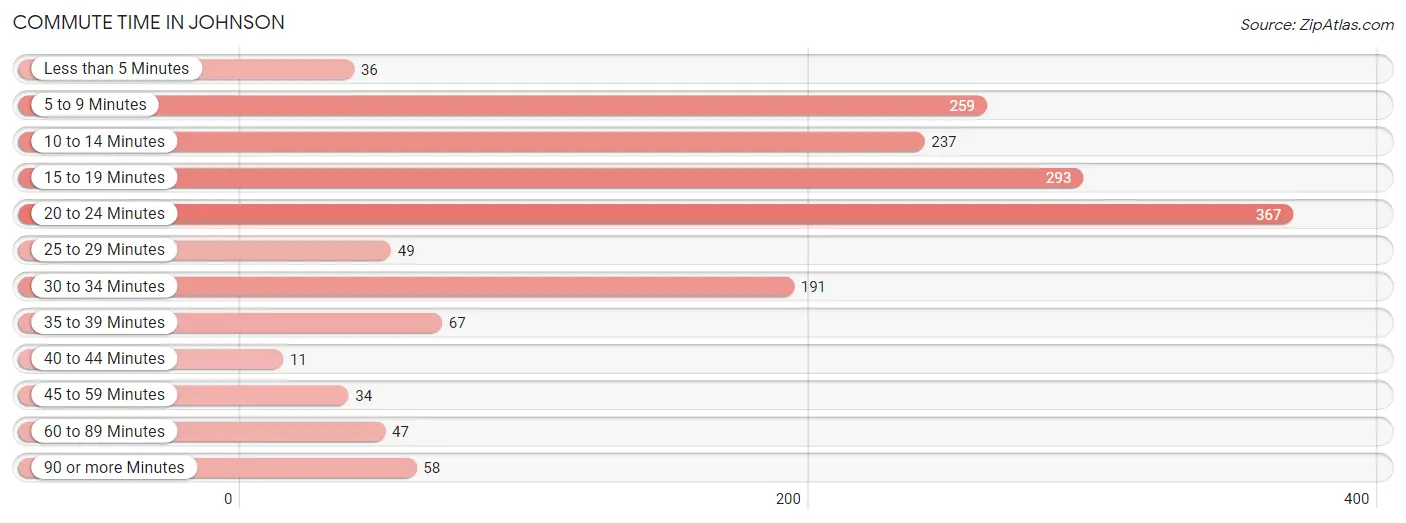
| Commute Time | # Commuters | % Commuters |
| Less than 5 Minutes | 36 | 2.2% |
| 5 to 9 Minutes | 259 | 15.7% |
| 10 to 14 Minutes | 237 | 14.4% |
| 15 to 19 Minutes | 293 | 17.8% |
| 20 to 24 Minutes | 367 | 22.3% |
| 25 to 29 Minutes | 49 | 3.0% |
| 30 to 34 Minutes | 191 | 11.6% |
| 35 to 39 Minutes | 67 | 4.1% |
| 40 to 44 Minutes | 11 | 0.7% |
| 45 to 59 Minutes | 34 | 2.1% |
| 60 to 89 Minutes | 47 | 2.9% |
| 90 or more Minutes | 58 | 3.5% |
Commute Time by Sex in Johnson
The most common commute times in Johnson are 20 to 24 minutes (201 commuters, 26.6%) for males and 15 to 19 minutes (205 commuters, 22.9%) for females.
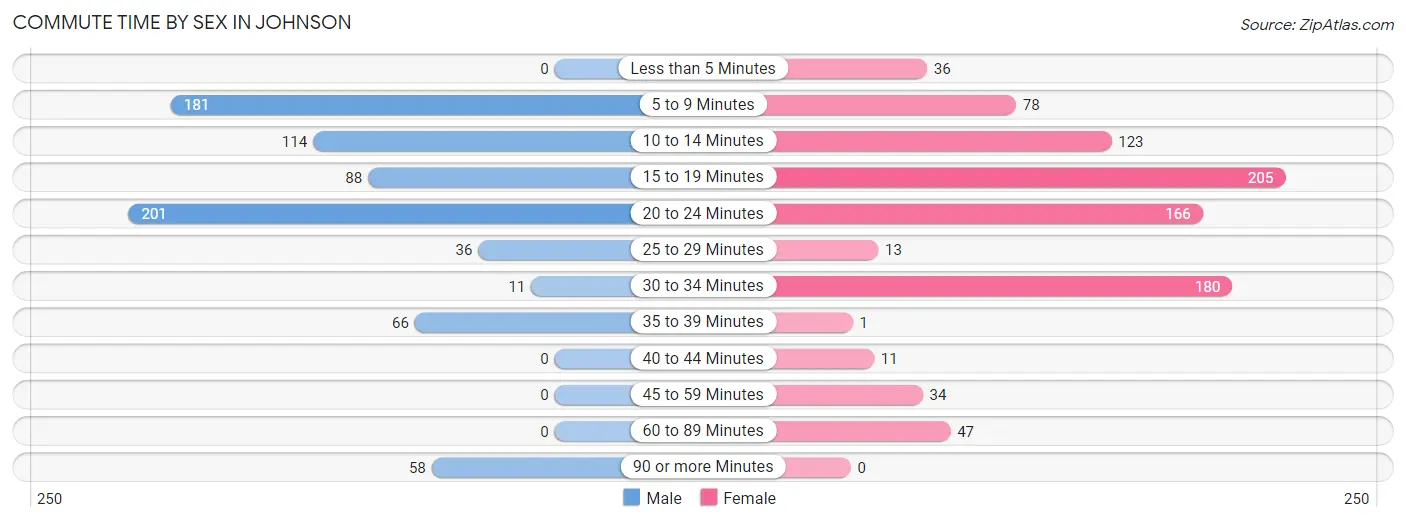
| Commute Time | Male | Female |
| Less than 5 Minutes | 0 (0.0%) | 36 (4.0%) |
| 5 to 9 Minutes | 181 (24.0%) | 78 (8.7%) |
| 10 to 14 Minutes | 114 (15.1%) | 123 (13.8%) |
| 15 to 19 Minutes | 88 (11.7%) | 205 (22.9%) |
| 20 to 24 Minutes | 201 (26.6%) | 166 (18.6%) |
| 25 to 29 Minutes | 36 (4.8%) | 13 (1.5%) |
| 30 to 34 Minutes | 11 (1.5%) | 180 (20.1%) |
| 35 to 39 Minutes | 66 (8.7%) | 1 (0.1%) |
| 40 to 44 Minutes | 0 (0.0%) | 11 (1.2%) |
| 45 to 59 Minutes | 0 (0.0%) | 34 (3.8%) |
| 60 to 89 Minutes | 0 (0.0%) | 47 (5.3%) |
| 90 or more Minutes | 58 (7.7%) | 0 (0.0%) |
Time of Departure to Work by Sex in Johnson
The most frequent times of departure to work in Johnson are 7:00 AM to 7:29 AM (252, 33.4%) for males and 7:30 AM to 7:59 AM (278, 31.1%) for females.
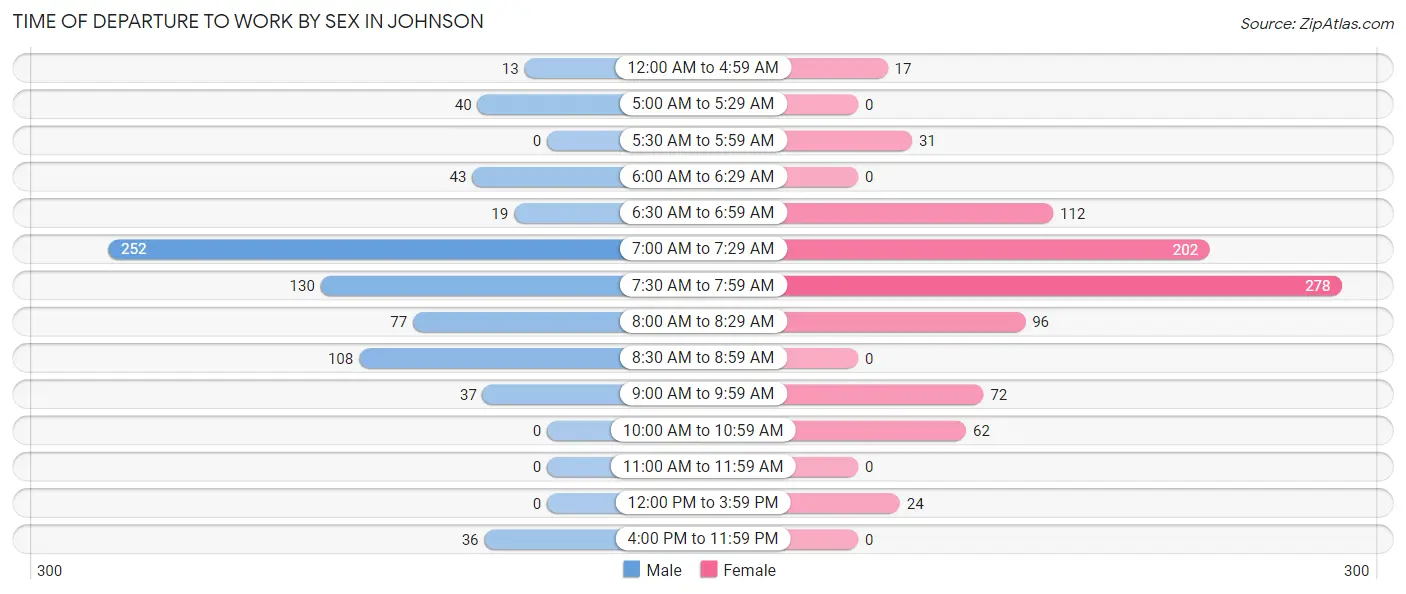
| Time of Departure | Male | Female |
| 12:00 AM to 4:59 AM | 13 (1.7%) | 17 (1.9%) |
| 5:00 AM to 5:29 AM | 40 (5.3%) | 0 (0.0%) |
| 5:30 AM to 5:59 AM | 0 (0.0%) | 31 (3.5%) |
| 6:00 AM to 6:29 AM | 43 (5.7%) | 0 (0.0%) |
| 6:30 AM to 6:59 AM | 19 (2.5%) | 112 (12.5%) |
| 7:00 AM to 7:29 AM | 252 (33.4%) | 202 (22.6%) |
| 7:30 AM to 7:59 AM | 130 (17.2%) | 278 (31.1%) |
| 8:00 AM to 8:29 AM | 77 (10.2%) | 96 (10.7%) |
| 8:30 AM to 8:59 AM | 108 (14.3%) | 0 (0.0%) |
| 9:00 AM to 9:59 AM | 37 (4.9%) | 72 (8.1%) |
| 10:00 AM to 10:59 AM | 0 (0.0%) | 62 (6.9%) |
| 11:00 AM to 11:59 AM | 0 (0.0%) | 0 (0.0%) |
| 12:00 PM to 3:59 PM | 0 (0.0%) | 24 (2.7%) |
| 4:00 PM to 11:59 PM | 36 (4.8%) | 0 (0.0%) |
| Total | 755 (100.0%) | 894 (100.0%) |
Housing Occupancy in Johnson
Occupancy by Ownership in Johnson
Of the total 1,347 dwellings in Johnson, owner-occupied units account for 671 (49.8%), while renter-occupied units make up 676 (50.2%).
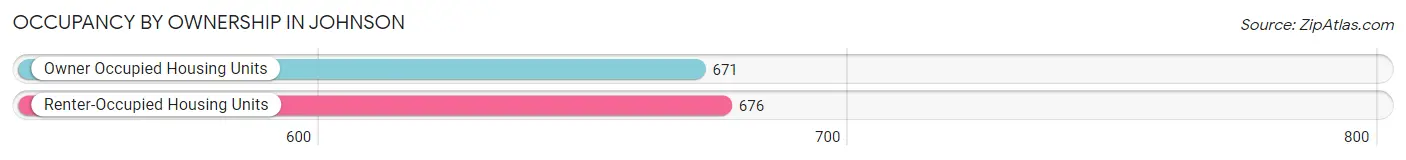
| Occupancy | # Housing Units | % Housing Units |
| Owner Occupied Housing Units | 671 | 49.8% |
| Renter-Occupied Housing Units | 676 | 50.2% |
| Total Occupied Housing Units | 1,347 | 100.0% |
Occupancy by Household Size in Johnson
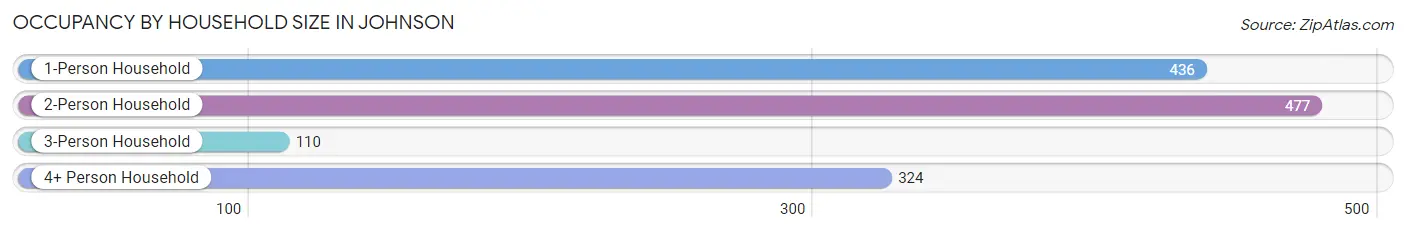
| Household Size | # Housing Units | % Housing Units |
| 1-Person Household | 436 | 32.4% |
| 2-Person Household | 477 | 35.4% |
| 3-Person Household | 110 | 8.2% |
| 4+ Person Household | 324 | 24.0% |
| Total Housing Units | 1,347 | 100.0% |
Occupancy by Ownership by Household Size in Johnson
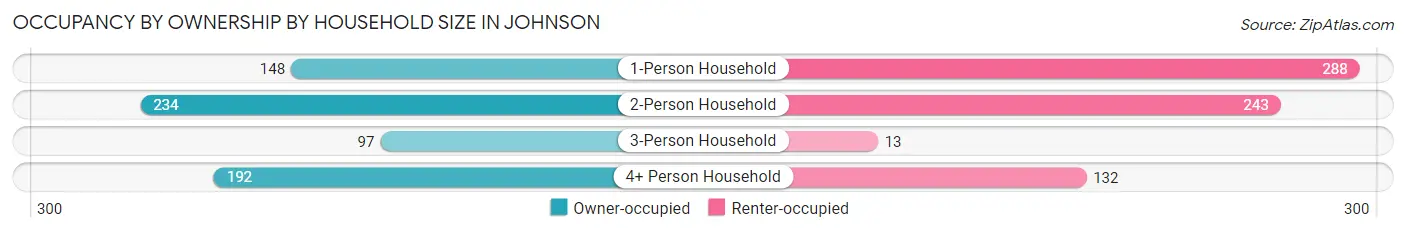
| Household Size | Owner-occupied | Renter-occupied |
| 1-Person Household | 148 (33.9%) | 288 (66.1%) |
| 2-Person Household | 234 (49.1%) | 243 (50.9%) |
| 3-Person Household | 97 (88.2%) | 13 (11.8%) |
| 4+ Person Household | 192 (59.3%) | 132 (40.7%) |
| Total Housing Units | 671 (49.8%) | 676 (50.2%) |
Occupancy by Educational Attainment in Johnson
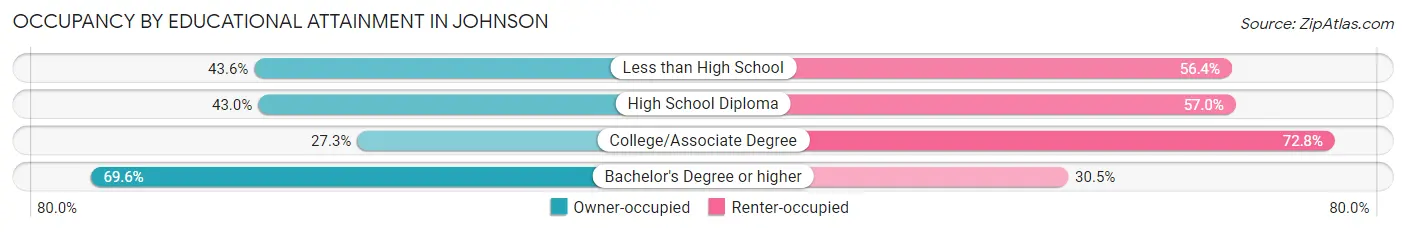
| Household Size | Owner-occupied | Renter-occupied |
| Less than High School | 34 (43.6%) | 44 (56.4%) |
| High School Diploma | 101 (43.0%) | 134 (57.0%) |
| College/Associate Degree | 118 (27.3%) | 315 (72.8%) |
| Bachelor's Degree or higher | 418 (69.6%) | 183 (30.4%) |
Occupancy by Age of Householder in Johnson
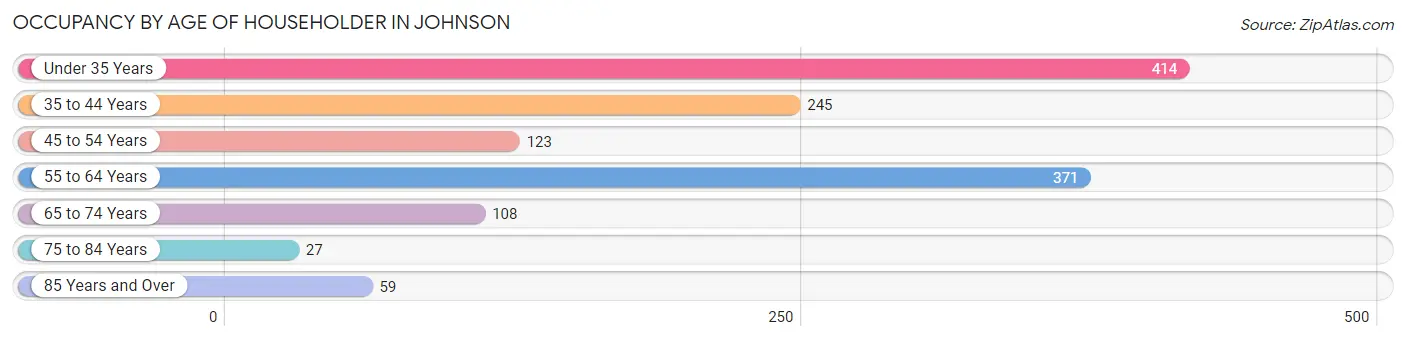
| Age Bracket | # Households | % Households |
| Under 35 Years | 414 | 30.7% |
| 35 to 44 Years | 245 | 18.2% |
| 45 to 54 Years | 123 | 9.1% |
| 55 to 64 Years | 371 | 27.5% |
| 65 to 74 Years | 108 | 8.0% |
| 75 to 84 Years | 27 | 2.0% |
| 85 Years and Over | 59 | 4.4% |
| Total | 1,347 | 100.0% |
Housing Finances in Johnson
Median Income by Occupancy in Johnson
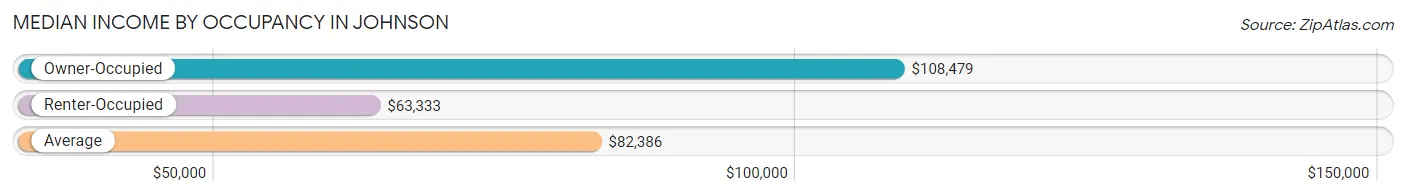
| Occupancy Type | # Households | Median Income |
| Owner-Occupied | 671 (49.8%) | $108,479 |
| Renter-Occupied | 676 (50.2%) | $63,333 |
| Average | 1,347 (100.0%) | $82,386 |
Occupancy by Householder Income Bracket in Johnson
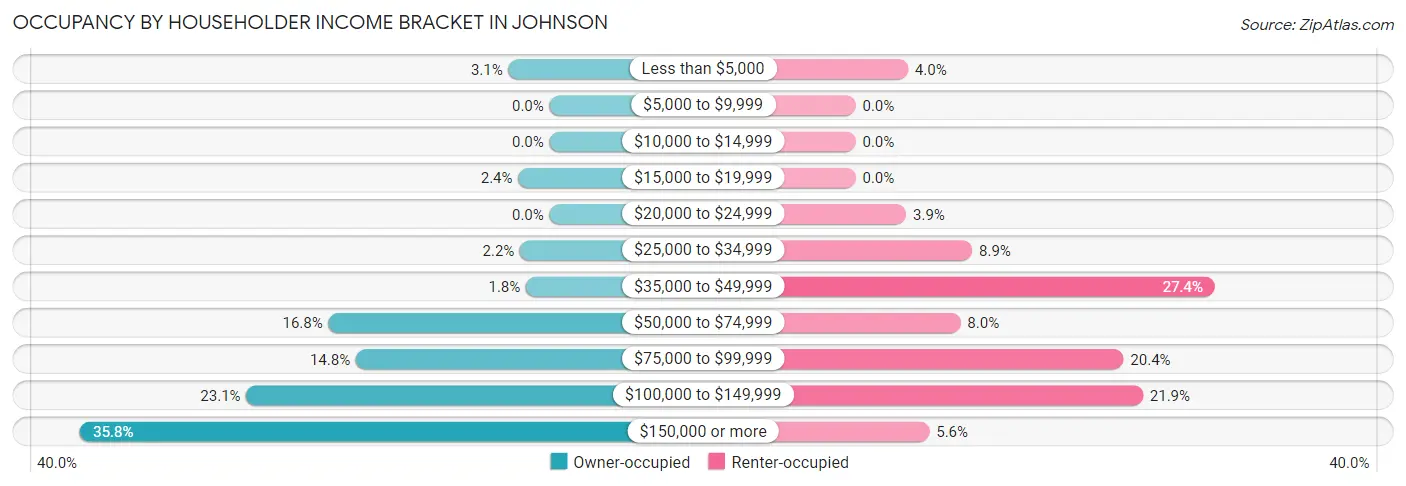
| Income Bracket | Owner-occupied | Renter-occupied |
| Less than $5,000 | 21 (3.1%) | 27 (4.0%) |
| $5,000 to $9,999 | 0 (0.0%) | 0 (0.0%) |
| $10,000 to $14,999 | 0 (0.0%) | 0 (0.0%) |
| $15,000 to $19,999 | 16 (2.4%) | 0 (0.0%) |
| $20,000 to $24,999 | 0 (0.0%) | 26 (3.8%) |
| $25,000 to $34,999 | 15 (2.2%) | 60 (8.9%) |
| $35,000 to $49,999 | 12 (1.8%) | 185 (27.4%) |
| $50,000 to $74,999 | 113 (16.8%) | 54 (8.0%) |
| $75,000 to $99,999 | 99 (14.7%) | 138 (20.4%) |
| $100,000 to $149,999 | 155 (23.1%) | 148 (21.9%) |
| $150,000 or more | 240 (35.8%) | 38 (5.6%) |
| Total | 671 (100.0%) | 676 (100.0%) |
Monthly Housing Cost Tiers in Johnson
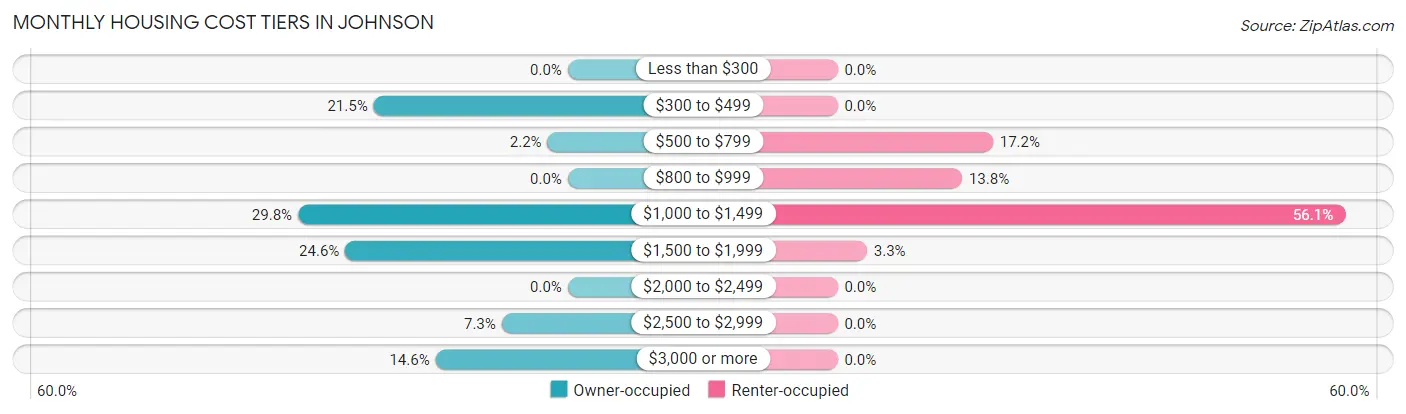
| Monthly Cost | Owner-occupied | Renter-occupied |
| Less than $300 | 0 (0.0%) | 0 (0.0%) |
| $300 to $499 | 144 (21.5%) | 0 (0.0%) |
| $500 to $799 | 15 (2.2%) | 116 (17.2%) |
| $800 to $999 | 0 (0.0%) | 93 (13.8%) |
| $1,000 to $1,499 | 200 (29.8%) | 379 (56.1%) |
| $1,500 to $1,999 | 165 (24.6%) | 22 (3.3%) |
| $2,000 to $2,499 | 0 (0.0%) | 0 (0.0%) |
| $2,500 to $2,999 | 49 (7.3%) | 0 (0.0%) |
| $3,000 or more | 98 (14.6%) | 0 (0.0%) |
| Total | 671 (100.0%) | 676 (100.0%) |
Physical Housing Characteristics in Johnson
Housing Structures in Johnson
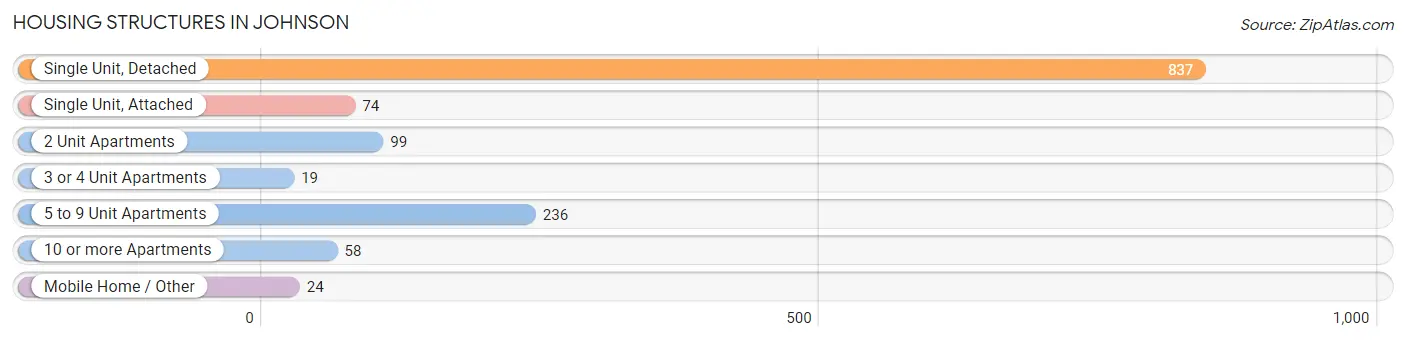
| Structure Type | # Housing Units | % Housing Units |
| Single Unit, Detached | 837 | 62.1% |
| Single Unit, Attached | 74 | 5.5% |
| 2 Unit Apartments | 99 | 7.3% |
| 3 or 4 Unit Apartments | 19 | 1.4% |
| 5 to 9 Unit Apartments | 236 | 17.5% |
| 10 or more Apartments | 58 | 4.3% |
| Mobile Home / Other | 24 | 1.8% |
| Total | 1,347 | 100.0% |
Housing Structures by Occupancy in Johnson
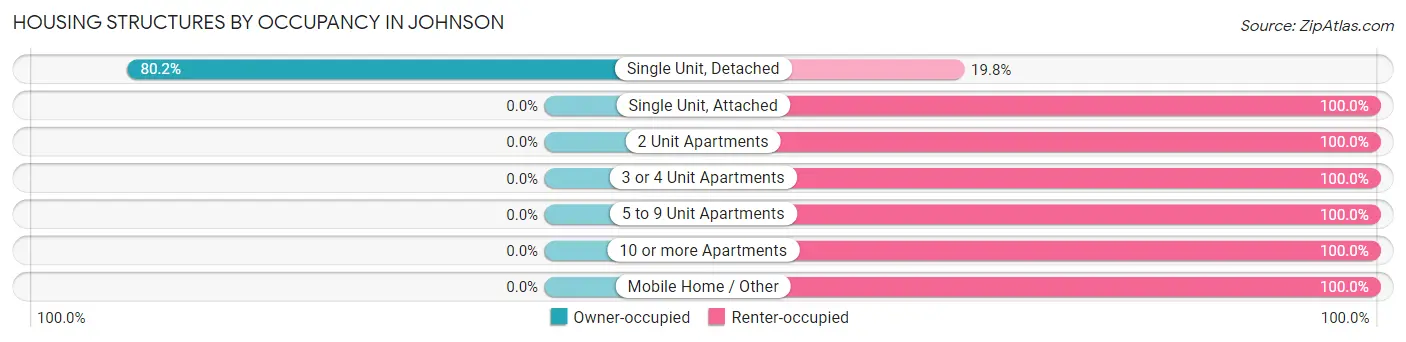
| Structure Type | Owner-occupied | Renter-occupied |
| Single Unit, Detached | 671 (80.2%) | 166 (19.8%) |
| Single Unit, Attached | 0 (0.0%) | 74 (100.0%) |
| 2 Unit Apartments | 0 (0.0%) | 99 (100.0%) |
| 3 or 4 Unit Apartments | 0 (0.0%) | 19 (100.0%) |
| 5 to 9 Unit Apartments | 0 (0.0%) | 236 (100.0%) |
| 10 or more Apartments | 0 (0.0%) | 58 (100.0%) |
| Mobile Home / Other | 0 (0.0%) | 24 (100.0%) |
| Total | 671 (49.8%) | 676 (50.2%) |
Housing Structures by Number of Rooms in Johnson
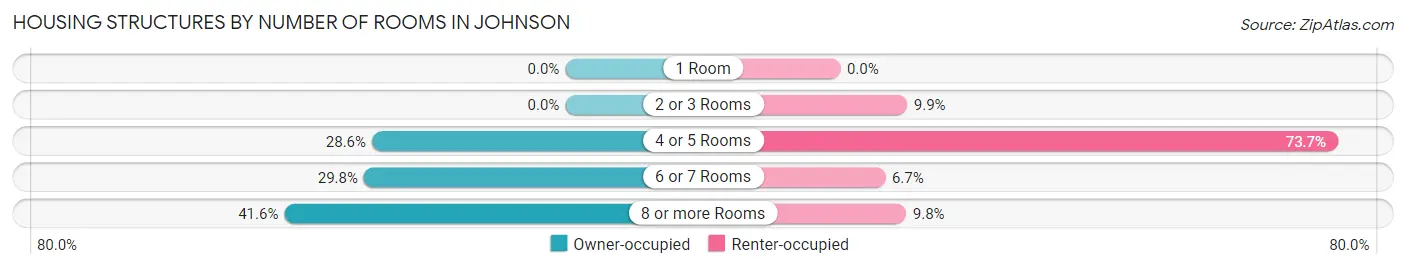
| Number of Rooms | Owner-occupied | Renter-occupied |
| 1 Room | 0 (0.0%) | 0 (0.0%) |
| 2 or 3 Rooms | 0 (0.0%) | 67 (9.9%) |
| 4 or 5 Rooms | 192 (28.6%) | 498 (73.7%) |
| 6 or 7 Rooms | 200 (29.8%) | 45 (6.7%) |
| 8 or more Rooms | 279 (41.6%) | 66 (9.8%) |
| Total | 671 (100.0%) | 676 (100.0%) |
Housing Structure by Heating Type in Johnson
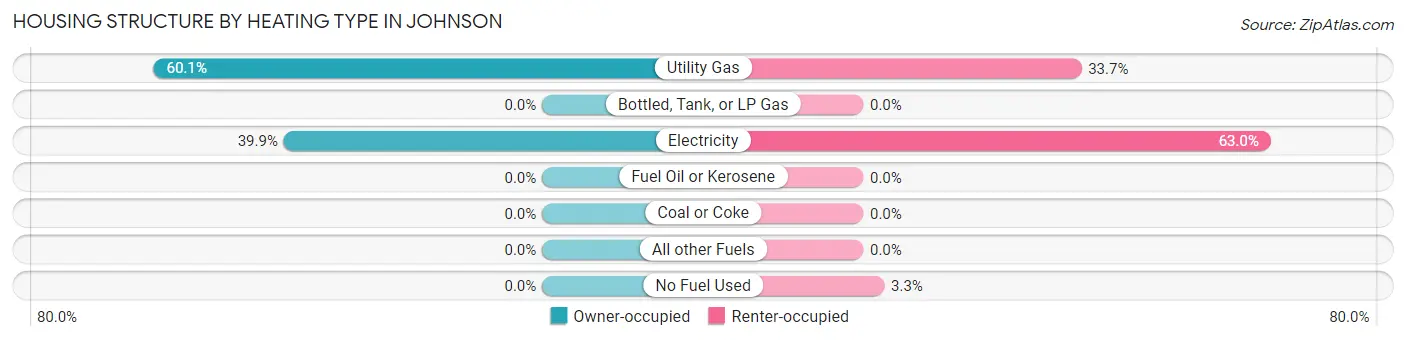
| Heating Type | Owner-occupied | Renter-occupied |
| Utility Gas | 403 (60.1%) | 228 (33.7%) |
| Bottled, Tank, or LP Gas | 0 (0.0%) | 0 (0.0%) |
| Electricity | 268 (39.9%) | 426 (63.0%) |
| Fuel Oil or Kerosene | 0 (0.0%) | 0 (0.0%) |
| Coal or Coke | 0 (0.0%) | 0 (0.0%) |
| All other Fuels | 0 (0.0%) | 0 (0.0%) |
| No Fuel Used | 0 (0.0%) | 22 (3.3%) |
| Total | 671 (100.0%) | 676 (100.0%) |
Household Vehicle Usage in Johnson
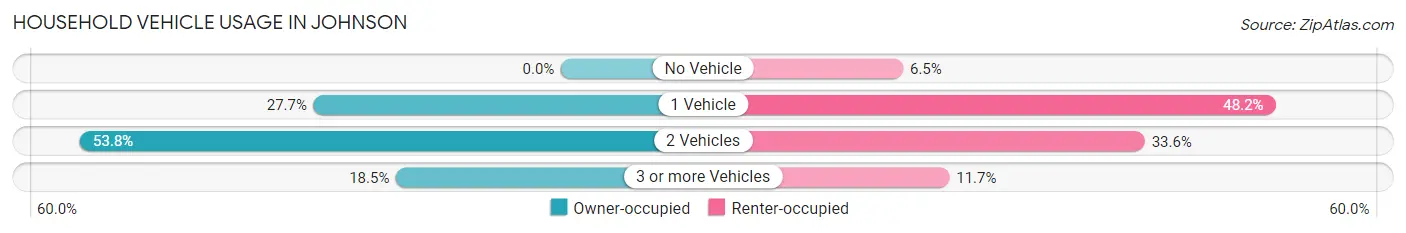
| Vehicles per Household | Owner-occupied | Renter-occupied |
| No Vehicle | 0 (0.0%) | 44 (6.5%) |
| 1 Vehicle | 186 (27.7%) | 326 (48.2%) |
| 2 Vehicles | 361 (53.8%) | 227 (33.6%) |
| 3 or more Vehicles | 124 (18.5%) | 79 (11.7%) |
| Total | 671 (100.0%) | 676 (100.0%) |
Real Estate & Mortgages in Johnson
Real Estate and Mortgage Overview in Johnson
| Characteristic | Without Mortgage | With Mortgage |
| Housing Units | 192 | 479 |
| Median Property Value | $233,100 | $238,800 |
| Median Household Income | $62,257 | $222 |
| Monthly Housing Costs | $448 | $98 |
| Real Estate Taxes | $1,771 | $10 |
Property Value by Mortgage Status in Johnson
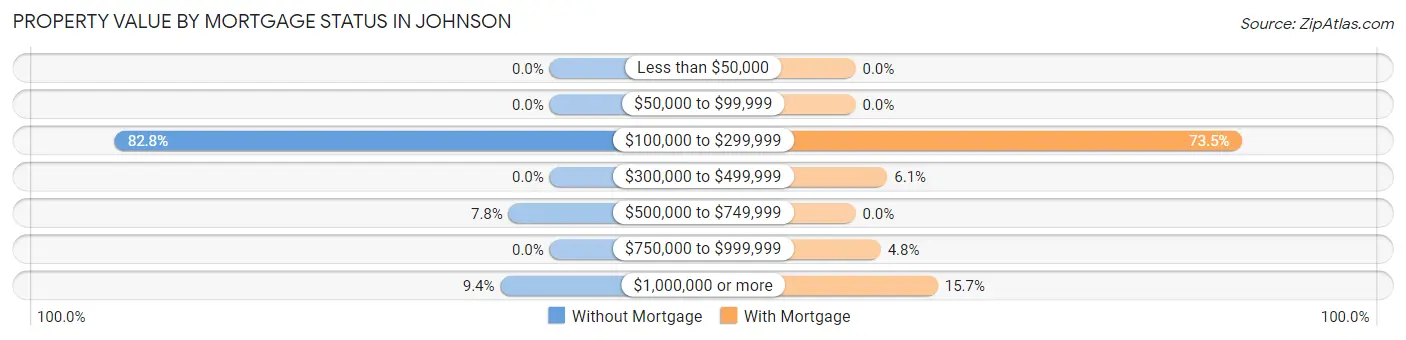
| Property Value | Without Mortgage | With Mortgage |
| Less than $50,000 | 0 (0.0%) | 0 (0.0%) |
| $50,000 to $99,999 | 0 (0.0%) | 0 (0.0%) |
| $100,000 to $299,999 | 159 (82.8%) | 352 (73.5%) |
| $300,000 to $499,999 | 0 (0.0%) | 29 (6.0%) |
| $500,000 to $749,999 | 15 (7.8%) | 0 (0.0%) |
| $750,000 to $999,999 | 0 (0.0%) | 23 (4.8%) |
| $1,000,000 or more | 18 (9.4%) | 75 (15.7%) |
| Total | 192 (100.0%) | 479 (100.0%) |
Household Income by Mortgage Status in Johnson
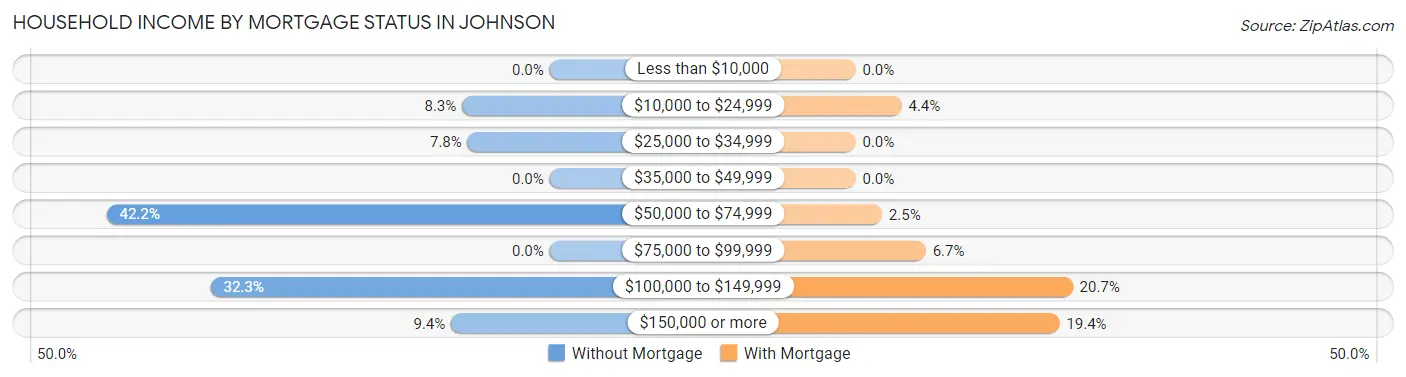
| Household Income | Without Mortgage | With Mortgage |
| Less than $10,000 | 0 (0.0%) | 0 (0.0%) |
| $10,000 to $24,999 | 16 (8.3%) | 21 (4.4%) |
| $25,000 to $34,999 | 15 (7.8%) | 0 (0.0%) |
| $35,000 to $49,999 | 0 (0.0%) | 0 (0.0%) |
| $50,000 to $74,999 | 81 (42.2%) | 12 (2.5%) |
| $75,000 to $99,999 | 0 (0.0%) | 32 (6.7%) |
| $100,000 to $149,999 | 62 (32.3%) | 99 (20.7%) |
| $150,000 or more | 18 (9.4%) | 93 (19.4%) |
| Total | 192 (100.0%) | 479 (100.0%) |
Property Value to Household Income Ratio in Johnson
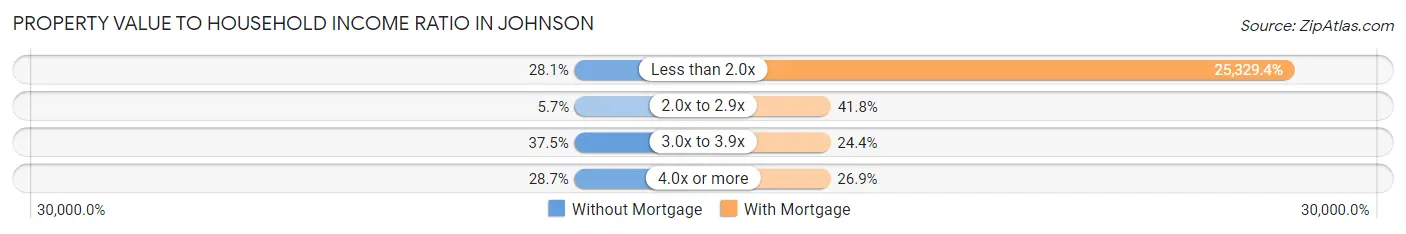
| Value-to-Income Ratio | Without Mortgage | With Mortgage |
| Less than 2.0x | 54 (28.1%) | 121,328 (25,329.4%) |
| 2.0x to 2.9x | 11 (5.7%) | 200 (41.7%) |
| 3.0x to 3.9x | 72 (37.5%) | 117 (24.4%) |
| 4.0x or more | 55 (28.6%) | 129 (26.9%) |
| Total | 192 (100.0%) | 479 (100.0%) |
Real Estate Taxes by Mortgage Status in Johnson
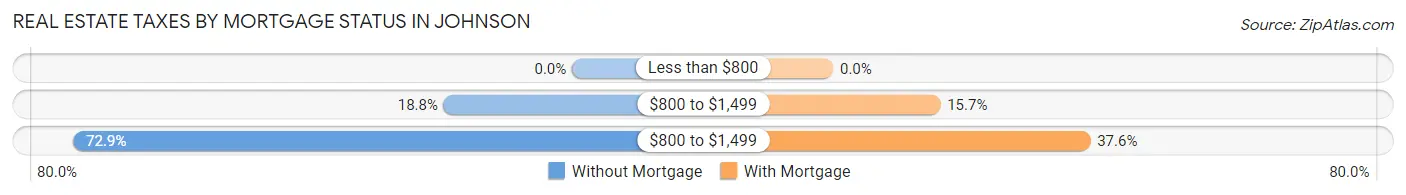
| Property Taxes | Without Mortgage | With Mortgage |
| Less than $800 | 0 (0.0%) | 0 (0.0%) |
| $800 to $1,499 | 36 (18.8%) | 75 (15.7%) |
| $800 to $1,499 | 140 (72.9%) | 180 (37.6%) |
| Total | 192 (100.0%) | 479 (100.0%) |
Health & Disability in Johnson
Health Insurance Coverage by Age in Johnson
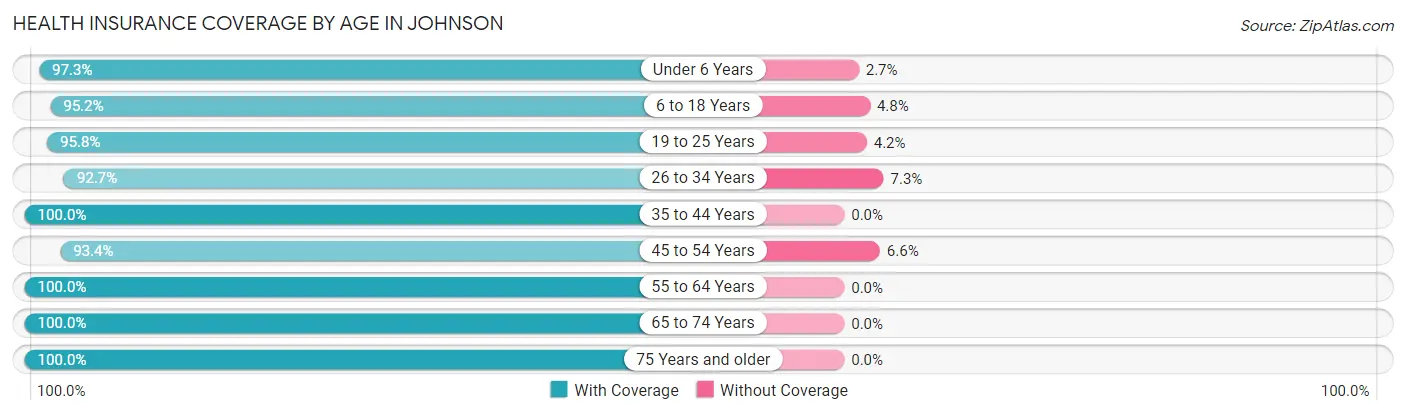
| Age Bracket | With Coverage | Without Coverage |
| Under 6 Years | 324 (97.3%) | 9 (2.7%) |
| 6 to 18 Years | 715 (95.2%) | 36 (4.8%) |
| 19 to 25 Years | 297 (95.8%) | 13 (4.2%) |
| 26 to 34 Years | 506 (92.7%) | 40 (7.3%) |
| 35 to 44 Years | 561 (100.0%) | 0 (0.0%) |
| 45 to 54 Years | 281 (93.4%) | 20 (6.6%) |
| 55 to 64 Years | 541 (100.0%) | 0 (0.0%) |
| 65 to 74 Years | 140 (100.0%) | 0 (0.0%) |
| 75 Years and older | 122 (100.0%) | 0 (0.0%) |
| Total | 3,487 (96.7%) | 118 (3.3%) |
Health Insurance Coverage by Citizenship Status in Johnson
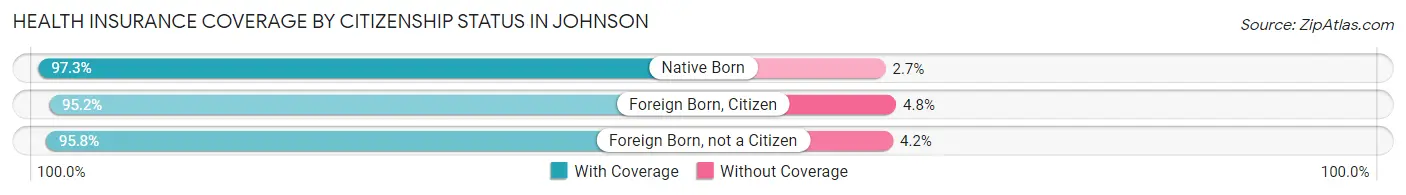
| Citizenship Status | With Coverage | Without Coverage |
| Native Born | 324 (97.3%) | 9 (2.7%) |
| Foreign Born, Citizen | 715 (95.2%) | 36 (4.8%) |
| Foreign Born, not a Citizen | 297 (95.8%) | 13 (4.2%) |
Health Insurance Coverage by Household Income in Johnson
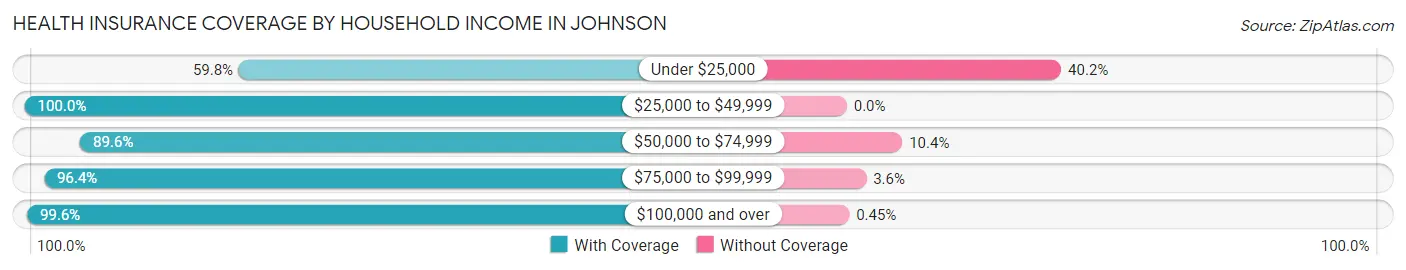
| Household Income | With Coverage | Without Coverage |
| Under $25,000 | 73 (59.8%) | 49 (40.2%) |
| $25,000 to $49,999 | 383 (100.0%) | 0 (0.0%) |
| $50,000 to $74,999 | 250 (89.6%) | 29 (10.4%) |
| $75,000 to $99,999 | 796 (96.4%) | 30 (3.6%) |
| $100,000 and over | 1,982 (99.6%) | 9 (0.4%) |
Public vs Private Health Insurance Coverage by Age in Johnson
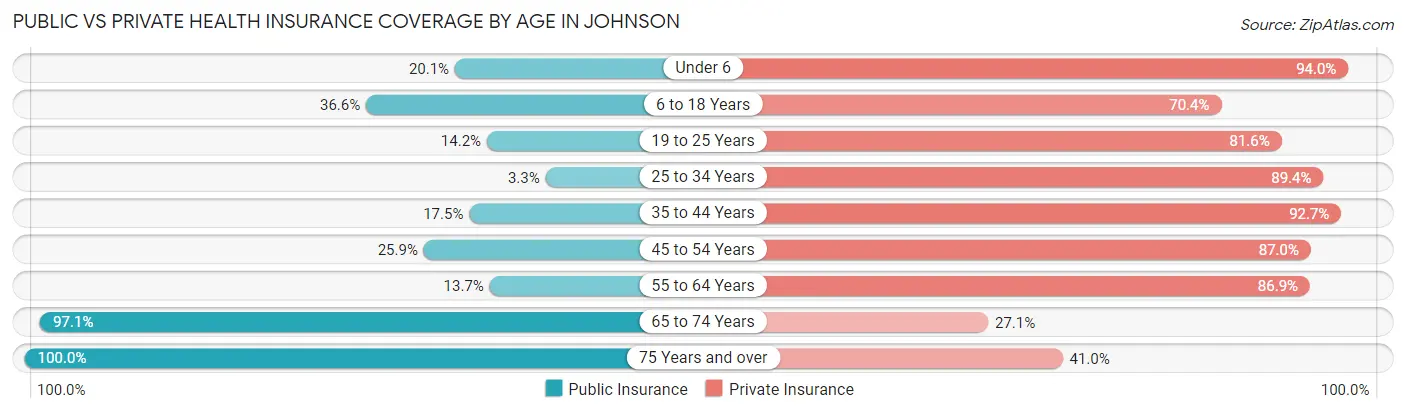
| Age Bracket | Public Insurance | Private Insurance |
| Under 6 | 67 (20.1%) | 313 (94.0%) |
| 6 to 18 Years | 275 (36.6%) | 529 (70.4%) |
| 19 to 25 Years | 44 (14.2%) | 253 (81.6%) |
| 25 to 34 Years | 18 (3.3%) | 488 (89.4%) |
| 35 to 44 Years | 98 (17.5%) | 520 (92.7%) |
| 45 to 54 Years | 78 (25.9%) | 262 (87.0%) |
| 55 to 64 Years | 74 (13.7%) | 470 (86.9%) |
| 65 to 74 Years | 136 (97.1%) | 38 (27.1%) |
| 75 Years and over | 122 (100.0%) | 50 (41.0%) |
| Total | 912 (25.3%) | 2,923 (81.1%) |
Disability Status by Sex by Age in Johnson
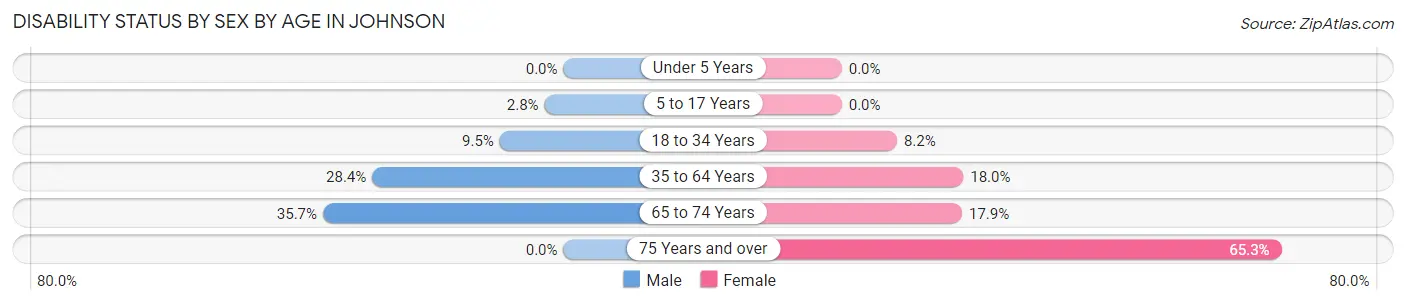
| Age Bracket | Male | Female |
| Under 5 Years | 0 (0.0%) | 0 (0.0%) |
| 5 to 17 Years | 9 (2.8%) | 0 (0.0%) |
| 18 to 34 Years | 42 (9.5%) | 38 (8.2%) |
| 35 to 64 Years | 167 (28.4%) | 147 (18.0%) |
| 65 to 74 Years | 20 (35.7%) | 15 (17.9%) |
| 75 Years and over | 0 (0.0%) | 47 (65.3%) |
Disability Class by Sex by Age in Johnson
Disability Class: Hearing Difficulty
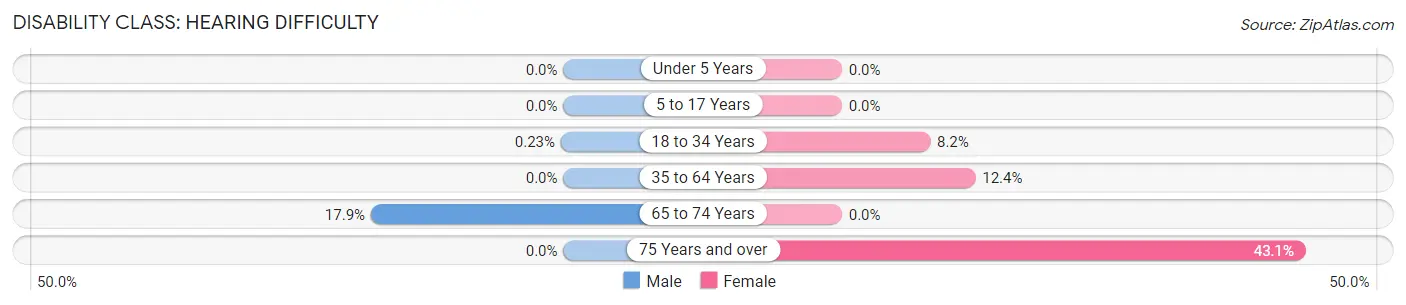
| Age Bracket | Male | Female |
| Under 5 Years | 0 (0.0%) | 0 (0.0%) |
| 5 to 17 Years | 0 (0.0%) | 0 (0.0%) |
| 18 to 34 Years | 1 (0.2%) | 38 (8.2%) |
| 35 to 64 Years | 0 (0.0%) | 101 (12.4%) |
| 65 to 74 Years | 10 (17.9%) | 0 (0.0%) |
| 75 Years and over | 0 (0.0%) | 31 (43.1%) |
Disability Class: Vision Difficulty
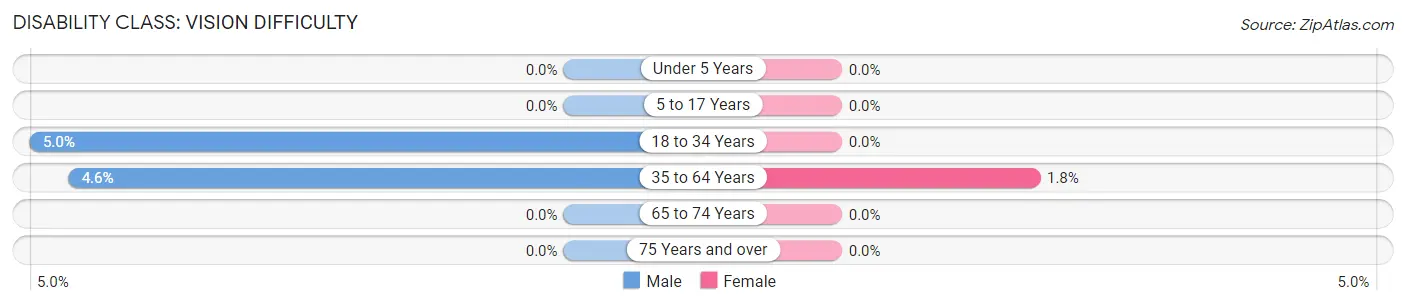
| Age Bracket | Male | Female |
| Under 5 Years | 0 (0.0%) | 0 (0.0%) |
| 5 to 17 Years | 0 (0.0%) | 0 (0.0%) |
| 18 to 34 Years | 22 (5.0%) | 0 (0.0%) |
| 35 to 64 Years | 27 (4.6%) | 15 (1.8%) |
| 65 to 74 Years | 0 (0.0%) | 0 (0.0%) |
| 75 Years and over | 0 (0.0%) | 0 (0.0%) |
Disability Class: Cognitive Difficulty
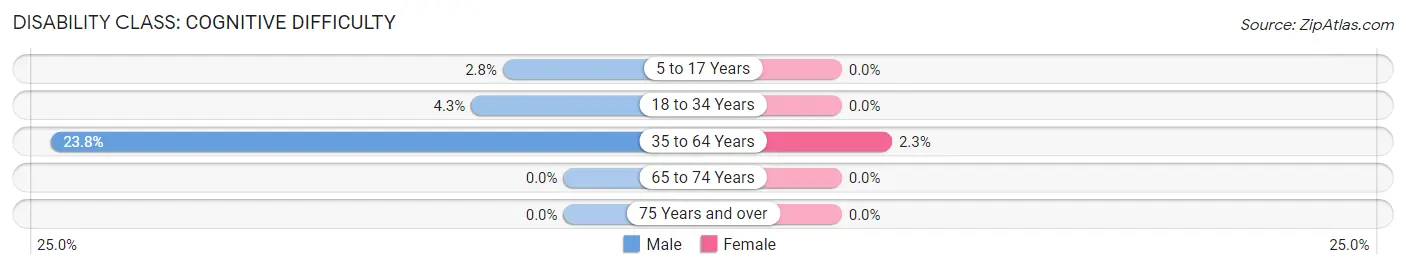
| Age Bracket | Male | Female |
| 5 to 17 Years | 9 (2.8%) | 0 (0.0%) |
| 18 to 34 Years | 19 (4.3%) | 0 (0.0%) |
| 35 to 64 Years | 140 (23.8%) | 19 (2.3%) |
| 65 to 74 Years | 0 (0.0%) | 0 (0.0%) |
| 75 Years and over | 0 (0.0%) | 0 (0.0%) |
Disability Class: Ambulatory Difficulty
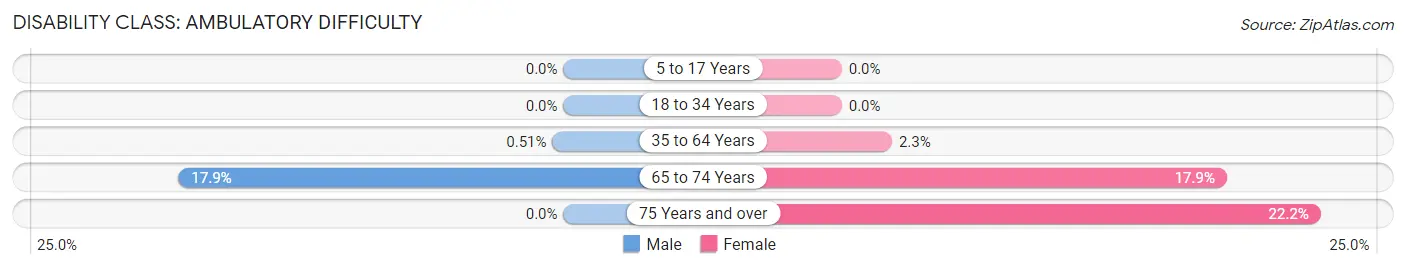
| Age Bracket | Male | Female |
| 5 to 17 Years | 0 (0.0%) | 0 (0.0%) |
| 18 to 34 Years | 0 (0.0%) | 0 (0.0%) |
| 35 to 64 Years | 3 (0.5%) | 19 (2.3%) |
| 65 to 74 Years | 10 (17.9%) | 15 (17.9%) |
| 75 Years and over | 0 (0.0%) | 16 (22.2%) |
Disability Class: Self-Care Difficulty
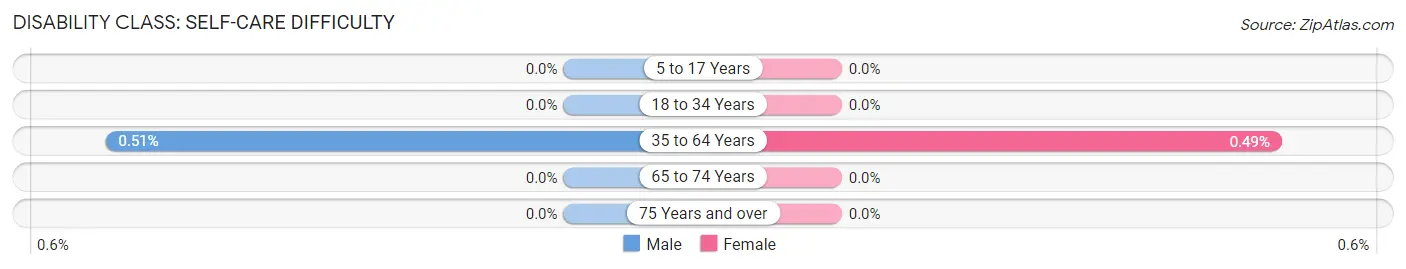
| Age Bracket | Male | Female |
| 5 to 17 Years | 0 (0.0%) | 0 (0.0%) |
| 18 to 34 Years | 0 (0.0%) | 0 (0.0%) |
| 35 to 64 Years | 3 (0.5%) | 4 (0.5%) |
| 65 to 74 Years | 0 (0.0%) | 0 (0.0%) |
| 75 Years and over | 0 (0.0%) | 0 (0.0%) |
Technology Access in Johnson
Computing Device Access in Johnson
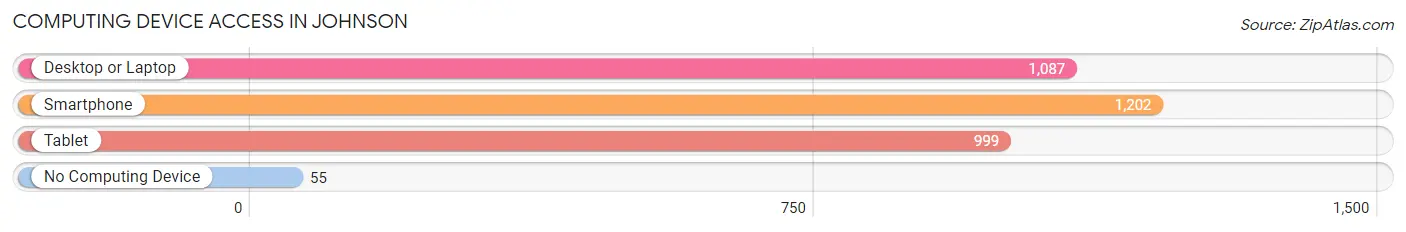
| Device Type | # Households | % Households |
| Desktop or Laptop | 1,087 | 80.7% |
| Smartphone | 1,202 | 89.2% |
| Tablet | 999 | 74.2% |
| No Computing Device | 55 | 4.1% |
| Total | 1,347 | 100.0% |
Internet Access in Johnson
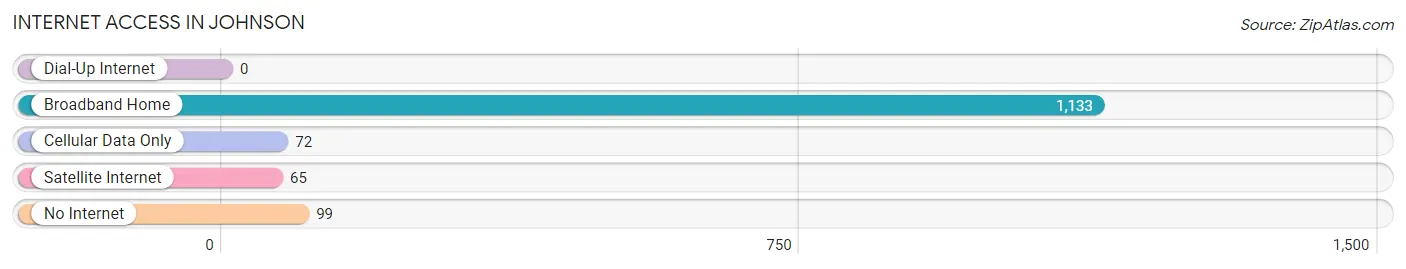
| Internet Type | # Households | % Households |
| Dial-Up Internet | 0 | 0.0% |
| Broadband Home | 1,133 | 84.1% |
| Cellular Data Only | 72 | 5.3% |
| Satellite Internet | 65 | 4.8% |
| No Internet | 99 | 7.3% |
| Total | 1,347 | 100.0% |
Johnson Summary
Johnson, Arkansas is a city located in Washington County, Arkansas. It is part of the Fayetteville-Springdale-Rogers Metropolitan Statistical Area. The city has a population of 8,927 as of the 2010 census.
Geography
Johnson is located at 36°14'25" North, 94°10'45" West (36.240278, -94.179167). It is situated in the Ozark Mountains of Northwest Arkansas. The city is located on the White River, which is a tributary of the Arkansas River. The city is surrounded by the Ozark National Forest and is located near the Buffalo National River.
The city has a total area of 4 2 square miles all of which is land
Demographics
As of the 2010 census, there were 8,927 people, 3,541 households, and 2,521 families residing in the city. The population density was 2,125.2 people per square mile. There were 3,845 housing units at an average density of 917.9 per square mile. The racial makeup of the city was 92.2% White, 0.7% African American, 1.2% Native American, 0.5% Asian, 0.1% Pacific Islander, 3.3% from other races, and 2.1% from two or more races. Hispanic or Latino of any race were 6.2% of the population.
There were 3,541 households, out of which 33.2% had children under the age of 18 living with them, 54.2% were married couples living together, 11.7% had a female householder with no husband present, and 29.2% were non-families. 24.2% of all households were made up of individuals, and 9.3% had someone living alone who was 65 years of age or older. The average household size was 2.51 and the average family size was 2.97.
The median age in the city was 36.7 years. 24.7% of residents were under the age of 18; 8.3% were between the ages of 18 and 24; 26.2% were from 25 to 44; 26.2% were from 45 to 64; and 14.6% were 65 years of age or older. The gender makeup of the city was 48.3% male and 51.7% female.
Economy
Johnson is home to several businesses, including a Walmart Supercenter, a Lowe's Home Improvement store, and a variety of restaurants and retail stores. The city is also home to the Johnson Industrial Park, which is home to several manufacturing and industrial businesses.
The city is served by the Johnson School District, which includes Johnson Elementary School, Johnson Middle School, and Johnson High School. The city is also home to the University of Arkansas Community College at Morrilton, which offers associate degrees and certificate programs.
The median income for a household in the city was $41,945, and the median income for a family was $50,945. Males had a median income of $37,945 versus $27,945 for females. The per capita income for the city was $20,945. About 8.3% of families and 11.7% of the population were below the poverty line, including 15.2% of those under age 18 and 8.3% of those age 65 or over.
Conclusion
Johnson, Arkansas is a city located in Washington County, Arkansas. It is part of the Fayetteville-Springdale-Rogers Metropolitan Statistical Area and has a population of 8,927 as of the 2010 census. The city is located on the White River and is surrounded by the Ozark National Forest. The city has a variety of businesses, including a Walmart Supercenter, a Lowe's Home Improvement store, and a variety of restaurants and retail stores. The city is served by the Johnson School District and is home to the University of Arkansas Community College at Morrilton. The median income for a household in the city was $41,945, and the median income for a family was $50,945. About 8.3% of families and 11.7% of the population were below the poverty line.
Common Questions
What is Per Capita Income in Johnson?
Per Capita income in Johnson is $59,282.
What is the Median Family Income in Johnson?
Median Family Income in Johnson is $105,714.
What is the Median Household income in Johnson?
Median Household Income in Johnson is $82,386.
What is Income or Wage Gap in Johnson?
Income or Wage Gap in Johnson is 11.9%.
Women in Johnson earn 88.1 cents for every dollar earned by a man.
What is Inequality or Gini Index in Johnson?
Inequality or Gini Index in Johnson is 0.58.
What is the Total Population of Johnson?
Total Population of Johnson is 3,605.
What is the Total Male Population of Johnson?
Total Male Population of Johnson is 1,683.
What is the Total Female Population of Johnson?
Total Female Population of Johnson is 1,922.
What is the Ratio of Males per 100 Females in Johnson?
There are 87.57 Males per 100 Females in Johnson.
What is the Ratio of Females per 100 Males in Johnson?
There are 114.20 Females per 100 Males in Johnson.
What is the Median Population Age in Johnson?
Median Population Age in Johnson is 31.3 Years.
What is the Average Family Size in Johnson
Average Family Size in Johnson is 3.5 People.
What is the Average Household Size in Johnson
Average Household Size in Johnson is 2.7 People.
How Large is the Labor Force in Johnson?
There are 1,844 People in the Labor Forcein in Johnson.
What is the Percentage of People in the Labor Force in Johnson?
69.8% of People are in the Labor Force in Johnson.
What is the Unemployment Rate in Johnson?
Unemployment Rate in Johnson is 1.0%.