Waterflow, NM Map & Demographics
Waterflow Map
Waterflow Overview
$24,279
PER CAPITA INCOME
$73,690
AVG FAMILY INCOME
$58,309
AVG HOUSEHOLD INCOME
30.4%
WAGE / INCOME GAP [ % ]
69.6¢/ $1
WAGE / INCOME GAP [ $ ]
0.36
INEQUALITY / GINI INDEX
1,325
TOTAL POPULATION
619
MALE POPULATION
706
FEMALE POPULATION
87.68
MALES / 100 FEMALES
114.05
FEMALES / 100 MALES
36.8
MEDIAN AGE
3.8
AVG FAMILY SIZE
3.1
AVG HOUSEHOLD SIZE
570
LABOR FORCE [ PEOPLE ]
58.6%
PERCENT IN LABOR FORCE
8.4%
UNEMPLOYMENT RATE
Waterflow Zip Codes
Waterflow Area Codes
Income in Waterflow
Income Overview in Waterflow
Per Capita Income in Waterflow is $24,279, while median incomes of families and households are $73,690 and $58,309 respectively.
| Characteristic | Number | Measure |
| Per Capita Income | 1,325 | $24,279 |
| Median Family Income | 314 | $73,690 |
| Mean Family Income | 314 | $76,349 |
| Median Household Income | 421 | $58,309 |
| Mean Household Income | 421 | $70,935 |
| Income Deficit | 314 | $0 |
| Wage / Income Gap (%) | 1,325 | 30.38% |
| Wage / Income Gap ($) | 1,325 | 69.62¢ per $1 |
| Gini / Inequality Index | 1,325 | 0.36 |
Earnings by Sex in Waterflow
Average Earnings in Waterflow are $31,250, $37,800 for men and $26,316 for women, a difference of 30.4%.
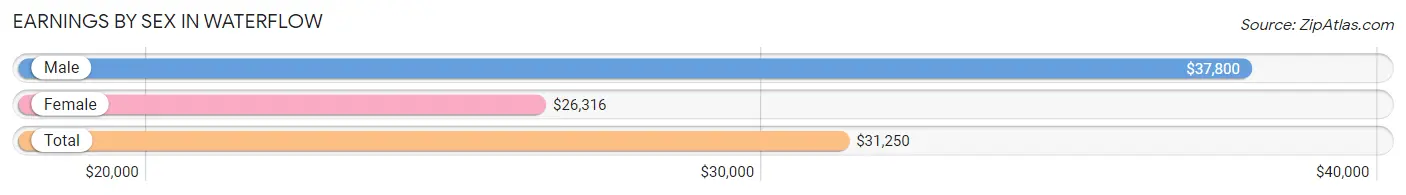
| Sex | Number | Average Earnings |
| Male | 286 (46.4%) | $37,800 |
| Female | 330 (53.6%) | $26,316 |
| Total | 616 (100.0%) | $31,250 |
Earnings by Sex by Income Bracket in Waterflow
The most common earnings brackets in Waterflow are $100,000+ for men (71 | 24.8%) and $30,000 to $34,999 for women (67 | 20.3%).
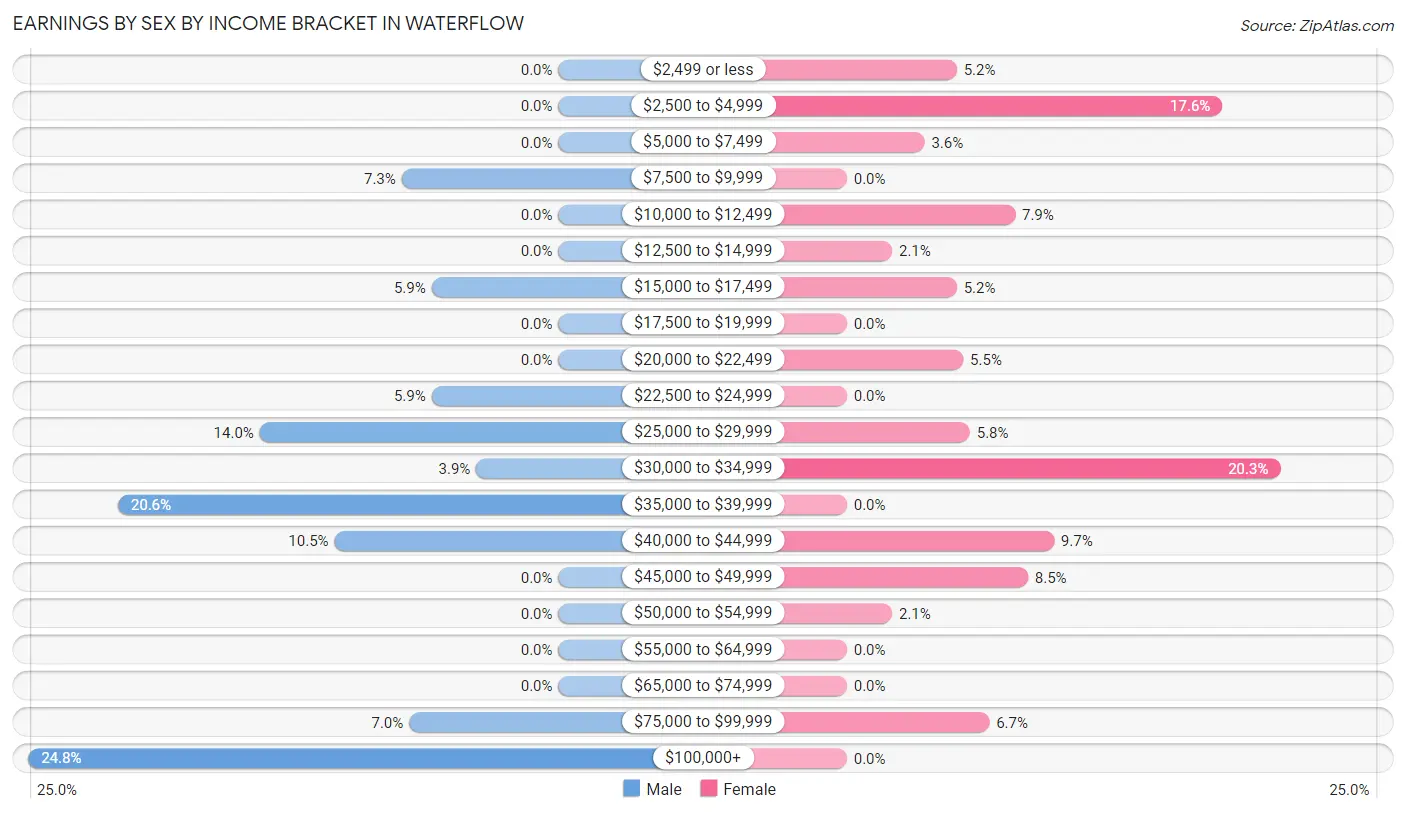
| Income | Male | Female |
| $2,499 or less | 0 (0.0%) | 17 (5.1%) |
| $2,500 to $4,999 | 0 (0.0%) | 58 (17.6%) |
| $5,000 to $7,499 | 0 (0.0%) | 12 (3.6%) |
| $7,500 to $9,999 | 21 (7.3%) | 0 (0.0%) |
| $10,000 to $12,499 | 0 (0.0%) | 26 (7.9%) |
| $12,500 to $14,999 | 0 (0.0%) | 7 (2.1%) |
| $15,000 to $17,499 | 17 (5.9%) | 17 (5.1%) |
| $17,500 to $19,999 | 0 (0.0%) | 0 (0.0%) |
| $20,000 to $22,499 | 0 (0.0%) | 18 (5.4%) |
| $22,500 to $24,999 | 17 (5.9%) | 0 (0.0%) |
| $25,000 to $29,999 | 40 (14.0%) | 19 (5.8%) |
| $30,000 to $34,999 | 11 (3.8%) | 67 (20.3%) |
| $35,000 to $39,999 | 59 (20.6%) | 0 (0.0%) |
| $40,000 to $44,999 | 30 (10.5%) | 32 (9.7%) |
| $45,000 to $49,999 | 0 (0.0%) | 28 (8.5%) |
| $50,000 to $54,999 | 0 (0.0%) | 7 (2.1%) |
| $55,000 to $64,999 | 0 (0.0%) | 0 (0.0%) |
| $65,000 to $74,999 | 0 (0.0%) | 0 (0.0%) |
| $75,000 to $99,999 | 20 (7.0%) | 22 (6.7%) |
| $100,000+ | 71 (24.8%) | 0 (0.0%) |
| Total | 286 (100.0%) | 330 (100.0%) |
Earnings by Sex by Educational Attainment in Waterflow
Average earnings in Waterflow are $37,800 for men and $25,987 for women, a difference of 31.2%. Men with an educational attainment of college or associate's degree enjoy the highest average annual earnings of $38,000, while those with college or associate's degree education earn the least with $38,000. Women with an educational attainment of high school diploma earn the most with the average annual earnings of $21,597, while those with high school diploma education have the smallest earnings of $21,597.
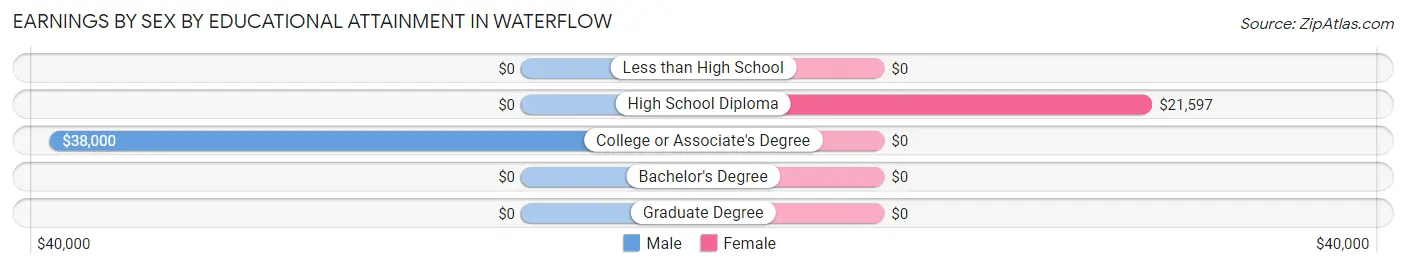
| Educational Attainment | Male Income | Female Income |
| Less than High School | - | - |
| High School Diploma | - | - |
| College or Associate's Degree | $38,000 | $0 |
| Bachelor's Degree | - | - |
| Graduate Degree | - | - |
| Total | $37,800 | $25,987 |
Family Income in Waterflow
Family Income Brackets in Waterflow
According to the Waterflow family income data, there are 77 families falling into the $75,000 to $99,999 income range, which is the most common income bracket and makes up 24.5% of all families.
| Income Bracket | # Families | % Families |
| Less than $10,000 | 20 | 6.4% |
| $10,000 to $14,999 | 0 | 0.0% |
| $15,000 to $24,999 | 17 | 5.4% |
| $25,000 to $34,999 | 6 | 1.9% |
| $35,000 to $49,999 | 62 | 19.7% |
| $50,000 to $74,999 | 63 | 20.1% |
| $75,000 to $99,999 | 77 | 24.5% |
| $100,000 to $149,999 | 31 | 9.9% |
| $150,000 to $199,999 | 38 | 12.1% |
| $200,000+ | 0 | 0.0% |
Family Income by Famaliy Size in Waterflow
3-person families (88 | 28.0%) account for the highest median family income in Waterflow with $76,786 per family, while 3-person families (88 | 28.0%) have the highest median income of $25,595 per family member.
| Income Bracket | # Families | Median Income |
| 2-Person Families | 132 (42.0%) | $48,452 |
| 3-Person Families | 88 (28.0%) | $76,786 |
| 4-Person Families | 24 (7.6%) | $0 |
| 5-Person Families | 40 (12.7%) | $0 |
| 6-Person Families | 0 (0.0%) | $0 |
| 7+ Person Families | 30 (9.6%) | $0 |
| Total | 314 (100.0%) | $73,690 |
Family Income by Number of Earners in Waterflow
| Number of Earners | # Families | Median Income |
| No Earners | 43 (13.7%) | $0 |
| 1 Earner | 109 (34.7%) | $44,688 |
| 2 Earners | 119 (37.9%) | $83,438 |
| 3+ Earners | 43 (13.7%) | $0 |
| Total | 314 (100.0%) | $73,690 |
Household Income in Waterflow
Household Income Brackets in Waterflow
With 96 households falling in the category, the $75,000 to $99,999 income range is the most frequent in Waterflow, accounting for 22.8% of all households.
| Income Bracket | # Households | % Households |
| Less than $10,000 | 20 | 4.8% |
| $10,000 to $14,999 | 5 | 1.2% |
| $15,000 to $24,999 | 40 | 9.5% |
| $25,000 to $34,999 | 33 | 7.8% |
| $35,000 to $49,999 | 65 | 15.4% |
| $50,000 to $74,999 | 80 | 19.0% |
| $75,000 to $99,999 | 96 | 22.8% |
| $100,000 to $149,999 | 44 | 10.5% |
| $150,000 to $199,999 | 38 | 9.0% |
| $200,000+ | 0 | 0.0% |
Household Income by Householder Age in Waterflow
The median household income in Waterflow is $58,309, with the highest median household income of $90,043 found in the 45 to 64 years age bracket for the primary householder. A total of 191 households (45.4%) fall into this category.
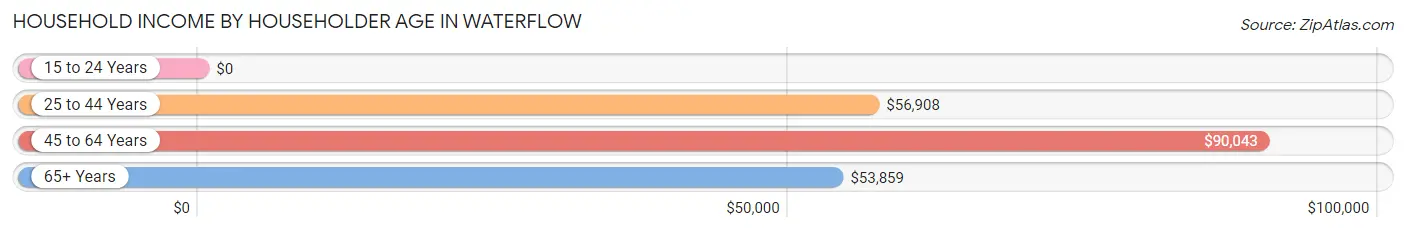
| Income Bracket | # Households | Median Income |
| 15 to 24 Years | 0 (0.0%) | $0 |
| 25 to 44 Years | 85 (20.2%) | $56,908 |
| 45 to 64 Years | 191 (45.4%) | $90,043 |
| 65+ Years | 145 (34.4%) | $53,859 |
| Total | 421 (100.0%) | $58,309 |
Poverty in Waterflow
Income Below Poverty by Sex and Age in Waterflow
With 8.2% poverty level for males and 9.5% for females among the residents of Waterflow, under 5 year old males and 16 and 17 year old females are the most vulnerable to poverty, with 12 males (26.1%) and 26 females (100.0%) in their respective age groups living below the poverty level.
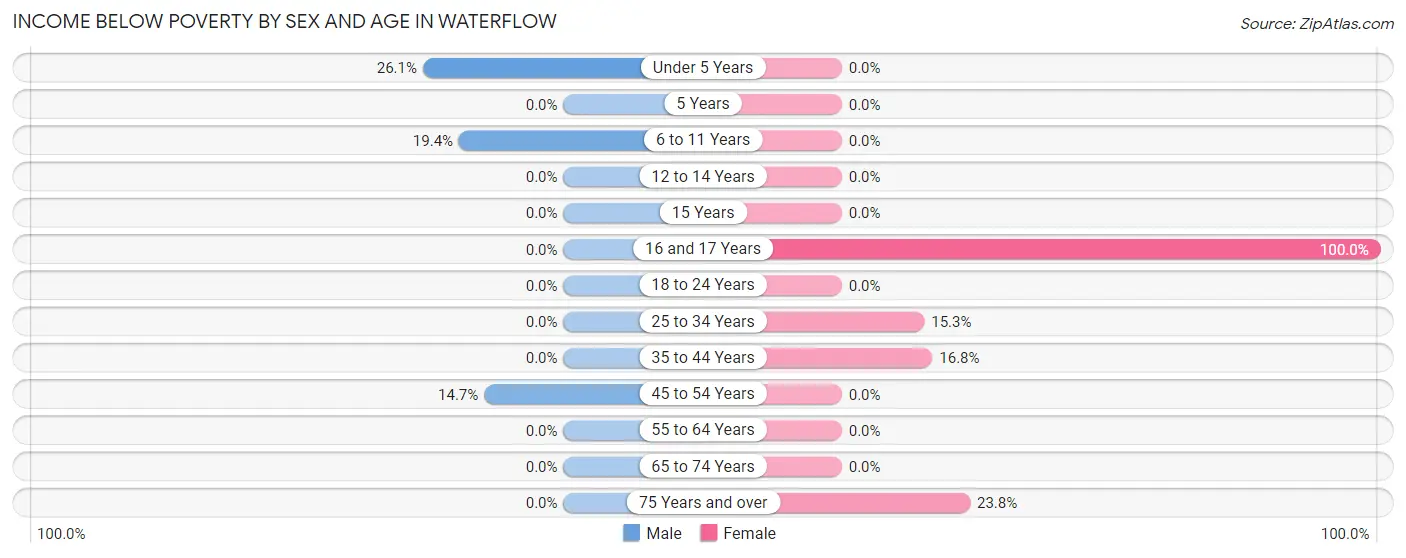
| Age Bracket | Male | Female |
| Under 5 Years | 12 (26.1%) | 0 (0.0%) |
| 5 Years | 0 (0.0%) | 0 (0.0%) |
| 6 to 11 Years | 19 (19.4%) | 0 (0.0%) |
| 12 to 14 Years | 0 (0.0%) | 0 (0.0%) |
| 15 Years | 0 (0.0%) | 0 (0.0%) |
| 16 and 17 Years | 0 (0.0%) | 26 (100.0%) |
| 18 to 24 Years | 0 (0.0%) | 0 (0.0%) |
| 25 to 34 Years | 0 (0.0%) | 17 (15.3%) |
| 35 to 44 Years | 0 (0.0%) | 19 (16.8%) |
| 45 to 54 Years | 20 (14.7%) | 0 (0.0%) |
| 55 to 64 Years | 0 (0.0%) | 0 (0.0%) |
| 65 to 74 Years | 0 (0.0%) | 0 (0.0%) |
| 75 Years and over | 0 (0.0%) | 5 (23.8%) |
| Total | 51 (8.2%) | 67 (9.5%) |
Income Above Poverty by Sex and Age in Waterflow
According to the poverty statistics in Waterflow, males aged 12 to 14 years and females aged under 5 years are the age groups that are most secure financially, with 100.0% of males and 100.0% of females in these age groups living above the poverty line.
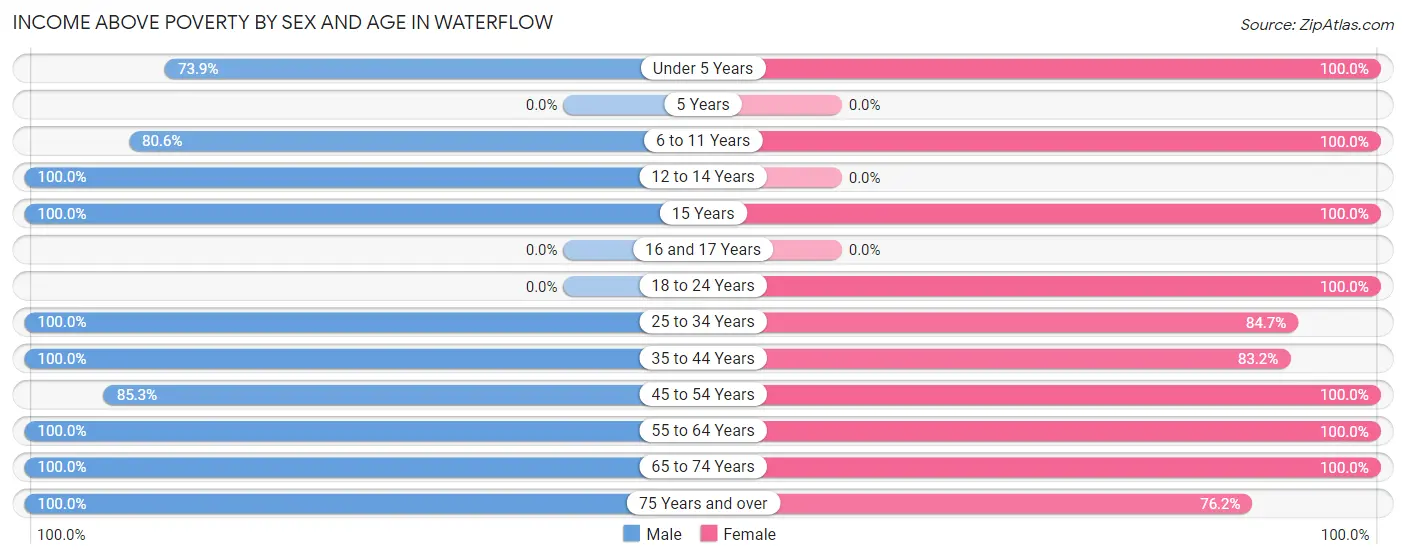
| Age Bracket | Male | Female |
| Under 5 Years | 34 (73.9%) | 6 (100.0%) |
| 5 Years | 0 (0.0%) | 0 (0.0%) |
| 6 to 11 Years | 79 (80.6%) | 89 (100.0%) |
| 12 to 14 Years | 37 (100.0%) | 0 (0.0%) |
| 15 Years | 48 (100.0%) | 28 (100.0%) |
| 16 and 17 Years | 0 (0.0%) | 0 (0.0%) |
| 18 to 24 Years | 0 (0.0%) | 57 (100.0%) |
| 25 to 34 Years | 55 (100.0%) | 94 (84.7%) |
| 35 to 44 Years | 49 (100.0%) | 94 (83.2%) |
| 45 to 54 Years | 116 (85.3%) | 89 (100.0%) |
| 55 to 64 Years | 45 (100.0%) | 78 (100.0%) |
| 65 to 74 Years | 93 (100.0%) | 88 (100.0%) |
| 75 Years and over | 12 (100.0%) | 16 (76.2%) |
| Total | 568 (91.8%) | 639 (90.5%) |
Income Below Poverty Among Married-Couple Families in Waterflow
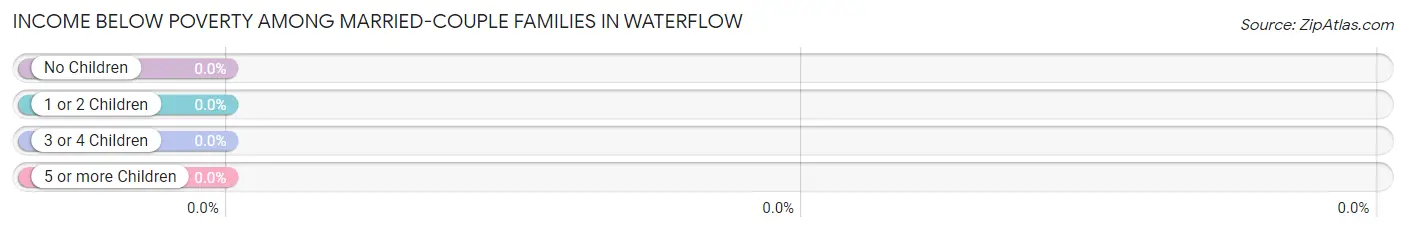
| Children | Above Poverty | Below Poverty |
| No Children | 116 (100.0%) | 0 (0.0%) |
| 1 or 2 Children | 53 (100.0%) | 0 (0.0%) |
| 3 or 4 Children | 40 (100.0%) | 0 (0.0%) |
| 5 or more Children | 21 (100.0%) | 0 (0.0%) |
| Total | 230 (100.0%) | 0 (0.0%) |
Income Below Poverty Among Single-Parent Households in Waterflow
According to the poverty data in Waterflow, 48.8% or 20 single-father households and 39.5% or 17 single-mother households are living below the poverty line. Among single-father households, those with 1 or 2 children have the highest poverty rate, with 20 households (100.0%) experiencing poverty. Likewise, among single-mother households, those with 1 or 2 children have the highest poverty rate, with 17 households (47.2%) falling below the poverty line.
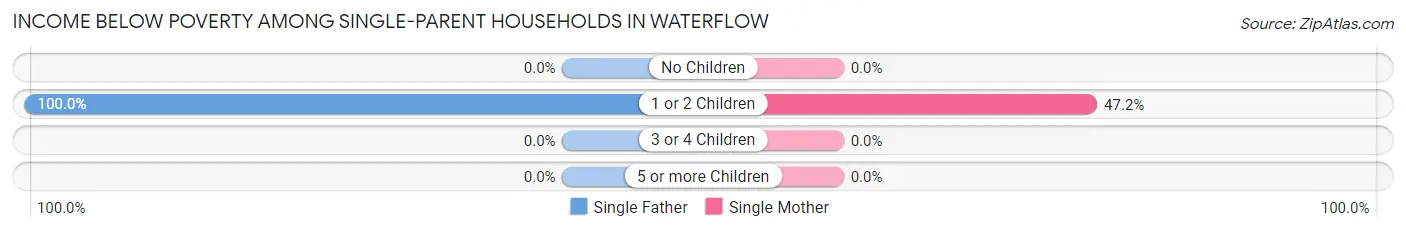
| Children | Single Father | Single Mother |
| No Children | 0 (0.0%) | 0 (0.0%) |
| 1 or 2 Children | 20 (100.0%) | 17 (47.2%) |
| 3 or 4 Children | 0 (0.0%) | 0 (0.0%) |
| 5 or more Children | 0 (0.0%) | 0 (0.0%) |
| Total | 20 (48.8%) | 17 (39.5%) |
Income Below Poverty Among Married-Couple vs Single-Parent Households in Waterflow
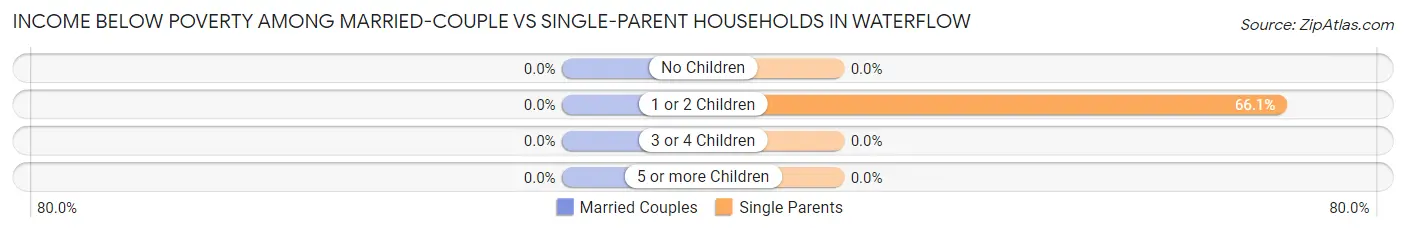
| Children | Married-Couple Families | Single-Parent Households |
| No Children | 0 (0.0%) | 0 (0.0%) |
| 1 or 2 Children | 0 (0.0%) | 37 (66.1%) |
| 3 or 4 Children | 0 (0.0%) | 0 (0.0%) |
| 5 or more Children | 0 (0.0%) | 0 (0.0%) |
| Total | 0 (0.0%) | 37 (44.1%) |
Race in Waterflow
The most populous races in Waterflow are Native / Alaskan (686 | 51.8%), White / Caucasian (520 | 39.3%), and Hispanic or Latino (180 | 13.6%).
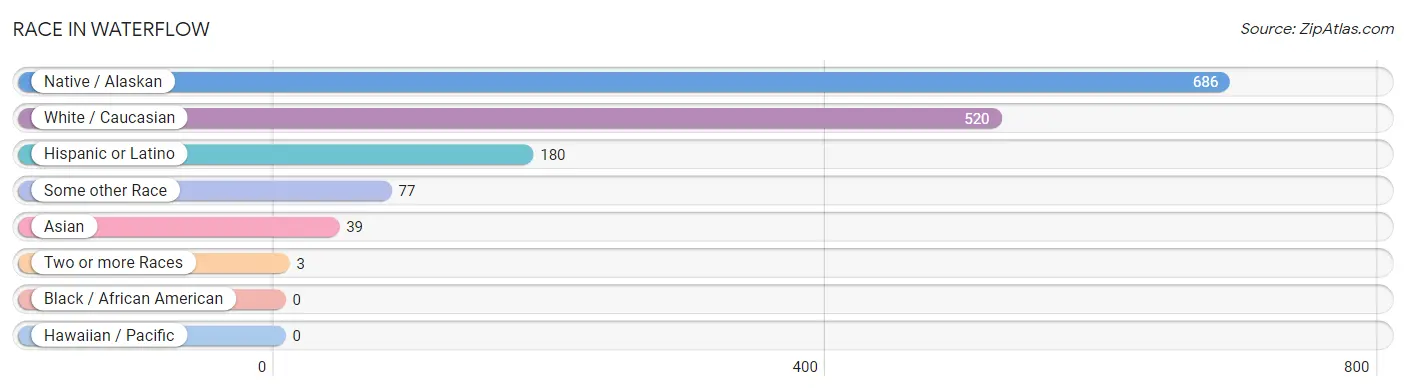
| Race | # Population | % Population |
| Asian | 39 | 2.9% |
| Black / African American | 0 | 0.0% |
| Hawaiian / Pacific | 0 | 0.0% |
| Hispanic or Latino | 180 | 13.6% |
| Native / Alaskan | 686 | 51.8% |
| White / Caucasian | 520 | 39.3% |
| Two or more Races | 3 | 0.2% |
| Some other Race | 77 | 5.8% |
| Total | 1,325 | 100.0% |
Ancestry in Waterflow
The most populous ancestries reported in Waterflow are Navajo (616 | 46.5%), English (112 | 8.5%), Spanish (81 | 6.1%), Potawatomi (62 | 4.7%), and Spaniard (51 | 3.8%), together accounting for 69.6% of all Waterflow residents.
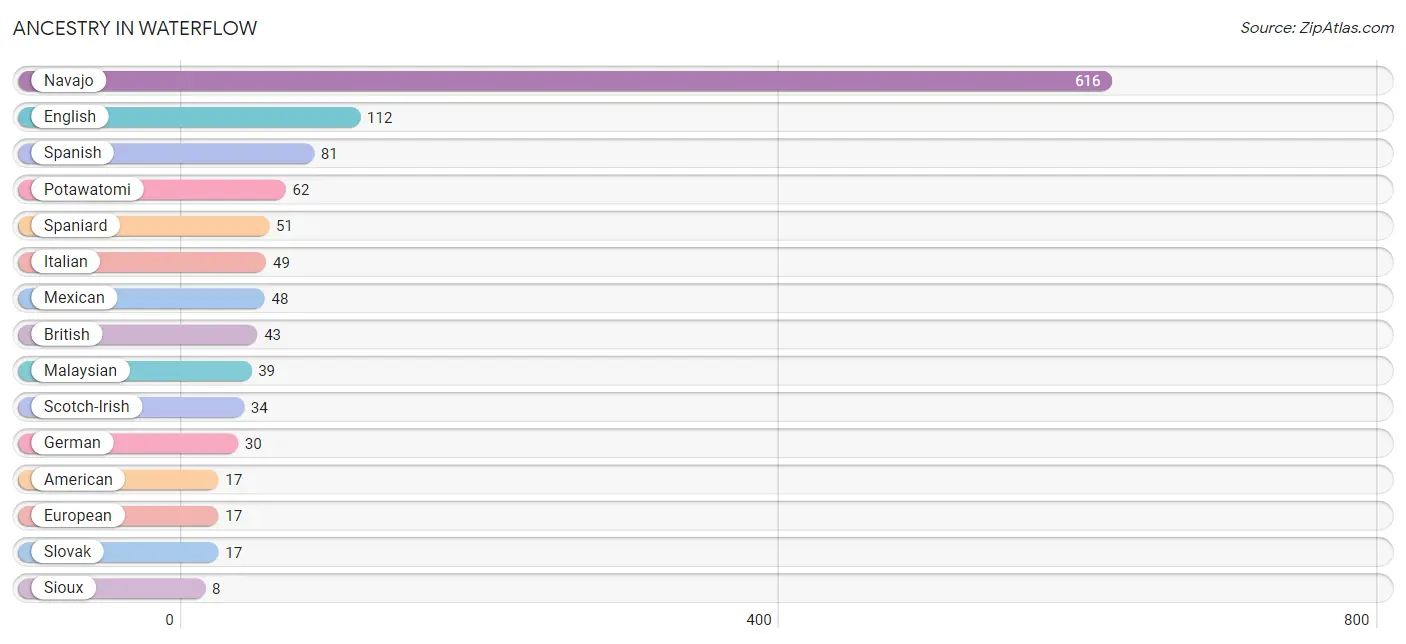
| Ancestry | # Population | % Population |
| American | 17 | 1.3% |
| British | 43 | 3.3% |
| English | 112 | 8.5% |
| European | 17 | 1.3% |
| French Canadian | 6 | 0.4% |
| German | 30 | 2.3% |
| Italian | 49 | 3.7% |
| Malaysian | 39 | 2.9% |
| Mexican | 48 | 3.6% |
| Navajo | 616 | 46.5% |
| Potawatomi | 62 | 4.7% |
| Scotch-Irish | 34 | 2.6% |
| Sioux | 8 | 0.6% |
| Slovak | 17 | 1.3% |
| Spaniard | 51 | 3.8% |
| Spanish | 81 | 6.1% |
| Swiss | 7 | 0.5% | View All 17 Rows |
Immigrants in Waterflow
The most numerous immigrant groups reported in Waterflow came from Asia (39 | 2.9%), Laos (39 | 2.9%), and South Eastern Asia (39 | 2.9%), together accounting for 8.8% of all Waterflow residents.
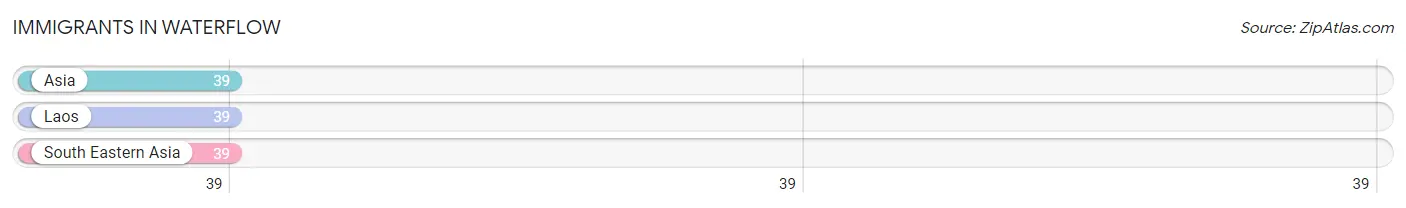
| Immigration Origin | # Population | % Population |
| Asia | 39 | 2.9% |
| Laos | 39 | 2.9% |
| South Eastern Asia | 39 | 2.9% | View All 3 Rows |
Sex and Age in Waterflow
Sex and Age in Waterflow
The most populous age groups in Waterflow are 10 to 14 Years (89 | 14.4%) for men and 30 to 34 Years (99 | 14.0%) for women.
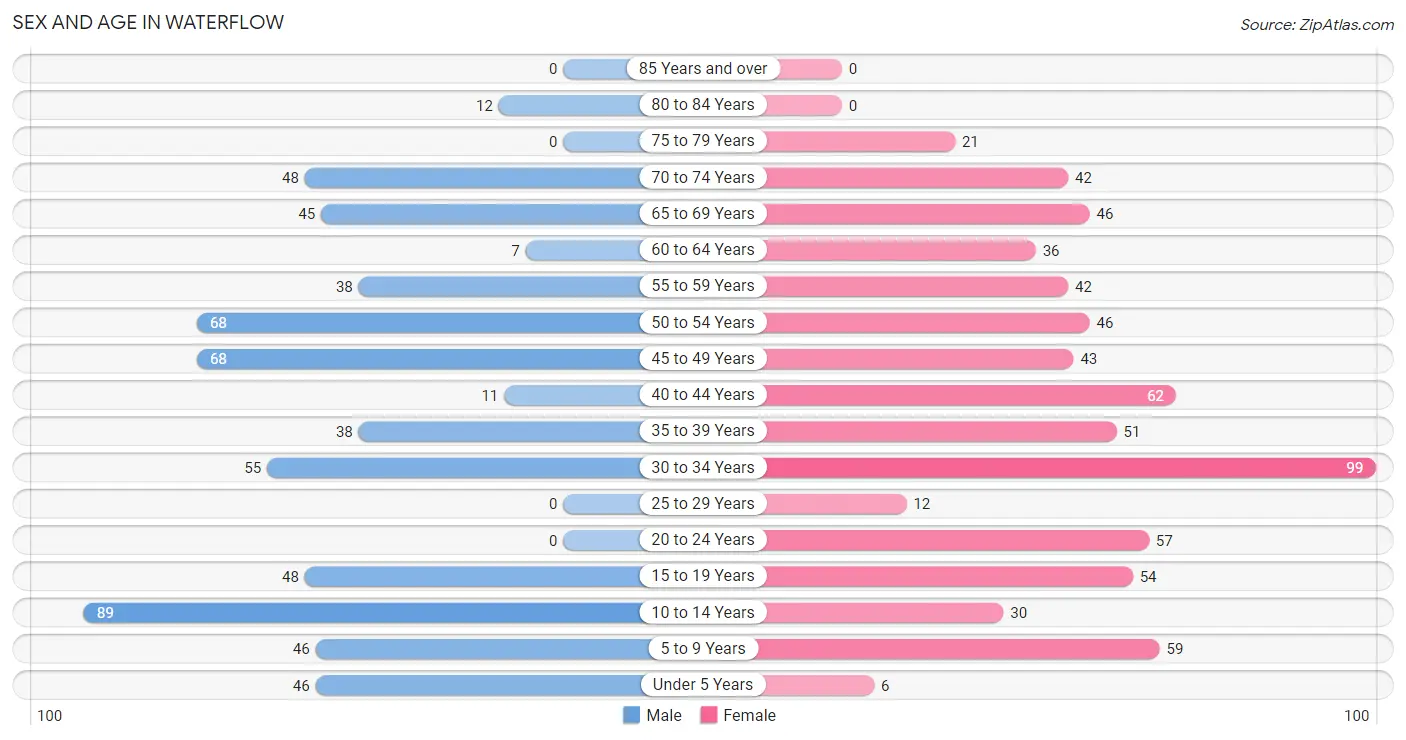
| Age Bracket | Male | Female |
| Under 5 Years | 46 (7.4%) | 6 (0.9%) |
| 5 to 9 Years | 46 (7.4%) | 59 (8.4%) |
| 10 to 14 Years | 89 (14.4%) | 30 (4.3%) |
| 15 to 19 Years | 48 (7.7%) | 54 (7.6%) |
| 20 to 24 Years | 0 (0.0%) | 57 (8.1%) |
| 25 to 29 Years | 0 (0.0%) | 12 (1.7%) |
| 30 to 34 Years | 55 (8.9%) | 99 (14.0%) |
| 35 to 39 Years | 38 (6.1%) | 51 (7.2%) |
| 40 to 44 Years | 11 (1.8%) | 62 (8.8%) |
| 45 to 49 Years | 68 (11.0%) | 43 (6.1%) |
| 50 to 54 Years | 68 (11.0%) | 46 (6.5%) |
| 55 to 59 Years | 38 (6.1%) | 42 (5.9%) |
| 60 to 64 Years | 7 (1.1%) | 36 (5.1%) |
| 65 to 69 Years | 45 (7.3%) | 46 (6.5%) |
| 70 to 74 Years | 48 (7.7%) | 42 (5.9%) |
| 75 to 79 Years | 0 (0.0%) | 21 (3.0%) |
| 80 to 84 Years | 12 (1.9%) | 0 (0.0%) |
| 85 Years and over | 0 (0.0%) | 0 (0.0%) |
| Total | 619 (100.0%) | 706 (100.0%) |
Families and Households in Waterflow
Median Family Size in Waterflow
The median family size in Waterflow is 3.75 persons per family, with married-couple families (230 | 73.3%) accounting for the largest median family size of 4 persons per family. On the other hand, single male/father families (41 | 13.1%) represent the smallest median family size with 2.76 persons per family.
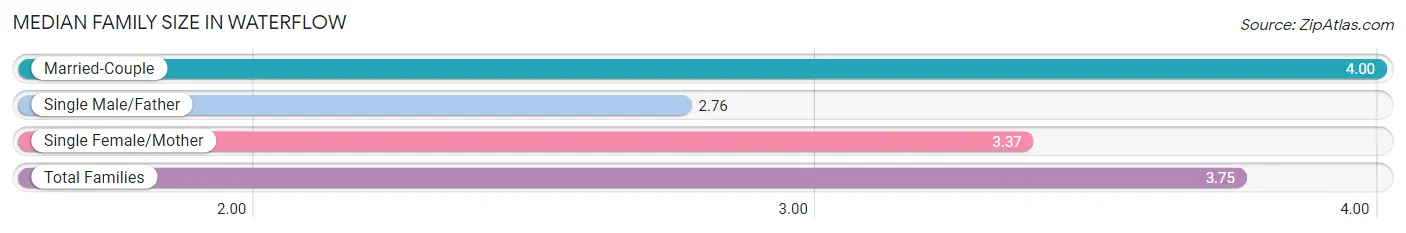
| Family Type | # Families | Family Size |
| Married-Couple | 230 (73.3%) | 4.00 |
| Single Male/Father | 41 (13.1%) | 2.76 |
| Single Female/Mother | 43 (13.7%) | 3.37 |
| Total Families | 314 (100.0%) | 3.75 |
Median Household Size in Waterflow
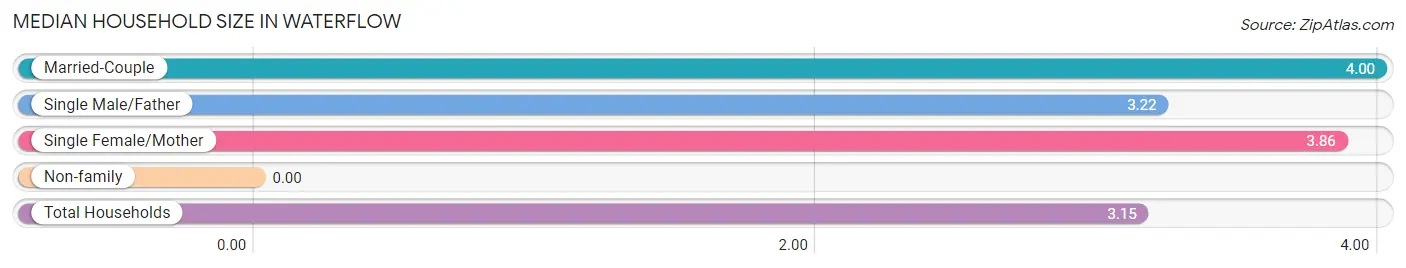
| Household Type | # Households | Household Size |
| Married-Couple | 230 (54.6%) | 4.00 |
| Single Male/Father | 41 (9.7%) | 3.22 |
| Single Female/Mother | 43 (10.2%) | 3.86 |
| Non-family | 107 (25.4%) | - |
| Total Households | 421 (100.0%) | 3.15 |
Household Size by Marriage Status in Waterflow
Out of a total of 421 households in Waterflow, 314 (74.6%) are family households, while 107 (25.4%) are nonfamily households. The most numerous type of family households are 2-person households, comprising 115, and the most common type of nonfamily households are 1-person households, comprising 107.
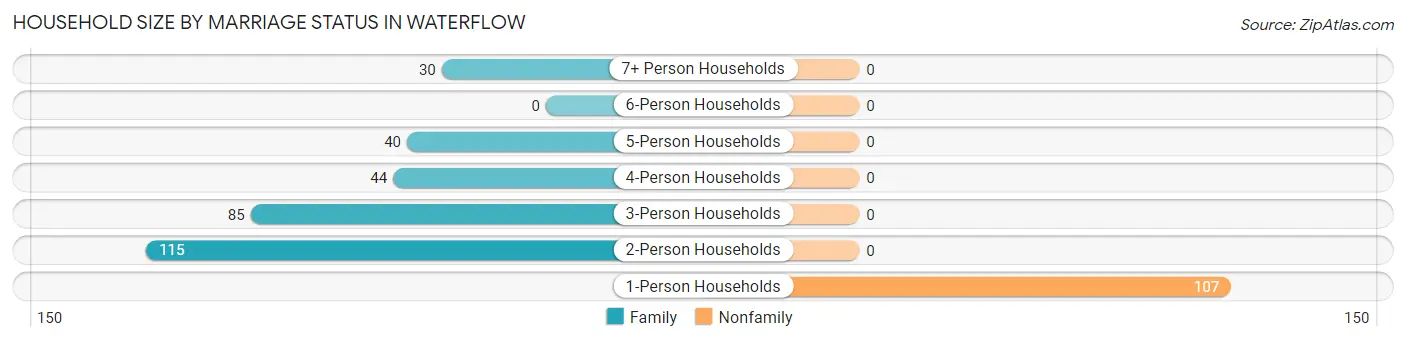
| Household Size | Family Households | Nonfamily Households |
| 1-Person Households | - | 107 (25.4%) |
| 2-Person Households | 115 (27.3%) | 0 (0.0%) |
| 3-Person Households | 85 (20.2%) | 0 (0.0%) |
| 4-Person Households | 44 (10.4%) | 0 (0.0%) |
| 5-Person Households | 40 (9.5%) | 0 (0.0%) |
| 6-Person Households | 0 (0.0%) | 0 (0.0%) |
| 7+ Person Households | 30 (7.1%) | 0 (0.0%) |
| Total | 314 (74.6%) | 107 (25.4%) |
Female Fertility in Waterflow
Fertility by Age in Waterflow
Average fertility rate in Waterflow is 21.0 births per 1,000 women. Women in the age bracket of 35 to 50 years have the highest fertility rate with 51.0 births per 1,000 women. Women in the age bracket of 35 to 50 years acount for 100.0% of all women with births.
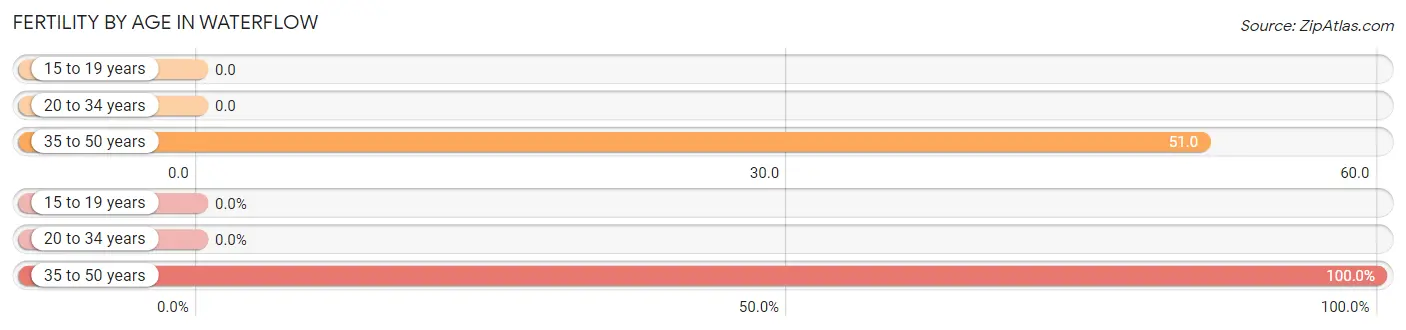
| Age Bracket | Women with Births | Births / 1,000 Women |
| 15 to 19 years | 0 (0.0%) | 0.0 |
| 20 to 34 years | 0 (0.0%) | 0.0 |
| 35 to 50 years | 8 (100.0%) | 51.0 |
| Total | 8 (100.0%) | 21.0 |
Fertility by Age by Marriage Status in Waterflow
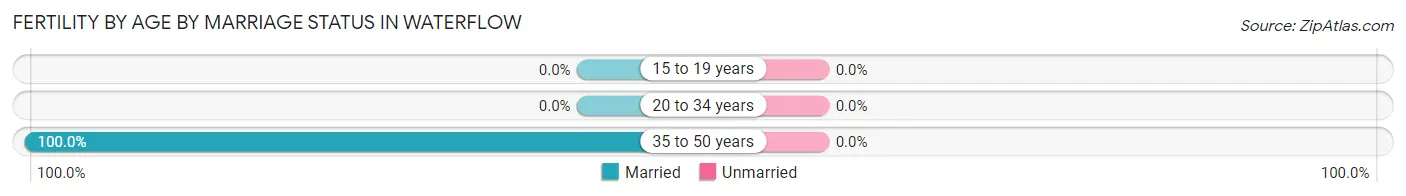
| Age Bracket | Married | Unmarried |
| 15 to 19 years | 0 (0.0%) | 0 (0.0%) |
| 20 to 34 years | 0 (0.0%) | 0 (0.0%) |
| 35 to 50 years | 8 (100.0%) | 0 (0.0%) |
| Total | 8 (100.0%) | 0 (0.0%) |
Fertility by Education in Waterflow
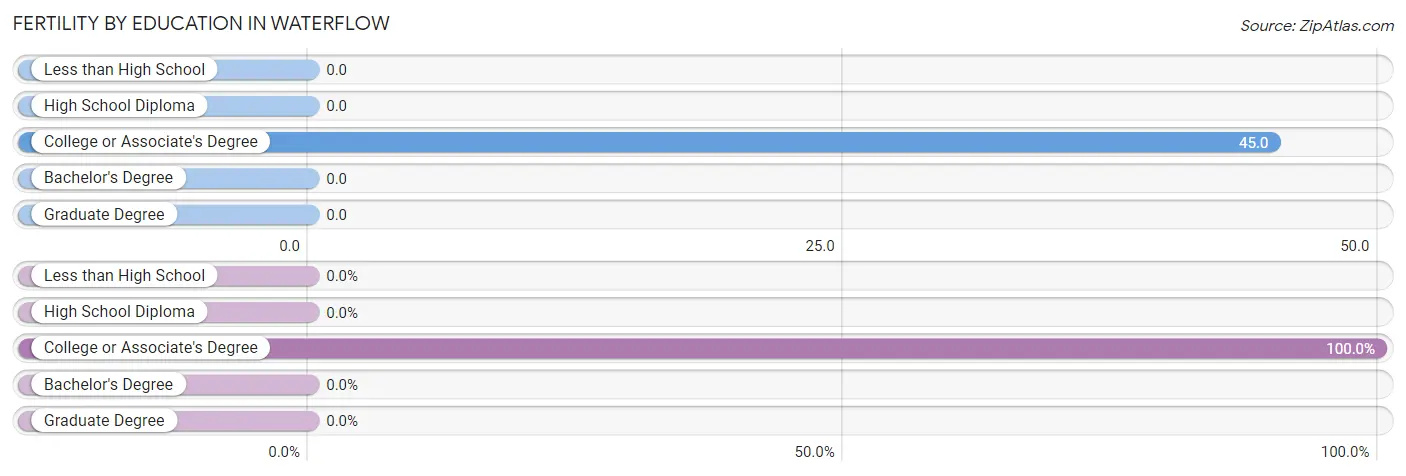
| Educational Attainment | Women with Births | Births / 1,000 Women |
| Less than High School | 0 (0.0%) | 0.0 |
| High School Diploma | 0 (0.0%) | 0.0 |
| College or Associate's Degree | 8 (100.0%) | 45.0 |
| Bachelor's Degree | 0 (0.0%) | 0.0 |
| Graduate Degree | 0 (0.0%) | 0.0 |
| Total | 8 (100.0%) | 21.0 |
Fertility by Education by Marriage Status in Waterflow
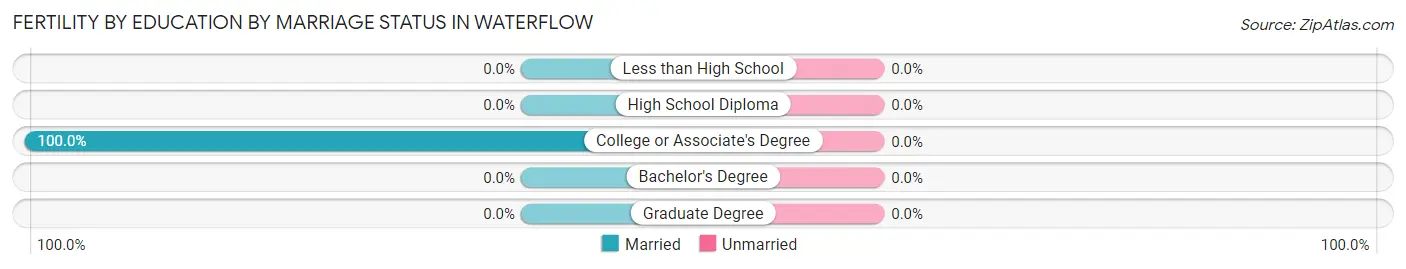
| Educational Attainment | Married | Unmarried |
| Less than High School | 0 (0.0%) | 0 (0.0%) |
| High School Diploma | 0 (0.0%) | 0 (0.0%) |
| College or Associate's Degree | 8 (100.0%) | 0 (0.0%) |
| Bachelor's Degree | 0 (0.0%) | 0 (0.0%) |
| Graduate Degree | 0 (0.0%) | 0 (0.0%) |
| Total | 8 (100.0%) | 0 (0.0%) |
Employment Characteristics in Waterflow
Employment by Class of Employer in Waterflow
Among the 486 employed individuals in Waterflow, private company employees (351 | 72.2%), not-for-profit organizations (50 | 10.3%), and local government employees (24 | 4.9%) make up the most common classes of employment.
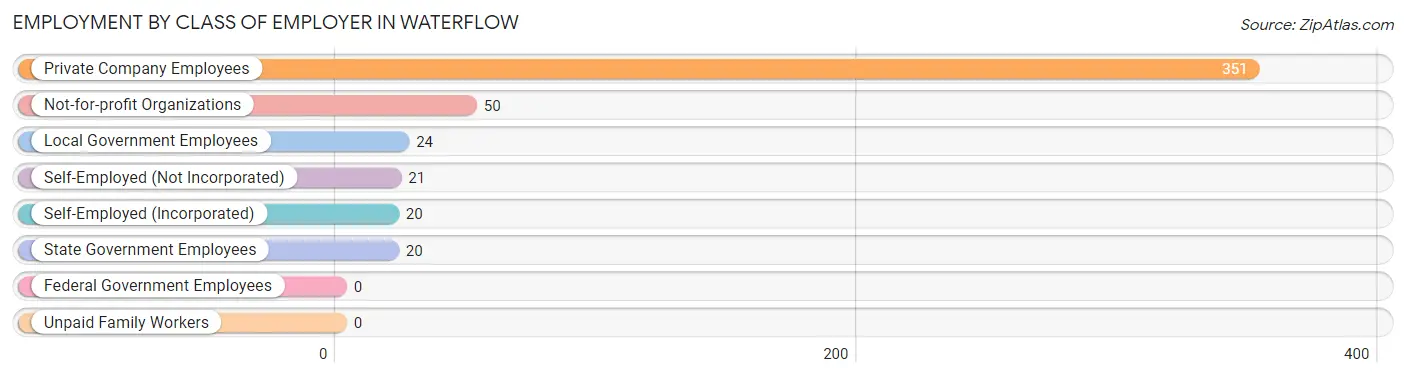
| Employer Class | # Employees | % Employees |
| Private Company Employees | 351 | 72.2% |
| Self-Employed (Incorporated) | 20 | 4.1% |
| Self-Employed (Not Incorporated) | 21 | 4.3% |
| Not-for-profit Organizations | 50 | 10.3% |
| Local Government Employees | 24 | 4.9% |
| State Government Employees | 20 | 4.1% |
| Federal Government Employees | 0 | 0.0% |
| Unpaid Family Workers | 0 | 0.0% |
| Total | 486 | 100.0% |
Employment Status by Age in Waterflow
According to the labor force statistics for Waterflow, out of the total population over 16 years of age (973), 58.6% or 570 individuals are in the labor force, with 8.4% or 48 of them unemployed. The age group with the highest labor force participation rate is 20 to 24 years, with 100.0% or 57 individuals in the labor force. Within the labor force, the 20 to 24 years age range has the highest percentage of unemployed individuals, with 54.4% or 31 of them being unemployed.
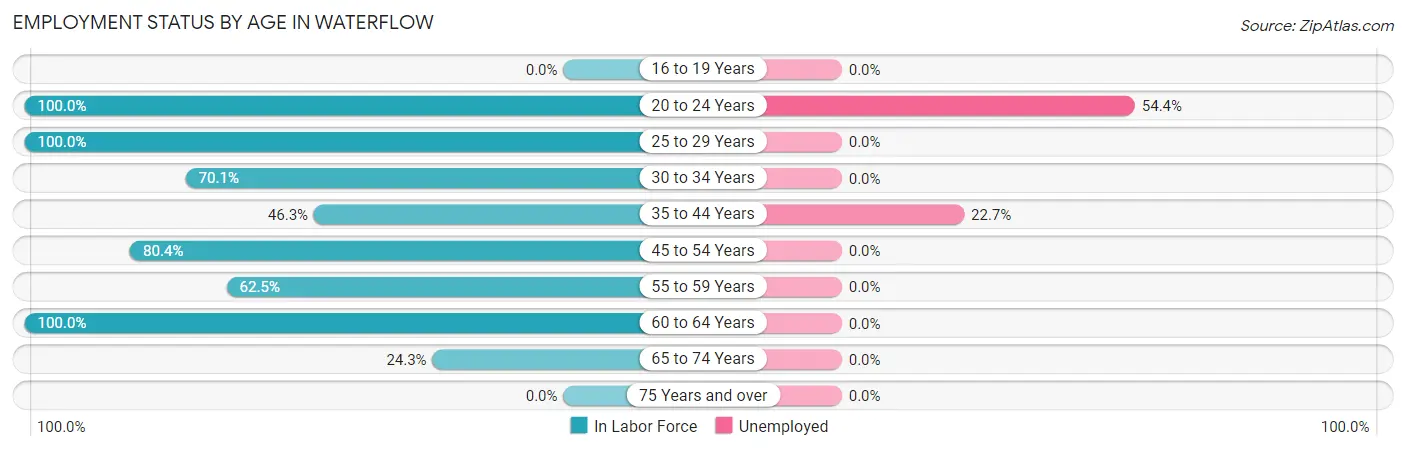
| Age Bracket | In Labor Force | Unemployed |
| 16 to 19 Years | 0 (0.0%) | 0 (0.0%) |
| 20 to 24 Years | 57 (100.0%) | 31 (54.4%) |
| 25 to 29 Years | 12 (100.0%) | 0 (0.0%) |
| 30 to 34 Years | 108 (70.1%) | 0 (0.0%) |
| 35 to 44 Years | 75 (46.3%) | 17 (22.7%) |
| 45 to 54 Years | 181 (80.4%) | 0 (0.0%) |
| 55 to 59 Years | 50 (62.5%) | 0 (0.0%) |
| 60 to 64 Years | 43 (100.0%) | 0 (0.0%) |
| 65 to 74 Years | 44 (24.3%) | 0 (0.0%) |
| 75 Years and over | 0 (0.0%) | 0 (0.0%) |
| Total | 570 (58.6%) | 48 (8.4%) |
Employment Status by Educational Attainment in Waterflow
According to labor force statistics for Waterflow, 69.4% of individuals (469) out of the total population between 25 and 64 years of age (676) are in the labor force, with 3.6% or 17 of them being unemployed. The group with the highest labor force participation rate are those with the educational attainment of bachelor's degree or higher, with 100.0% or 36 individuals in the labor force. Within the labor force, individuals with less than high school education have the highest percentage of unemployment, with 19.1% or 17 of them being unemployed.
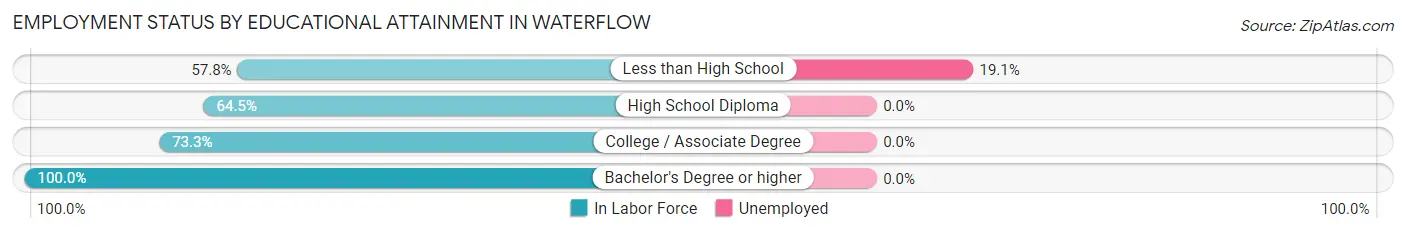
| Educational Attainment | In Labor Force | Unemployed |
| Less than High School | 89 (57.8%) | 29 (19.1%) |
| High School Diploma | 89 (64.5%) | 0 (0.0%) |
| College / Associate Degree | 255 (73.3%) | 0 (0.0%) |
| Bachelor's Degree or higher | 36 (100.0%) | 0 (0.0%) |
| Total | 469 (69.4%) | 24 (3.6%) |
Employment Occupations by Sex in Waterflow
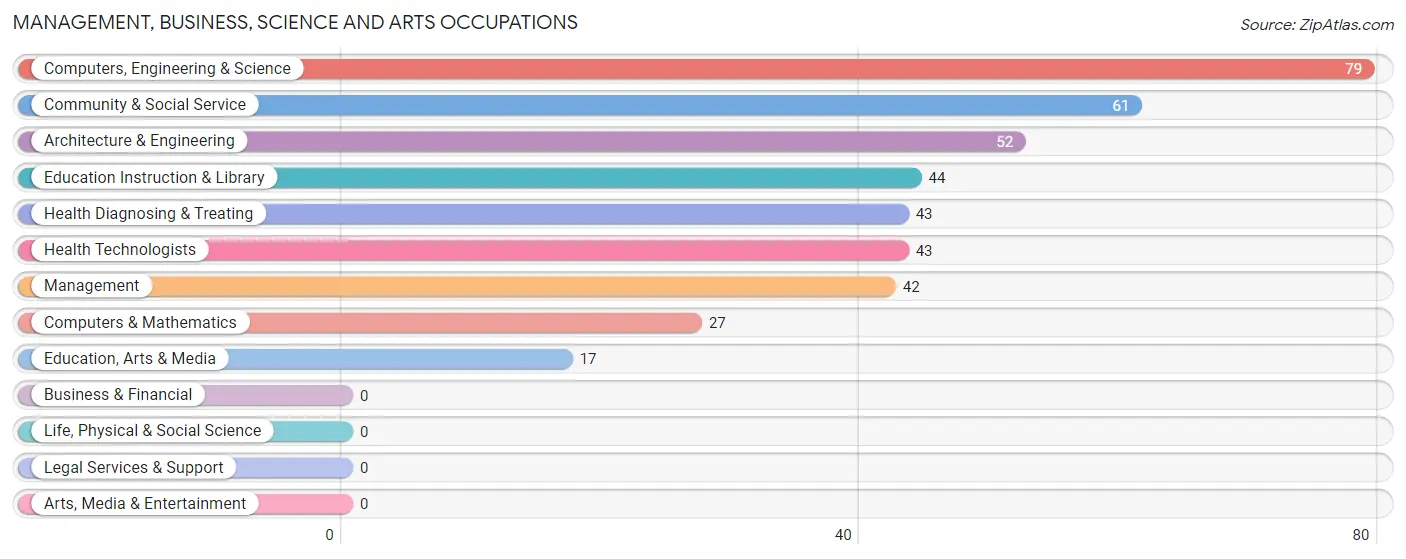
Management, Business, Science and Arts Occupations
The most common Management, Business, Science and Arts occupations in Waterflow are Computers, Engineering & Science (79 | 15.1%), Community & Social Service (61 | 11.7%), Architecture & Engineering (52 | 10.0%), Education Instruction & Library (44 | 8.4%), and Health Diagnosing & Treating (43 | 8.2%).
Management, Business, Science and Arts Occupations by Sex
Within the Management, Business, Science and Arts occupations in Waterflow, the most male-oriented occupations are Computers, Engineering & Science (100.0%), Computers & Mathematics (100.0%), and Architecture & Engineering (100.0%), while the most female-oriented occupations are Education Instruction & Library (100.0%), Community & Social Service (72.1%), and Health Diagnosing & Treating (53.5%).
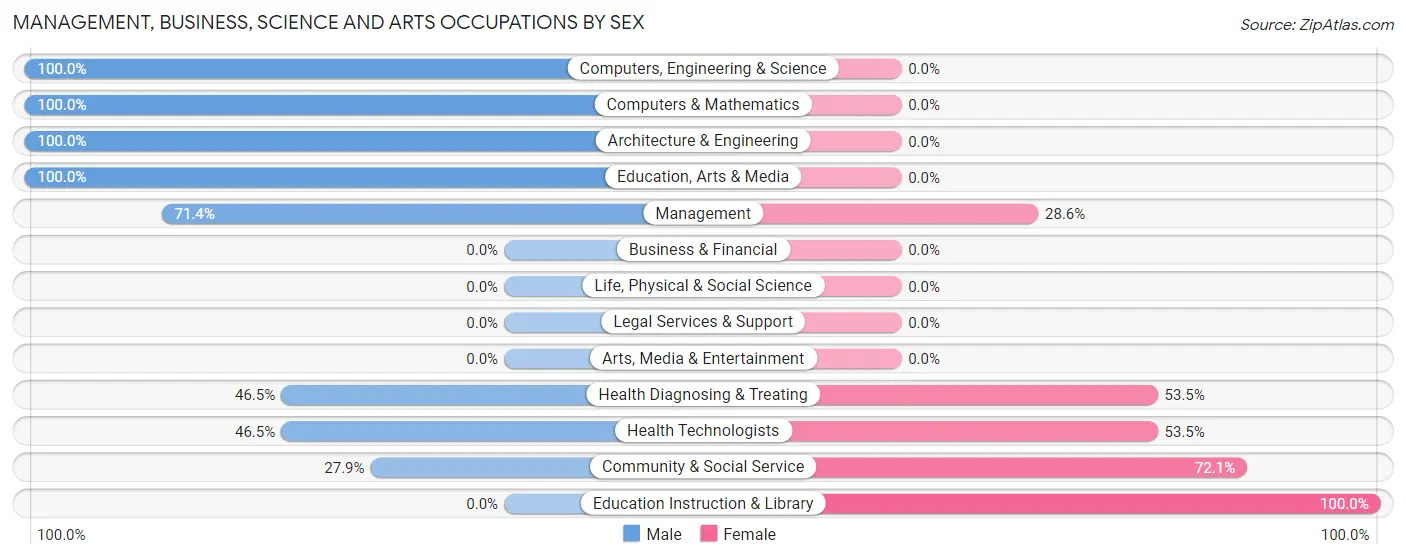
| Occupation | Male | Female |
| Management | 30 (71.4%) | 12 (28.6%) |
| Business & Financial | 0 (0.0%) | 0 (0.0%) |
| Computers, Engineering & Science | 79 (100.0%) | 0 (0.0%) |
| Computers & Mathematics | 27 (100.0%) | 0 (0.0%) |
| Architecture & Engineering | 52 (100.0%) | 0 (0.0%) |
| Life, Physical & Social Science | 0 (0.0%) | 0 (0.0%) |
| Community & Social Service | 17 (27.9%) | 44 (72.1%) |
| Education, Arts & Media | 17 (100.0%) | 0 (0.0%) |
| Legal Services & Support | 0 (0.0%) | 0 (0.0%) |
| Education Instruction & Library | 0 (0.0%) | 44 (100.0%) |
| Arts, Media & Entertainment | 0 (0.0%) | 0 (0.0%) |
| Health Diagnosing & Treating | 20 (46.5%) | 23 (53.5%) |
| Health Technologists | 20 (46.5%) | 23 (53.5%) |
| Total (Category) | 146 (64.9%) | 79 (35.1%) |
| Total (Overall) | 269 (51.5%) | 253 (48.5%) |
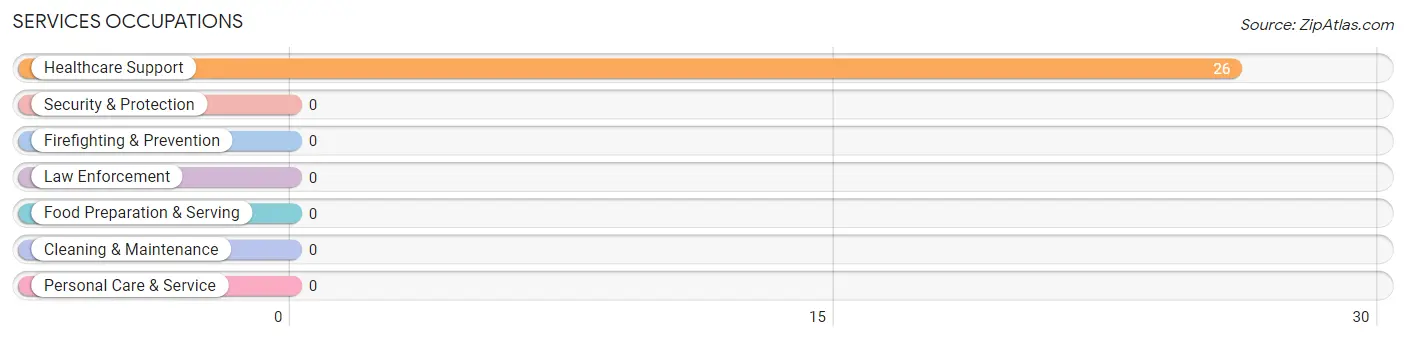
Services Occupations
The most common Services occupations in Waterflow are , and Healthcare Support (26 | 5.0%).
Services Occupations by Sex
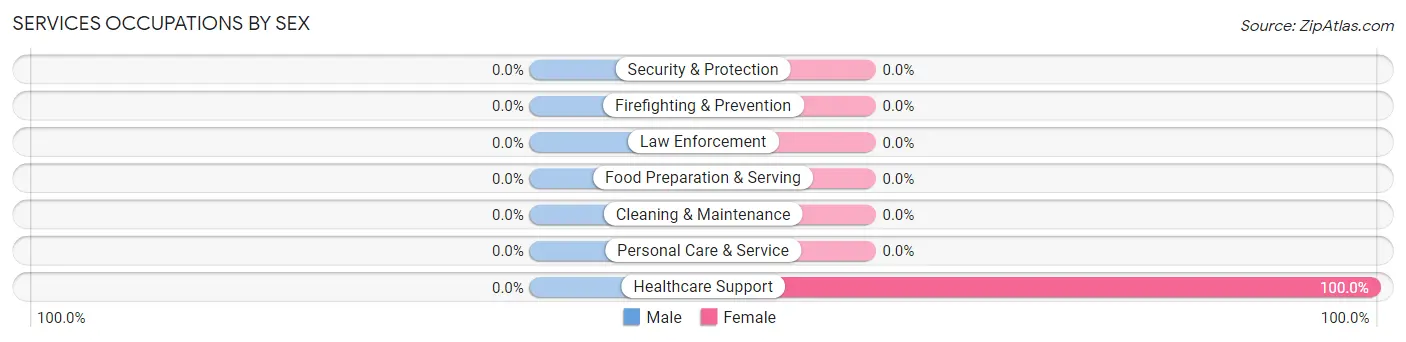
| Occupation | Male | Female |
| Healthcare Support | 0 (0.0%) | 26 (100.0%) |
| Security & Protection | 0 (0.0%) | 0 (0.0%) |
| Firefighting & Prevention | 0 (0.0%) | 0 (0.0%) |
| Law Enforcement | 0 (0.0%) | 0 (0.0%) |
| Food Preparation & Serving | 0 (0.0%) | 0 (0.0%) |
| Cleaning & Maintenance | 0 (0.0%) | 0 (0.0%) |
| Personal Care & Service | 0 (0.0%) | 0 (0.0%) |
| Total (Category) | 0 (0.0%) | 26 (100.0%) |
| Total (Overall) | 269 (51.5%) | 253 (48.5%) |
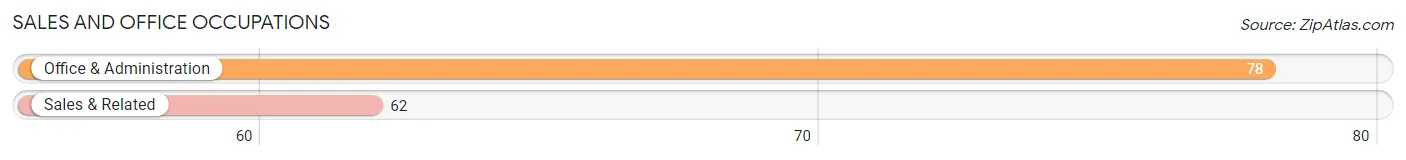
Sales and Office Occupations
The most common Sales and Office occupations in Waterflow are Office & Administration (78 | 14.9%), and Sales & Related (62 | 11.9%).
Sales and Office Occupations by Sex
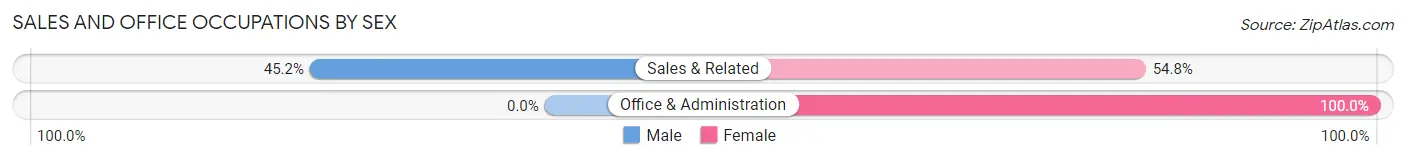
| Occupation | Male | Female |
| Sales & Related | 28 (45.2%) | 34 (54.8%) |
| Office & Administration | 0 (0.0%) | 78 (100.0%) |
| Total (Category) | 28 (20.0%) | 112 (80.0%) |
| Total (Overall) | 269 (51.5%) | 253 (48.5%) |
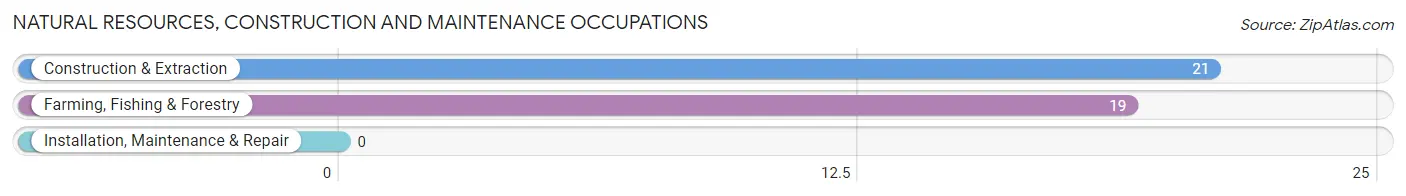
Natural Resources, Construction and Maintenance Occupations
The most common Natural Resources, Construction and Maintenance occupations in Waterflow are Construction & Extraction (21 | 4.0%), and Farming, Fishing & Forestry (19 | 3.6%).
Natural Resources, Construction and Maintenance Occupations by Sex
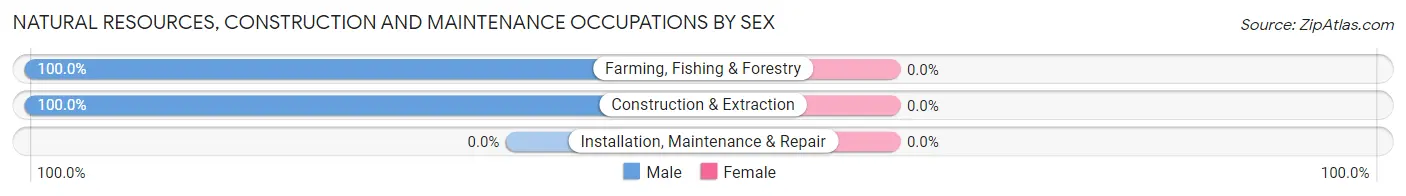
| Occupation | Male | Female |
| Farming, Fishing & Forestry | 19 (100.0%) | 0 (0.0%) |
| Construction & Extraction | 21 (100.0%) | 0 (0.0%) |
| Installation, Maintenance & Repair | 0 (0.0%) | 0 (0.0%) |
| Total (Category) | 40 (100.0%) | 0 (0.0%) |
| Total (Overall) | 269 (51.5%) | 253 (48.5%) |
Production, Transportation and Moving Occupations
The most common Production, Transportation and Moving occupations in Waterflow are Production (57 | 10.9%), and Transportation (34 | 6.5%).
Production, Transportation and Moving Occupations by Sex
| Occupation | Male | Female |
| Production | 21 (36.8%) | 36 (63.2%) |
| Transportation | 34 (100.0%) | 0 (0.0%) |
| Material Moving | 0 (0.0%) | 0 (0.0%) |
| Total (Category) | 55 (60.4%) | 36 (39.6%) |
| Total (Overall) | 269 (51.5%) | 253 (48.5%) |
Employment Industries by Sex in Waterflow
Employment Industries in Waterflow
The major employment industries in Waterflow include Health Care & Social Assistance (85 | 16.3%), Manufacturing (59 | 11.3%), Construction (42 | 8.1%), Mining, Quarrying, & Extraction (41 | 7.9%), and Agriculture, Fishing & Hunting (40 | 7.7%).
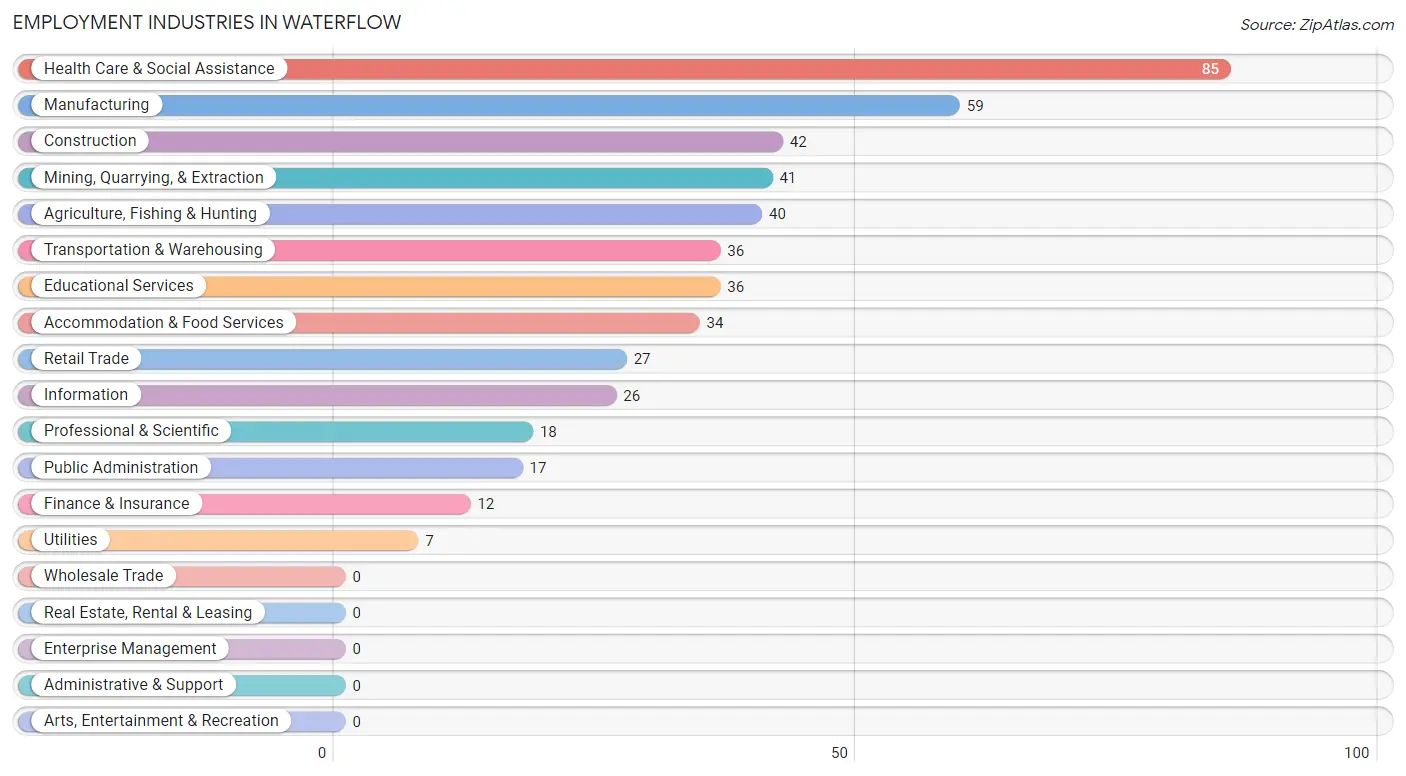
Employment Industries by Sex in Waterflow
The Waterflow industries that see more men than women are Agriculture, Fishing & Hunting (100.0%), Mining, Quarrying, & Extraction (100.0%), and Construction (100.0%), whereas the industries that tend to have a higher number of women are Transportation & Warehousing (100.0%), Information (100.0%), and Finance & Insurance (100.0%).
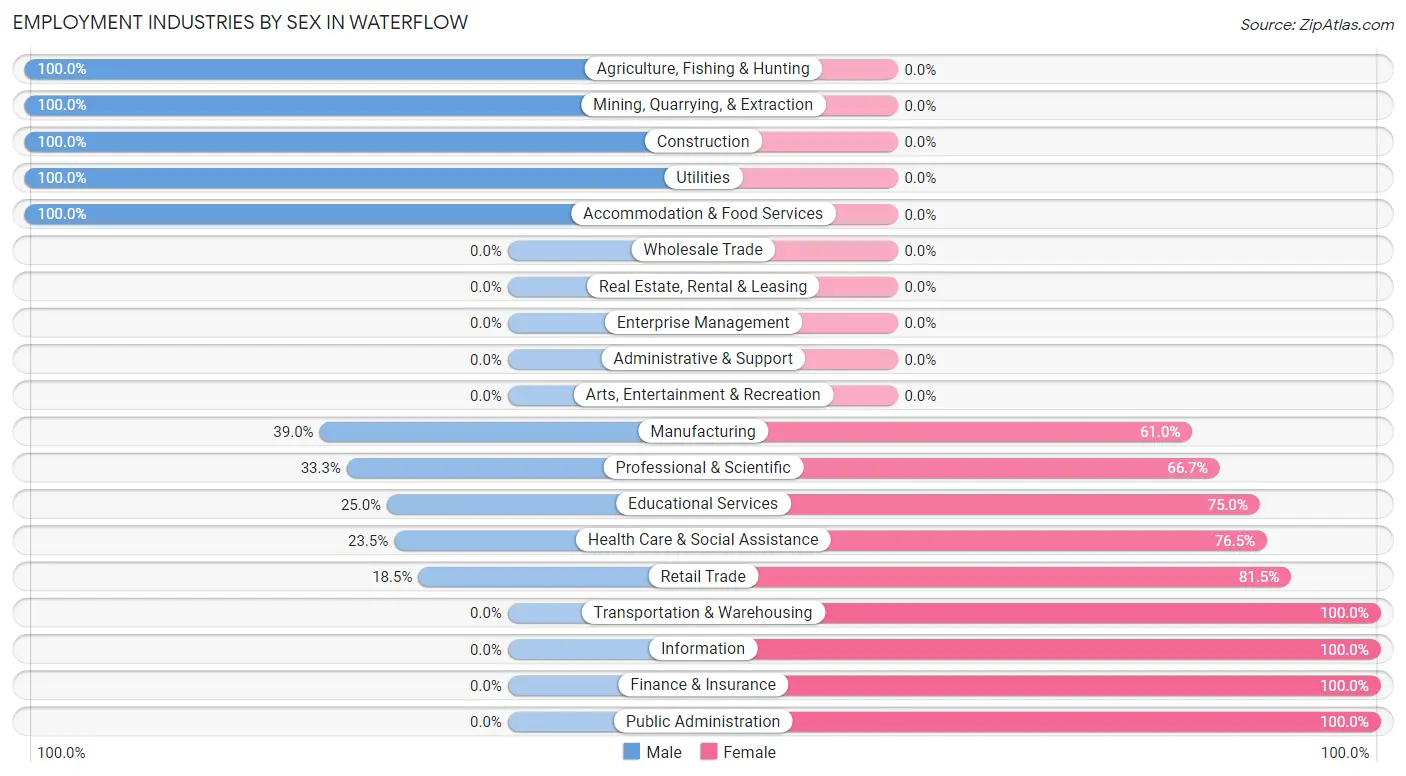
| Industry | Male | Female |
| Agriculture, Fishing & Hunting | 40 (100.0%) | 0 (0.0%) |
| Mining, Quarrying, & Extraction | 41 (100.0%) | 0 (0.0%) |
| Construction | 42 (100.0%) | 0 (0.0%) |
| Manufacturing | 23 (39.0%) | 36 (61.0%) |
| Wholesale Trade | 0 (0.0%) | 0 (0.0%) |
| Retail Trade | 5 (18.5%) | 22 (81.5%) |
| Transportation & Warehousing | 0 (0.0%) | 36 (100.0%) |
| Utilities | 7 (100.0%) | 0 (0.0%) |
| Information | 0 (0.0%) | 26 (100.0%) |
| Finance & Insurance | 0 (0.0%) | 12 (100.0%) |
| Real Estate, Rental & Leasing | 0 (0.0%) | 0 (0.0%) |
| Professional & Scientific | 6 (33.3%) | 12 (66.7%) |
| Enterprise Management | 0 (0.0%) | 0 (0.0%) |
| Administrative & Support | 0 (0.0%) | 0 (0.0%) |
| Educational Services | 9 (25.0%) | 27 (75.0%) |
| Health Care & Social Assistance | 20 (23.5%) | 65 (76.5%) |
| Arts, Entertainment & Recreation | 0 (0.0%) | 0 (0.0%) |
| Accommodation & Food Services | 34 (100.0%) | 0 (0.0%) |
| Public Administration | 0 (0.0%) | 17 (100.0%) |
| Total | 269 (51.5%) | 253 (48.5%) |
Education in Waterflow
School Enrollment in Waterflow
The most common levels of schooling among the 397 students in Waterflow are elementary school (147 | 37.0%), high school (102 | 25.7%), and middle school (77 | 19.4%).
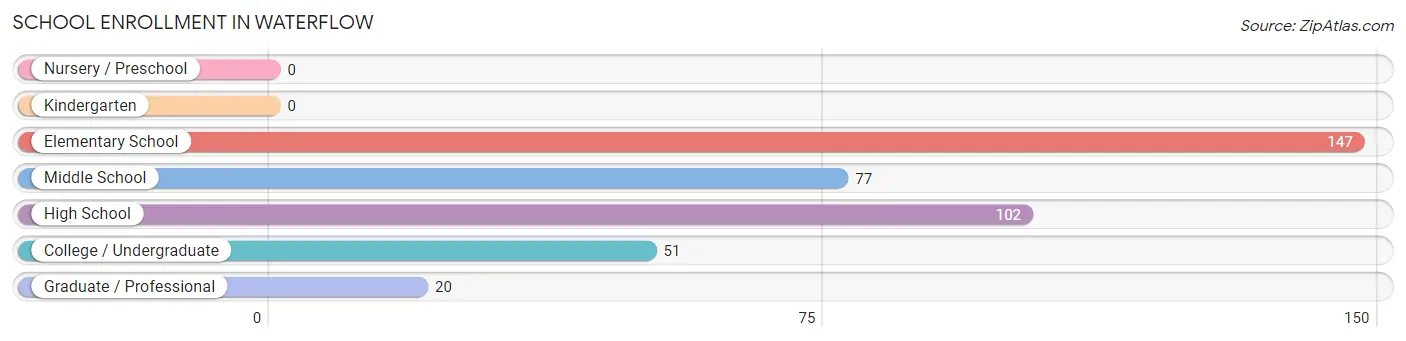
| School Level | # Students | % Students |
| Nursery / Preschool | 0 | 0.0% |
| Kindergarten | 0 | 0.0% |
| Elementary School | 147 | 37.0% |
| Middle School | 77 | 19.4% |
| High School | 102 | 25.7% |
| College / Undergraduate | 51 | 12.9% |
| Graduate / Professional | 20 | 5.0% |
| Total | 397 | 100.0% |
School Enrollment by Age by Funding Source in Waterflow
Out of a total of 397 students who are enrolled in schools in Waterflow, 45 (11.3%) attend a private institution, while the remaining 352 (88.7%) are enrolled in public schools. The age group of 25 to 34 year olds has the highest likelihood of being enrolled in private schools, with 34 (66.7% in the age bracket) enrolled. Conversely, the age group of 5 to 9 year old has the lowest likelihood of being enrolled in a private school, with 105 (100.0% in the age bracket) attending a public institution.
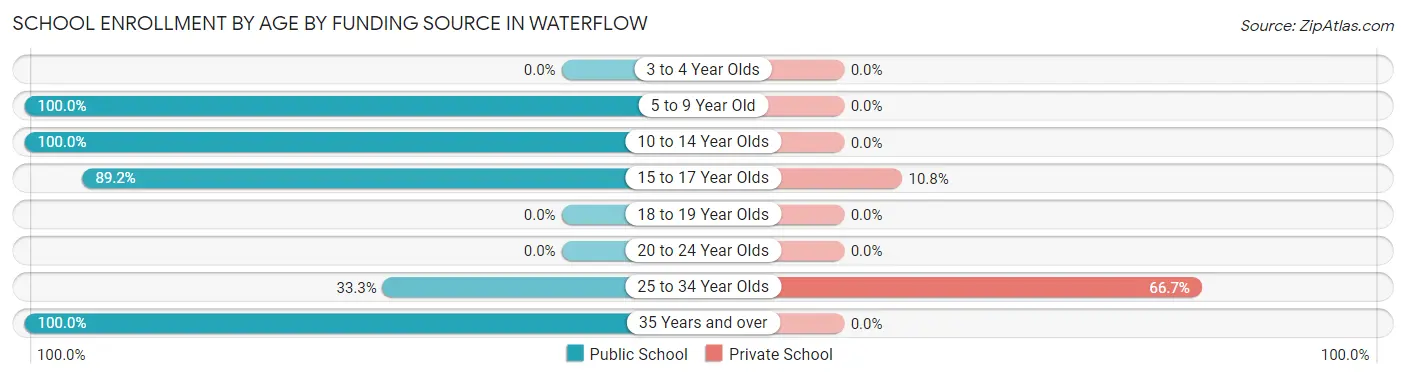
| Age Bracket | Public School | Private School |
| 3 to 4 Year Olds | 0 (0.0%) | 0 (0.0%) |
| 5 to 9 Year Old | 105 (100.0%) | 0 (0.0%) |
| 10 to 14 Year Olds | 119 (100.0%) | 0 (0.0%) |
| 15 to 17 Year Olds | 91 (89.2%) | 11 (10.8%) |
| 18 to 19 Year Olds | 0 (0.0%) | 0 (0.0%) |
| 20 to 24 Year Olds | 0 (0.0%) | 0 (0.0%) |
| 25 to 34 Year Olds | 17 (33.3%) | 34 (66.7%) |
| 35 Years and over | 20 (100.0%) | 0 (0.0%) |
| Total | 352 (88.7%) | 45 (11.3%) |
Educational Attainment by Field of Study in Waterflow
Education (39 | 38.6%), engineering (28 | 27.7%), science & technology (25 | 24.7%), and arts & humanities (9 | 8.9%) are the most common fields of study among 101 individuals in Waterflow who have obtained a bachelor's degree or higher.
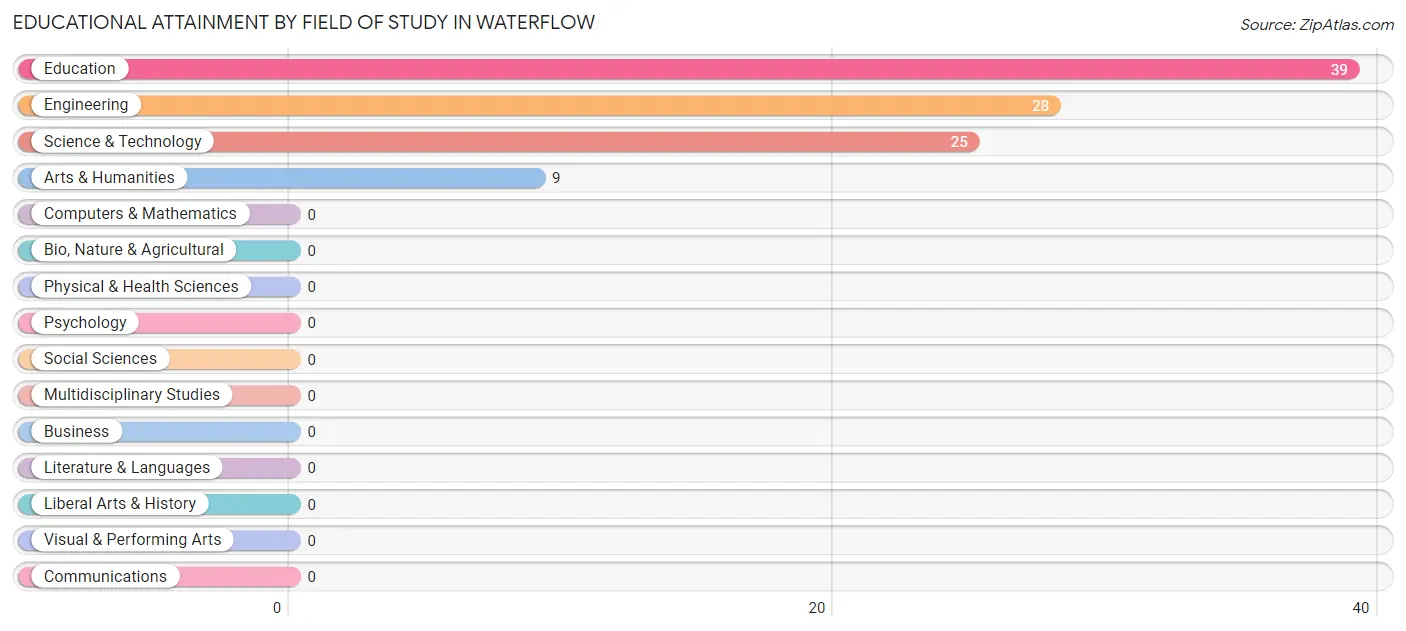
| Field of Study | # Graduates | % Graduates |
| Computers & Mathematics | 0 | 0.0% |
| Bio, Nature & Agricultural | 0 | 0.0% |
| Physical & Health Sciences | 0 | 0.0% |
| Psychology | 0 | 0.0% |
| Social Sciences | 0 | 0.0% |
| Engineering | 28 | 27.7% |
| Multidisciplinary Studies | 0 | 0.0% |
| Science & Technology | 25 | 24.7% |
| Business | 0 | 0.0% |
| Education | 39 | 38.6% |
| Literature & Languages | 0 | 0.0% |
| Liberal Arts & History | 0 | 0.0% |
| Visual & Performing Arts | 0 | 0.0% |
| Communications | 0 | 0.0% |
| Arts & Humanities | 9 | 8.9% |
| Total | 101 | 100.0% |
Transportation & Commute in Waterflow
Vehicle Availability by Sex in Waterflow
The most prevalent vehicle ownership categories in Waterflow are males with 2 vehicles (96, accounting for 35.7%) and females with 2 vehicles (47, making up 44.2%).
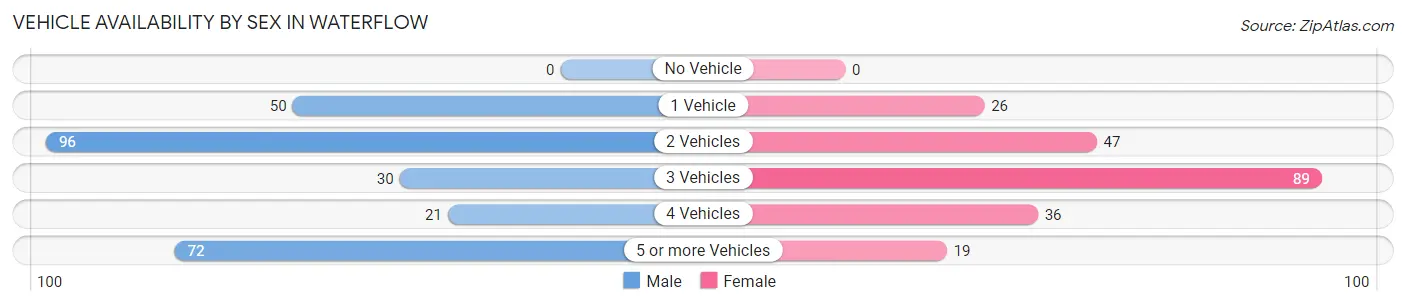
| Vehicles Available | Male | Female |
| No Vehicle | 0 (0.0%) | 0 (0.0%) |
| 1 Vehicle | 50 (18.6%) | 26 (12.0%) |
| 2 Vehicles | 96 (35.7%) | 47 (21.7%) |
| 3 Vehicles | 30 (11.2%) | 89 (41.0%) |
| 4 Vehicles | 21 (7.8%) | 36 (16.6%) |
| 5 or more Vehicles | 72 (26.8%) | 19 (8.8%) |
| Total | 269 (100.0%) | 217 (100.0%) |
Commute Time in Waterflow
The most frequently occuring commute durations in Waterflow are 5 to 9 minutes (122 commuters, 28.6%), 20 to 24 minutes (82 commuters, 19.2%), and 25 to 29 minutes (59 commuters, 13.8%).
| Commute Time | # Commuters | % Commuters |
| Less than 5 Minutes | 0 | 0.0% |
| 5 to 9 Minutes | 122 | 28.6% |
| 10 to 14 Minutes | 7 | 1.6% |
| 15 to 19 Minutes | 0 | 0.0% |
| 20 to 24 Minutes | 82 | 19.2% |
| 25 to 29 Minutes | 59 | 13.8% |
| 30 to 34 Minutes | 30 | 7.0% |
| 35 to 39 Minutes | 31 | 7.3% |
| 40 to 44 Minutes | 40 | 9.4% |
| 45 to 59 Minutes | 20 | 4.7% |
| 60 to 89 Minutes | 36 | 8.4% |
| 90 or more Minutes | 0 | 0.0% |
Commute Time by Sex in Waterflow
The most common commute times in Waterflow are 20 to 24 minutes (75 commuters, 35.7%) for males and 5 to 9 minutes (58 commuters, 26.7%) for females.
| Commute Time | Male | Female |
| Less than 5 Minutes | 0 (0.0%) | 0 (0.0%) |
| 5 to 9 Minutes | 64 (30.5%) | 58 (26.7%) |
| 10 to 14 Minutes | 0 (0.0%) | 7 (3.2%) |
| 15 to 19 Minutes | 0 (0.0%) | 0 (0.0%) |
| 20 to 24 Minutes | 75 (35.7%) | 7 (3.2%) |
| 25 to 29 Minutes | 26 (12.4%) | 33 (15.2%) |
| 30 to 34 Minutes | 0 (0.0%) | 30 (13.8%) |
| 35 to 39 Minutes | 5 (2.4%) | 26 (12.0%) |
| 40 to 44 Minutes | 21 (10.0%) | 19 (8.8%) |
| 45 to 59 Minutes | 0 (0.0%) | 20 (9.2%) |
| 60 to 89 Minutes | 19 (9.0%) | 17 (7.8%) |
| 90 or more Minutes | 0 (0.0%) | 0 (0.0%) |
Time of Departure to Work by Sex in Waterflow
The most frequent times of departure to work in Waterflow are 5:30 AM to 5:59 AM (55, 26.2%) for males and 9:00 AM to 9:59 AM (62, 28.6%) for females.
| Time of Departure | Male | Female |
| 12:00 AM to 4:59 AM | 0 (0.0%) | 0 (0.0%) |
| 5:00 AM to 5:29 AM | 0 (0.0%) | 17 (7.8%) |
| 5:30 AM to 5:59 AM | 55 (26.2%) | 7 (3.2%) |
| 6:00 AM to 6:29 AM | 20 (9.5%) | 0 (0.0%) |
| 6:30 AM to 6:59 AM | 46 (21.9%) | 43 (19.8%) |
| 7:00 AM to 7:29 AM | 40 (19.1%) | 31 (14.3%) |
| 7:30 AM to 7:59 AM | 7 (3.3%) | 0 (0.0%) |
| 8:00 AM to 8:29 AM | 23 (11.0%) | 16 (7.4%) |
| 8:30 AM to 8:59 AM | 0 (0.0%) | 22 (10.1%) |
| 9:00 AM to 9:59 AM | 0 (0.0%) | 62 (28.6%) |
| 10:00 AM to 10:59 AM | 0 (0.0%) | 0 (0.0%) |
| 11:00 AM to 11:59 AM | 19 (9.0%) | 0 (0.0%) |
| 12:00 PM to 3:59 PM | 0 (0.0%) | 19 (8.8%) |
| 4:00 PM to 11:59 PM | 0 (0.0%) | 0 (0.0%) |
| Total | 210 (100.0%) | 217 (100.0%) |
Housing Occupancy in Waterflow
Occupancy by Ownership in Waterflow
Of the total 421 dwellings in Waterflow, owner-occupied units account for 289 (68.6%), while renter-occupied units make up 132 (31.4%).
| Occupancy | # Housing Units | % Housing Units |
| Owner Occupied Housing Units | 289 | 68.6% |
| Renter-Occupied Housing Units | 132 | 31.4% |
| Total Occupied Housing Units | 421 | 100.0% |
Occupancy by Household Size in Waterflow
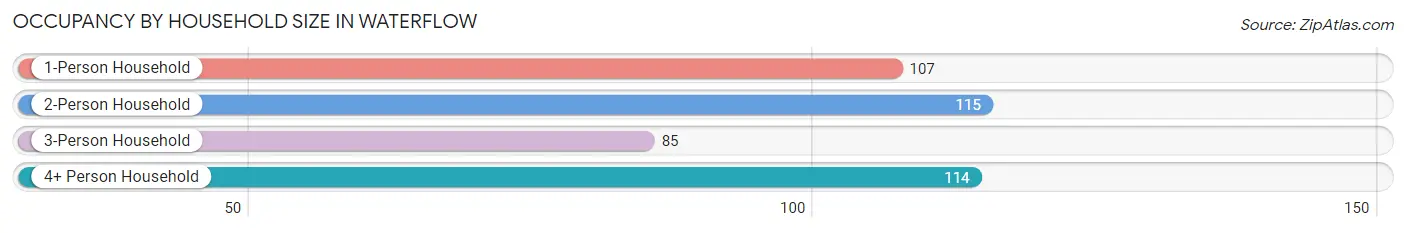
| Household Size | # Housing Units | % Housing Units |
| 1-Person Household | 107 | 25.4% |
| 2-Person Household | 115 | 27.3% |
| 3-Person Household | 85 | 20.2% |
| 4+ Person Household | 114 | 27.1% |
| Total Housing Units | 421 | 100.0% |
Occupancy by Ownership by Household Size in Waterflow
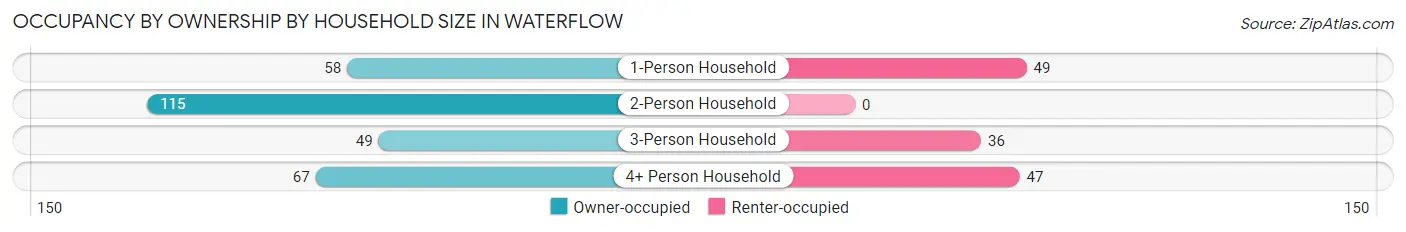
| Household Size | Owner-occupied | Renter-occupied |
| 1-Person Household | 58 (54.2%) | 49 (45.8%) |
| 2-Person Household | 115 (100.0%) | 0 (0.0%) |
| 3-Person Household | 49 (57.7%) | 36 (42.3%) |
| 4+ Person Household | 67 (58.8%) | 47 (41.2%) |
| Total Housing Units | 289 (68.6%) | 132 (31.4%) |
Occupancy by Educational Attainment in Waterflow
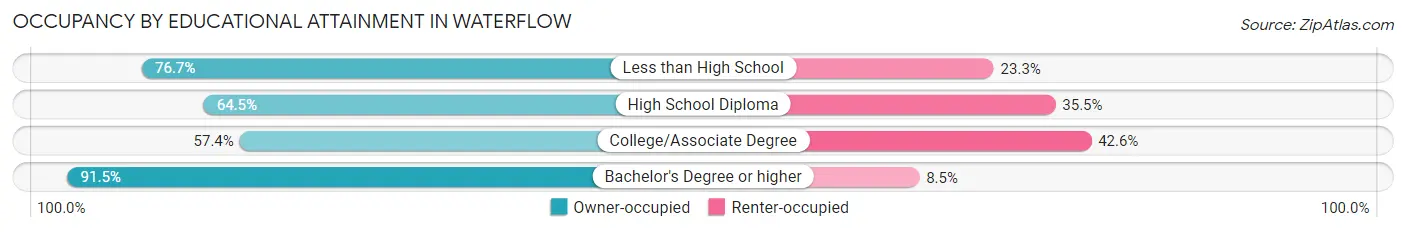
| Household Size | Owner-occupied | Renter-occupied |
| Less than High School | 56 (76.7%) | 17 (23.3%) |
| High School Diploma | 49 (64.5%) | 27 (35.5%) |
| College/Associate Degree | 109 (57.4%) | 81 (42.6%) |
| Bachelor's Degree or higher | 75 (91.5%) | 7 (8.5%) |
Occupancy by Age of Householder in Waterflow
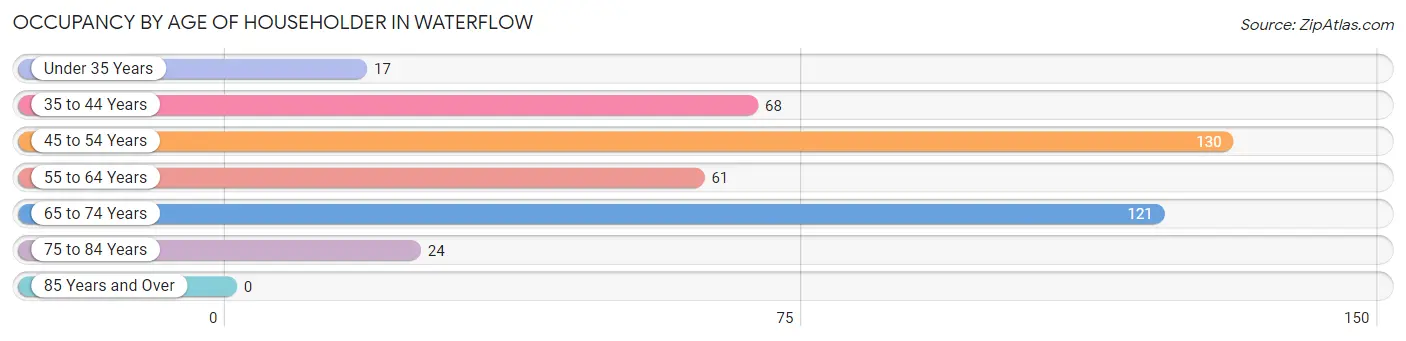
| Age Bracket | # Households | % Households |
| Under 35 Years | 17 | 4.0% |
| 35 to 44 Years | 68 | 16.2% |
| 45 to 54 Years | 130 | 30.9% |
| 55 to 64 Years | 61 | 14.5% |
| 65 to 74 Years | 121 | 28.7% |
| 75 to 84 Years | 24 | 5.7% |
| 85 Years and Over | 0 | 0.0% |
| Total | 421 | 100.0% |
Housing Finances in Waterflow
Median Income by Occupancy in Waterflow
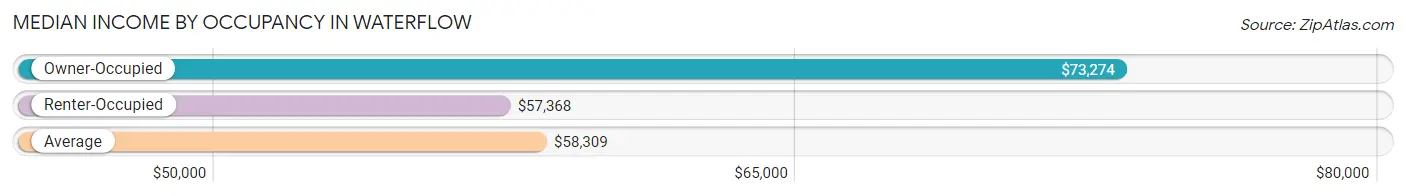
| Occupancy Type | # Households | Median Income |
| Owner-Occupied | 289 (68.6%) | $73,274 |
| Renter-Occupied | 132 (31.4%) | $57,368 |
| Average | 421 (100.0%) | $58,309 |
Occupancy by Householder Income Bracket in Waterflow
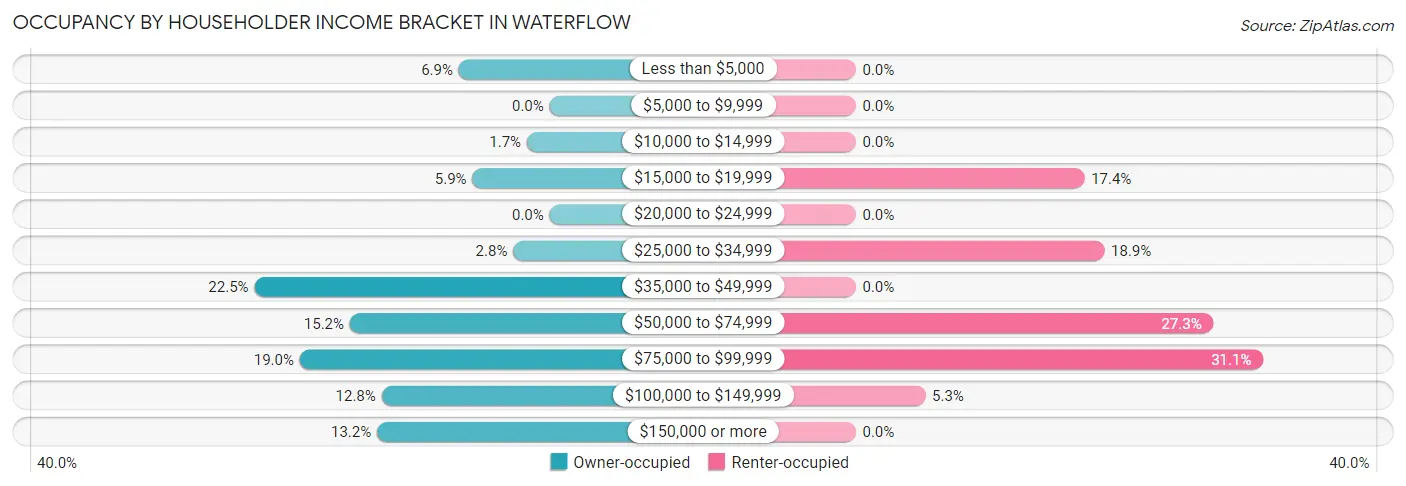
| Income Bracket | Owner-occupied | Renter-occupied |
| Less than $5,000 | 20 (6.9%) | 0 (0.0%) |
| $5,000 to $9,999 | 0 (0.0%) | 0 (0.0%) |
| $10,000 to $14,999 | 5 (1.7%) | 0 (0.0%) |
| $15,000 to $19,999 | 17 (5.9%) | 23 (17.4%) |
| $20,000 to $24,999 | 0 (0.0%) | 0 (0.0%) |
| $25,000 to $34,999 | 8 (2.8%) | 25 (18.9%) |
| $35,000 to $49,999 | 65 (22.5%) | 0 (0.0%) |
| $50,000 to $74,999 | 44 (15.2%) | 36 (27.3%) |
| $75,000 to $99,999 | 55 (19.0%) | 41 (31.1%) |
| $100,000 to $149,999 | 37 (12.8%) | 7 (5.3%) |
| $150,000 or more | 38 (13.2%) | 0 (0.0%) |
| Total | 289 (100.0%) | 132 (100.0%) |
Monthly Housing Cost Tiers in Waterflow
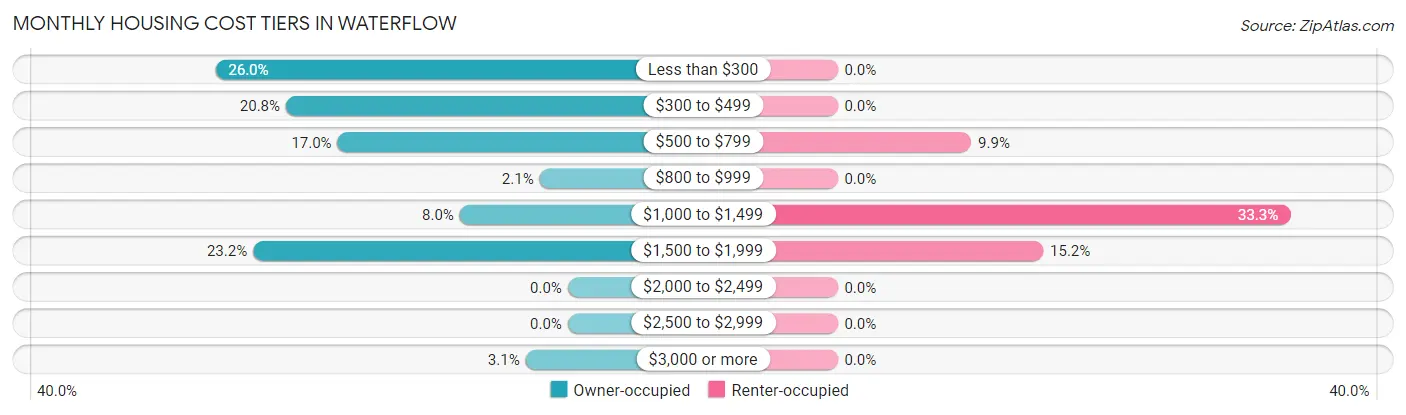
| Monthly Cost | Owner-occupied | Renter-occupied |
| Less than $300 | 75 (26.0%) | 0 (0.0%) |
| $300 to $499 | 60 (20.8%) | 0 (0.0%) |
| $500 to $799 | 49 (17.0%) | 13 (9.9%) |
| $800 to $999 | 6 (2.1%) | 0 (0.0%) |
| $1,000 to $1,499 | 23 (8.0%) | 44 (33.3%) |
| $1,500 to $1,999 | 67 (23.2%) | 20 (15.1%) |
| $2,000 to $2,499 | 0 (0.0%) | 0 (0.0%) |
| $2,500 to $2,999 | 0 (0.0%) | 0 (0.0%) |
| $3,000 or more | 9 (3.1%) | 0 (0.0%) |
| Total | 289 (100.0%) | 132 (100.0%) |
Physical Housing Characteristics in Waterflow
Housing Structures in Waterflow
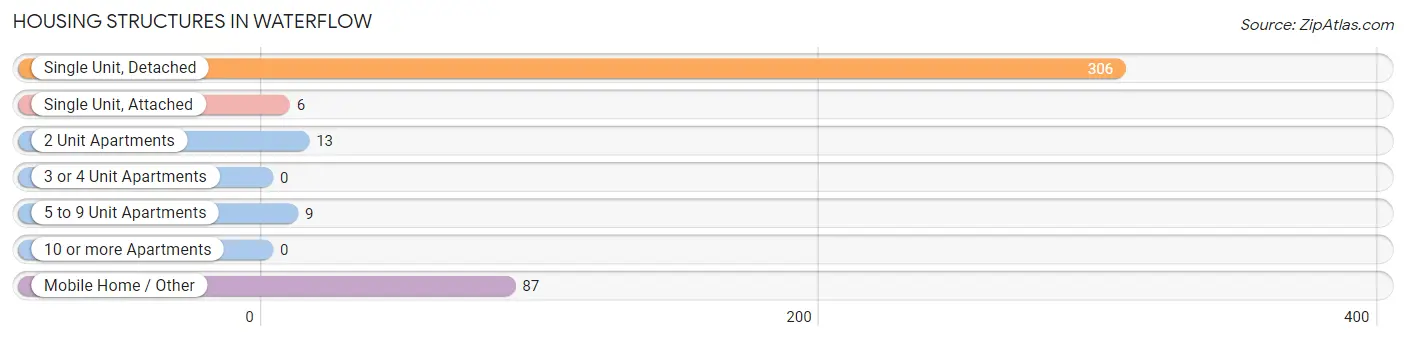
| Structure Type | # Housing Units | % Housing Units |
| Single Unit, Detached | 306 | 72.7% |
| Single Unit, Attached | 6 | 1.4% |
| 2 Unit Apartments | 13 | 3.1% |
| 3 or 4 Unit Apartments | 0 | 0.0% |
| 5 to 9 Unit Apartments | 9 | 2.1% |
| 10 or more Apartments | 0 | 0.0% |
| Mobile Home / Other | 87 | 20.7% |
| Total | 421 | 100.0% |
Housing Structures by Occupancy in Waterflow
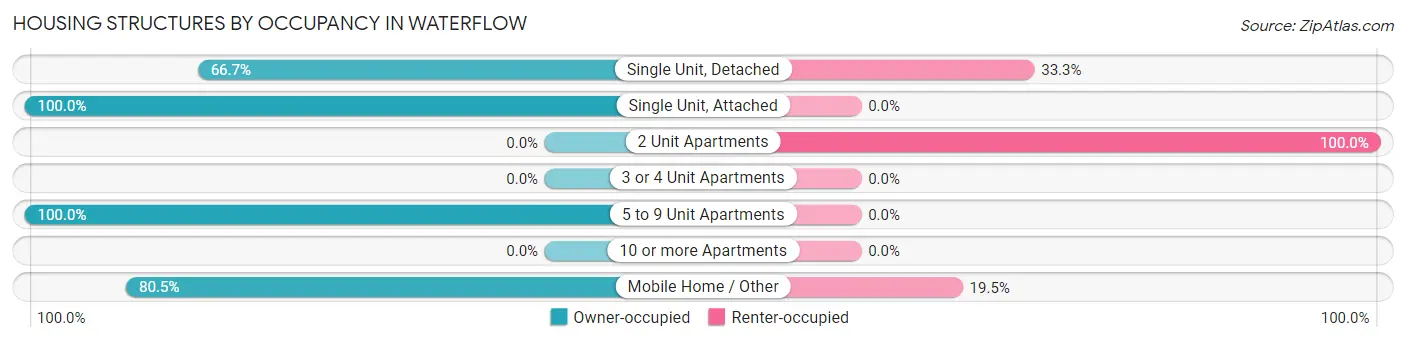
| Structure Type | Owner-occupied | Renter-occupied |
| Single Unit, Detached | 204 (66.7%) | 102 (33.3%) |
| Single Unit, Attached | 6 (100.0%) | 0 (0.0%) |
| 2 Unit Apartments | 0 (0.0%) | 13 (100.0%) |
| 3 or 4 Unit Apartments | 0 (0.0%) | 0 (0.0%) |
| 5 to 9 Unit Apartments | 9 (100.0%) | 0 (0.0%) |
| 10 or more Apartments | 0 (0.0%) | 0 (0.0%) |
| Mobile Home / Other | 70 (80.5%) | 17 (19.5%) |
| Total | 289 (68.6%) | 132 (31.4%) |
Housing Structures by Number of Rooms in Waterflow
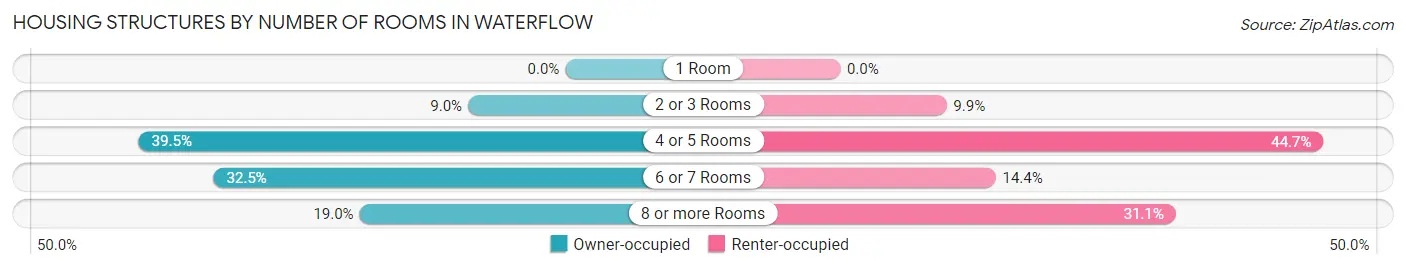
| Number of Rooms | Owner-occupied | Renter-occupied |
| 1 Room | 0 (0.0%) | 0 (0.0%) |
| 2 or 3 Rooms | 26 (9.0%) | 13 (9.9%) |
| 4 or 5 Rooms | 114 (39.5%) | 59 (44.7%) |
| 6 or 7 Rooms | 94 (32.5%) | 19 (14.4%) |
| 8 or more Rooms | 55 (19.0%) | 41 (31.1%) |
| Total | 289 (100.0%) | 132 (100.0%) |
Housing Structure by Heating Type in Waterflow
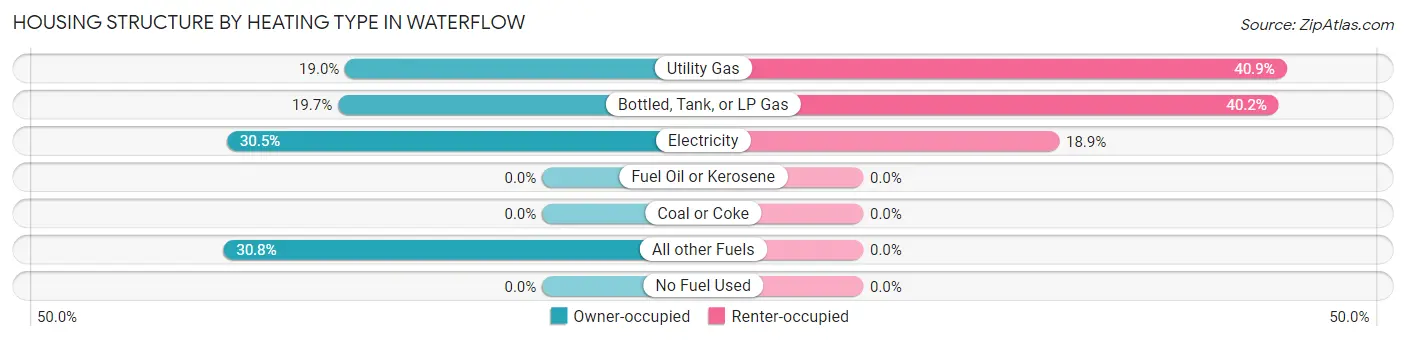
| Heating Type | Owner-occupied | Renter-occupied |
| Utility Gas | 55 (19.0%) | 54 (40.9%) |
| Bottled, Tank, or LP Gas | 57 (19.7%) | 53 (40.2%) |
| Electricity | 88 (30.4%) | 25 (18.9%) |
| Fuel Oil or Kerosene | 0 (0.0%) | 0 (0.0%) |
| Coal or Coke | 0 (0.0%) | 0 (0.0%) |
| All other Fuels | 89 (30.8%) | 0 (0.0%) |
| No Fuel Used | 0 (0.0%) | 0 (0.0%) |
| Total | 289 (100.0%) | 132 (100.0%) |
Household Vehicle Usage in Waterflow
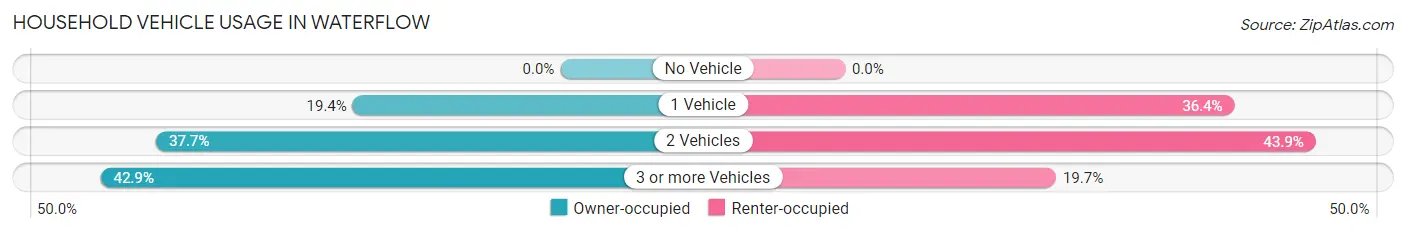
| Vehicles per Household | Owner-occupied | Renter-occupied |
| No Vehicle | 0 (0.0%) | 0 (0.0%) |
| 1 Vehicle | 56 (19.4%) | 48 (36.4%) |
| 2 Vehicles | 109 (37.7%) | 58 (43.9%) |
| 3 or more Vehicles | 124 (42.9%) | 26 (19.7%) |
| Total | 289 (100.0%) | 132 (100.0%) |
Real Estate & Mortgages in Waterflow
Real Estate and Mortgage Overview in Waterflow
| Characteristic | Without Mortgage | With Mortgage |
| Housing Units | 190 | 99 |
| Median Property Value | $146,000 | $181,000 |
| Median Household Income | $61,250 | $38 |
| Monthly Housing Costs | $430 | $9 |
| Real Estate Taxes | - | - |
Property Value by Mortgage Status in Waterflow
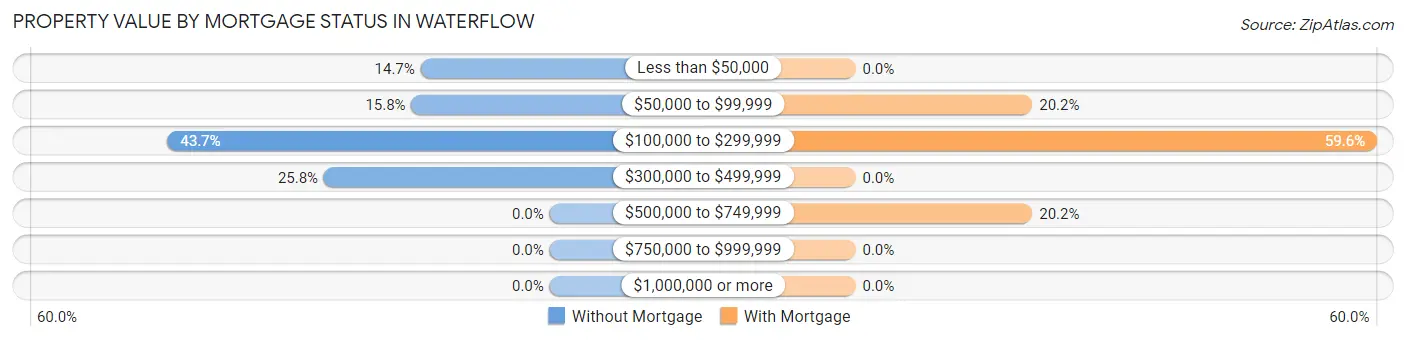
| Property Value | Without Mortgage | With Mortgage |
| Less than $50,000 | 28 (14.7%) | 0 (0.0%) |
| $50,000 to $99,999 | 30 (15.8%) | 20 (20.2%) |
| $100,000 to $299,999 | 83 (43.7%) | 59 (59.6%) |
| $300,000 to $499,999 | 49 (25.8%) | 0 (0.0%) |
| $500,000 to $749,999 | 0 (0.0%) | 20 (20.2%) |
| $750,000 to $999,999 | 0 (0.0%) | 0 (0.0%) |
| $1,000,000 or more | 0 (0.0%) | 0 (0.0%) |
| Total | 190 (100.0%) | 99 (100.0%) |
Household Income by Mortgage Status in Waterflow
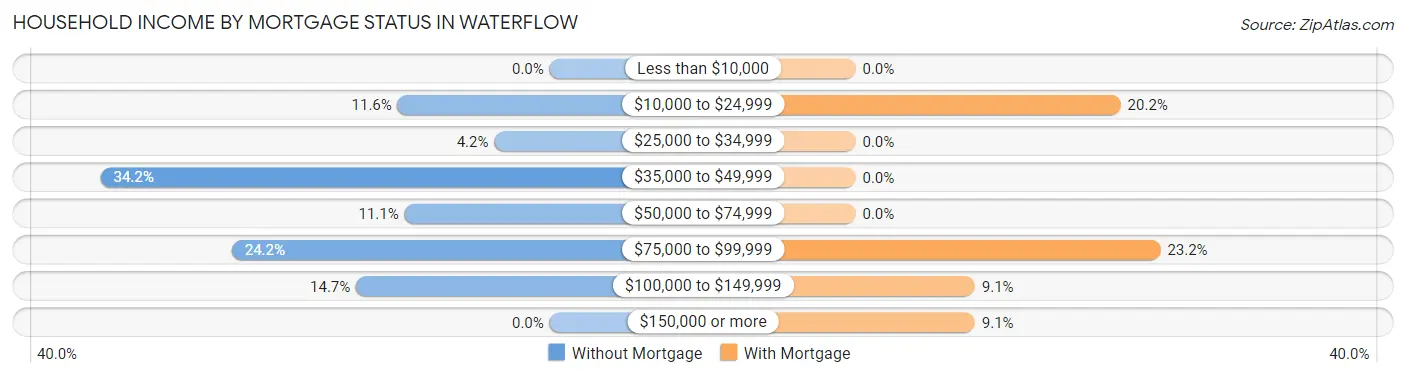
| Household Income | Without Mortgage | With Mortgage |
| Less than $10,000 | 0 (0.0%) | 0 (0.0%) |
| $10,000 to $24,999 | 22 (11.6%) | 20 (20.2%) |
| $25,000 to $34,999 | 8 (4.2%) | 0 (0.0%) |
| $35,000 to $49,999 | 65 (34.2%) | 0 (0.0%) |
| $50,000 to $74,999 | 21 (11.1%) | 0 (0.0%) |
| $75,000 to $99,999 | 46 (24.2%) | 23 (23.2%) |
| $100,000 to $149,999 | 28 (14.7%) | 9 (9.1%) |
| $150,000 or more | 0 (0.0%) | 9 (9.1%) |
| Total | 190 (100.0%) | 99 (100.0%) |
Property Value to Household Income Ratio in Waterflow
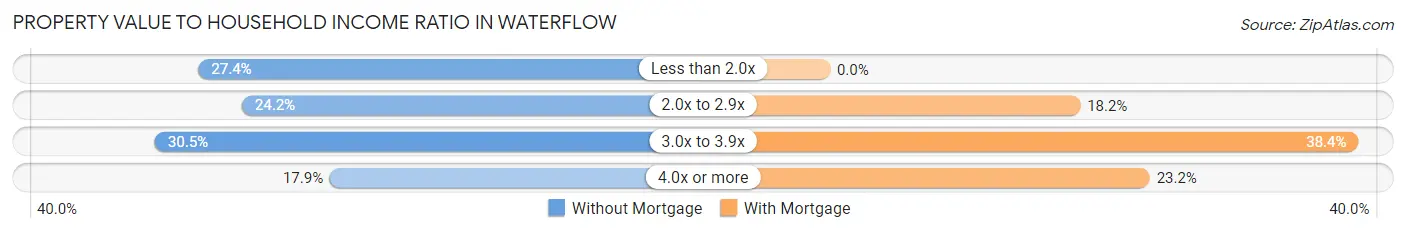
| Value-to-Income Ratio | Without Mortgage | With Mortgage |
| Less than 2.0x | 52 (27.4%) | 0 (0.0%) |
| 2.0x to 2.9x | 46 (24.2%) | 18 (18.2%) |
| 3.0x to 3.9x | 58 (30.5%) | 38 (38.4%) |
| 4.0x or more | 34 (17.9%) | 23 (23.2%) |
| Total | 190 (100.0%) | 99 (100.0%) |
Real Estate Taxes by Mortgage Status in Waterflow
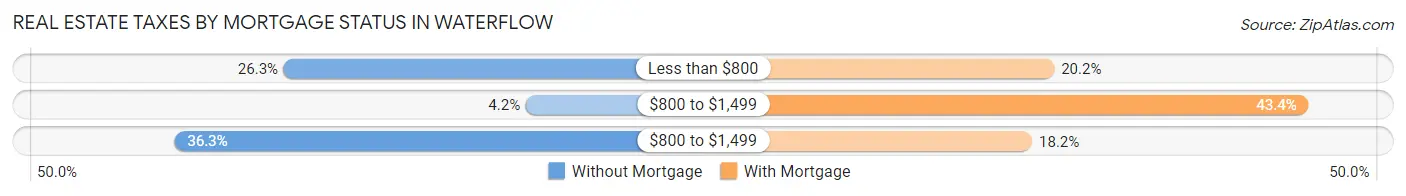
| Property Taxes | Without Mortgage | With Mortgage |
| Less than $800 | 50 (26.3%) | 20 (20.2%) |
| $800 to $1,499 | 8 (4.2%) | 43 (43.4%) |
| $800 to $1,499 | 69 (36.3%) | 18 (18.2%) |
| Total | 190 (100.0%) | 99 (100.0%) |
Health & Disability in Waterflow
Health Insurance Coverage by Age in Waterflow
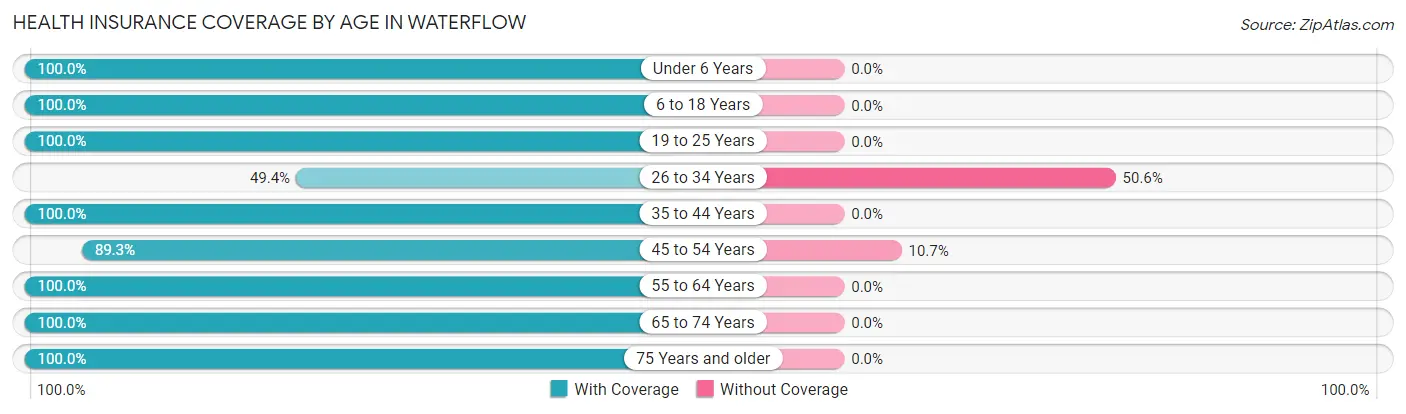
| Age Bracket | With Coverage | Without Coverage |
| Under 6 Years | 52 (100.0%) | 0 (0.0%) |
| 6 to 18 Years | 326 (100.0%) | 0 (0.0%) |
| 19 to 25 Years | 57 (100.0%) | 0 (0.0%) |
| 26 to 34 Years | 82 (49.4%) | 84 (50.6%) |
| 35 to 44 Years | 162 (100.0%) | 0 (0.0%) |
| 45 to 54 Years | 201 (89.3%) | 24 (10.7%) |
| 55 to 64 Years | 123 (100.0%) | 0 (0.0%) |
| 65 to 74 Years | 181 (100.0%) | 0 (0.0%) |
| 75 Years and older | 33 (100.0%) | 0 (0.0%) |
| Total | 1,217 (91.8%) | 108 (8.2%) |
Health Insurance Coverage by Citizenship Status in Waterflow
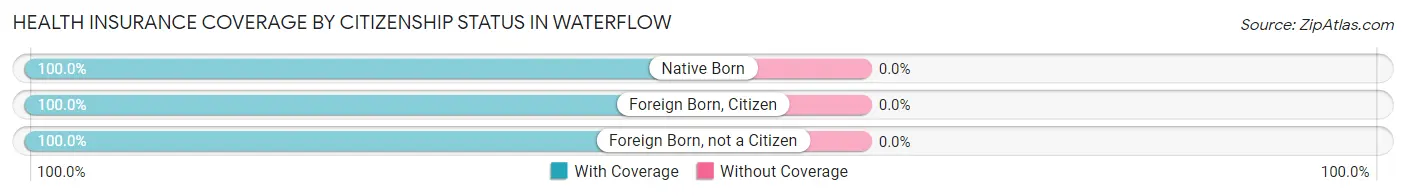
| Citizenship Status | With Coverage | Without Coverage |
| Native Born | 52 (100.0%) | 0 (0.0%) |
| Foreign Born, Citizen | 326 (100.0%) | 0 (0.0%) |
| Foreign Born, not a Citizen | 57 (100.0%) | 0 (0.0%) |
Health Insurance Coverage by Household Income in Waterflow
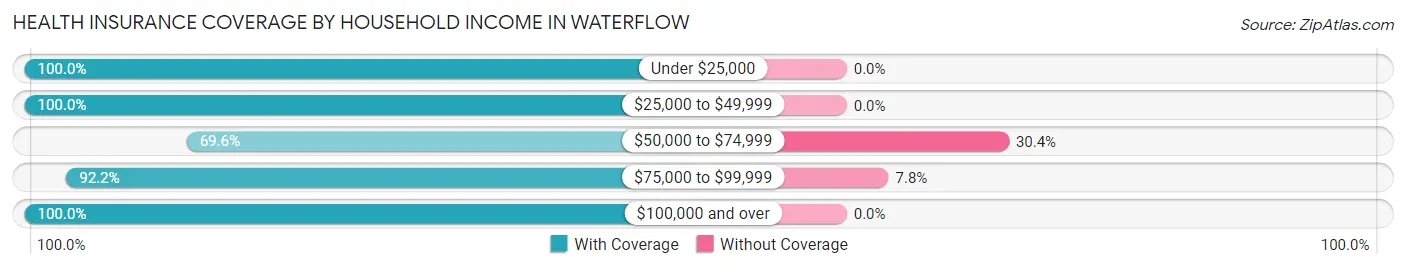
| Household Income | With Coverage | Without Coverage |
| Under $25,000 | 122 (100.0%) | 0 (0.0%) |
| $25,000 to $49,999 | 145 (100.0%) | 0 (0.0%) |
| $50,000 to $74,999 | 165 (69.6%) | 72 (30.4%) |
| $75,000 to $99,999 | 424 (92.2%) | 36 (7.8%) |
| $100,000 and over | 361 (100.0%) | 0 (0.0%) |
Public vs Private Health Insurance Coverage by Age in Waterflow
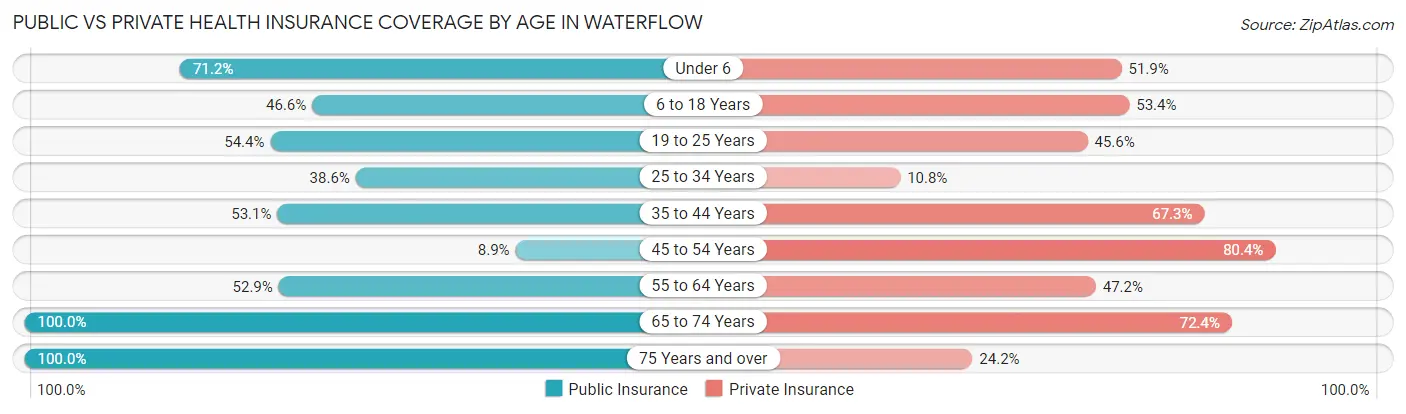
| Age Bracket | Public Insurance | Private Insurance |
| Under 6 | 37 (71.2%) | 27 (51.9%) |
| 6 to 18 Years | 152 (46.6%) | 174 (53.4%) |
| 19 to 25 Years | 31 (54.4%) | 26 (45.6%) |
| 25 to 34 Years | 64 (38.6%) | 18 (10.8%) |
| 35 to 44 Years | 86 (53.1%) | 109 (67.3%) |
| 45 to 54 Years | 20 (8.9%) | 181 (80.4%) |
| 55 to 64 Years | 65 (52.8%) | 58 (47.1%) |
| 65 to 74 Years | 181 (100.0%) | 131 (72.4%) |
| 75 Years and over | 33 (100.0%) | 8 (24.2%) |
| Total | 669 (50.5%) | 732 (55.2%) |
Disability Status by Sex by Age in Waterflow
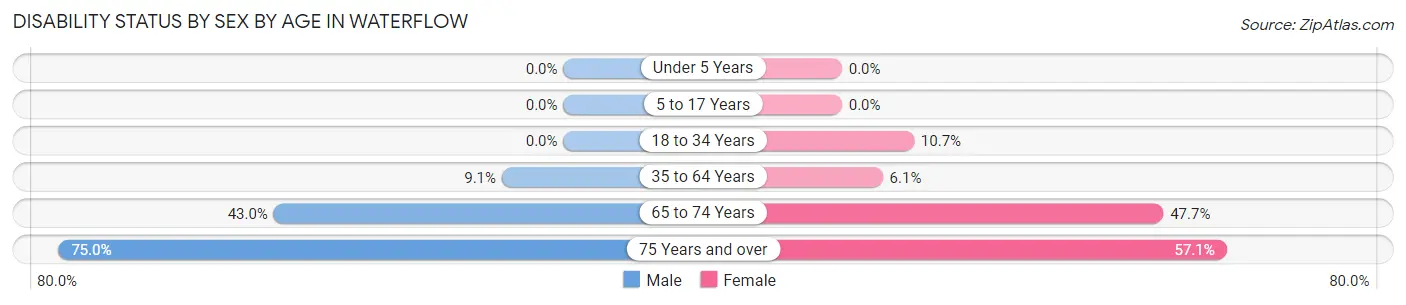
| Age Bracket | Male | Female |
| Under 5 Years | 0 (0.0%) | 0 (0.0%) |
| 5 to 17 Years | 0 (0.0%) | 0 (0.0%) |
| 18 to 34 Years | 0 (0.0%) | 18 (10.7%) |
| 35 to 64 Years | 21 (9.1%) | 17 (6.1%) |
| 65 to 74 Years | 40 (43.0%) | 42 (47.7%) |
| 75 Years and over | 9 (75.0%) | 12 (57.1%) |
Disability Class by Sex by Age in Waterflow
Disability Class: Hearing Difficulty
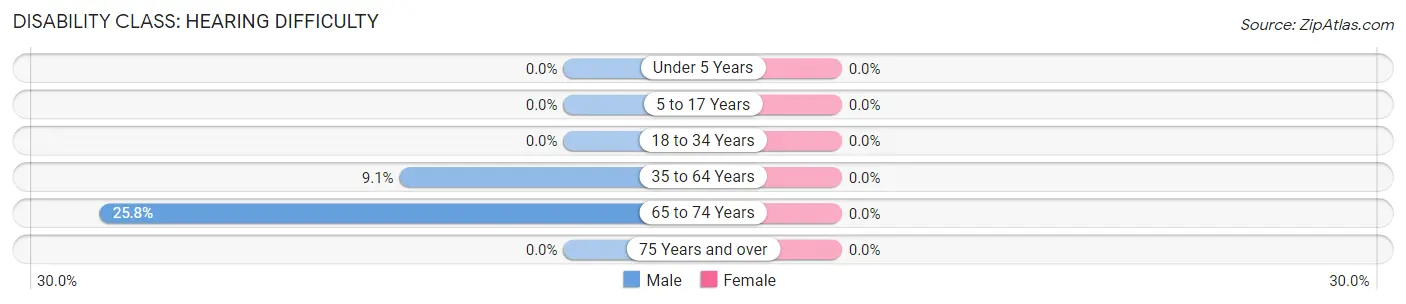
| Age Bracket | Male | Female |
| Under 5 Years | 0 (0.0%) | 0 (0.0%) |
| 5 to 17 Years | 0 (0.0%) | 0 (0.0%) |
| 18 to 34 Years | 0 (0.0%) | 0 (0.0%) |
| 35 to 64 Years | 21 (9.1%) | 0 (0.0%) |
| 65 to 74 Years | 24 (25.8%) | 0 (0.0%) |
| 75 Years and over | 0 (0.0%) | 0 (0.0%) |
Disability Class: Vision Difficulty
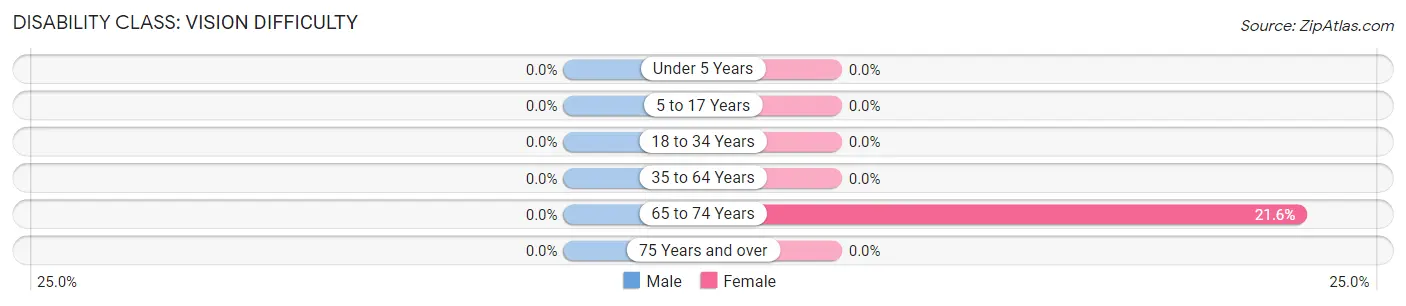
| Age Bracket | Male | Female |
| Under 5 Years | 0 (0.0%) | 0 (0.0%) |
| 5 to 17 Years | 0 (0.0%) | 0 (0.0%) |
| 18 to 34 Years | 0 (0.0%) | 0 (0.0%) |
| 35 to 64 Years | 0 (0.0%) | 0 (0.0%) |
| 65 to 74 Years | 0 (0.0%) | 19 (21.6%) |
| 75 Years and over | 0 (0.0%) | 0 (0.0%) |
Disability Class: Cognitive Difficulty
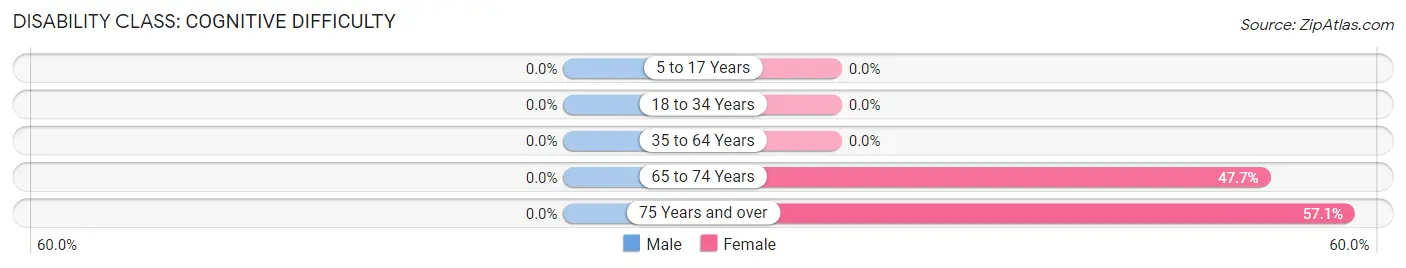
| Age Bracket | Male | Female |
| 5 to 17 Years | 0 (0.0%) | 0 (0.0%) |
| 18 to 34 Years | 0 (0.0%) | 0 (0.0%) |
| 35 to 64 Years | 0 (0.0%) | 0 (0.0%) |
| 65 to 74 Years | 0 (0.0%) | 42 (47.7%) |
| 75 Years and over | 0 (0.0%) | 12 (57.1%) |
Disability Class: Ambulatory Difficulty
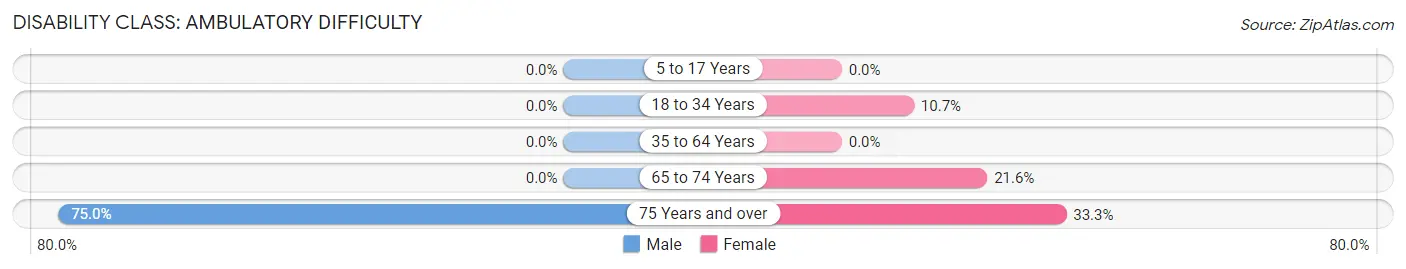
| Age Bracket | Male | Female |
| 5 to 17 Years | 0 (0.0%) | 0 (0.0%) |
| 18 to 34 Years | 0 (0.0%) | 18 (10.7%) |
| 35 to 64 Years | 0 (0.0%) | 0 (0.0%) |
| 65 to 74 Years | 0 (0.0%) | 19 (21.6%) |
| 75 Years and over | 9 (75.0%) | 7 (33.3%) |
Disability Class: Self-Care Difficulty
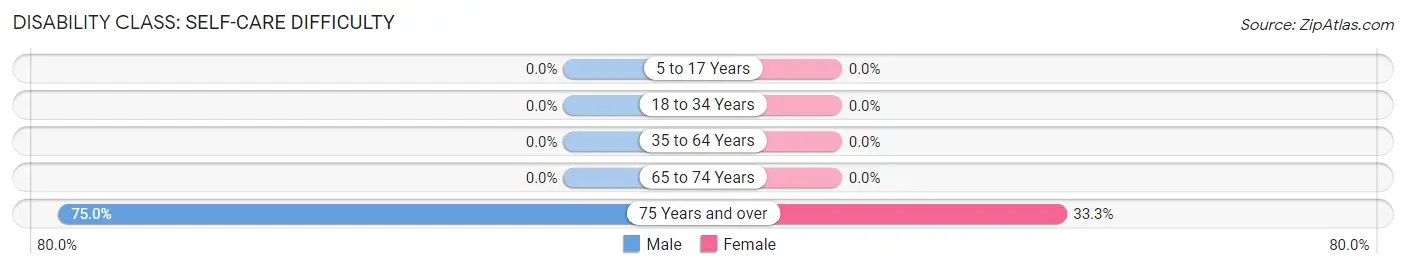
| Age Bracket | Male | Female |
| 5 to 17 Years | 0 (0.0%) | 0 (0.0%) |
| 18 to 34 Years | 0 (0.0%) | 0 (0.0%) |
| 35 to 64 Years | 0 (0.0%) | 0 (0.0%) |
| 65 to 74 Years | 0 (0.0%) | 0 (0.0%) |
| 75 Years and over | 9 (75.0%) | 7 (33.3%) |
Technology Access in Waterflow
Computing Device Access in Waterflow
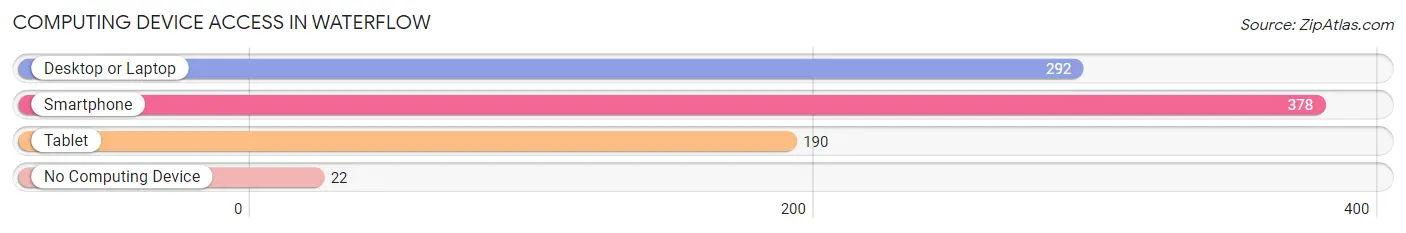
| Device Type | # Households | % Households |
| Desktop or Laptop | 292 | 69.4% |
| Smartphone | 378 | 89.8% |
| Tablet | 190 | 45.1% |
| No Computing Device | 22 | 5.2% |
| Total | 421 | 100.0% |
Internet Access in Waterflow
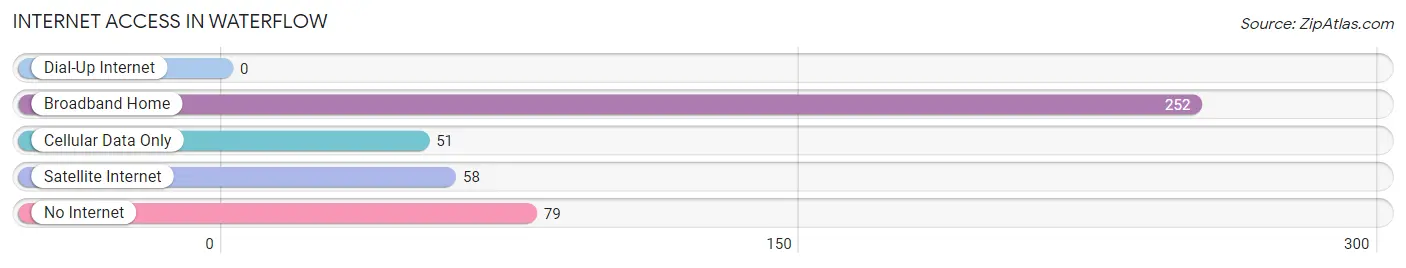
| Internet Type | # Households | % Households |
| Dial-Up Internet | 0 | 0.0% |
| Broadband Home | 252 | 59.9% |
| Cellular Data Only | 51 | 12.1% |
| Satellite Internet | 58 | 13.8% |
| No Internet | 79 | 18.8% |
| Total | 421 | 100.0% |
Waterflow Summary
Waterflow, New Mexico is a small unincorporated community located in San Juan County in the northwestern corner of the state. It is situated on the banks of the San Juan River, approximately 20 miles south of Farmington. The area is known for its rich cultural heritage, stunning landscapes, and unique economic opportunities.
History
Waterflow has a long and varied history. The area was first inhabited by the Anasazi people, who lived in the area for centuries before the arrival of the Spanish in the 16th century. The Spanish established a mission in the area in 1629, and the area was later settled by Navajo and Ute people. The area was part of the Navajo Nation until the late 19th century, when the U.S. government forcibly removed the Navajo people and opened the area up to white settlers.
The town of Waterflow was established in the early 1900s, and the area quickly became a hub for farming and ranching. The town was named after the nearby San Juan River, which flows through the area and provides a source of irrigation for the local farms and ranches.
Geography
Waterflow is located in the northwestern corner of New Mexico, in San Juan County. It is situated on the banks of the San Juan River, approximately 20 miles south of Farmington. The area is known for its stunning landscapes, with rolling hills, mesas, and canyons. The area is also home to a variety of wildlife, including deer, elk, and bighorn sheep.
The climate in Waterflow is semi-arid, with hot summers and cold winters. The average annual temperature is around 60 degrees Fahrenheit, and the average annual precipitation is around 10 inches.
Economy
The economy of Waterflow is largely based on agriculture and ranching. The area is home to a variety of farms and ranches, which produce a variety of crops, including alfalfa, corn, and wheat. The area is also home to a number of oil and gas wells, which provide additional economic opportunities.
In addition to agriculture and ranching, Waterflow is home to a number of small businesses, including restaurants, stores, and other services. The area is also home to a number of tourist attractions, including the nearby Navajo Nation and Chaco Culture National Historical Park.
Demographics
As of the 2010 census, the population of Waterflow was 1,845. The population is largely Native American, with the majority of the population being Navajo. The median household income in Waterflow is $30,000, and the median home value is $90,000. The area is served by the San Juan County School District, which includes two elementary schools, one middle school, and one high school.
Common Questions
What is Per Capita Income in Waterflow?
Per Capita income in Waterflow is $24,279.
What is the Median Family Income in Waterflow?
Median Family Income in Waterflow is $73,690.
What is the Median Household income in Waterflow?
Median Household Income in Waterflow is $58,309.
What is Income or Wage Gap in Waterflow?
Income or Wage Gap in Waterflow is 30.4%.
Women in Waterflow earn 69.6 cents for every dollar earned by a man.
What is Inequality or Gini Index in Waterflow?
Inequality or Gini Index in Waterflow is 0.36.
What is the Total Population of Waterflow?
Total Population of Waterflow is 1,325.
What is the Total Male Population of Waterflow?
Total Male Population of Waterflow is 619.
What is the Total Female Population of Waterflow?
Total Female Population of Waterflow is 706.
What is the Ratio of Males per 100 Females in Waterflow?
There are 87.68 Males per 100 Females in Waterflow.
What is the Ratio of Females per 100 Males in Waterflow?
There are 114.05 Females per 100 Males in Waterflow.
What is the Median Population Age in Waterflow?
Median Population Age in Waterflow is 36.8 Years.
What is the Average Family Size in Waterflow
Average Family Size in Waterflow is 3.8 People.
What is the Average Household Size in Waterflow
Average Household Size in Waterflow is 3.1 People.
How Large is the Labor Force in Waterflow?
There are 570 People in the Labor Forcein in Waterflow.
What is the Percentage of People in the Labor Force in Waterflow?
58.6% of People are in the Labor Force in Waterflow.
What is the Unemployment Rate in Waterflow?
Unemployment Rate in Waterflow is 8.4%.