Dalworthington Gardens, TX Map & Demographics
Dalworthington Gardens Map
Dalworthington Gardens Overview
$69,899
PER CAPITA INCOME
$145,333
AVG FAMILY INCOME
$108,750
AVG HOUSEHOLD INCOME
61.8%
WAGE / INCOME GAP [ % ]
38.2¢/ $1
WAGE / INCOME GAP [ $ ]
0.51
INEQUALITY / GINI INDEX
2,437
TOTAL POPULATION
1,237
MALE POPULATION
1,200
FEMALE POPULATION
103.08
MALES / 100 FEMALES
97.01
FEMALES / 100 MALES
52.2
MEDIAN AGE
3.2
AVG FAMILY SIZE
2.8
AVG HOUSEHOLD SIZE
1,206
LABOR FORCE [ PEOPLE ]
58.8%
PERCENT IN LABOR FORCE
4.3%
UNEMPLOYMENT RATE
Income in Dalworthington Gardens
Income Overview in Dalworthington Gardens
Per Capita Income in Dalworthington Gardens is $69,899, while median incomes of families and households are $145,333 and $108,750 respectively.
| Characteristic | Number | Measure |
| Per Capita Income | 2,437 | $69,899 |
| Median Family Income | 692 | $145,333 |
| Mean Family Income | 692 | $226,783 |
| Median Household Income | 868 | $108,750 |
| Mean Household Income | 868 | $194,224 |
| Income Deficit | 692 | $0 |
| Wage / Income Gap (%) | 2,437 | 61.75% |
| Wage / Income Gap ($) | 2,437 | 38.25¢ per $1 |
| Gini / Inequality Index | 2,437 | 0.51 |
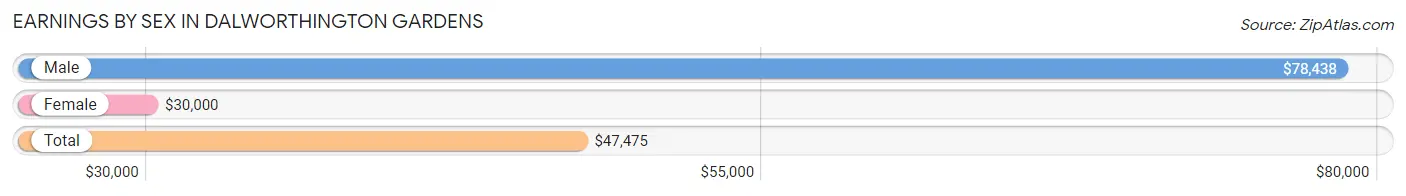
Earnings by Sex in Dalworthington Gardens
Average Earnings in Dalworthington Gardens are $47,475, $78,438 for men and $30,000 for women, a difference of 61.8%.
| Sex | Number | Average Earnings |
| Male | 665 (51.3%) | $78,438 |
| Female | 632 (48.7%) | $30,000 |
| Total | 1,297 (100.0%) | $47,475 |
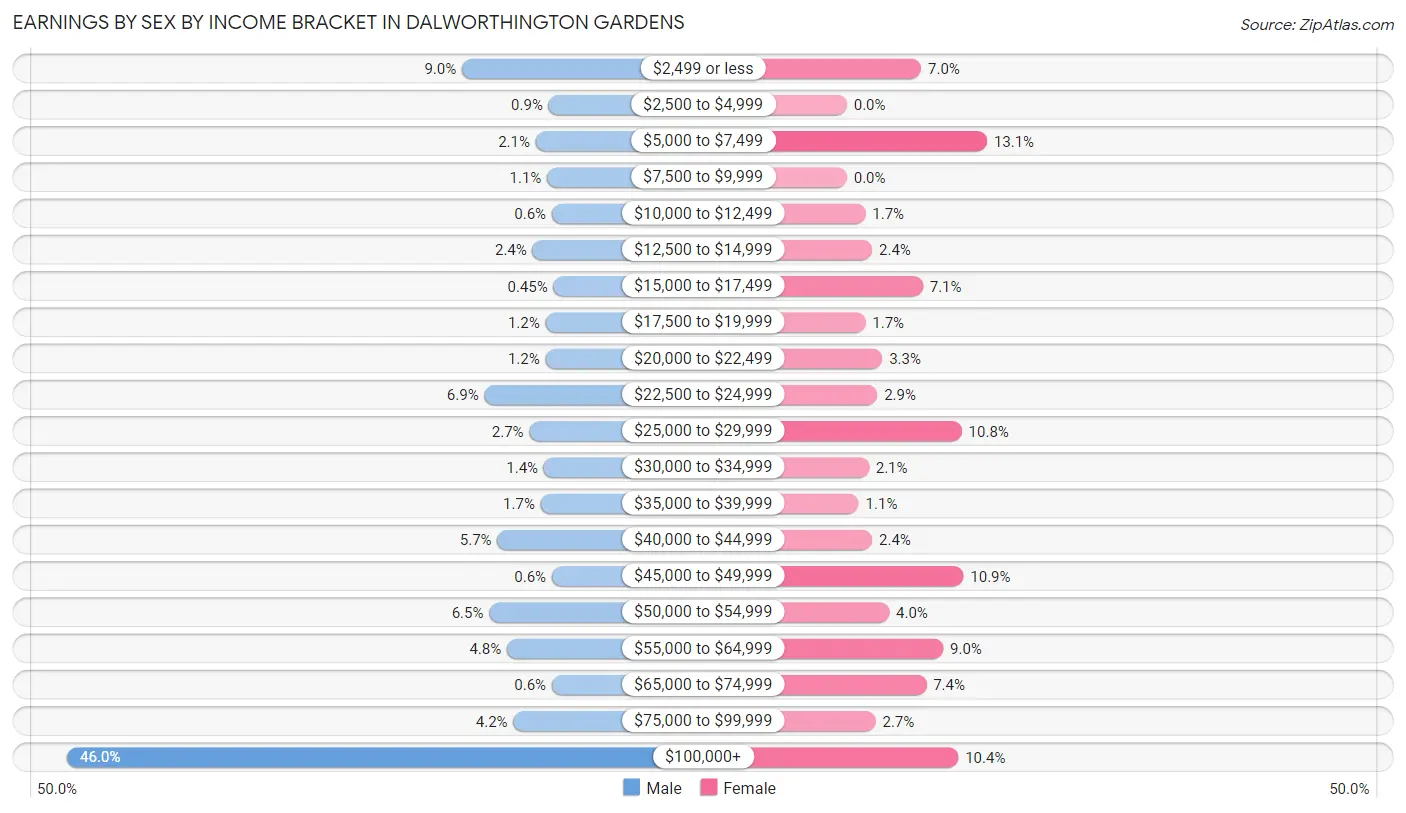
Earnings by Sex by Income Bracket in Dalworthington Gardens
The most common earnings brackets in Dalworthington Gardens are $100,000+ for men (306 | 46.0%) and $5,000 to $7,499 for women (83 | 13.1%).
| Income | Male | Female |
| $2,499 or less | 60 (9.0%) | 44 (7.0%) |
| $2,500 to $4,999 | 6 (0.9%) | 0 (0.0%) |
| $5,000 to $7,499 | 14 (2.1%) | 83 (13.1%) |
| $7,500 to $9,999 | 7 (1.1%) | 0 (0.0%) |
| $10,000 to $12,499 | 4 (0.6%) | 11 (1.7%) |
| $12,500 to $14,999 | 16 (2.4%) | 15 (2.4%) |
| $15,000 to $17,499 | 3 (0.4%) | 45 (7.1%) |
| $17,500 to $19,999 | 8 (1.2%) | 11 (1.7%) |
| $20,000 to $22,499 | 8 (1.2%) | 21 (3.3%) |
| $22,500 to $24,999 | 46 (6.9%) | 18 (2.9%) |
| $25,000 to $29,999 | 18 (2.7%) | 68 (10.8%) |
| $30,000 to $34,999 | 9 (1.3%) | 13 (2.1%) |
| $35,000 to $39,999 | 11 (1.7%) | 7 (1.1%) |
| $40,000 to $44,999 | 38 (5.7%) | 15 (2.4%) |
| $45,000 to $49,999 | 4 (0.6%) | 69 (10.9%) |
| $50,000 to $54,999 | 43 (6.5%) | 25 (4.0%) |
| $55,000 to $64,999 | 32 (4.8%) | 57 (9.0%) |
| $65,000 to $74,999 | 4 (0.6%) | 47 (7.4%) |
| $75,000 to $99,999 | 28 (4.2%) | 17 (2.7%) |
| $100,000+ | 306 (46.0%) | 66 (10.4%) |
| Total | 665 (100.0%) | 632 (100.0%) |
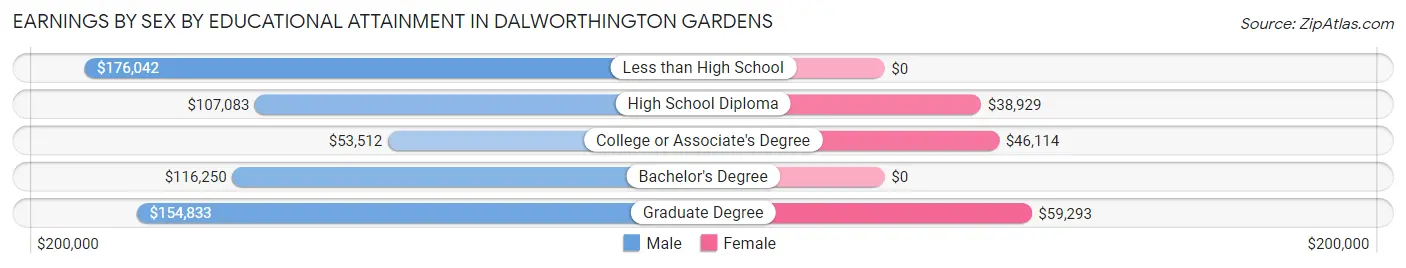
Earnings by Sex by Educational Attainment in Dalworthington Gardens
Average earnings in Dalworthington Gardens are $106,488 for men and $42,250 for women, a difference of 60.3%. Men with an educational attainment of less than high school enjoy the highest average annual earnings of $176,042, while those with college or associate's degree education earn the least with $53,512. Women with an educational attainment of graduate degree earn the most with the average annual earnings of $59,293, while those with high school diploma education have the smallest earnings of $38,929.
| Educational Attainment | Male Income | Female Income |
| Less than High School | $176,042 | $0 |
| High School Diploma | $107,083 | $38,929 |
| College or Associate's Degree | $53,512 | $46,114 |
| Bachelor's Degree | $116,250 | $0 |
| Graduate Degree | $154,833 | $59,293 |
| Total | $106,488 | $42,250 |
Family Income in Dalworthington Gardens
Family Income Brackets in Dalworthington Gardens
According to the Dalworthington Gardens family income data, there are 305 families falling into the $200,000+ income range, which is the most common income bracket and makes up 44.1% of all families.
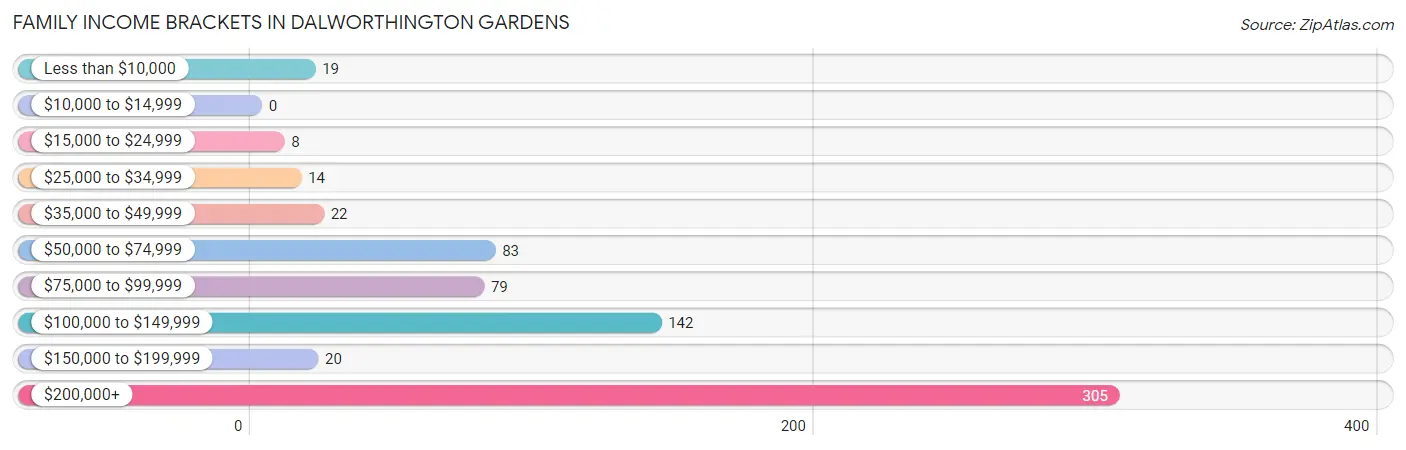
| Income Bracket | # Families | % Families |
| Less than $10,000 | 19 | 2.7% |
| $10,000 to $14,999 | 0 | 0.0% |
| $15,000 to $24,999 | 8 | 1.2% |
| $25,000 to $34,999 | 14 | 2.0% |
| $35,000 to $49,999 | 22 | 3.2% |
| $50,000 to $74,999 | 83 | 12.0% |
| $75,000 to $99,999 | 79 | 11.4% |
| $100,000 to $149,999 | 142 | 20.5% |
| $150,000 to $199,999 | 20 | 2.9% |
| $200,000+ | 305 | 44.1% |
Family Income by Famaliy Size in Dalworthington Gardens
5-person families (62 | 9.0%) account for the highest median family income in Dalworthington Gardens with $250,001 per family, while 2-person families (327 | 47.2%) have the highest median income of $70,625 per family member.
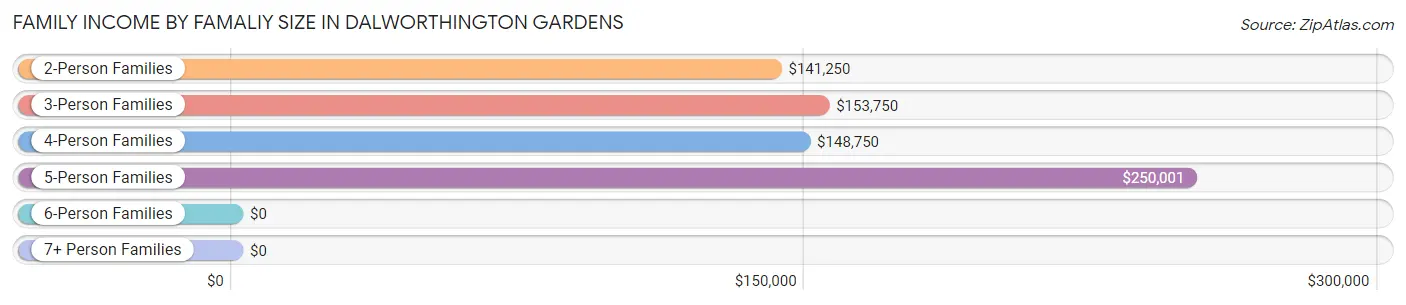
| Income Bracket | # Families | Median Income |
| 2-Person Families | 327 (47.2%) | $141,250 |
| 3-Person Families | 138 (19.9%) | $153,750 |
| 4-Person Families | 154 (22.3%) | $148,750 |
| 5-Person Families | 62 (9.0%) | $250,001 |
| 6-Person Families | 11 (1.6%) | $0 |
| 7+ Person Families | 0 (0.0%) | $0 |
| Total | 692 (100.0%) | $145,333 |
Family Income by Number of Earners in Dalworthington Gardens
The median family income in Dalworthington Gardens is $145,333, with families comprising 3+ earners (119) having the highest median family income of $250,001, while families with 1 earner (226) have the lowest median family income of $89,848, accounting for 17.2% and 32.7% of families, respectively.
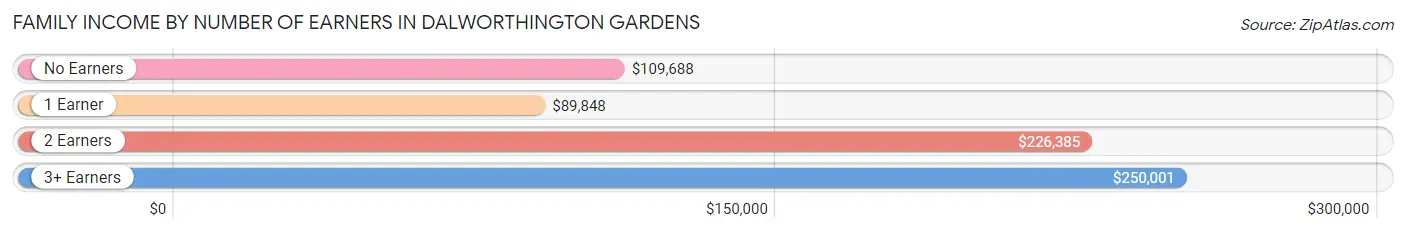
| Number of Earners | # Families | Median Income |
| No Earners | 114 (16.5%) | $109,688 |
| 1 Earner | 226 (32.7%) | $89,848 |
| 2 Earners | 233 (33.7%) | $226,385 |
| 3+ Earners | 119 (17.2%) | $250,001 |
| Total | 692 (100.0%) | $145,333 |
Household Income in Dalworthington Gardens
Household Income Brackets in Dalworthington Gardens
With 311 households falling in the category, the $200,000+ income range is the most frequent in Dalworthington Gardens, accounting for 35.8% of all households. In contrast, only 14 households (1.6%) fall into the $10,000 to $14,999 income bracket, making it the least populous group.
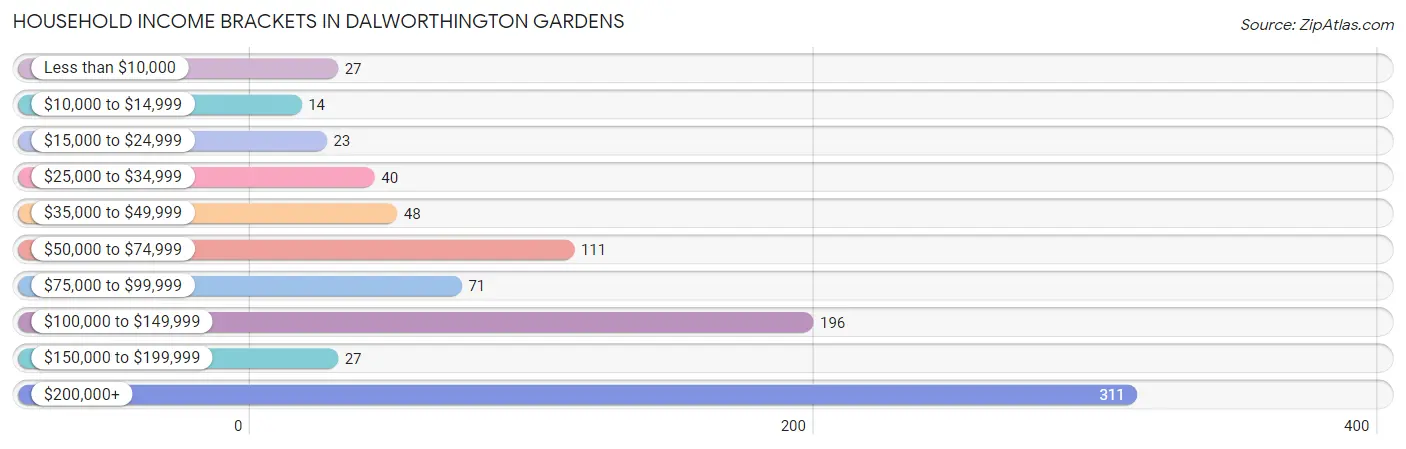
| Income Bracket | # Households | % Households |
| Less than $10,000 | 27 | 3.1% |
| $10,000 to $14,999 | 14 | 1.6% |
| $15,000 to $24,999 | 23 | 2.6% |
| $25,000 to $34,999 | 40 | 4.6% |
| $35,000 to $49,999 | 48 | 5.5% |
| $50,000 to $74,999 | 111 | 12.8% |
| $75,000 to $99,999 | 71 | 8.2% |
| $100,000 to $149,999 | 196 | 22.6% |
| $150,000 to $199,999 | 27 | 3.1% |
| $200,000+ | 311 | 35.8% |
Household Income by Householder Age in Dalworthington Gardens
The median household income in Dalworthington Gardens is $108,750, with the highest median household income of $126,875 found in the 45 to 64 years age bracket for the primary householder. A total of 390 households (44.9%) fall into this category.
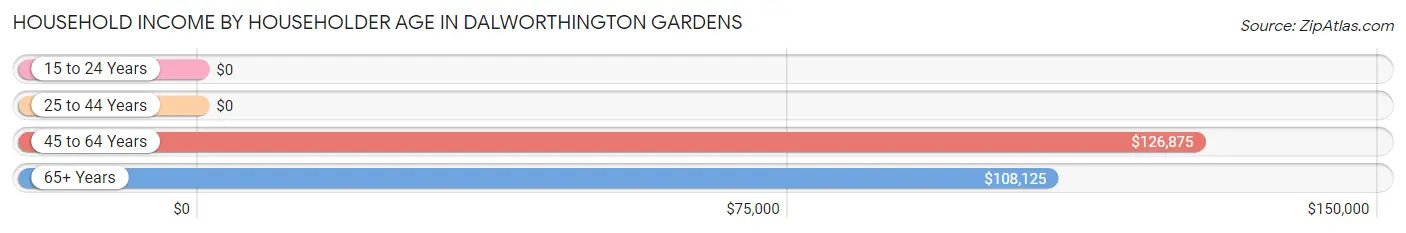
| Income Bracket | # Households | Median Income |
| 15 to 24 Years | 0 (0.0%) | $0 |
| 25 to 44 Years | 152 (17.5%) | $0 |
| 45 to 64 Years | 390 (44.9%) | $126,875 |
| 65+ Years | 326 (37.6%) | $108,125 |
| Total | 868 (100.0%) | $108,750 |
Poverty in Dalworthington Gardens
Income Below Poverty by Sex and Age in Dalworthington Gardens
With 5.2% poverty level for males and 2.3% for females among the residents of Dalworthington Gardens, 25 to 34 year old males and 18 to 24 year old females are the most vulnerable to poverty, with 15 males (26.3%) and 23 females (19.5%) in their respective age groups living below the poverty level.
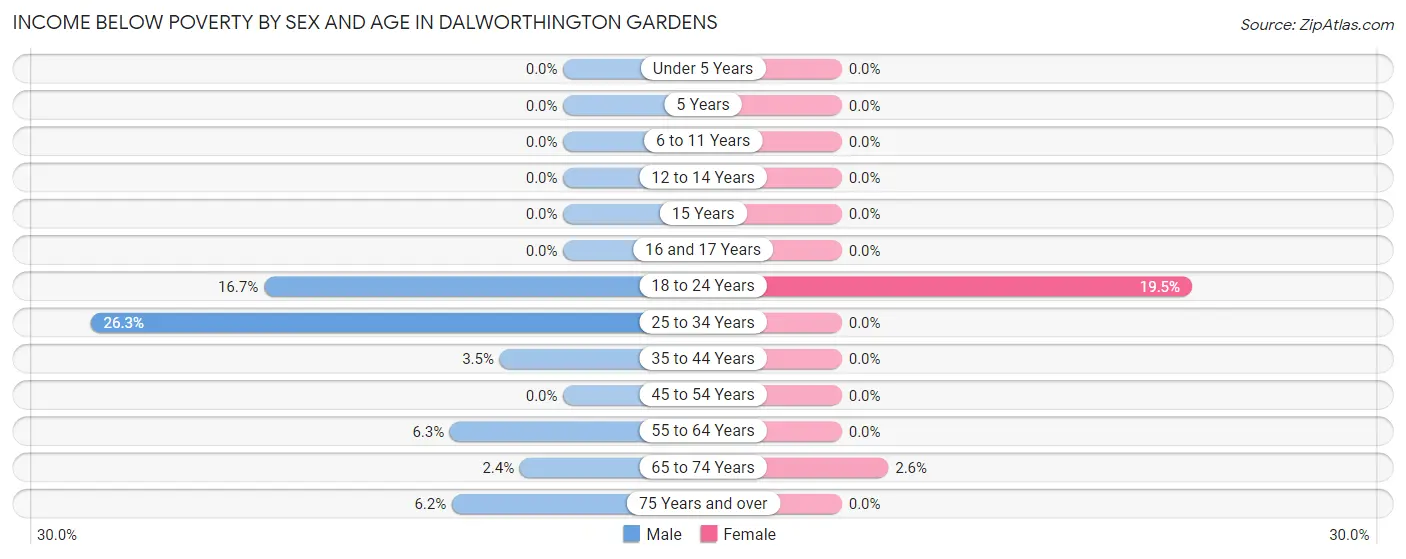
| Age Bracket | Male | Female |
| Under 5 Years | 0 (0.0%) | 0 (0.0%) |
| 5 Years | 0 (0.0%) | 0 (0.0%) |
| 6 to 11 Years | 0 (0.0%) | 0 (0.0%) |
| 12 to 14 Years | 0 (0.0%) | 0 (0.0%) |
| 15 Years | 0 (0.0%) | 0 (0.0%) |
| 16 and 17 Years | 0 (0.0%) | 0 (0.0%) |
| 18 to 24 Years | 20 (16.7%) | 23 (19.5%) |
| 25 to 34 Years | 15 (26.3%) | 0 (0.0%) |
| 35 to 44 Years | 4 (3.5%) | 0 (0.0%) |
| 45 to 54 Years | 0 (0.0%) | 0 (0.0%) |
| 55 to 64 Years | 14 (6.3%) | 0 (0.0%) |
| 65 to 74 Years | 4 (2.4%) | 5 (2.6%) |
| 75 Years and over | 8 (6.2%) | 0 (0.0%) |
| Total | 65 (5.2%) | 28 (2.3%) |
Income Above Poverty by Sex and Age in Dalworthington Gardens
According to the poverty statistics in Dalworthington Gardens, males aged under 5 years and females aged under 5 years are the age groups that are most secure financially, with 100.0% of males and 100.0% of females in these age groups living above the poverty line.
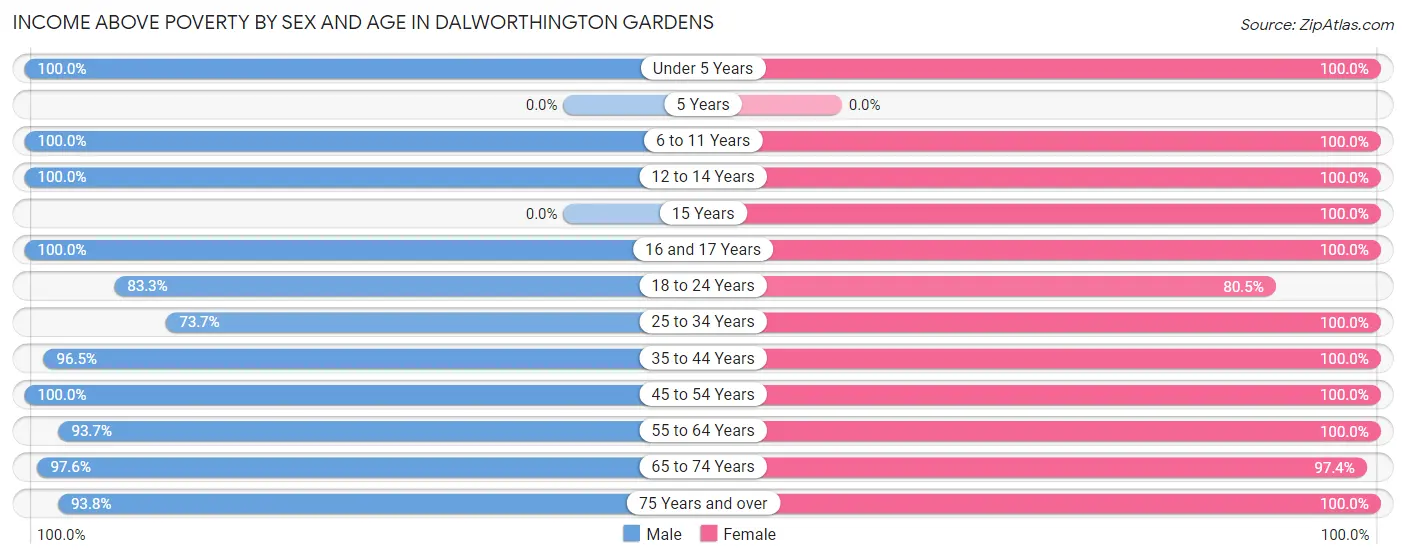
| Age Bracket | Male | Female |
| Under 5 Years | 96 (100.0%) | 20 (100.0%) |
| 5 Years | 0 (0.0%) | 0 (0.0%) |
| 6 to 11 Years | 81 (100.0%) | 75 (100.0%) |
| 12 to 14 Years | 75 (100.0%) | 5 (100.0%) |
| 15 Years | 0 (0.0%) | 34 (100.0%) |
| 16 and 17 Years | 23 (100.0%) | 41 (100.0%) |
| 18 to 24 Years | 100 (83.3%) | 95 (80.5%) |
| 25 to 34 Years | 42 (73.7%) | 162 (100.0%) |
| 35 to 44 Years | 109 (96.5%) | 37 (100.0%) |
| 45 to 54 Years | 155 (100.0%) | 195 (100.0%) |
| 55 to 64 Years | 208 (93.7%) | 185 (100.0%) |
| 65 to 74 Years | 162 (97.6%) | 188 (97.4%) |
| 75 Years and over | 121 (93.8%) | 135 (100.0%) |
| Total | 1,172 (94.8%) | 1,172 (97.7%) |
Income Below Poverty Among Married-Couple Families in Dalworthington Gardens
The poverty statistics for married-couple families in Dalworthington Gardens show that 0.7% or 4 of the total 553 families live below the poverty line. Families with no children have the highest poverty rate of 1.1%, comprising of 4 families. On the other hand, families with 1 or 2 children have the lowest poverty rate of 0.0%, which includes 0 families.
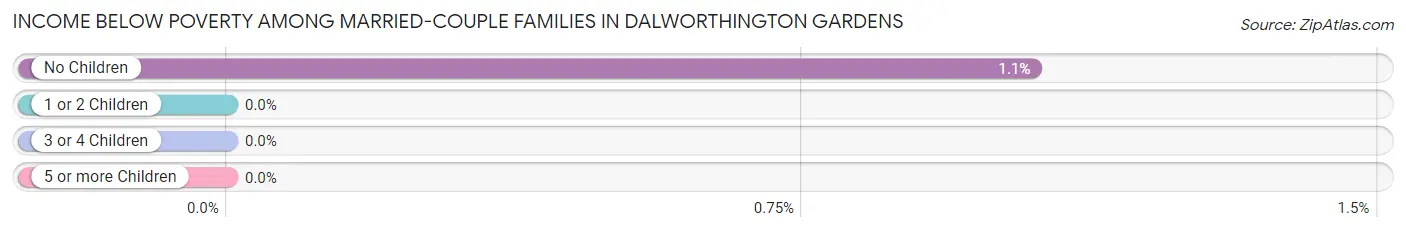
| Children | Above Poverty | Below Poverty |
| No Children | 378 (99.0%) | 4 (1.1%) |
| 1 or 2 Children | 150 (100.0%) | 0 (0.0%) |
| 3 or 4 Children | 21 (100.0%) | 0 (0.0%) |
| 5 or more Children | 0 (0.0%) | 0 (0.0%) |
| Total | 549 (99.3%) | 4 (0.7%) |
Income Below Poverty Among Single-Parent Households in Dalworthington Gardens
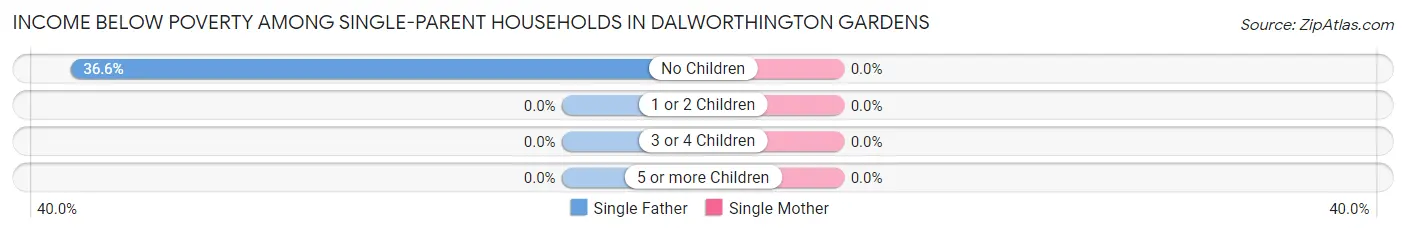
| Children | Single Father | Single Mother |
| No Children | 15 (36.6%) | 0 (0.0%) |
| 1 or 2 Children | 0 (0.0%) | 0 (0.0%) |
| 3 or 4 Children | 0 (0.0%) | 0 (0.0%) |
| 5 or more Children | 0 (0.0%) | 0 (0.0%) |
| Total | 15 (28.8%) | 0 (0.0%) |
Income Below Poverty Among Married-Couple vs Single-Parent Households in Dalworthington Gardens
The poverty data for Dalworthington Gardens shows that 4 of the married-couple family households (0.7%) and 15 of the single-parent households (10.8%) are living below the poverty level. Within the married-couple family households, those with no children have the highest poverty rate, with 4 households (1.1%) falling below the poverty line. Among the single-parent households, those with no children have the highest poverty rate, with 15 household (19.2%) living below poverty.
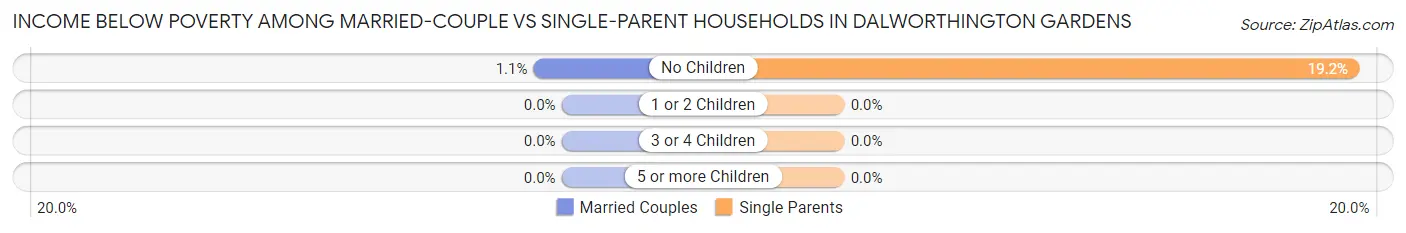
| Children | Married-Couple Families | Single-Parent Households |
| No Children | 4 (1.1%) | 15 (19.2%) |
| 1 or 2 Children | 0 (0.0%) | 0 (0.0%) |
| 3 or 4 Children | 0 (0.0%) | 0 (0.0%) |
| 5 or more Children | 0 (0.0%) | 0 (0.0%) |
| Total | 4 (0.7%) | 15 (10.8%) |
Race in Dalworthington Gardens
The most populous races in Dalworthington Gardens are White / Caucasian (1,601 | 65.7%), Asian (330 | 13.5%), and Hispanic or Latino (277 | 11.4%).
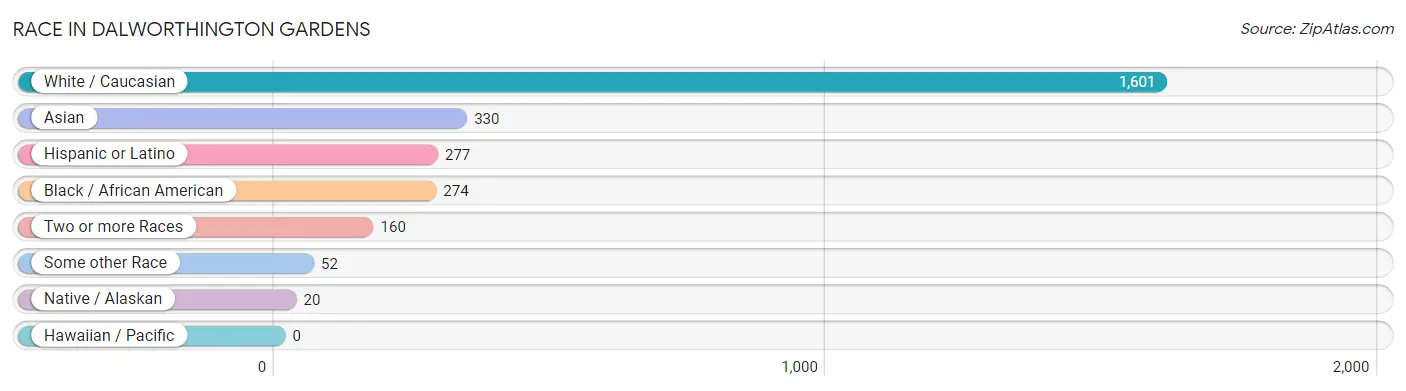
| Race | # Population | % Population |
| Asian | 330 | 13.5% |
| Black / African American | 274 | 11.2% |
| Hawaiian / Pacific | 0 | 0.0% |
| Hispanic or Latino | 277 | 11.4% |
| Native / Alaskan | 20 | 0.8% |
| White / Caucasian | 1,601 | 65.7% |
| Two or more Races | 160 | 6.6% |
| Some other Race | 52 | 2.1% |
| Total | 2,437 | 100.0% |
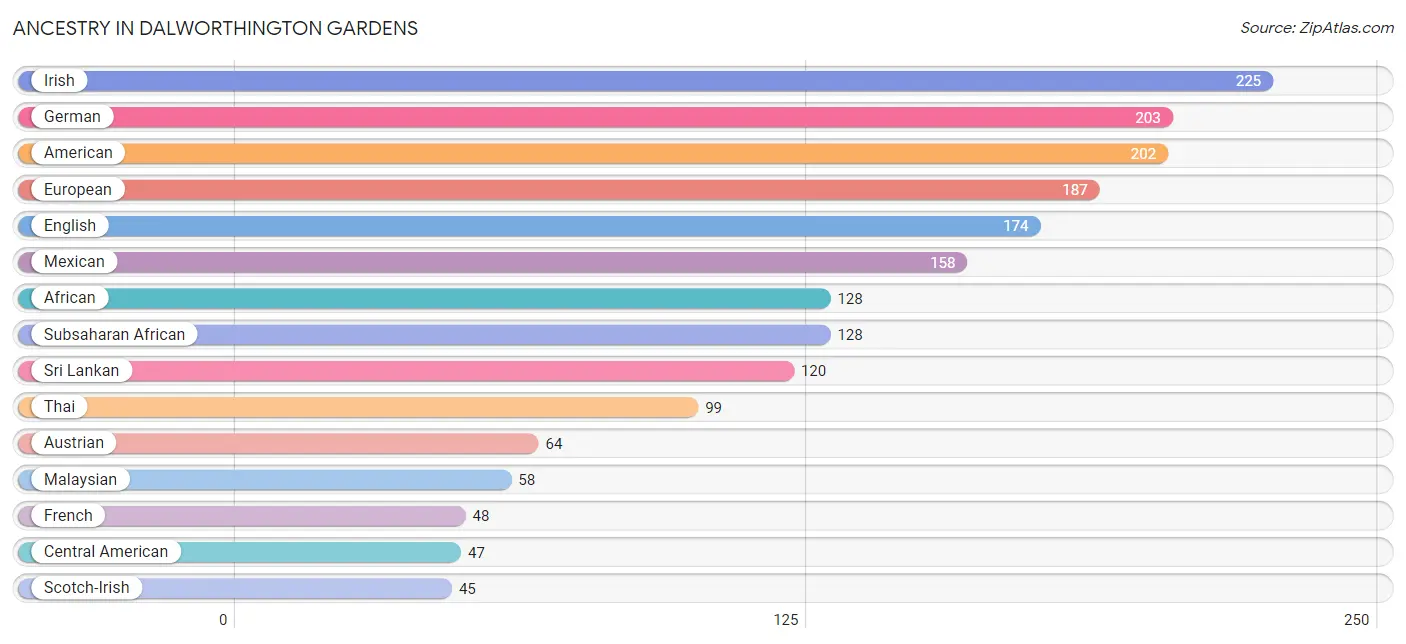
Ancestry in Dalworthington Gardens
The most populous ancestries reported in Dalworthington Gardens are Irish (225 | 9.2%), German (203 | 8.3%), American (202 | 8.3%), European (187 | 7.7%), and English (174 | 7.1%), together accounting for 40.7% of all Dalworthington Gardens residents.
| Ancestry | # Population | % Population |
| African | 128 | 5.2% |
| American | 202 | 8.3% |
| Apache | 20 | 0.8% |
| Austrian | 64 | 2.6% |
| Belgian | 17 | 0.7% |
| British | 22 | 0.9% |
| Burmese | 17 | 0.7% |
| Canadian | 6 | 0.3% |
| Central American | 47 | 1.9% |
| Costa Rican | 7 | 0.3% |
| Cuban | 21 | 0.9% |
| Czech | 42 | 1.7% |
| Czechoslovakian | 7 | 0.3% |
| Danish | 25 | 1.0% |
| Dutch | 6 | 0.3% |
| English | 174 | 7.1% |
| European | 187 | 7.7% |
| French | 48 | 2.0% |
| German | 203 | 8.3% |
| Greek | 5 | 0.2% |
| Indian (Asian) | 5 | 0.2% |
| Iranian | 9 | 0.4% |
| Irish | 225 | 9.2% |
| Italian | 35 | 1.4% |
| Malaysian | 58 | 2.4% |
| Mexican | 158 | 6.5% |
| Norwegian | 39 | 1.6% |
| Polish | 11 | 0.4% |
| Puerto Rican | 7 | 0.3% |
| Russian | 34 | 1.4% |
| Salvadoran | 40 | 1.6% |
| Scandinavian | 14 | 0.6% |
| Scotch-Irish | 45 | 1.8% |
| Scottish | 18 | 0.7% |
| Slavic | 4 | 0.2% |
| Spaniard | 44 | 1.8% |
| Sri Lankan | 120 | 4.9% |
| Subsaharan African | 128 | 5.2% |
| Swiss | 15 | 0.6% |
| Thai | 99 | 4.1% |
| Welsh | 28 | 1.1% |
| West Indian | 22 | 0.9% | View All 42 Rows |
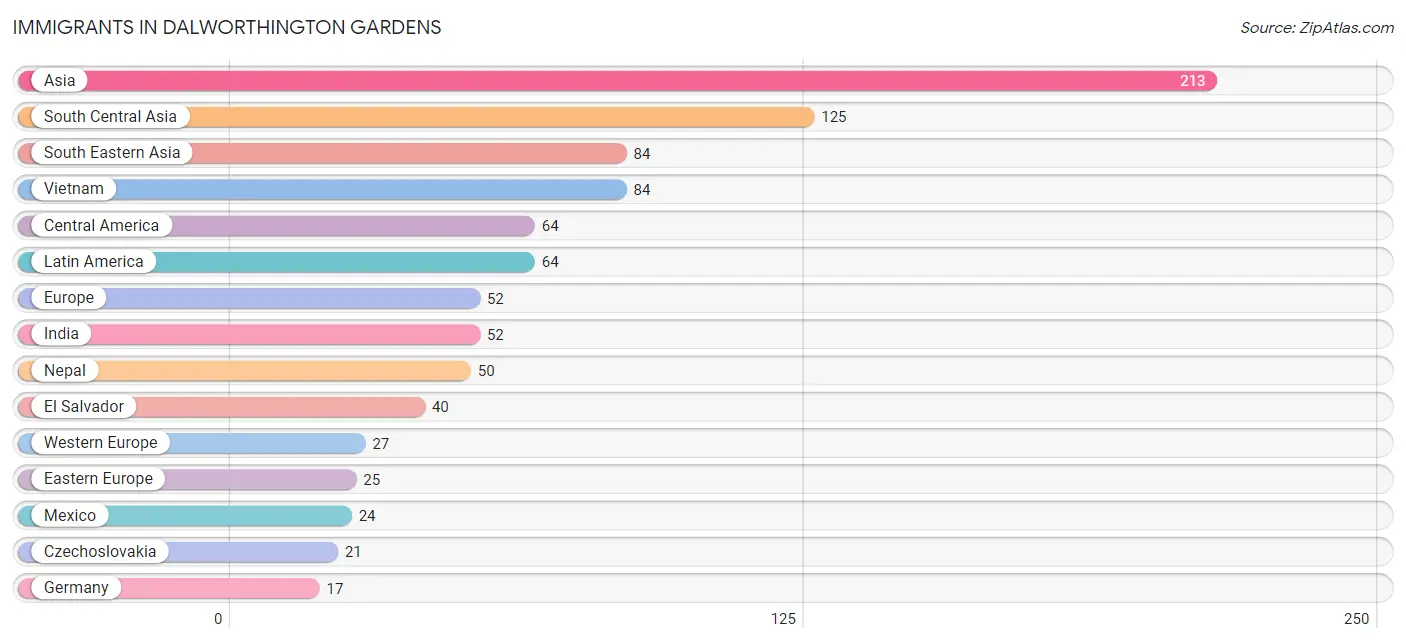
Immigrants in Dalworthington Gardens
The most numerous immigrant groups reported in Dalworthington Gardens came from Asia (213 | 8.7%), South Central Asia (125 | 5.1%), South Eastern Asia (84 | 3.5%), Vietnam (84 | 3.5%), and Central America (64 | 2.6%), together accounting for 23.4% of all Dalworthington Gardens residents.
| Immigration Origin | # Population | % Population |
| Asia | 213 | 8.7% |
| Canada | 5 | 0.2% |
| Central America | 64 | 2.6% |
| Czechoslovakia | 21 | 0.9% |
| Eastern Asia | 4 | 0.2% |
| Eastern Europe | 25 | 1.0% |
| El Salvador | 40 | 1.6% |
| Europe | 52 | 2.1% |
| Germany | 17 | 0.7% |
| India | 52 | 2.1% |
| Iran | 9 | 0.4% |
| Korea | 4 | 0.2% |
| Latin America | 64 | 2.6% |
| Mexico | 24 | 1.0% |
| Nepal | 50 | 2.1% |
| Netherlands | 10 | 0.4% |
| Pakistan | 14 | 0.6% |
| Serbia | 4 | 0.2% |
| South Central Asia | 125 | 5.1% |
| South Eastern Asia | 84 | 3.5% |
| Vietnam | 84 | 3.5% |
| Western Europe | 27 | 1.1% | View All 22 Rows |
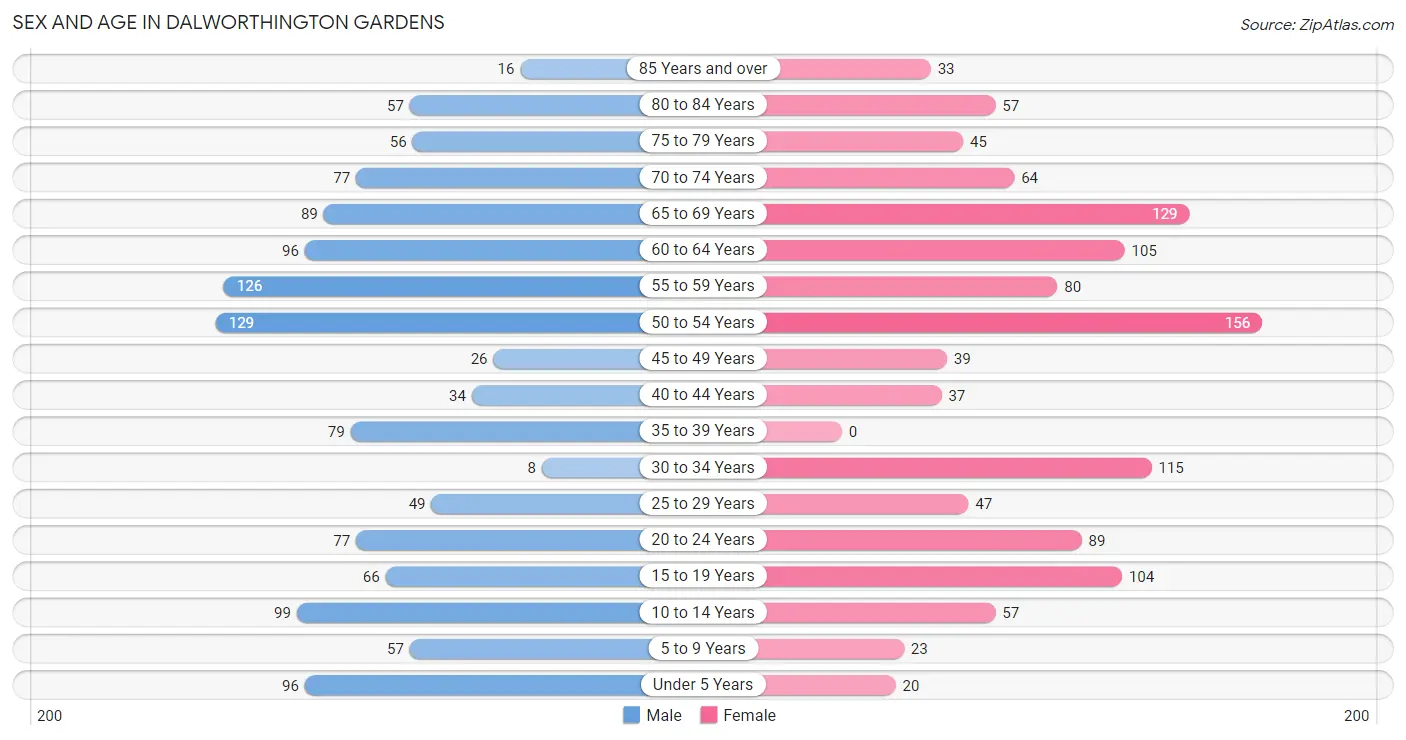
Sex and Age in Dalworthington Gardens
Sex and Age in Dalworthington Gardens
The most populous age groups in Dalworthington Gardens are 50 to 54 Years (129 | 10.4%) for men and 50 to 54 Years (156 | 13.0%) for women.
| Age Bracket | Male | Female |
| Under 5 Years | 96 (7.8%) | 20 (1.7%) |
| 5 to 9 Years | 57 (4.6%) | 23 (1.9%) |
| 10 to 14 Years | 99 (8.0%) | 57 (4.8%) |
| 15 to 19 Years | 66 (5.3%) | 104 (8.7%) |
| 20 to 24 Years | 77 (6.2%) | 89 (7.4%) |
| 25 to 29 Years | 49 (4.0%) | 47 (3.9%) |
| 30 to 34 Years | 8 (0.6%) | 115 (9.6%) |
| 35 to 39 Years | 79 (6.4%) | 0 (0.0%) |
| 40 to 44 Years | 34 (2.8%) | 37 (3.1%) |
| 45 to 49 Years | 26 (2.1%) | 39 (3.3%) |
| 50 to 54 Years | 129 (10.4%) | 156 (13.0%) |
| 55 to 59 Years | 126 (10.2%) | 80 (6.7%) |
| 60 to 64 Years | 96 (7.8%) | 105 (8.7%) |
| 65 to 69 Years | 89 (7.2%) | 129 (10.7%) |
| 70 to 74 Years | 77 (6.2%) | 64 (5.3%) |
| 75 to 79 Years | 56 (4.5%) | 45 (3.7%) |
| 80 to 84 Years | 57 (4.6%) | 57 (4.8%) |
| 85 Years and over | 16 (1.3%) | 33 (2.8%) |
| Total | 1,237 (100.0%) | 1,200 (100.0%) |
Families and Households in Dalworthington Gardens
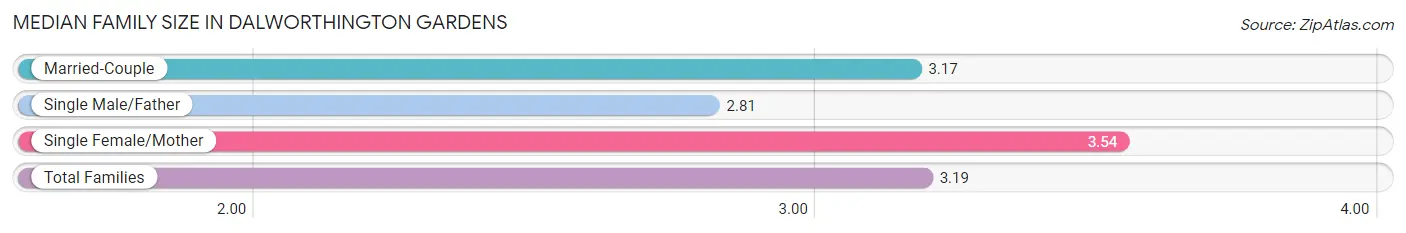
Median Family Size in Dalworthington Gardens
The median family size in Dalworthington Gardens is 3.19 persons per family, with single female/mother families (87 | 12.6%) accounting for the largest median family size of 3.54 persons per family. On the other hand, single male/father families (52 | 7.5%) represent the smallest median family size with 2.81 persons per family.
| Family Type | # Families | Family Size |
| Married-Couple | 553 (79.9%) | 3.17 |
| Single Male/Father | 52 (7.5%) | 2.81 |
| Single Female/Mother | 87 (12.6%) | 3.54 |
| Total Families | 692 (100.0%) | 3.19 |
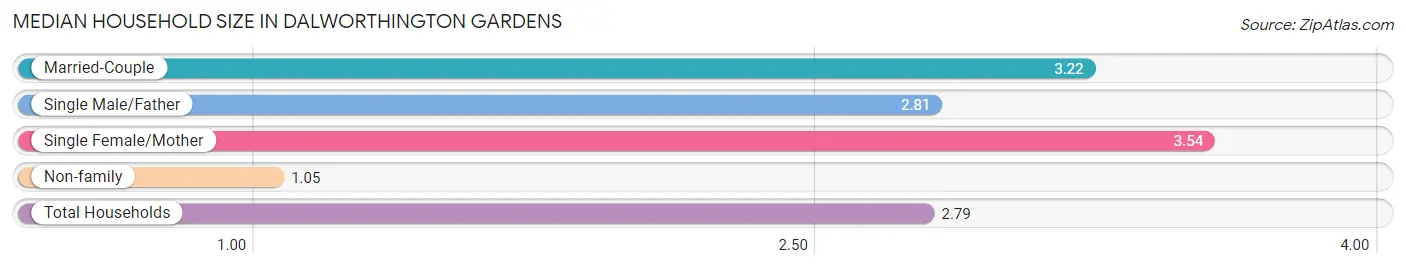
Median Household Size in Dalworthington Gardens
The median household size in Dalworthington Gardens is 2.79 persons per household, with single female/mother households (87 | 10.0%) accounting for the largest median household size of 3.54 persons per household. non-family households (176 | 20.3%) represent the smallest median household size with 1.05 persons per household.
| Household Type | # Households | Household Size |
| Married-Couple | 553 (63.7%) | 3.22 |
| Single Male/Father | 52 (6.0%) | 2.81 |
| Single Female/Mother | 87 (10.0%) | 3.54 |
| Non-family | 176 (20.3%) | 1.05 |
| Total Households | 868 (100.0%) | 2.79 |
Household Size by Marriage Status in Dalworthington Gardens
Out of a total of 868 households in Dalworthington Gardens, 692 (79.7%) are family households, while 176 (20.3%) are nonfamily households. The most numerous type of family households are 2-person households, comprising 321, and the most common type of nonfamily households are 1-person households, comprising 174.
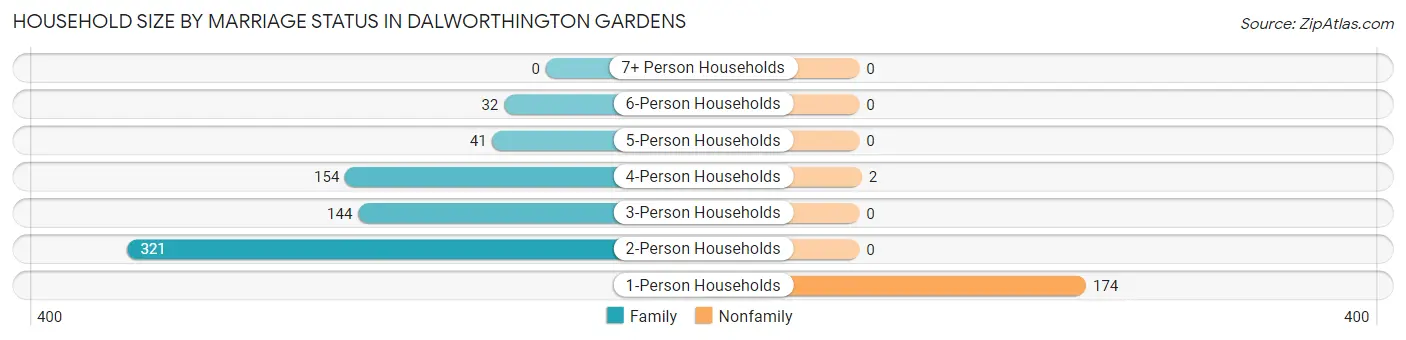
| Household Size | Family Households | Nonfamily Households |
| 1-Person Households | - | 174 (20.1%) |
| 2-Person Households | 321 (37.0%) | 0 (0.0%) |
| 3-Person Households | 144 (16.6%) | 0 (0.0%) |
| 4-Person Households | 154 (17.7%) | 2 (0.2%) |
| 5-Person Households | 41 (4.7%) | 0 (0.0%) |
| 6-Person Households | 32 (3.7%) | 0 (0.0%) |
| 7+ Person Households | 0 (0.0%) | 0 (0.0%) |
| Total | 692 (79.7%) | 176 (20.3%) |
Female Fertility in Dalworthington Gardens
Fertility by Age in Dalworthington Gardens
| Age Bracket | Women with Births | Births / 1,000 Women |
| 15 to 19 years | 0 (0.0%) | 0.0 |
| 20 to 34 years | 0 (0.0%) | 0.0 |
| 35 to 50 years | 0 (0.0%) | 0.0 |
| Total | 0 (0.0%) | 0.0 |
Fertility by Age by Marriage Status in Dalworthington Gardens
| Age Bracket | Married | Unmarried |
| 15 to 19 years | 0 (0.0%) | 0 (0.0%) |
| 20 to 34 years | 0 (0.0%) | 0 (0.0%) |
| 35 to 50 years | 0 (0.0%) | 0 (0.0%) |
| Total | 0 (0.0%) | 0 (0.0%) |
Fertility by Education in Dalworthington Gardens
| Educational Attainment | Women with Births | Births / 1,000 Women |
| Less than High School | 0 (0.0%) | 0.0 |
| High School Diploma | 0 (0.0%) | 0.0 |
| College or Associate's Degree | 0 (0.0%) | 0.0 |
| Bachelor's Degree | 0 (0.0%) | 0.0 |
| Graduate Degree | 0 (0.0%) | 0.0 |
| Total | 0 (0.0%) | 0.0 |
Fertility by Education by Marriage Status in Dalworthington Gardens
| Educational Attainment | Married | Unmarried |
| Less than High School | 0 (0.0%) | 0 (0.0%) |
| High School Diploma | 0 (0.0%) | 0 (0.0%) |
| College or Associate's Degree | 0 (0.0%) | 0 (0.0%) |
| Bachelor's Degree | 0 (0.0%) | 0 (0.0%) |
| Graduate Degree | 0 (0.0%) | 0 (0.0%) |
| Total | 0 (0.0%) | 0 (0.0%) |
Employment Characteristics in Dalworthington Gardens
Employment by Class of Employer in Dalworthington Gardens
Among the 1,092 employed individuals in Dalworthington Gardens, private company employees (581 | 53.2%), self-employed (not incorporated) (169 | 15.5%), and local government employees (103 | 9.4%) make up the most common classes of employment.
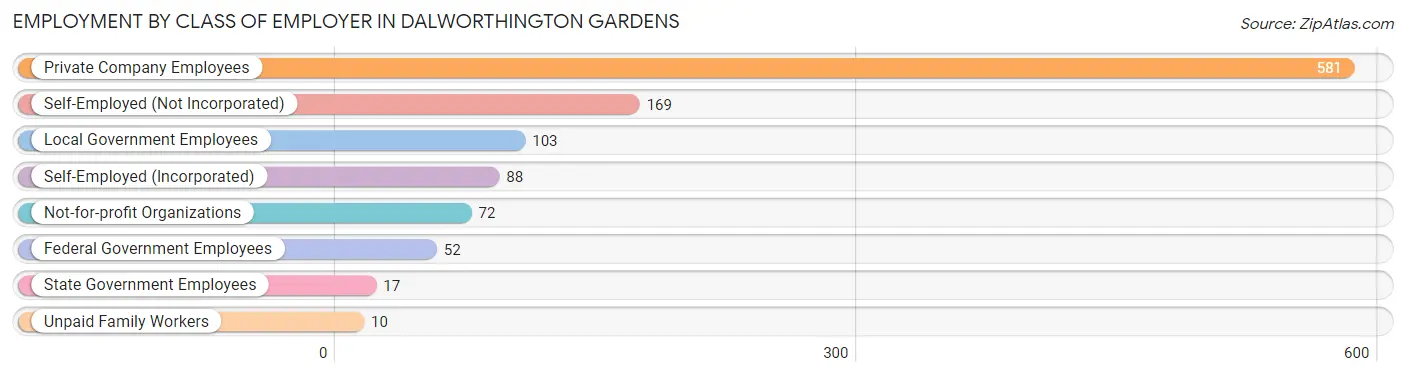
| Employer Class | # Employees | % Employees |
| Private Company Employees | 581 | 53.2% |
| Self-Employed (Incorporated) | 88 | 8.1% |
| Self-Employed (Not Incorporated) | 169 | 15.5% |
| Not-for-profit Organizations | 72 | 6.6% |
| Local Government Employees | 103 | 9.4% |
| State Government Employees | 17 | 1.6% |
| Federal Government Employees | 52 | 4.8% |
| Unpaid Family Workers | 10 | 0.9% |
| Total | 1,092 | 100.0% |
Employment Status by Age in Dalworthington Gardens
According to the labor force statistics for Dalworthington Gardens, out of the total population over 16 years of age (2,051), 58.8% or 1,206 individuals are in the labor force, with 4.3% or 52 of them unemployed. The age group with the highest labor force participation rate is 55 to 59 years, with 88.8% or 183 individuals in the labor force. Within the labor force, the 65 to 74 years age range has the highest percentage of unemployed individuals, with 23.0% or 32 of them being unemployed.
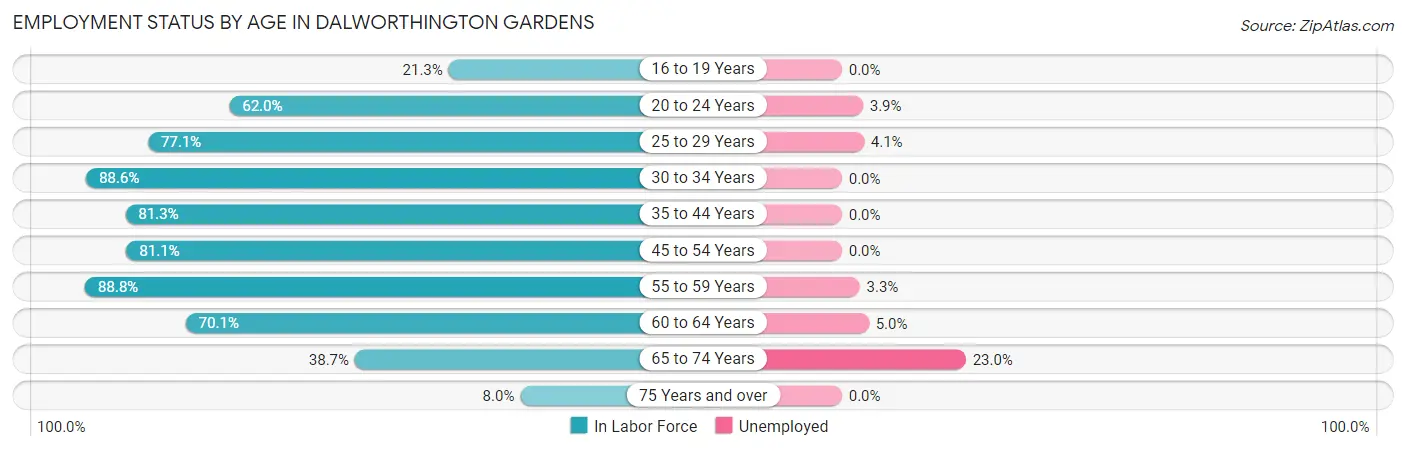
| Age Bracket | In Labor Force | Unemployed |
| 16 to 19 Years | 29 (21.3%) | 0 (0.0%) |
| 20 to 24 Years | 103 (62.0%) | 4 (3.9%) |
| 25 to 29 Years | 74 (77.1%) | 3 (4.1%) |
| 30 to 34 Years | 109 (88.6%) | 0 (0.0%) |
| 35 to 44 Years | 122 (81.3%) | 0 (0.0%) |
| 45 to 54 Years | 284 (81.1%) | 0 (0.0%) |
| 55 to 59 Years | 183 (88.8%) | 6 (3.3%) |
| 60 to 64 Years | 141 (70.1%) | 7 (5.0%) |
| 65 to 74 Years | 139 (38.7%) | 32 (23.0%) |
| 75 Years and over | 21 (8.0%) | 0 (0.0%) |
| Total | 1,206 (58.8%) | 52 (4.3%) |
Employment Status by Educational Attainment in Dalworthington Gardens
According to labor force statistics for Dalworthington Gardens, 81.1% of individuals (913) out of the total population between 25 and 64 years of age (1,126) are in the labor force, with 1.8% or 16 of them being unemployed. The group with the highest labor force participation rate are those with the educational attainment of less than high school, with 87.1% or 27 individuals in the labor force. Within the labor force, individuals with bachelor's degree or higher education have the highest percentage of unemployment, with 4.0% or 16 of them being unemployed.
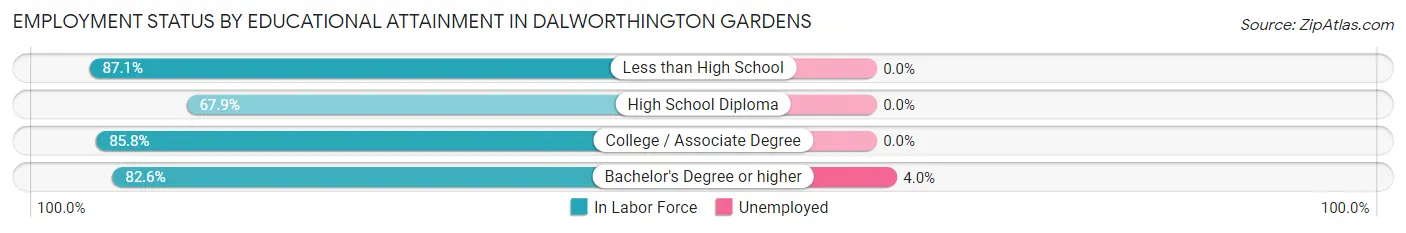
| Educational Attainment | In Labor Force | Unemployed |
| Less than High School | 27 (87.1%) | 0 (0.0%) |
| High School Diploma | 142 (67.9%) | 0 (0.0%) |
| College / Associate Degree | 337 (85.8%) | 0 (0.0%) |
| Bachelor's Degree or higher | 407 (82.6%) | 20 (4.0%) |
| Total | 913 (81.1%) | 20 (1.8%) |
Employment Occupations by Sex in Dalworthington Gardens
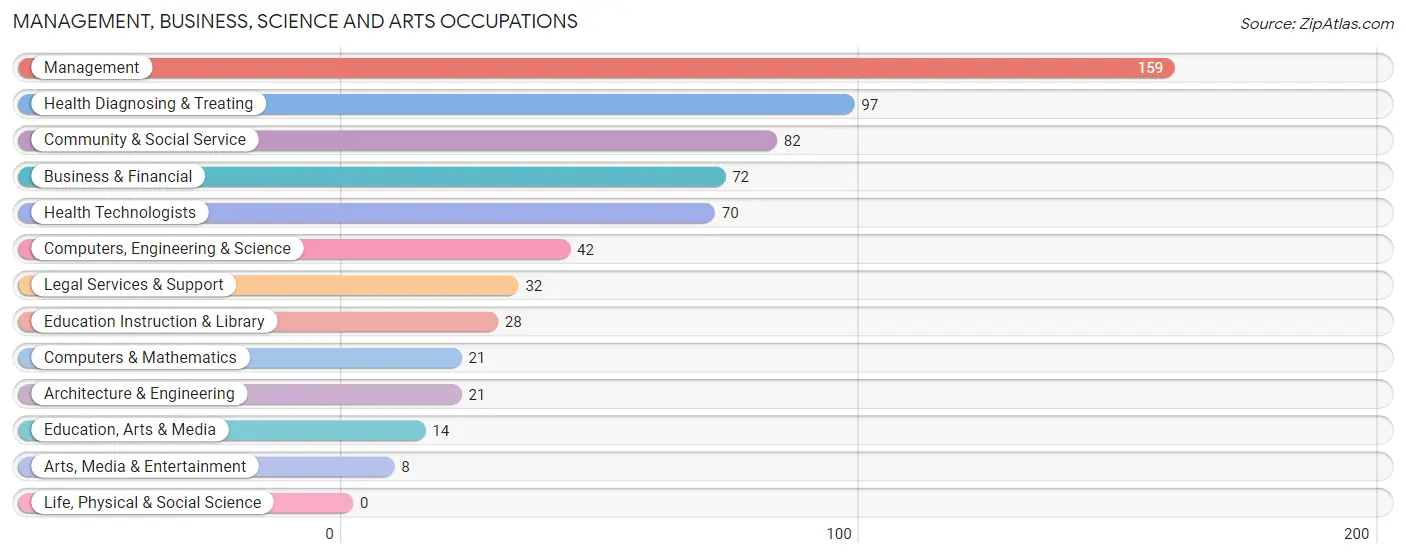
Management, Business, Science and Arts Occupations
The most common Management, Business, Science and Arts occupations in Dalworthington Gardens are Management (159 | 13.9%), Health Diagnosing & Treating (97 | 8.5%), Community & Social Service (82 | 7.2%), Business & Financial (72 | 6.3%), and Health Technologists (70 | 6.1%).
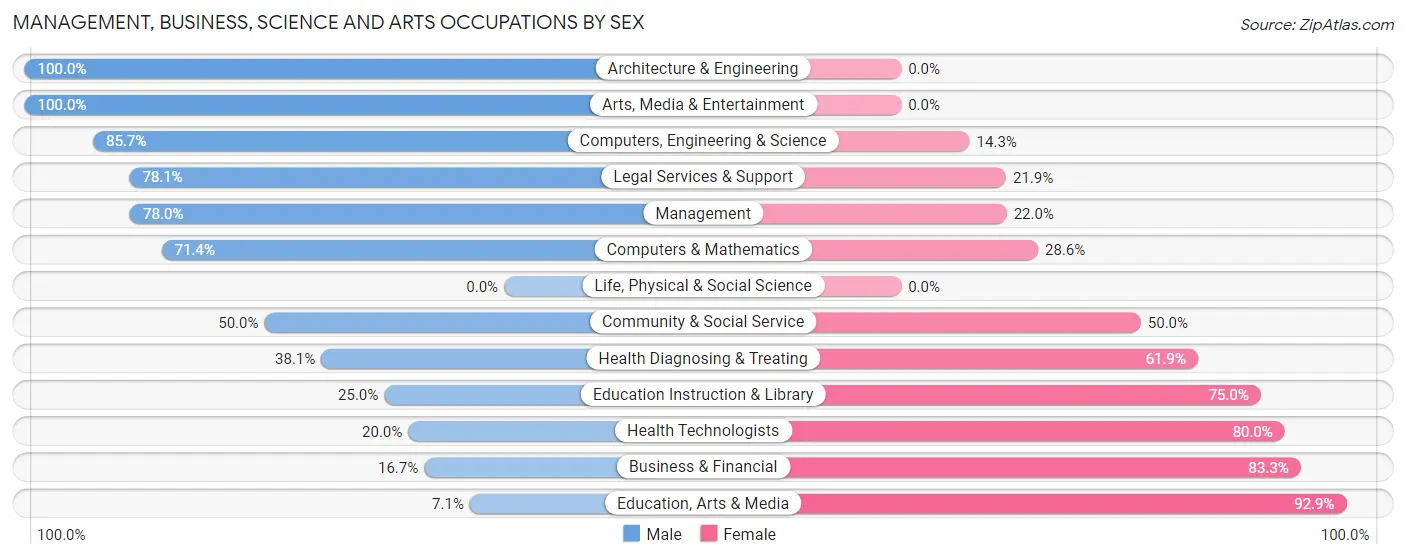
Management, Business, Science and Arts Occupations by Sex
Within the Management, Business, Science and Arts occupations in Dalworthington Gardens, the most male-oriented occupations are Architecture & Engineering (100.0%), Arts, Media & Entertainment (100.0%), and Computers, Engineering & Science (85.7%), while the most female-oriented occupations are Education, Arts & Media (92.9%), Business & Financial (83.3%), and Health Technologists (80.0%).
| Occupation | Male | Female |
| Management | 124 (78.0%) | 35 (22.0%) |
| Business & Financial | 12 (16.7%) | 60 (83.3%) |
| Computers, Engineering & Science | 36 (85.7%) | 6 (14.3%) |
| Computers & Mathematics | 15 (71.4%) | 6 (28.6%) |
| Architecture & Engineering | 21 (100.0%) | 0 (0.0%) |
| Life, Physical & Social Science | 0 (0.0%) | 0 (0.0%) |
| Community & Social Service | 41 (50.0%) | 41 (50.0%) |
| Education, Arts & Media | 1 (7.1%) | 13 (92.9%) |
| Legal Services & Support | 25 (78.1%) | 7 (21.9%) |
| Education Instruction & Library | 7 (25.0%) | 21 (75.0%) |
| Arts, Media & Entertainment | 8 (100.0%) | 0 (0.0%) |
| Health Diagnosing & Treating | 37 (38.1%) | 60 (61.9%) |
| Health Technologists | 14 (20.0%) | 56 (80.0%) |
| Total (Category) | 250 (55.3%) | 202 (44.7%) |
| Total (Overall) | 595 (52.0%) | 549 (48.0%) |
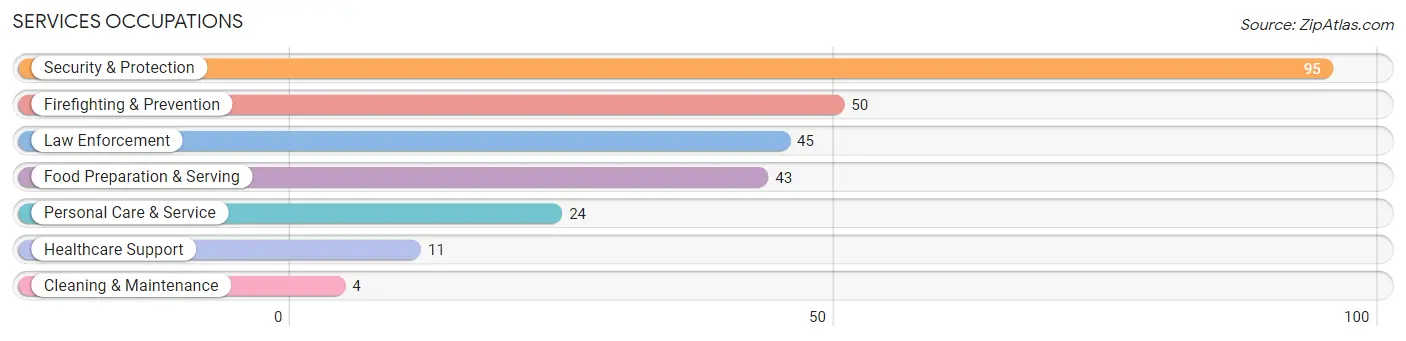
Services Occupations
The most common Services occupations in Dalworthington Gardens are Security & Protection (95 | 8.3%), Firefighting & Prevention (50 | 4.4%), Law Enforcement (45 | 3.9%), Food Preparation & Serving (43 | 3.8%), and Personal Care & Service (24 | 2.1%).
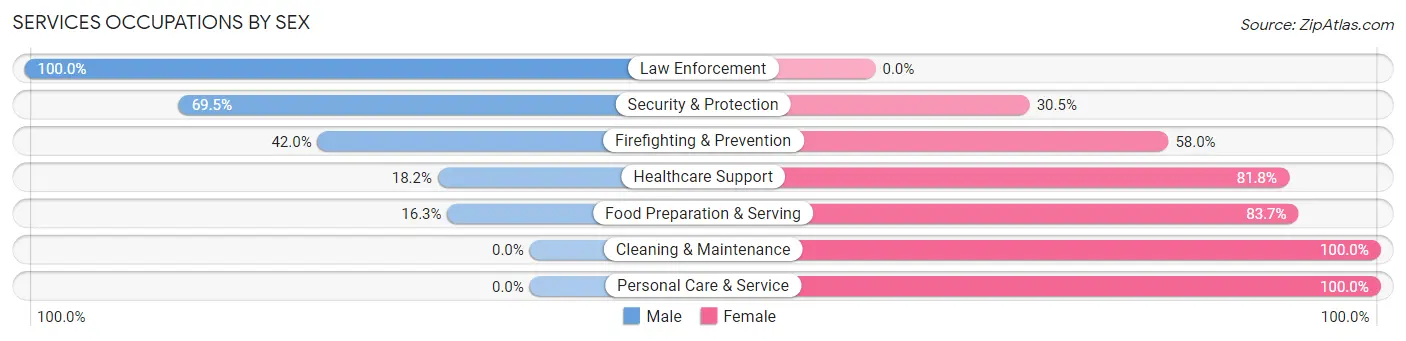
Services Occupations by Sex
Within the Services occupations in Dalworthington Gardens, the most male-oriented occupations are Law Enforcement (100.0%), Security & Protection (69.5%), and Firefighting & Prevention (42.0%), while the most female-oriented occupations are Cleaning & Maintenance (100.0%), Personal Care & Service (100.0%), and Food Preparation & Serving (83.7%).
| Occupation | Male | Female |
| Healthcare Support | 2 (18.2%) | 9 (81.8%) |
| Security & Protection | 66 (69.5%) | 29 (30.5%) |
| Firefighting & Prevention | 21 (42.0%) | 29 (58.0%) |
| Law Enforcement | 45 (100.0%) | 0 (0.0%) |
| Food Preparation & Serving | 7 (16.3%) | 36 (83.7%) |
| Cleaning & Maintenance | 0 (0.0%) | 4 (100.0%) |
| Personal Care & Service | 0 (0.0%) | 24 (100.0%) |
| Total (Category) | 75 (42.4%) | 102 (57.6%) |
| Total (Overall) | 595 (52.0%) | 549 (48.0%) |
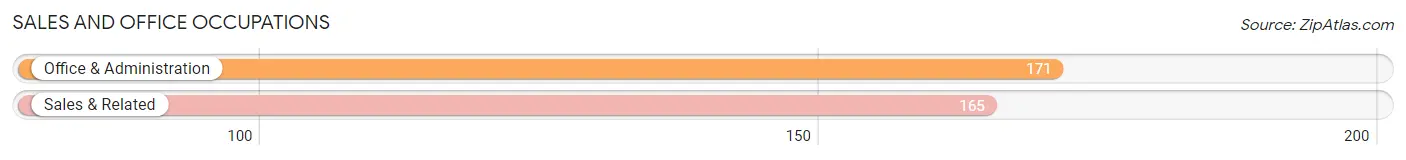
Sales and Office Occupations
The most common Sales and Office occupations in Dalworthington Gardens are Office & Administration (171 | 14.9%), and Sales & Related (165 | 14.4%).
Sales and Office Occupations by Sex
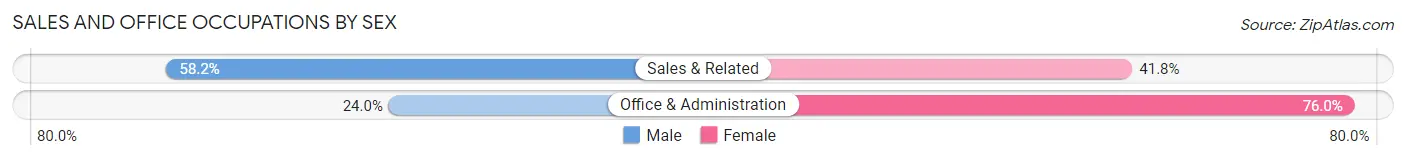
| Occupation | Male | Female |
| Sales & Related | 96 (58.2%) | 69 (41.8%) |
| Office & Administration | 41 (24.0%) | 130 (76.0%) |
| Total (Category) | 137 (40.8%) | 199 (59.2%) |
| Total (Overall) | 595 (52.0%) | 549 (48.0%) |
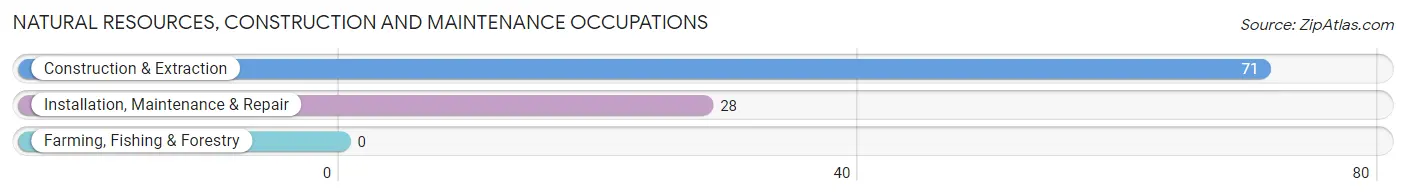
Natural Resources, Construction and Maintenance Occupations
The most common Natural Resources, Construction and Maintenance occupations in Dalworthington Gardens are Construction & Extraction (71 | 6.2%), and Installation, Maintenance & Repair (28 | 2.5%).
Natural Resources, Construction and Maintenance Occupations by Sex
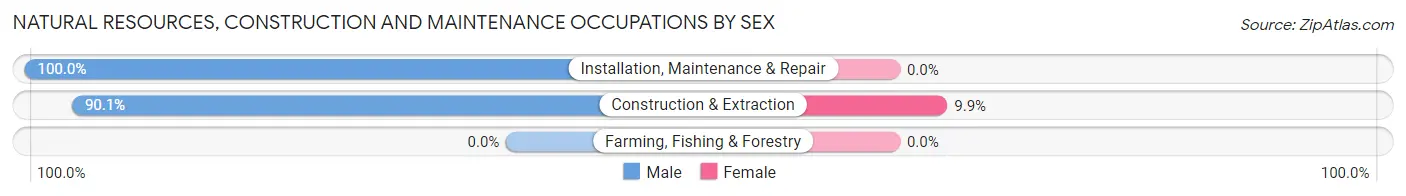
| Occupation | Male | Female |
| Farming, Fishing & Forestry | 0 (0.0%) | 0 (0.0%) |
| Construction & Extraction | 64 (90.1%) | 7 (9.9%) |
| Installation, Maintenance & Repair | 28 (100.0%) | 0 (0.0%) |
| Total (Category) | 92 (92.9%) | 7 (7.1%) |
| Total (Overall) | 595 (52.0%) | 549 (48.0%) |
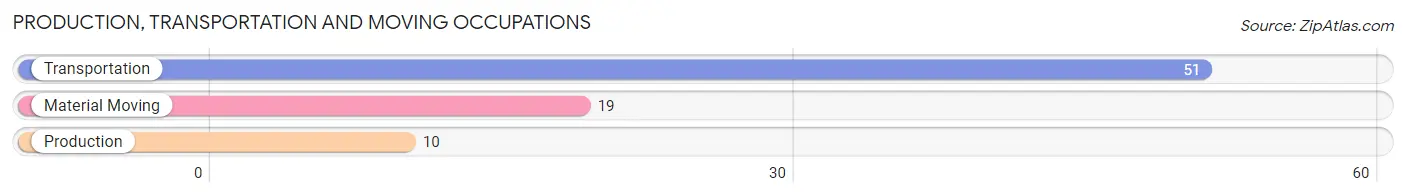
Production, Transportation and Moving Occupations
The most common Production, Transportation and Moving occupations in Dalworthington Gardens are Transportation (51 | 4.5%), Material Moving (19 | 1.7%), and Production (10 | 0.9%).
Production, Transportation and Moving Occupations by Sex
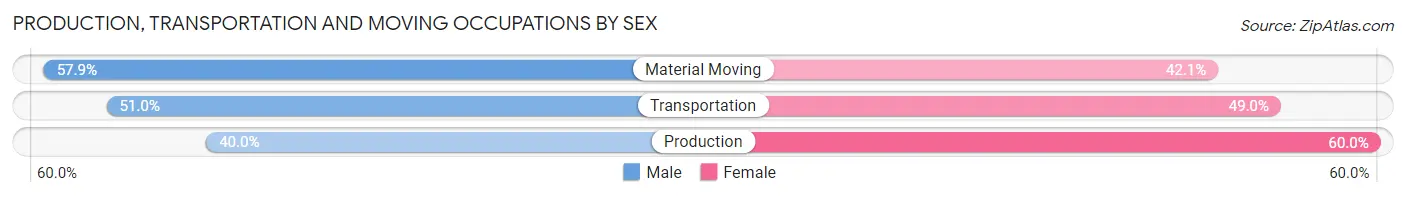
| Occupation | Male | Female |
| Production | 4 (40.0%) | 6 (60.0%) |
| Transportation | 26 (51.0%) | 25 (49.0%) |
| Material Moving | 11 (57.9%) | 8 (42.1%) |
| Total (Category) | 41 (51.2%) | 39 (48.7%) |
| Total (Overall) | 595 (52.0%) | 549 (48.0%) |
Employment Industries by Sex in Dalworthington Gardens
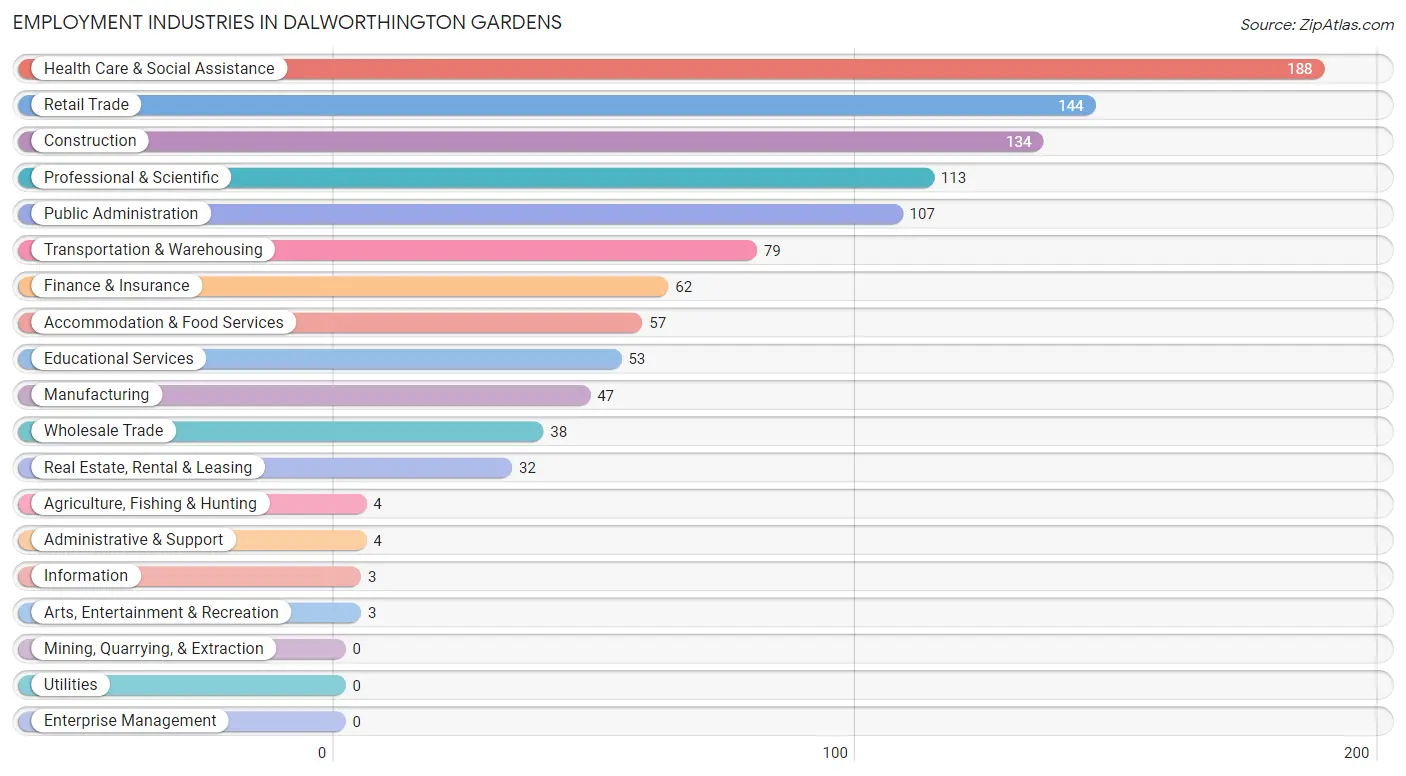
Employment Industries in Dalworthington Gardens
The major employment industries in Dalworthington Gardens include Health Care & Social Assistance (188 | 16.4%), Retail Trade (144 | 12.6%), Construction (134 | 11.7%), Professional & Scientific (113 | 9.9%), and Public Administration (107 | 9.3%).
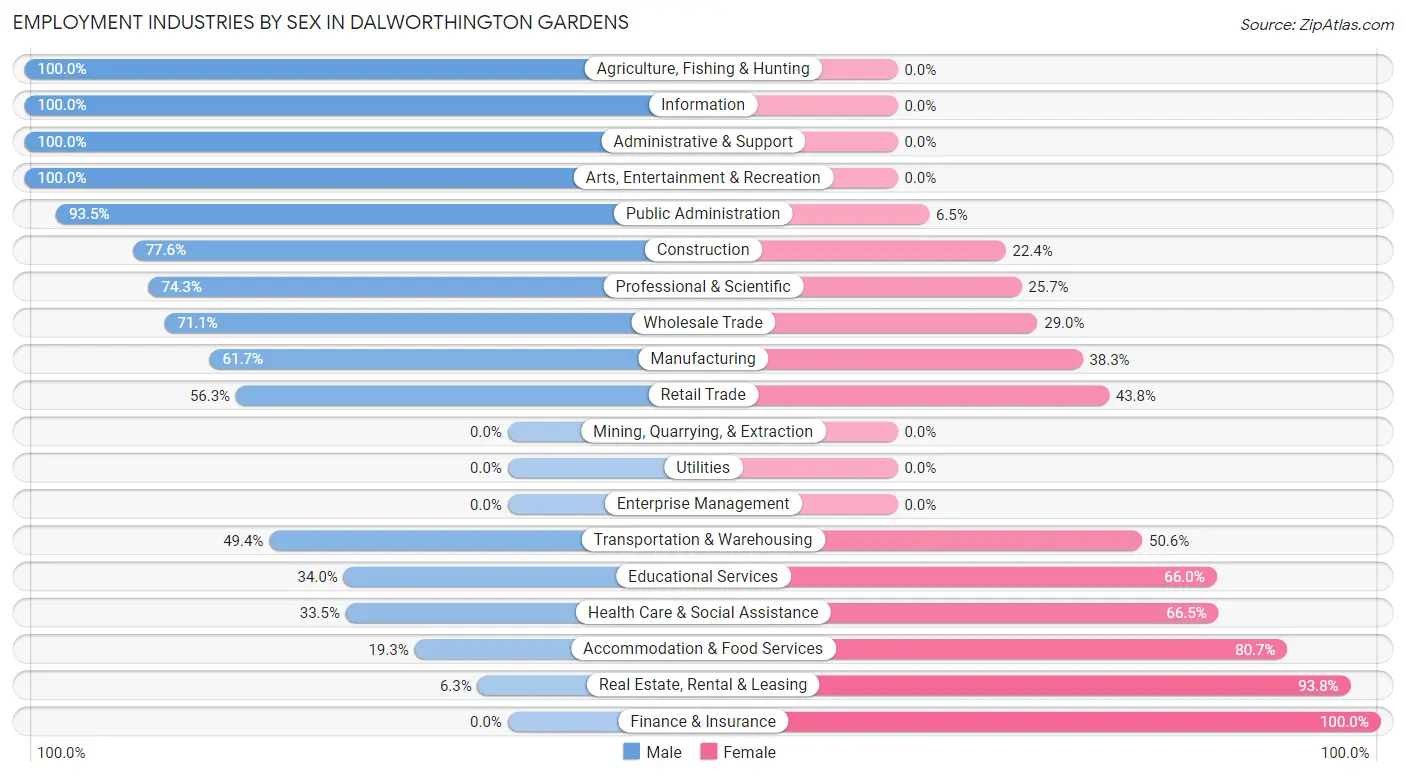
Employment Industries by Sex in Dalworthington Gardens
The Dalworthington Gardens industries that see more men than women are Agriculture, Fishing & Hunting (100.0%), Information (100.0%), and Administrative & Support (100.0%), whereas the industries that tend to have a higher number of women are Finance & Insurance (100.0%), Real Estate, Rental & Leasing (93.8%), and Accommodation & Food Services (80.7%).
| Industry | Male | Female |
| Agriculture, Fishing & Hunting | 4 (100.0%) | 0 (0.0%) |
| Mining, Quarrying, & Extraction | 0 (0.0%) | 0 (0.0%) |
| Construction | 104 (77.6%) | 30 (22.4%) |
| Manufacturing | 29 (61.7%) | 18 (38.3%) |
| Wholesale Trade | 27 (71.1%) | 11 (28.9%) |
| Retail Trade | 81 (56.2%) | 63 (43.8%) |
| Transportation & Warehousing | 39 (49.4%) | 40 (50.6%) |
| Utilities | 0 (0.0%) | 0 (0.0%) |
| Information | 3 (100.0%) | 0 (0.0%) |
| Finance & Insurance | 0 (0.0%) | 62 (100.0%) |
| Real Estate, Rental & Leasing | 2 (6.2%) | 30 (93.8%) |
| Professional & Scientific | 84 (74.3%) | 29 (25.7%) |
| Enterprise Management | 0 (0.0%) | 0 (0.0%) |
| Administrative & Support | 4 (100.0%) | 0 (0.0%) |
| Educational Services | 18 (34.0%) | 35 (66.0%) |
| Health Care & Social Assistance | 63 (33.5%) | 125 (66.5%) |
| Arts, Entertainment & Recreation | 3 (100.0%) | 0 (0.0%) |
| Accommodation & Food Services | 11 (19.3%) | 46 (80.7%) |
| Public Administration | 100 (93.5%) | 7 (6.5%) |
| Total | 595 (52.0%) | 549 (48.0%) |
Education in Dalworthington Gardens
School Enrollment in Dalworthington Gardens
The most common levels of schooling among the 469 students in Dalworthington Gardens are high school (142 | 30.3%), elementary school (104 | 22.2%), and middle school (98 | 20.9%).
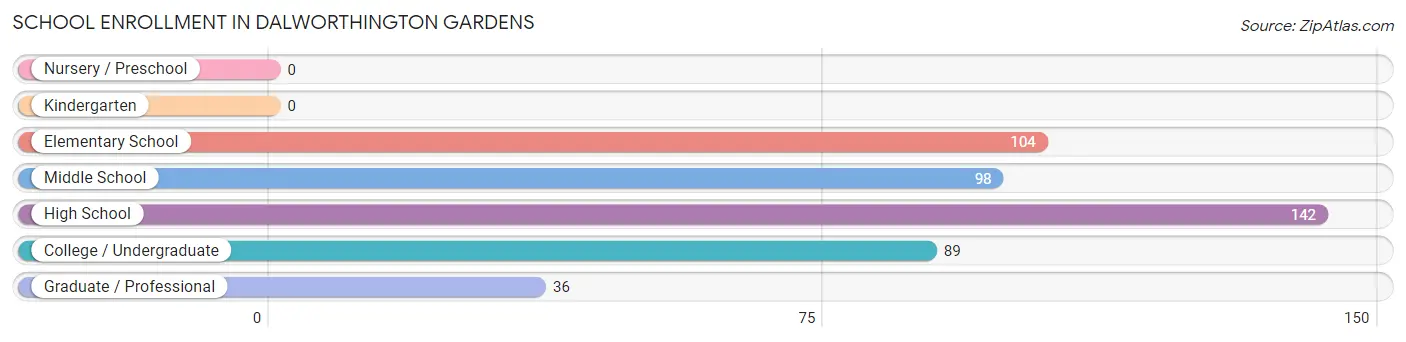
| School Level | # Students | % Students |
| Nursery / Preschool | 0 | 0.0% |
| Kindergarten | 0 | 0.0% |
| Elementary School | 104 | 22.2% |
| Middle School | 98 | 20.9% |
| High School | 142 | 30.3% |
| College / Undergraduate | 89 | 19.0% |
| Graduate / Professional | 36 | 7.7% |
| Total | 469 | 100.0% |
School Enrollment by Age by Funding Source in Dalworthington Gardens
Out of a total of 469 students who are enrolled in schools in Dalworthington Gardens, 71 (15.1%) attend a private institution, while the remaining 398 (84.9%) are enrolled in public schools. The age group of 25 to 34 year olds has the highest likelihood of being enrolled in private schools, with 6 (42.9% in the age bracket) enrolled. Conversely, the age group of 35 years and over has the lowest likelihood of being enrolled in a private school, with 18 (100.0% in the age bracket) attending a public institution.
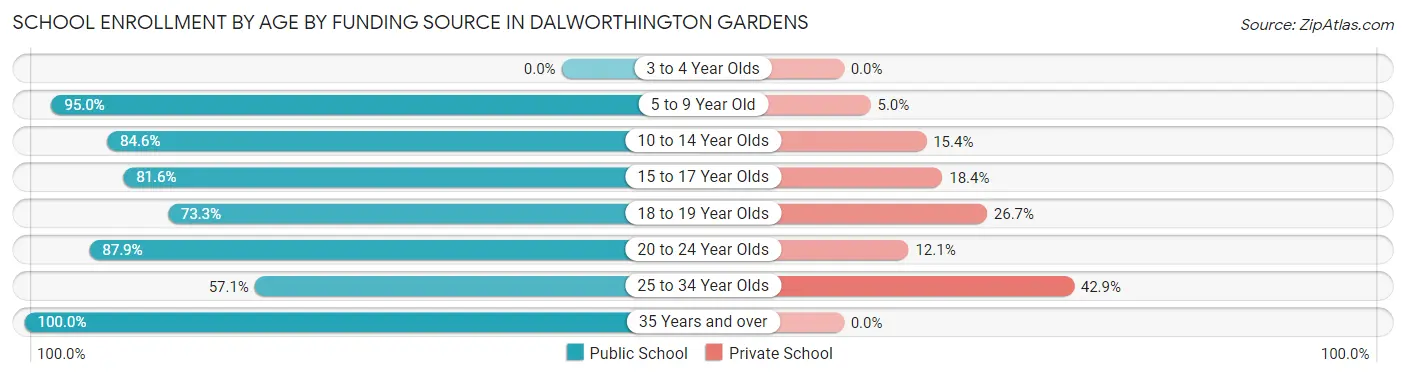
| Age Bracket | Public School | Private School |
| 3 to 4 Year Olds | 0 (0.0%) | 0 (0.0%) |
| 5 to 9 Year Old | 76 (95.0%) | 4 (5.0%) |
| 10 to 14 Year Olds | 132 (84.6%) | 24 (15.4%) |
| 15 to 17 Year Olds | 80 (81.6%) | 18 (18.4%) |
| 18 to 19 Year Olds | 33 (73.3%) | 12 (26.7%) |
| 20 to 24 Year Olds | 51 (87.9%) | 7 (12.1%) |
| 25 to 34 Year Olds | 8 (57.1%) | 6 (42.9%) |
| 35 Years and over | 18 (100.0%) | 0 (0.0%) |
| Total | 398 (84.9%) | 71 (15.1%) |
Educational Attainment by Field of Study in Dalworthington Gardens
Business (284 | 34.7%), science & technology (76 | 9.3%), bio, nature & agricultural (74 | 9.0%), education (57 | 7.0%), and psychology (52 | 6.4%) are the most common fields of study among 819 individuals in Dalworthington Gardens who have obtained a bachelor's degree or higher.
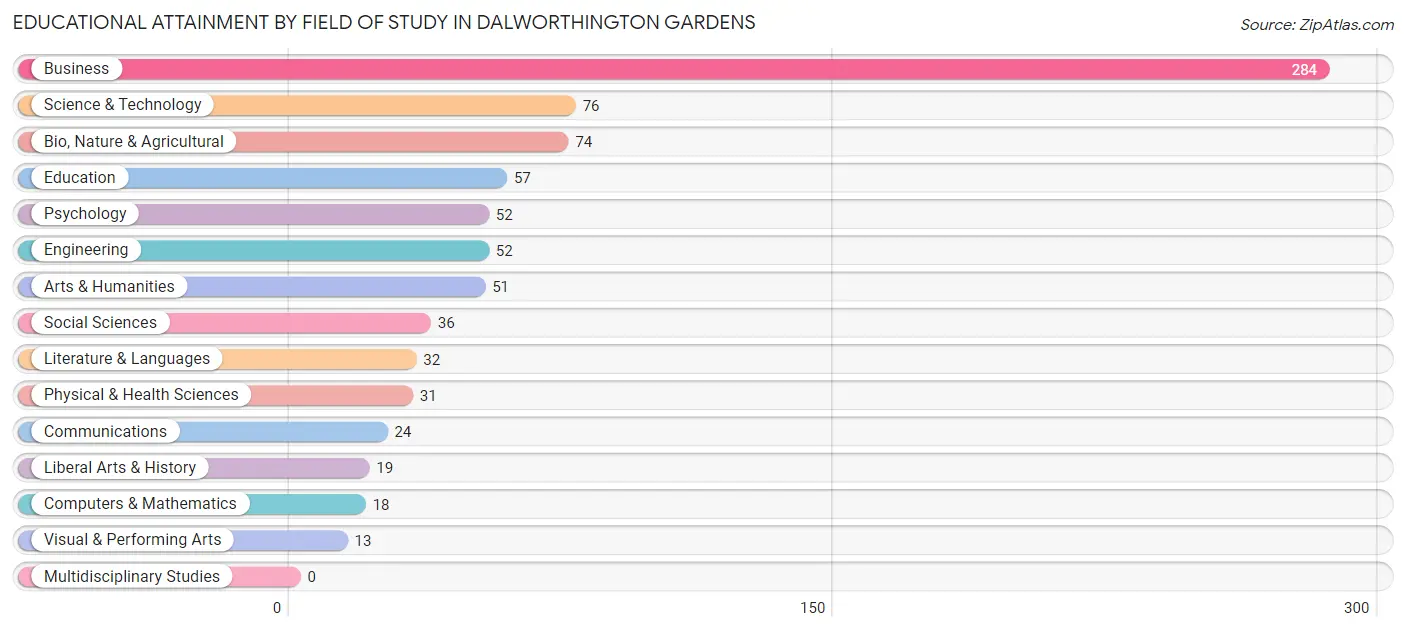
| Field of Study | # Graduates | % Graduates |
| Computers & Mathematics | 18 | 2.2% |
| Bio, Nature & Agricultural | 74 | 9.0% |
| Physical & Health Sciences | 31 | 3.8% |
| Psychology | 52 | 6.4% |
| Social Sciences | 36 | 4.4% |
| Engineering | 52 | 6.4% |
| Multidisciplinary Studies | 0 | 0.0% |
| Science & Technology | 76 | 9.3% |
| Business | 284 | 34.7% |
| Education | 57 | 7.0% |
| Literature & Languages | 32 | 3.9% |
| Liberal Arts & History | 19 | 2.3% |
| Visual & Performing Arts | 13 | 1.6% |
| Communications | 24 | 2.9% |
| Arts & Humanities | 51 | 6.2% |
| Total | 819 | 100.0% |
Transportation & Commute in Dalworthington Gardens
Vehicle Availability by Sex in Dalworthington Gardens
The most prevalent vehicle ownership categories in Dalworthington Gardens are males with 2 vehicles (313, accounting for 57.6%) and females with 2 vehicles (140, making up 57.2%).
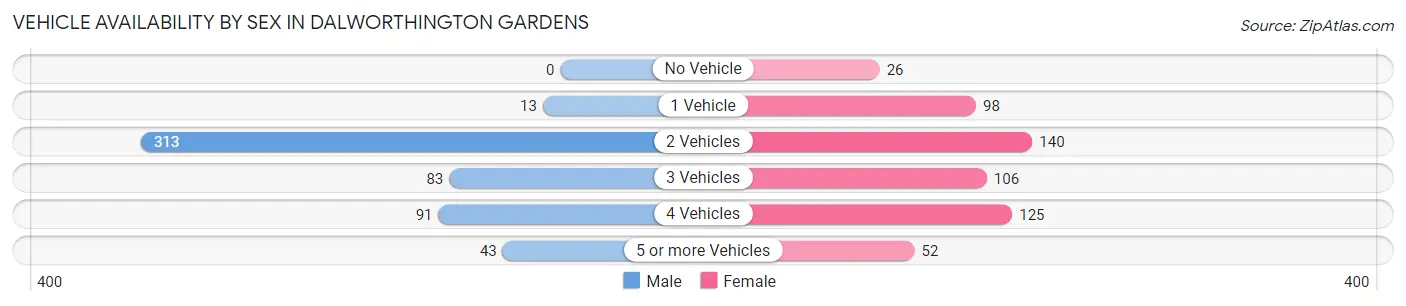
| Vehicles Available | Male | Female |
| No Vehicle | 0 (0.0%) | 26 (4.8%) |
| 1 Vehicle | 13 (2.4%) | 98 (17.9%) |
| 2 Vehicles | 313 (57.6%) | 140 (25.6%) |
| 3 Vehicles | 83 (15.3%) | 106 (19.4%) |
| 4 Vehicles | 91 (16.8%) | 125 (22.9%) |
| 5 or more Vehicles | 43 (7.9%) | 52 (9.5%) |
| Total | 543 (100.0%) | 547 (100.0%) |
Commute Time in Dalworthington Gardens
The most frequently occuring commute durations in Dalworthington Gardens are 10 to 14 minutes (129 commuters, 13.0%), 30 to 34 minutes (127 commuters, 12.8%), and 15 to 19 minutes (116 commuters, 11.7%).
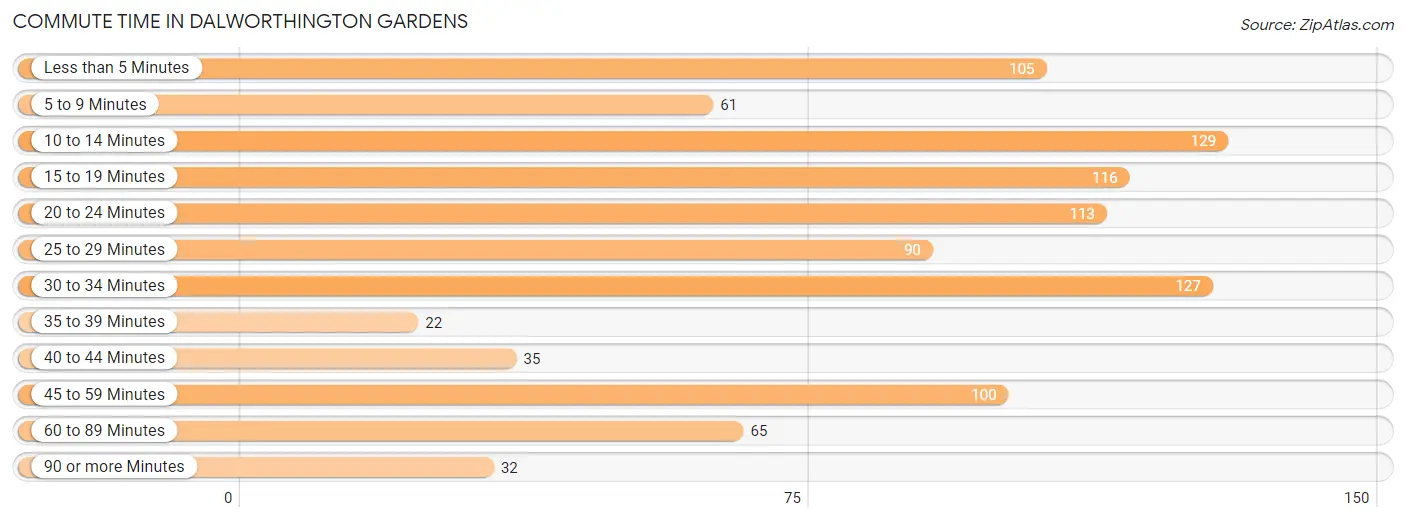
| Commute Time | # Commuters | % Commuters |
| Less than 5 Minutes | 105 | 10.5% |
| 5 to 9 Minutes | 61 | 6.1% |
| 10 to 14 Minutes | 129 | 13.0% |
| 15 to 19 Minutes | 116 | 11.7% |
| 20 to 24 Minutes | 113 | 11.4% |
| 25 to 29 Minutes | 90 | 9.0% |
| 30 to 34 Minutes | 127 | 12.8% |
| 35 to 39 Minutes | 22 | 2.2% |
| 40 to 44 Minutes | 35 | 3.5% |
| 45 to 59 Minutes | 100 | 10.1% |
| 60 to 89 Minutes | 65 | 6.5% |
| 90 or more Minutes | 32 | 3.2% |
Commute Time by Sex in Dalworthington Gardens
The most common commute times in Dalworthington Gardens are 30 to 34 minutes (88 commuters, 18.2%) for males and 45 to 59 minutes (86 commuters, 16.8%) for females.
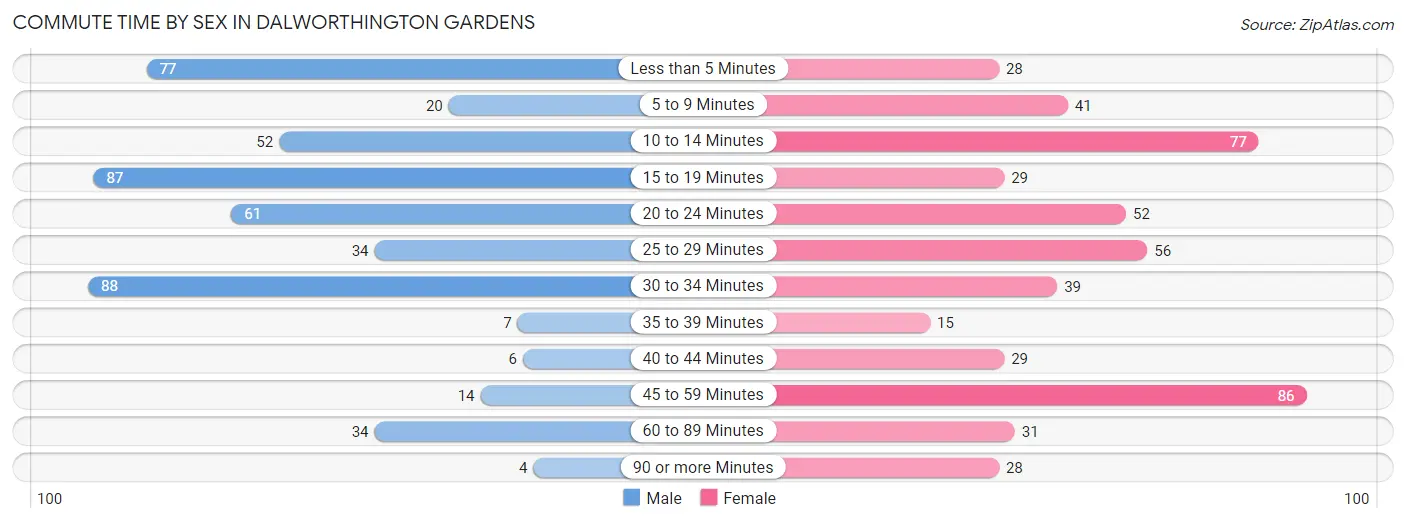
| Commute Time | Male | Female |
| Less than 5 Minutes | 77 (15.9%) | 28 (5.5%) |
| 5 to 9 Minutes | 20 (4.1%) | 41 (8.0%) |
| 10 to 14 Minutes | 52 (10.7%) | 77 (15.1%) |
| 15 to 19 Minutes | 87 (18.0%) | 29 (5.7%) |
| 20 to 24 Minutes | 61 (12.6%) | 52 (10.2%) |
| 25 to 29 Minutes | 34 (7.0%) | 56 (11.0%) |
| 30 to 34 Minutes | 88 (18.2%) | 39 (7.6%) |
| 35 to 39 Minutes | 7 (1.5%) | 15 (2.9%) |
| 40 to 44 Minutes | 6 (1.2%) | 29 (5.7%) |
| 45 to 59 Minutes | 14 (2.9%) | 86 (16.8%) |
| 60 to 89 Minutes | 34 (7.0%) | 31 (6.1%) |
| 90 or more Minutes | 4 (0.8%) | 28 (5.5%) |
Time of Departure to Work by Sex in Dalworthington Gardens
The most frequent times of departure to work in Dalworthington Gardens are 7:00 AM to 7:29 AM (126, 26.0%) for males and 7:00 AM to 7:29 AM (112, 21.9%) for females.
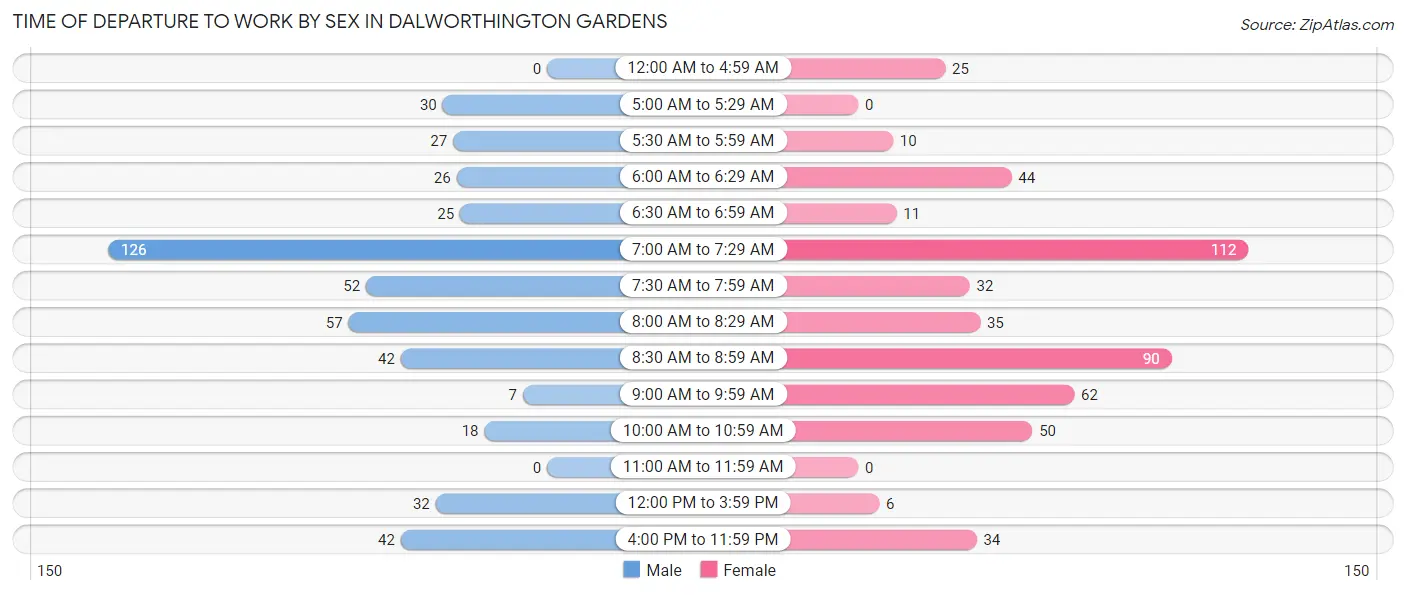
| Time of Departure | Male | Female |
| 12:00 AM to 4:59 AM | 0 (0.0%) | 25 (4.9%) |
| 5:00 AM to 5:29 AM | 30 (6.2%) | 0 (0.0%) |
| 5:30 AM to 5:59 AM | 27 (5.6%) | 10 (2.0%) |
| 6:00 AM to 6:29 AM | 26 (5.4%) | 44 (8.6%) |
| 6:30 AM to 6:59 AM | 25 (5.2%) | 11 (2.1%) |
| 7:00 AM to 7:29 AM | 126 (26.0%) | 112 (21.9%) |
| 7:30 AM to 7:59 AM | 52 (10.7%) | 32 (6.3%) |
| 8:00 AM to 8:29 AM | 57 (11.8%) | 35 (6.9%) |
| 8:30 AM to 8:59 AM | 42 (8.7%) | 90 (17.6%) |
| 9:00 AM to 9:59 AM | 7 (1.5%) | 62 (12.1%) |
| 10:00 AM to 10:59 AM | 18 (3.7%) | 50 (9.8%) |
| 11:00 AM to 11:59 AM | 0 (0.0%) | 0 (0.0%) |
| 12:00 PM to 3:59 PM | 32 (6.6%) | 6 (1.2%) |
| 4:00 PM to 11:59 PM | 42 (8.7%) | 34 (6.7%) |
| Total | 484 (100.0%) | 511 (100.0%) |
Housing Occupancy in Dalworthington Gardens
Occupancy by Ownership in Dalworthington Gardens
Of the total 868 dwellings in Dalworthington Gardens, owner-occupied units account for 721 (83.1%), while renter-occupied units make up 147 (16.9%).
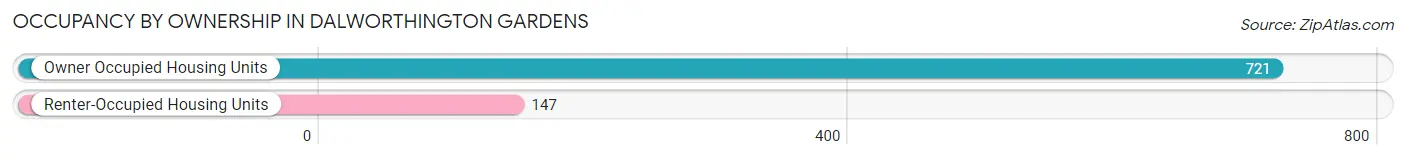
| Occupancy | # Housing Units | % Housing Units |
| Owner Occupied Housing Units | 721 | 83.1% |
| Renter-Occupied Housing Units | 147 | 16.9% |
| Total Occupied Housing Units | 868 | 100.0% |
Occupancy by Household Size in Dalworthington Gardens
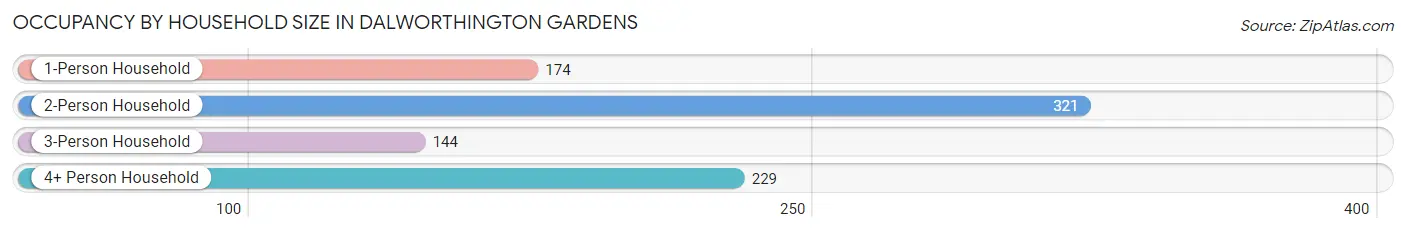
| Household Size | # Housing Units | % Housing Units |
| 1-Person Household | 174 | 20.1% |
| 2-Person Household | 321 | 37.0% |
| 3-Person Household | 144 | 16.6% |
| 4+ Person Household | 229 | 26.4% |
| Total Housing Units | 868 | 100.0% |
Occupancy by Ownership by Household Size in Dalworthington Gardens
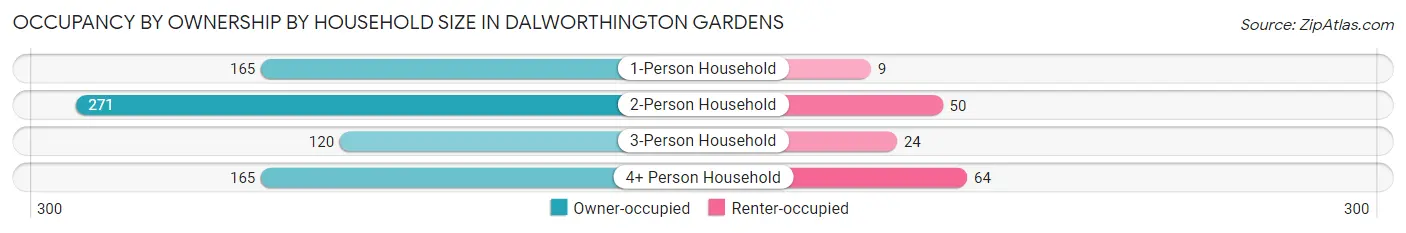
| Household Size | Owner-occupied | Renter-occupied |
| 1-Person Household | 165 (94.8%) | 9 (5.2%) |
| 2-Person Household | 271 (84.4%) | 50 (15.6%) |
| 3-Person Household | 120 (83.3%) | 24 (16.7%) |
| 4+ Person Household | 165 (72.1%) | 64 (28.0%) |
| Total Housing Units | 721 (83.1%) | 147 (16.9%) |
Occupancy by Educational Attainment in Dalworthington Gardens
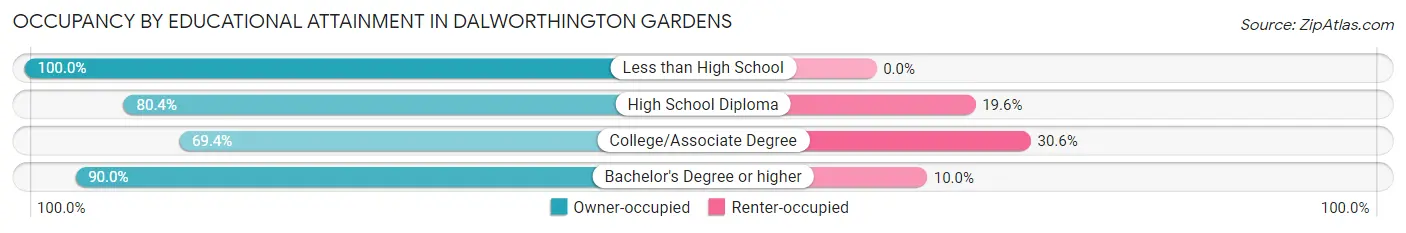
| Household Size | Owner-occupied | Renter-occupied |
| Less than High School | 13 (100.0%) | 0 (0.0%) |
| High School Diploma | 90 (80.4%) | 22 (19.6%) |
| College/Associate Degree | 170 (69.4%) | 75 (30.6%) |
| Bachelor's Degree or higher | 448 (90.0%) | 50 (10.0%) |
Occupancy by Age of Householder in Dalworthington Gardens
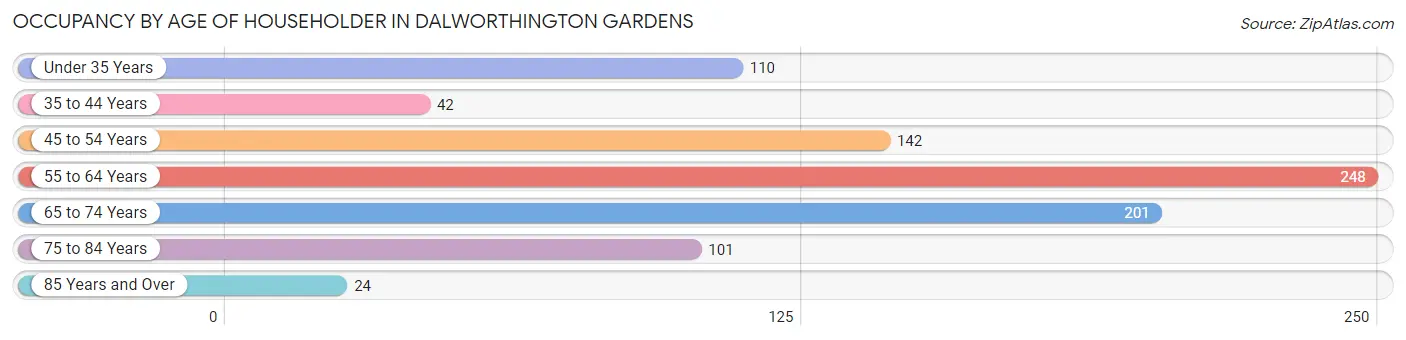
| Age Bracket | # Households | % Households |
| Under 35 Years | 110 | 12.7% |
| 35 to 44 Years | 42 | 4.8% |
| 45 to 54 Years | 142 | 16.4% |
| 55 to 64 Years | 248 | 28.6% |
| 65 to 74 Years | 201 | 23.2% |
| 75 to 84 Years | 101 | 11.6% |
| 85 Years and Over | 24 | 2.8% |
| Total | 868 | 100.0% |
Housing Finances in Dalworthington Gardens
Median Income by Occupancy in Dalworthington Gardens
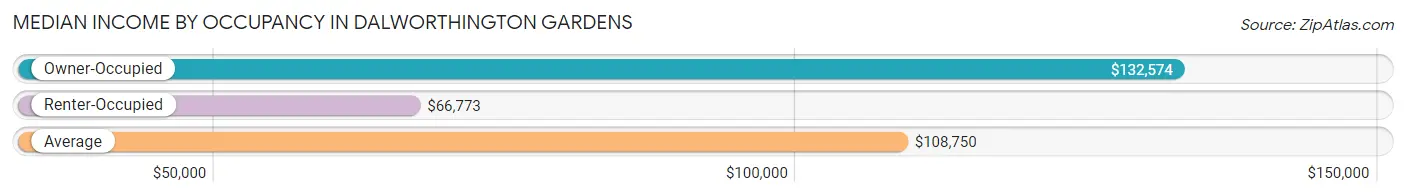
| Occupancy Type | # Households | Median Income |
| Owner-Occupied | 721 (83.1%) | $132,574 |
| Renter-Occupied | 147 (16.9%) | $66,773 |
| Average | 868 (100.0%) | $108,750 |
Occupancy by Householder Income Bracket in Dalworthington Gardens
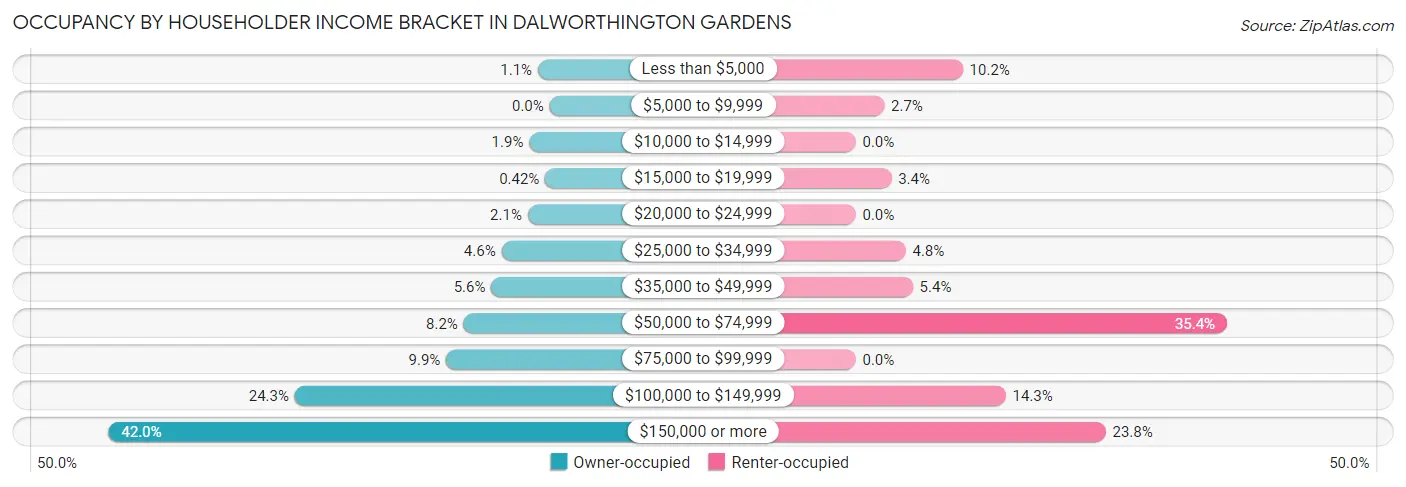
| Income Bracket | Owner-occupied | Renter-occupied |
| Less than $5,000 | 8 (1.1%) | 15 (10.2%) |
| $5,000 to $9,999 | 0 (0.0%) | 4 (2.7%) |
| $10,000 to $14,999 | 14 (1.9%) | 0 (0.0%) |
| $15,000 to $19,999 | 3 (0.4%) | 5 (3.4%) |
| $20,000 to $24,999 | 15 (2.1%) | 0 (0.0%) |
| $25,000 to $34,999 | 33 (4.6%) | 7 (4.8%) |
| $35,000 to $49,999 | 40 (5.6%) | 8 (5.4%) |
| $50,000 to $74,999 | 59 (8.2%) | 52 (35.4%) |
| $75,000 to $99,999 | 71 (9.9%) | 0 (0.0%) |
| $100,000 to $149,999 | 175 (24.3%) | 21 (14.3%) |
| $150,000 or more | 303 (42.0%) | 35 (23.8%) |
| Total | 721 (100.0%) | 147 (100.0%) |
Monthly Housing Cost Tiers in Dalworthington Gardens
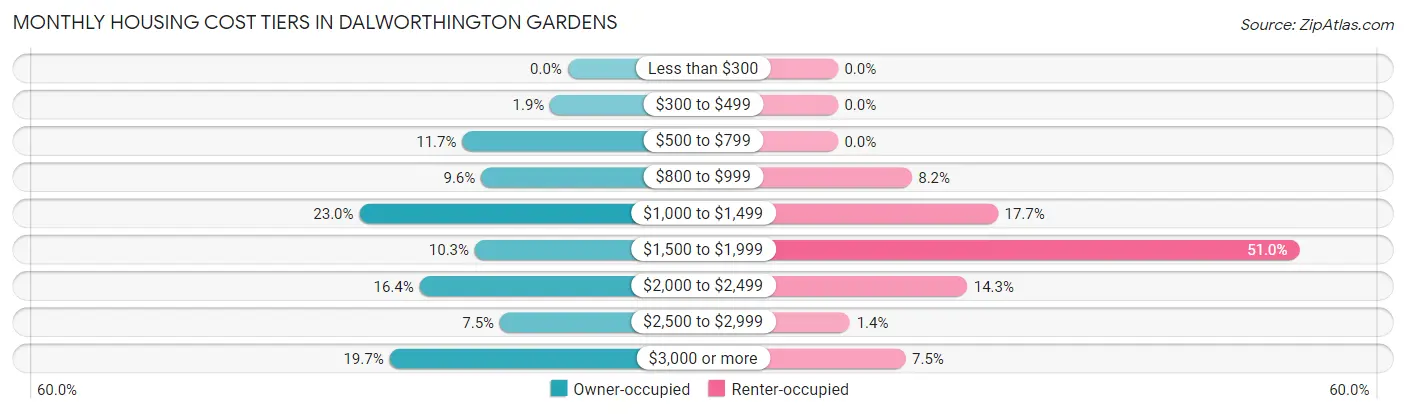
| Monthly Cost | Owner-occupied | Renter-occupied |
| Less than $300 | 0 (0.0%) | 0 (0.0%) |
| $300 to $499 | 14 (1.9%) | 0 (0.0%) |
| $500 to $799 | 84 (11.7%) | 0 (0.0%) |
| $800 to $999 | 69 (9.6%) | 12 (8.2%) |
| $1,000 to $1,499 | 166 (23.0%) | 26 (17.7%) |
| $1,500 to $1,999 | 74 (10.3%) | 75 (51.0%) |
| $2,000 to $2,499 | 118 (16.4%) | 21 (14.3%) |
| $2,500 to $2,999 | 54 (7.5%) | 2 (1.4%) |
| $3,000 or more | 142 (19.7%) | 11 (7.5%) |
| Total | 721 (100.0%) | 147 (100.0%) |
Physical Housing Characteristics in Dalworthington Gardens
Housing Structures in Dalworthington Gardens
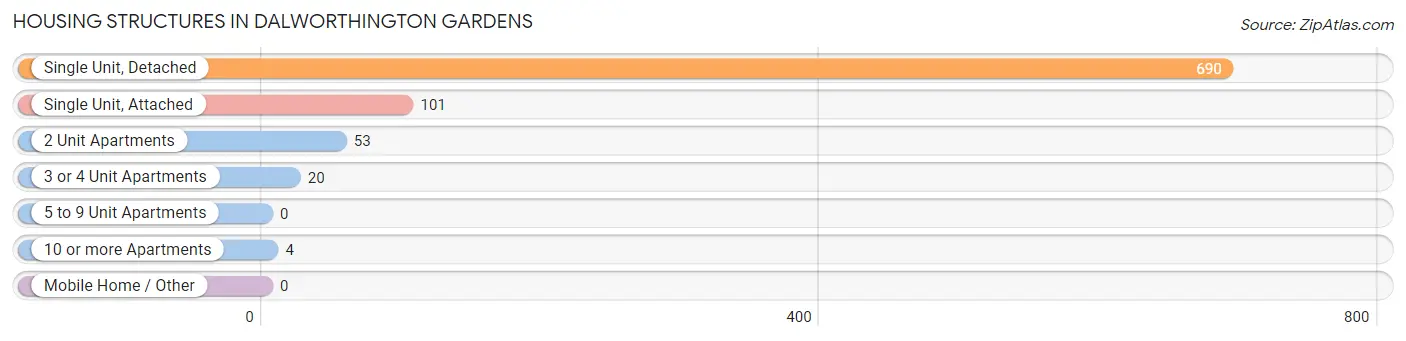
| Structure Type | # Housing Units | % Housing Units |
| Single Unit, Detached | 690 | 79.5% |
| Single Unit, Attached | 101 | 11.6% |
| 2 Unit Apartments | 53 | 6.1% |
| 3 or 4 Unit Apartments | 20 | 2.3% |
| 5 to 9 Unit Apartments | 0 | 0.0% |
| 10 or more Apartments | 4 | 0.5% |
| Mobile Home / Other | 0 | 0.0% |
| Total | 868 | 100.0% |
Housing Structures by Occupancy in Dalworthington Gardens
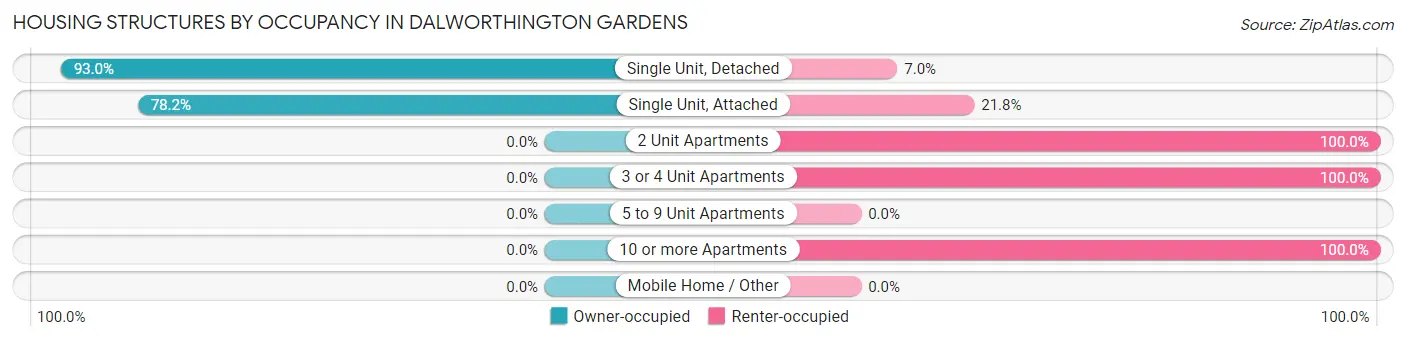
| Structure Type | Owner-occupied | Renter-occupied |
| Single Unit, Detached | 642 (93.0%) | 48 (7.0%) |
| Single Unit, Attached | 79 (78.2%) | 22 (21.8%) |
| 2 Unit Apartments | 0 (0.0%) | 53 (100.0%) |
| 3 or 4 Unit Apartments | 0 (0.0%) | 20 (100.0%) |
| 5 to 9 Unit Apartments | 0 (0.0%) | 0 (0.0%) |
| 10 or more Apartments | 0 (0.0%) | 4 (100.0%) |
| Mobile Home / Other | 0 (0.0%) | 0 (0.0%) |
| Total | 721 (83.1%) | 147 (16.9%) |
Housing Structures by Number of Rooms in Dalworthington Gardens
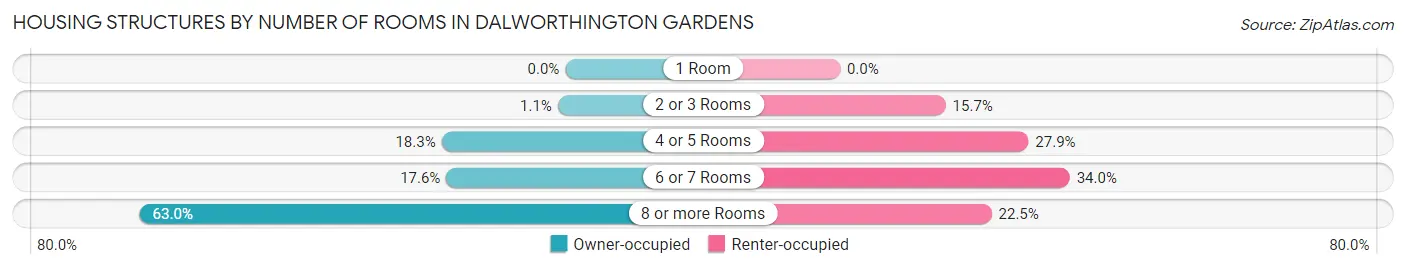
| Number of Rooms | Owner-occupied | Renter-occupied |
| 1 Room | 0 (0.0%) | 0 (0.0%) |
| 2 or 3 Rooms | 8 (1.1%) | 23 (15.7%) |
| 4 or 5 Rooms | 132 (18.3%) | 41 (27.9%) |
| 6 or 7 Rooms | 127 (17.6%) | 50 (34.0%) |
| 8 or more Rooms | 454 (63.0%) | 33 (22.5%) |
| Total | 721 (100.0%) | 147 (100.0%) |
Housing Structure by Heating Type in Dalworthington Gardens
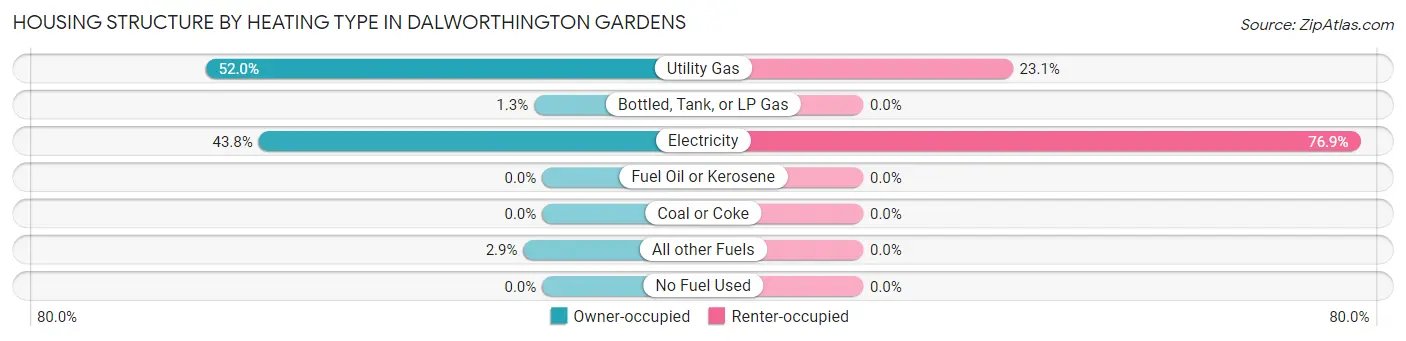
| Heating Type | Owner-occupied | Renter-occupied |
| Utility Gas | 375 (52.0%) | 34 (23.1%) |
| Bottled, Tank, or LP Gas | 9 (1.3%) | 0 (0.0%) |
| Electricity | 316 (43.8%) | 113 (76.9%) |
| Fuel Oil or Kerosene | 0 (0.0%) | 0 (0.0%) |
| Coal or Coke | 0 (0.0%) | 0 (0.0%) |
| All other Fuels | 21 (2.9%) | 0 (0.0%) |
| No Fuel Used | 0 (0.0%) | 0 (0.0%) |
| Total | 721 (100.0%) | 147 (100.0%) |
Household Vehicle Usage in Dalworthington Gardens
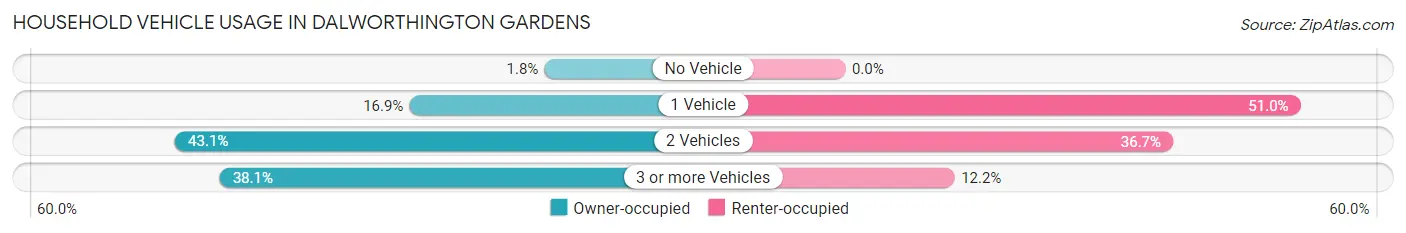
| Vehicles per Household | Owner-occupied | Renter-occupied |
| No Vehicle | 13 (1.8%) | 0 (0.0%) |
| 1 Vehicle | 122 (16.9%) | 75 (51.0%) |
| 2 Vehicles | 311 (43.1%) | 54 (36.7%) |
| 3 or more Vehicles | 275 (38.1%) | 18 (12.2%) |
| Total | 721 (100.0%) | 147 (100.0%) |
Real Estate & Mortgages in Dalworthington Gardens
Real Estate and Mortgage Overview in Dalworthington Gardens
| Characteristic | Without Mortgage | With Mortgage |
| Housing Units | 424 | 297 |
| Median Property Value | $462,100 | $441,300 |
| Median Household Income | $134,500 | $110 |
| Monthly Housing Costs | $1,250 | $142 |
| Real Estate Taxes | $6,732 | $0 |
Property Value by Mortgage Status in Dalworthington Gardens
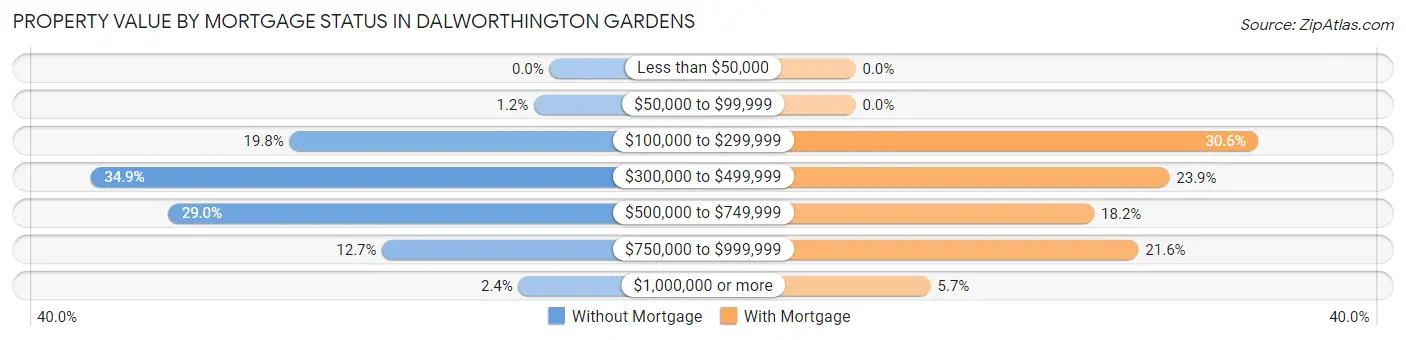
| Property Value | Without Mortgage | With Mortgage |
| Less than $50,000 | 0 (0.0%) | 0 (0.0%) |
| $50,000 to $99,999 | 5 (1.2%) | 0 (0.0%) |
| $100,000 to $299,999 | 84 (19.8%) | 91 (30.6%) |
| $300,000 to $499,999 | 148 (34.9%) | 71 (23.9%) |
| $500,000 to $749,999 | 123 (29.0%) | 54 (18.2%) |
| $750,000 to $999,999 | 54 (12.7%) | 64 (21.5%) |
| $1,000,000 or more | 10 (2.4%) | 17 (5.7%) |
| Total | 424 (100.0%) | 297 (100.0%) |
Household Income by Mortgage Status in Dalworthington Gardens
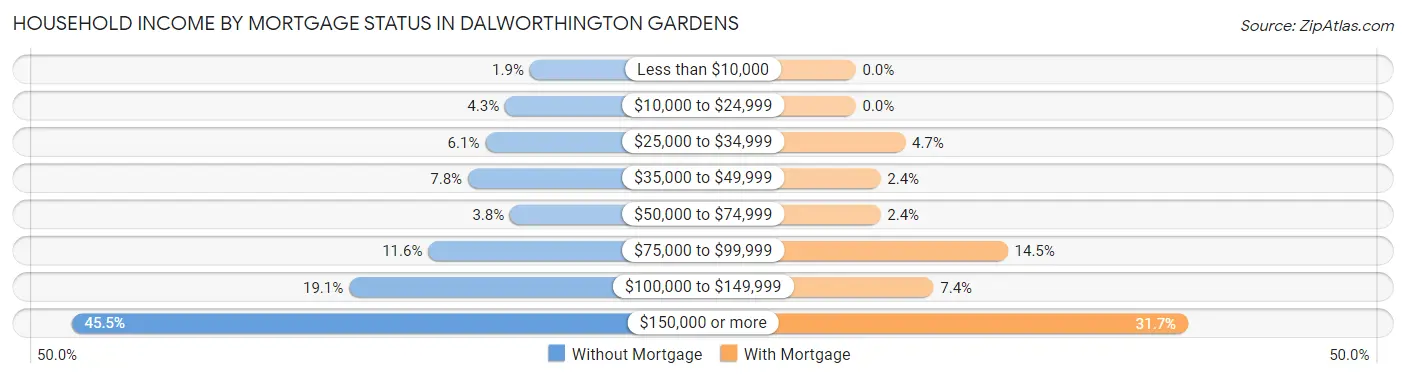
| Household Income | Without Mortgage | With Mortgage |
| Less than $10,000 | 8 (1.9%) | 0 (0.0%) |
| $10,000 to $24,999 | 18 (4.3%) | 0 (0.0%) |
| $25,000 to $34,999 | 26 (6.1%) | 14 (4.7%) |
| $35,000 to $49,999 | 33 (7.8%) | 7 (2.4%) |
| $50,000 to $74,999 | 16 (3.8%) | 7 (2.4%) |
| $75,000 to $99,999 | 49 (11.6%) | 43 (14.5%) |
| $100,000 to $149,999 | 81 (19.1%) | 22 (7.4%) |
| $150,000 or more | 193 (45.5%) | 94 (31.7%) |
| Total | 424 (100.0%) | 297 (100.0%) |
Property Value to Household Income Ratio in Dalworthington Gardens
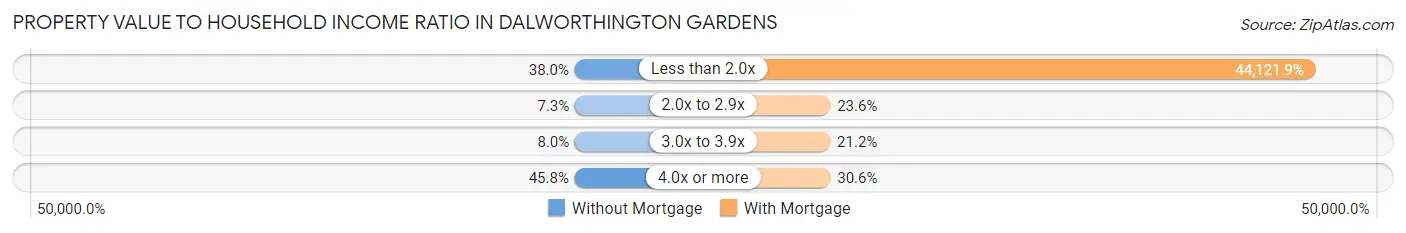
| Value-to-Income Ratio | Without Mortgage | With Mortgage |
| Less than 2.0x | 161 (38.0%) | 131,042 (44,121.9%) |
| 2.0x to 2.9x | 31 (7.3%) | 70 (23.6%) |
| 3.0x to 3.9x | 34 (8.0%) | 63 (21.2%) |
| 4.0x or more | 194 (45.8%) | 91 (30.6%) |
| Total | 424 (100.0%) | 297 (100.0%) |
Real Estate Taxes by Mortgage Status in Dalworthington Gardens
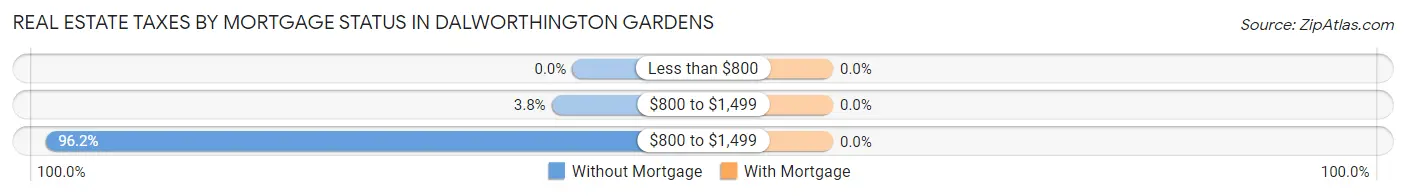
| Property Taxes | Without Mortgage | With Mortgage |
| Less than $800 | 0 (0.0%) | 0 (0.0%) |
| $800 to $1,499 | 16 (3.8%) | 0 (0.0%) |
| $800 to $1,499 | 408 (96.2%) | 0 (0.0%) |
| Total | 424 (100.0%) | 297 (100.0%) |
Health & Disability in Dalworthington Gardens
Health Insurance Coverage by Age in Dalworthington Gardens
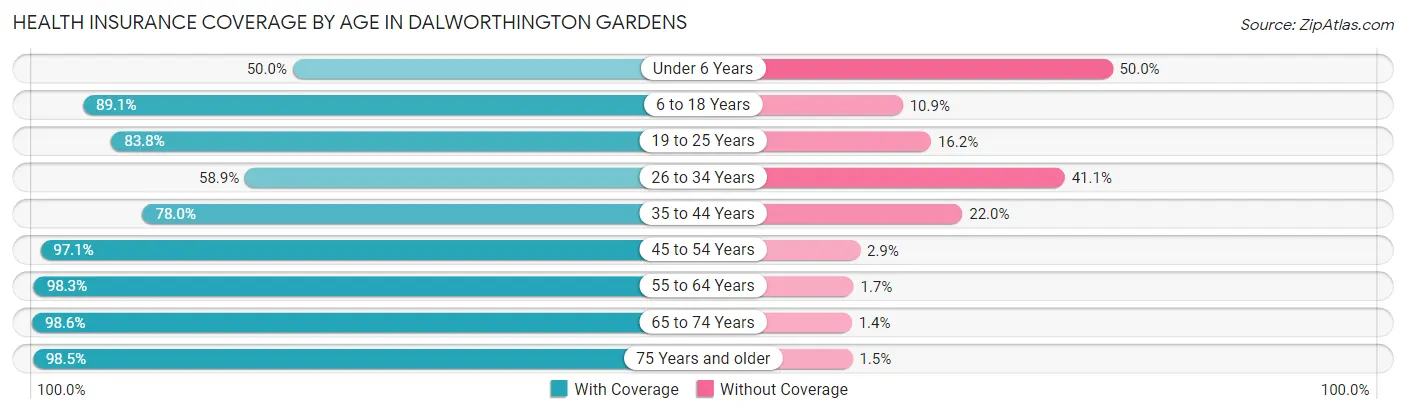
| Age Bracket | With Coverage | Without Coverage |
| Under 6 Years | 58 (50.0%) | 58 (50.0%) |
| 6 to 18 Years | 335 (89.1%) | 41 (10.9%) |
| 19 to 25 Years | 197 (83.8%) | 38 (16.2%) |
| 26 to 34 Years | 106 (58.9%) | 74 (41.1%) |
| 35 to 44 Years | 117 (78.0%) | 33 (22.0%) |
| 45 to 54 Years | 331 (97.1%) | 10 (2.9%) |
| 55 to 64 Years | 400 (98.3%) | 7 (1.7%) |
| 65 to 74 Years | 354 (98.6%) | 5 (1.4%) |
| 75 Years and older | 260 (98.5%) | 4 (1.5%) |
| Total | 2,158 (88.9%) | 270 (11.1%) |
Health Insurance Coverage by Citizenship Status in Dalworthington Gardens
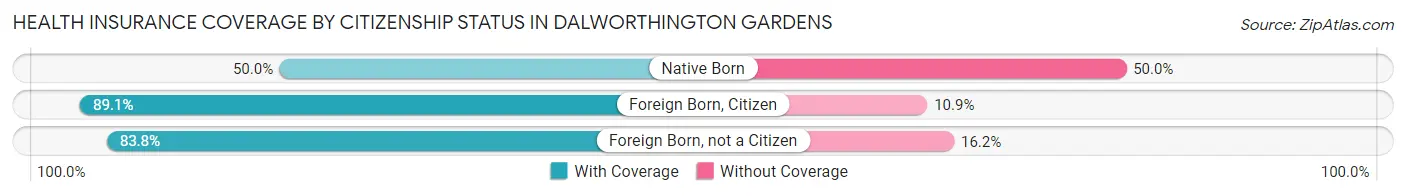
| Citizenship Status | With Coverage | Without Coverage |
| Native Born | 58 (50.0%) | 58 (50.0%) |
| Foreign Born, Citizen | 335 (89.1%) | 41 (10.9%) |
| Foreign Born, not a Citizen | 197 (83.8%) | 38 (16.2%) |
Health Insurance Coverage by Household Income in Dalworthington Gardens
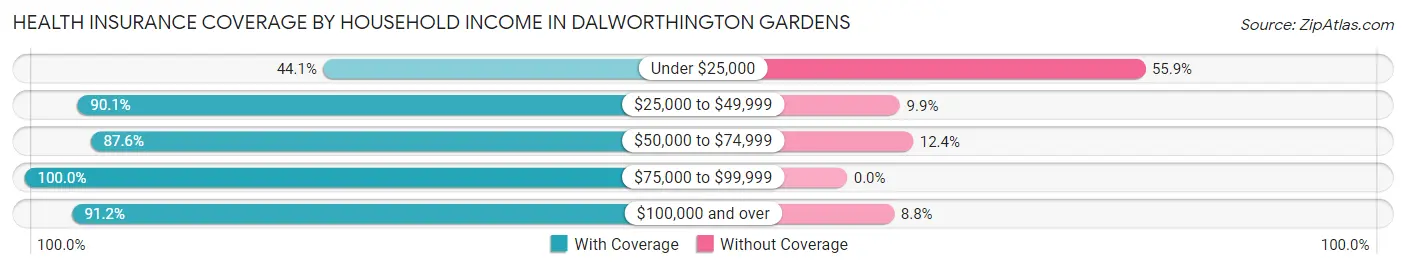
| Household Income | With Coverage | Without Coverage |
| Under $25,000 | 49 (44.1%) | 62 (55.9%) |
| $25,000 to $49,999 | 173 (90.1%) | 19 (9.9%) |
| $50,000 to $74,999 | 255 (87.6%) | 36 (12.4%) |
| $75,000 to $99,999 | 150 (100.0%) | 0 (0.0%) |
| $100,000 and over | 1,522 (91.2%) | 147 (8.8%) |
Public vs Private Health Insurance Coverage by Age in Dalworthington Gardens
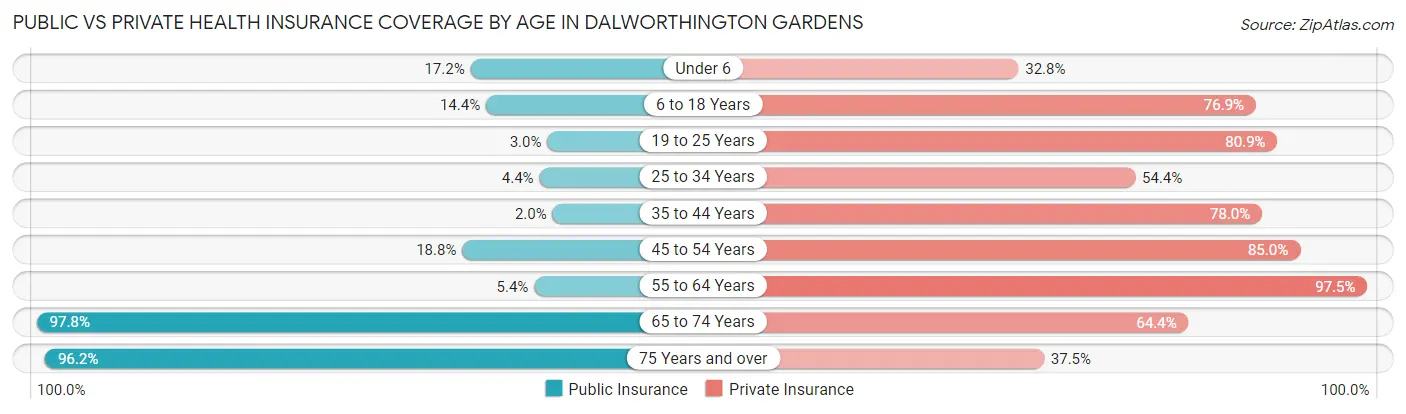
| Age Bracket | Public Insurance | Private Insurance |
| Under 6 | 20 (17.2%) | 38 (32.8%) |
| 6 to 18 Years | 54 (14.4%) | 289 (76.9%) |
| 19 to 25 Years | 7 (3.0%) | 190 (80.8%) |
| 25 to 34 Years | 8 (4.4%) | 98 (54.4%) |
| 35 to 44 Years | 3 (2.0%) | 117 (78.0%) |
| 45 to 54 Years | 64 (18.8%) | 290 (85.0%) |
| 55 to 64 Years | 22 (5.4%) | 397 (97.5%) |
| 65 to 74 Years | 351 (97.8%) | 231 (64.3%) |
| 75 Years and over | 254 (96.2%) | 99 (37.5%) |
| Total | 783 (32.3%) | 1,749 (72.0%) |
Disability Status by Sex by Age in Dalworthington Gardens
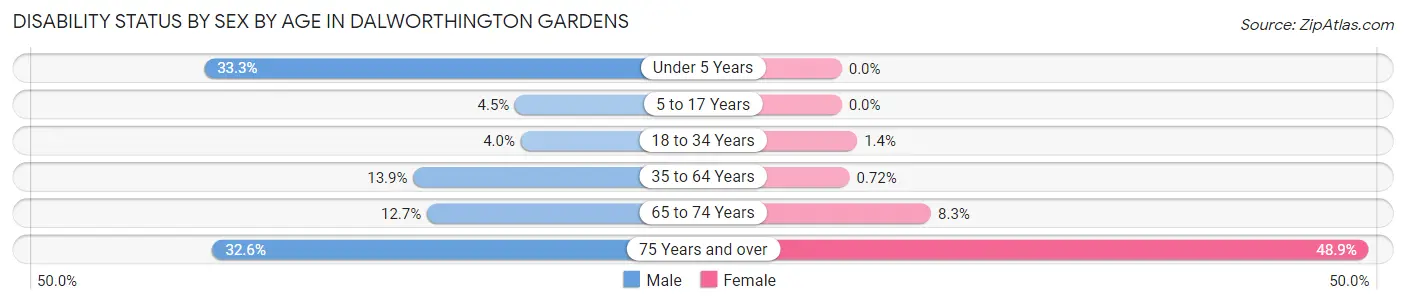
| Age Bracket | Male | Female |
| Under 5 Years | 32 (33.3%) | 0 (0.0%) |
| 5 to 17 Years | 8 (4.5%) | 0 (0.0%) |
| 18 to 34 Years | 7 (4.0%) | 4 (1.4%) |
| 35 to 64 Years | 67 (13.9%) | 3 (0.7%) |
| 65 to 74 Years | 21 (12.7%) | 16 (8.3%) |
| 75 Years and over | 42 (32.6%) | 66 (48.9%) |
Disability Class by Sex by Age in Dalworthington Gardens
Disability Class: Hearing Difficulty
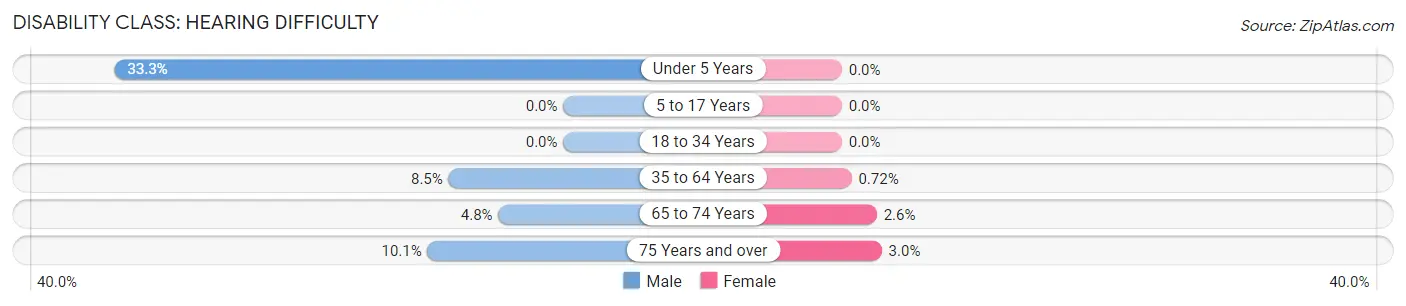
| Age Bracket | Male | Female |
| Under 5 Years | 32 (33.3%) | 0 (0.0%) |
| 5 to 17 Years | 0 (0.0%) | 0 (0.0%) |
| 18 to 34 Years | 0 (0.0%) | 0 (0.0%) |
| 35 to 64 Years | 41 (8.5%) | 3 (0.7%) |
| 65 to 74 Years | 8 (4.8%) | 5 (2.6%) |
| 75 Years and over | 13 (10.1%) | 4 (3.0%) |
Disability Class: Vision Difficulty
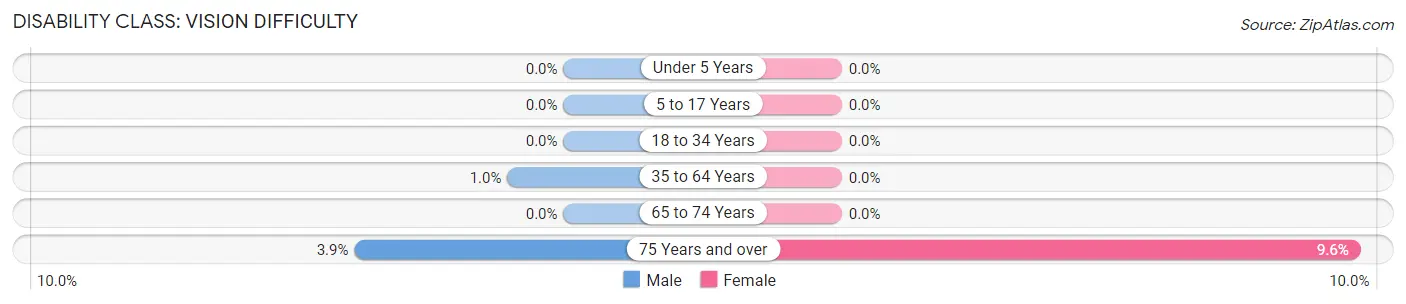
| Age Bracket | Male | Female |
| Under 5 Years | 0 (0.0%) | 0 (0.0%) |
| 5 to 17 Years | 0 (0.0%) | 0 (0.0%) |
| 18 to 34 Years | 0 (0.0%) | 0 (0.0%) |
| 35 to 64 Years | 5 (1.0%) | 0 (0.0%) |
| 65 to 74 Years | 0 (0.0%) | 0 (0.0%) |
| 75 Years and over | 5 (3.9%) | 13 (9.6%) |
Disability Class: Cognitive Difficulty
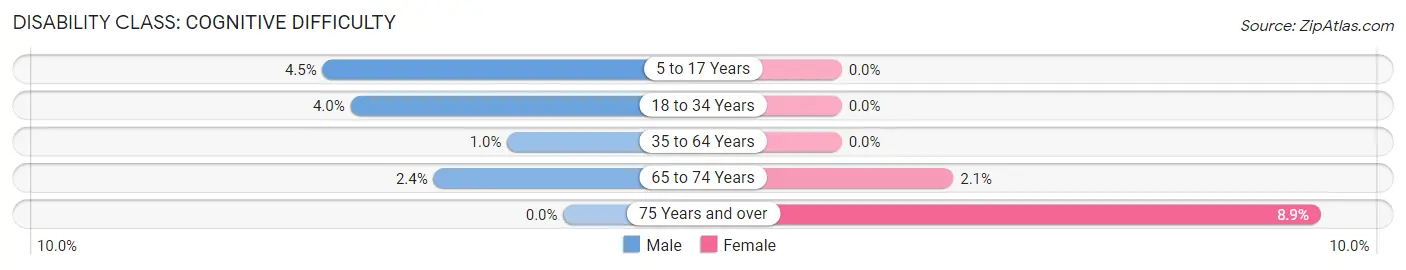
| Age Bracket | Male | Female |
| 5 to 17 Years | 8 (4.5%) | 0 (0.0%) |
| 18 to 34 Years | 7 (4.0%) | 0 (0.0%) |
| 35 to 64 Years | 5 (1.0%) | 0 (0.0%) |
| 65 to 74 Years | 4 (2.4%) | 4 (2.1%) |
| 75 Years and over | 0 (0.0%) | 12 (8.9%) |
Disability Class: Ambulatory Difficulty
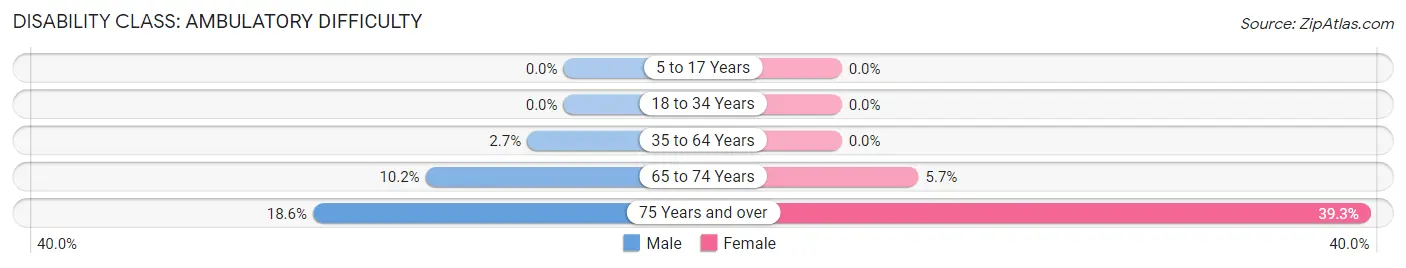
| Age Bracket | Male | Female |
| 5 to 17 Years | 0 (0.0%) | 0 (0.0%) |
| 18 to 34 Years | 0 (0.0%) | 0 (0.0%) |
| 35 to 64 Years | 13 (2.7%) | 0 (0.0%) |
| 65 to 74 Years | 17 (10.2%) | 11 (5.7%) |
| 75 Years and over | 24 (18.6%) | 53 (39.3%) |
Disability Class: Self-Care Difficulty
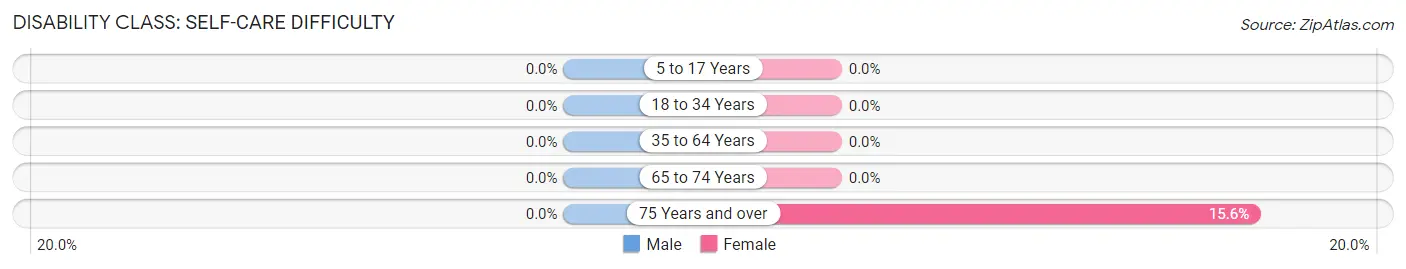
| Age Bracket | Male | Female |
| 5 to 17 Years | 0 (0.0%) | 0 (0.0%) |
| 18 to 34 Years | 0 (0.0%) | 0 (0.0%) |
| 35 to 64 Years | 0 (0.0%) | 0 (0.0%) |
| 65 to 74 Years | 0 (0.0%) | 0 (0.0%) |
| 75 Years and over | 0 (0.0%) | 21 (15.6%) |
Technology Access in Dalworthington Gardens
Computing Device Access in Dalworthington Gardens
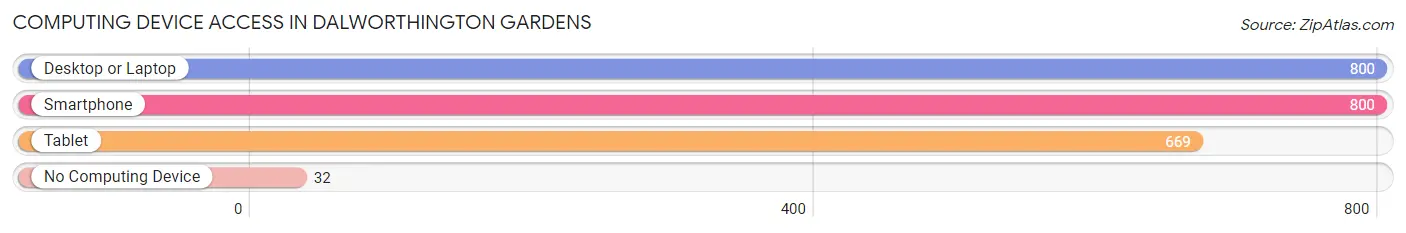
| Device Type | # Households | % Households |
| Desktop or Laptop | 800 | 92.2% |
| Smartphone | 800 | 92.2% |
| Tablet | 669 | 77.1% |
| No Computing Device | 32 | 3.7% |
| Total | 868 | 100.0% |
Internet Access in Dalworthington Gardens
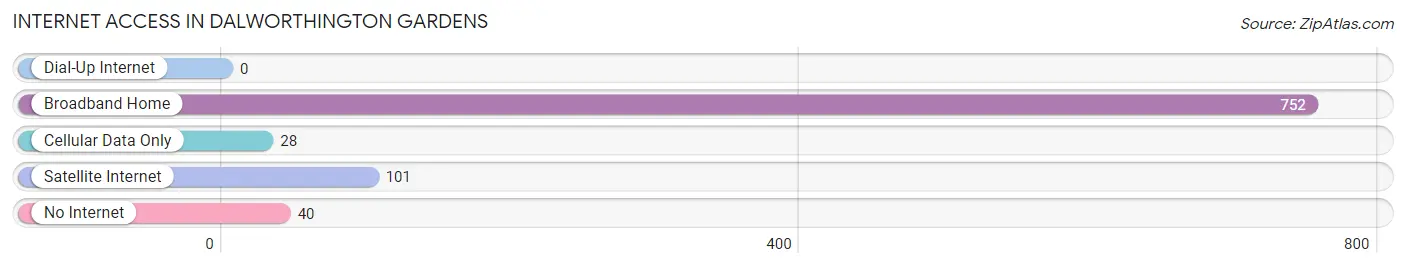
| Internet Type | # Households | % Households |
| Dial-Up Internet | 0 | 0.0% |
| Broadband Home | 752 | 86.6% |
| Cellular Data Only | 28 | 3.2% |
| Satellite Internet | 101 | 11.6% |
| No Internet | 40 | 4.6% |
| Total | 868 | 100.0% |
Dalworthington Gardens Summary
Dalworthington Gardens is a small city located in Tarrant County, Texas, United States. It is part of the Dallas-Fort Worth-Arlington metropolitan area. The city was incorporated in 1955 and has a population of 2,093 as of the 2010 census.
History
Dalworthington Gardens was founded in the early 1950s by oilman and real estate developer W.T. Waggoner. He purchased the land from the Dalworthington family, who had owned it since the late 1800s. Waggoner developed the area into a residential community and named it after the family.
The city was officially incorporated in 1955 and has remained a small, residential community ever since. The city has grown slowly over the years, with the population increasing from 1,845 in 2000 to 2,093 in 2010.
Geography
Dalworthington Gardens is located in Tarrant County, Texas, about 20 miles west of downtown Dallas. It is part of the Dallas-Fort Worth-Arlington metropolitan area. The city covers an area of 1.2 square miles and has a population density of 1,743 people per square mile.
The city is located in the Blackland Prairie region of Texas, which is characterized by flat terrain and fertile soil. The climate is humid subtropical, with hot summers and mild winters.
Economy
Dalworthington Gardens is primarily a residential community, with most of its residents employed in the nearby cities of Dallas and Fort Worth. The city does not have any major industries or employers.
The median household income in Dalworthington Gardens is $68,958, which is higher than the national average. The median home value is $220,000, which is also higher than the national average.
Demographics
As of the 2010 census, there were 2,093 people living in Dalworthington Gardens. The population is predominantly white (90.2%), with small percentages of African American (3.2%), Hispanic (3.2%), and Asian (2.2%) residents.
The median age in Dalworthington Gardens is 43.3, which is slightly higher than the national average. The city has a higher percentage of married couples (63.2%) than the national average (50.7%).
Conclusion
Dalworthington Gardens is a small city located in Tarrant County, Texas. It was founded in the 1950s by oilman and real estate developer W.T. Waggoner and has remained a residential community ever since. The city has a population of 2,093 and a median household income of $68,958. The population is predominantly white, with small percentages of African American, Hispanic, and Asian residents.
Common Questions
What is Per Capita Income in Dalworthington Gardens?
Per Capita income in Dalworthington Gardens is $69,899.
What is the Median Family Income in Dalworthington Gardens?
Median Family Income in Dalworthington Gardens is $145,333.
What is the Median Household income in Dalworthington Gardens?
Median Household Income in Dalworthington Gardens is $108,750.
What is Income or Wage Gap in Dalworthington Gardens?
Income or Wage Gap in Dalworthington Gardens is 61.8%.
Women in Dalworthington Gardens earn 38.2 cents for every dollar earned by a man.
What is Inequality or Gini Index in Dalworthington Gardens?
Inequality or Gini Index in Dalworthington Gardens is 0.51.
What is the Total Population of Dalworthington Gardens?
Total Population of Dalworthington Gardens is 2,437.
What is the Total Male Population of Dalworthington Gardens?
Total Male Population of Dalworthington Gardens is 1,237.
What is the Total Female Population of Dalworthington Gardens?
Total Female Population of Dalworthington Gardens is 1,200.
What is the Ratio of Males per 100 Females in Dalworthington Gardens?
There are 103.08 Males per 100 Females in Dalworthington Gardens.
What is the Ratio of Females per 100 Males in Dalworthington Gardens?
There are 97.01 Females per 100 Males in Dalworthington Gardens.
What is the Median Population Age in Dalworthington Gardens?
Median Population Age in Dalworthington Gardens is 52.2 Years.
What is the Average Family Size in Dalworthington Gardens
Average Family Size in Dalworthington Gardens is 3.2 People.
What is the Average Household Size in Dalworthington Gardens
Average Household Size in Dalworthington Gardens is 2.8 People.
How Large is the Labor Force in Dalworthington Gardens?
There are 1,206 People in the Labor Forcein in Dalworthington Gardens.
What is the Percentage of People in the Labor Force in Dalworthington Gardens?
58.8% of People are in the Labor Force in Dalworthington Gardens.
What is the Unemployment Rate in Dalworthington Gardens?
Unemployment Rate in Dalworthington Gardens is 4.3%.