St Charles, MN Map & Demographics
St Charles Map
St Charles Overview
$49,860
PER CAPITA INCOME
$106,897
AVG FAMILY INCOME
$91,326
AVG HOUSEHOLD INCOME
25.0%
WAGE / INCOME GAP [ % ]
75.0¢/ $1
WAGE / INCOME GAP [ $ ]
0.44
INEQUALITY / GINI INDEX
3,979
TOTAL POPULATION
2,073
MALE POPULATION
1,906
FEMALE POPULATION
108.76
MALES / 100 FEMALES
91.94
FEMALES / 100 MALES
39.9
MEDIAN AGE
3.0
AVG FAMILY SIZE
2.4
AVG HOUSEHOLD SIZE
2,319
LABOR FORCE [ PEOPLE ]
75.2%
PERCENT IN LABOR FORCE
2.5%
UNEMPLOYMENT RATE
Income in St Charles
Income Overview in St Charles
Per Capita Income in St Charles is $49,860, while median incomes of families and households are $106,897 and $91,326 respectively.
| Characteristic | Number | Measure |
| Per Capita Income | 3,979 | $49,860 |
| Median Family Income | 1,028 | $106,897 |
| Mean Family Income | 1,028 | $112,209 |
| Median Household Income | 1,637 | $91,326 |
| Mean Household Income | 1,637 | $119,322 |
| Income Deficit | 1,028 | $0 |
| Wage / Income Gap (%) | 3,979 | 25.01% |
| Wage / Income Gap ($) | 3,979 | 74.99¢ per $1 |
| Gini / Inequality Index | 3,979 | 0.44 |
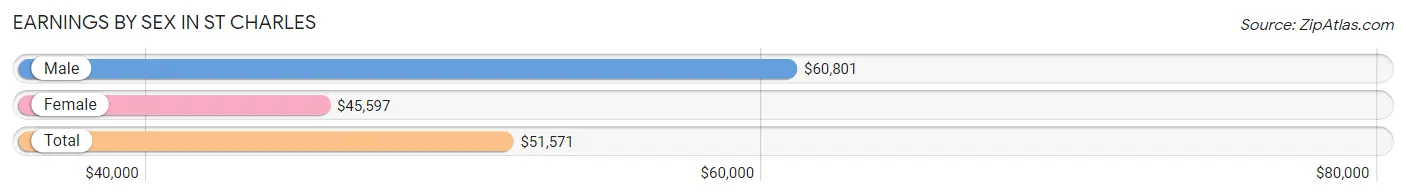
Earnings by Sex in St Charles
Average Earnings in St Charles are $51,571, $60,801 for men and $45,597 for women, a difference of 25.0%.
| Sex | Number | Average Earnings |
| Male | 1,261 (52.6%) | $60,801 |
| Female | 1,134 (47.3%) | $45,597 |
| Total | 2,395 (100.0%) | $51,571 |
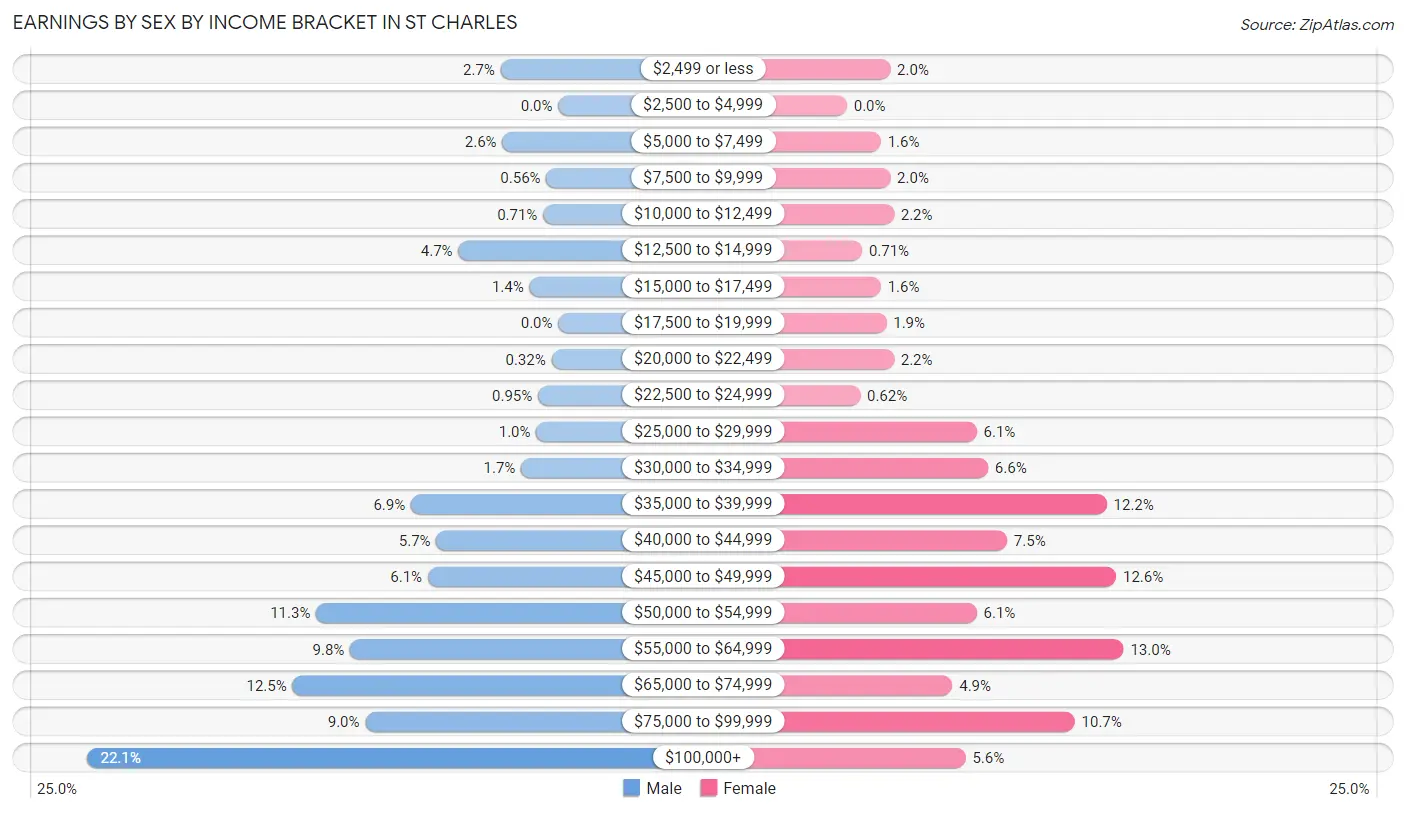
Earnings by Sex by Income Bracket in St Charles
The most common earnings brackets in St Charles are $100,000+ for men (278 | 22.1%) and $55,000 to $64,999 for women (147 | 13.0%).
| Income | Male | Female |
| $2,499 or less | 34 (2.7%) | 23 (2.0%) |
| $2,500 to $4,999 | 0 (0.0%) | 0 (0.0%) |
| $5,000 to $7,499 | 33 (2.6%) | 18 (1.6%) |
| $7,500 to $9,999 | 7 (0.6%) | 23 (2.0%) |
| $10,000 to $12,499 | 9 (0.7%) | 25 (2.2%) |
| $12,500 to $14,999 | 59 (4.7%) | 8 (0.7%) |
| $15,000 to $17,499 | 17 (1.3%) | 18 (1.6%) |
| $17,500 to $19,999 | 0 (0.0%) | 21 (1.8%) |
| $20,000 to $22,499 | 4 (0.3%) | 25 (2.2%) |
| $22,500 to $24,999 | 12 (0.9%) | 7 (0.6%) |
| $25,000 to $29,999 | 13 (1.0%) | 69 (6.1%) |
| $30,000 to $34,999 | 22 (1.7%) | 75 (6.6%) |
| $35,000 to $39,999 | 87 (6.9%) | 138 (12.2%) |
| $40,000 to $44,999 | 72 (5.7%) | 85 (7.5%) |
| $45,000 to $49,999 | 77 (6.1%) | 143 (12.6%) |
| $50,000 to $54,999 | 143 (11.3%) | 69 (6.1%) |
| $55,000 to $64,999 | 123 (9.8%) | 147 (13.0%) |
| $65,000 to $74,999 | 157 (12.4%) | 56 (4.9%) |
| $75,000 to $99,999 | 114 (9.0%) | 121 (10.7%) |
| $100,000+ | 278 (22.1%) | 63 (5.6%) |
| Total | 1,261 (100.0%) | 1,134 (100.0%) |
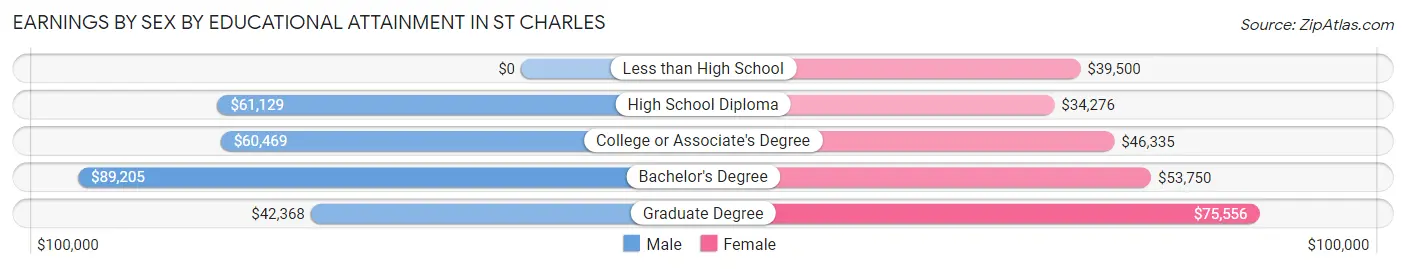
Earnings by Sex by Educational Attainment in St Charles
Average earnings in St Charles are $64,773 for men and $46,446 for women, a difference of 28.3%. Men with an educational attainment of bachelor's degree enjoy the highest average annual earnings of $89,205, while those with graduate degree education earn the least with $42,368. Women with an educational attainment of graduate degree earn the most with the average annual earnings of $75,556, while those with high school diploma education have the smallest earnings of $34,276.
| Educational Attainment | Male Income | Female Income |
| Less than High School | - | - |
| High School Diploma | $61,129 | $34,276 |
| College or Associate's Degree | $60,469 | $46,335 |
| Bachelor's Degree | $89,205 | $53,750 |
| Graduate Degree | $42,368 | $75,556 |
| Total | $64,773 | $46,446 |
Family Income in St Charles
Family Income Brackets in St Charles
According to the St Charles family income data, there are 390 families falling into the $100,000 to $149,999 income range, which is the most common income bracket and makes up 37.9% of all families.
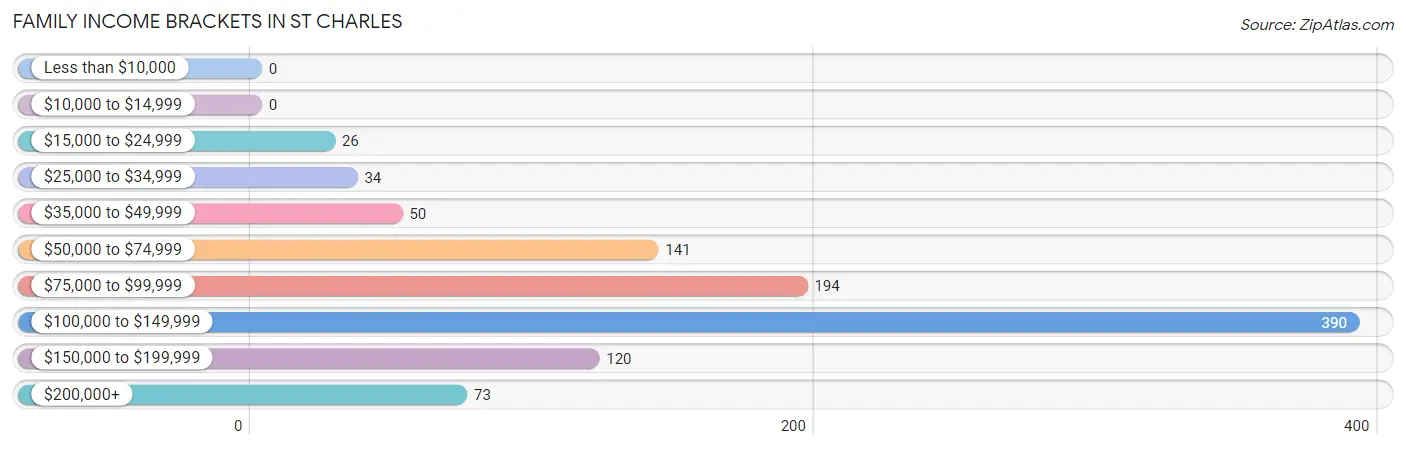
| Income Bracket | # Families | % Families |
| Less than $10,000 | 0 | 0.0% |
| $10,000 to $14,999 | 0 | 0.0% |
| $15,000 to $24,999 | 26 | 2.5% |
| $25,000 to $34,999 | 34 | 3.3% |
| $35,000 to $49,999 | 50 | 4.9% |
| $50,000 to $74,999 | 141 | 13.7% |
| $75,000 to $99,999 | 194 | 18.9% |
| $100,000 to $149,999 | 390 | 37.9% |
| $150,000 to $199,999 | 120 | 11.7% |
| $200,000+ | 73 | 7.1% |
Family Income by Famaliy Size in St Charles
5-person families (72 | 7.0%) account for the highest median family income in St Charles with $141,944 per family, while 2-person families (551 | 53.6%) have the highest median income of $43,867 per family member.
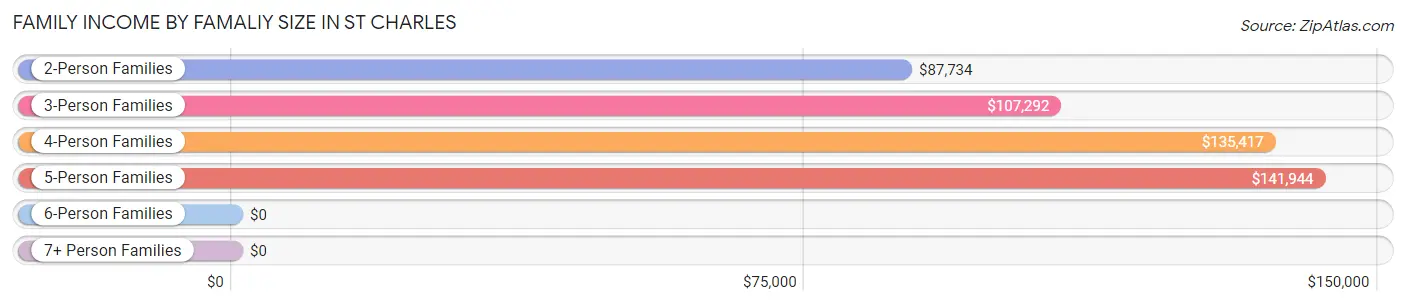
| Income Bracket | # Families | Median Income |
| 2-Person Families | 551 (53.6%) | $87,734 |
| 3-Person Families | 213 (20.7%) | $107,292 |
| 4-Person Families | 170 (16.5%) | $135,417 |
| 5-Person Families | 72 (7.0%) | $141,944 |
| 6-Person Families | 22 (2.1%) | $0 |
| 7+ Person Families | 0 (0.0%) | $0 |
| Total | 1,028 (100.0%) | $106,897 |
Family Income by Number of Earners in St Charles
The median family income in St Charles is $106,897, with families comprising 2 earners (612) having the highest median family income of $125,524, while families with no earners (121) have the lowest median family income of $53,854, accounting for 59.5% and 11.8% of families, respectively.
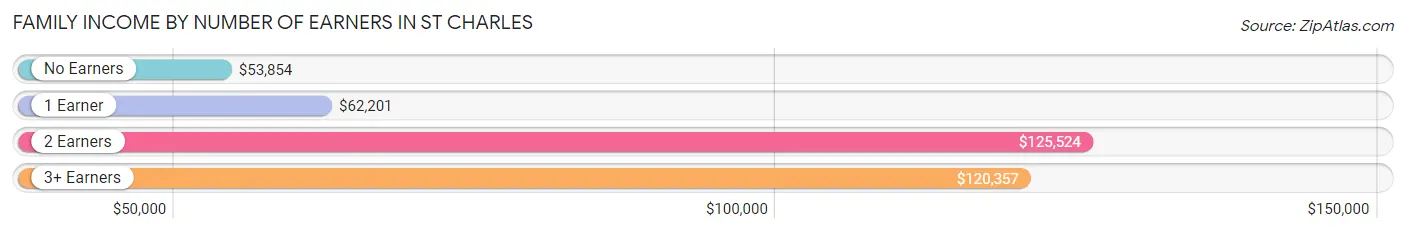
| Number of Earners | # Families | Median Income |
| No Earners | 121 (11.8%) | $53,854 |
| 1 Earner | 209 (20.3%) | $62,201 |
| 2 Earners | 612 (59.5%) | $125,524 |
| 3+ Earners | 86 (8.4%) | $120,357 |
| Total | 1,028 (100.0%) | $106,897 |
Household Income in St Charles
Household Income Brackets in St Charles
With 406 households falling in the category, the $100,000 to $149,999 income range is the most frequent in St Charles, accounting for 24.8% of all households. In contrast, only 25 households (1.5%) fall into the $15,000 to $24,999 income bracket, making it the least populous group.
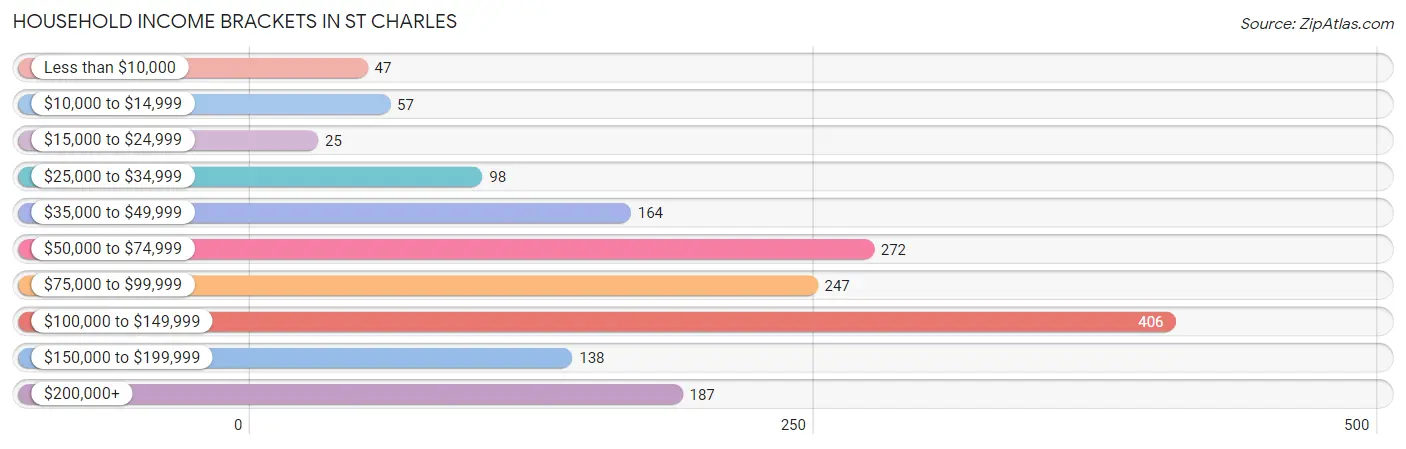
| Income Bracket | # Households | % Households |
| Less than $10,000 | 47 | 2.9% |
| $10,000 to $14,999 | 57 | 3.5% |
| $15,000 to $24,999 | 25 | 1.5% |
| $25,000 to $34,999 | 98 | 6.0% |
| $35,000 to $49,999 | 164 | 10.0% |
| $50,000 to $74,999 | 272 | 16.6% |
| $75,000 to $99,999 | 247 | 15.1% |
| $100,000 to $149,999 | 406 | 24.8% |
| $150,000 to $199,999 | 138 | 8.4% |
| $200,000+ | 187 | 11.4% |
Household Income by Householder Age in St Charles
The median household income in St Charles is $91,326, with the highest median household income of $110,139 found in the 25 to 44 years age bracket for the primary householder. A total of 575 households (35.1%) fall into this category. Meanwhile, the 65+ years age bracket for the primary householder has the lowest median household income of $49,236, with 351 households (21.4%) in this group.
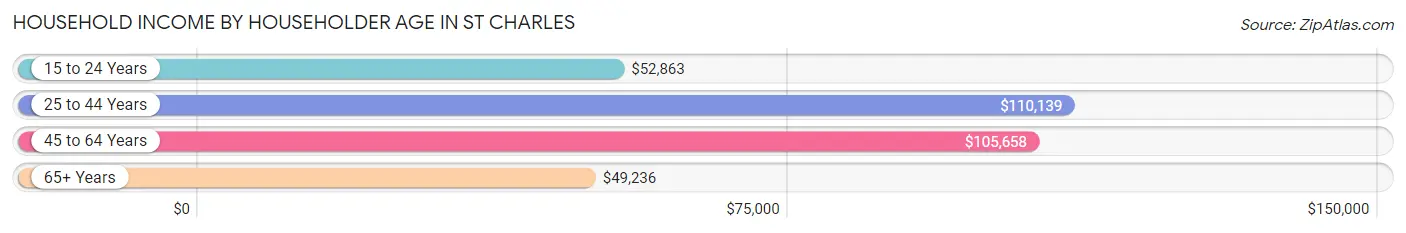
| Income Bracket | # Households | Median Income |
| 15 to 24 Years | 79 (4.8%) | $52,863 |
| 25 to 44 Years | 575 (35.1%) | $110,139 |
| 45 to 64 Years | 632 (38.6%) | $105,658 |
| 65+ Years | 351 (21.4%) | $49,236 |
| Total | 1,637 (100.0%) | $91,326 |
Poverty in St Charles
Income Below Poverty by Sex and Age in St Charles
With 3.6% poverty level for males and 4.6% for females among the residents of St Charles, 55 to 64 year old males and 18 to 24 year old females are the most vulnerable to poverty, with 43 males (11.6%) and 17 females (25.0%) in their respective age groups living below the poverty level.
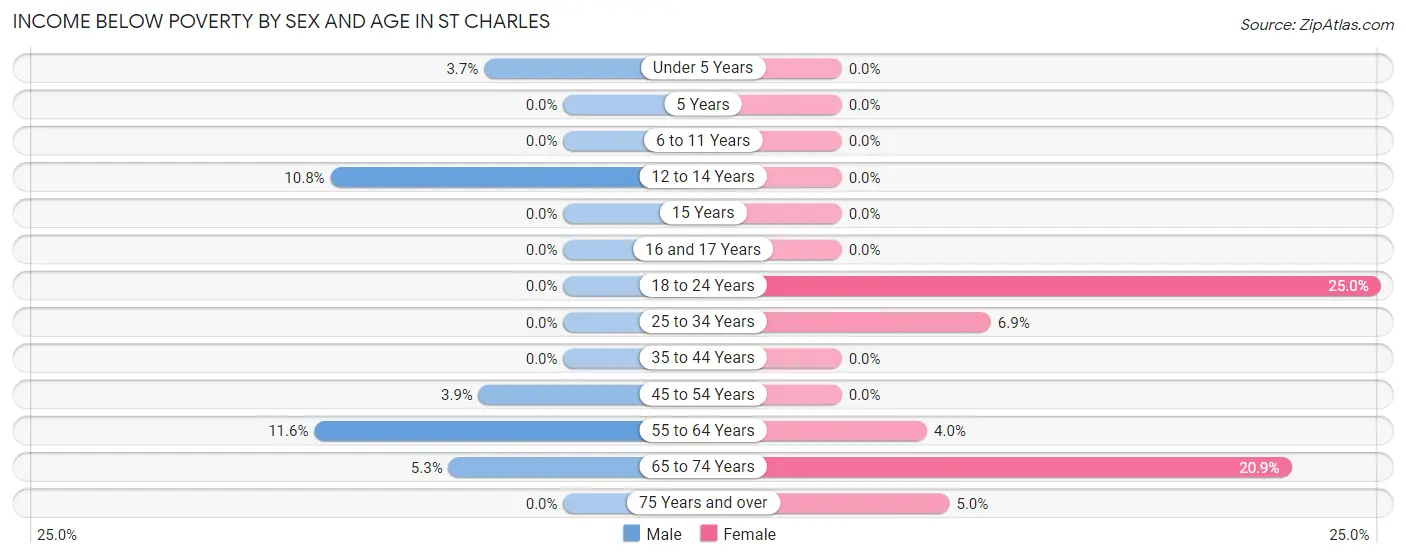
| Age Bracket | Male | Female |
| Under 5 Years | 6 (3.7%) | 0 (0.0%) |
| 5 Years | 0 (0.0%) | 0 (0.0%) |
| 6 to 11 Years | 0 (0.0%) | 0 (0.0%) |
| 12 to 14 Years | 8 (10.8%) | 0 (0.0%) |
| 15 Years | 0 (0.0%) | 0 (0.0%) |
| 16 and 17 Years | 0 (0.0%) | 0 (0.0%) |
| 18 to 24 Years | 0 (0.0%) | 17 (25.0%) |
| 25 to 34 Years | 0 (0.0%) | 18 (6.9%) |
| 35 to 44 Years | 0 (0.0%) | 0 (0.0%) |
| 45 to 54 Years | 9 (3.9%) | 0 (0.0%) |
| 55 to 64 Years | 43 (11.6%) | 8 (4.0%) |
| 65 to 74 Years | 8 (5.3%) | 39 (20.9%) |
| 75 Years and over | 0 (0.0%) | 4 (5.0%) |
| Total | 74 (3.6%) | 86 (4.6%) |
Income Above Poverty by Sex and Age in St Charles
According to the poverty statistics in St Charles, males aged 5 years and females aged under 5 years are the age groups that are most secure financially, with 100.0% of males and 100.0% of females in these age groups living above the poverty line.
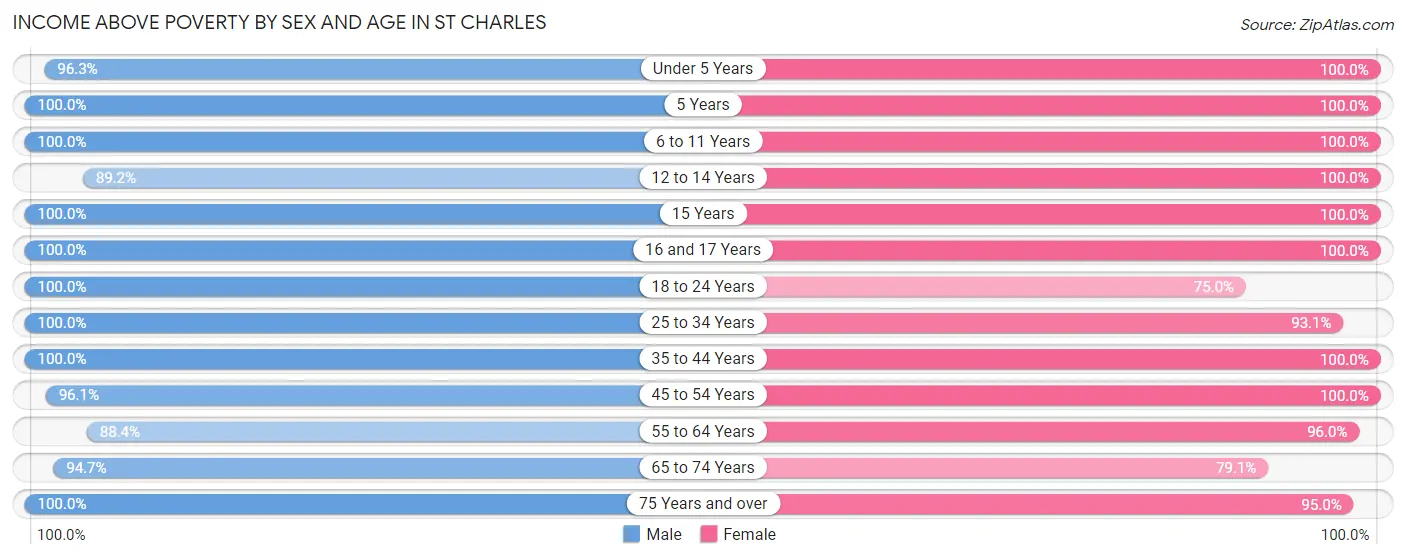
| Age Bracket | Male | Female |
| Under 5 Years | 157 (96.3%) | 102 (100.0%) |
| 5 Years | 10 (100.0%) | 11 (100.0%) |
| 6 to 11 Years | 154 (100.0%) | 179 (100.0%) |
| 12 to 14 Years | 66 (89.2%) | 90 (100.0%) |
| 15 Years | 24 (100.0%) | 52 (100.0%) |
| 16 and 17 Years | 4 (100.0%) | 36 (100.0%) |
| 18 to 24 Years | 212 (100.0%) | 51 (75.0%) |
| 25 to 34 Years | 261 (100.0%) | 242 (93.1%) |
| 35 to 44 Years | 267 (100.0%) | 430 (100.0%) |
| 45 to 54 Years | 220 (96.1%) | 176 (100.0%) |
| 55 to 64 Years | 329 (88.4%) | 194 (96.0%) |
| 65 to 74 Years | 142 (94.7%) | 148 (79.1%) |
| 75 Years and over | 110 (100.0%) | 76 (95.0%) |
| Total | 1,956 (96.4%) | 1,787 (95.4%) |
Income Below Poverty Among Married-Couple Families in St Charles
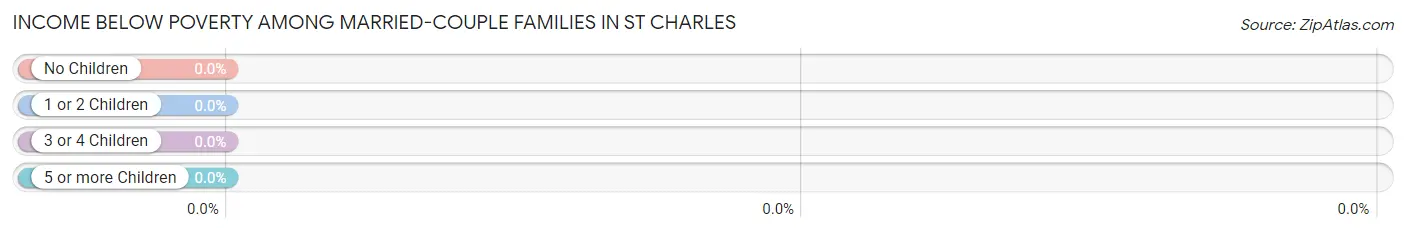
| Children | Above Poverty | Below Poverty |
| No Children | 493 (100.0%) | 0 (0.0%) |
| 1 or 2 Children | 272 (100.0%) | 0 (0.0%) |
| 3 or 4 Children | 94 (100.0%) | 0 (0.0%) |
| 5 or more Children | 0 (0.0%) | 0 (0.0%) |
| Total | 859 (100.0%) | 0 (0.0%) |
Income Below Poverty Among Single-Parent Households in St Charles
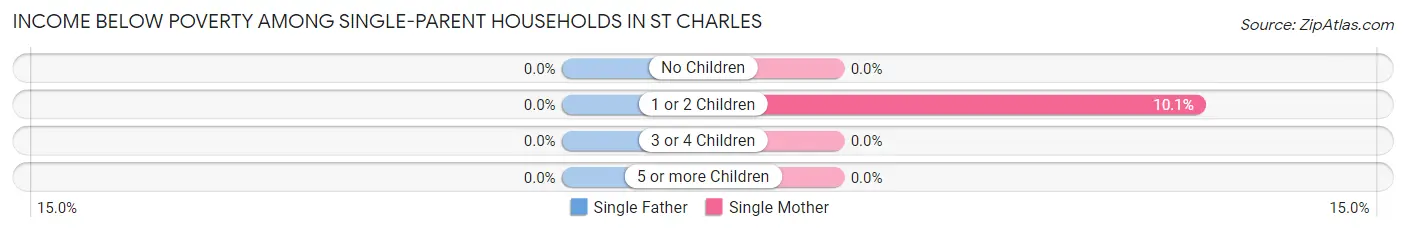
| Children | Single Father | Single Mother |
| No Children | 0 (0.0%) | 0 (0.0%) |
| 1 or 2 Children | 0 (0.0%) | 9 (10.1%) |
| 3 or 4 Children | 0 (0.0%) | 0 (0.0%) |
| 5 or more Children | 0 (0.0%) | 0 (0.0%) |
| Total | 0 (0.0%) | 9 (7.6%) |
Income Below Poverty Among Married-Couple vs Single-Parent Households in St Charles
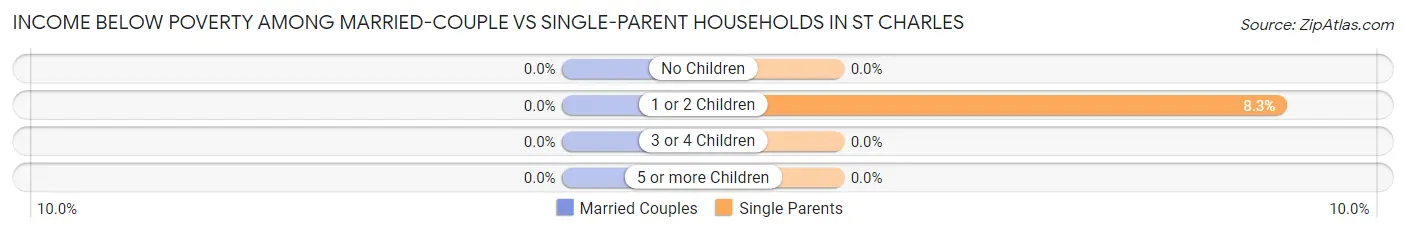
| Children | Married-Couple Families | Single-Parent Households |
| No Children | 0 (0.0%) | 0 (0.0%) |
| 1 or 2 Children | 0 (0.0%) | 9 (8.3%) |
| 3 or 4 Children | 0 (0.0%) | 0 (0.0%) |
| 5 or more Children | 0 (0.0%) | 0 (0.0%) |
| Total | 0 (0.0%) | 9 (5.3%) |
Race in St Charles
The most populous races in St Charles are White / Caucasian (3,598 | 90.4%), Asian (250 | 6.3%), and Some other Race (114 | 2.9%).
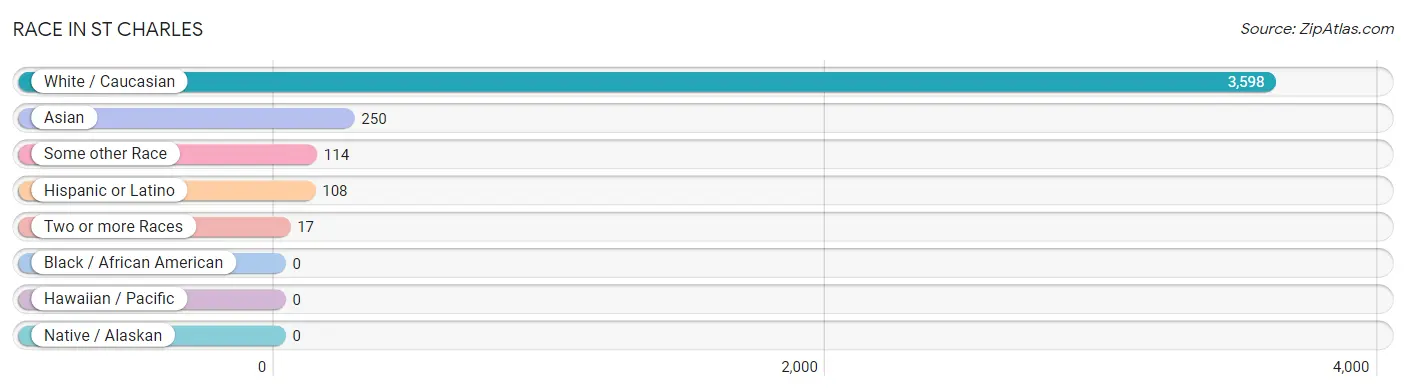
| Race | # Population | % Population |
| Asian | 250 | 6.3% |
| Black / African American | 0 | 0.0% |
| Hawaiian / Pacific | 0 | 0.0% |
| Hispanic or Latino | 108 | 2.7% |
| Native / Alaskan | 0 | 0.0% |
| White / Caucasian | 3,598 | 90.4% |
| Two or more Races | 17 | 0.4% |
| Some other Race | 114 | 2.9% |
| Total | 3,979 | 100.0% |
Ancestry in St Charles
The most populous ancestries reported in St Charles are German (1,743 | 43.8%), Irish (709 | 17.8%), Norwegian (505 | 12.7%), American (387 | 9.7%), and Malaysian (200 | 5.0%), together accounting for 89.1% of all St Charles residents.
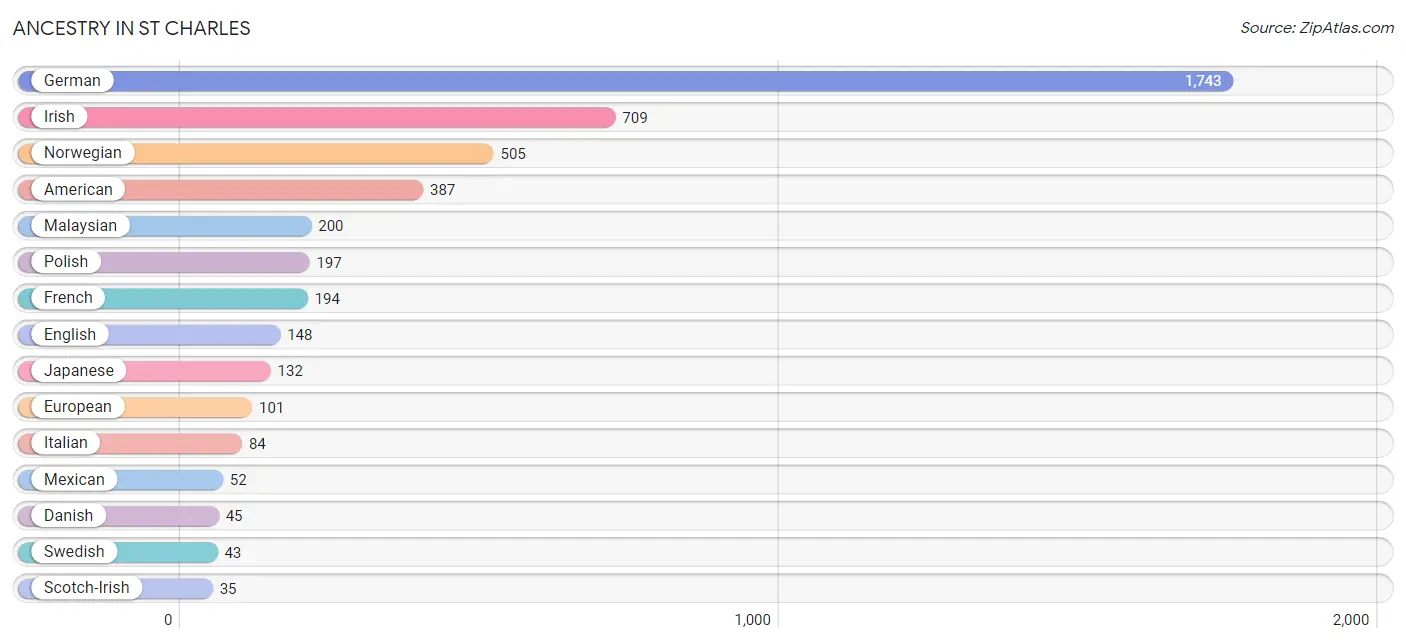
| Ancestry | # Population | % Population |
| American | 387 | 9.7% |
| Bhutanese | 4 | 0.1% |
| British | 9 | 0.2% |
| Burmese | 5 | 0.1% |
| Canadian | 8 | 0.2% |
| Central American | 32 | 0.8% |
| Czech | 31 | 0.8% |
| Danish | 45 | 1.1% |
| Dutch | 10 | 0.3% |
| Eastern European | 11 | 0.3% |
| English | 148 | 3.7% |
| European | 101 | 2.5% |
| Finnish | 10 | 0.3% |
| French | 194 | 4.9% |
| French Canadian | 31 | 0.8% |
| German | 1,743 | 43.8% |
| Guatemalan | 32 | 0.8% |
| Irish | 709 | 17.8% |
| Italian | 84 | 2.1% |
| Japanese | 132 | 3.3% |
| Luxembourger | 24 | 0.6% |
| Malaysian | 200 | 5.0% |
| Mexican | 52 | 1.3% |
| Norwegian | 505 | 12.7% |
| Polish | 197 | 5.0% |
| Portuguese | 15 | 0.4% |
| Puerto Rican | 24 | 0.6% |
| Scandinavian | 10 | 0.3% |
| Scotch-Irish | 35 | 0.9% |
| Scottish | 26 | 0.6% |
| Sioux | 1 | 0.0% |
| Slovak | 10 | 0.3% |
| Swedish | 43 | 1.1% |
| Swiss | 14 | 0.4% |
| Welsh | 7 | 0.2% | View All 35 Rows |
Immigrants in St Charles
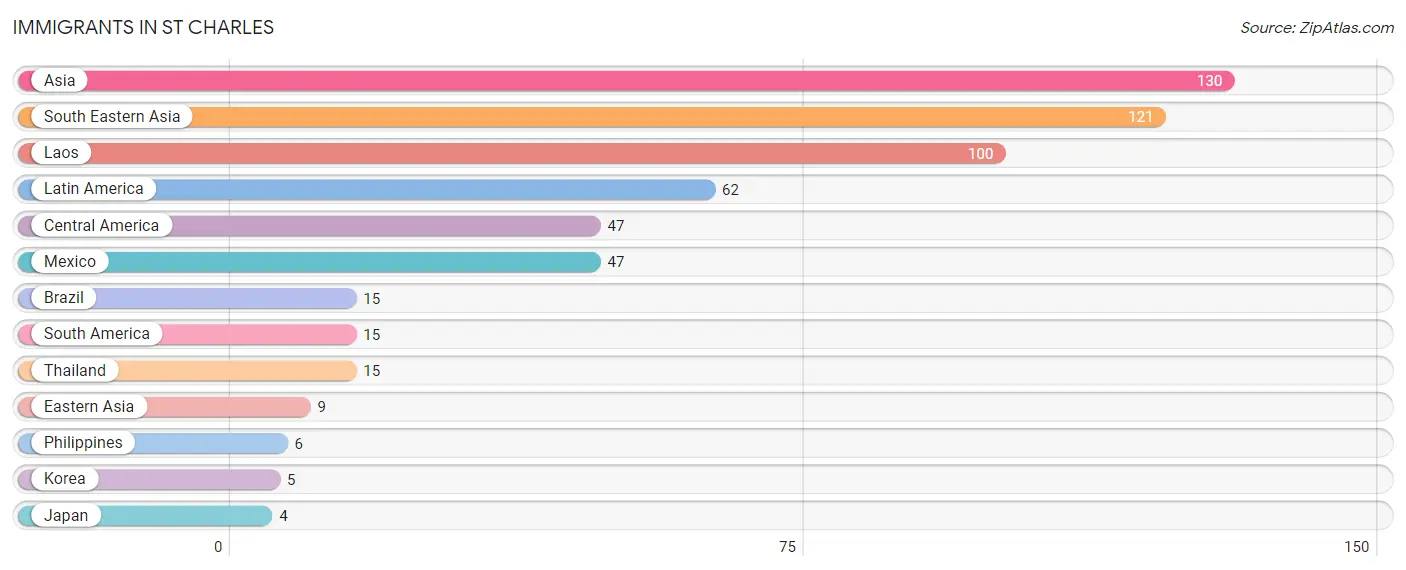
The most numerous immigrant groups reported in St Charles came from Asia (130 | 3.3%), South Eastern Asia (121 | 3.0%), Laos (100 | 2.5%), Latin America (62 | 1.6%), and Central America (47 | 1.2%), together accounting for 11.6% of all St Charles residents.
| Immigration Origin | # Population | % Population |
| Asia | 130 | 3.3% |
| Brazil | 15 | 0.4% |
| Central America | 47 | 1.2% |
| Eastern Asia | 9 | 0.2% |
| Japan | 4 | 0.1% |
| Korea | 5 | 0.1% |
| Laos | 100 | 2.5% |
| Latin America | 62 | 1.6% |
| Mexico | 47 | 1.2% |
| Philippines | 6 | 0.2% |
| South America | 15 | 0.4% |
| South Eastern Asia | 121 | 3.0% |
| Thailand | 15 | 0.4% | View All 13 Rows |
Sex and Age in St Charles
Sex and Age in St Charles
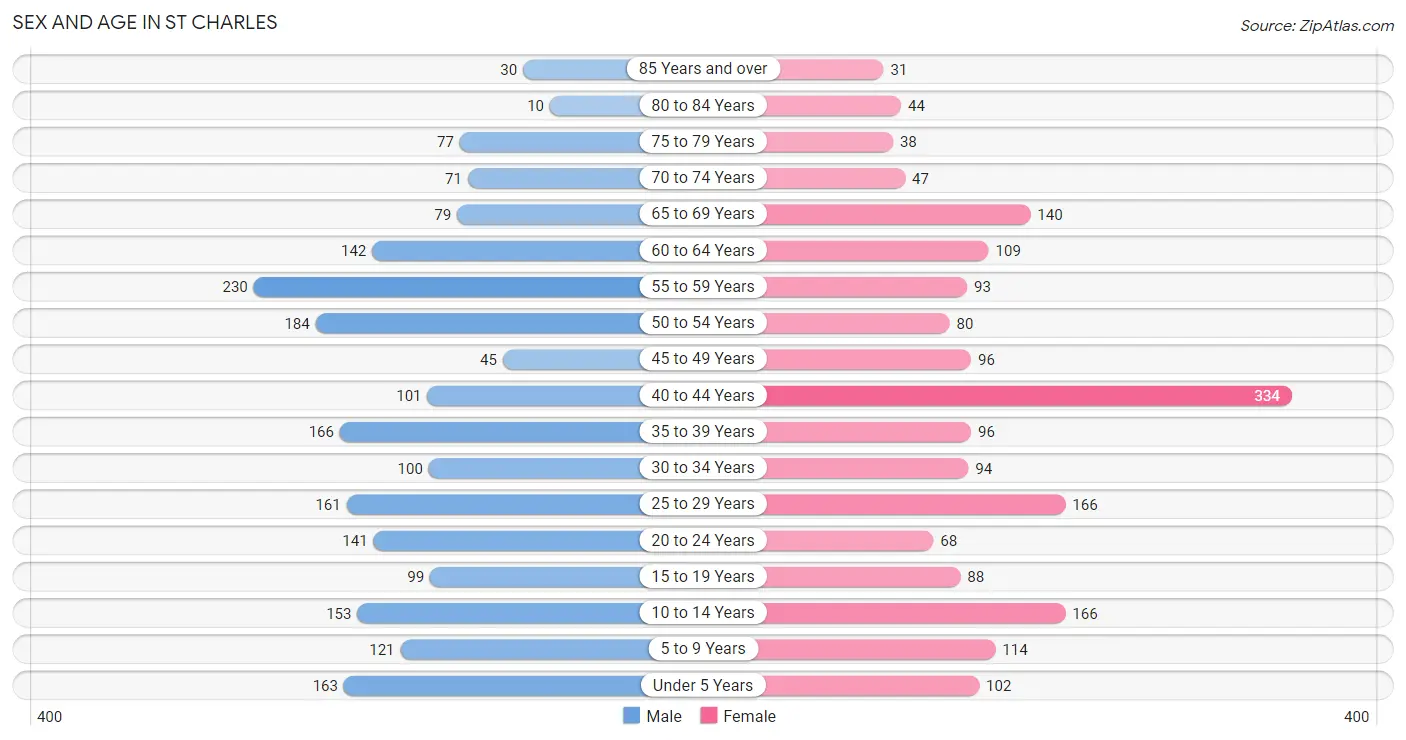
The most populous age groups in St Charles are 55 to 59 Years (230 | 11.1%) for men and 40 to 44 Years (334 | 17.5%) for women.
| Age Bracket | Male | Female |
| Under 5 Years | 163 (7.9%) | 102 (5.3%) |
| 5 to 9 Years | 121 (5.8%) | 114 (6.0%) |
| 10 to 14 Years | 153 (7.4%) | 166 (8.7%) |
| 15 to 19 Years | 99 (4.8%) | 88 (4.6%) |
| 20 to 24 Years | 141 (6.8%) | 68 (3.6%) |
| 25 to 29 Years | 161 (7.8%) | 166 (8.7%) |
| 30 to 34 Years | 100 (4.8%) | 94 (4.9%) |
| 35 to 39 Years | 166 (8.0%) | 96 (5.0%) |
| 40 to 44 Years | 101 (4.9%) | 334 (17.5%) |
| 45 to 49 Years | 45 (2.2%) | 96 (5.0%) |
| 50 to 54 Years | 184 (8.9%) | 80 (4.2%) |
| 55 to 59 Years | 230 (11.1%) | 93 (4.9%) |
| 60 to 64 Years | 142 (6.9%) | 109 (5.7%) |
| 65 to 69 Years | 79 (3.8%) | 140 (7.3%) |
| 70 to 74 Years | 71 (3.4%) | 47 (2.5%) |
| 75 to 79 Years | 77 (3.7%) | 38 (2.0%) |
| 80 to 84 Years | 10 (0.5%) | 44 (2.3%) |
| 85 Years and over | 30 (1.5%) | 31 (1.6%) |
| Total | 2,073 (100.0%) | 1,906 (100.0%) |
Families and Households in St Charles
Median Family Size in St Charles
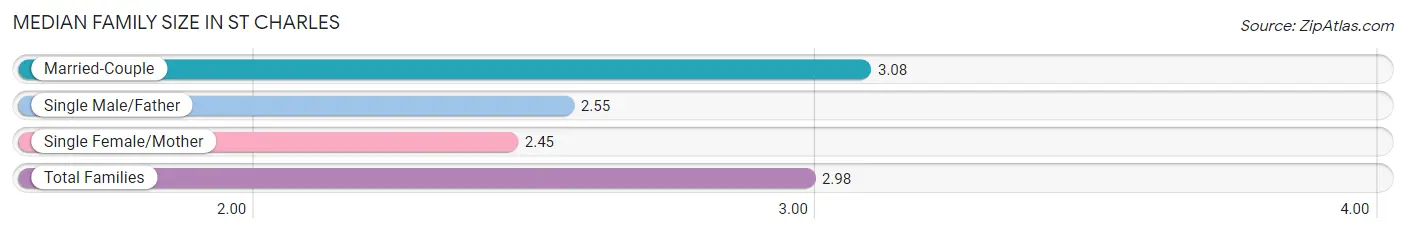
The median family size in St Charles is 2.98 persons per family, with married-couple families (859 | 83.6%) accounting for the largest median family size of 3.08 persons per family. On the other hand, single female/mother families (118 | 11.5%) represent the smallest median family size with 2.45 persons per family.
| Family Type | # Families | Family Size |
| Married-Couple | 859 (83.6%) | 3.08 |
| Single Male/Father | 51 (5.0%) | 2.55 |
| Single Female/Mother | 118 (11.5%) | 2.45 |
| Total Families | 1,028 (100.0%) | 2.98 |
Median Household Size in St Charles
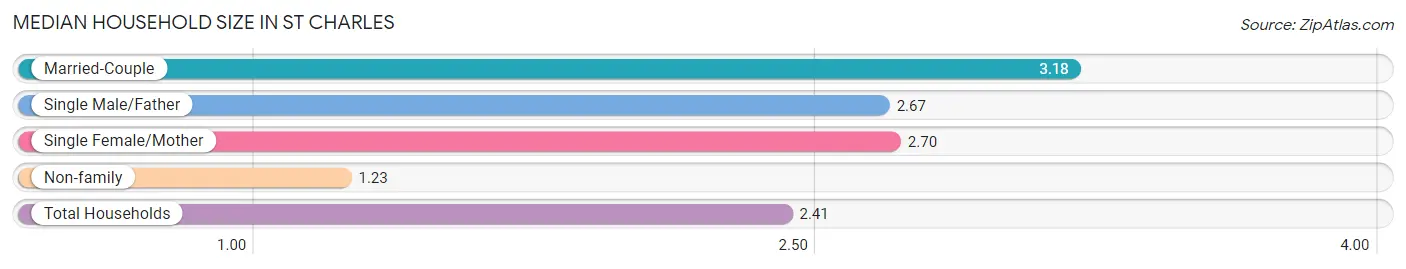
The median household size in St Charles is 2.41 persons per household, with married-couple households (859 | 52.5%) accounting for the largest median household size of 3.18 persons per household. non-family households (609 | 37.2%) represent the smallest median household size with 1.23 persons per household.
| Household Type | # Households | Household Size |
| Married-Couple | 859 (52.5%) | 3.18 |
| Single Male/Father | 51 (3.1%) | 2.67 |
| Single Female/Mother | 118 (7.2%) | 2.70 |
| Non-family | 609 (37.2%) | 1.23 |
| Total Households | 1,637 (100.0%) | 2.41 |
Household Size by Marriage Status in St Charles
Out of a total of 1,637 households in St Charles, 1,028 (62.8%) are family households, while 609 (37.2%) are nonfamily households. The most numerous type of family households are 2-person households, comprising 537, and the most common type of nonfamily households are 1-person households, comprising 451.
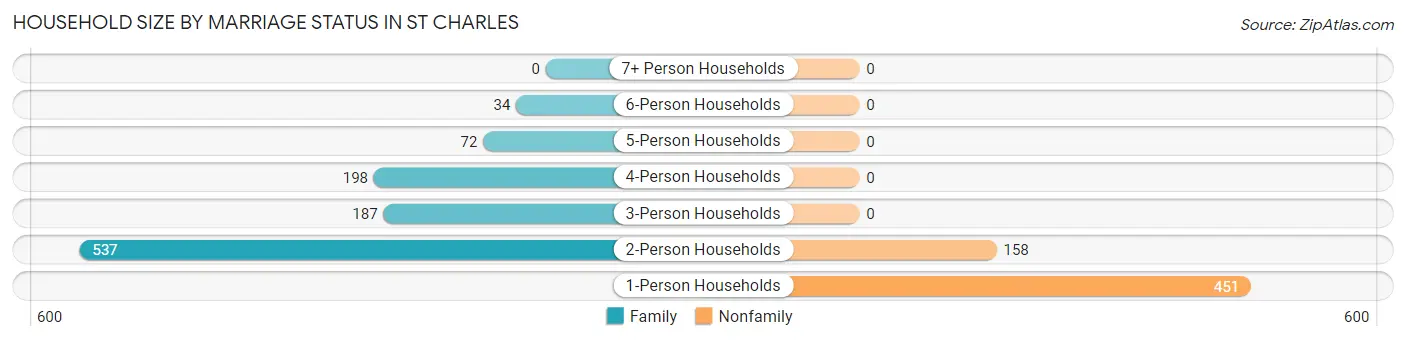
| Household Size | Family Households | Nonfamily Households |
| 1-Person Households | - | 451 (27.6%) |
| 2-Person Households | 537 (32.8%) | 158 (9.7%) |
| 3-Person Households | 187 (11.4%) | 0 (0.0%) |
| 4-Person Households | 198 (12.1%) | 0 (0.0%) |
| 5-Person Households | 72 (4.4%) | 0 (0.0%) |
| 6-Person Households | 34 (2.1%) | 0 (0.0%) |
| 7+ Person Households | 0 (0.0%) | 0 (0.0%) |
| Total | 1,028 (62.8%) | 609 (37.2%) |
Female Fertility in St Charles
Fertility by Age in St Charles
Average fertility rate in St Charles is 33.0 births per 1,000 women. Women in the age bracket of 20 to 34 years have the highest fertility rate with 67.0 births per 1,000 women. Women in the age bracket of 20 to 34 years acount for 71.0% of all women with births.
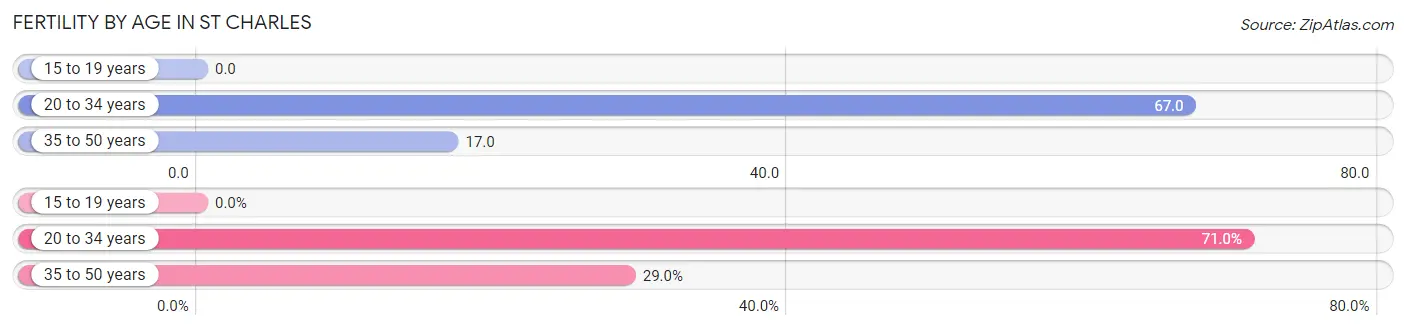
| Age Bracket | Women with Births | Births / 1,000 Women |
| 15 to 19 years | 0 (0.0%) | 0.0 |
| 20 to 34 years | 22 (71.0%) | 67.0 |
| 35 to 50 years | 9 (29.0%) | 17.0 |
| Total | 31 (100.0%) | 33.0 |
Fertility by Age by Marriage Status in St Charles
80.6% of women with births (31) in St Charles are married. The highest percentage of unmarried women with births falls into 20 to 34 years age bracket with 27.3% of them unmarried at the time of birth, while the lowest percentage of unmarried women with births belong to 35 to 50 years age bracket with 0.0% of them unmarried.
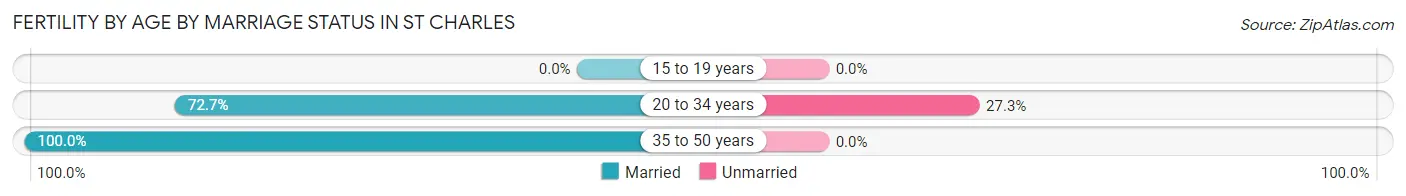
| Age Bracket | Married | Unmarried |
| 15 to 19 years | 0 (0.0%) | 0 (0.0%) |
| 20 to 34 years | 16 (72.7%) | 6 (27.3%) |
| 35 to 50 years | 9 (100.0%) | 0 (0.0%) |
| Total | 25 (80.6%) | 6 (19.4%) |
Fertility by Education in St Charles
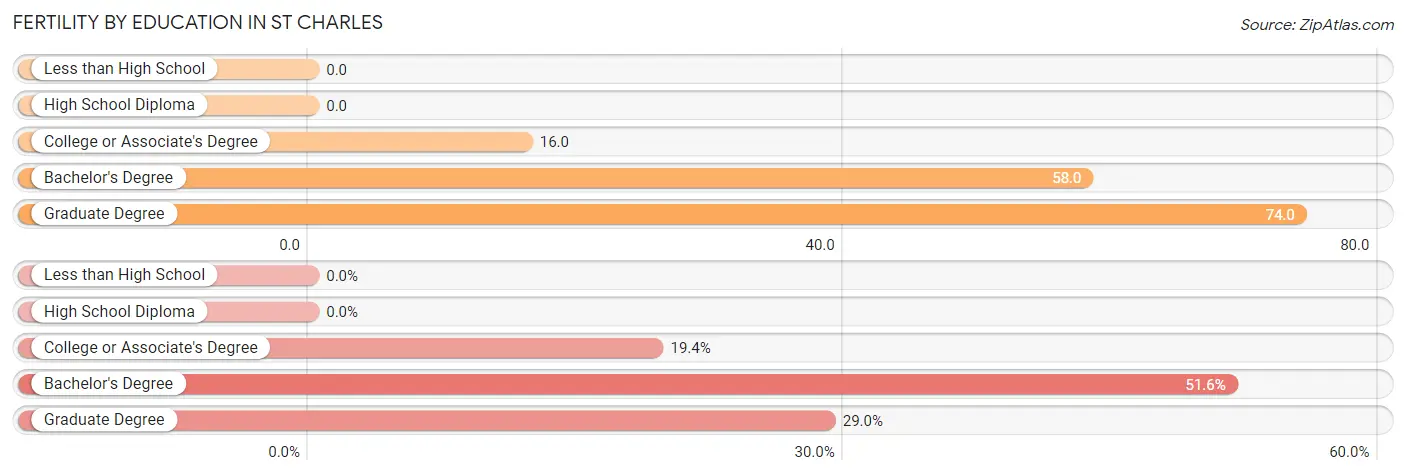
| Educational Attainment | Women with Births | Births / 1,000 Women |
| Less than High School | 0 (0.0%) | 0.0 |
| High School Diploma | 0 (0.0%) | 0.0 |
| College or Associate's Degree | 6 (19.4%) | 16.0 |
| Bachelor's Degree | 16 (51.6%) | 58.0 |
| Graduate Degree | 9 (29.0%) | 74.0 |
| Total | 31 (100.0%) | 33.0 |
Fertility by Education by Marriage Status in St Charles
19.4% of women with births in St Charles are unmarried. Women with the educational attainment of bachelor's degree are most likely to be married with 100.0% of them married at childbirth, while women with the educational attainment of college or associate's degree are least likely to be married with 100.0% of them unmarried at childbirth.
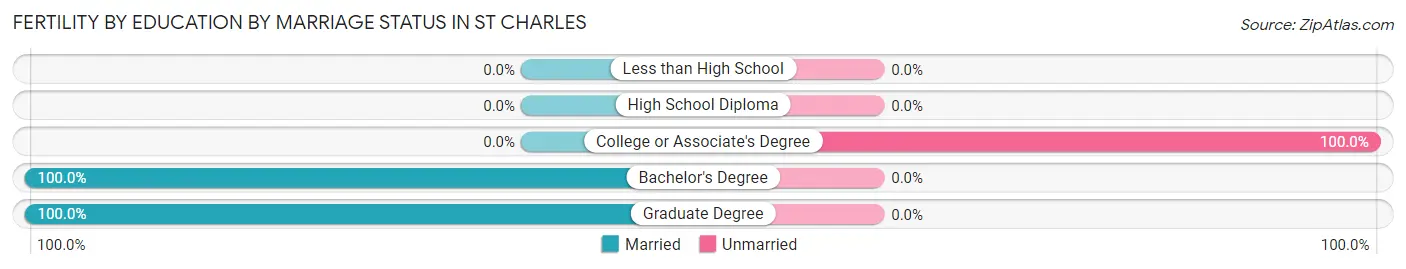
| Educational Attainment | Married | Unmarried |
| Less than High School | 0 (0.0%) | 0 (0.0%) |
| High School Diploma | 0 (0.0%) | 0 (0.0%) |
| College or Associate's Degree | 0 (0.0%) | 6 (100.0%) |
| Bachelor's Degree | 16 (100.0%) | 0 (0.0%) |
| Graduate Degree | 9 (100.0%) | 0 (0.0%) |
| Total | 25 (80.6%) | 6 (19.4%) |
Employment Characteristics in St Charles
Employment by Class of Employer in St Charles
Among the 2,189 employed individuals in St Charles, private company employees (1,344 | 61.4%), not-for-profit organizations (524 | 23.9%), and local government employees (135 | 6.2%) make up the most common classes of employment.
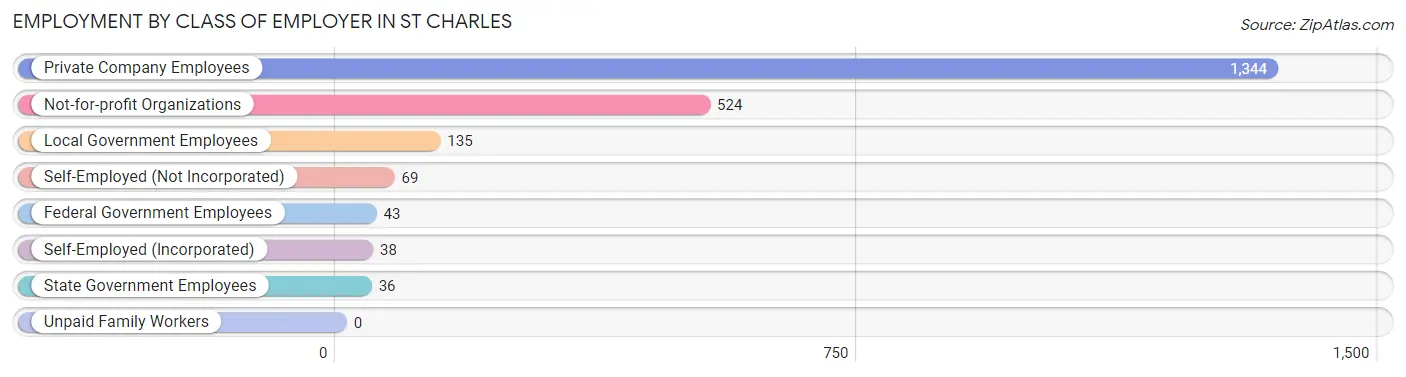
| Employer Class | # Employees | % Employees |
| Private Company Employees | 1,344 | 61.4% |
| Self-Employed (Incorporated) | 38 | 1.7% |
| Self-Employed (Not Incorporated) | 69 | 3.2% |
| Not-for-profit Organizations | 524 | 23.9% |
| Local Government Employees | 135 | 6.2% |
| State Government Employees | 36 | 1.6% |
| Federal Government Employees | 43 | 2.0% |
| Unpaid Family Workers | 0 | 0.0% |
| Total | 2,189 | 100.0% |
Employment Status by Age in St Charles
According to the labor force statistics for St Charles, out of the total population over 16 years of age (3,084), 75.2% or 2,319 individuals are in the labor force, with 2.5% or 58 of them unemployed. The age group with the highest labor force participation rate is 30 to 34 years, with 100.0% or 194 individuals in the labor force. Within the labor force, the 16 to 19 years age range has the highest percentage of unemployed individuals, with 72.0% or 59 of them being unemployed.
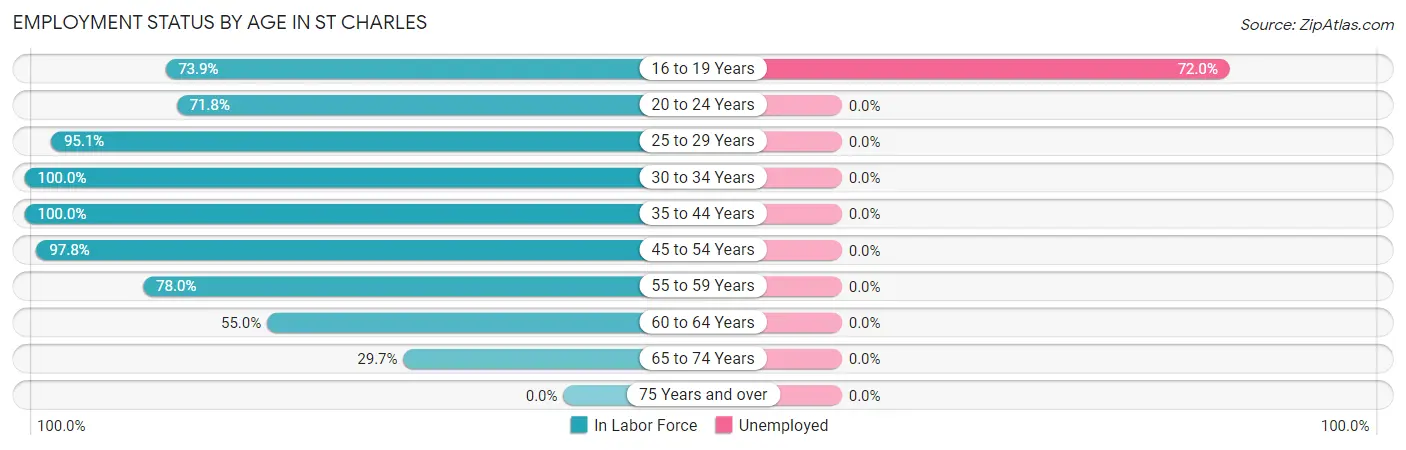
| Age Bracket | In Labor Force | Unemployed |
| 16 to 19 Years | 82 (73.9%) | 59 (72.0%) |
| 20 to 24 Years | 150 (71.8%) | 0 (0.0%) |
| 25 to 29 Years | 311 (95.1%) | 0 (0.0%) |
| 30 to 34 Years | 194 (100.0%) | 0 (0.0%) |
| 35 to 44 Years | 697 (100.0%) | 0 (0.0%) |
| 45 to 54 Years | 396 (97.8%) | 0 (0.0%) |
| 55 to 59 Years | 252 (78.0%) | 0 (0.0%) |
| 60 to 64 Years | 138 (55.0%) | 0 (0.0%) |
| 65 to 74 Years | 100 (29.7%) | 0 (0.0%) |
| 75 Years and over | 0 (0.0%) | 0 (0.0%) |
| Total | 2,319 (75.2%) | 58 (2.5%) |
Employment Status by Educational Attainment in St Charles
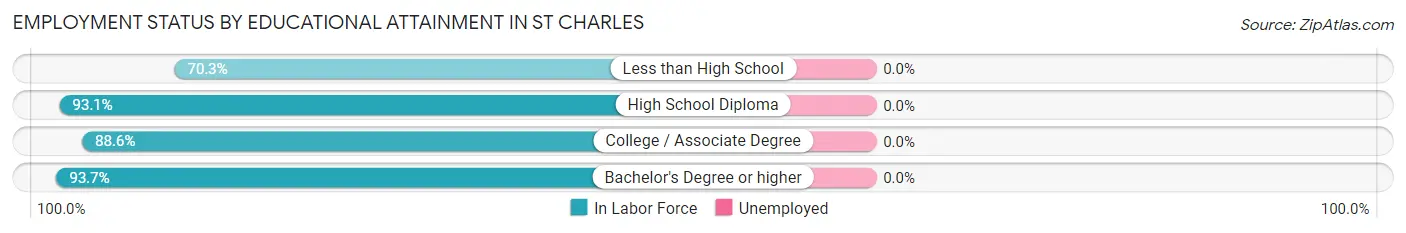
| Educational Attainment | In Labor Force | Unemployed |
| Less than High School | 78 (70.3%) | 0 (0.0%) |
| High School Diploma | 324 (93.1%) | 0 (0.0%) |
| College / Associate Degree | 739 (88.6%) | 0 (0.0%) |
| Bachelor's Degree or higher | 847 (93.7%) | 0 (0.0%) |
| Total | 1,988 (90.5%) | 0 (0.0%) |
Employment Occupations by Sex in St Charles
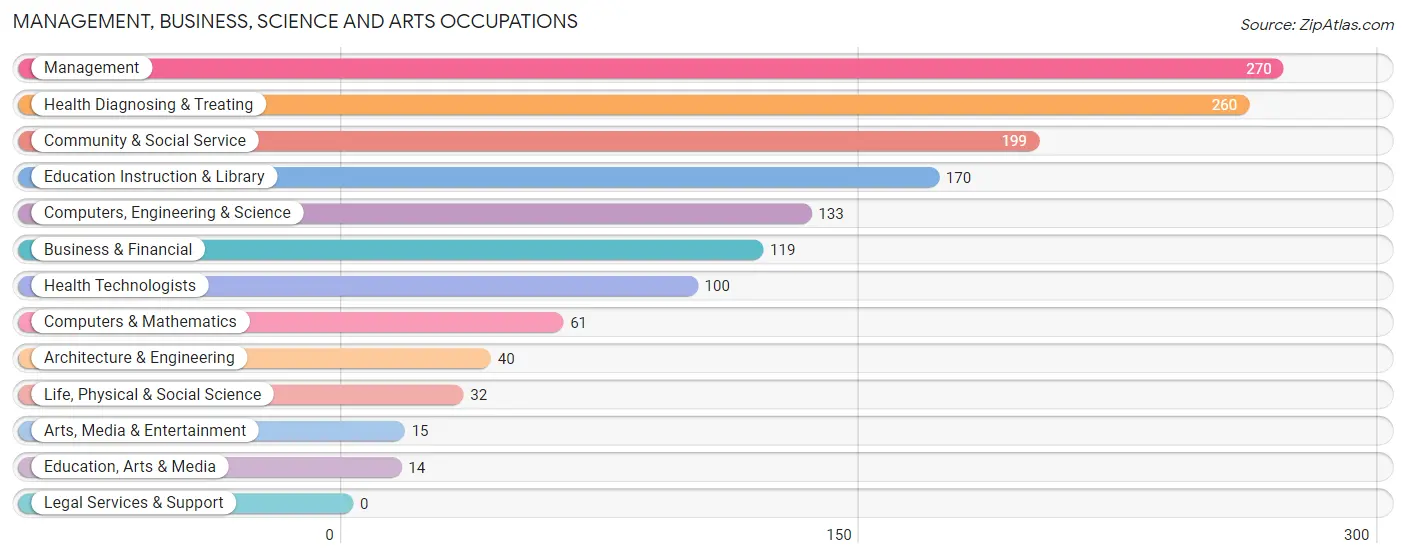
Management, Business, Science and Arts Occupations
The most common Management, Business, Science and Arts occupations in St Charles are Management (270 | 11.9%), Health Diagnosing & Treating (260 | 11.5%), Community & Social Service (199 | 8.8%), Education Instruction & Library (170 | 7.5%), and Computers, Engineering & Science (133 | 5.9%).
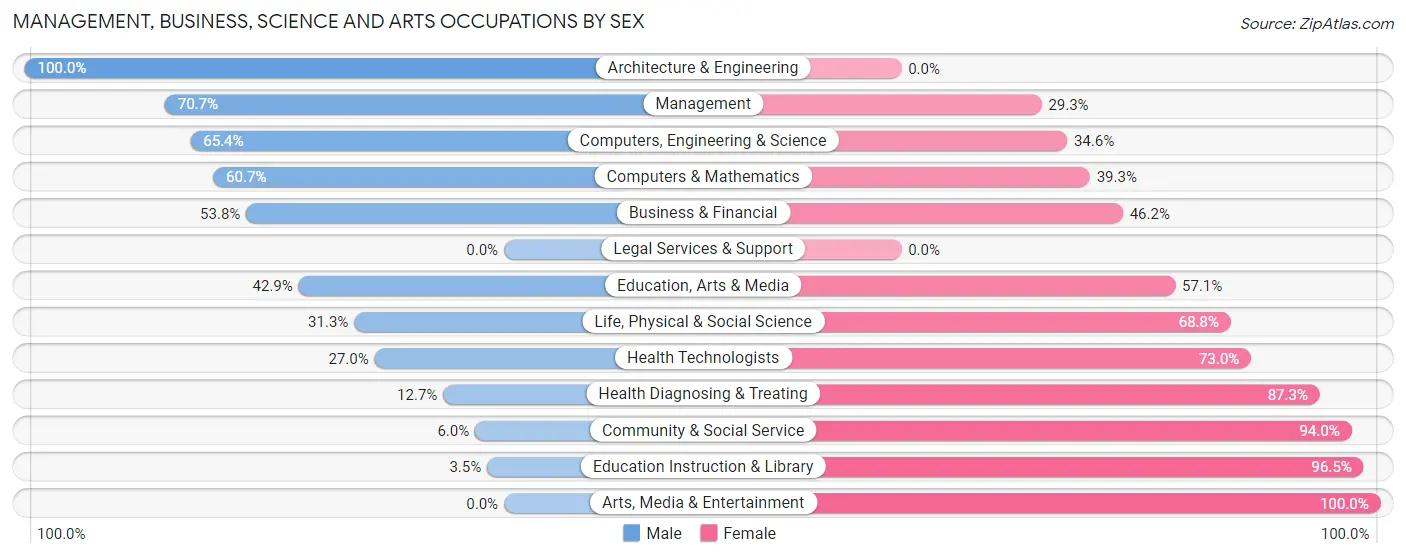
Management, Business, Science and Arts Occupations by Sex
Within the Management, Business, Science and Arts occupations in St Charles, the most male-oriented occupations are Architecture & Engineering (100.0%), Management (70.7%), and Computers, Engineering & Science (65.4%), while the most female-oriented occupations are Arts, Media & Entertainment (100.0%), Education Instruction & Library (96.5%), and Community & Social Service (94.0%).
| Occupation | Male | Female |
| Management | 191 (70.7%) | 79 (29.3%) |
| Business & Financial | 64 (53.8%) | 55 (46.2%) |
| Computers, Engineering & Science | 87 (65.4%) | 46 (34.6%) |
| Computers & Mathematics | 37 (60.7%) | 24 (39.3%) |
| Architecture & Engineering | 40 (100.0%) | 0 (0.0%) |
| Life, Physical & Social Science | 10 (31.2%) | 22 (68.8%) |
| Community & Social Service | 12 (6.0%) | 187 (94.0%) |
| Education, Arts & Media | 6 (42.9%) | 8 (57.1%) |
| Legal Services & Support | 0 (0.0%) | 0 (0.0%) |
| Education Instruction & Library | 6 (3.5%) | 164 (96.5%) |
| Arts, Media & Entertainment | 0 (0.0%) | 15 (100.0%) |
| Health Diagnosing & Treating | 33 (12.7%) | 227 (87.3%) |
| Health Technologists | 27 (27.0%) | 73 (73.0%) |
| Total (Category) | 387 (39.5%) | 594 (60.6%) |
| Total (Overall) | 1,142 (50.5%) | 1,119 (49.5%) |
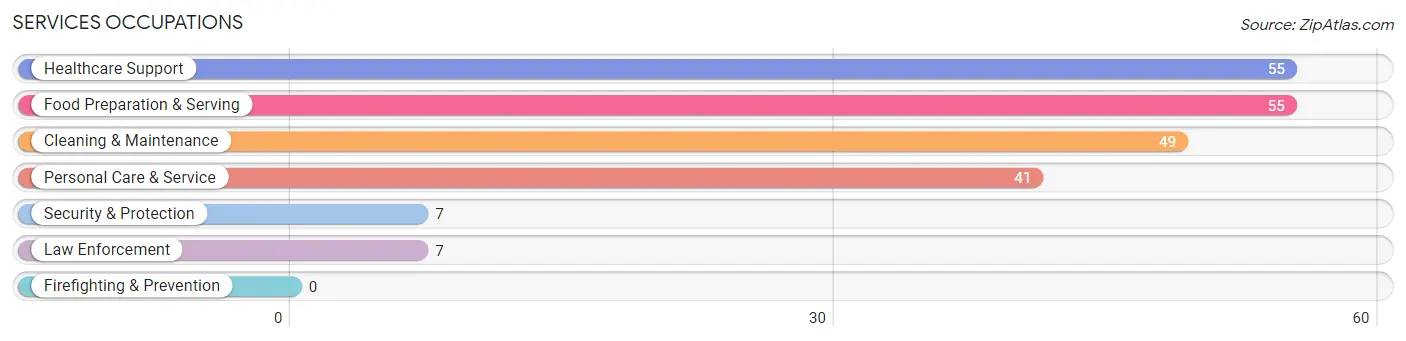
Services Occupations
The most common Services occupations in St Charles are Healthcare Support (55 | 2.4%), Food Preparation & Serving (55 | 2.4%), Cleaning & Maintenance (49 | 2.2%), Personal Care & Service (41 | 1.8%), and Security & Protection (7 | 0.3%).
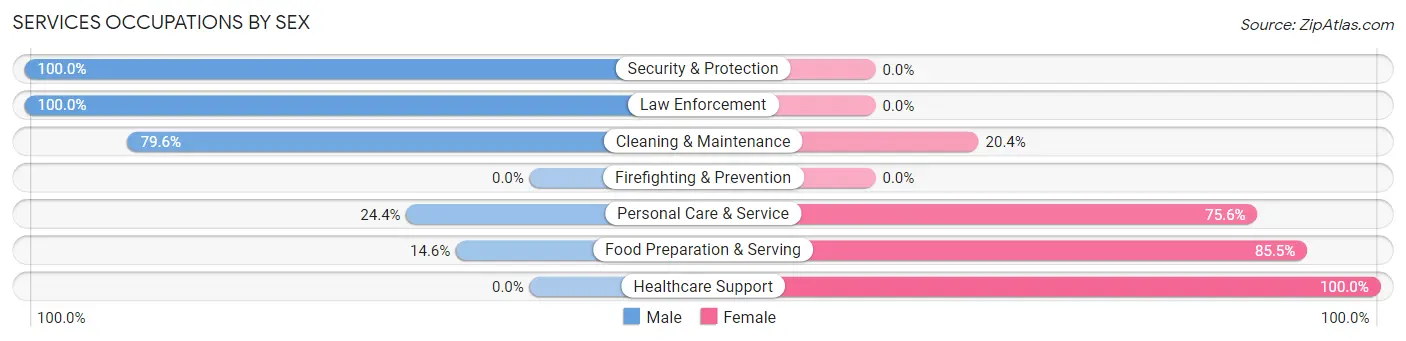
Services Occupations by Sex
Within the Services occupations in St Charles, the most male-oriented occupations are Security & Protection (100.0%), Law Enforcement (100.0%), and Cleaning & Maintenance (79.6%), while the most female-oriented occupations are Healthcare Support (100.0%), Food Preparation & Serving (85.5%), and Personal Care & Service (75.6%).
| Occupation | Male | Female |
| Healthcare Support | 0 (0.0%) | 55 (100.0%) |
| Security & Protection | 7 (100.0%) | 0 (0.0%) |
| Firefighting & Prevention | 0 (0.0%) | 0 (0.0%) |
| Law Enforcement | 7 (100.0%) | 0 (0.0%) |
| Food Preparation & Serving | 8 (14.5%) | 47 (85.5%) |
| Cleaning & Maintenance | 39 (79.6%) | 10 (20.4%) |
| Personal Care & Service | 10 (24.4%) | 31 (75.6%) |
| Total (Category) | 64 (30.9%) | 143 (69.1%) |
| Total (Overall) | 1,142 (50.5%) | 1,119 (49.5%) |
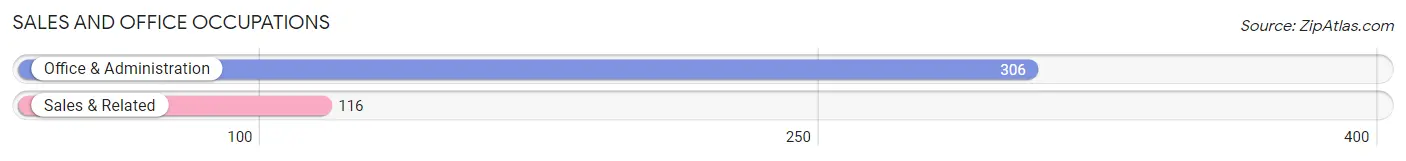
Sales and Office Occupations
The most common Sales and Office occupations in St Charles are Office & Administration (306 | 13.5%), and Sales & Related (116 | 5.1%).
Sales and Office Occupations by Sex
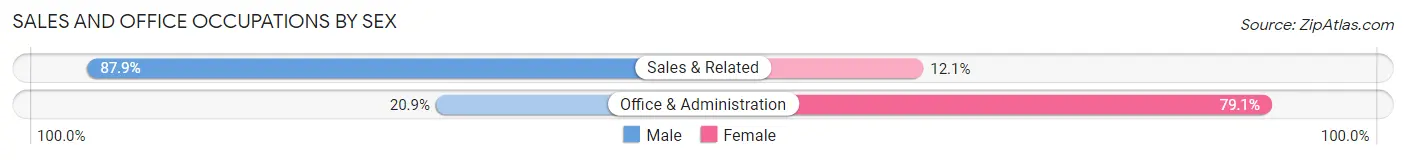
| Occupation | Male | Female |
| Sales & Related | 102 (87.9%) | 14 (12.1%) |
| Office & Administration | 64 (20.9%) | 242 (79.1%) |
| Total (Category) | 166 (39.3%) | 256 (60.7%) |
| Total (Overall) | 1,142 (50.5%) | 1,119 (49.5%) |
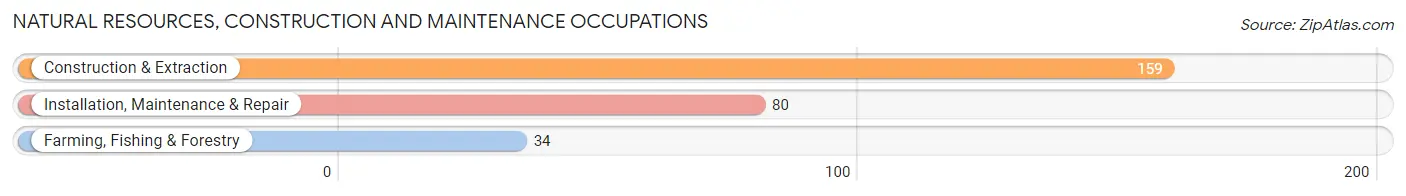
Natural Resources, Construction and Maintenance Occupations
The most common Natural Resources, Construction and Maintenance occupations in St Charles are Construction & Extraction (159 | 7.0%), Installation, Maintenance & Repair (80 | 3.5%), and Farming, Fishing & Forestry (34 | 1.5%).
Natural Resources, Construction and Maintenance Occupations by Sex
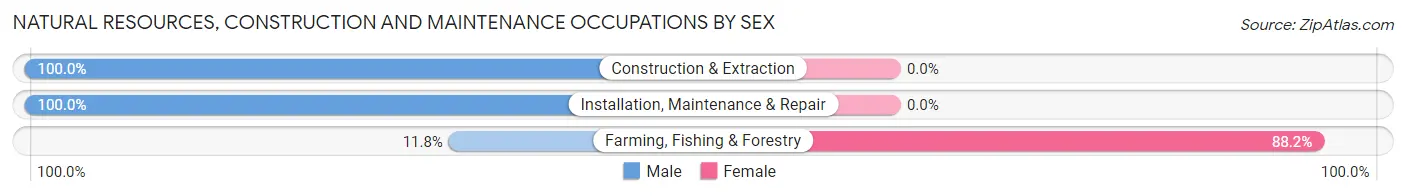
| Occupation | Male | Female |
| Farming, Fishing & Forestry | 4 (11.8%) | 30 (88.2%) |
| Construction & Extraction | 159 (100.0%) | 0 (0.0%) |
| Installation, Maintenance & Repair | 80 (100.0%) | 0 (0.0%) |
| Total (Category) | 243 (89.0%) | 30 (11.0%) |
| Total (Overall) | 1,142 (50.5%) | 1,119 (49.5%) |
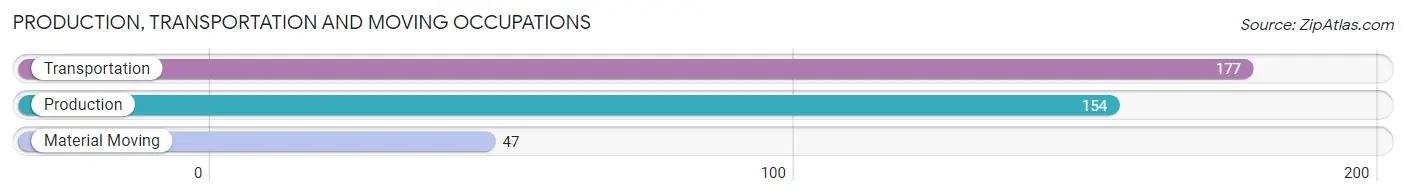
Production, Transportation and Moving Occupations
The most common Production, Transportation and Moving occupations in St Charles are Transportation (177 | 7.8%), Production (154 | 6.8%), and Material Moving (47 | 2.1%).
Production, Transportation and Moving Occupations by Sex
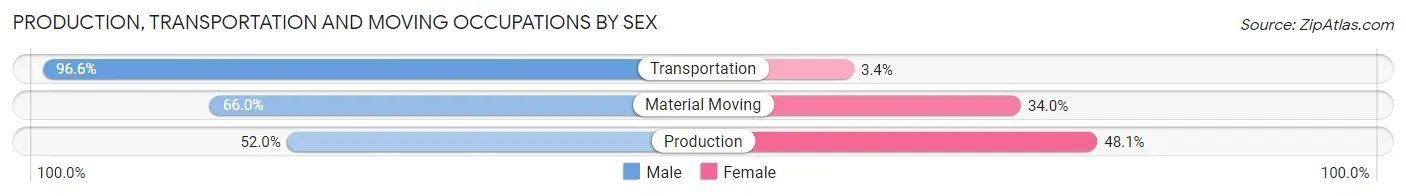
| Occupation | Male | Female |
| Production | 80 (51.9%) | 74 (48.0%) |
| Transportation | 171 (96.6%) | 6 (3.4%) |
| Material Moving | 31 (66.0%) | 16 (34.0%) |
| Total (Category) | 282 (74.6%) | 96 (25.4%) |
| Total (Overall) | 1,142 (50.5%) | 1,119 (49.5%) |
Employment Industries by Sex in St Charles
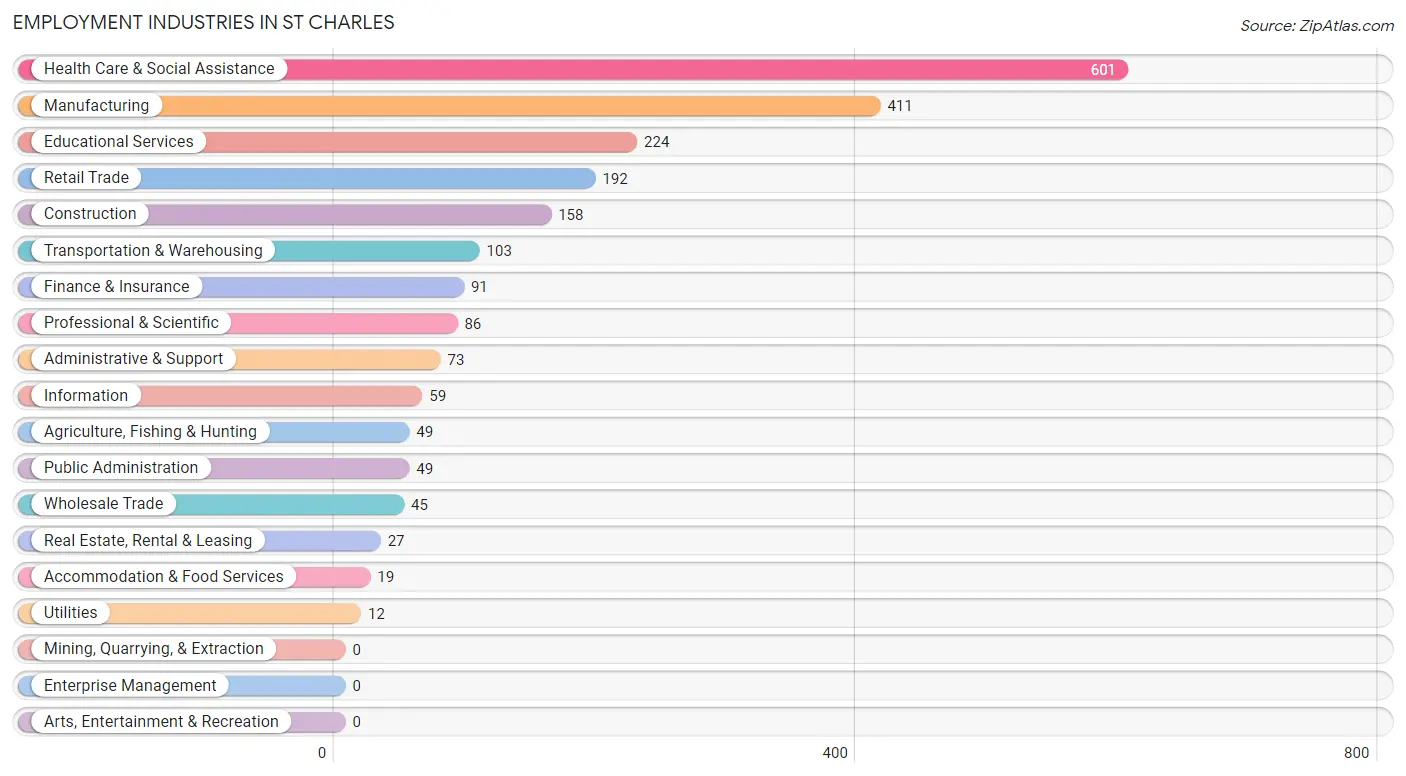
Employment Industries in St Charles
The major employment industries in St Charles include Health Care & Social Assistance (601 | 26.6%), Manufacturing (411 | 18.2%), Educational Services (224 | 9.9%), Retail Trade (192 | 8.5%), and Construction (158 | 7.0%).
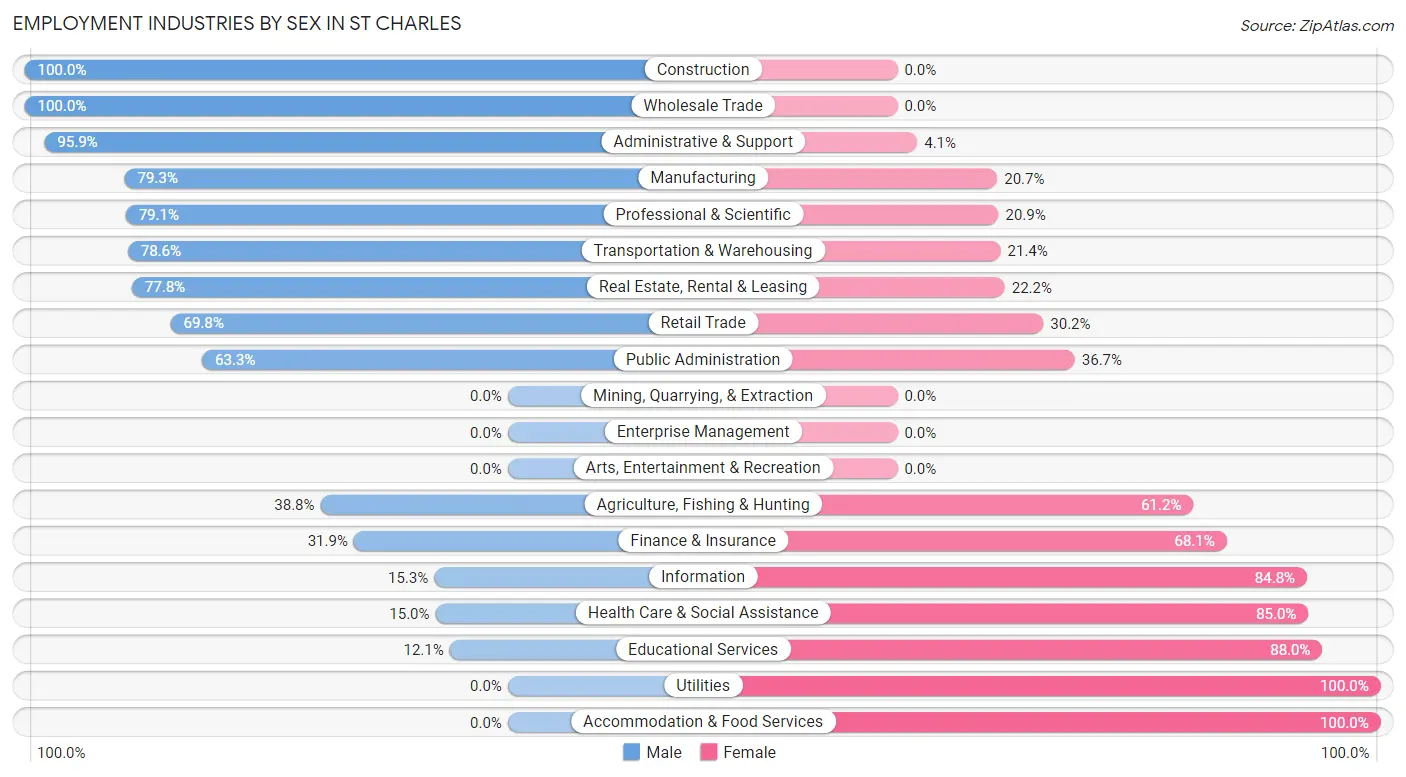
Employment Industries by Sex in St Charles
The St Charles industries that see more men than women are Construction (100.0%), Wholesale Trade (100.0%), and Administrative & Support (95.9%), whereas the industries that tend to have a higher number of women are Utilities (100.0%), Accommodation & Food Services (100.0%), and Educational Services (87.9%).
| Industry | Male | Female |
| Agriculture, Fishing & Hunting | 19 (38.8%) | 30 (61.2%) |
| Mining, Quarrying, & Extraction | 0 (0.0%) | 0 (0.0%) |
| Construction | 158 (100.0%) | 0 (0.0%) |
| Manufacturing | 326 (79.3%) | 85 (20.7%) |
| Wholesale Trade | 45 (100.0%) | 0 (0.0%) |
| Retail Trade | 134 (69.8%) | 58 (30.2%) |
| Transportation & Warehousing | 81 (78.6%) | 22 (21.4%) |
| Utilities | 0 (0.0%) | 12 (100.0%) |
| Information | 9 (15.2%) | 50 (84.8%) |
| Finance & Insurance | 29 (31.9%) | 62 (68.1%) |
| Real Estate, Rental & Leasing | 21 (77.8%) | 6 (22.2%) |
| Professional & Scientific | 68 (79.1%) | 18 (20.9%) |
| Enterprise Management | 0 (0.0%) | 0 (0.0%) |
| Administrative & Support | 70 (95.9%) | 3 (4.1%) |
| Educational Services | 27 (12.0%) | 197 (87.9%) |
| Health Care & Social Assistance | 90 (15.0%) | 511 (85.0%) |
| Arts, Entertainment & Recreation | 0 (0.0%) | 0 (0.0%) |
| Accommodation & Food Services | 0 (0.0%) | 19 (100.0%) |
| Public Administration | 31 (63.3%) | 18 (36.7%) |
| Total | 1,142 (50.5%) | 1,119 (49.5%) |
Education in St Charles
School Enrollment in St Charles
The most common levels of schooling among the 928 students in St Charles are middle school (308 | 33.2%), elementary school (216 | 23.3%), and high school (128 | 13.8%).
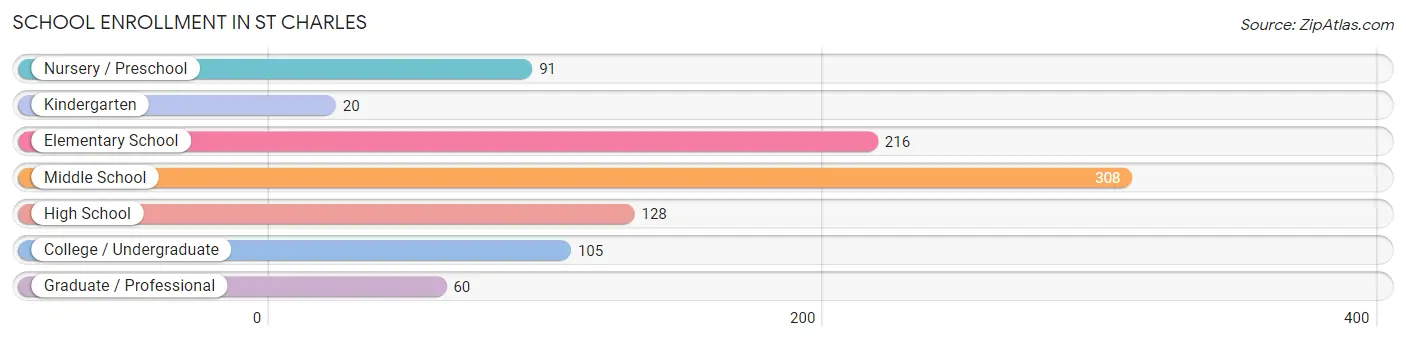
| School Level | # Students | % Students |
| Nursery / Preschool | 91 | 9.8% |
| Kindergarten | 20 | 2.2% |
| Elementary School | 216 | 23.3% |
| Middle School | 308 | 33.2% |
| High School | 128 | 13.8% |
| College / Undergraduate | 105 | 11.3% |
| Graduate / Professional | 60 | 6.5% |
| Total | 928 | 100.0% |
School Enrollment by Age by Funding Source in St Charles
Out of a total of 928 students who are enrolled in schools in St Charles, 60 (6.5%) attend a private institution, while the remaining 868 (93.5%) are enrolled in public schools. The age group of 25 to 34 year olds has the highest likelihood of being enrolled in private schools, with 31 (62.0% in the age bracket) enrolled. Conversely, the age group of 10 to 14 year olds has the lowest likelihood of being enrolled in a private school, with 319 (100.0% in the age bracket) attending a public institution.
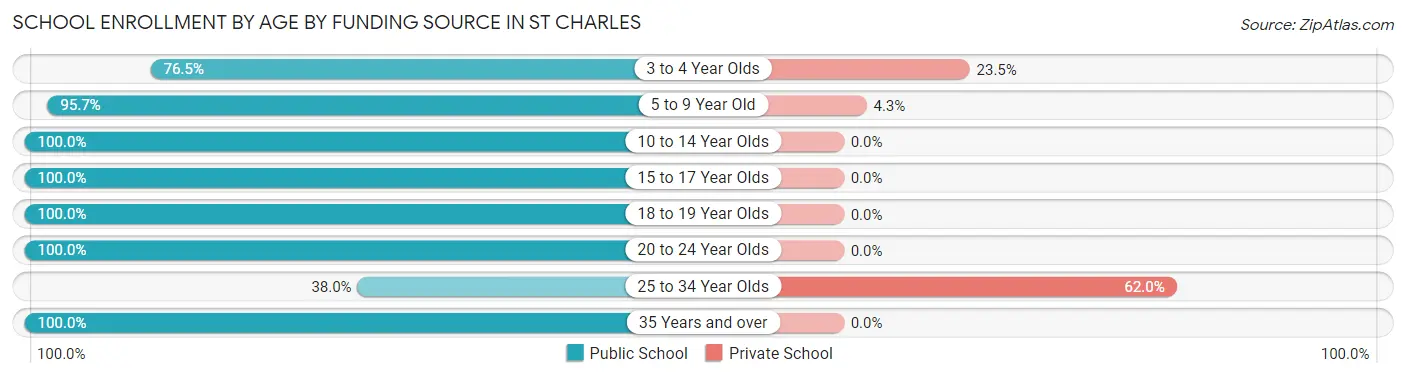
| Age Bracket | Public School | Private School |
| 3 to 4 Year Olds | 62 (76.5%) | 19 (23.5%) |
| 5 to 9 Year Old | 225 (95.7%) | 10 (4.3%) |
| 10 to 14 Year Olds | 319 (100.0%) | 0 (0.0%) |
| 15 to 17 Year Olds | 116 (100.0%) | 0 (0.0%) |
| 18 to 19 Year Olds | 12 (100.0%) | 0 (0.0%) |
| 20 to 24 Year Olds | 75 (100.0%) | 0 (0.0%) |
| 25 to 34 Year Olds | 19 (38.0%) | 31 (62.0%) |
| 35 Years and over | 40 (100.0%) | 0 (0.0%) |
| Total | 868 (93.5%) | 60 (6.5%) |
Educational Attainment by Field of Study in St Charles
Education (254 | 23.7%), business (186 | 17.3%), science & technology (132 | 12.3%), bio, nature & agricultural (121 | 11.3%), and arts & humanities (102 | 9.5%) are the most common fields of study among 1,073 individuals in St Charles who have obtained a bachelor's degree or higher.
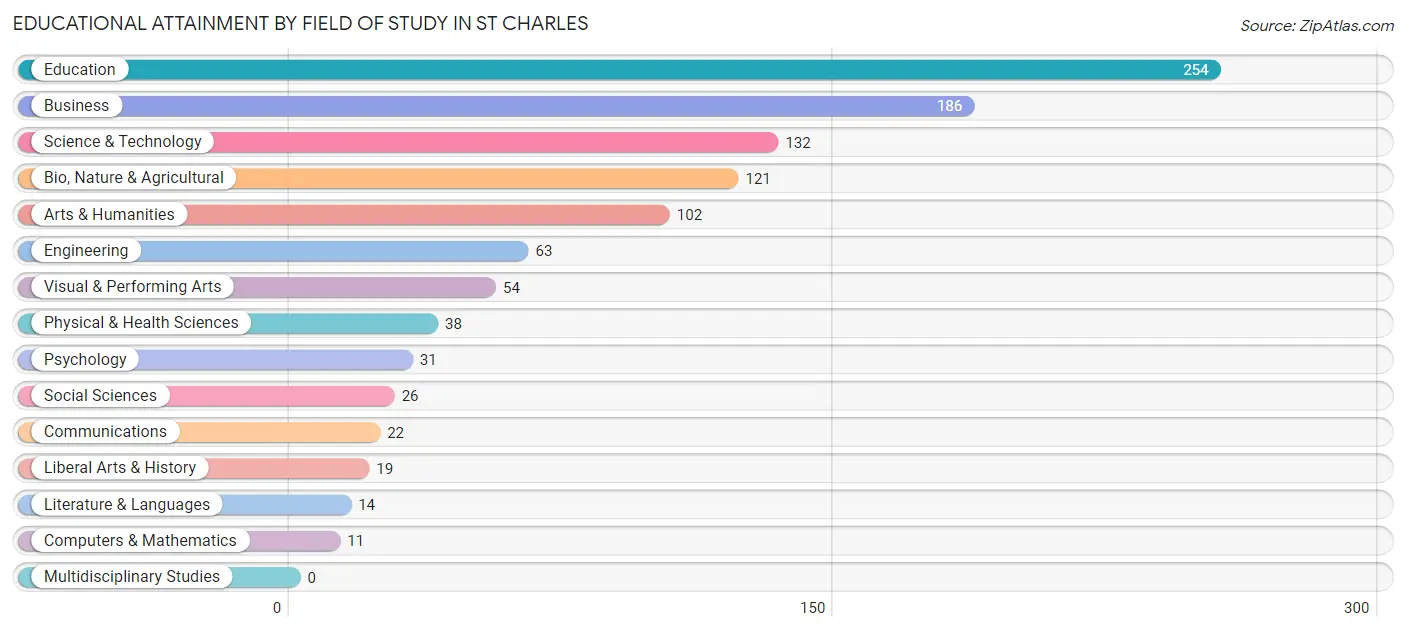
| Field of Study | # Graduates | % Graduates |
| Computers & Mathematics | 11 | 1.0% |
| Bio, Nature & Agricultural | 121 | 11.3% |
| Physical & Health Sciences | 38 | 3.5% |
| Psychology | 31 | 2.9% |
| Social Sciences | 26 | 2.4% |
| Engineering | 63 | 5.9% |
| Multidisciplinary Studies | 0 | 0.0% |
| Science & Technology | 132 | 12.3% |
| Business | 186 | 17.3% |
| Education | 254 | 23.7% |
| Literature & Languages | 14 | 1.3% |
| Liberal Arts & History | 19 | 1.8% |
| Visual & Performing Arts | 54 | 5.0% |
| Communications | 22 | 2.1% |
| Arts & Humanities | 102 | 9.5% |
| Total | 1,073 | 100.0% |
Transportation & Commute in St Charles
Vehicle Availability by Sex in St Charles
The most prevalent vehicle ownership categories in St Charles are males with 2 vehicles (633, accounting for 57.0%) and females with 2 vehicles (467, making up 58.7%).
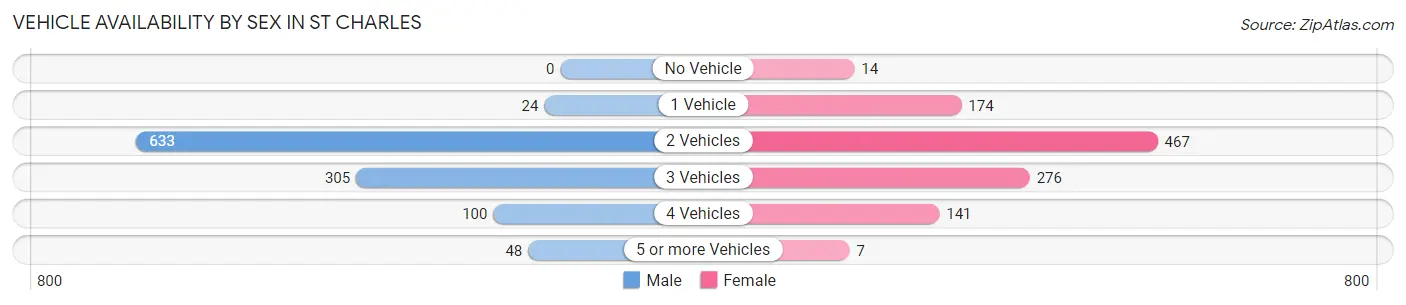
| Vehicles Available | Male | Female |
| No Vehicle | 0 (0.0%) | 14 (1.3%) |
| 1 Vehicle | 24 (2.2%) | 174 (16.1%) |
| 2 Vehicles | 633 (57.0%) | 467 (43.3%) |
| 3 Vehicles | 305 (27.5%) | 276 (25.6%) |
| 4 Vehicles | 100 (9.0%) | 141 (13.1%) |
| 5 or more Vehicles | 48 (4.3%) | 7 (0.6%) |
| Total | 1,110 (100.0%) | 1,079 (100.0%) |
Commute Time in St Charles
The most frequently occuring commute durations in St Charles are 30 to 34 minutes (587 commuters, 30.3%), 25 to 29 minutes (280 commuters, 14.4%), and 20 to 24 minutes (229 commuters, 11.8%).
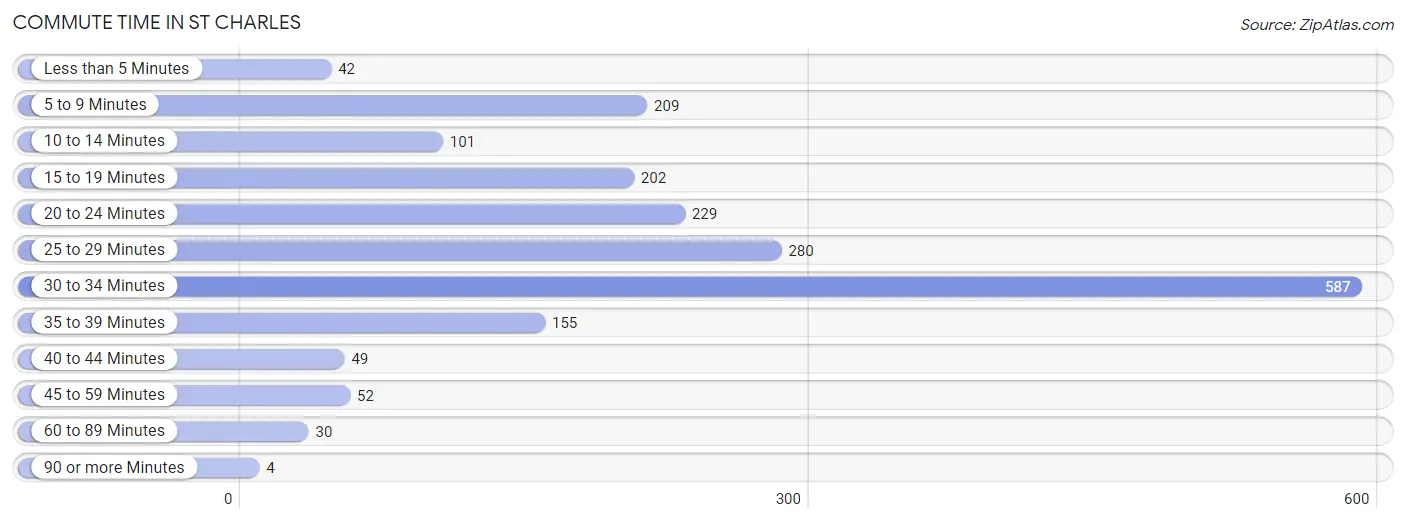
| Commute Time | # Commuters | % Commuters |
| Less than 5 Minutes | 42 | 2.2% |
| 5 to 9 Minutes | 209 | 10.8% |
| 10 to 14 Minutes | 101 | 5.2% |
| 15 to 19 Minutes | 202 | 10.4% |
| 20 to 24 Minutes | 229 | 11.8% |
| 25 to 29 Minutes | 280 | 14.4% |
| 30 to 34 Minutes | 587 | 30.3% |
| 35 to 39 Minutes | 155 | 8.0% |
| 40 to 44 Minutes | 49 | 2.5% |
| 45 to 59 Minutes | 52 | 2.7% |
| 60 to 89 Minutes | 30 | 1.5% |
| 90 or more Minutes | 4 | 0.2% |
Commute Time by Sex in St Charles
The most common commute times in St Charles are 30 to 34 minutes (214 commuters, 22.3%) for males and 30 to 34 minutes (373 commuters, 38.1%) for females.
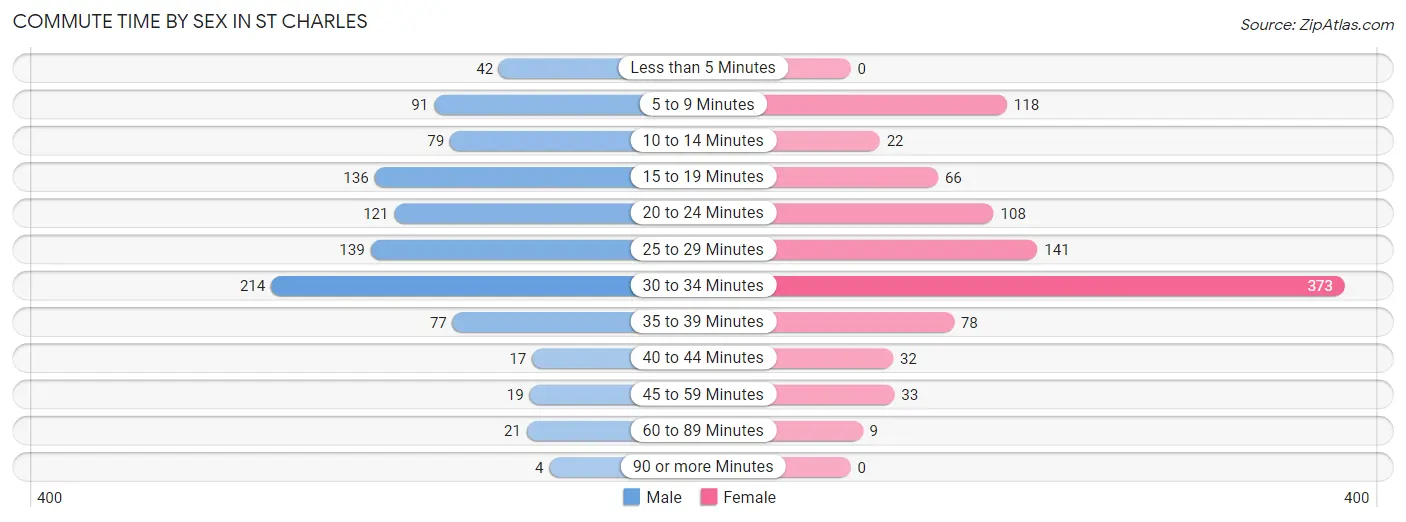
| Commute Time | Male | Female |
| Less than 5 Minutes | 42 (4.4%) | 0 (0.0%) |
| 5 to 9 Minutes | 91 (9.5%) | 118 (12.0%) |
| 10 to 14 Minutes | 79 (8.2%) | 22 (2.2%) |
| 15 to 19 Minutes | 136 (14.2%) | 66 (6.7%) |
| 20 to 24 Minutes | 121 (12.6%) | 108 (11.0%) |
| 25 to 29 Minutes | 139 (14.5%) | 141 (14.4%) |
| 30 to 34 Minutes | 214 (22.3%) | 373 (38.1%) |
| 35 to 39 Minutes | 77 (8.0%) | 78 (8.0%) |
| 40 to 44 Minutes | 17 (1.8%) | 32 (3.3%) |
| 45 to 59 Minutes | 19 (2.0%) | 33 (3.4%) |
| 60 to 89 Minutes | 21 (2.2%) | 9 (0.9%) |
| 90 or more Minutes | 4 (0.4%) | 0 (0.0%) |
Time of Departure to Work by Sex in St Charles
The most frequent times of departure to work in St Charles are 12:00 AM to 4:59 AM (250, 26.0%) for males and 6:00 AM to 6:29 AM (290, 29.6%) for females.
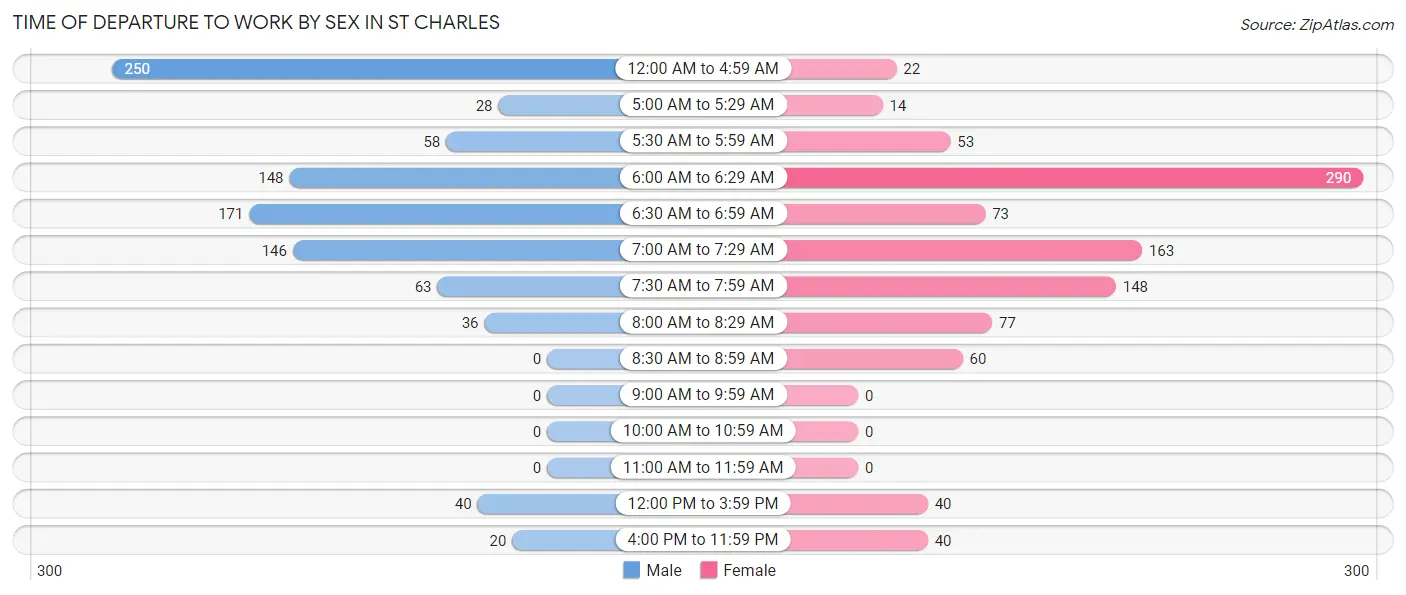
| Time of Departure | Male | Female |
| 12:00 AM to 4:59 AM | 250 (26.0%) | 22 (2.2%) |
| 5:00 AM to 5:29 AM | 28 (2.9%) | 14 (1.4%) |
| 5:30 AM to 5:59 AM | 58 (6.0%) | 53 (5.4%) |
| 6:00 AM to 6:29 AM | 148 (15.4%) | 290 (29.6%) |
| 6:30 AM to 6:59 AM | 171 (17.8%) | 73 (7.4%) |
| 7:00 AM to 7:29 AM | 146 (15.2%) | 163 (16.6%) |
| 7:30 AM to 7:59 AM | 63 (6.6%) | 148 (15.1%) |
| 8:00 AM to 8:29 AM | 36 (3.7%) | 77 (7.9%) |
| 8:30 AM to 8:59 AM | 0 (0.0%) | 60 (6.1%) |
| 9:00 AM to 9:59 AM | 0 (0.0%) | 0 (0.0%) |
| 10:00 AM to 10:59 AM | 0 (0.0%) | 0 (0.0%) |
| 11:00 AM to 11:59 AM | 0 (0.0%) | 0 (0.0%) |
| 12:00 PM to 3:59 PM | 40 (4.2%) | 40 (4.1%) |
| 4:00 PM to 11:59 PM | 20 (2.1%) | 40 (4.1%) |
| Total | 960 (100.0%) | 980 (100.0%) |
Housing Occupancy in St Charles
Occupancy by Ownership in St Charles
Of the total 1,637 dwellings in St Charles, owner-occupied units account for 1,370 (83.7%), while renter-occupied units make up 267 (16.3%).
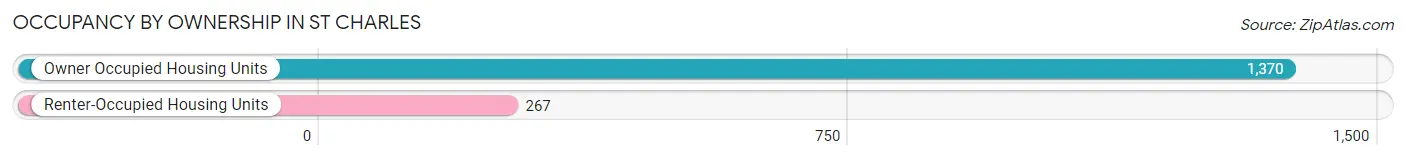
| Occupancy | # Housing Units | % Housing Units |
| Owner Occupied Housing Units | 1,370 | 83.7% |
| Renter-Occupied Housing Units | 267 | 16.3% |
| Total Occupied Housing Units | 1,637 | 100.0% |
Occupancy by Household Size in St Charles
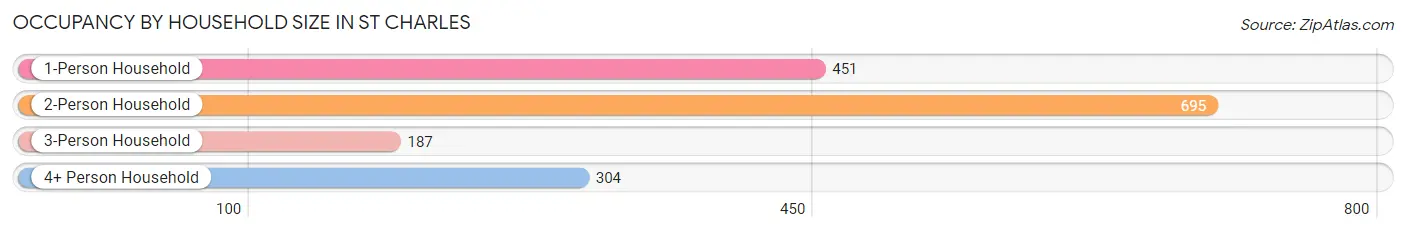
| Household Size | # Housing Units | % Housing Units |
| 1-Person Household | 451 | 27.6% |
| 2-Person Household | 695 | 42.5% |
| 3-Person Household | 187 | 11.4% |
| 4+ Person Household | 304 | 18.6% |
| Total Housing Units | 1,637 | 100.0% |
Occupancy by Ownership by Household Size in St Charles
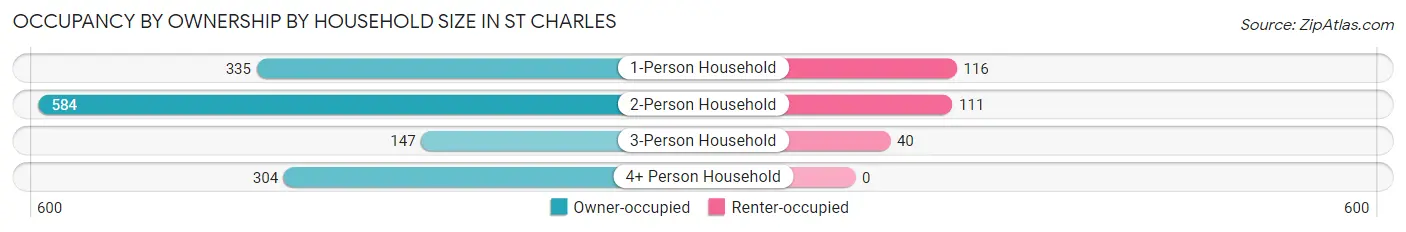
| Household Size | Owner-occupied | Renter-occupied |
| 1-Person Household | 335 (74.3%) | 116 (25.7%) |
| 2-Person Household | 584 (84.0%) | 111 (16.0%) |
| 3-Person Household | 147 (78.6%) | 40 (21.4%) |
| 4+ Person Household | 304 (100.0%) | 0 (0.0%) |
| Total Housing Units | 1,370 (83.7%) | 267 (16.3%) |
Occupancy by Educational Attainment in St Charles
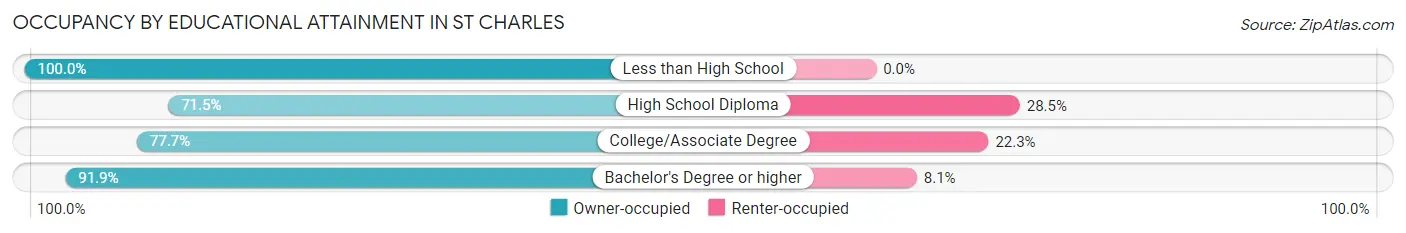
| Household Size | Owner-occupied | Renter-occupied |
| Less than High School | 109 (100.0%) | 0 (0.0%) |
| High School Diploma | 231 (71.5%) | 92 (28.5%) |
| College/Associate Degree | 426 (77.7%) | 122 (22.3%) |
| Bachelor's Degree or higher | 604 (91.9%) | 53 (8.1%) |
Occupancy by Age of Householder in St Charles
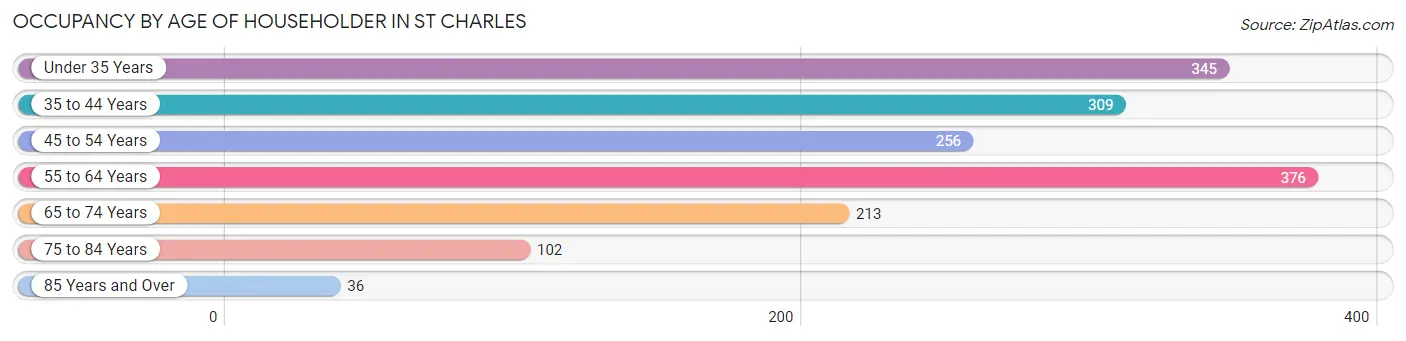
| Age Bracket | # Households | % Households |
| Under 35 Years | 345 | 21.1% |
| 35 to 44 Years | 309 | 18.9% |
| 45 to 54 Years | 256 | 15.6% |
| 55 to 64 Years | 376 | 23.0% |
| 65 to 74 Years | 213 | 13.0% |
| 75 to 84 Years | 102 | 6.2% |
| 85 Years and Over | 36 | 2.2% |
| Total | 1,637 | 100.0% |
Housing Finances in St Charles
Median Income by Occupancy in St Charles
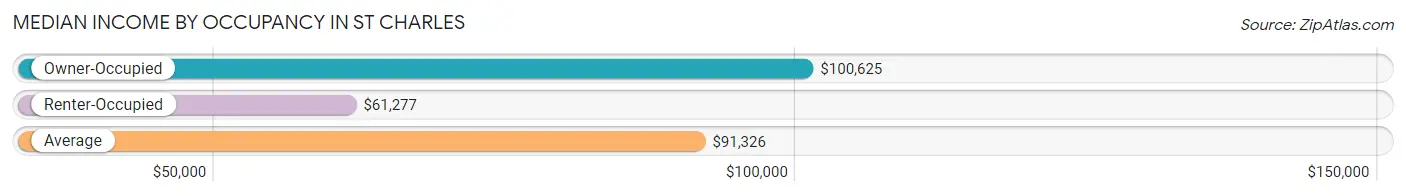
| Occupancy Type | # Households | Median Income |
| Owner-Occupied | 1,370 (83.7%) | $100,625 |
| Renter-Occupied | 267 (16.3%) | $61,277 |
| Average | 1,637 (100.0%) | $91,326 |
Occupancy by Householder Income Bracket in St Charles
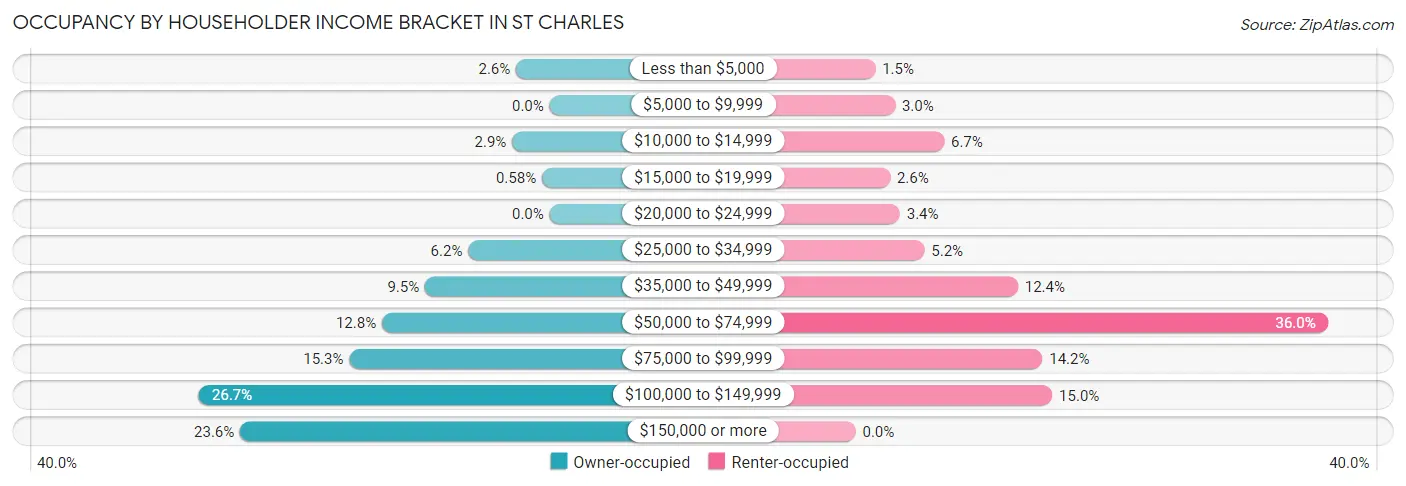
| Income Bracket | Owner-occupied | Renter-occupied |
| Less than $5,000 | 35 (2.5%) | 4 (1.5%) |
| $5,000 to $9,999 | 0 (0.0%) | 8 (3.0%) |
| $10,000 to $14,999 | 39 (2.9%) | 18 (6.7%) |
| $15,000 to $19,999 | 8 (0.6%) | 7 (2.6%) |
| $20,000 to $24,999 | 0 (0.0%) | 9 (3.4%) |
| $25,000 to $34,999 | 85 (6.2%) | 14 (5.2%) |
| $35,000 to $49,999 | 130 (9.5%) | 33 (12.4%) |
| $50,000 to $74,999 | 175 (12.8%) | 96 (36.0%) |
| $75,000 to $99,999 | 209 (15.3%) | 38 (14.2%) |
| $100,000 to $149,999 | 366 (26.7%) | 40 (15.0%) |
| $150,000 or more | 323 (23.6%) | 0 (0.0%) |
| Total | 1,370 (100.0%) | 267 (100.0%) |
Monthly Housing Cost Tiers in St Charles
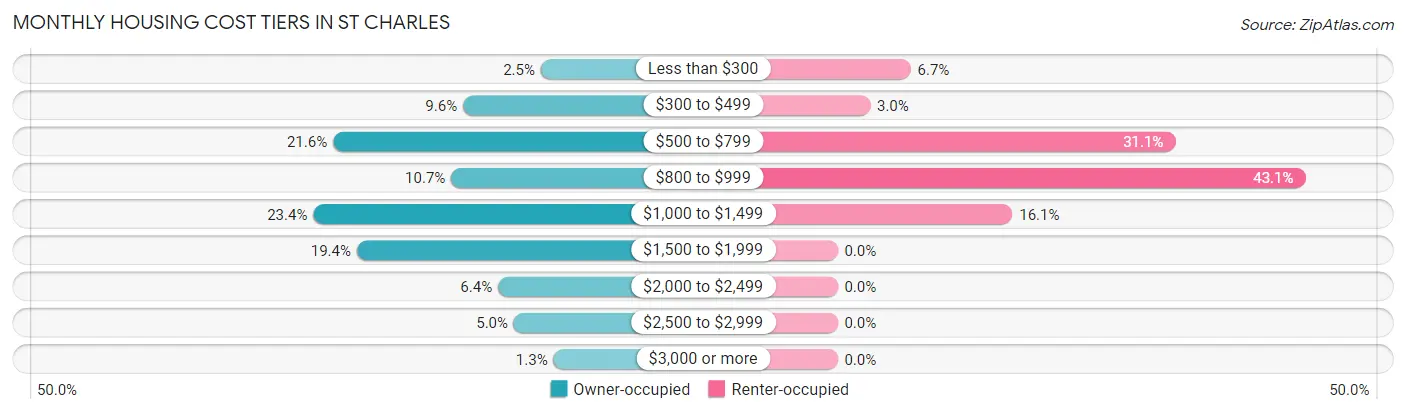
| Monthly Cost | Owner-occupied | Renter-occupied |
| Less than $300 | 34 (2.5%) | 18 (6.7%) |
| $300 to $499 | 132 (9.6%) | 8 (3.0%) |
| $500 to $799 | 296 (21.6%) | 83 (31.1%) |
| $800 to $999 | 147 (10.7%) | 115 (43.1%) |
| $1,000 to $1,499 | 321 (23.4%) | 43 (16.1%) |
| $1,500 to $1,999 | 266 (19.4%) | 0 (0.0%) |
| $2,000 to $2,499 | 88 (6.4%) | 0 (0.0%) |
| $2,500 to $2,999 | 68 (5.0%) | 0 (0.0%) |
| $3,000 or more | 18 (1.3%) | 0 (0.0%) |
| Total | 1,370 (100.0%) | 267 (100.0%) |
Physical Housing Characteristics in St Charles
Housing Structures in St Charles
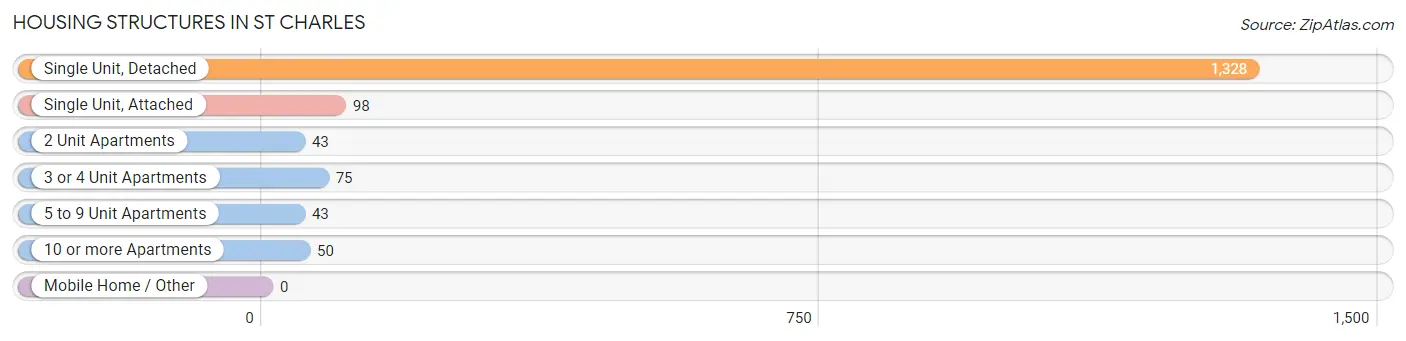
| Structure Type | # Housing Units | % Housing Units |
| Single Unit, Detached | 1,328 | 81.1% |
| Single Unit, Attached | 98 | 6.0% |
| 2 Unit Apartments | 43 | 2.6% |
| 3 or 4 Unit Apartments | 75 | 4.6% |
| 5 to 9 Unit Apartments | 43 | 2.6% |
| 10 or more Apartments | 50 | 3.0% |
| Mobile Home / Other | 0 | 0.0% |
| Total | 1,637 | 100.0% |
Housing Structures by Occupancy in St Charles
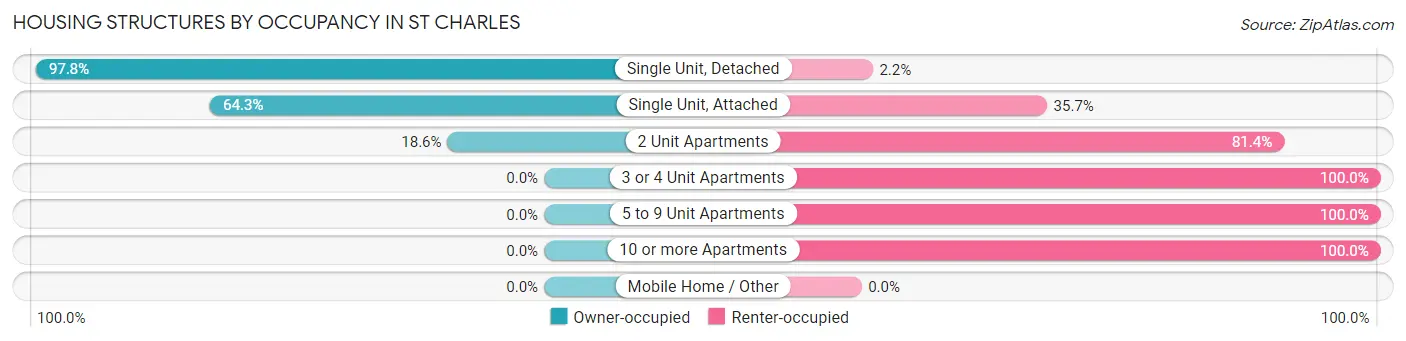
| Structure Type | Owner-occupied | Renter-occupied |
| Single Unit, Detached | 1,299 (97.8%) | 29 (2.2%) |
| Single Unit, Attached | 63 (64.3%) | 35 (35.7%) |
| 2 Unit Apartments | 8 (18.6%) | 35 (81.4%) |
| 3 or 4 Unit Apartments | 0 (0.0%) | 75 (100.0%) |
| 5 to 9 Unit Apartments | 0 (0.0%) | 43 (100.0%) |
| 10 or more Apartments | 0 (0.0%) | 50 (100.0%) |
| Mobile Home / Other | 0 (0.0%) | 0 (0.0%) |
| Total | 1,370 (83.7%) | 267 (16.3%) |
Housing Structures by Number of Rooms in St Charles
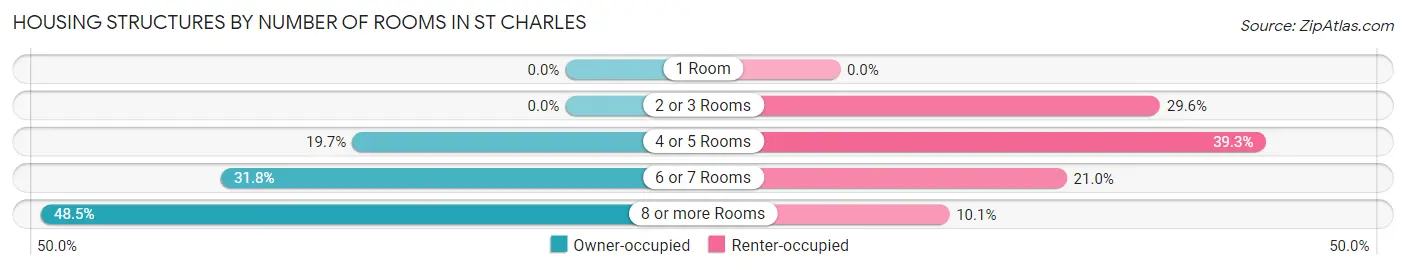
| Number of Rooms | Owner-occupied | Renter-occupied |
| 1 Room | 0 (0.0%) | 0 (0.0%) |
| 2 or 3 Rooms | 0 (0.0%) | 79 (29.6%) |
| 4 or 5 Rooms | 270 (19.7%) | 105 (39.3%) |
| 6 or 7 Rooms | 436 (31.8%) | 56 (21.0%) |
| 8 or more Rooms | 664 (48.5%) | 27 (10.1%) |
| Total | 1,370 (100.0%) | 267 (100.0%) |
Housing Structure by Heating Type in St Charles
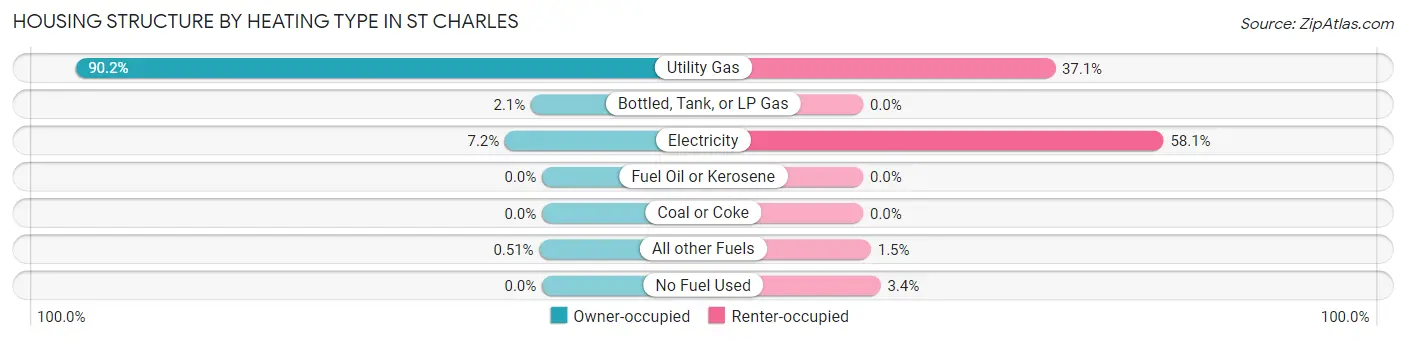
| Heating Type | Owner-occupied | Renter-occupied |
| Utility Gas | 1,236 (90.2%) | 99 (37.1%) |
| Bottled, Tank, or LP Gas | 29 (2.1%) | 0 (0.0%) |
| Electricity | 98 (7.1%) | 155 (58.1%) |
| Fuel Oil or Kerosene | 0 (0.0%) | 0 (0.0%) |
| Coal or Coke | 0 (0.0%) | 0 (0.0%) |
| All other Fuels | 7 (0.5%) | 4 (1.5%) |
| No Fuel Used | 0 (0.0%) | 9 (3.4%) |
| Total | 1,370 (100.0%) | 267 (100.0%) |
Household Vehicle Usage in St Charles
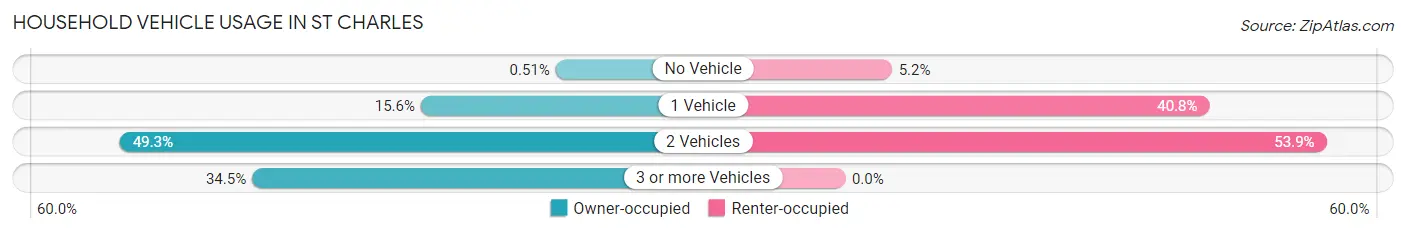
| Vehicles per Household | Owner-occupied | Renter-occupied |
| No Vehicle | 7 (0.5%) | 14 (5.2%) |
| 1 Vehicle | 214 (15.6%) | 109 (40.8%) |
| 2 Vehicles | 676 (49.3%) | 144 (53.9%) |
| 3 or more Vehicles | 473 (34.5%) | 0 (0.0%) |
| Total | 1,370 (100.0%) | 267 (100.0%) |
Real Estate & Mortgages in St Charles
Real Estate and Mortgage Overview in St Charles
| Characteristic | Without Mortgage | With Mortgage |
| Housing Units | 473 | 897 |
| Median Property Value | $253,700 | $207,800 |
| Median Household Income | $96,250 | $164 |
| Monthly Housing Costs | $559 | $18 |
| Real Estate Taxes | $2,348 | $20 |
Property Value by Mortgage Status in St Charles
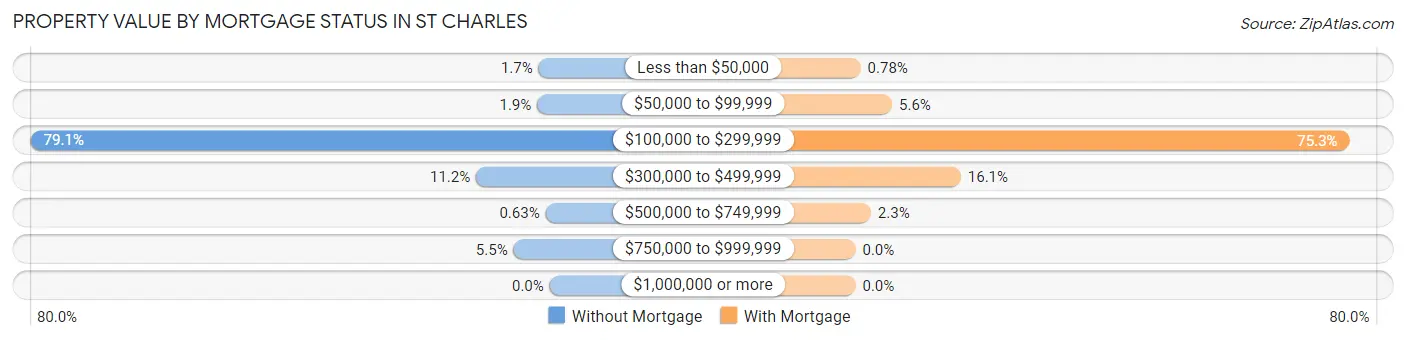
| Property Value | Without Mortgage | With Mortgage |
| Less than $50,000 | 8 (1.7%) | 7 (0.8%) |
| $50,000 to $99,999 | 9 (1.9%) | 50 (5.6%) |
| $100,000 to $299,999 | 374 (79.1%) | 675 (75.2%) |
| $300,000 to $499,999 | 53 (11.2%) | 144 (16.1%) |
| $500,000 to $749,999 | 3 (0.6%) | 21 (2.3%) |
| $750,000 to $999,999 | 26 (5.5%) | 0 (0.0%) |
| $1,000,000 or more | 0 (0.0%) | 0 (0.0%) |
| Total | 473 (100.0%) | 897 (100.0%) |
Household Income by Mortgage Status in St Charles
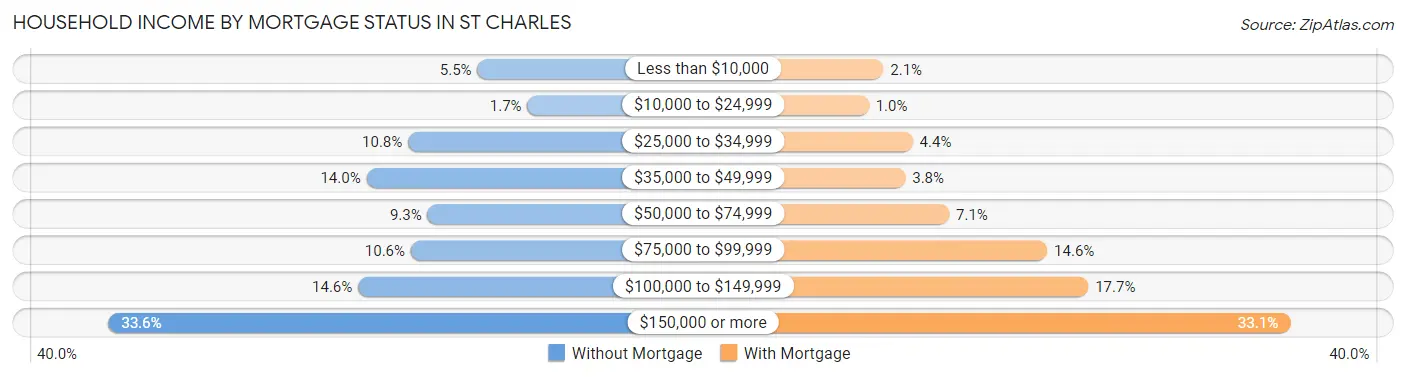
| Household Income | Without Mortgage | With Mortgage |
| Less than $10,000 | 26 (5.5%) | 19 (2.1%) |
| $10,000 to $24,999 | 8 (1.7%) | 9 (1.0%) |
| $25,000 to $34,999 | 51 (10.8%) | 39 (4.3%) |
| $35,000 to $49,999 | 66 (14.0%) | 34 (3.8%) |
| $50,000 to $74,999 | 44 (9.3%) | 64 (7.1%) |
| $75,000 to $99,999 | 50 (10.6%) | 131 (14.6%) |
| $100,000 to $149,999 | 69 (14.6%) | 159 (17.7%) |
| $150,000 or more | 159 (33.6%) | 297 (33.1%) |
| Total | 473 (100.0%) | 897 (100.0%) |
Property Value to Household Income Ratio in St Charles
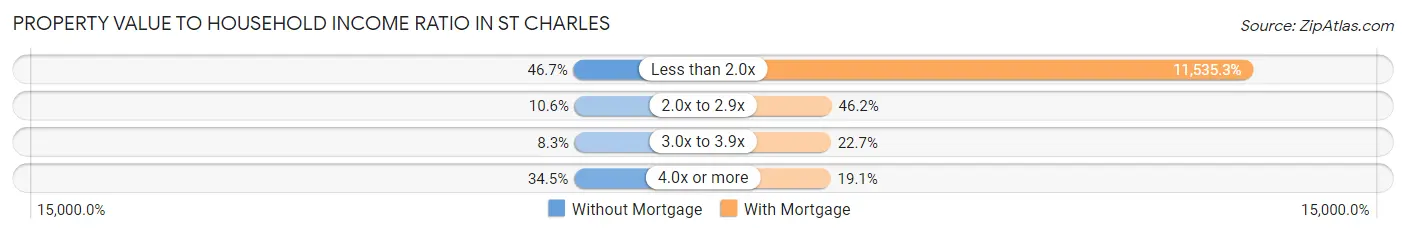
| Value-to-Income Ratio | Without Mortgage | With Mortgage |
| Less than 2.0x | 221 (46.7%) | 103,472 (11,535.3%) |
| 2.0x to 2.9x | 50 (10.6%) | 414 (46.2%) |
| 3.0x to 3.9x | 39 (8.3%) | 204 (22.7%) |
| 4.0x or more | 163 (34.5%) | 171 (19.1%) |
| Total | 473 (100.0%) | 897 (100.0%) |
Real Estate Taxes by Mortgage Status in St Charles
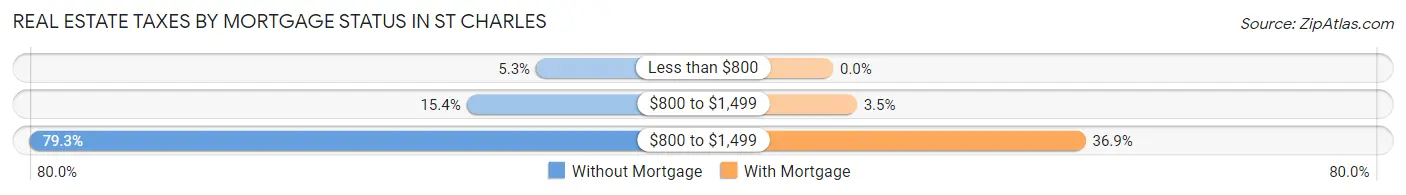
| Property Taxes | Without Mortgage | With Mortgage |
| Less than $800 | 25 (5.3%) | 0 (0.0%) |
| $800 to $1,499 | 73 (15.4%) | 31 (3.5%) |
| $800 to $1,499 | 375 (79.3%) | 331 (36.9%) |
| Total | 473 (100.0%) | 897 (100.0%) |
Health & Disability in St Charles
Health Insurance Coverage by Age in St Charles
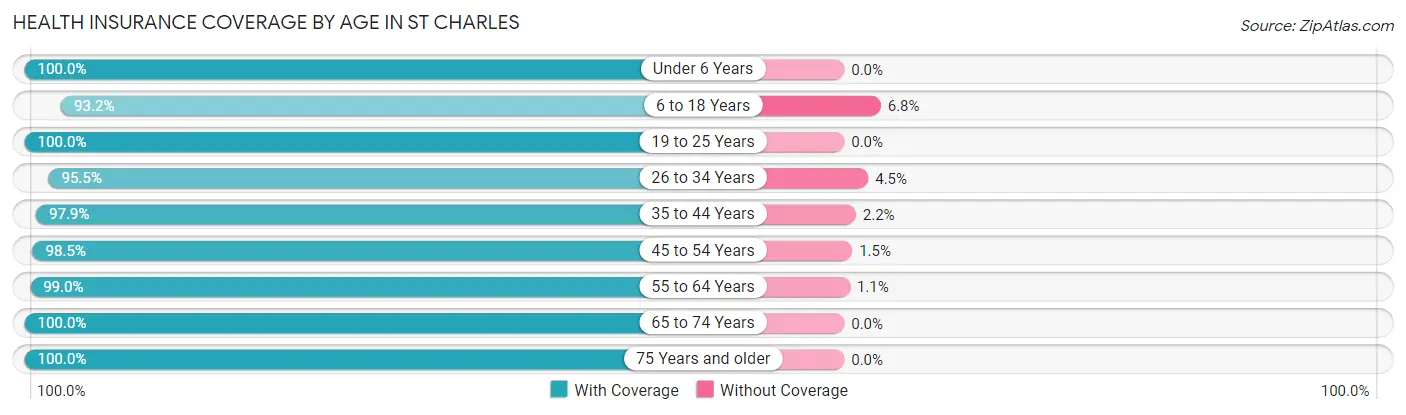
| Age Bracket | With Coverage | Without Coverage |
| Under 6 Years | 286 (100.0%) | 0 (0.0%) |
| 6 to 18 Years | 671 (93.2%) | 49 (6.8%) |
| 19 to 25 Years | 260 (100.0%) | 0 (0.0%) |
| 26 to 34 Years | 449 (95.5%) | 21 (4.5%) |
| 35 to 44 Years | 682 (97.9%) | 15 (2.1%) |
| 45 to 54 Years | 399 (98.5%) | 6 (1.5%) |
| 55 to 64 Years | 568 (99.0%) | 6 (1.1%) |
| 65 to 74 Years | 337 (100.0%) | 0 (0.0%) |
| 75 Years and older | 190 (100.0%) | 0 (0.0%) |
| Total | 3,842 (97.5%) | 97 (2.5%) |
Health Insurance Coverage by Citizenship Status in St Charles
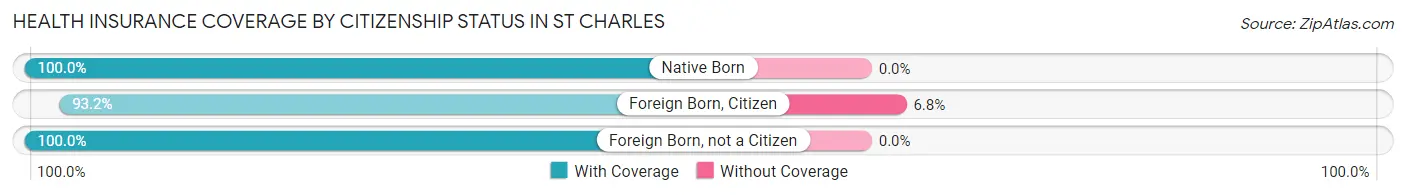
| Citizenship Status | With Coverage | Without Coverage |
| Native Born | 286 (100.0%) | 0 (0.0%) |
| Foreign Born, Citizen | 671 (93.2%) | 49 (6.8%) |
| Foreign Born, not a Citizen | 260 (100.0%) | 0 (0.0%) |
Health Insurance Coverage by Household Income in St Charles
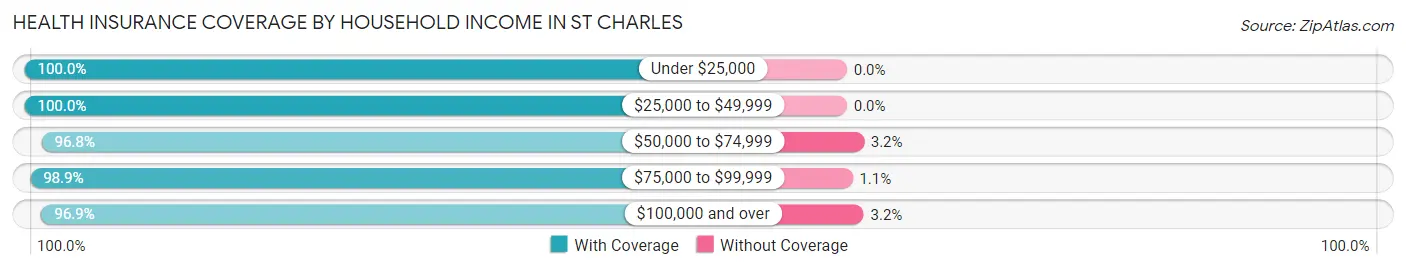
| Household Income | With Coverage | Without Coverage |
| Under $25,000 | 144 (100.0%) | 0 (0.0%) |
| $25,000 to $49,999 | 339 (100.0%) | 0 (0.0%) |
| $50,000 to $74,999 | 457 (96.8%) | 15 (3.2%) |
| $75,000 to $99,999 | 562 (98.9%) | 6 (1.1%) |
| $100,000 and over | 2,340 (96.9%) | 76 (3.2%) |
Public vs Private Health Insurance Coverage by Age in St Charles
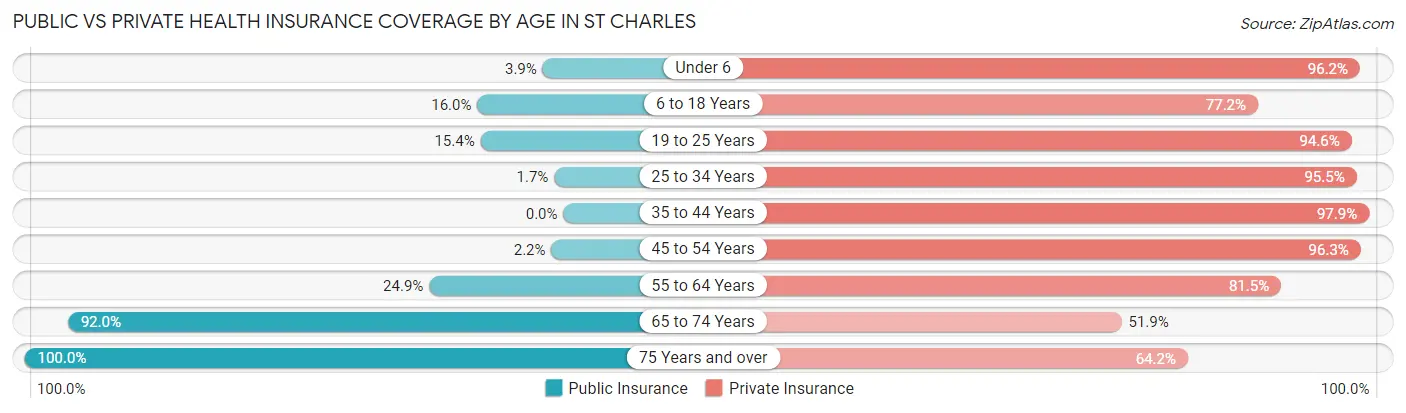
| Age Bracket | Public Insurance | Private Insurance |
| Under 6 | 11 (3.8%) | 275 (96.2%) |
| 6 to 18 Years | 115 (16.0%) | 556 (77.2%) |
| 19 to 25 Years | 40 (15.4%) | 246 (94.6%) |
| 25 to 34 Years | 8 (1.7%) | 449 (95.5%) |
| 35 to 44 Years | 0 (0.0%) | 682 (97.9%) |
| 45 to 54 Years | 9 (2.2%) | 390 (96.3%) |
| 55 to 64 Years | 143 (24.9%) | 468 (81.5%) |
| 65 to 74 Years | 310 (92.0%) | 175 (51.9%) |
| 75 Years and over | 190 (100.0%) | 122 (64.2%) |
| Total | 826 (21.0%) | 3,363 (85.4%) |
Disability Status by Sex by Age in St Charles
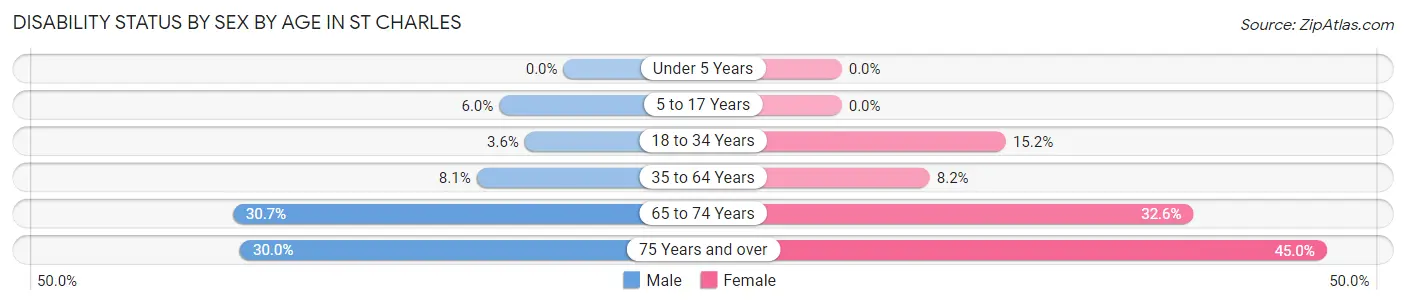
| Age Bracket | Male | Female |
| Under 5 Years | 0 (0.0%) | 0 (0.0%) |
| 5 to 17 Years | 18 (6.0%) | 0 (0.0%) |
| 18 to 34 Years | 17 (3.6%) | 50 (15.2%) |
| 35 to 64 Years | 70 (8.1%) | 66 (8.2%) |
| 65 to 74 Years | 46 (30.7%) | 61 (32.6%) |
| 75 Years and over | 33 (30.0%) | 36 (45.0%) |
Disability Class by Sex by Age in St Charles
Disability Class: Hearing Difficulty
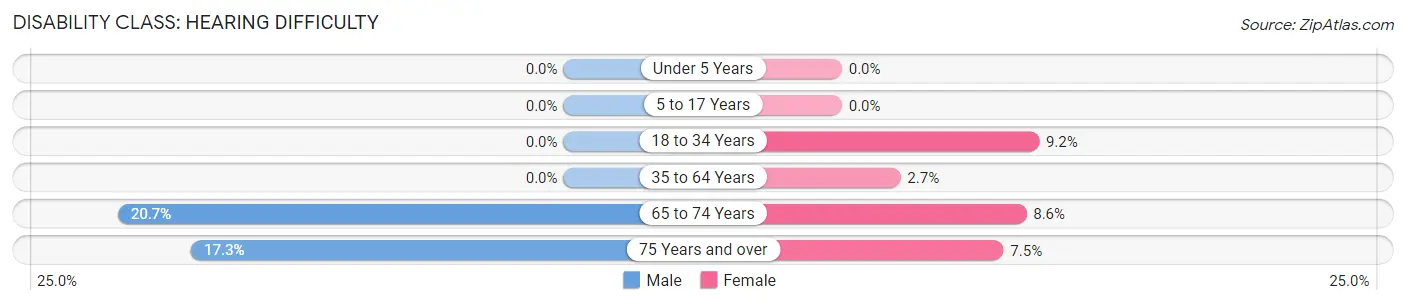
| Age Bracket | Male | Female |
| Under 5 Years | 0 (0.0%) | 0 (0.0%) |
| 5 to 17 Years | 0 (0.0%) | 0 (0.0%) |
| 18 to 34 Years | 0 (0.0%) | 30 (9.1%) |
| 35 to 64 Years | 0 (0.0%) | 22 (2.7%) |
| 65 to 74 Years | 31 (20.7%) | 16 (8.6%) |
| 75 Years and over | 19 (17.3%) | 6 (7.5%) |
Disability Class: Vision Difficulty
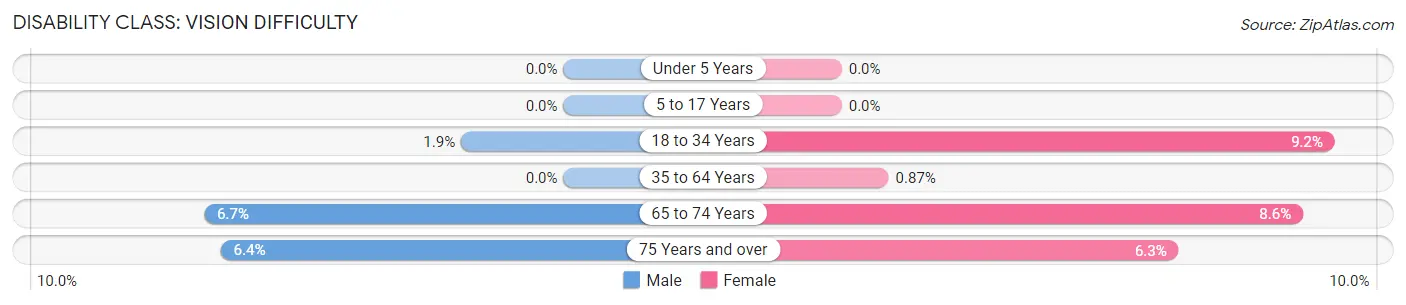
| Age Bracket | Male | Female |
| Under 5 Years | 0 (0.0%) | 0 (0.0%) |
| 5 to 17 Years | 0 (0.0%) | 0 (0.0%) |
| 18 to 34 Years | 9 (1.9%) | 30 (9.1%) |
| 35 to 64 Years | 0 (0.0%) | 7 (0.9%) |
| 65 to 74 Years | 10 (6.7%) | 16 (8.6%) |
| 75 Years and over | 7 (6.4%) | 5 (6.2%) |
Disability Class: Cognitive Difficulty
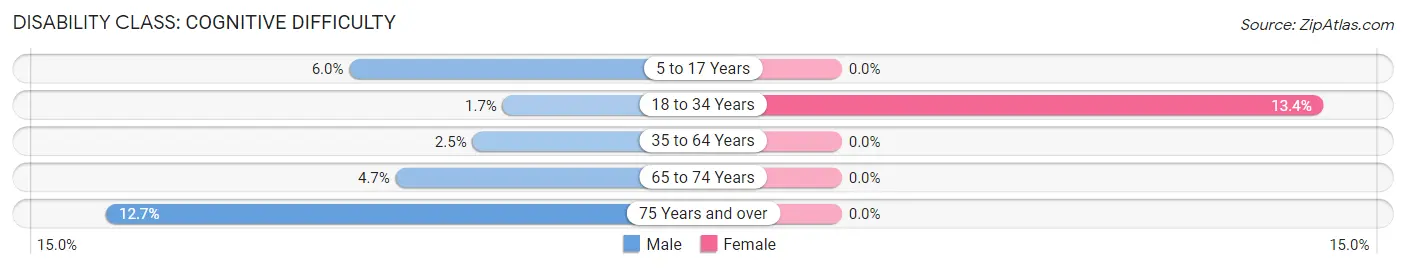
| Age Bracket | Male | Female |
| 5 to 17 Years | 18 (6.0%) | 0 (0.0%) |
| 18 to 34 Years | 8 (1.7%) | 44 (13.4%) |
| 35 to 64 Years | 22 (2.5%) | 0 (0.0%) |
| 65 to 74 Years | 7 (4.7%) | 0 (0.0%) |
| 75 Years and over | 14 (12.7%) | 0 (0.0%) |
Disability Class: Ambulatory Difficulty
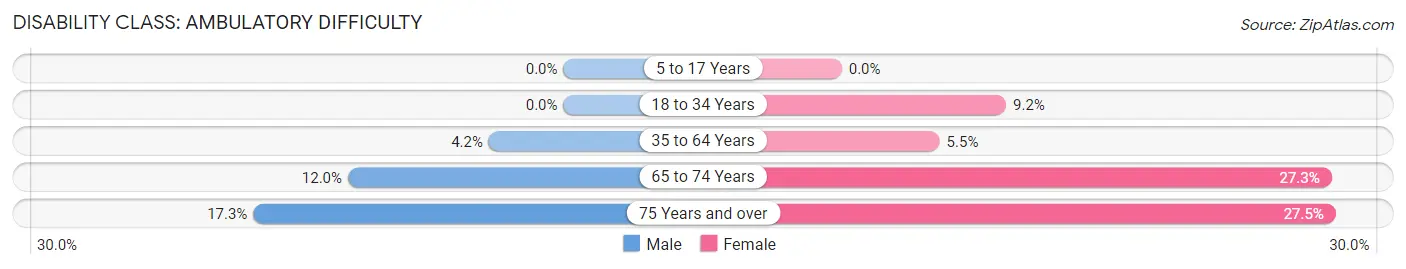
| Age Bracket | Male | Female |
| 5 to 17 Years | 0 (0.0%) | 0 (0.0%) |
| 18 to 34 Years | 0 (0.0%) | 30 (9.1%) |
| 35 to 64 Years | 36 (4.2%) | 44 (5.4%) |
| 65 to 74 Years | 18 (12.0%) | 51 (27.3%) |
| 75 Years and over | 19 (17.3%) | 22 (27.5%) |
Disability Class: Self-Care Difficulty
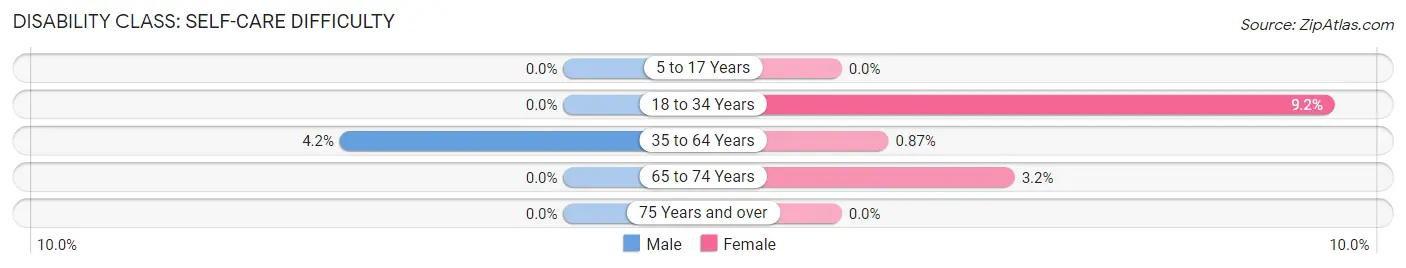
| Age Bracket | Male | Female |
| 5 to 17 Years | 0 (0.0%) | 0 (0.0%) |
| 18 to 34 Years | 0 (0.0%) | 30 (9.1%) |
| 35 to 64 Years | 36 (4.2%) | 7 (0.9%) |
| 65 to 74 Years | 0 (0.0%) | 6 (3.2%) |
| 75 Years and over | 0 (0.0%) | 0 (0.0%) |
Technology Access in St Charles
Computing Device Access in St Charles
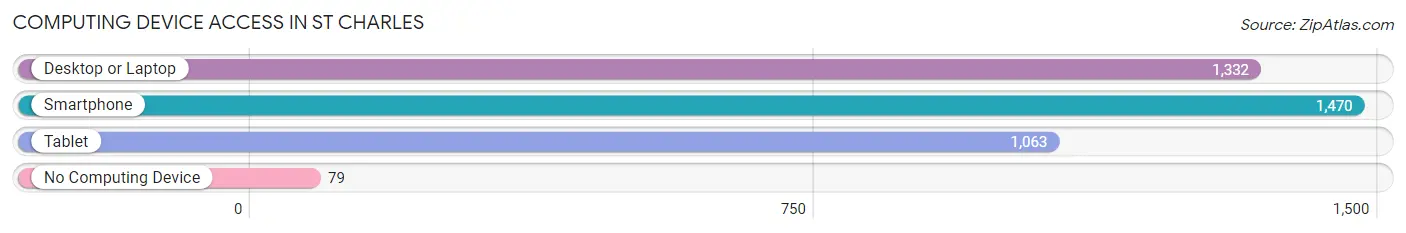
| Device Type | # Households | % Households |
| Desktop or Laptop | 1,332 | 81.4% |
| Smartphone | 1,470 | 89.8% |
| Tablet | 1,063 | 64.9% |
| No Computing Device | 79 | 4.8% |
| Total | 1,637 | 100.0% |
Internet Access in St Charles
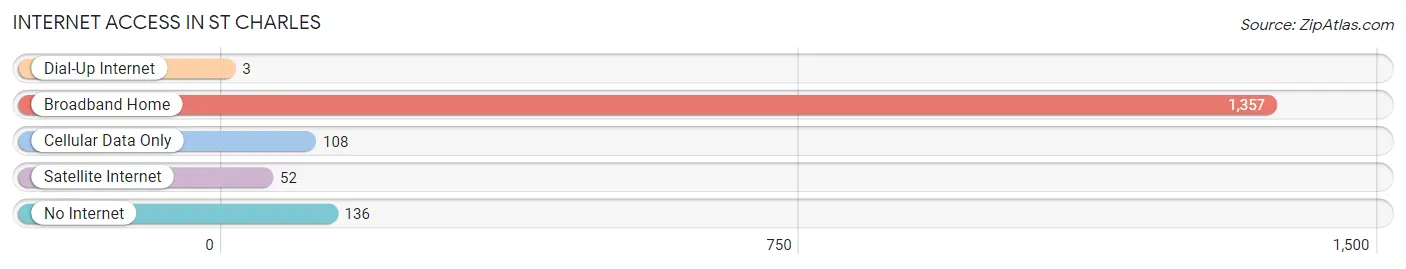
| Internet Type | # Households | % Households |
| Dial-Up Internet | 3 | 0.2% |
| Broadband Home | 1,357 | 82.9% |
| Cellular Data Only | 108 | 6.6% |
| Satellite Internet | 52 | 3.2% |
| No Internet | 136 | 8.3% |
| Total | 1,637 | 100.0% |
St Charles Summary
St. Charles, Minnesota is a small city located in Winona County, in the southeastern corner of the state. It is situated on the banks of the Mississippi River, and is part of the Rochester-Austin-St. Charles metropolitan area. The city has a population of approximately 3,500 people, and is known for its historic downtown area, which is listed on the National Register of Historic Places.
History
The area that is now St. Charles was first settled in 1854 by a group of German immigrants. The town was originally known as “New Germany”, and was later renamed St. Charles in 1856. The city was officially incorporated in 1872.
In the late 19th century, St. Charles was a thriving river port, and was home to a number of industries, including a flour mill, a sawmill, and a brickyard. The city was also home to a number of saloons and brothels, which were popular with the riverboat crews that frequented the area.
In the early 20th century, St. Charles began to decline as the river trade shifted to larger cities. The city’s economy was further hurt by the Great Depression, and many of the businesses in the downtown area closed.
In the 1950s, the city began to experience a resurgence, as new businesses opened and the downtown area was revitalized. The city’s economy has continued to grow in recent years, and St. Charles is now home to a number of businesses, including a number of restaurants, shops, and other services.
Geography
St. Charles is located in southeastern Minnesota, in Winona County. The city is situated on the banks of the Mississippi River, and is part of the Rochester-Austin-St. Charles metropolitan area. The city has a total area of 2.2 square miles, all of which is land.
The city is located in a hilly region, and is surrounded by wooded areas. The city is located near the confluence of the Mississippi and Root Rivers, and is home to a number of parks and recreational areas.
Economy
The economy of St. Charles is largely based on tourism and retail. The city is home to a number of restaurants, shops, and other services, and is a popular destination for visitors to the area. The city is also home to a number of manufacturing and industrial businesses, including a number of food processing plants.
The city is also home to a number of educational institutions, including a community college and a technical college. The city is also home to a number of healthcare facilities, including a hospital and a number of clinics.
Demographics
As of the 2010 census, the population of St. Charles was 3,521. The racial makeup of the city was 95.2% White, 0.7% African American, 0.3% Native American, 0.7% Asian, 0.1% Pacific Islander, 1.2% from other races, and 1.8% from two or more races. Hispanic or Latino of any race were 3.2% of the population.
The median household income in St. Charles was $41,944, and the median family income was $50,917. The per capita income for the city was $20,845. About 8.2% of families and 10.3% of the population were below the poverty line, including 14.2% of those under age 18 and 6.2% of those age 65 or over.
Common Questions
What is Per Capita Income in St Charles?
Per Capita income in St Charles is $49,860.
What is the Median Family Income in St Charles?
Median Family Income in St Charles is $106,897.
What is the Median Household income in St Charles?
Median Household Income in St Charles is $91,326.
What is Income or Wage Gap in St Charles?
Income or Wage Gap in St Charles is 25.0%.
Women in St Charles earn 75.0 cents for every dollar earned by a man.
What is Inequality or Gini Index in St Charles?
Inequality or Gini Index in St Charles is 0.44.
What is the Total Population of St Charles?
Total Population of St Charles is 3,979.
What is the Total Male Population of St Charles?
Total Male Population of St Charles is 2,073.
What is the Total Female Population of St Charles?
Total Female Population of St Charles is 1,906.
What is the Ratio of Males per 100 Females in St Charles?
There are 108.76 Males per 100 Females in St Charles.
What is the Ratio of Females per 100 Males in St Charles?
There are 91.94 Females per 100 Males in St Charles.
What is the Median Population Age in St Charles?
Median Population Age in St Charles is 39.9 Years.
What is the Average Family Size in St Charles
Average Family Size in St Charles is 3.0 People.
What is the Average Household Size in St Charles
Average Household Size in St Charles is 2.4 People.
How Large is the Labor Force in St Charles?
There are 2,319 People in the Labor Forcein in St Charles.
What is the Percentage of People in the Labor Force in St Charles?
75.2% of People are in the Labor Force in St Charles.
What is the Unemployment Rate in St Charles?
Unemployment Rate in St Charles is 2.5%.