Hillsboro, OR Map & Demographics
Hillsboro Map
Hillsboro Overview
$47,232
PER CAPITA INCOME
$110,200
AVG FAMILY INCOME
$98,891
AVG HOUSEHOLD INCOME
35.4%
WAGE / INCOME GAP [ % ]
64.6¢/ $1
WAGE / INCOME GAP [ $ ]
$11,533
FAMILY INCOME DEFICIT
0.40
INEQUALITY / GINI INDEX
106,612
TOTAL POPULATION
53,839
MALE POPULATION
52,773
FEMALE POPULATION
102.02
MALES / 100 FEMALES
98.02
FEMALES / 100 MALES
34.5
MEDIAN AGE
3.1
AVG FAMILY SIZE
2.6
AVG HOUSEHOLD SIZE
60,977
LABOR FORCE [ PEOPLE ]
71.1%
PERCENT IN LABOR FORCE
4.6%
UNEMPLOYMENT RATE
Income in Hillsboro
Income Overview in Hillsboro
Per Capita Income in Hillsboro is $47,232, while median incomes of families and households are $110,200 and $98,891 respectively.
| Characteristic | Number | Measure |
| Per Capita Income | 106,612 | $47,232 |
| Median Family Income | 26,597 | $110,200 |
| Mean Family Income | 26,597 | $137,413 |
| Median Household Income | 40,633 | $98,891 |
| Mean Household Income | 40,633 | $123,148 |
| Income Deficit | 26,597 | $11,533 |
| Wage / Income Gap (%) | 106,612 | 35.38% |
| Wage / Income Gap ($) | 106,612 | 64.62¢ per $1 |
| Gini / Inequality Index | 106,612 | 0.40 |
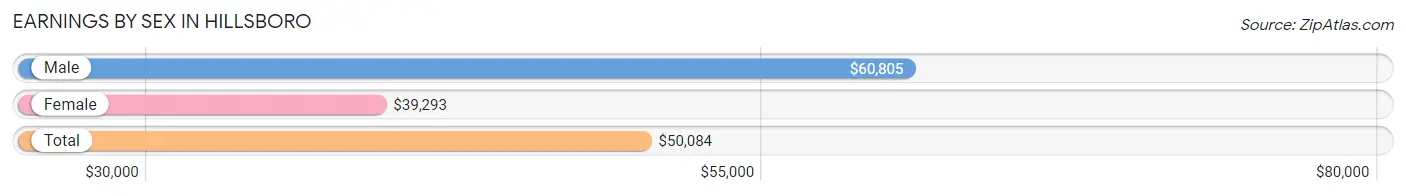
Earnings by Sex in Hillsboro
Average Earnings in Hillsboro are $50,084, $60,805 for men and $39,293 for women, a difference of 35.4%.
| Sex | Number | Average Earnings |
| Male | 34,811 (54.9%) | $60,805 |
| Female | 28,560 (45.1%) | $39,293 |
| Total | 63,371 (100.0%) | $50,084 |
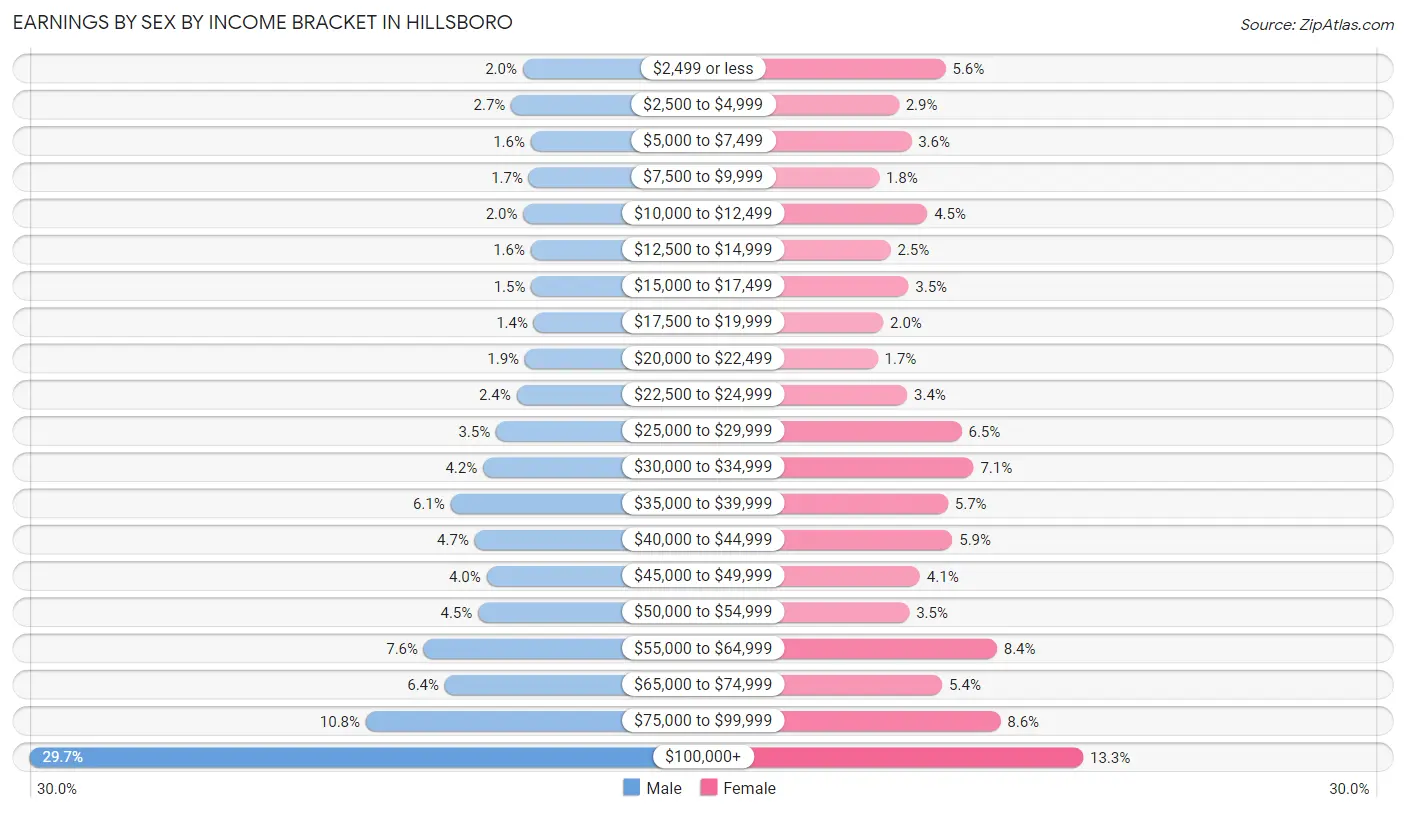
Earnings by Sex by Income Bracket in Hillsboro
The most common earnings brackets in Hillsboro are $100,000+ for men (10,346 | 29.7%) and $100,000+ for women (3,794 | 13.3%).
| Income | Male | Female |
| $2,499 or less | 696 (2.0%) | 1,584 (5.6%) |
| $2,500 to $4,999 | 922 (2.6%) | 835 (2.9%) |
| $5,000 to $7,499 | 538 (1.5%) | 1,035 (3.6%) |
| $7,500 to $9,999 | 577 (1.7%) | 516 (1.8%) |
| $10,000 to $12,499 | 687 (2.0%) | 1,290 (4.5%) |
| $12,500 to $14,999 | 538 (1.5%) | 704 (2.5%) |
| $15,000 to $17,499 | 528 (1.5%) | 987 (3.5%) |
| $17,500 to $19,999 | 482 (1.4%) | 582 (2.0%) |
| $20,000 to $22,499 | 654 (1.9%) | 494 (1.7%) |
| $22,500 to $24,999 | 819 (2.4%) | 968 (3.4%) |
| $25,000 to $29,999 | 1,217 (3.5%) | 1,843 (6.5%) |
| $30,000 to $34,999 | 1,474 (4.2%) | 2,033 (7.1%) |
| $35,000 to $39,999 | 2,110 (6.1%) | 1,622 (5.7%) |
| $40,000 to $44,999 | 1,636 (4.7%) | 1,693 (5.9%) |
| $45,000 to $49,999 | 1,403 (4.0%) | 1,174 (4.1%) |
| $50,000 to $54,999 | 1,569 (4.5%) | 1,003 (3.5%) |
| $55,000 to $64,999 | 2,630 (7.6%) | 2,407 (8.4%) |
| $65,000 to $74,999 | 2,220 (6.4%) | 1,530 (5.4%) |
| $75,000 to $99,999 | 3,765 (10.8%) | 2,466 (8.6%) |
| $100,000+ | 10,346 (29.7%) | 3,794 (13.3%) |
| Total | 34,811 (100.0%) | 28,560 (100.0%) |
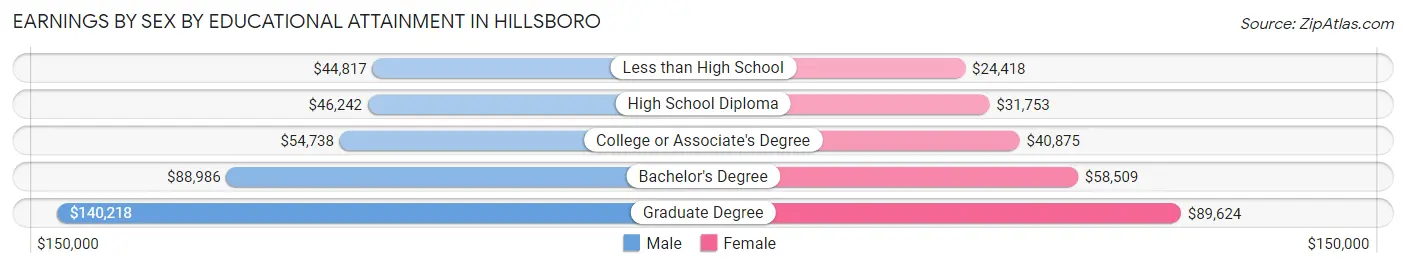
Earnings by Sex by Educational Attainment in Hillsboro
Average earnings in Hillsboro are $68,896 for men and $44,862 for women, a difference of 34.9%. Men with an educational attainment of graduate degree enjoy the highest average annual earnings of $140,218, while those with less than high school education earn the least with $44,817. Women with an educational attainment of graduate degree earn the most with the average annual earnings of $89,624, while those with less than high school education have the smallest earnings of $24,418.
| Educational Attainment | Male Income | Female Income |
| Less than High School | $44,817 | $24,418 |
| High School Diploma | $46,242 | $31,753 |
| College or Associate's Degree | $54,738 | $40,875 |
| Bachelor's Degree | $88,986 | $58,509 |
| Graduate Degree | $140,218 | $89,624 |
| Total | $68,896 | $44,862 |
Family Income in Hillsboro
Family Income Brackets in Hillsboro
According to the Hillsboro family income data, there are 5,851 families falling into the $100,000 to $149,999 income range, which is the most common income bracket and makes up 22.0% of all families. Conversely, the $10,000 to $14,999 income bracket is the least frequent group with only 372 families (1.4%) belonging to this category.
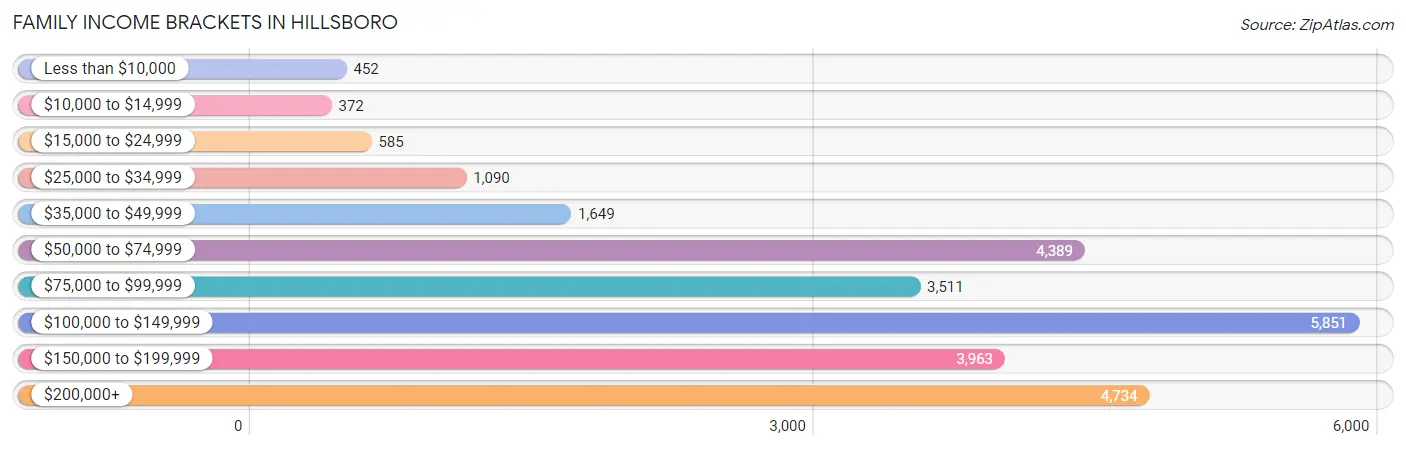
| Income Bracket | # Families | % Families |
| Less than $10,000 | 452 | 1.7% |
| $10,000 to $14,999 | 372 | 1.4% |
| $15,000 to $24,999 | 585 | 2.2% |
| $25,000 to $34,999 | 1,090 | 4.1% |
| $35,000 to $49,999 | 1,649 | 6.2% |
| $50,000 to $74,999 | 4,389 | 16.5% |
| $75,000 to $99,999 | 3,511 | 13.2% |
| $100,000 to $149,999 | 5,851 | 22.0% |
| $150,000 to $199,999 | 3,963 | 14.9% |
| $200,000+ | 4,734 | 17.8% |
Family Income by Famaliy Size in Hillsboro
3-person families (6,412 | 24.1%) account for the highest median family income in Hillsboro with $126,186 per family, while 2-person families (11,886 | 44.7%) have the highest median income of $47,620 per family member.
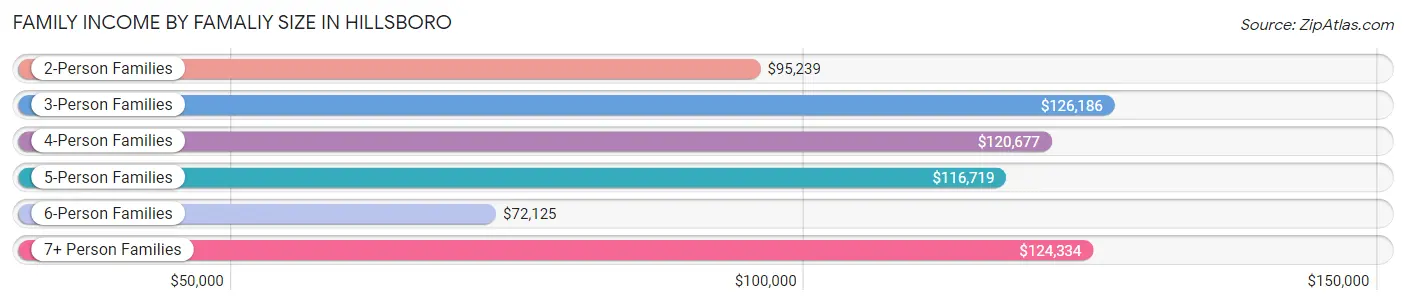
| Income Bracket | # Families | Median Income |
| 2-Person Families | 11,886 (44.7%) | $95,239 |
| 3-Person Families | 6,412 (24.1%) | $126,186 |
| 4-Person Families | 4,984 (18.7%) | $120,677 |
| 5-Person Families | 1,704 (6.4%) | $116,719 |
| 6-Person Families | 1,041 (3.9%) | $72,125 |
| 7+ Person Families | 570 (2.1%) | $124,334 |
| Total | 26,597 (100.0%) | $110,200 |
Family Income by Number of Earners in Hillsboro
The median family income in Hillsboro is $110,200, with families comprising 3+ earners (3,583) having the highest median family income of $137,822, while families with no earners (2,559) have the lowest median family income of $54,007, accounting for 13.5% and 9.6% of families, respectively.
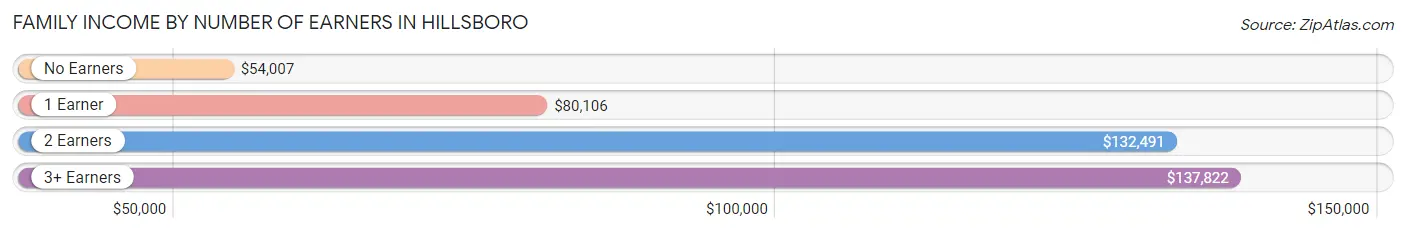
| Number of Earners | # Families | Median Income |
| No Earners | 2,559 (9.6%) | $54,007 |
| 1 Earner | 8,112 (30.5%) | $80,106 |
| 2 Earners | 12,343 (46.4%) | $132,491 |
| 3+ Earners | 3,583 (13.5%) | $137,822 |
| Total | 26,597 (100.0%) | $110,200 |
Household Income in Hillsboro
Household Income Brackets in Hillsboro
With 8,858 households falling in the category, the $100,000 to $149,999 income range is the most frequent in Hillsboro, accounting for 21.8% of all households. In contrast, only 772 households (1.9%) fall into the less than $10,000 income bracket, making it the least populous group.
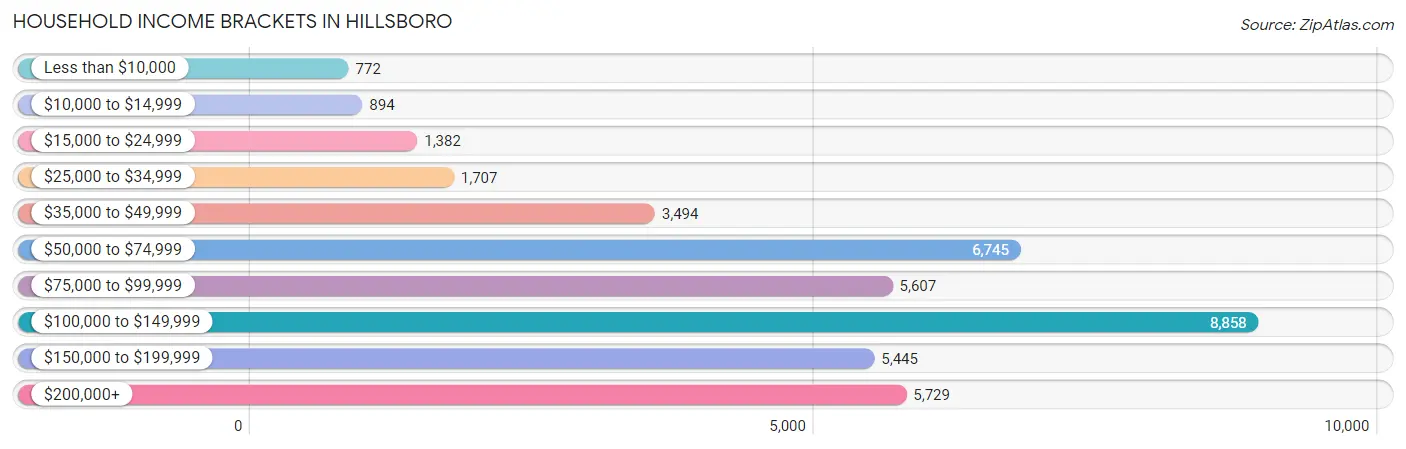
| Income Bracket | # Households | % Households |
| Less than $10,000 | 772 | 1.9% |
| $10,000 to $14,999 | 894 | 2.2% |
| $15,000 to $24,999 | 1,382 | 3.4% |
| $25,000 to $34,999 | 1,707 | 4.2% |
| $35,000 to $49,999 | 3,494 | 8.6% |
| $50,000 to $74,999 | 6,745 | 16.6% |
| $75,000 to $99,999 | 5,607 | 13.8% |
| $100,000 to $149,999 | 8,858 | 21.8% |
| $150,000 to $199,999 | 5,445 | 13.4% |
| $200,000+ | 5,729 | 14.1% |
Household Income by Householder Age in Hillsboro
The median household income in Hillsboro is $98,891, with the highest median household income of $114,685 found in the 45 to 64 years age bracket for the primary householder. A total of 12,635 households (31.1%) fall into this category. Meanwhile, the 65+ years age bracket for the primary householder has the lowest median household income of $61,379, with 6,717 households (16.5%) in this group.
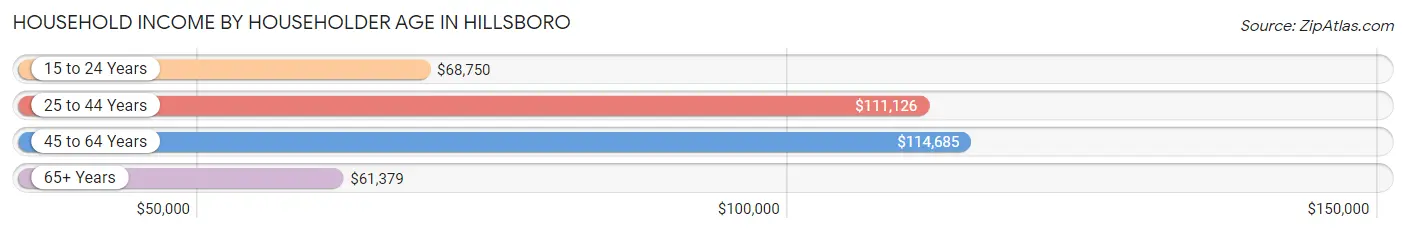
| Income Bracket | # Households | Median Income |
| 15 to 24 Years | 1,702 (4.2%) | $68,750 |
| 25 to 44 Years | 19,579 (48.2%) | $111,126 |
| 45 to 64 Years | 12,635 (31.1%) | $114,685 |
| 65+ Years | 6,717 (16.5%) | $61,379 |
| Total | 40,633 (100.0%) | $98,891 |
Poverty in Hillsboro
Income Below Poverty by Sex and Age in Hillsboro
With 6.4% poverty level for males and 9.4% for females among the residents of Hillsboro, 5 year old males and 18 to 24 year old females are the most vulnerable to poverty, with 111 males (15.4%) and 870 females (17.6%) in their respective age groups living below the poverty level.
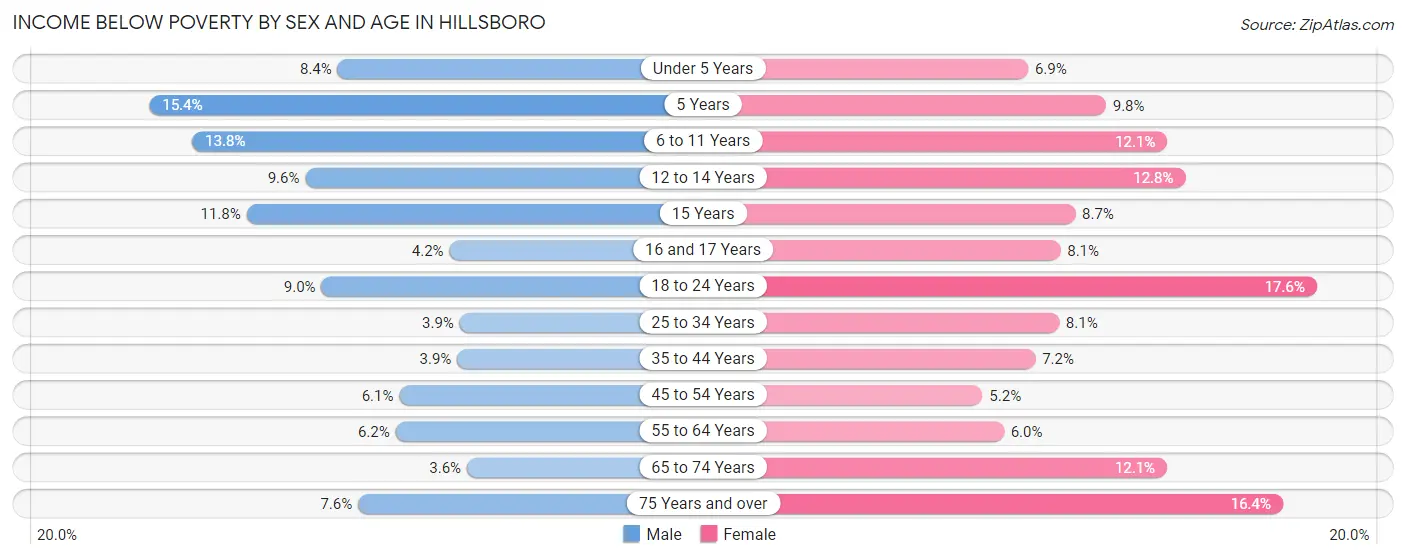
| Age Bracket | Male | Female |
| Under 5 Years | 275 (8.4%) | 213 (6.9%) |
| 5 Years | 111 (15.4%) | 55 (9.8%) |
| 6 to 11 Years | 588 (13.8%) | 463 (12.1%) |
| 12 to 14 Years | 200 (9.6%) | 233 (12.8%) |
| 15 Years | 48 (11.8%) | 51 (8.7%) |
| 16 and 17 Years | 63 (4.2%) | 73 (8.1%) |
| 18 to 24 Years | 385 (9.0%) | 870 (17.6%) |
| 25 to 34 Years | 428 (3.8%) | 846 (8.1%) |
| 35 to 44 Years | 354 (3.9%) | 590 (7.2%) |
| 45 to 54 Years | 385 (6.1%) | 310 (5.2%) |
| 55 to 64 Years | 317 (6.2%) | 320 (6.0%) |
| 65 to 74 Years | 118 (3.6%) | 495 (12.1%) |
| 75 Years and over | 134 (7.6%) | 417 (16.4%) |
| Total | 3,406 (6.4%) | 4,936 (9.4%) |
Income Above Poverty by Sex and Age in Hillsboro
According to the poverty statistics in Hillsboro, males aged 65 to 74 years and females aged 45 to 54 years are the age groups that are most secure financially, with 96.4% of males and 94.8% of females in these age groups living above the poverty line.
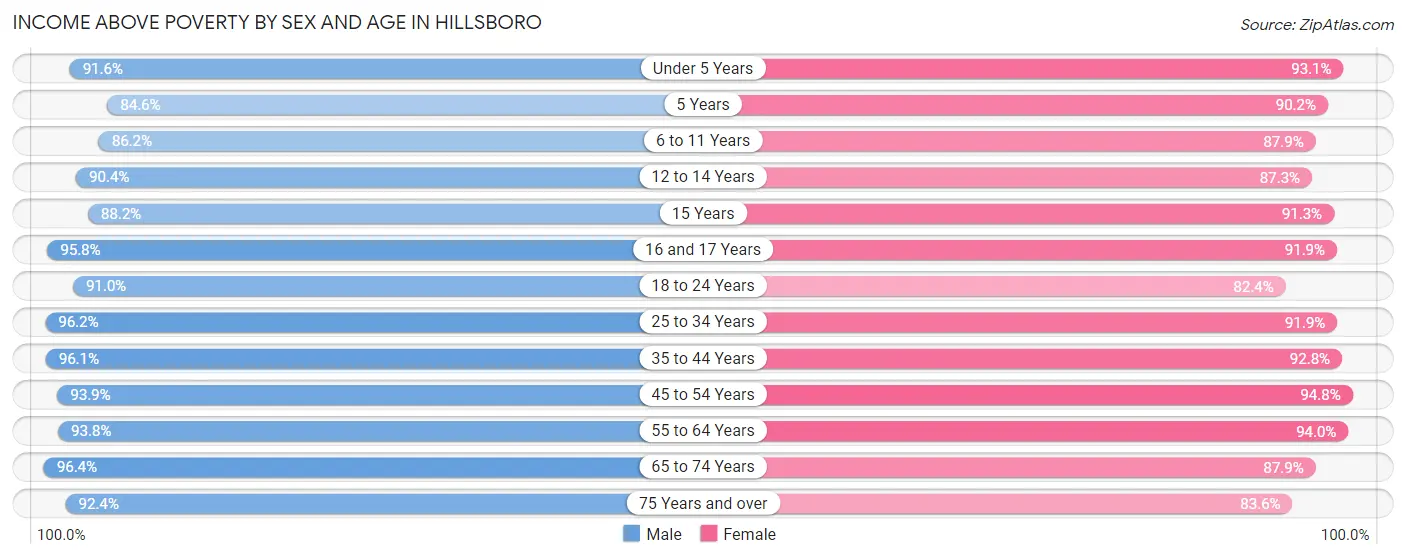
| Age Bracket | Male | Female |
| Under 5 Years | 3,007 (91.6%) | 2,869 (93.1%) |
| 5 Years | 611 (84.6%) | 506 (90.2%) |
| 6 to 11 Years | 3,678 (86.2%) | 3,369 (87.9%) |
| 12 to 14 Years | 1,887 (90.4%) | 1,595 (87.3%) |
| 15 Years | 360 (88.2%) | 538 (91.3%) |
| 16 and 17 Years | 1,428 (95.8%) | 827 (91.9%) |
| 18 to 24 Years | 3,904 (91.0%) | 4,065 (82.4%) |
| 25 to 34 Years | 10,698 (96.2%) | 9,652 (91.9%) |
| 35 to 44 Years | 8,636 (96.1%) | 7,626 (92.8%) |
| 45 to 54 Years | 5,933 (93.9%) | 5,625 (94.8%) |
| 55 to 64 Years | 4,772 (93.8%) | 5,006 (94.0%) |
| 65 to 74 Years | 3,178 (96.4%) | 3,605 (87.9%) |
| 75 Years and over | 1,624 (92.4%) | 2,131 (83.6%) |
| Total | 49,716 (93.6%) | 47,414 (90.6%) |
Income Below Poverty Among Married-Couple Families in Hillsboro
The poverty statistics for married-couple families in Hillsboro show that 2.2% or 458 of the total 20,371 families live below the poverty line. Families with 5 or more children have the highest poverty rate of 17.3%, comprising of 37 families. On the other hand, families with 1 or 2 children have the lowest poverty rate of 1.1%, which includes 78 families.
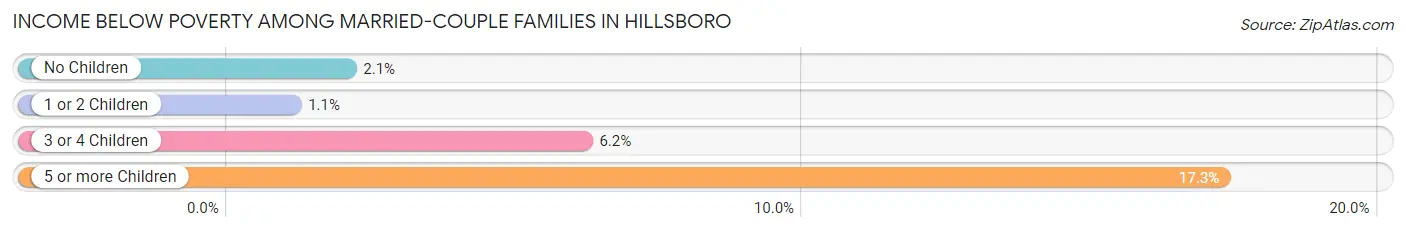
| Children | Above Poverty | Below Poverty |
| No Children | 11,070 (97.9%) | 233 (2.1%) |
| 1 or 2 Children | 6,994 (98.9%) | 78 (1.1%) |
| 3 or 4 Children | 1,672 (93.8%) | 110 (6.2%) |
| 5 or more Children | 177 (82.7%) | 37 (17.3%) |
| Total | 19,913 (97.8%) | 458 (2.2%) |
Income Below Poverty Among Single-Parent Households in Hillsboro
According to the poverty data in Hillsboro, 8.9% or 178 single-father households and 16.5% or 695 single-mother households are living below the poverty line. Among single-father households, those with 5 or more children have the highest poverty rate, with 11 households (36.7%) experiencing poverty. Likewise, among single-mother households, those with 5 or more children have the highest poverty rate, with 57 households (90.5%) falling below the poverty line.
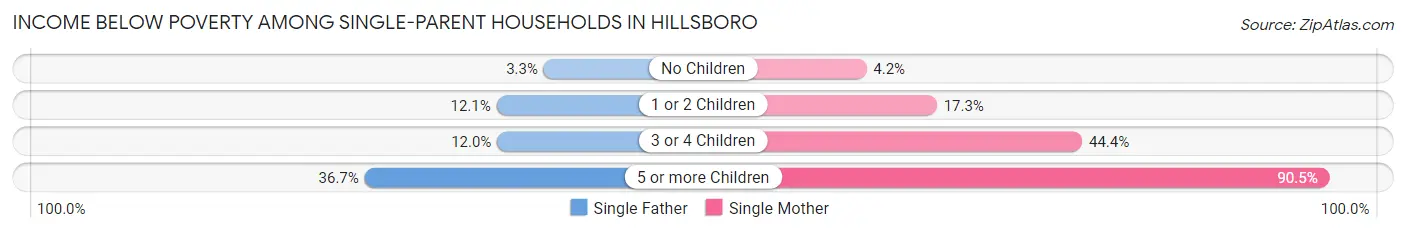
| Children | Single Father | Single Mother |
| No Children | 27 (3.3%) | 74 (4.2%) |
| 1 or 2 Children | 126 (12.1%) | 322 (17.3%) |
| 3 or 4 Children | 14 (12.0%) | 242 (44.4%) |
| 5 or more Children | 11 (36.7%) | 57 (90.5%) |
| Total | 178 (8.9%) | 695 (16.5%) |
Income Below Poverty Among Married-Couple vs Single-Parent Households in Hillsboro
The poverty data for Hillsboro shows that 458 of the married-couple family households (2.2%) and 873 of the single-parent households (14.0%) are living below the poverty level. Within the married-couple family households, those with 5 or more children have the highest poverty rate, with 37 households (17.3%) falling below the poverty line. Among the single-parent households, those with 5 or more children have the highest poverty rate, with 68 household (73.1%) living below poverty.
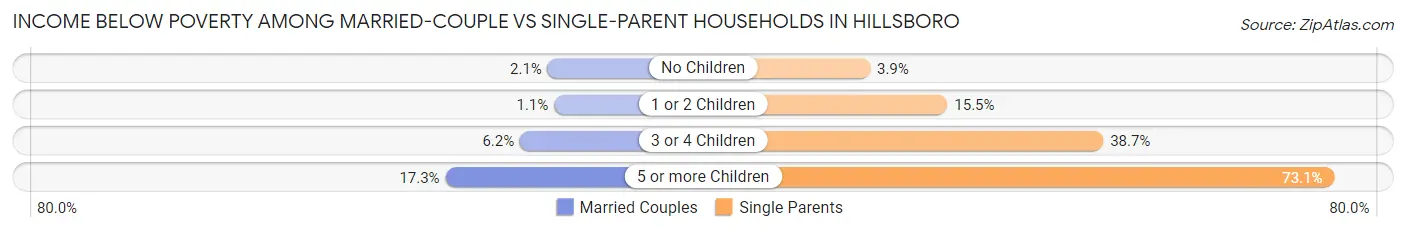
| Children | Married-Couple Families | Single-Parent Households |
| No Children | 233 (2.1%) | 101 (3.9%) |
| 1 or 2 Children | 78 (1.1%) | 448 (15.4%) |
| 3 or 4 Children | 110 (6.2%) | 256 (38.7%) |
| 5 or more Children | 37 (17.3%) | 68 (73.1%) |
| Total | 458 (2.2%) | 873 (14.0%) |
Race in Hillsboro
The most populous races in Hillsboro are White / Caucasian (65,875 | 61.8%), Hispanic or Latino (25,585 | 24.0%), and Two or more Races (14,647 | 13.7%).
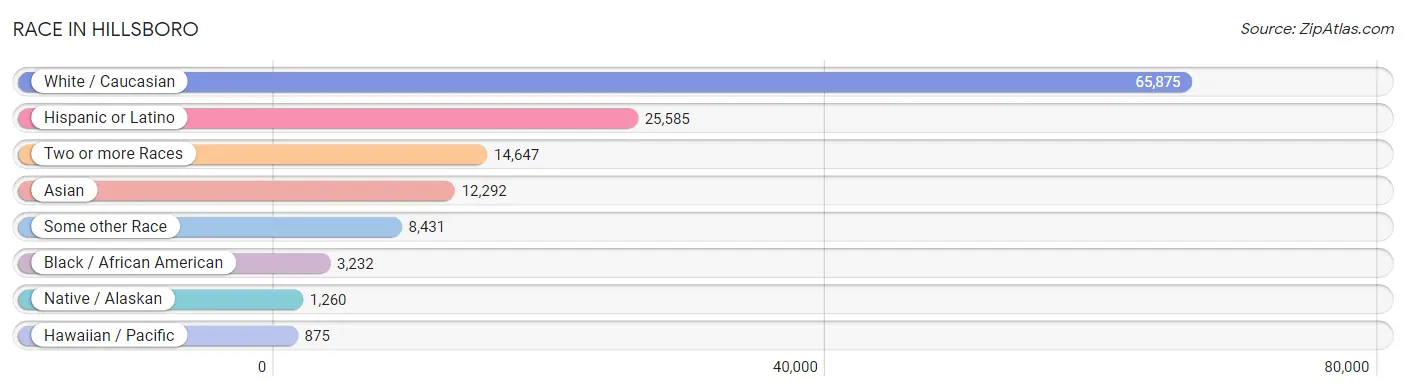
| Race | # Population | % Population |
| Asian | 12,292 | 11.5% |
| Black / African American | 3,232 | 3.0% |
| Hawaiian / Pacific | 875 | 0.8% |
| Hispanic or Latino | 25,585 | 24.0% |
| Native / Alaskan | 1,260 | 1.2% |
| White / Caucasian | 65,875 | 61.8% |
| Two or more Races | 14,647 | 13.7% |
| Some other Race | 8,431 | 7.9% |
| Total | 106,612 | 100.0% |
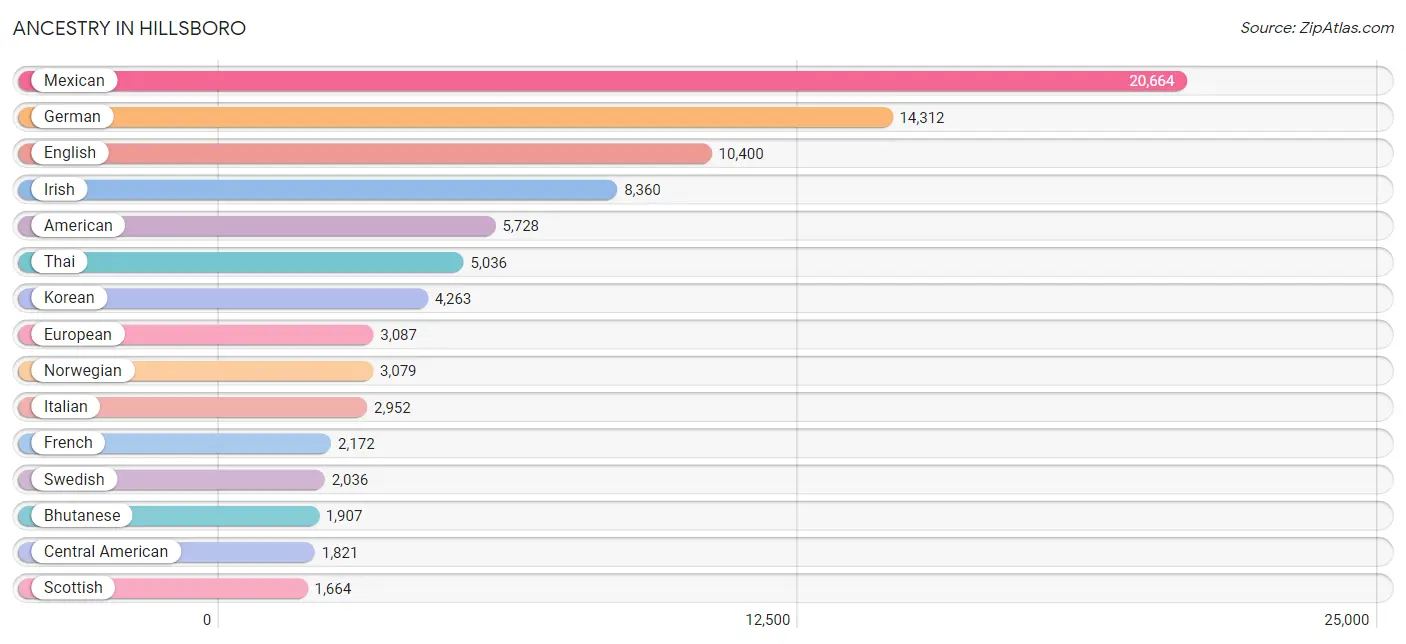
Ancestry in Hillsboro
The most populous ancestries reported in Hillsboro are Mexican (20,664 | 19.4%), German (14,312 | 13.4%), English (10,400 | 9.8%), Irish (8,360 | 7.8%), and American (5,728 | 5.4%), together accounting for 55.8% of all Hillsboro residents.
| Ancestry | # Population | % Population |
| African | 560 | 0.5% |
| Alaska Native | 4 | 0.0% |
| Alsatian | 6 | 0.0% |
| American | 5,728 | 5.4% |
| Apache | 55 | 0.1% |
| Arab | 433 | 0.4% |
| Argentinean | 96 | 0.1% |
| Armenian | 164 | 0.2% |
| Assyrian / Chaldean / Syriac | 34 | 0.0% |
| Australian | 131 | 0.1% |
| Austrian | 282 | 0.3% |
| Bangladeshi | 320 | 0.3% |
| Basque | 17 | 0.0% |
| Belgian | 67 | 0.1% |
| Bhutanese | 1,907 | 1.8% |
| Blackfeet | 69 | 0.1% |
| Bolivian | 56 | 0.1% |
| Brazilian | 98 | 0.1% |
| British | 1,115 | 1.1% |
| Bulgarian | 26 | 0.0% |
| Burmese | 1,269 | 1.2% |
| Cajun | 11 | 0.0% |
| Canadian | 360 | 0.3% |
| Celtic | 12 | 0.0% |
| Central American | 1,821 | 1.7% |
| Central American Indian | 115 | 0.1% |
| Cherokee | 417 | 0.4% |
| Chilean | 11 | 0.0% |
| Chippewa | 97 | 0.1% |
| Choctaw | 128 | 0.1% |
| Colombian | 133 | 0.1% |
| Comanche | 31 | 0.0% |
| Costa Rican | 283 | 0.3% |
| Cree | 7 | 0.0% |
| Creek | 5 | 0.0% |
| Croatian | 94 | 0.1% |
| Cuban | 566 | 0.5% |
| Cypriot | 13 | 0.0% |
| Czech | 484 | 0.4% |
| Czechoslovakian | 20 | 0.0% |
| Danish | 718 | 0.7% |
| Dominican | 78 | 0.1% |
| Dutch | 1,259 | 1.2% |
| Eastern European | 251 | 0.2% |
| Ecuadorian | 110 | 0.1% |
| Egyptian | 38 | 0.0% |
| English | 10,400 | 9.8% |
| Estonian | 9 | 0.0% |
| Ethiopian | 33 | 0.0% |
| European | 3,087 | 2.9% |
| Filipino | 55 | 0.1% |
| Finnish | 452 | 0.4% |
| French | 2,172 | 2.0% |
| French Canadian | 409 | 0.4% |
| German | 14,312 | 13.4% |
| Ghanaian | 342 | 0.3% |
| Greek | 211 | 0.2% |
| Guamanian / Chamorro | 204 | 0.2% |
| Guatemalan | 751 | 0.7% |
| Guyanese | 9 | 0.0% |
| Haitian | 122 | 0.1% |
| Hmong | 10 | 0.0% |
| Honduran | 231 | 0.2% |
| Houma | 17 | 0.0% |
| Hungarian | 329 | 0.3% |
| Icelander | 12 | 0.0% |
| Indian (Asian) | 1,657 | 1.5% |
| Iranian | 150 | 0.1% |
| Iraqi | 157 | 0.2% |
| Irish | 8,360 | 7.8% |
| Iroquois | 4 | 0.0% |
| Italian | 2,952 | 2.8% |
| Jamaican | 426 | 0.4% |
| Japanese | 460 | 0.4% |
| Kenyan | 29 | 0.0% |
| Korean | 4,263 | 4.0% |
| Laotian | 19 | 0.0% |
| Latvian | 64 | 0.1% |
| Lebanese | 33 | 0.0% |
| Lithuanian | 66 | 0.1% |
| Malaysian | 205 | 0.2% |
| Maltese | 15 | 0.0% |
| Mexican | 20,664 | 19.4% |
| Mexican American Indian | 552 | 0.5% |
| Mongolian | 9 | 0.0% |
| Moroccan | 72 | 0.1% |
| Native Hawaiian | 1,353 | 1.3% |
| Navajo | 104 | 0.1% |
| Nepalese | 91 | 0.1% |
| New Zealander | 6 | 0.0% |
| Nicaraguan | 67 | 0.1% |
| Nigerian | 192 | 0.2% |
| Northern European | 386 | 0.4% |
| Norwegian | 3,079 | 2.9% |
| Okinawan | 36 | 0.0% |
| Osage | 3 | 0.0% |
| Paiute | 121 | 0.1% |
| Pakistani | 84 | 0.1% |
| Palestinian | 25 | 0.0% |
| Panamanian | 273 | 0.3% |
| Pennsylvania German | 14 | 0.0% |
| Peruvian | 151 | 0.1% |
| Polish | 1,326 | 1.2% |
| Portuguese | 325 | 0.3% |
| Potawatomi | 25 | 0.0% |
| Pueblo | 20 | 0.0% |
| Puerto Rican | 629 | 0.6% |
| Romanian | 283 | 0.3% |
| Russian | 545 | 0.5% |
| Salvadoran | 212 | 0.2% |
| Samoan | 101 | 0.1% |
| Scandinavian | 750 | 0.7% |
| Scotch-Irish | 1,114 | 1.0% |
| Scottish | 1,664 | 1.6% |
| Serbian | 195 | 0.2% |
| Sioux | 28 | 0.0% |
| Slavic | 15 | 0.0% |
| Slovak | 18 | 0.0% |
| Slovene | 18 | 0.0% |
| Somali | 85 | 0.1% |
| South African | 35 | 0.0% |
| South American | 583 | 0.5% |
| South American Indian | 56 | 0.1% |
| Spaniard | 385 | 0.4% |
| Spanish | 323 | 0.3% |
| Spanish American | 15 | 0.0% |
| Spanish American Indian | 18 | 0.0% |
| Sri Lankan | 1,393 | 1.3% |
| Subsaharan African | 1,369 | 1.3% |
| Swedish | 2,036 | 1.9% |
| Swiss | 765 | 0.7% |
| Syrian | 5 | 0.0% |
| Thai | 5,036 | 4.7% |
| Tlingit-Haida | 39 | 0.0% |
| Tongan | 1 | 0.0% |
| Trinidadian and Tobagonian | 15 | 0.0% |
| Turkish | 244 | 0.2% |
| Ukrainian | 224 | 0.2% |
| Venezuelan | 26 | 0.0% |
| Vietnamese | 176 | 0.2% |
| Welsh | 489 | 0.5% |
| West Indian | 155 | 0.2% |
| Yakama | 17 | 0.0% |
| Yaqui | 114 | 0.1% |
| Yugoslavian | 5 | 0.0% | View All 145 Rows |
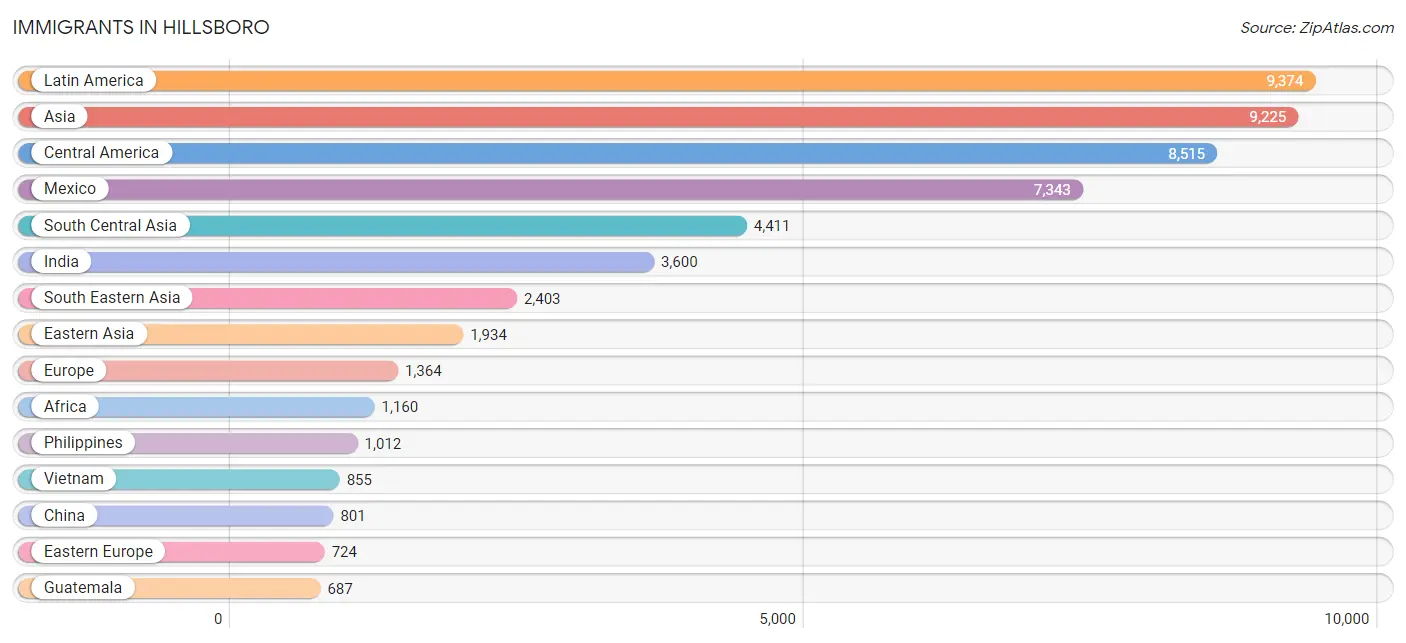
Immigrants in Hillsboro
The most numerous immigrant groups reported in Hillsboro came from Latin America (9,374 | 8.8%), Asia (9,225 | 8.6%), Central America (8,515 | 8.0%), Mexico (7,343 | 6.9%), and South Central Asia (4,411 | 4.1%), together accounting for 36.5% of all Hillsboro residents.
| Immigration Origin | # Population | % Population |
| Afghanistan | 150 | 0.1% |
| Africa | 1,160 | 1.1% |
| Argentina | 47 | 0.0% |
| Armenia | 38 | 0.0% |
| Asia | 9,225 | 8.6% |
| Australia | 46 | 0.0% |
| Austria | 7 | 0.0% |
| Bangladesh | 209 | 0.2% |
| Belarus | 39 | 0.0% |
| Brazil | 71 | 0.1% |
| Bulgaria | 26 | 0.0% |
| Cambodia | 200 | 0.2% |
| Cameroon | 70 | 0.1% |
| Canada | 392 | 0.4% |
| Caribbean | 470 | 0.4% |
| Central America | 8,515 | 8.0% |
| China | 801 | 0.7% |
| Colombia | 70 | 0.1% |
| Costa Rica | 186 | 0.2% |
| Cuba | 60 | 0.1% |
| Czechoslovakia | 105 | 0.1% |
| Denmark | 14 | 0.0% |
| Eastern Africa | 176 | 0.2% |
| Eastern Asia | 1,934 | 1.8% |
| Eastern Europe | 724 | 0.7% |
| Ecuador | 50 | 0.1% |
| Egypt | 23 | 0.0% |
| El Salvador | 80 | 0.1% |
| England | 92 | 0.1% |
| Eritrea | 9 | 0.0% |
| Ethiopia | 44 | 0.0% |
| Europe | 1,364 | 1.3% |
| Fiji | 191 | 0.2% |
| France | 51 | 0.1% |
| Germany | 148 | 0.1% |
| Ghana | 352 | 0.3% |
| Greece | 28 | 0.0% |
| Guatemala | 687 | 0.6% |
| Honduras | 132 | 0.1% |
| Hong Kong | 126 | 0.1% |
| Hungary | 25 | 0.0% |
| India | 3,600 | 3.4% |
| Indonesia | 11 | 0.0% |
| Iran | 102 | 0.1% |
| Iraq | 153 | 0.1% |
| Ireland | 95 | 0.1% |
| Israel | 59 | 0.1% |
| Italy | 30 | 0.0% |
| Jamaica | 400 | 0.4% |
| Japan | 549 | 0.5% |
| Jordan | 16 | 0.0% |
| Kazakhstan | 100 | 0.1% |
| Kenya | 52 | 0.1% |
| Korea | 584 | 0.5% |
| Kuwait | 4 | 0.0% |
| Laos | 217 | 0.2% |
| Latin America | 9,374 | 8.8% |
| Lebanon | 21 | 0.0% |
| Lithuania | 10 | 0.0% |
| Malaysia | 71 | 0.1% |
| Mexico | 7,343 | 6.9% |
| Middle Africa | 115 | 0.1% |
| Moldova | 12 | 0.0% |
| Morocco | 124 | 0.1% |
| Nepal | 129 | 0.1% |
| Netherlands | 31 | 0.0% |
| Nicaragua | 47 | 0.0% |
| Nigeria | 269 | 0.3% |
| Northern Africa | 147 | 0.1% |
| Northern Europe | 322 | 0.3% |
| Norway | 18 | 0.0% |
| Oceania | 262 | 0.3% |
| Pakistan | 71 | 0.1% |
| Panama | 40 | 0.0% |
| Peru | 151 | 0.1% |
| Philippines | 1,012 | 0.9% |
| Poland | 75 | 0.1% |
| Portugal | 14 | 0.0% |
| Romania | 120 | 0.1% |
| Russia | 168 | 0.2% |
| Saudi Arabia | 4 | 0.0% |
| Serbia | 64 | 0.1% |
| Singapore | 12 | 0.0% |
| Somalia | 71 | 0.1% |
| South Africa | 83 | 0.1% |
| South America | 389 | 0.4% |
| South Central Asia | 4,411 | 4.1% |
| South Eastern Asia | 2,403 | 2.2% |
| Southern Europe | 72 | 0.1% |
| Sri Lanka | 50 | 0.1% |
| Sweden | 31 | 0.0% |
| Switzerland | 9 | 0.0% |
| Taiwan | 133 | 0.1% |
| Thailand | 25 | 0.0% |
| Trinidad and Tobago | 10 | 0.0% |
| Turkey | 168 | 0.2% |
| Ukraine | 68 | 0.1% |
| Vietnam | 855 | 0.8% |
| Western Africa | 639 | 0.6% |
| Western Asia | 477 | 0.4% |
| Western Europe | 246 | 0.2% |
| Zaire | 45 | 0.0% | View All 102 Rows |
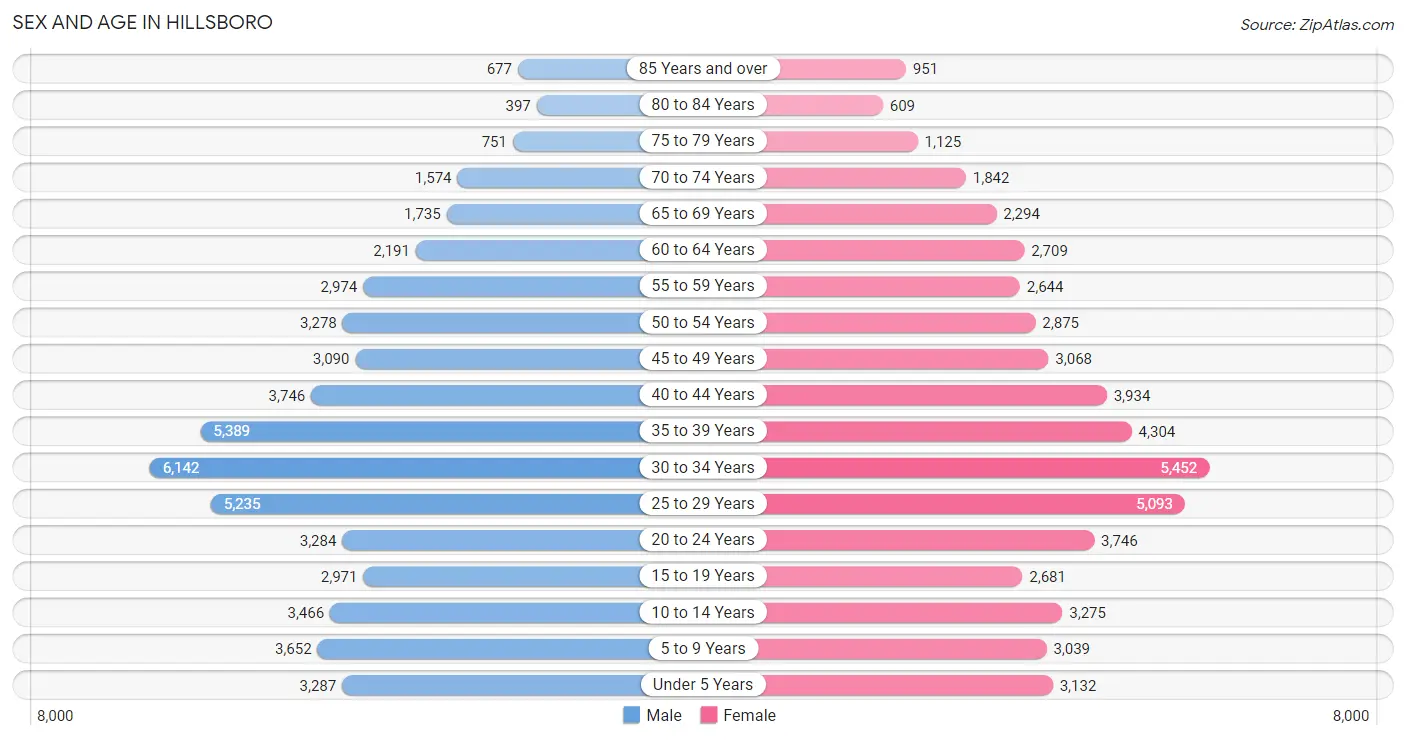
Sex and Age in Hillsboro
Sex and Age in Hillsboro
The most populous age groups in Hillsboro are 30 to 34 Years (6,142 | 11.4%) for men and 30 to 34 Years (5,452 | 10.3%) for women.
| Age Bracket | Male | Female |
| Under 5 Years | 3,287 (6.1%) | 3,132 (5.9%) |
| 5 to 9 Years | 3,652 (6.8%) | 3,039 (5.8%) |
| 10 to 14 Years | 3,466 (6.4%) | 3,275 (6.2%) |
| 15 to 19 Years | 2,971 (5.5%) | 2,681 (5.1%) |
| 20 to 24 Years | 3,284 (6.1%) | 3,746 (7.1%) |
| 25 to 29 Years | 5,235 (9.7%) | 5,093 (9.7%) |
| 30 to 34 Years | 6,142 (11.4%) | 5,452 (10.3%) |
| 35 to 39 Years | 5,389 (10.0%) | 4,304 (8.2%) |
| 40 to 44 Years | 3,746 (7.0%) | 3,934 (7.4%) |
| 45 to 49 Years | 3,090 (5.7%) | 3,068 (5.8%) |
| 50 to 54 Years | 3,278 (6.1%) | 2,875 (5.4%) |
| 55 to 59 Years | 2,974 (5.5%) | 2,644 (5.0%) |
| 60 to 64 Years | 2,191 (4.1%) | 2,709 (5.1%) |
| 65 to 69 Years | 1,735 (3.2%) | 2,294 (4.3%) |
| 70 to 74 Years | 1,574 (2.9%) | 1,842 (3.5%) |
| 75 to 79 Years | 751 (1.4%) | 1,125 (2.1%) |
| 80 to 84 Years | 397 (0.7%) | 609 (1.1%) |
| 85 Years and over | 677 (1.3%) | 951 (1.8%) |
| Total | 53,839 (100.0%) | 52,773 (100.0%) |
Families and Households in Hillsboro
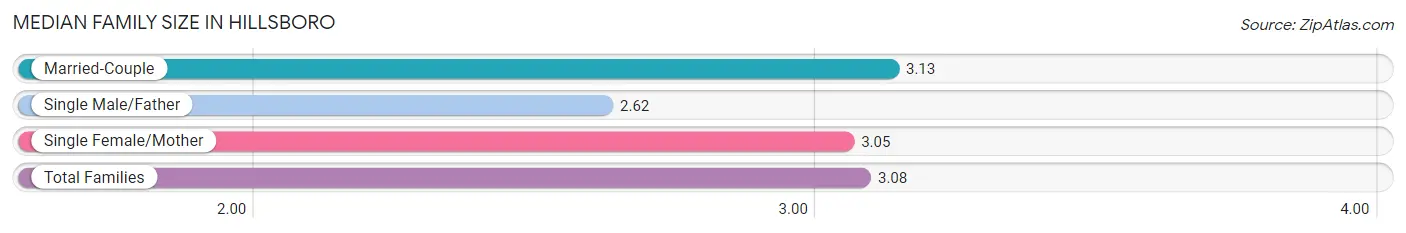
Median Family Size in Hillsboro
The median family size in Hillsboro is 3.08 persons per family, with married-couple families (20,371 | 76.6%) accounting for the largest median family size of 3.13 persons per family. On the other hand, single male/father families (2,010 | 7.6%) represent the smallest median family size with 2.62 persons per family.
| Family Type | # Families | Family Size |
| Married-Couple | 20,371 (76.6%) | 3.13 |
| Single Male/Father | 2,010 (7.6%) | 2.62 |
| Single Female/Mother | 4,216 (15.9%) | 3.05 |
| Total Families | 26,597 (100.0%) | 3.08 |
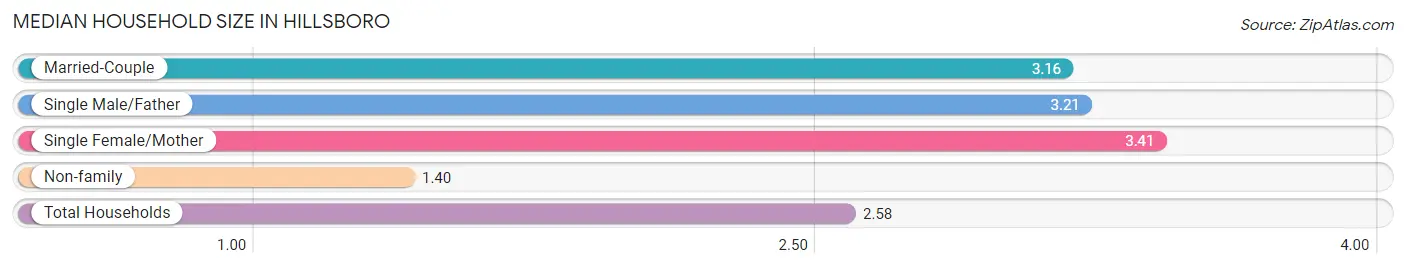
Median Household Size in Hillsboro
The median household size in Hillsboro is 2.58 persons per household, with single female/mother households (4,216 | 10.4%) accounting for the largest median household size of 3.41 persons per household. non-family households (14,036 | 34.5%) represent the smallest median household size with 1.40 persons per household.
| Household Type | # Households | Household Size |
| Married-Couple | 20,371 (50.1%) | 3.16 |
| Single Male/Father | 2,010 (5.0%) | 3.21 |
| Single Female/Mother | 4,216 (10.4%) | 3.41 |
| Non-family | 14,036 (34.5%) | 1.40 |
| Total Households | 40,633 (100.0%) | 2.58 |
Household Size by Marriage Status in Hillsboro
Out of a total of 40,633 households in Hillsboro, 26,597 (65.5%) are family households, while 14,036 (34.5%) are nonfamily households. The most numerous type of family households are 2-person households, comprising 10,518, and the most common type of nonfamily households are 1-person households, comprising 9,690.
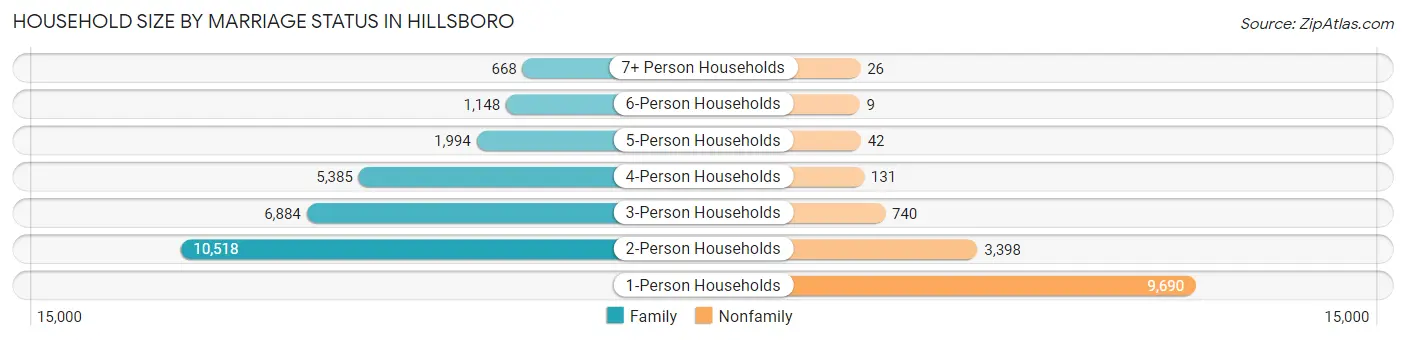
| Household Size | Family Households | Nonfamily Households |
| 1-Person Households | - | 9,690 (23.8%) |
| 2-Person Households | 10,518 (25.9%) | 3,398 (8.4%) |
| 3-Person Households | 6,884 (16.9%) | 740 (1.8%) |
| 4-Person Households | 5,385 (13.3%) | 131 (0.3%) |
| 5-Person Households | 1,994 (4.9%) | 42 (0.1%) |
| 6-Person Households | 1,148 (2.8%) | 9 (0.0%) |
| 7+ Person Households | 668 (1.6%) | 26 (0.1%) |
| Total | 26,597 (65.5%) | 14,036 (34.5%) |
Female Fertility in Hillsboro
Fertility by Age in Hillsboro
Average fertility rate in Hillsboro is 41.0 births per 1,000 women. Women in the age bracket of 20 to 34 years have the highest fertility rate with 57.0 births per 1,000 women. Women in the age bracket of 20 to 34 years acount for 69.4% of all women with births.
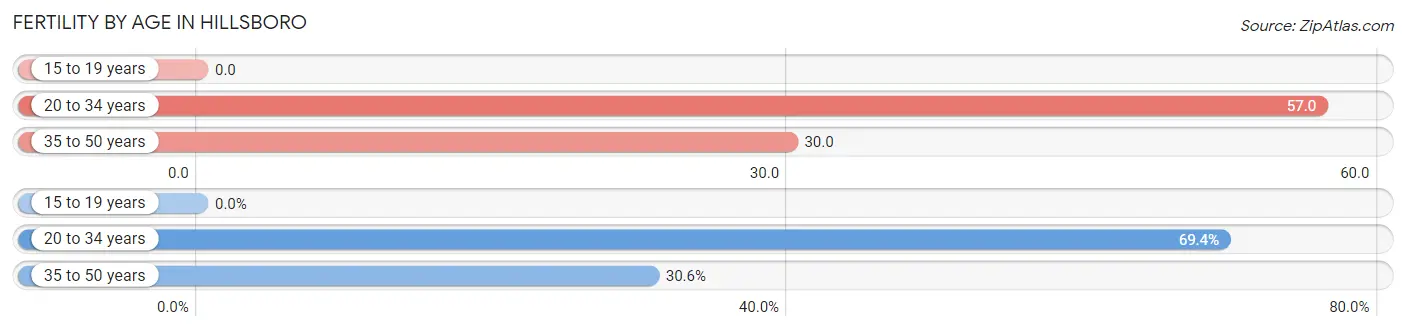
| Age Bracket | Women with Births | Births / 1,000 Women |
| 15 to 19 years | 0 (0.0%) | 0.0 |
| 20 to 34 years | 819 (69.4%) | 57.0 |
| 35 to 50 years | 361 (30.6%) | 30.0 |
| Total | 1,180 (100.0%) | 41.0 |
Fertility by Age by Marriage Status in Hillsboro
82.6% of women with births (1,180) in Hillsboro are married. The highest percentage of unmarried women with births falls into 20 to 34 years age bracket with 23.4% of them unmarried at the time of birth, while the lowest percentage of unmarried women with births belong to 35 to 50 years age bracket with 3.6% of them unmarried.
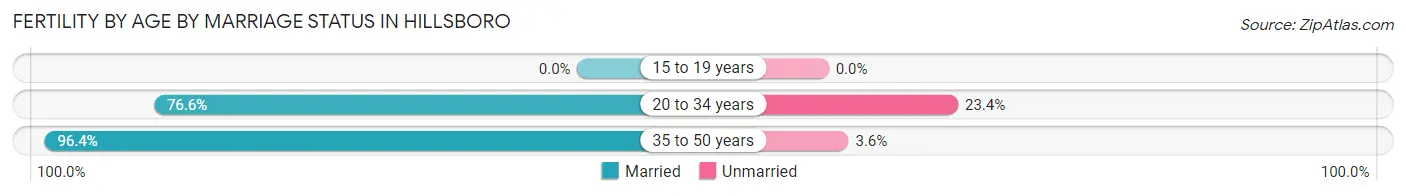
| Age Bracket | Married | Unmarried |
| 15 to 19 years | 0 (0.0%) | 0 (0.0%) |
| 20 to 34 years | 627 (76.6%) | 192 (23.4%) |
| 35 to 50 years | 348 (96.4%) | 13 (3.6%) |
| Total | 975 (82.6%) | 205 (17.4%) |
Fertility by Education in Hillsboro
Average fertility rate in Hillsboro is 41.0 births per 1,000 women. Women with the education attainment of graduate degree have the highest fertility rate of 69.0 births per 1,000 women, while women with the education attainment of college or associate's degree have the lowest fertility at 14.0 births per 1,000 women. Women with the education attainment of bachelor's degree represent 30.3% of all women with births.
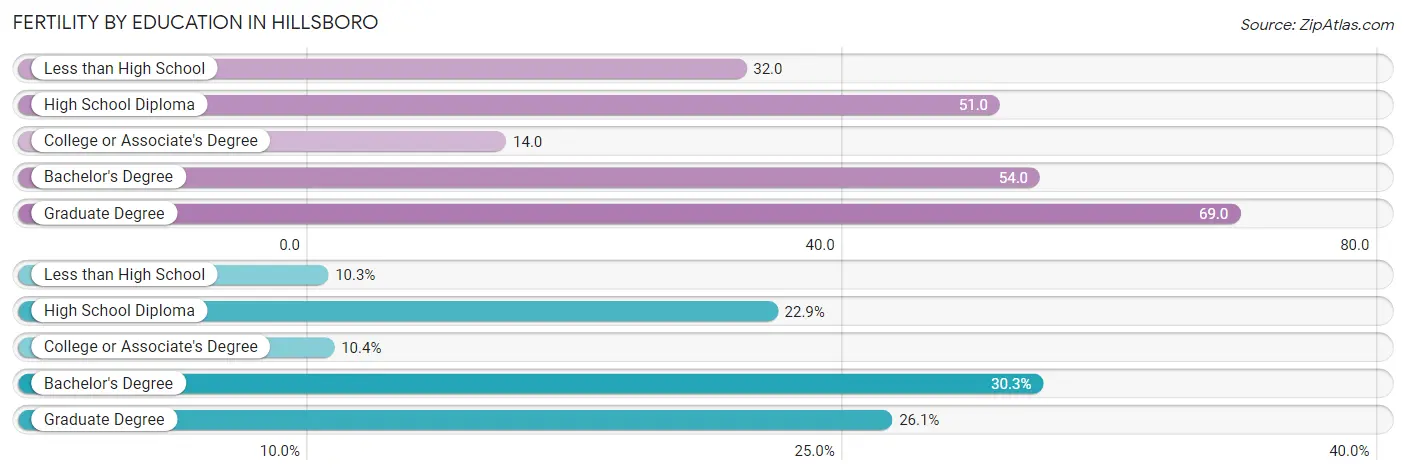
| Educational Attainment | Women with Births | Births / 1,000 Women |
| Less than High School | 121 (10.2%) | 32.0 |
| High School Diploma | 270 (22.9%) | 51.0 |
| College or Associate's Degree | 123 (10.4%) | 14.0 |
| Bachelor's Degree | 358 (30.3%) | 54.0 |
| Graduate Degree | 308 (26.1%) | 69.0 |
| Total | 1,180 (100.0%) | 41.0 |
Fertility by Education by Marriage Status in Hillsboro
17.4% of women with births in Hillsboro are unmarried. Women with the educational attainment of bachelor's degree are most likely to be married with 100.0% of them married at childbirth, while women with the educational attainment of less than high school are least likely to be married with 43.8% of them unmarried at childbirth.
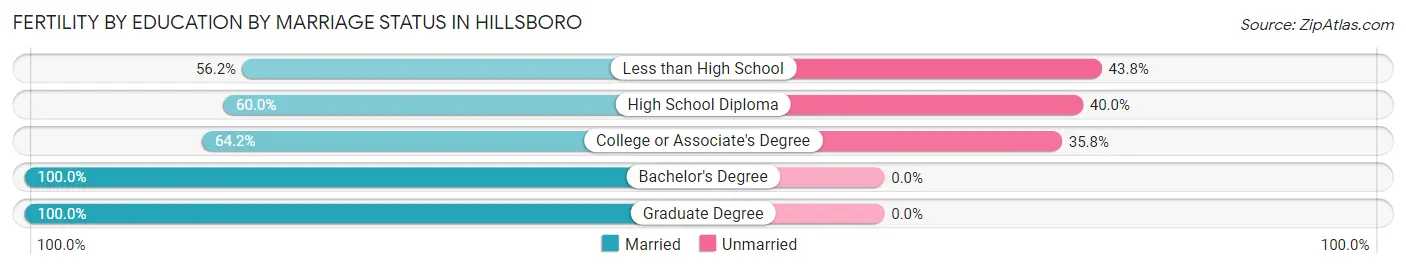
| Educational Attainment | Married | Unmarried |
| Less than High School | 68 (56.2%) | 53 (43.8%) |
| High School Diploma | 162 (60.0%) | 108 (40.0%) |
| College or Associate's Degree | 79 (64.2%) | 44 (35.8%) |
| Bachelor's Degree | 358 (100.0%) | 0 (0.0%) |
| Graduate Degree | 308 (100.0%) | 0 (0.0%) |
| Total | 975 (82.6%) | 205 (17.4%) |
Employment Characteristics in Hillsboro
Employment by Class of Employer in Hillsboro
Among the 57,340 employed individuals in Hillsboro, private company employees (44,716 | 78.0%), not-for-profit organizations (4,117 | 7.2%), and local government employees (3,254 | 5.7%) make up the most common classes of employment.
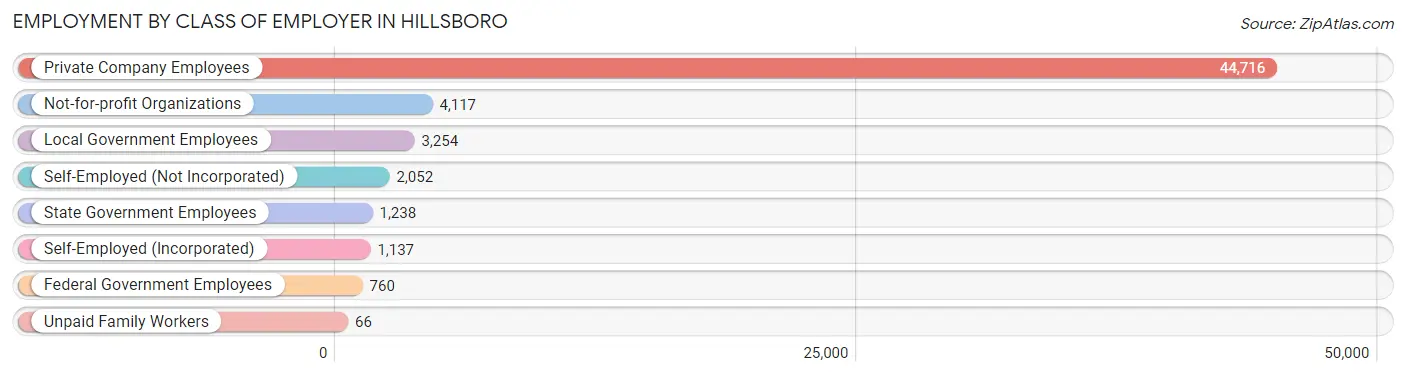
| Employer Class | # Employees | % Employees |
| Private Company Employees | 44,716 | 78.0% |
| Self-Employed (Incorporated) | 1,137 | 2.0% |
| Self-Employed (Not Incorporated) | 2,052 | 3.6% |
| Not-for-profit Organizations | 4,117 | 7.2% |
| Local Government Employees | 3,254 | 5.7% |
| State Government Employees | 1,238 | 2.2% |
| Federal Government Employees | 760 | 1.3% |
| Unpaid Family Workers | 66 | 0.1% |
| Total | 57,340 | 100.0% |
Employment Status by Age in Hillsboro
According to the labor force statistics for Hillsboro, out of the total population over 16 years of age (85,763), 71.1% or 60,977 individuals are in the labor force, with 4.6% or 2,805 of them unemployed. The age group with the highest labor force participation rate is 25 to 29 years, with 86.0% or 8,882 individuals in the labor force. Within the labor force, the 16 to 19 years age range has the highest percentage of unemployed individuals, with 17.5% or 372 of them being unemployed.
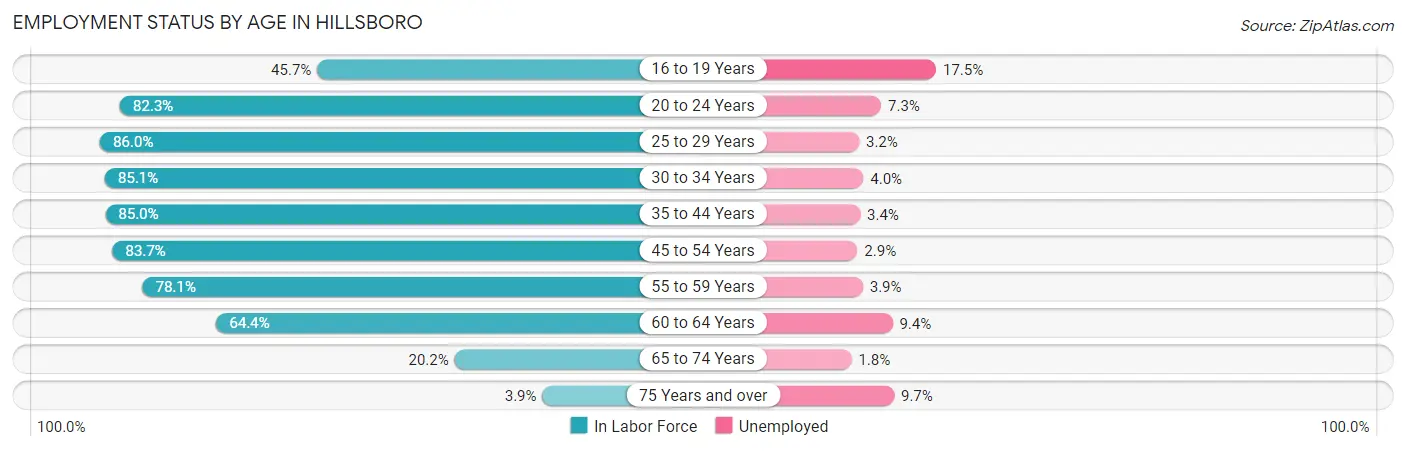
| Age Bracket | In Labor Force | Unemployed |
| 16 to 19 Years | 2,127 (45.7%) | 372 (17.5%) |
| 20 to 24 Years | 5,786 (82.3%) | 422 (7.3%) |
| 25 to 29 Years | 8,882 (86.0%) | 284 (3.2%) |
| 30 to 34 Years | 9,866 (85.1%) | 395 (4.0%) |
| 35 to 44 Years | 14,767 (85.0%) | 502 (3.4%) |
| 45 to 54 Years | 10,304 (83.7%) | 299 (2.9%) |
| 55 to 59 Years | 4,388 (78.1%) | 171 (3.9%) |
| 60 to 64 Years | 3,156 (64.4%) | 297 (9.4%) |
| 65 to 74 Years | 1,504 (20.2%) | 27 (1.8%) |
| 75 Years and over | 176 (3.9%) | 17 (9.7%) |
| Total | 60,977 (71.1%) | 2,805 (4.6%) |
Employment Status by Educational Attainment in Hillsboro
According to labor force statistics for Hillsboro, 82.7% of individuals (51,377) out of the total population between 25 and 64 years of age (62,124) are in the labor force, with 3.8% or 1,952 of them being unemployed. The group with the highest labor force participation rate are those with the educational attainment of bachelor's degree or higher, with 87.1% or 23,534 individuals in the labor force. Within the labor force, individuals with less than high school education have the highest percentage of unemployment, with 5.7% or 231 of them being unemployed.
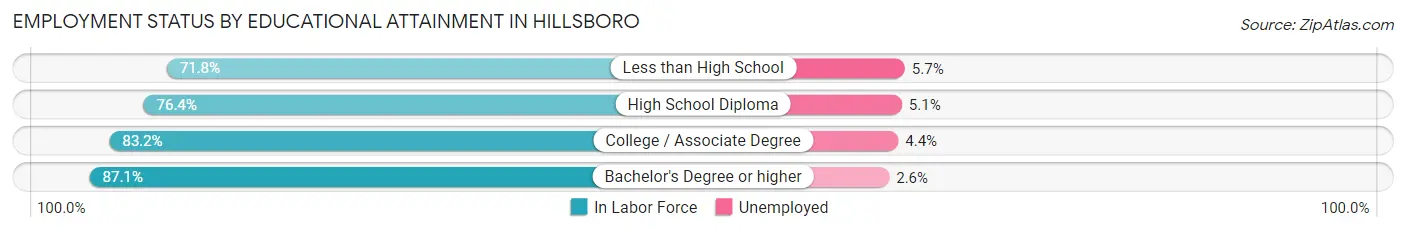
| Educational Attainment | In Labor Force | Unemployed |
| Less than High School | 4,052 (71.8%) | 322 (5.7%) |
| High School Diploma | 8,252 (76.4%) | 551 (5.1%) |
| College / Associate Degree | 15,524 (83.2%) | 821 (4.4%) |
| Bachelor's Degree or higher | 23,534 (87.1%) | 703 (2.6%) |
| Total | 51,377 (82.7%) | 2,361 (3.8%) |
Employment Occupations by Sex in Hillsboro
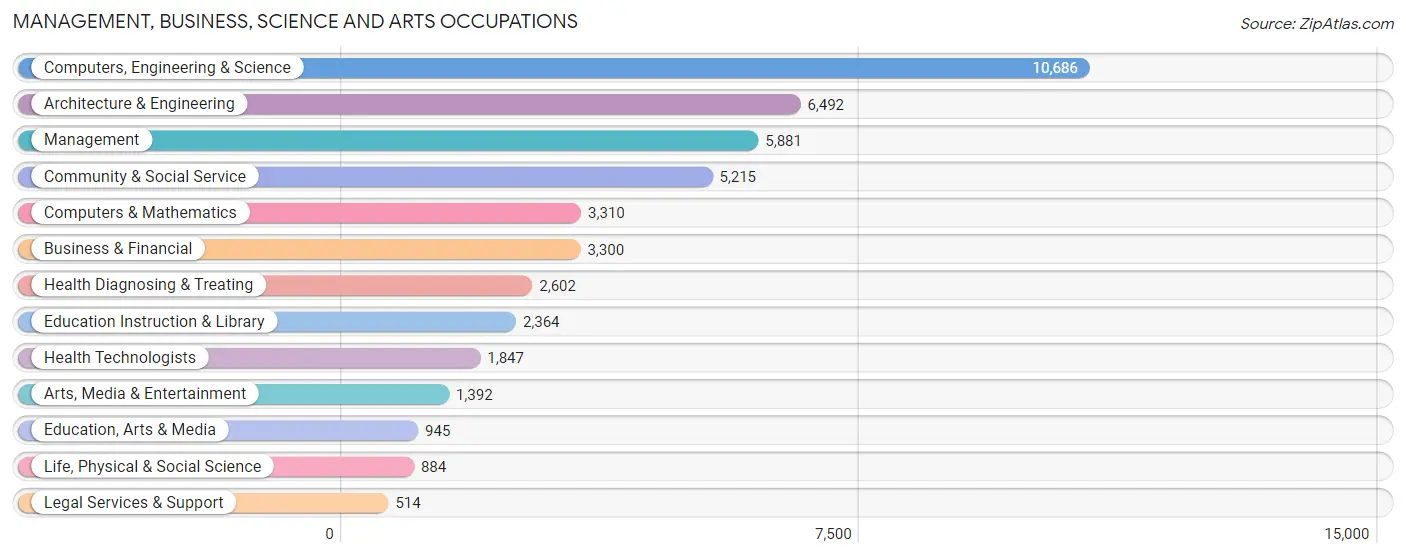
Management, Business, Science and Arts Occupations
The most common Management, Business, Science and Arts occupations in Hillsboro are Computers, Engineering & Science (10,686 | 18.4%), Architecture & Engineering (6,492 | 11.2%), Management (5,881 | 10.1%), Community & Social Service (5,215 | 9.0%), and Computers & Mathematics (3,310 | 5.7%).
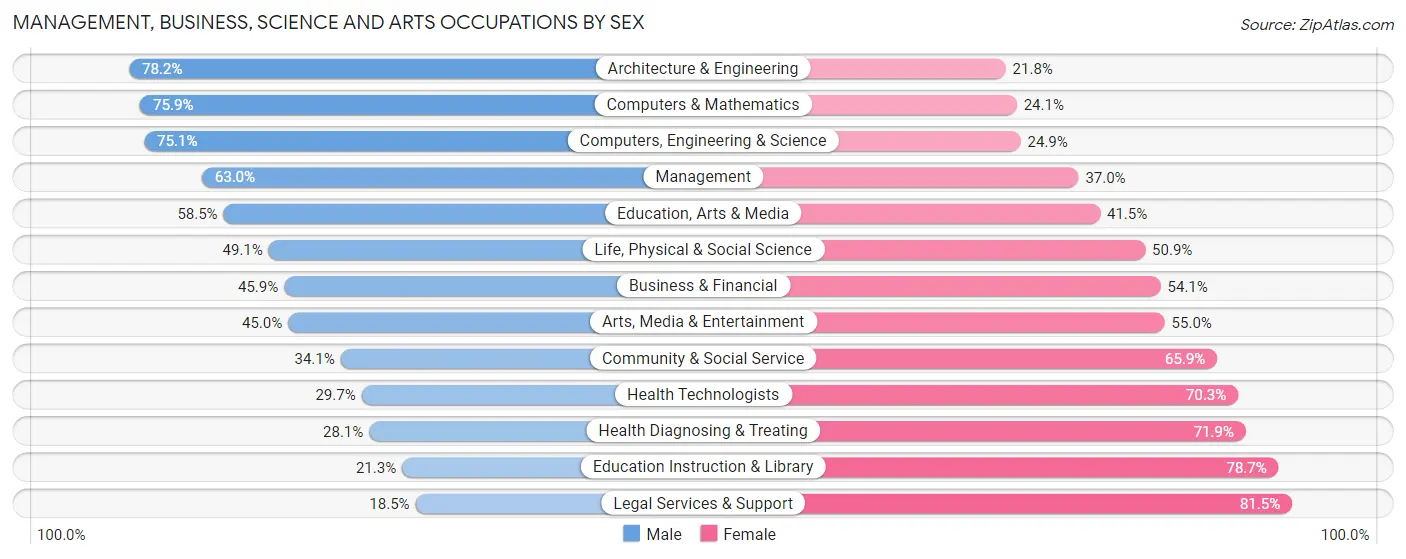
Management, Business, Science and Arts Occupations by Sex
Within the Management, Business, Science and Arts occupations in Hillsboro, the most male-oriented occupations are Architecture & Engineering (78.2%), Computers & Mathematics (75.9%), and Computers, Engineering & Science (75.1%), while the most female-oriented occupations are Legal Services & Support (81.5%), Education Instruction & Library (78.7%), and Health Diagnosing & Treating (71.9%).
| Occupation | Male | Female |
| Management | 3,706 (63.0%) | 2,175 (37.0%) |
| Business & Financial | 1,514 (45.9%) | 1,786 (54.1%) |
| Computers, Engineering & Science | 8,023 (75.1%) | 2,663 (24.9%) |
| Computers & Mathematics | 2,512 (75.9%) | 798 (24.1%) |
| Architecture & Engineering | 5,077 (78.2%) | 1,415 (21.8%) |
| Life, Physical & Social Science | 434 (49.1%) | 450 (50.9%) |
| Community & Social Service | 1,778 (34.1%) | 3,437 (65.9%) |
| Education, Arts & Media | 553 (58.5%) | 392 (41.5%) |
| Legal Services & Support | 95 (18.5%) | 419 (81.5%) |
| Education Instruction & Library | 503 (21.3%) | 1,861 (78.7%) |
| Arts, Media & Entertainment | 627 (45.0%) | 765 (55.0%) |
| Health Diagnosing & Treating | 732 (28.1%) | 1,870 (71.9%) |
| Health Technologists | 549 (29.7%) | 1,298 (70.3%) |
| Total (Category) | 15,753 (56.9%) | 11,931 (43.1%) |
| Total (Overall) | 32,631 (56.1%) | 25,552 (43.9%) |
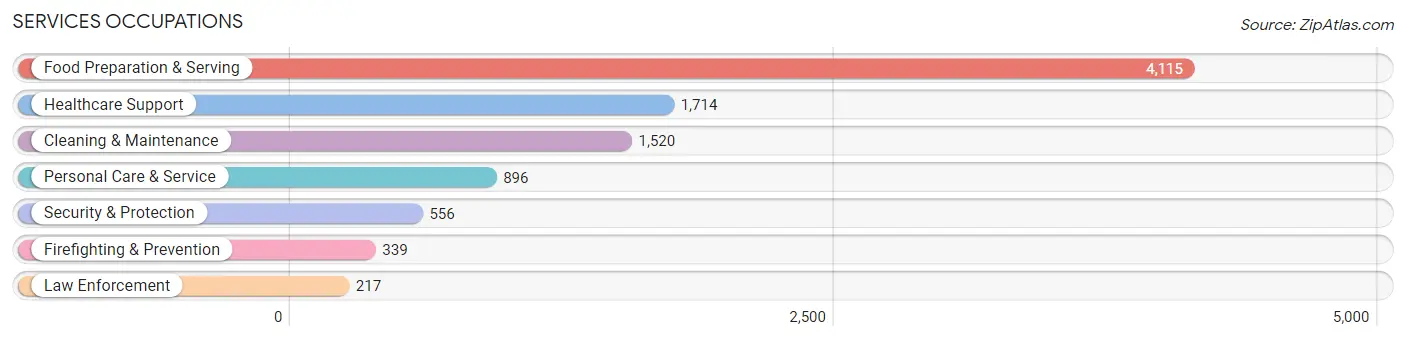
Services Occupations
The most common Services occupations in Hillsboro are Food Preparation & Serving (4,115 | 7.1%), Healthcare Support (1,714 | 2.9%), Cleaning & Maintenance (1,520 | 2.6%), Personal Care & Service (896 | 1.5%), and Security & Protection (556 | 1.0%).
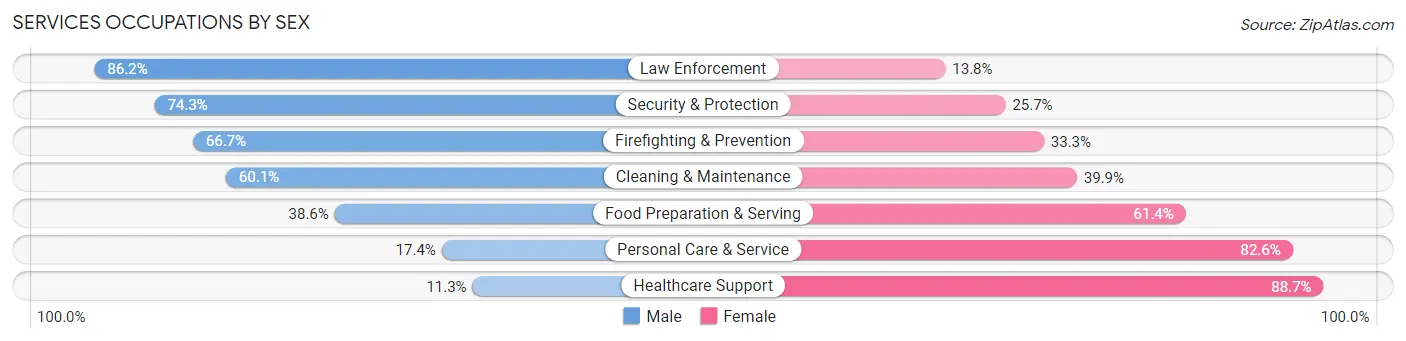
Services Occupations by Sex
Within the Services occupations in Hillsboro, the most male-oriented occupations are Law Enforcement (86.2%), Security & Protection (74.3%), and Firefighting & Prevention (66.7%), while the most female-oriented occupations are Healthcare Support (88.7%), Personal Care & Service (82.6%), and Food Preparation & Serving (61.4%).
| Occupation | Male | Female |
| Healthcare Support | 194 (11.3%) | 1,520 (88.7%) |
| Security & Protection | 413 (74.3%) | 143 (25.7%) |
| Firefighting & Prevention | 226 (66.7%) | 113 (33.3%) |
| Law Enforcement | 187 (86.2%) | 30 (13.8%) |
| Food Preparation & Serving | 1,589 (38.6%) | 2,526 (61.4%) |
| Cleaning & Maintenance | 914 (60.1%) | 606 (39.9%) |
| Personal Care & Service | 156 (17.4%) | 740 (82.6%) |
| Total (Category) | 3,266 (37.1%) | 5,535 (62.9%) |
| Total (Overall) | 32,631 (56.1%) | 25,552 (43.9%) |
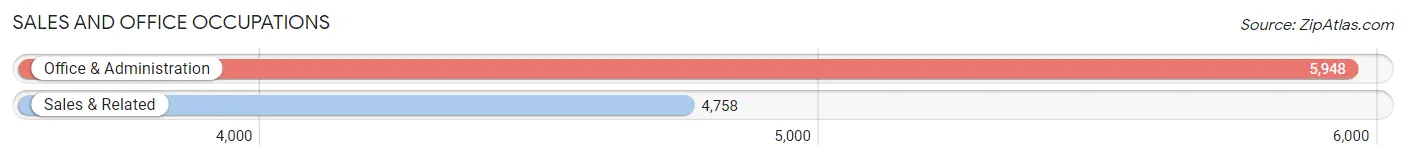
Sales and Office Occupations
The most common Sales and Office occupations in Hillsboro are Office & Administration (5,948 | 10.2%), and Sales & Related (4,758 | 8.2%).
Sales and Office Occupations by Sex
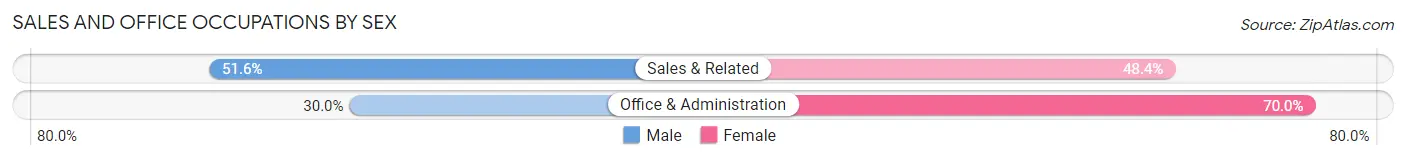
| Occupation | Male | Female |
| Sales & Related | 2,455 (51.6%) | 2,303 (48.4%) |
| Office & Administration | 1,787 (30.0%) | 4,161 (70.0%) |
| Total (Category) | 4,242 (39.6%) | 6,464 (60.4%) |
| Total (Overall) | 32,631 (56.1%) | 25,552 (43.9%) |
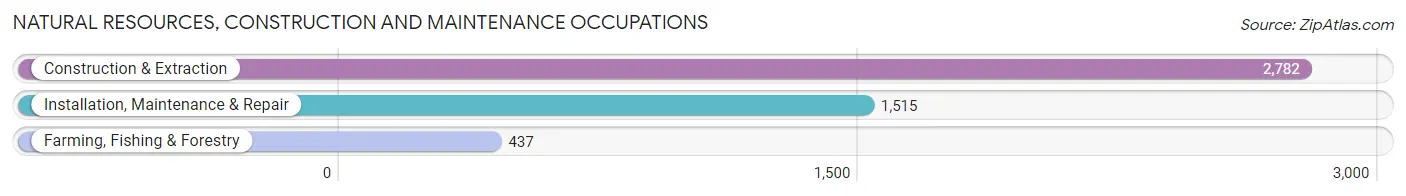
Natural Resources, Construction and Maintenance Occupations
The most common Natural Resources, Construction and Maintenance occupations in Hillsboro are Construction & Extraction (2,782 | 4.8%), Installation, Maintenance & Repair (1,515 | 2.6%), and Farming, Fishing & Forestry (437 | 0.7%).
Natural Resources, Construction and Maintenance Occupations by Sex
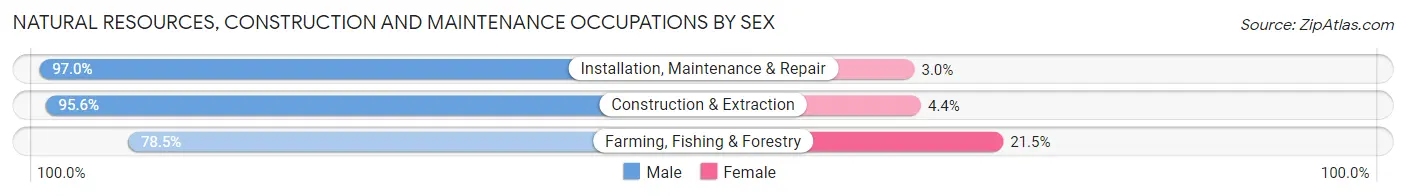
| Occupation | Male | Female |
| Farming, Fishing & Forestry | 343 (78.5%) | 94 (21.5%) |
| Construction & Extraction | 2,660 (95.6%) | 122 (4.4%) |
| Installation, Maintenance & Repair | 1,469 (97.0%) | 46 (3.0%) |
| Total (Category) | 4,472 (94.5%) | 262 (5.5%) |
| Total (Overall) | 32,631 (56.1%) | 25,552 (43.9%) |
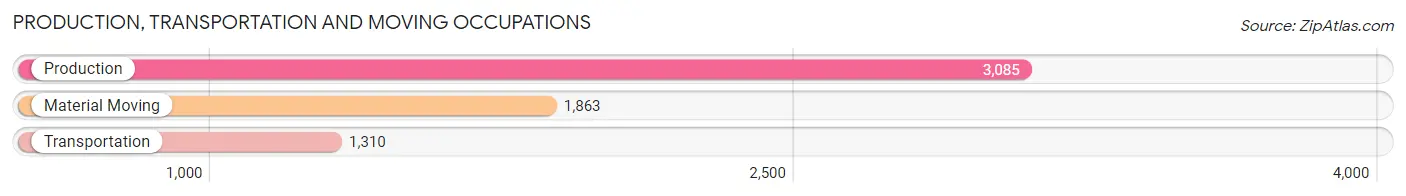
Production, Transportation and Moving Occupations
The most common Production, Transportation and Moving occupations in Hillsboro are Production (3,085 | 5.3%), Material Moving (1,863 | 3.2%), and Transportation (1,310 | 2.2%).
Production, Transportation and Moving Occupations by Sex
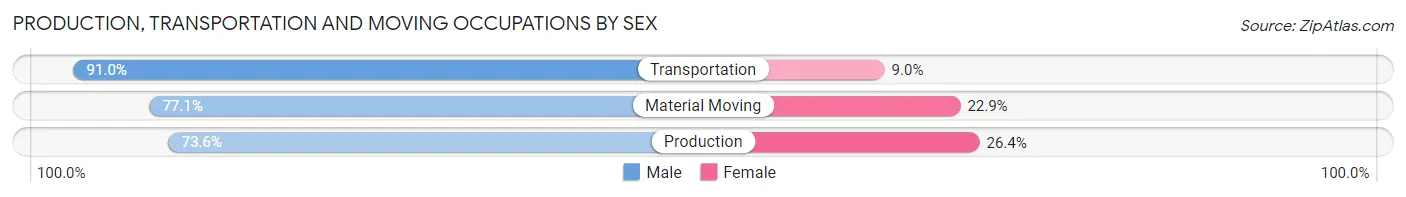
| Occupation | Male | Female |
| Production | 2,270 (73.6%) | 815 (26.4%) |
| Transportation | 1,192 (91.0%) | 118 (9.0%) |
| Material Moving | 1,436 (77.1%) | 427 (22.9%) |
| Total (Category) | 4,898 (78.3%) | 1,360 (21.7%) |
| Total (Overall) | 32,631 (56.1%) | 25,552 (43.9%) |
Employment Industries by Sex in Hillsboro
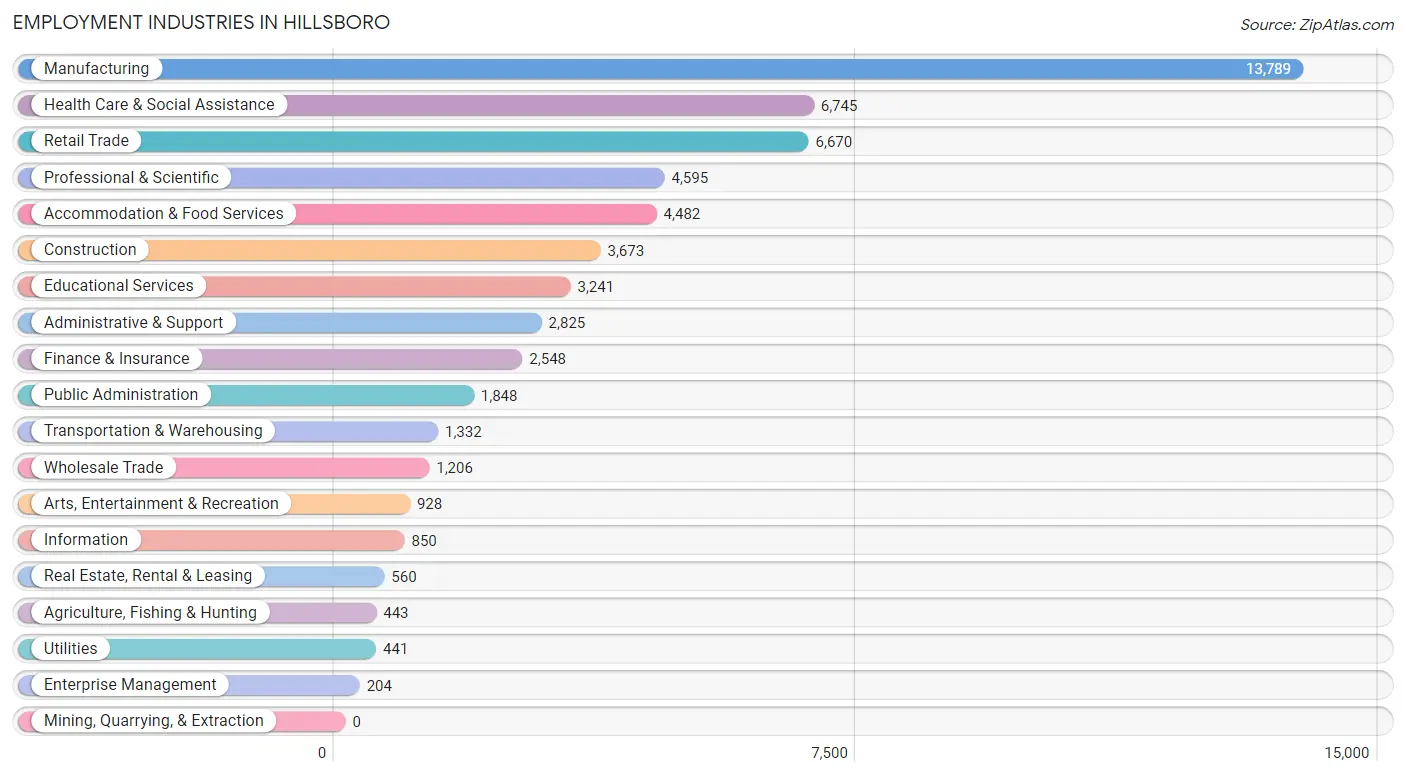
Employment Industries in Hillsboro
The major employment industries in Hillsboro include Manufacturing (13,789 | 23.7%), Health Care & Social Assistance (6,745 | 11.6%), Retail Trade (6,670 | 11.5%), Professional & Scientific (4,595 | 7.9%), and Accommodation & Food Services (4,482 | 7.7%).
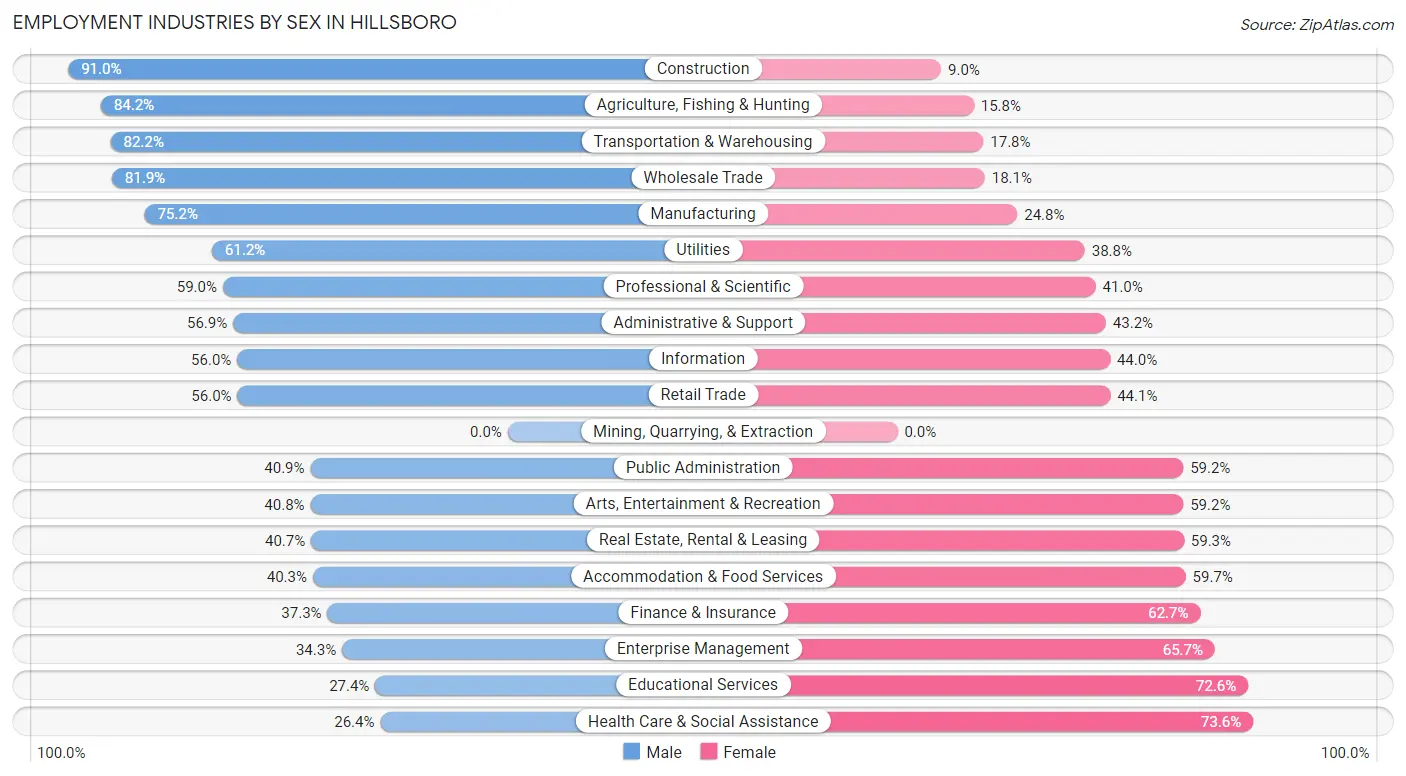
Employment Industries by Sex in Hillsboro
The Hillsboro industries that see more men than women are Construction (91.0%), Agriculture, Fishing & Hunting (84.2%), and Transportation & Warehousing (82.2%), whereas the industries that tend to have a higher number of women are Health Care & Social Assistance (73.6%), Educational Services (72.6%), and Enterprise Management (65.7%).
| Industry | Male | Female |
| Agriculture, Fishing & Hunting | 373 (84.2%) | 70 (15.8%) |
| Mining, Quarrying, & Extraction | 0 (0.0%) | 0 (0.0%) |
| Construction | 3,341 (91.0%) | 332 (9.0%) |
| Manufacturing | 10,367 (75.2%) | 3,422 (24.8%) |
| Wholesale Trade | 988 (81.9%) | 218 (18.1%) |
| Retail Trade | 3,732 (55.9%) | 2,938 (44.1%) |
| Transportation & Warehousing | 1,095 (82.2%) | 237 (17.8%) |
| Utilities | 270 (61.2%) | 171 (38.8%) |
| Information | 476 (56.0%) | 374 (44.0%) |
| Finance & Insurance | 951 (37.3%) | 1,597 (62.7%) |
| Real Estate, Rental & Leasing | 228 (40.7%) | 332 (59.3%) |
| Professional & Scientific | 2,710 (59.0%) | 1,885 (41.0%) |
| Enterprise Management | 70 (34.3%) | 134 (65.7%) |
| Administrative & Support | 1,606 (56.9%) | 1,219 (43.1%) |
| Educational Services | 889 (27.4%) | 2,352 (72.6%) |
| Health Care & Social Assistance | 1,779 (26.4%) | 4,966 (73.6%) |
| Arts, Entertainment & Recreation | 379 (40.8%) | 549 (59.2%) |
| Accommodation & Food Services | 1,808 (40.3%) | 2,674 (59.7%) |
| Public Administration | 755 (40.8%) | 1,093 (59.2%) |
| Total | 32,631 (56.1%) | 25,552 (43.9%) |
Education in Hillsboro
School Enrollment in Hillsboro
The most common levels of schooling among the 25,318 students in Hillsboro are college / undergraduate (5,747 | 22.7%), elementary school (5,228 | 20.6%), and middle school (5,206 | 20.6%).
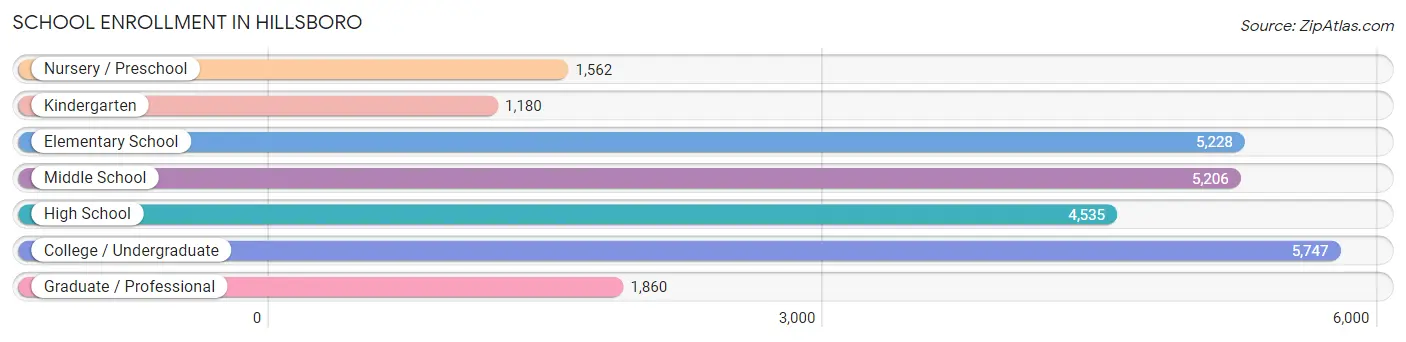
| School Level | # Students | % Students |
| Nursery / Preschool | 1,562 | 6.2% |
| Kindergarten | 1,180 | 4.7% |
| Elementary School | 5,228 | 20.6% |
| Middle School | 5,206 | 20.6% |
| High School | 4,535 | 17.9% |
| College / Undergraduate | 5,747 | 22.7% |
| Graduate / Professional | 1,860 | 7.3% |
| Total | 25,318 | 100.0% |
School Enrollment by Age by Funding Source in Hillsboro
Out of a total of 25,318 students who are enrolled in schools in Hillsboro, 4,431 (17.5%) attend a private institution, while the remaining 20,887 (82.5%) are enrolled in public schools. The age group of 3 to 4 year olds has the highest likelihood of being enrolled in private schools, with 621 (49.2% in the age bracket) enrolled. Conversely, the age group of 10 to 14 year olds has the lowest likelihood of being enrolled in a private school, with 5,888 (91.9% in the age bracket) attending a public institution.
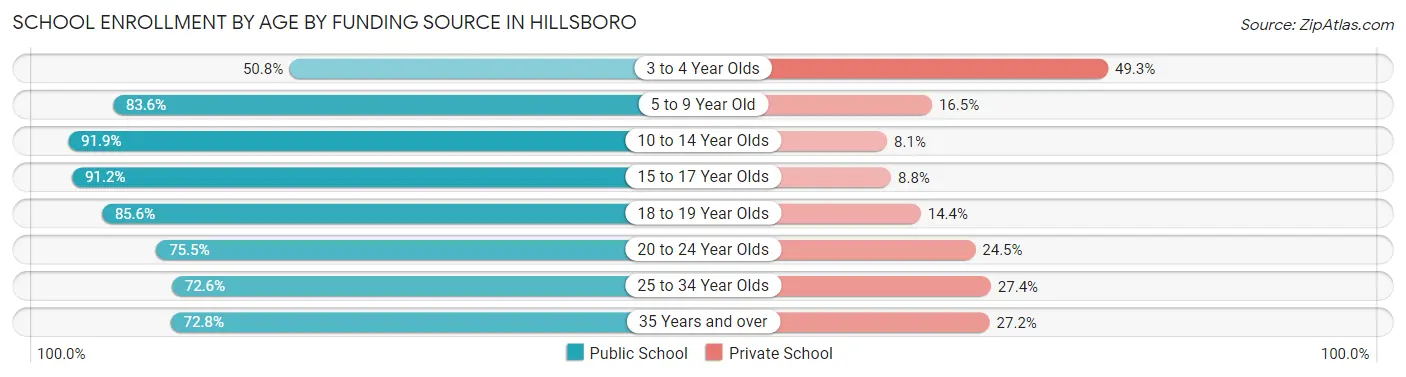
| Age Bracket | Public School | Private School |
| 3 to 4 Year Olds | 640 (50.7%) | 621 (49.2%) |
| 5 to 9 Year Old | 5,114 (83.6%) | 1,007 (16.5%) |
| 10 to 14 Year Olds | 5,888 (91.9%) | 519 (8.1%) |
| 15 to 17 Year Olds | 2,963 (91.2%) | 287 (8.8%) |
| 18 to 19 Year Olds | 1,383 (85.6%) | 232 (14.4%) |
| 20 to 24 Year Olds | 1,788 (75.5%) | 581 (24.5%) |
| 25 to 34 Year Olds | 1,849 (72.6%) | 699 (27.4%) |
| 35 Years and over | 1,272 (72.8%) | 475 (27.2%) |
| Total | 20,887 (82.5%) | 4,431 (17.5%) |
Educational Attainment by Field of Study in Hillsboro
Engineering (7,153 | 21.0%), business (5,028 | 14.7%), science & technology (2,622 | 7.7%), computers & mathematics (2,259 | 6.6%), and physical & health sciences (2,214 | 6.5%) are the most common fields of study among 34,113 individuals in Hillsboro who have obtained a bachelor's degree or higher.
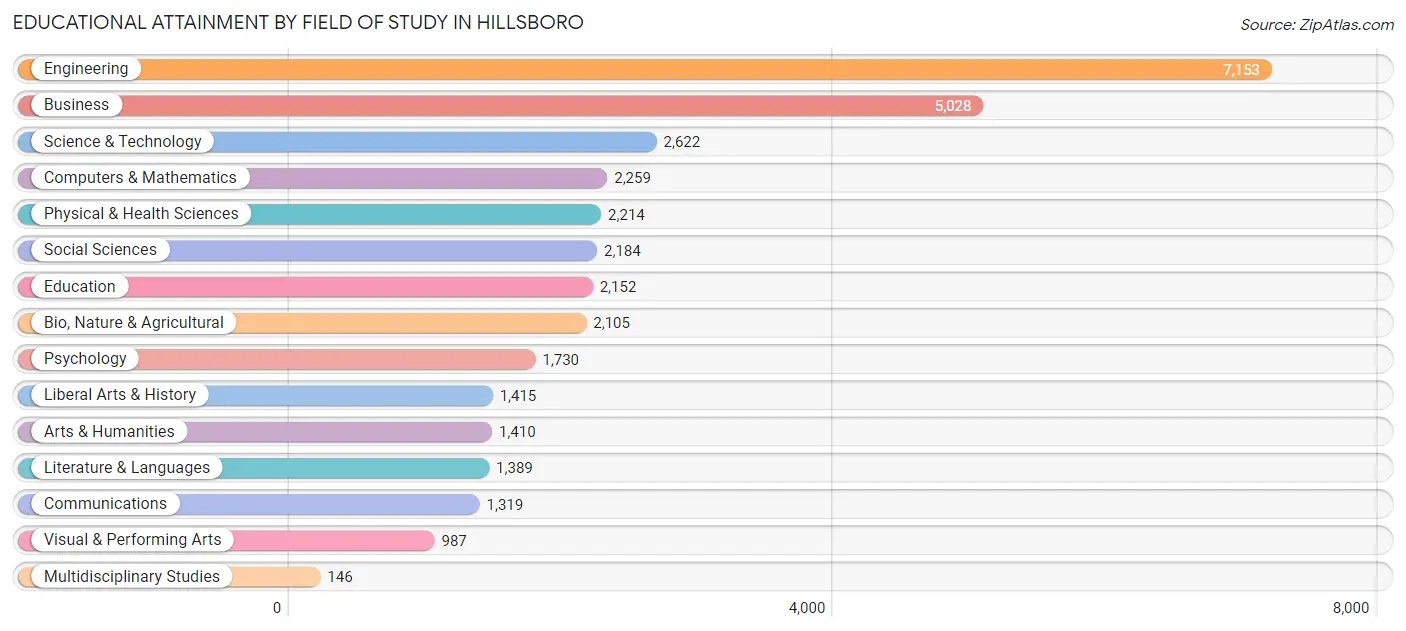
| Field of Study | # Graduates | % Graduates |
| Computers & Mathematics | 2,259 | 6.6% |
| Bio, Nature & Agricultural | 2,105 | 6.2% |
| Physical & Health Sciences | 2,214 | 6.5% |
| Psychology | 1,730 | 5.1% |
| Social Sciences | 2,184 | 6.4% |
| Engineering | 7,153 | 21.0% |
| Multidisciplinary Studies | 146 | 0.4% |
| Science & Technology | 2,622 | 7.7% |
| Business | 5,028 | 14.7% |
| Education | 2,152 | 6.3% |
| Literature & Languages | 1,389 | 4.1% |
| Liberal Arts & History | 1,415 | 4.2% |
| Visual & Performing Arts | 987 | 2.9% |
| Communications | 1,319 | 3.9% |
| Arts & Humanities | 1,410 | 4.1% |
| Total | 34,113 | 100.0% |
Transportation & Commute in Hillsboro
Vehicle Availability by Sex in Hillsboro
The most prevalent vehicle ownership categories in Hillsboro are males with 2 vehicles (14,106, accounting for 43.7%) and females with 2 vehicles (10,407, making up 56.5%).
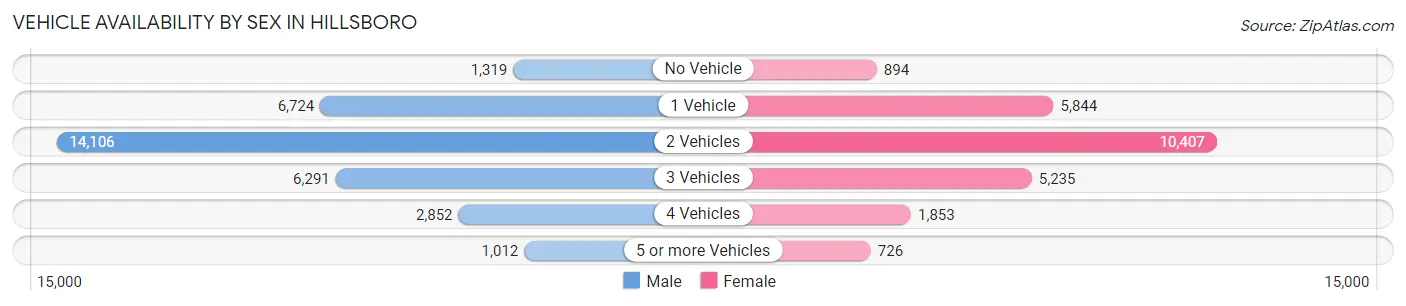
| Vehicles Available | Male | Female |
| No Vehicle | 1,319 (4.1%) | 894 (3.6%) |
| 1 Vehicle | 6,724 (20.8%) | 5,844 (23.4%) |
| 2 Vehicles | 14,106 (43.7%) | 10,407 (41.7%) |
| 3 Vehicles | 6,291 (19.5%) | 5,235 (21.0%) |
| 4 Vehicles | 2,852 (8.8%) | 1,853 (7.4%) |
| 5 or more Vehicles | 1,012 (3.1%) | 726 (2.9%) |
| Total | 32,304 (100.0%) | 24,959 (100.0%) |
Commute Time in Hillsboro
The most frequently occuring commute durations in Hillsboro are 10 to 14 minutes (9,995 commuters, 21.1%), 15 to 19 minutes (8,238 commuters, 17.4%), and 20 to 24 minutes (5,958 commuters, 12.6%).
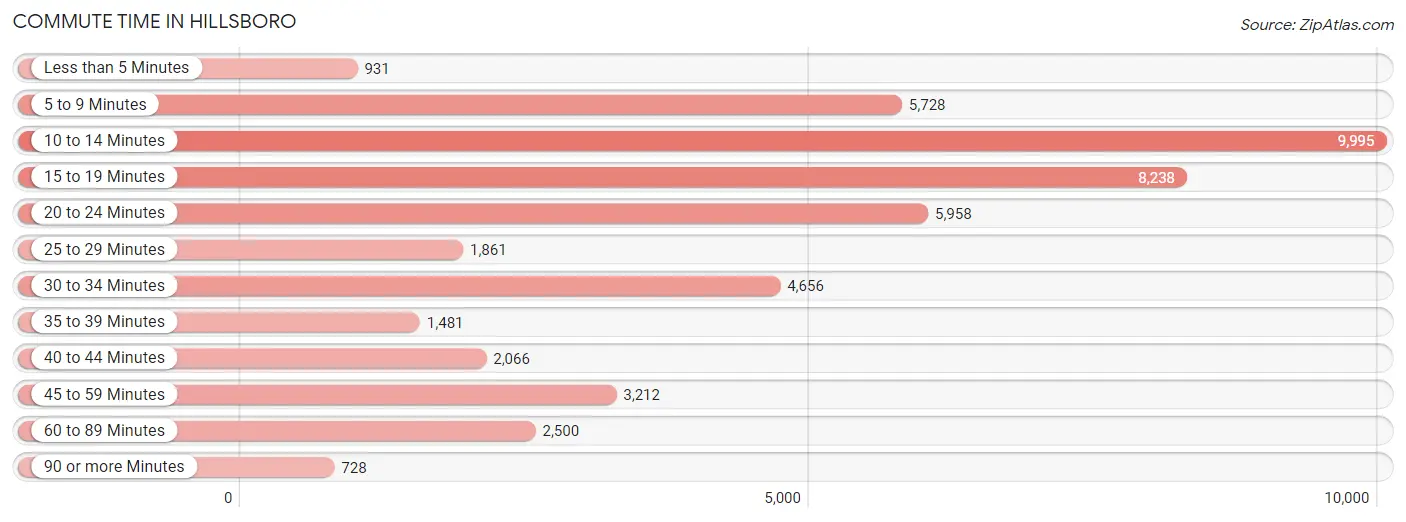
| Commute Time | # Commuters | % Commuters |
| Less than 5 Minutes | 931 | 2.0% |
| 5 to 9 Minutes | 5,728 | 12.1% |
| 10 to 14 Minutes | 9,995 | 21.1% |
| 15 to 19 Minutes | 8,238 | 17.4% |
| 20 to 24 Minutes | 5,958 | 12.6% |
| 25 to 29 Minutes | 1,861 | 3.9% |
| 30 to 34 Minutes | 4,656 | 9.8% |
| 35 to 39 Minutes | 1,481 | 3.1% |
| 40 to 44 Minutes | 2,066 | 4.4% |
| 45 to 59 Minutes | 3,212 | 6.8% |
| 60 to 89 Minutes | 2,500 | 5.3% |
| 90 or more Minutes | 728 | 1.5% |
Commute Time by Sex in Hillsboro
The most common commute times in Hillsboro are 10 to 14 minutes (5,780 commuters, 21.5%) for males and 10 to 14 minutes (4,215 commuters, 20.6%) for females.
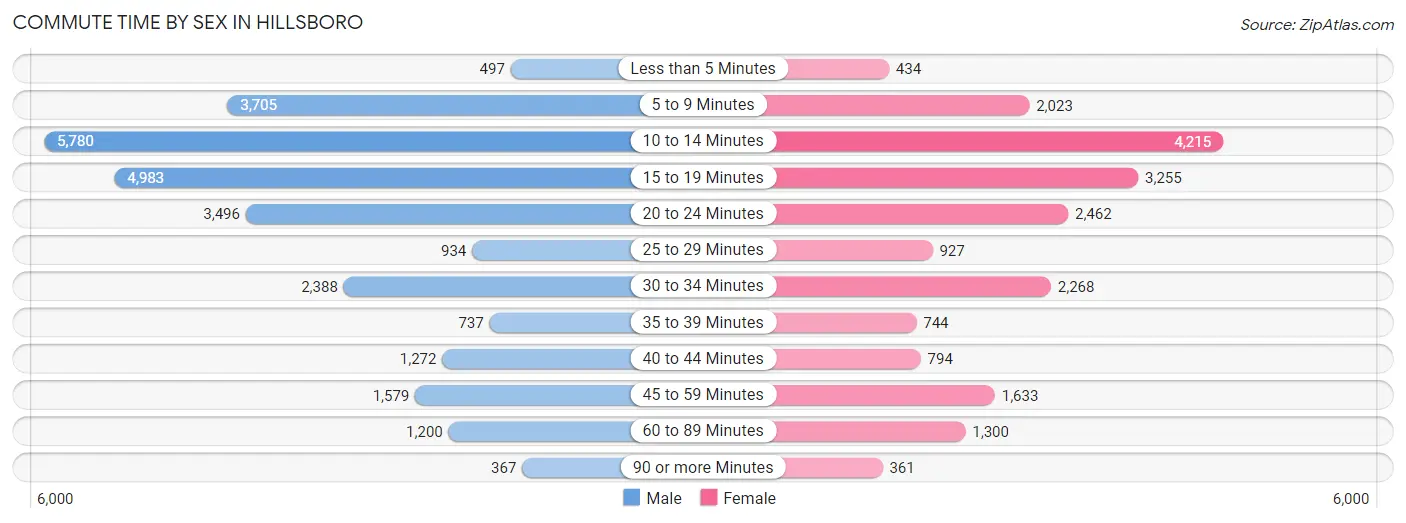
| Commute Time | Male | Female |
| Less than 5 Minutes | 497 (1.8%) | 434 (2.1%) |
| 5 to 9 Minutes | 3,705 (13.8%) | 2,023 (9.9%) |
| 10 to 14 Minutes | 5,780 (21.5%) | 4,215 (20.6%) |
| 15 to 19 Minutes | 4,983 (18.5%) | 3,255 (15.9%) |
| 20 to 24 Minutes | 3,496 (13.0%) | 2,462 (12.1%) |
| 25 to 29 Minutes | 934 (3.5%) | 927 (4.5%) |
| 30 to 34 Minutes | 2,388 (8.9%) | 2,268 (11.1%) |
| 35 to 39 Minutes | 737 (2.7%) | 744 (3.6%) |
| 40 to 44 Minutes | 1,272 (4.7%) | 794 (3.9%) |
| 45 to 59 Minutes | 1,579 (5.9%) | 1,633 (8.0%) |
| 60 to 89 Minutes | 1,200 (4.4%) | 1,300 (6.4%) |
| 90 or more Minutes | 367 (1.4%) | 361 (1.8%) |
Time of Departure to Work by Sex in Hillsboro
The most frequent times of departure to work in Hillsboro are 7:00 AM to 7:29 AM (3,379, 12.5%) for males and 7:30 AM to 7:59 AM (3,369, 16.5%) for females.
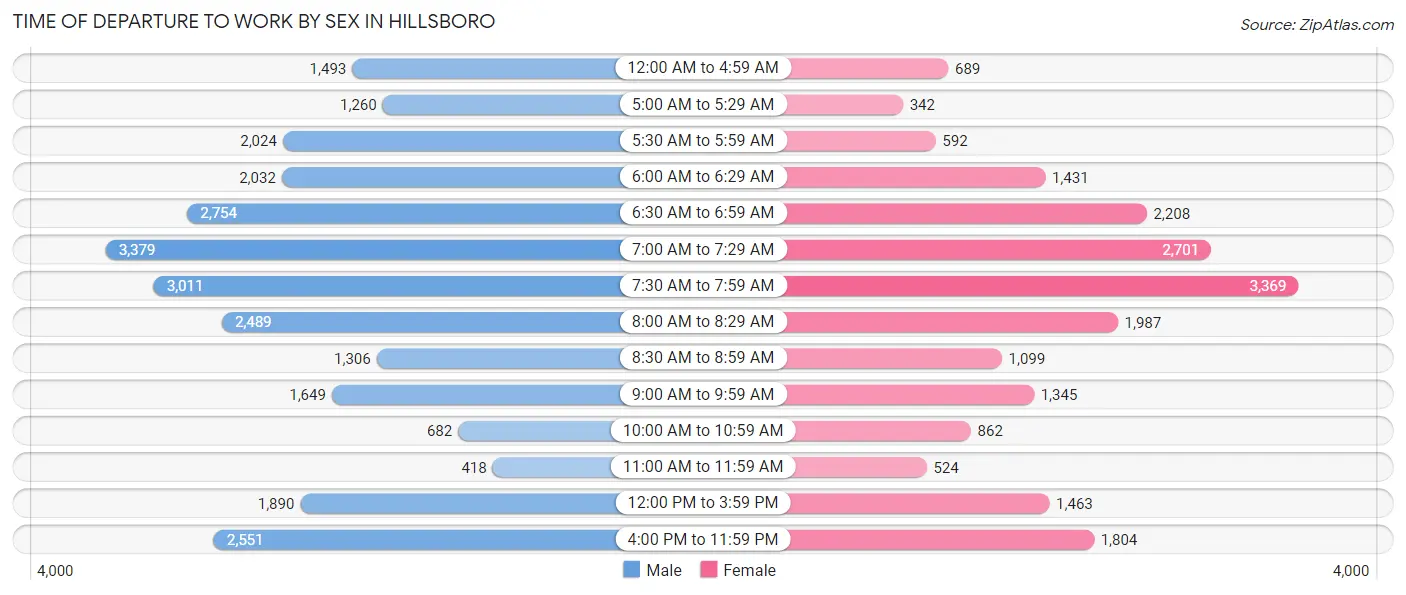
| Time of Departure | Male | Female |
| 12:00 AM to 4:59 AM | 1,493 (5.5%) | 689 (3.4%) |
| 5:00 AM to 5:29 AM | 1,260 (4.7%) | 342 (1.7%) |
| 5:30 AM to 5:59 AM | 2,024 (7.5%) | 592 (2.9%) |
| 6:00 AM to 6:29 AM | 2,032 (7.5%) | 1,431 (7.0%) |
| 6:30 AM to 6:59 AM | 2,754 (10.2%) | 2,208 (10.8%) |
| 7:00 AM to 7:29 AM | 3,379 (12.5%) | 2,701 (13.2%) |
| 7:30 AM to 7:59 AM | 3,011 (11.2%) | 3,369 (16.5%) |
| 8:00 AM to 8:29 AM | 2,489 (9.2%) | 1,987 (9.7%) |
| 8:30 AM to 8:59 AM | 1,306 (4.9%) | 1,099 (5.4%) |
| 9:00 AM to 9:59 AM | 1,649 (6.1%) | 1,345 (6.6%) |
| 10:00 AM to 10:59 AM | 682 (2.5%) | 862 (4.2%) |
| 11:00 AM to 11:59 AM | 418 (1.5%) | 524 (2.6%) |
| 12:00 PM to 3:59 PM | 1,890 (7.0%) | 1,463 (7.2%) |
| 4:00 PM to 11:59 PM | 2,551 (9.5%) | 1,804 (8.8%) |
| Total | 26,938 (100.0%) | 20,416 (100.0%) |
Housing Occupancy in Hillsboro
Occupancy by Ownership in Hillsboro
Of the total 40,633 dwellings in Hillsboro, owner-occupied units account for 20,532 (50.5%), while renter-occupied units make up 20,101 (49.5%).
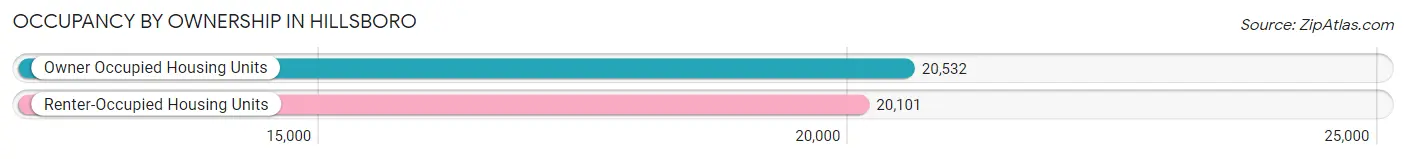
| Occupancy | # Housing Units | % Housing Units |
| Owner Occupied Housing Units | 20,532 | 50.5% |
| Renter-Occupied Housing Units | 20,101 | 49.5% |
| Total Occupied Housing Units | 40,633 | 100.0% |
Occupancy by Household Size in Hillsboro
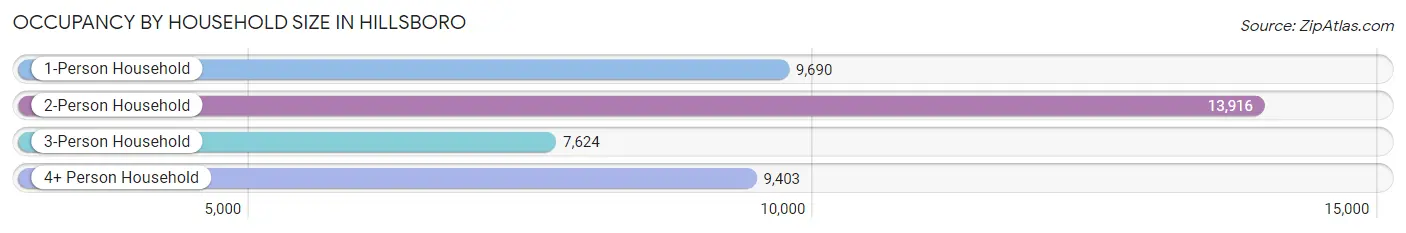
| Household Size | # Housing Units | % Housing Units |
| 1-Person Household | 9,690 | 23.8% |
| 2-Person Household | 13,916 | 34.3% |
| 3-Person Household | 7,624 | 18.8% |
| 4+ Person Household | 9,403 | 23.1% |
| Total Housing Units | 40,633 | 100.0% |
Occupancy by Ownership by Household Size in Hillsboro
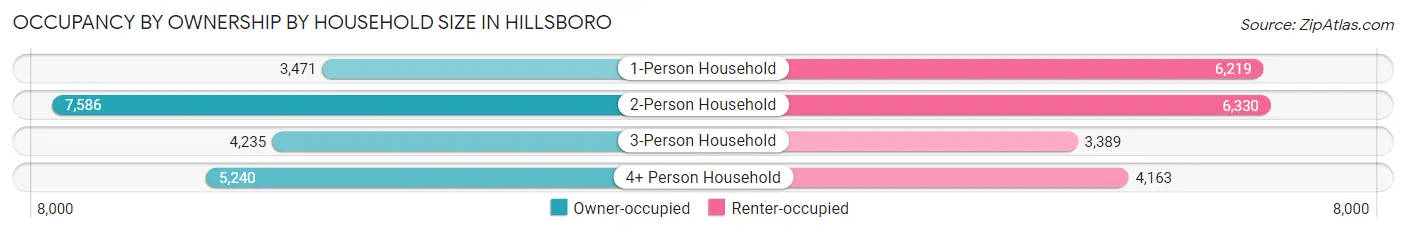
| Household Size | Owner-occupied | Renter-occupied |
| 1-Person Household | 3,471 (35.8%) | 6,219 (64.2%) |
| 2-Person Household | 7,586 (54.5%) | 6,330 (45.5%) |
| 3-Person Household | 4,235 (55.5%) | 3,389 (44.5%) |
| 4+ Person Household | 5,240 (55.7%) | 4,163 (44.3%) |
| Total Housing Units | 20,532 (50.5%) | 20,101 (49.5%) |
Occupancy by Educational Attainment in Hillsboro
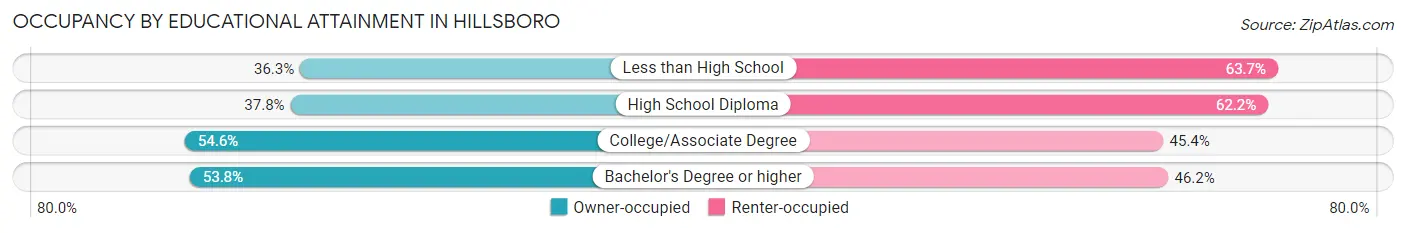
| Household Size | Owner-occupied | Renter-occupied |
| Less than High School | 1,008 (36.3%) | 1,768 (63.7%) |
| High School Diploma | 2,229 (37.8%) | 3,661 (62.2%) |
| College/Associate Degree | 7,063 (54.6%) | 5,880 (45.4%) |
| Bachelor's Degree or higher | 10,232 (53.8%) | 8,792 (46.2%) |
Occupancy by Age of Householder in Hillsboro
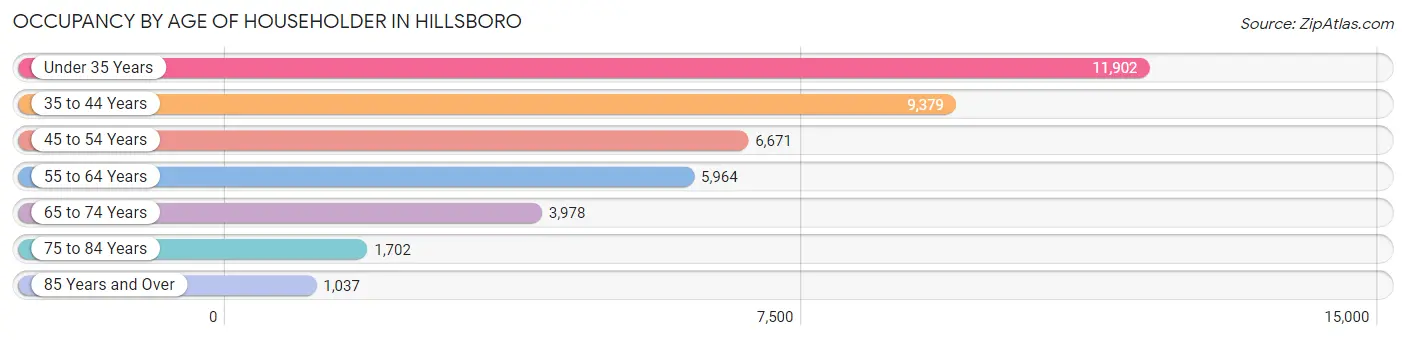
| Age Bracket | # Households | % Households |
| Under 35 Years | 11,902 | 29.3% |
| 35 to 44 Years | 9,379 | 23.1% |
| 45 to 54 Years | 6,671 | 16.4% |
| 55 to 64 Years | 5,964 | 14.7% |
| 65 to 74 Years | 3,978 | 9.8% |
| 75 to 84 Years | 1,702 | 4.2% |
| 85 Years and Over | 1,037 | 2.5% |
| Total | 40,633 | 100.0% |
Housing Finances in Hillsboro
Median Income by Occupancy in Hillsboro
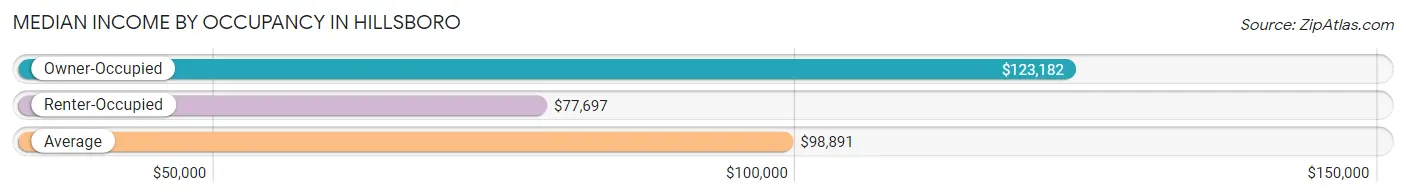
| Occupancy Type | # Households | Median Income |
| Owner-Occupied | 20,532 (50.5%) | $123,182 |
| Renter-Occupied | 20,101 (49.5%) | $77,697 |
| Average | 40,633 (100.0%) | $98,891 |
Occupancy by Householder Income Bracket in Hillsboro
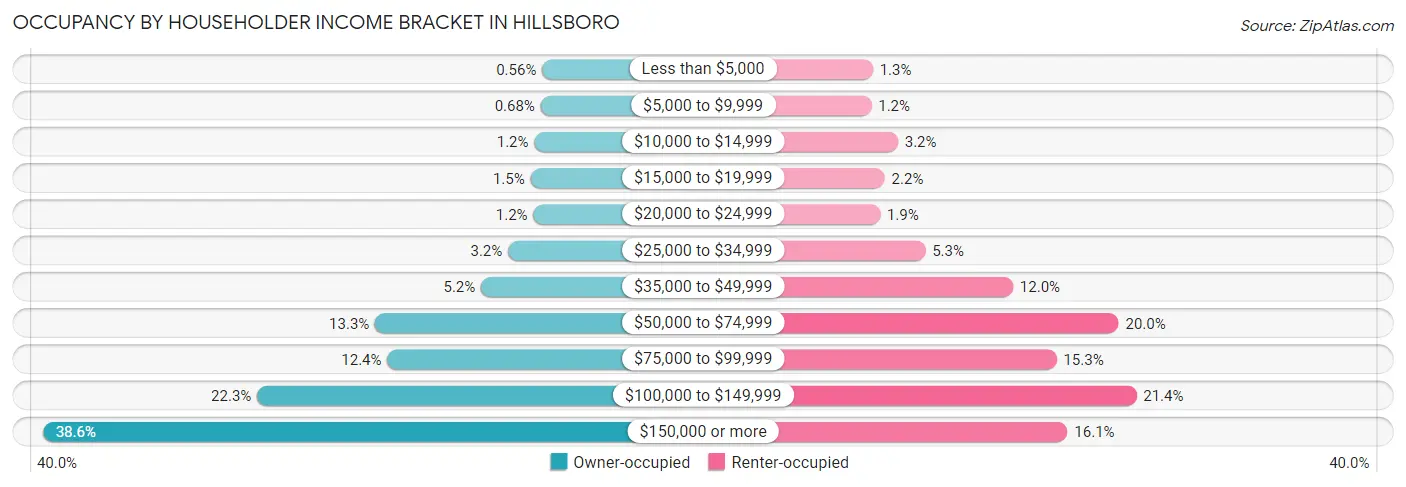
| Income Bracket | Owner-occupied | Renter-occupied |
| Less than $5,000 | 114 (0.6%) | 263 (1.3%) |
| $5,000 to $9,999 | 140 (0.7%) | 242 (1.2%) |
| $10,000 to $14,999 | 239 (1.2%) | 647 (3.2%) |
| $15,000 to $19,999 | 297 (1.5%) | 446 (2.2%) |
| $20,000 to $24,999 | 252 (1.2%) | 374 (1.9%) |
| $25,000 to $34,999 | 649 (3.2%) | 1,067 (5.3%) |
| $35,000 to $49,999 | 1,071 (5.2%) | 2,411 (12.0%) |
| $50,000 to $74,999 | 2,728 (13.3%) | 4,029 (20.0%) |
| $75,000 to $99,999 | 2,538 (12.4%) | 3,077 (15.3%) |
| $100,000 to $149,999 | 4,574 (22.3%) | 4,300 (21.4%) |
| $150,000 or more | 7,930 (38.6%) | 3,245 (16.1%) |
| Total | 20,532 (100.0%) | 20,101 (100.0%) |
Monthly Housing Cost Tiers in Hillsboro
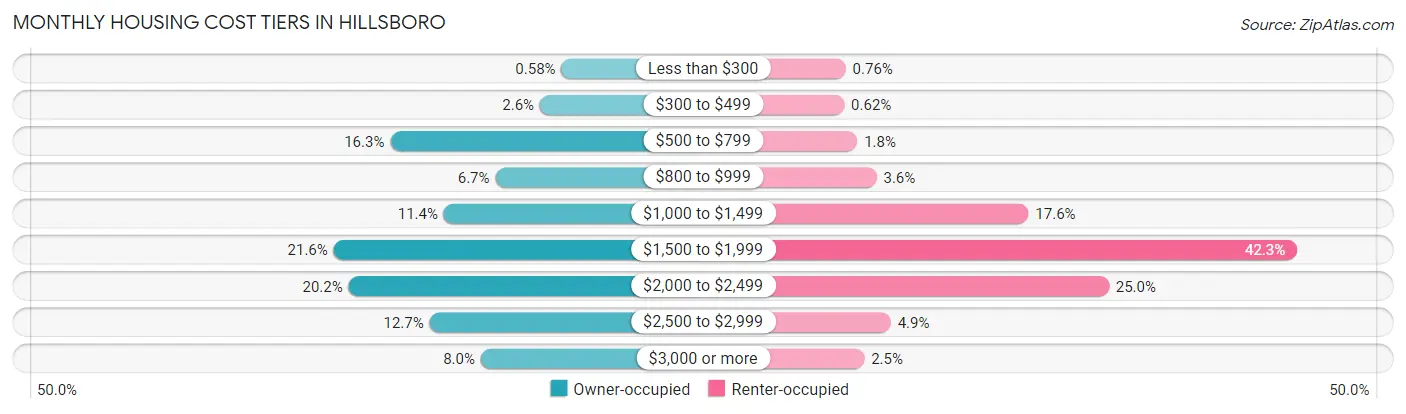
| Monthly Cost | Owner-occupied | Renter-occupied |
| Less than $300 | 119 (0.6%) | 153 (0.8%) |
| $300 to $499 | 526 (2.6%) | 125 (0.6%) |
| $500 to $799 | 3,354 (16.3%) | 365 (1.8%) |
| $800 to $999 | 1,368 (6.7%) | 724 (3.6%) |
| $1,000 to $1,499 | 2,343 (11.4%) | 3,533 (17.6%) |
| $1,500 to $1,999 | 4,425 (21.5%) | 8,505 (42.3%) |
| $2,000 to $2,499 | 4,144 (20.2%) | 5,022 (25.0%) |
| $2,500 to $2,999 | 2,611 (12.7%) | 987 (4.9%) |
| $3,000 or more | 1,642 (8.0%) | 496 (2.5%) |
| Total | 20,532 (100.0%) | 20,101 (100.0%) |
Physical Housing Characteristics in Hillsboro
Housing Structures in Hillsboro
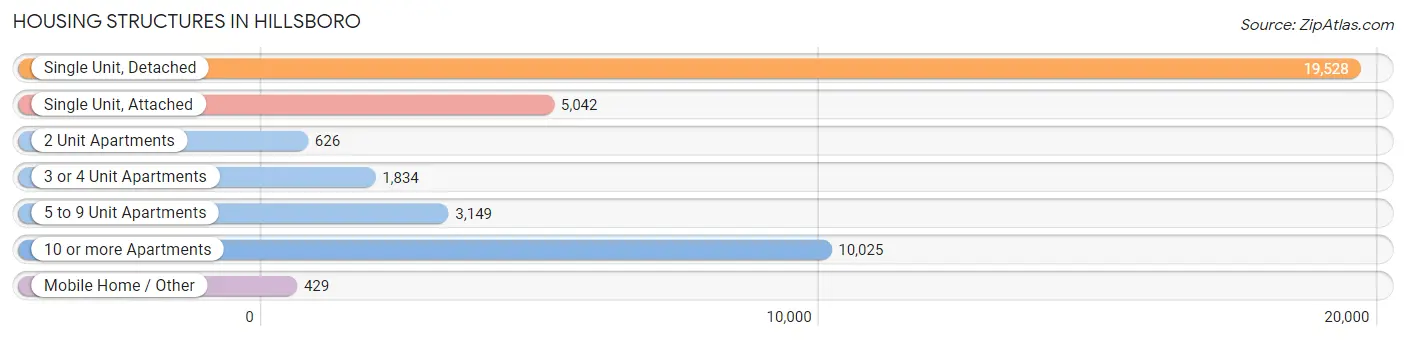
| Structure Type | # Housing Units | % Housing Units |
| Single Unit, Detached | 19,528 | 48.1% |
| Single Unit, Attached | 5,042 | 12.4% |
| 2 Unit Apartments | 626 | 1.5% |
| 3 or 4 Unit Apartments | 1,834 | 4.5% |
| 5 to 9 Unit Apartments | 3,149 | 7.7% |
| 10 or more Apartments | 10,025 | 24.7% |
| Mobile Home / Other | 429 | 1.1% |
| Total | 40,633 | 100.0% |
Housing Structures by Occupancy in Hillsboro
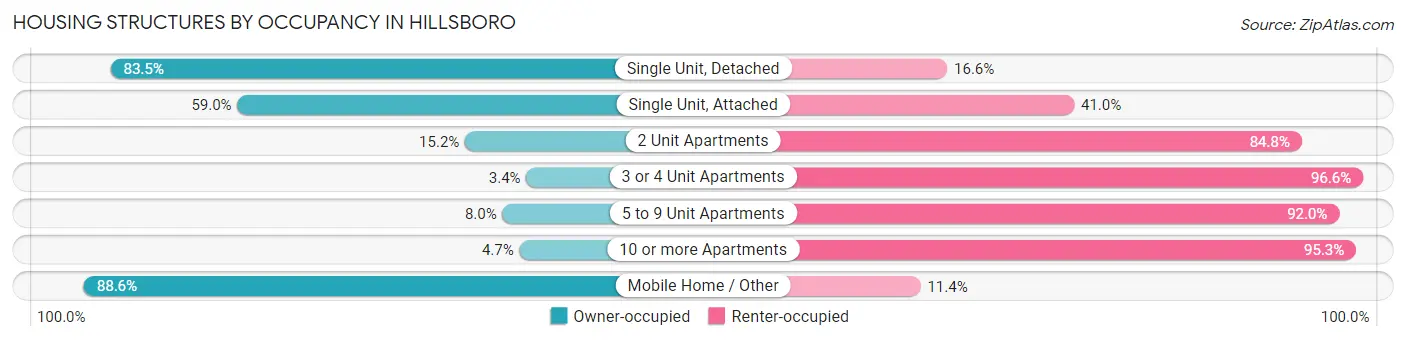
| Structure Type | Owner-occupied | Renter-occupied |
| Single Unit, Detached | 16,296 (83.5%) | 3,232 (16.6%) |
| Single Unit, Attached | 2,976 (59.0%) | 2,066 (41.0%) |
| 2 Unit Apartments | 95 (15.2%) | 531 (84.8%) |
| 3 or 4 Unit Apartments | 62 (3.4%) | 1,772 (96.6%) |
| 5 to 9 Unit Apartments | 251 (8.0%) | 2,898 (92.0%) |
| 10 or more Apartments | 472 (4.7%) | 9,553 (95.3%) |
| Mobile Home / Other | 380 (88.6%) | 49 (11.4%) |
| Total | 20,532 (50.5%) | 20,101 (49.5%) |
Housing Structures by Number of Rooms in Hillsboro
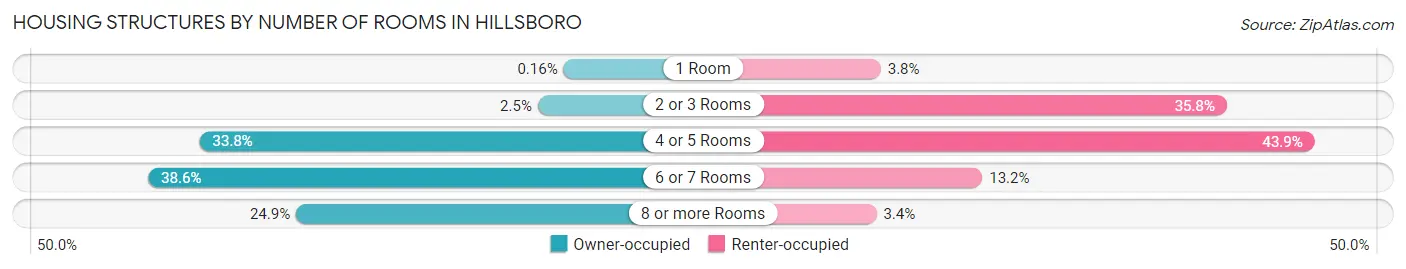
| Number of Rooms | Owner-occupied | Renter-occupied |
| 1 Room | 33 (0.2%) | 760 (3.8%) |
| 2 or 3 Rooms | 521 (2.5%) | 7,190 (35.8%) |
| 4 or 5 Rooms | 6,947 (33.8%) | 8,823 (43.9%) |
| 6 or 7 Rooms | 7,919 (38.6%) | 2,648 (13.2%) |
| 8 or more Rooms | 5,112 (24.9%) | 680 (3.4%) |
| Total | 20,532 (100.0%) | 20,101 (100.0%) |
Housing Structure by Heating Type in Hillsboro
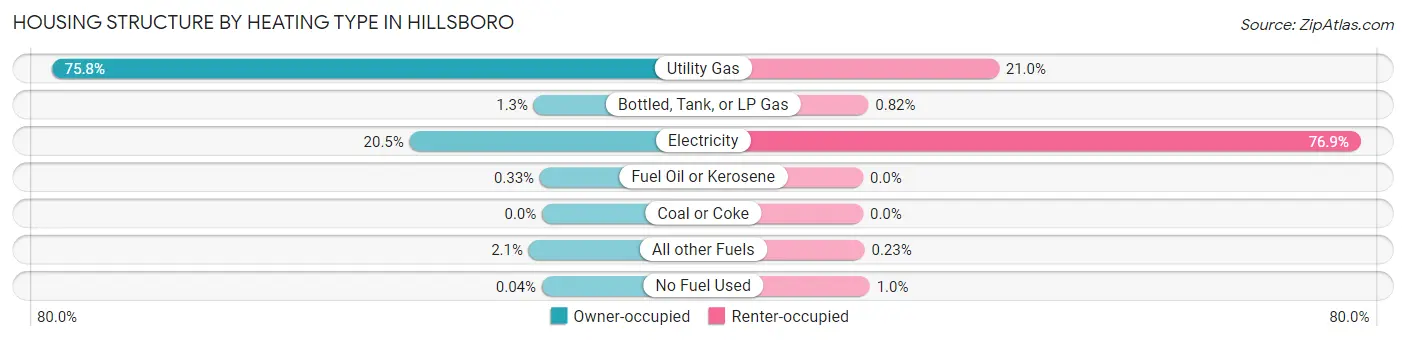
| Heating Type | Owner-occupied | Renter-occupied |
| Utility Gas | 15,568 (75.8%) | 4,218 (21.0%) |
| Bottled, Tank, or LP Gas | 261 (1.3%) | 165 (0.8%) |
| Electricity | 4,205 (20.5%) | 15,463 (76.9%) |
| Fuel Oil or Kerosene | 67 (0.3%) | 0 (0.0%) |
| Coal or Coke | 0 (0.0%) | 0 (0.0%) |
| All other Fuels | 423 (2.1%) | 47 (0.2%) |
| No Fuel Used | 8 (0.0%) | 208 (1.0%) |
| Total | 20,532 (100.0%) | 20,101 (100.0%) |
Household Vehicle Usage in Hillsboro
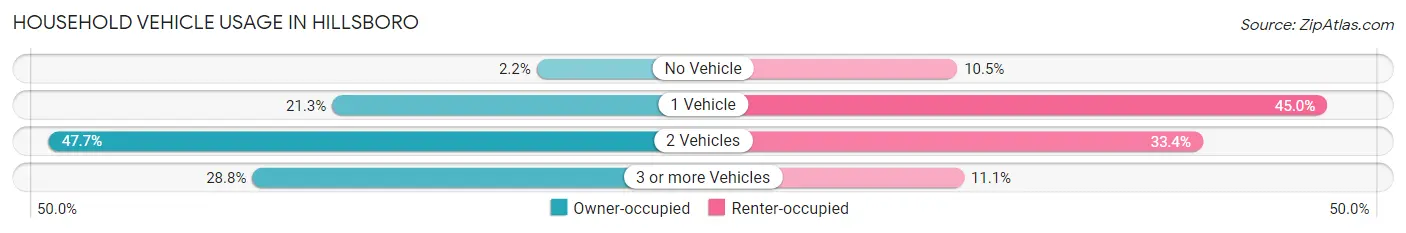
| Vehicles per Household | Owner-occupied | Renter-occupied |
| No Vehicle | 453 (2.2%) | 2,106 (10.5%) |
| 1 Vehicle | 4,374 (21.3%) | 9,048 (45.0%) |
| 2 Vehicles | 9,802 (47.7%) | 6,714 (33.4%) |
| 3 or more Vehicles | 5,903 (28.7%) | 2,233 (11.1%) |
| Total | 20,532 (100.0%) | 20,101 (100.0%) |
Real Estate & Mortgages in Hillsboro
Real Estate and Mortgage Overview in Hillsboro
| Characteristic | Without Mortgage | With Mortgage |
| Housing Units | 5,421 | 15,111 |
| Median Property Value | $456,600 | $451,000 |
| Median Household Income | $90,858 | $6,385 |
| Monthly Housing Costs | $692 | $1,642 |
| Real Estate Taxes | $4,061 | $398 |
Property Value by Mortgage Status in Hillsboro
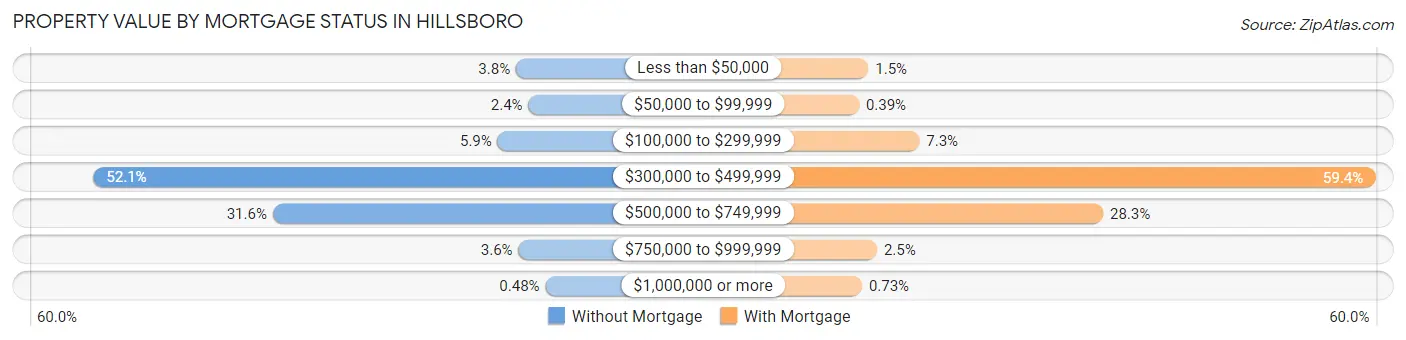
| Property Value | Without Mortgage | With Mortgage |
| Less than $50,000 | 208 (3.8%) | 221 (1.5%) |
| $50,000 to $99,999 | 131 (2.4%) | 59 (0.4%) |
| $100,000 to $299,999 | 322 (5.9%) | 1,102 (7.3%) |
| $300,000 to $499,999 | 2,826 (52.1%) | 8,973 (59.4%) |
| $500,000 to $749,999 | 1,715 (31.6%) | 4,275 (28.3%) |
| $750,000 to $999,999 | 193 (3.6%) | 370 (2.5%) |
| $1,000,000 or more | 26 (0.5%) | 111 (0.7%) |
| Total | 5,421 (100.0%) | 15,111 (100.0%) |
Household Income by Mortgage Status in Hillsboro
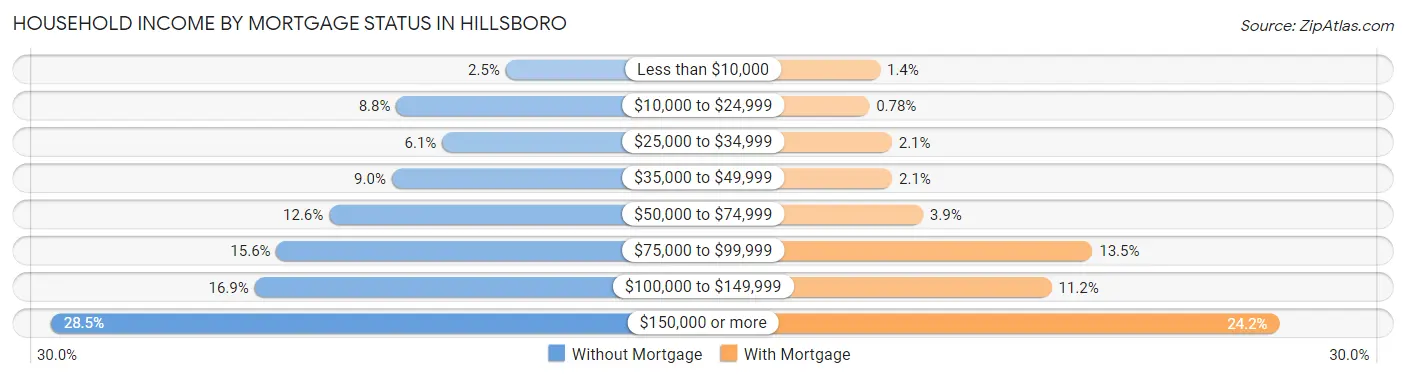
| Household Income | Without Mortgage | With Mortgage |
| Less than $10,000 | 136 (2.5%) | 211 (1.4%) |
| $10,000 to $24,999 | 475 (8.8%) | 118 (0.8%) |
| $25,000 to $34,999 | 333 (6.1%) | 313 (2.1%) |
| $35,000 to $49,999 | 489 (9.0%) | 316 (2.1%) |
| $50,000 to $74,999 | 683 (12.6%) | 582 (3.8%) |
| $75,000 to $99,999 | 846 (15.6%) | 2,045 (13.5%) |
| $100,000 to $149,999 | 914 (16.9%) | 1,692 (11.2%) |
| $150,000 or more | 1,545 (28.5%) | 3,660 (24.2%) |
| Total | 5,421 (100.0%) | 15,111 (100.0%) |
Property Value to Household Income Ratio in Hillsboro
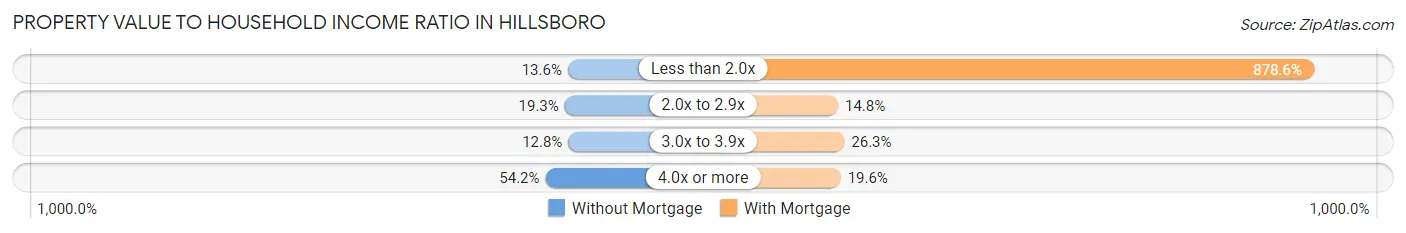
| Value-to-Income Ratio | Without Mortgage | With Mortgage |
| Less than 2.0x | 739 (13.6%) | 132,768 (878.6%) |
| 2.0x to 2.9x | 1,044 (19.3%) | 2,239 (14.8%) |
| 3.0x to 3.9x | 693 (12.8%) | 3,970 (26.3%) |
| 4.0x or more | 2,940 (54.2%) | 2,963 (19.6%) |
| Total | 5,421 (100.0%) | 15,111 (100.0%) |
Real Estate Taxes by Mortgage Status in Hillsboro
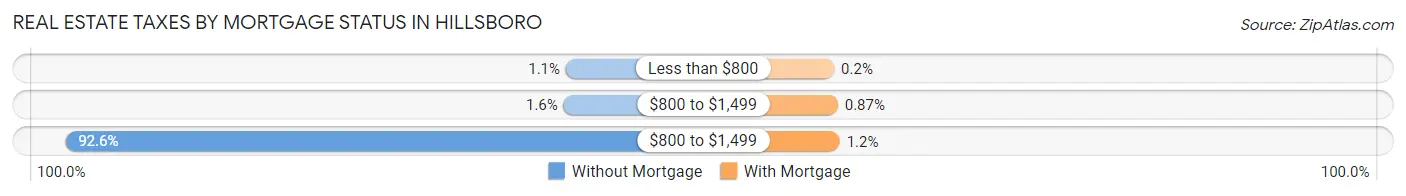
| Property Taxes | Without Mortgage | With Mortgage |
| Less than $800 | 62 (1.1%) | 30 (0.2%) |
| $800 to $1,499 | 84 (1.5%) | 131 (0.9%) |
| $800 to $1,499 | 5,019 (92.6%) | 184 (1.2%) |
| Total | 5,421 (100.0%) | 15,111 (100.0%) |
Health & Disability in Hillsboro
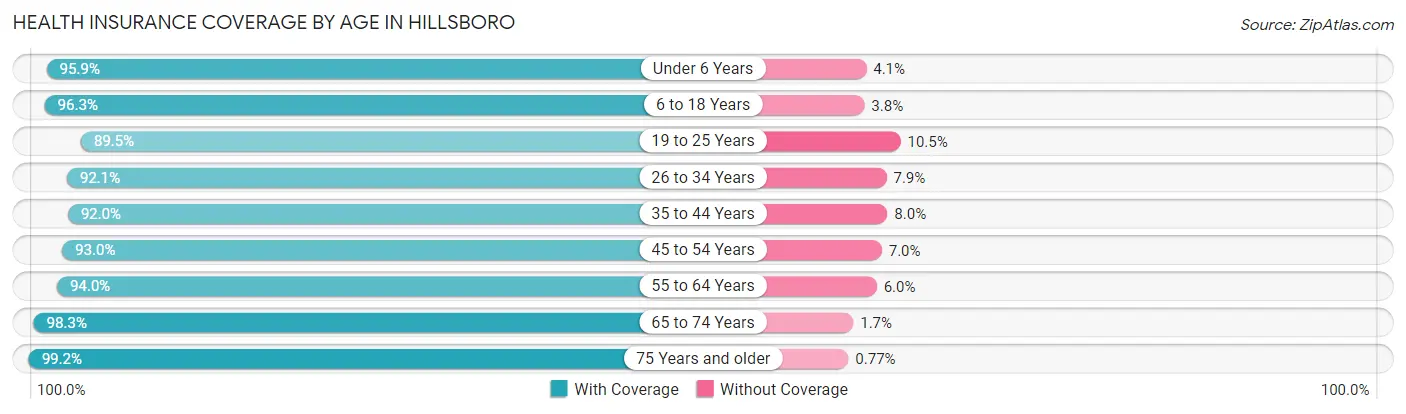
Health Insurance Coverage by Age in Hillsboro
| Age Bracket | With Coverage | Without Coverage |
| Under 6 Years | 7,389 (95.9%) | 316 (4.1%) |
| 6 to 18 Years | 16,285 (96.3%) | 635 (3.7%) |
| 19 to 25 Years | 8,908 (89.5%) | 1,044 (10.5%) |
| 26 to 34 Years | 17,971 (92.1%) | 1,537 (7.9%) |
| 35 to 44 Years | 15,822 (92.0%) | 1,384 (8.0%) |
| 45 to 54 Years | 11,397 (93.0%) | 856 (7.0%) |
| 55 to 64 Years | 9,786 (94.0%) | 629 (6.0%) |
| 65 to 74 Years | 7,272 (98.3%) | 124 (1.7%) |
| 75 Years and older | 4,273 (99.2%) | 33 (0.8%) |
| Total | 99,103 (93.8%) | 6,558 (6.2%) |
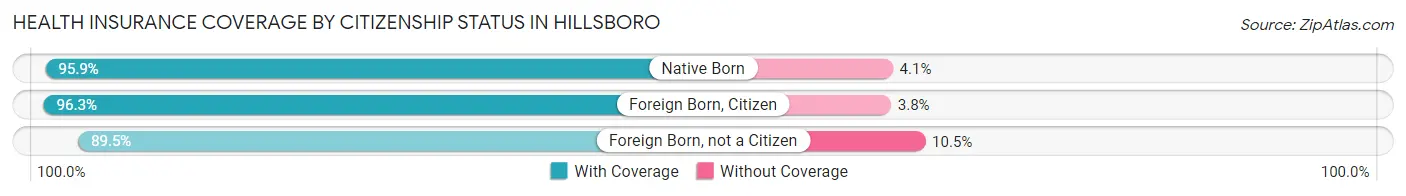
Health Insurance Coverage by Citizenship Status in Hillsboro
| Citizenship Status | With Coverage | Without Coverage |
| Native Born | 7,389 (95.9%) | 316 (4.1%) |
| Foreign Born, Citizen | 16,285 (96.3%) | 635 (3.7%) |
| Foreign Born, not a Citizen | 8,908 (89.5%) | 1,044 (10.5%) |
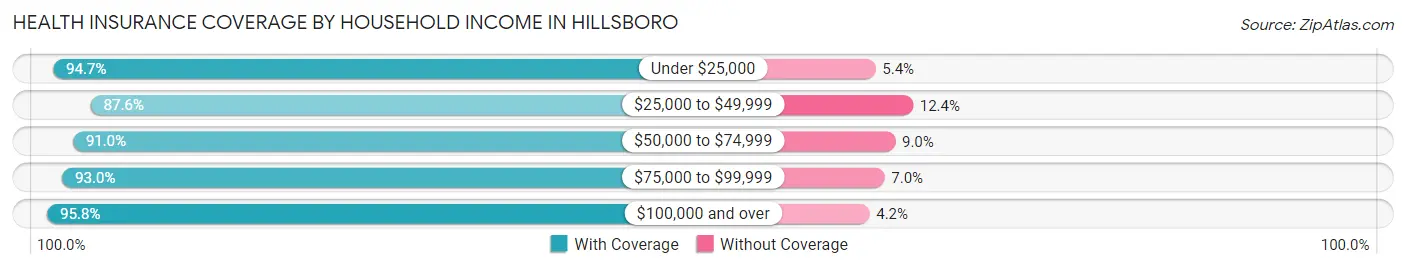
Health Insurance Coverage by Household Income in Hillsboro
| Household Income | With Coverage | Without Coverage |
| Under $25,000 | 4,922 (94.7%) | 278 (5.3%) |
| $25,000 to $49,999 | 9,591 (87.6%) | 1,354 (12.4%) |
| $50,000 to $74,999 | 14,848 (91.0%) | 1,476 (9.0%) |
| $75,000 to $99,999 | 13,053 (93.0%) | 987 (7.0%) |
| $100,000 and over | 56,016 (95.8%) | 2,461 (4.2%) |
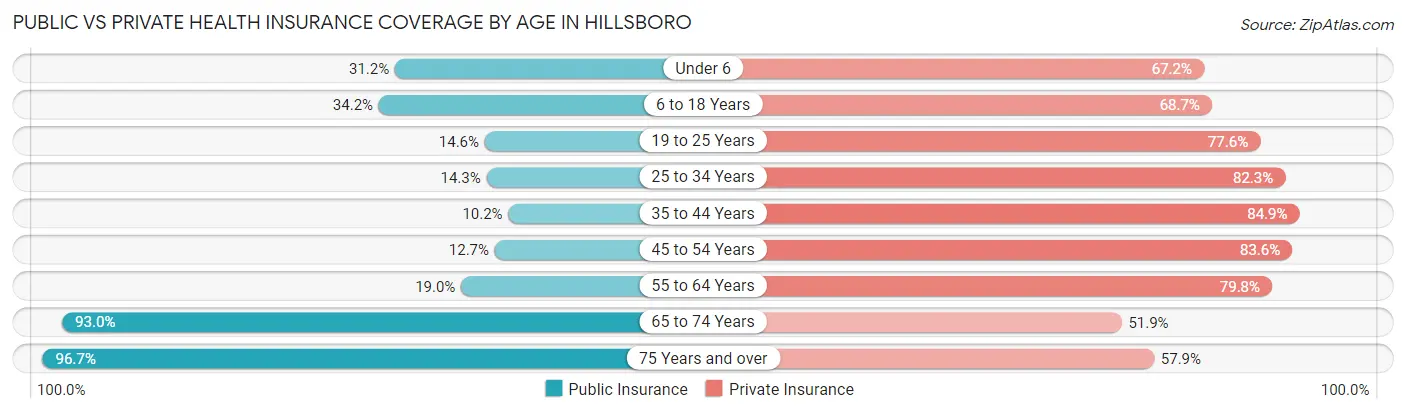
Public vs Private Health Insurance Coverage by Age in Hillsboro
| Age Bracket | Public Insurance | Private Insurance |
| Under 6 | 2,407 (31.2%) | 5,177 (67.2%) |
| 6 to 18 Years | 5,793 (34.2%) | 11,615 (68.6%) |
| 19 to 25 Years | 1,450 (14.6%) | 7,725 (77.6%) |
| 25 to 34 Years | 2,781 (14.3%) | 16,050 (82.3%) |
| 35 to 44 Years | 1,753 (10.2%) | 14,610 (84.9%) |
| 45 to 54 Years | 1,557 (12.7%) | 10,238 (83.6%) |
| 55 to 64 Years | 1,975 (19.0%) | 8,313 (79.8%) |
| 65 to 74 Years | 6,880 (93.0%) | 3,839 (51.9%) |
| 75 Years and over | 4,162 (96.7%) | 2,494 (57.9%) |
| Total | 28,758 (27.2%) | 80,061 (75.8%) |
Disability Status by Sex by Age in Hillsboro
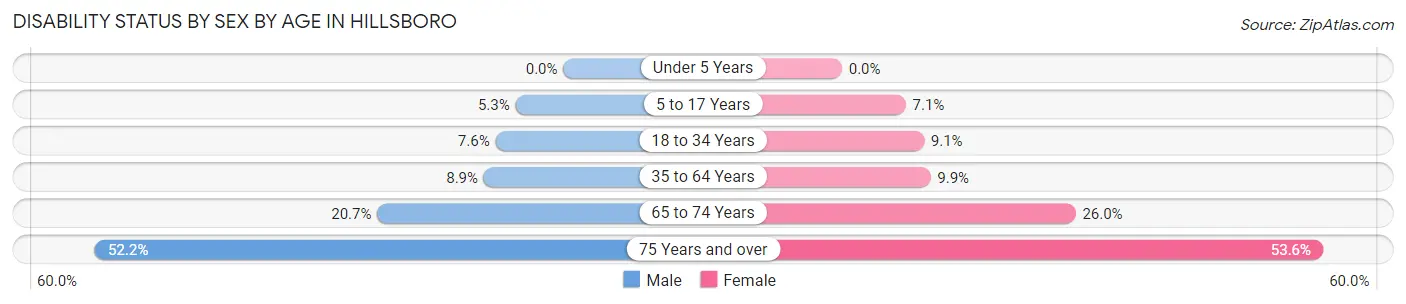
| Age Bracket | Male | Female |
| Under 5 Years | 0 (0.0%) | 0 (0.0%) |
| 5 to 17 Years | 480 (5.3%) | 555 (7.1%) |
| 18 to 34 Years | 1,165 (7.6%) | 1,411 (9.1%) |
| 35 to 64 Years | 1,805 (8.8%) | 1,921 (9.9%) |
| 65 to 74 Years | 683 (20.7%) | 1,067 (26.0%) |
| 75 Years and over | 917 (52.2%) | 1,365 (53.6%) |
Disability Class by Sex by Age in Hillsboro
Disability Class: Hearing Difficulty
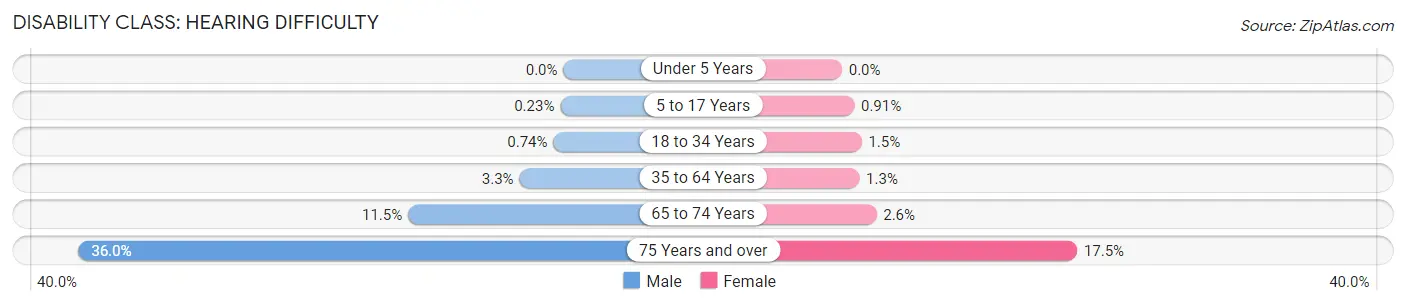
| Age Bracket | Male | Female |
| Under 5 Years | 0 (0.0%) | 0 (0.0%) |
| 5 to 17 Years | 21 (0.2%) | 71 (0.9%) |
| 18 to 34 Years | 114 (0.7%) | 225 (1.5%) |
| 35 to 64 Years | 664 (3.3%) | 251 (1.3%) |
| 65 to 74 Years | 380 (11.5%) | 105 (2.6%) |
| 75 Years and over | 633 (36.0%) | 445 (17.5%) |
Disability Class: Vision Difficulty
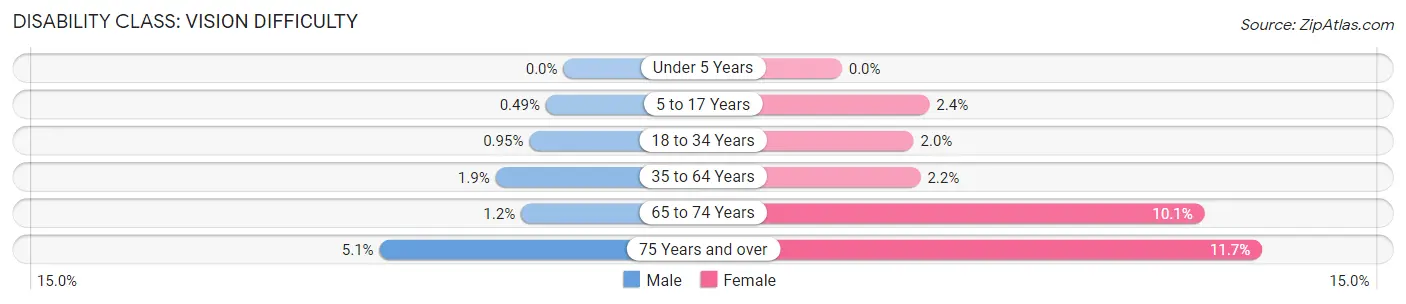
| Age Bracket | Male | Female |
| Under 5 Years | 0 (0.0%) | 0 (0.0%) |
| 5 to 17 Years | 44 (0.5%) | 190 (2.4%) |
| 18 to 34 Years | 146 (0.9%) | 308 (2.0%) |
| 35 to 64 Years | 386 (1.9%) | 426 (2.2%) |
| 65 to 74 Years | 39 (1.2%) | 414 (10.1%) |
| 75 Years and over | 90 (5.1%) | 298 (11.7%) |
Disability Class: Cognitive Difficulty
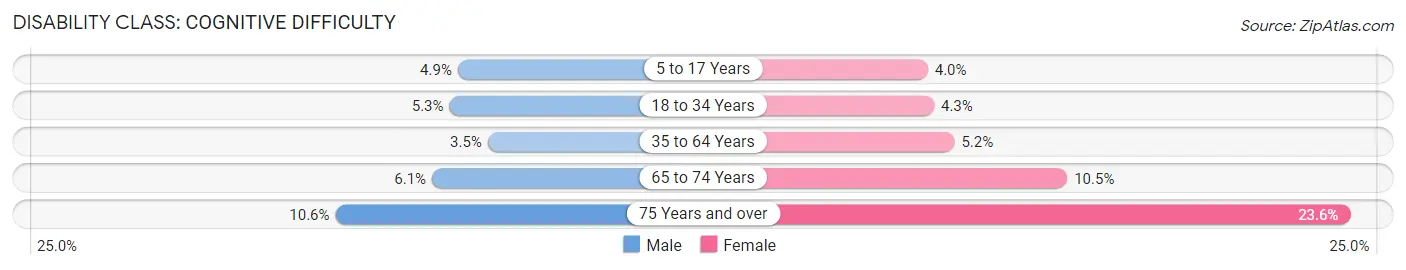
| Age Bracket | Male | Female |
| 5 to 17 Years | 442 (4.9%) | 311 (4.0%) |
| 18 to 34 Years | 815 (5.3%) | 660 (4.3%) |
| 35 to 64 Years | 716 (3.5%) | 1,018 (5.2%) |
| 65 to 74 Years | 201 (6.1%) | 429 (10.5%) |
| 75 Years and over | 186 (10.6%) | 601 (23.6%) |
Disability Class: Ambulatory Difficulty
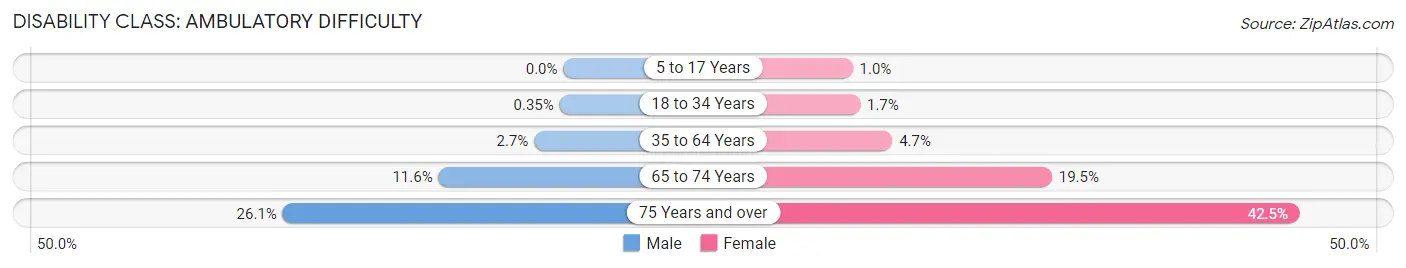
| Age Bracket | Male | Female |
| 5 to 17 Years | 0 (0.0%) | 78 (1.0%) |
| 18 to 34 Years | 54 (0.4%) | 261 (1.7%) |
| 35 to 64 Years | 552 (2.7%) | 911 (4.7%) |
| 65 to 74 Years | 382 (11.6%) | 799 (19.5%) |
| 75 Years and over | 458 (26.1%) | 1,083 (42.5%) |
Disability Class: Self-Care Difficulty
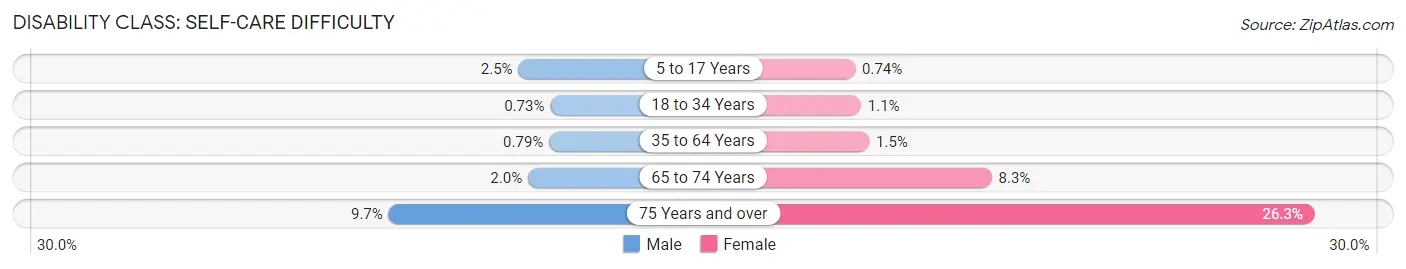
| Age Bracket | Male | Female |
| 5 to 17 Years | 225 (2.5%) | 58 (0.7%) |
| 18 to 34 Years | 113 (0.7%) | 164 (1.1%) |
| 35 to 64 Years | 162 (0.8%) | 296 (1.5%) |
| 65 to 74 Years | 65 (2.0%) | 342 (8.3%) |
| 75 Years and over | 171 (9.7%) | 671 (26.3%) |
Technology Access in Hillsboro
Computing Device Access in Hillsboro
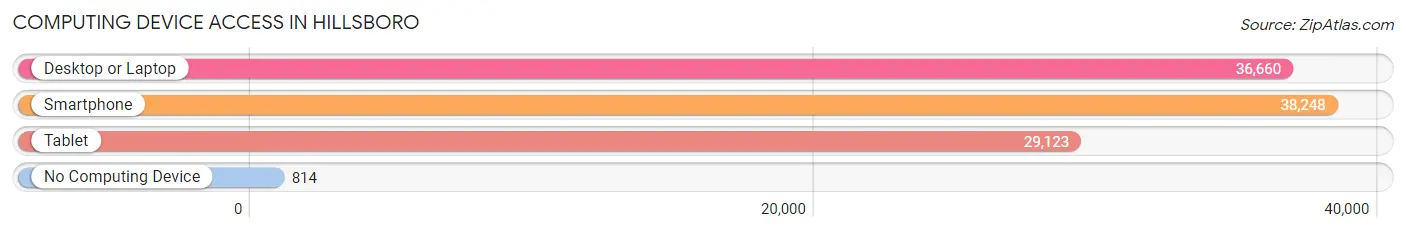
| Device Type | # Households | % Households |
| Desktop or Laptop | 36,660 | 90.2% |
| Smartphone | 38,248 | 94.1% |
| Tablet | 29,123 | 71.7% |
| No Computing Device | 814 | 2.0% |
| Total | 40,633 | 100.0% |
Internet Access in Hillsboro
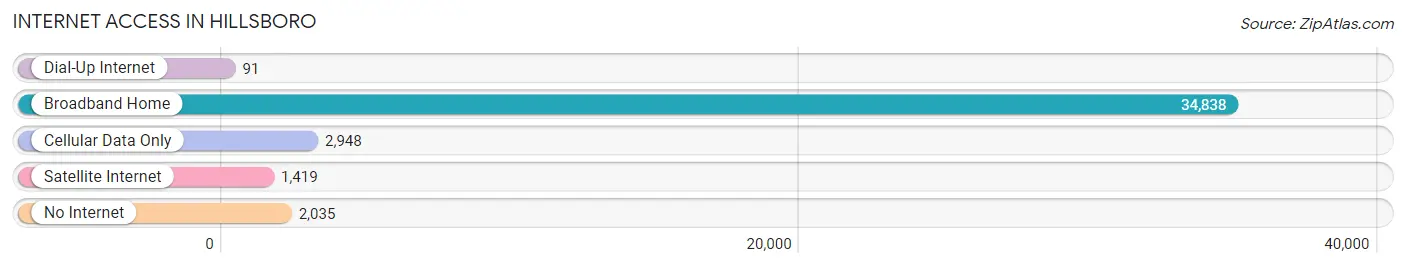
| Internet Type | # Households | % Households |
| Dial-Up Internet | 91 | 0.2% |
| Broadband Home | 34,838 | 85.7% |
| Cellular Data Only | 2,948 | 7.3% |
| Satellite Internet | 1,419 | 3.5% |
| No Internet | 2,035 | 5.0% |
| Total | 40,633 | 100.0% |
Hillsboro Summary
Hillsboro is a city located in the state of Oregon, in the United States of America. It is the fifth-largest city in the state, with a population of over 100,000 people. The city is located in Washington County, and is part of the Portland metropolitan area. Hillsboro is known for its vibrant economy, diverse culture, and strong sense of community.
Geography
Hillsboro is located in the Tualatin Valley, in the foothills of the Oregon Coast Range. The city is situated on the Tualatin River, and is surrounded by rolling hills and lush forests. The city is located about 20 miles west of Portland, and is part of the Portland metropolitan area. The city has a total area of 24.2 square miles, of which 23.9 square miles is land and 0.3 square miles is water.
Climate
Hillsboro has a mild climate, with warm summers and cool winters. The average temperature in the summer is around 75 degrees Fahrenheit, and the average temperature in the winter is around 40 degrees Fahrenheit. The city receives an average of 37 inches of precipitation per year, with most of it falling in the winter months.
Demographics
As of the 2010 census, the population of Hillsboro was 91,611. The racial makeup of the city was 73.3% White, 8.2% Hispanic or Latino, 6.2% Asian, 4.2% African American, 0.7% Native American, and 0.4% Pacific Islander. The median household income in the city was $60,845, and the median family income was $71,817.
Economy
Hillsboro is home to a vibrant and diverse economy. The city is home to several major employers, including Intel, Nike, and SolarWorld. The city is also home to a number of smaller businesses, including tech startups, restaurants, and retail stores. The city is also home to several educational institutions, including Oregon Health & Science University, Pacific University, and Hillsboro Community College.
The city is also home to a number of cultural attractions, including the Rice Northwest Museum of Rocks and Minerals, the Gordon Faber Recreation Complex, and the Hillsboro Farmers Market. The city is also home to a number of parks and outdoor recreation areas, including Jackson Bottom Wetlands Preserve, Jackson Bottom Wildlife Refuge, and the Tualatin River National Wildlife Refuge.
Conclusion
Hillsboro is a vibrant and diverse city located in the state of Oregon. The city is home to a strong economy, diverse culture, and strong sense of community. The city is home to several major employers, educational institutions, and cultural attractions. The city is also home to a number of parks and outdoor recreation areas. Hillsboro is a great place to live, work, and play.
Common Questions
What is Per Capita Income in Hillsboro?
Per Capita income in Hillsboro is $47,232.
What is the Median Family Income in Hillsboro?
Median Family Income in Hillsboro is $110,200.
What is the Median Household income in Hillsboro?
Median Household Income in Hillsboro is $98,891.
What is Income or Wage Gap in Hillsboro?
Income or Wage Gap in Hillsboro is 35.4%.
Women in Hillsboro earn 64.6 cents for every dollar earned by a man.
What is Family Income Deficit in Hillsboro?
Family Income Deficit in Hillsboro is $11,533.
Families that are below poverty line in Hillsboro earn $11,533 less on average than the poverty threshold level.
What is Inequality or Gini Index in Hillsboro?
Inequality or Gini Index in Hillsboro is 0.40.
What is the Total Population of Hillsboro?
Total Population of Hillsboro is 106,612.
What is the Total Male Population of Hillsboro?
Total Male Population of Hillsboro is 53,839.
What is the Total Female Population of Hillsboro?
Total Female Population of Hillsboro is 52,773.
What is the Ratio of Males per 100 Females in Hillsboro?
There are 102.02 Males per 100 Females in Hillsboro.
What is the Ratio of Females per 100 Males in Hillsboro?
There are 98.02 Females per 100 Males in Hillsboro.
What is the Median Population Age in Hillsboro?
Median Population Age in Hillsboro is 34.5 Years.
What is the Average Family Size in Hillsboro
Average Family Size in Hillsboro is 3.1 People.
What is the Average Household Size in Hillsboro
Average Household Size in Hillsboro is 2.6 People.
How Large is the Labor Force in Hillsboro?
There are 60,977 People in the Labor Forcein in Hillsboro.
What is the Percentage of People in the Labor Force in Hillsboro?
71.1% of People are in the Labor Force in Hillsboro.
What is the Unemployment Rate in Hillsboro?
Unemployment Rate in Hillsboro is 4.6%.