Tustin, CA Map & Demographics
Tustin Map
Tustin Overview
$47,648
PER CAPITA INCOME
$116,749
AVG FAMILY INCOME
$102,065
AVG HOUSEHOLD INCOME
26.5%
WAGE / INCOME GAP [ % ]
73.5¢/ $1
WAGE / INCOME GAP [ $ ]
$8,794
FAMILY INCOME DEFICIT
0.45
INEQUALITY / GINI INDEX
79,514
TOTAL POPULATION
39,440
MALE POPULATION
40,074
FEMALE POPULATION
98.42
MALES / 100 FEMALES
101.61
FEMALES / 100 MALES
36.2
MEDIAN AGE
3.4
AVG FAMILY SIZE
3.0
AVG HOUSEHOLD SIZE
43,314
LABOR FORCE [ PEOPLE ]
69.0%
PERCENT IN LABOR FORCE
5.9%
UNEMPLOYMENT RATE
Tustin Area Codes
Income in Tustin
Income Overview in Tustin
Per Capita Income in Tustin is $47,648, while median incomes of families and households are $116,749 and $102,065 respectively.
| Characteristic | Number | Measure |
| Per Capita Income | 79,514 | $47,648 |
| Median Family Income | 19,320 | $116,749 |
| Mean Family Income | 19,320 | $154,811 |
| Median Household Income | 26,508 | $102,065 |
| Mean Household Income | 26,508 | $139,477 |
| Income Deficit | 19,320 | $8,794 |
| Wage / Income Gap (%) | 79,514 | 26.49% |
| Wage / Income Gap ($) | 79,514 | 73.51¢ per $1 |
| Gini / Inequality Index | 79,514 | 0.45 |
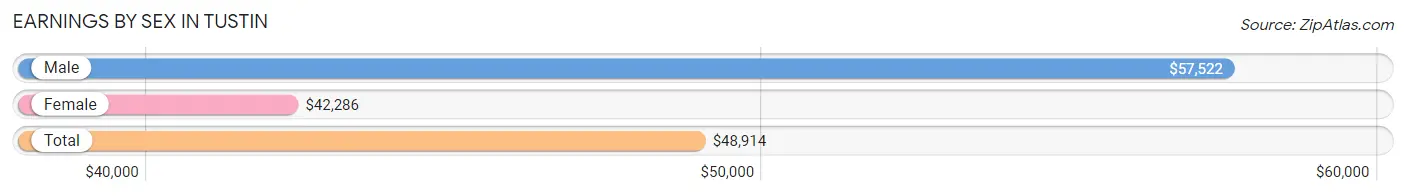
Earnings by Sex in Tustin
Average Earnings in Tustin are $48,914, $57,522 for men and $42,286 for women, a difference of 26.5%.
| Sex | Number | Average Earnings |
| Male | 23,088 (52.2%) | $57,522 |
| Female | 21,107 (47.8%) | $42,286 |
| Total | 44,195 (100.0%) | $48,914 |
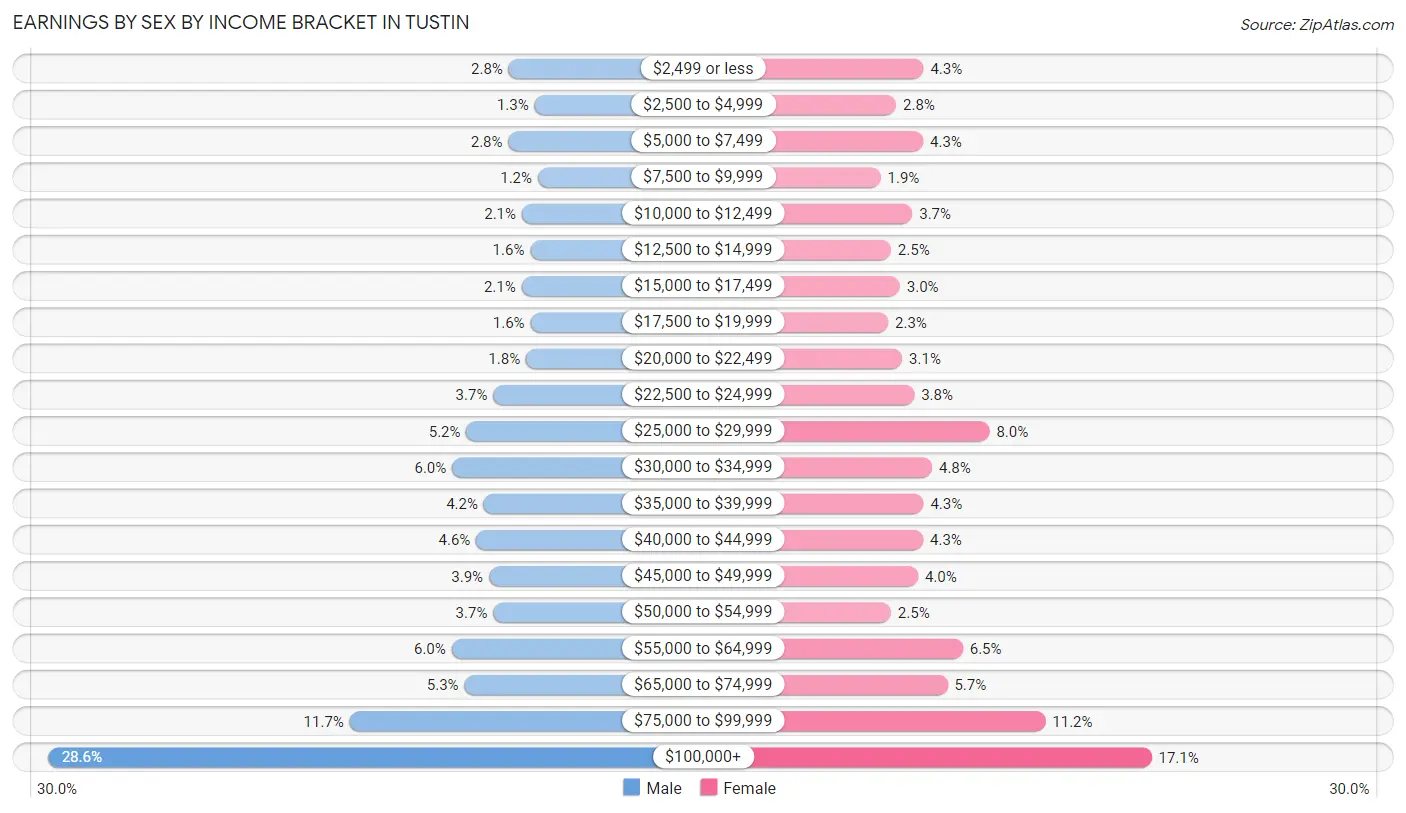
Earnings by Sex by Income Bracket in Tustin
The most common earnings brackets in Tustin are $100,000+ for men (6,613 | 28.6%) and $100,000+ for women (3,616 | 17.1%).
| Income | Male | Female |
| $2,499 or less | 644 (2.8%) | 910 (4.3%) |
| $2,500 to $4,999 | 309 (1.3%) | 584 (2.8%) |
| $5,000 to $7,499 | 649 (2.8%) | 905 (4.3%) |
| $7,500 to $9,999 | 266 (1.1%) | 402 (1.9%) |
| $10,000 to $12,499 | 473 (2.1%) | 777 (3.7%) |
| $12,500 to $14,999 | 365 (1.6%) | 523 (2.5%) |
| $15,000 to $17,499 | 478 (2.1%) | 629 (3.0%) |
| $17,500 to $19,999 | 362 (1.6%) | 490 (2.3%) |
| $20,000 to $22,499 | 421 (1.8%) | 657 (3.1%) |
| $22,500 to $24,999 | 844 (3.7%) | 800 (3.8%) |
| $25,000 to $29,999 | 1,193 (5.2%) | 1,693 (8.0%) |
| $30,000 to $34,999 | 1,379 (6.0%) | 1,012 (4.8%) |
| $35,000 to $39,999 | 967 (4.2%) | 910 (4.3%) |
| $40,000 to $44,999 | 1,066 (4.6%) | 905 (4.3%) |
| $45,000 to $49,999 | 901 (3.9%) | 845 (4.0%) |
| $50,000 to $54,999 | 846 (3.7%) | 524 (2.5%) |
| $55,000 to $64,999 | 1,385 (6.0%) | 1,376 (6.5%) |
| $65,000 to $74,999 | 1,219 (5.3%) | 1,194 (5.7%) |
| $75,000 to $99,999 | 2,708 (11.7%) | 2,355 (11.2%) |
| $100,000+ | 6,613 (28.6%) | 3,616 (17.1%) |
| Total | 23,088 (100.0%) | 21,107 (100.0%) |
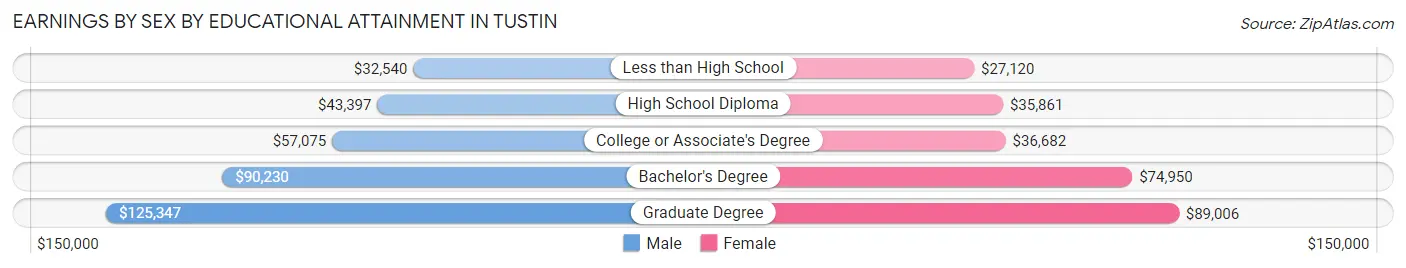
Earnings by Sex by Educational Attainment in Tustin
Average earnings in Tustin are $68,426 for men and $47,246 for women, a difference of 30.9%. Men with an educational attainment of graduate degree enjoy the highest average annual earnings of $125,347, while those with less than high school education earn the least with $32,540. Women with an educational attainment of graduate degree earn the most with the average annual earnings of $89,006, while those with less than high school education have the smallest earnings of $27,120.
| Educational Attainment | Male Income | Female Income |
| Less than High School | $32,540 | $27,120 |
| High School Diploma | $43,397 | $35,861 |
| College or Associate's Degree | $57,075 | $36,682 |
| Bachelor's Degree | $90,230 | $74,950 |
| Graduate Degree | $125,347 | $89,006 |
| Total | $68,426 | $47,246 |
Family Income in Tustin
Family Income Brackets in Tustin
According to the Tustin family income data, there are 4,869 families falling into the $200,000+ income range, which is the most common income bracket and makes up 25.2% of all families. Conversely, the less than $10,000 income bracket is the least frequent group with only 328 families (1.7%) belonging to this category.
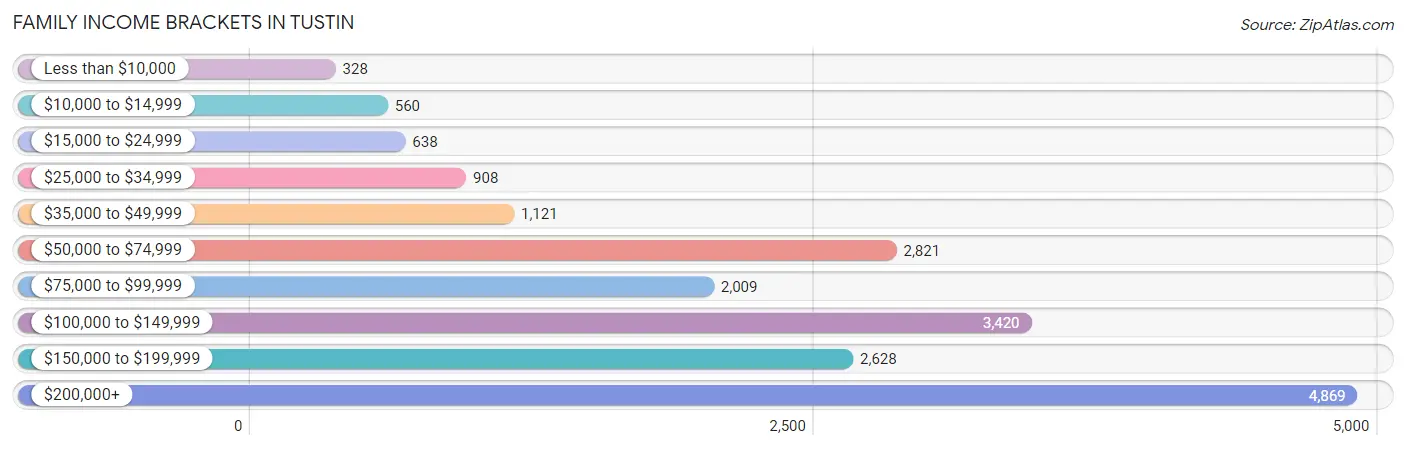
| Income Bracket | # Families | % Families |
| Less than $10,000 | 328 | 1.7% |
| $10,000 to $14,999 | 560 | 2.9% |
| $15,000 to $24,999 | 638 | 3.3% |
| $25,000 to $34,999 | 908 | 4.7% |
| $35,000 to $49,999 | 1,121 | 5.8% |
| $50,000 to $74,999 | 2,821 | 14.6% |
| $75,000 to $99,999 | 2,009 | 10.4% |
| $100,000 to $149,999 | 3,420 | 17.7% |
| $150,000 to $199,999 | 2,628 | 13.6% |
| $200,000+ | 4,869 | 25.2% |
Family Income by Famaliy Size in Tustin
7+ person families (430 | 2.2%) account for the highest median family income in Tustin with $135,417 per family, while 2-person families (7,367 | 38.1%) have the highest median income of $49,698 per family member.
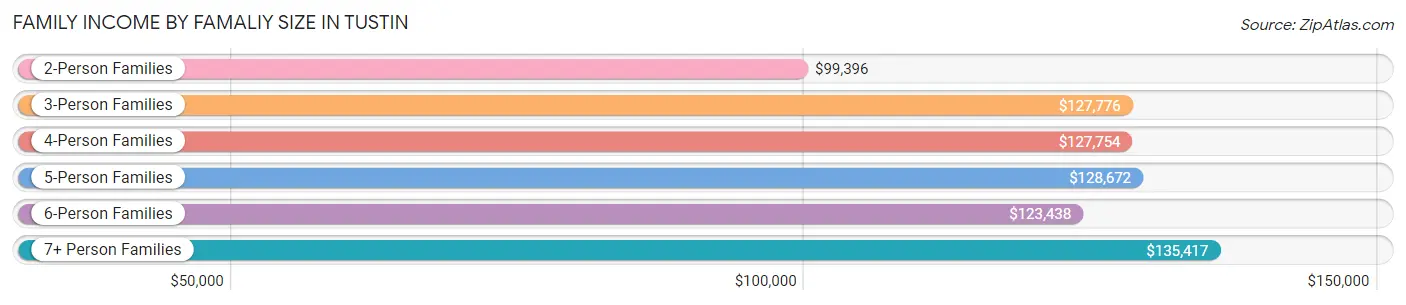
| Income Bracket | # Families | Median Income |
| 2-Person Families | 7,367 (38.1%) | $99,396 |
| 3-Person Families | 4,167 (21.6%) | $127,776 |
| 4-Person Families | 4,634 (24.0%) | $127,754 |
| 5-Person Families | 2,010 (10.4%) | $128,672 |
| 6-Person Families | 712 (3.7%) | $123,438 |
| 7+ Person Families | 430 (2.2%) | $135,417 |
| Total | 19,320 (100.0%) | $116,749 |
Family Income by Number of Earners in Tustin
The median family income in Tustin is $116,749, with families comprising 3+ earners (3,216) having the highest median family income of $154,091, while families with no earners (1,857) have the lowest median family income of $26,484, accounting for 16.7% and 9.6% of families, respectively.
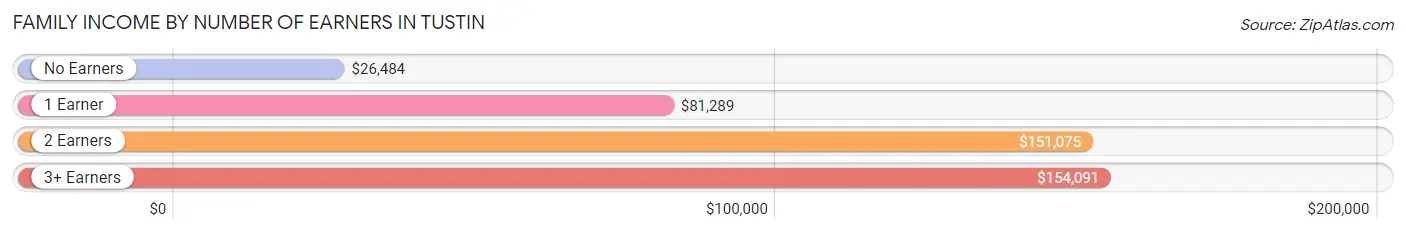
| Number of Earners | # Families | Median Income |
| No Earners | 1,857 (9.6%) | $26,484 |
| 1 Earner | 5,451 (28.2%) | $81,289 |
| 2 Earners | 8,796 (45.5%) | $151,075 |
| 3+ Earners | 3,216 (16.7%) | $154,091 |
| Total | 19,320 (100.0%) | $116,749 |
Household Income in Tustin
Household Income Brackets in Tustin
With 5,514 households falling in the category, the $200,000+ income range is the most frequent in Tustin, accounting for 20.8% of all households. In contrast, only 795 households (3.0%) fall into the less than $10,000 income bracket, making it the least populous group.
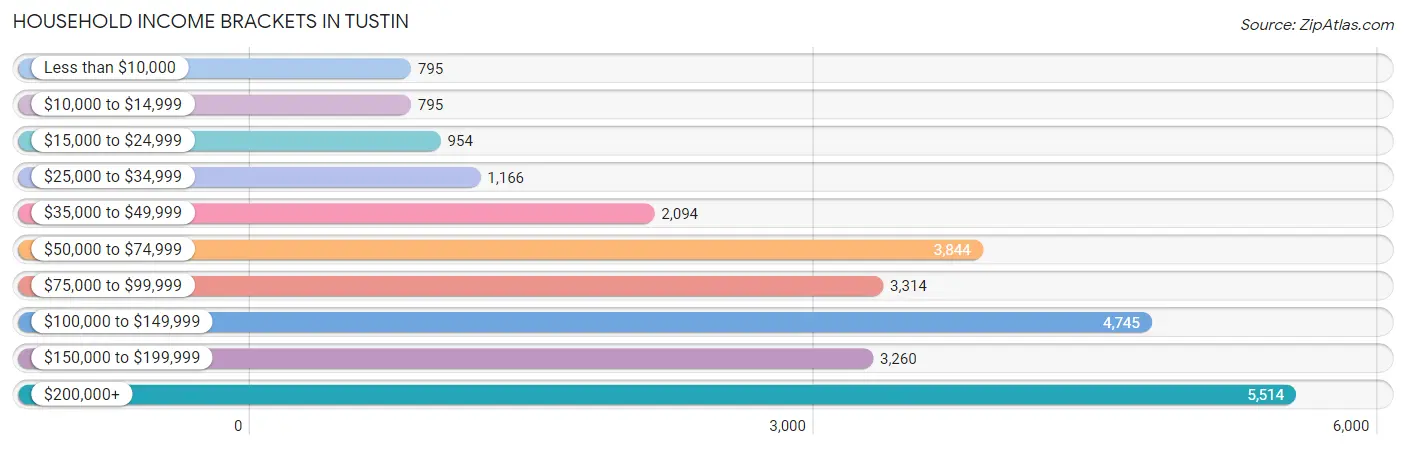
| Income Bracket | # Households | % Households |
| Less than $10,000 | 795 | 3.0% |
| $10,000 to $14,999 | 795 | 3.0% |
| $15,000 to $24,999 | 954 | 3.6% |
| $25,000 to $34,999 | 1,166 | 4.4% |
| $35,000 to $49,999 | 2,094 | 7.9% |
| $50,000 to $74,999 | 3,844 | 14.5% |
| $75,000 to $99,999 | 3,314 | 12.5% |
| $100,000 to $149,999 | 4,745 | 17.9% |
| $150,000 to $199,999 | 3,260 | 12.3% |
| $200,000+ | 5,514 | 20.8% |
Household Income by Householder Age in Tustin
The median household income in Tustin is $102,065, with the highest median household income of $127,516 found in the 45 to 64 years age bracket for the primary householder. A total of 10,370 households (39.1%) fall into this category. Meanwhile, the 65+ years age bracket for the primary householder has the lowest median household income of $62,922, with 5,482 households (20.7%) in this group.
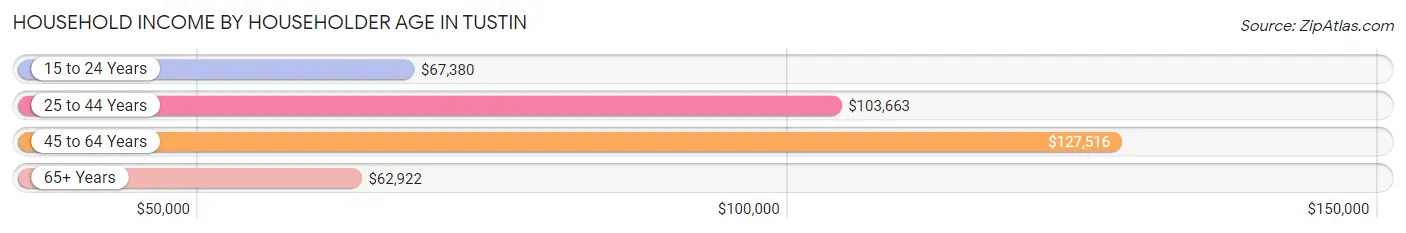
| Income Bracket | # Households | Median Income |
| 15 to 24 Years | 768 (2.9%) | $67,380 |
| 25 to 44 Years | 9,888 (37.3%) | $103,663 |
| 45 to 64 Years | 10,370 (39.1%) | $127,516 |
| 65+ Years | 5,482 (20.7%) | $62,922 |
| Total | 26,508 (100.0%) | $102,065 |
Poverty in Tustin
Income Below Poverty by Sex and Age in Tustin
With 9.0% poverty level for males and 11.1% for females among the residents of Tustin, under 5 year old males and 65 to 74 year old females are the most vulnerable to poverty, with 784 males (25.4%) and 624 females (20.0%) in their respective age groups living below the poverty level.
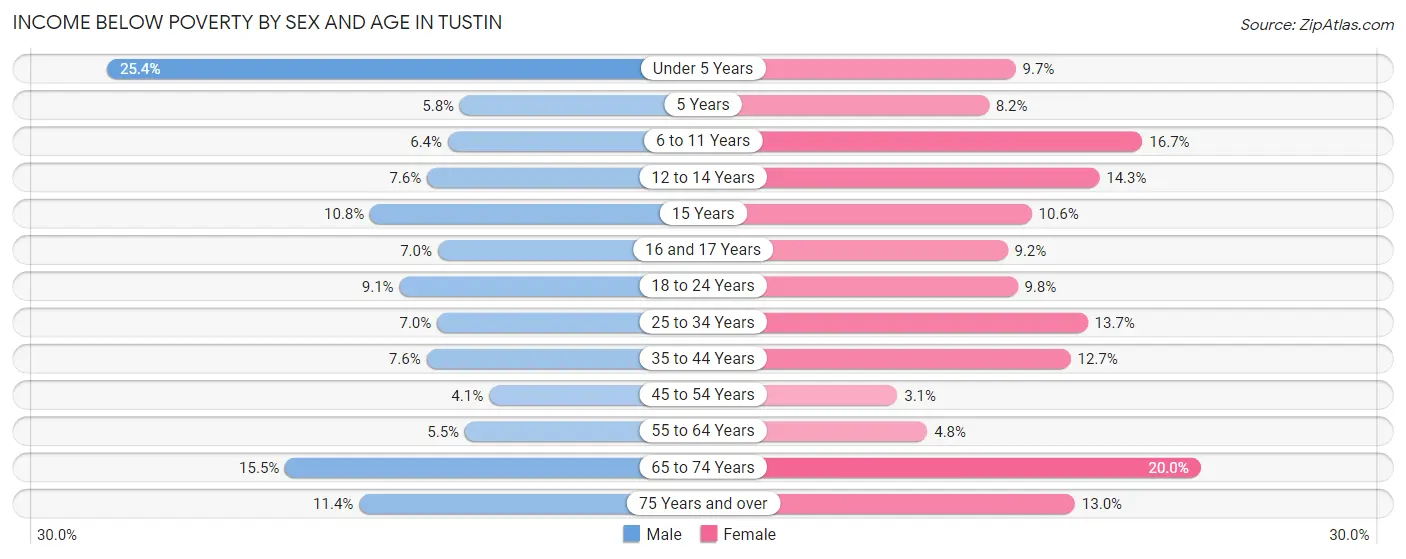
| Age Bracket | Male | Female |
| Under 5 Years | 784 (25.4%) | 200 (9.7%) |
| 5 Years | 22 (5.8%) | 27 (8.2%) |
| 6 to 11 Years | 185 (6.4%) | 516 (16.7%) |
| 12 to 14 Years | 176 (7.6%) | 223 (14.3%) |
| 15 Years | 48 (10.8%) | 35 (10.6%) |
| 16 and 17 Years | 93 (7.0%) | 84 (9.2%) |
| 18 to 24 Years | 356 (9.1%) | 365 (9.8%) |
| 25 to 34 Years | 394 (7.0%) | 831 (13.7%) |
| 35 to 44 Years | 423 (7.6%) | 770 (12.7%) |
| 45 to 54 Years | 209 (4.1%) | 166 (3.1%) |
| 55 to 64 Years | 248 (5.5%) | 208 (4.8%) |
| 65 to 74 Years | 436 (15.5%) | 624 (20.0%) |
| 75 Years and over | 148 (11.4%) | 381 (13.0%) |
| Total | 3,522 (9.0%) | 4,430 (11.1%) |
Income Above Poverty by Sex and Age in Tustin
According to the poverty statistics in Tustin, males aged 45 to 54 years and females aged 45 to 54 years are the age groups that are most secure financially, with 95.9% of males and 96.9% of females in these age groups living above the poverty line.
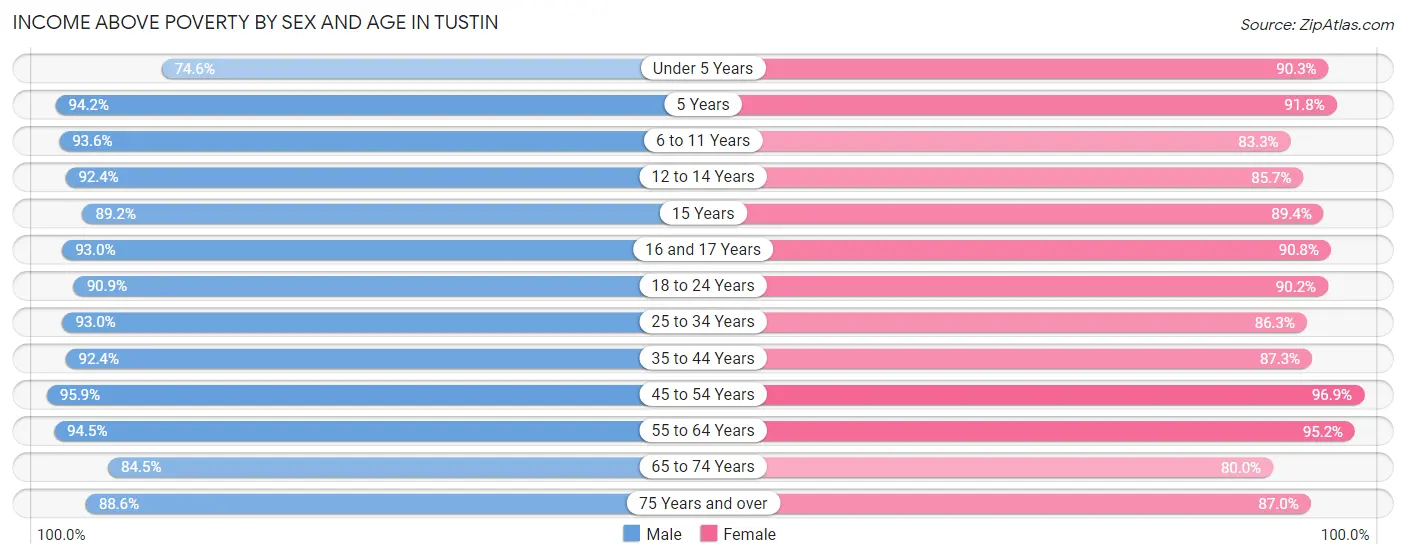
| Age Bracket | Male | Female |
| Under 5 Years | 2,301 (74.6%) | 1,867 (90.3%) |
| 5 Years | 360 (94.2%) | 303 (91.8%) |
| 6 to 11 Years | 2,693 (93.6%) | 2,566 (83.3%) |
| 12 to 14 Years | 2,144 (92.4%) | 1,332 (85.7%) |
| 15 Years | 398 (89.2%) | 296 (89.4%) |
| 16 and 17 Years | 1,237 (93.0%) | 826 (90.8%) |
| 18 to 24 Years | 3,544 (90.9%) | 3,369 (90.2%) |
| 25 to 34 Years | 5,212 (93.0%) | 5,241 (86.3%) |
| 35 to 44 Years | 5,131 (92.4%) | 5,273 (87.3%) |
| 45 to 54 Years | 4,837 (95.9%) | 5,206 (96.9%) |
| 55 to 64 Years | 4,278 (94.5%) | 4,166 (95.2%) |
| 65 to 74 Years | 2,379 (84.5%) | 2,499 (80.0%) |
| 75 Years and over | 1,154 (88.6%) | 2,555 (87.0%) |
| Total | 35,668 (91.0%) | 35,499 (88.9%) |
Income Below Poverty Among Married-Couple Families in Tustin
The poverty statistics for married-couple families in Tustin show that 5.2% or 730 of the total 13,931 families live below the poverty line. Families with no children have the highest poverty rate of 7.4%, comprising of 535 families. On the other hand, families with 5 or more children have the lowest poverty rate of 0.0%, which includes 0 families.
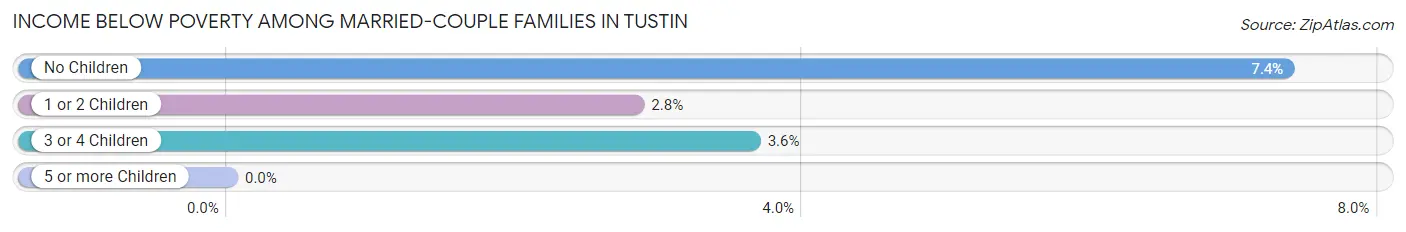
| Children | Above Poverty | Below Poverty |
| No Children | 6,737 (92.6%) | 535 (7.4%) |
| 1 or 2 Children | 5,262 (97.2%) | 153 (2.8%) |
| 3 or 4 Children | 1,112 (96.4%) | 42 (3.6%) |
| 5 or more Children | 90 (100.0%) | 0 (0.0%) |
| Total | 13,201 (94.8%) | 730 (5.2%) |
Income Below Poverty Among Single-Parent Households in Tustin
According to the poverty data in Tustin, 3.0% or 51 single-father households and 21.0% or 777 single-mother households are living below the poverty line. Among single-father households, those with 3 or 4 children have the highest poverty rate, with 15 households (16.7%) experiencing poverty. Likewise, among single-mother households, those with 5 or more children have the highest poverty rate, with 8 households (100.0%) falling below the poverty line.
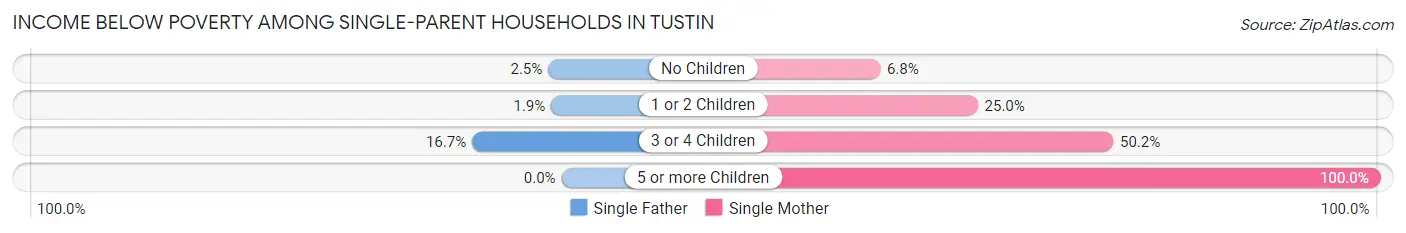
| Children | Single Father | Single Mother |
| No Children | 23 (2.5%) | 112 (6.8%) |
| 1 or 2 Children | 13 (1.9%) | 360 (24.9%) |
| 3 or 4 Children | 15 (16.7%) | 297 (50.2%) |
| 5 or more Children | 0 (0.0%) | 8 (100.0%) |
| Total | 51 (3.0%) | 777 (21.0%) |
Income Below Poverty Among Married-Couple vs Single-Parent Households in Tustin
The poverty data for Tustin shows that 730 of the married-couple family households (5.2%) and 828 of the single-parent households (15.4%) are living below the poverty level. Within the married-couple family households, those with no children have the highest poverty rate, with 535 households (7.4%) falling below the poverty line. Among the single-parent households, those with 5 or more children have the highest poverty rate, with 8 household (100.0%) living below poverty.
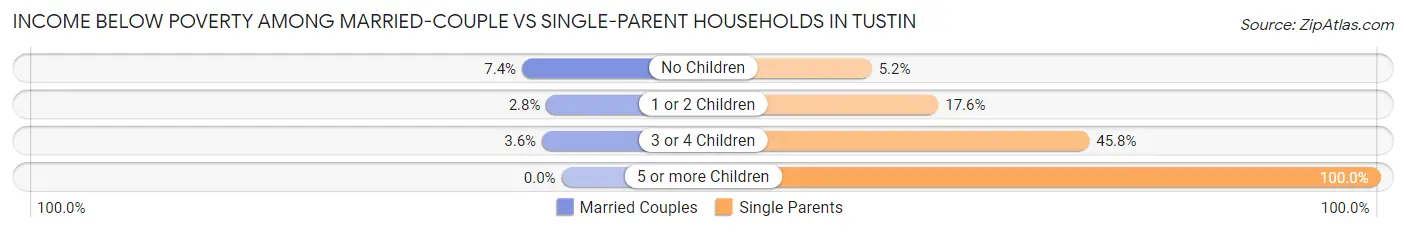
| Children | Married-Couple Families | Single-Parent Households |
| No Children | 535 (7.4%) | 135 (5.2%) |
| 1 or 2 Children | 153 (2.8%) | 373 (17.6%) |
| 3 or 4 Children | 42 (3.6%) | 312 (45.8%) |
| 5 or more Children | 0 (0.0%) | 8 (100.0%) |
| Total | 730 (5.2%) | 828 (15.4%) |
Race in Tustin
The most populous races in Tustin are White / Caucasian (33,299 | 41.9%), Hispanic or Latino (32,131 | 40.4%), and Asian (20,187 | 25.4%).
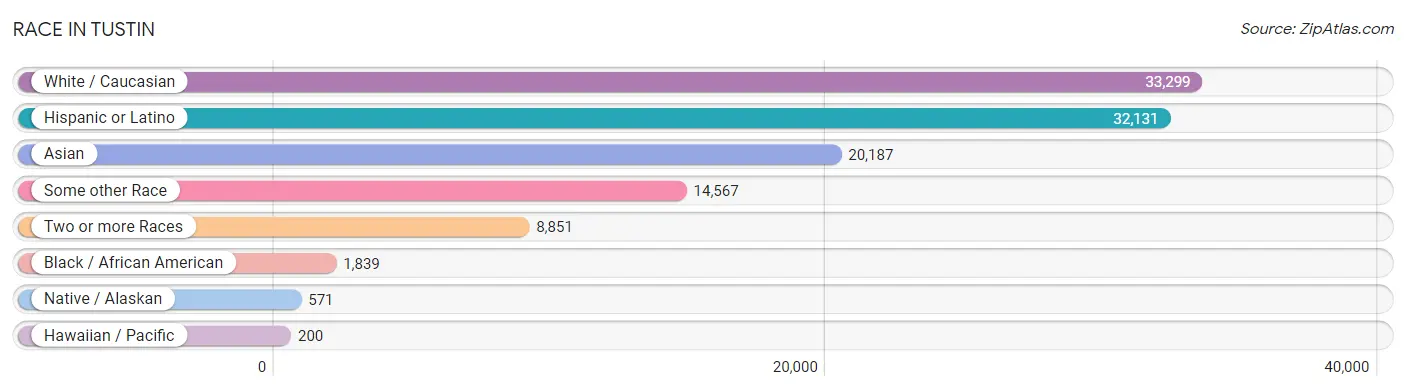
| Race | # Population | % Population |
| Asian | 20,187 | 25.4% |
| Black / African American | 1,839 | 2.3% |
| Hawaiian / Pacific | 200 | 0.3% |
| Hispanic or Latino | 32,131 | 40.4% |
| Native / Alaskan | 571 | 0.7% |
| White / Caucasian | 33,299 | 41.9% |
| Two or more Races | 8,851 | 11.1% |
| Some other Race | 14,567 | 18.3% |
| Total | 79,514 | 100.0% |
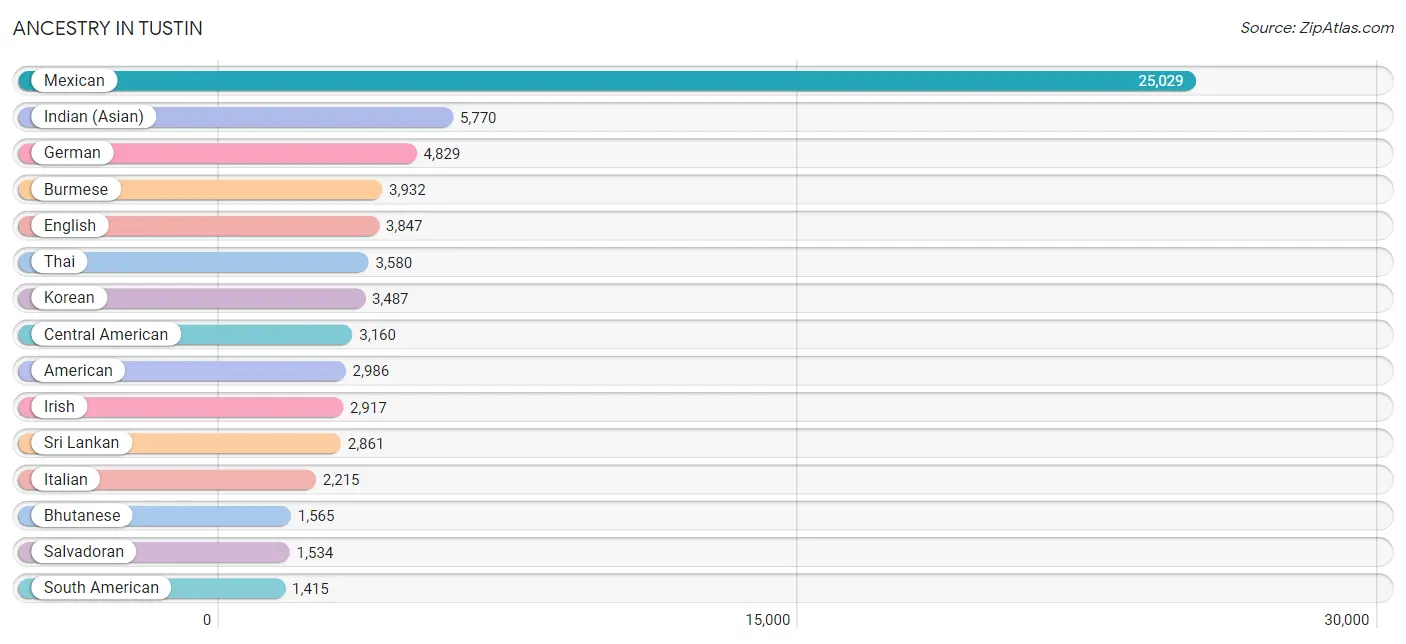
Ancestry in Tustin
The most populous ancestries reported in Tustin are Mexican (25,029 | 31.5%), Indian (Asian) (5,770 | 7.3%), German (4,829 | 6.1%), Burmese (3,932 | 5.0%), and English (3,847 | 4.8%), together accounting for 54.6% of all Tustin residents.
| Ancestry | # Population | % Population |
| Afghan | 257 | 0.3% |
| African | 192 | 0.2% |
| Albanian | 14 | 0.0% |
| American | 2,986 | 3.8% |
| Apache | 19 | 0.0% |
| Arab | 754 | 0.9% |
| Argentinean | 95 | 0.1% |
| Armenian | 381 | 0.5% |
| Assyrian / Chaldean / Syriac | 45 | 0.1% |
| Austrian | 70 | 0.1% |
| Basque | 4 | 0.0% |
| Belgian | 55 | 0.1% |
| Belizean | 10 | 0.0% |
| Bhutanese | 1,565 | 2.0% |
| Bolivian | 232 | 0.3% |
| Brazilian | 30 | 0.0% |
| British | 327 | 0.4% |
| Bulgarian | 84 | 0.1% |
| Burmese | 3,932 | 5.0% |
| Canadian | 174 | 0.2% |
| Central American | 3,160 | 4.0% |
| Central American Indian | 232 | 0.3% |
| Cherokee | 93 | 0.1% |
| Chilean | 231 | 0.3% |
| Chinese | 22 | 0.0% |
| Choctaw | 40 | 0.1% |
| Colombian | 232 | 0.3% |
| Costa Rican | 44 | 0.1% |
| Croatian | 26 | 0.0% |
| Cuban | 302 | 0.4% |
| Czech | 119 | 0.2% |
| Czechoslovakian | 53 | 0.1% |
| Danish | 209 | 0.3% |
| Dominican | 27 | 0.0% |
| Dutch | 806 | 1.0% |
| Eastern European | 203 | 0.3% |
| Ecuadorian | 55 | 0.1% |
| Egyptian | 207 | 0.3% |
| English | 3,847 | 4.8% |
| Estonian | 16 | 0.0% |
| Ethiopian | 17 | 0.0% |
| European | 1,045 | 1.3% |
| Filipino | 719 | 0.9% |
| Finnish | 42 | 0.1% |
| French | 1,300 | 1.6% |
| French Canadian | 306 | 0.4% |
| German | 4,829 | 6.1% |
| Greek | 209 | 0.3% |
| Guatemalan | 1,363 | 1.7% |
| Honduran | 29 | 0.0% |
| Hungarian | 72 | 0.1% |
| Indian (Asian) | 5,770 | 7.3% |
| Indonesian | 82 | 0.1% |
| Iranian | 463 | 0.6% |
| Iraqi | 59 | 0.1% |
| Irish | 2,917 | 3.7% |
| Iroquois | 28 | 0.0% |
| Italian | 2,215 | 2.8% |
| Jamaican | 8 | 0.0% |
| Japanese | 395 | 0.5% |
| Jordanian | 13 | 0.0% |
| Korean | 3,487 | 4.4% |
| Laotian | 122 | 0.2% |
| Lebanese | 164 | 0.2% |
| Lithuanian | 81 | 0.1% |
| Malaysian | 47 | 0.1% |
| Mexican | 25,029 | 31.5% |
| Mexican American Indian | 449 | 0.6% |
| Mongolian | 146 | 0.2% |
| Native Hawaiian | 81 | 0.1% |
| Navajo | 63 | 0.1% |
| Nepalese | 12 | 0.0% |
| New Zealander | 9 | 0.0% |
| Nicaraguan | 98 | 0.1% |
| Nigerian | 58 | 0.1% |
| Northern European | 40 | 0.1% |
| Norwegian | 585 | 0.7% |
| Osage | 3 | 0.0% |
| Ottawa | 10 | 0.0% |
| Pakistani | 31 | 0.0% |
| Palestinian | 59 | 0.1% |
| Panamanian | 92 | 0.1% |
| Paraguayan | 18 | 0.0% |
| Pennsylvania German | 19 | 0.0% |
| Peruvian | 446 | 0.6% |
| Polish | 1,285 | 1.6% |
| Portuguese | 135 | 0.2% |
| Potawatomi | 23 | 0.0% |
| Puerto Rican | 285 | 0.4% |
| Romanian | 45 | 0.1% |
| Russian | 608 | 0.8% |
| Salvadoran | 1,534 | 1.9% |
| Scandinavian | 252 | 0.3% |
| Scotch-Irish | 284 | 0.4% |
| Scottish | 762 | 1.0% |
| Serbian | 89 | 0.1% |
| Slovak | 60 | 0.1% |
| South American | 1,415 | 1.8% |
| Spaniard | 313 | 0.4% |
| Spanish | 968 | 1.2% |
| Spanish American | 6 | 0.0% |
| Sri Lankan | 2,861 | 3.6% |
| Subsaharan African | 267 | 0.3% |
| Swedish | 622 | 0.8% |
| Swiss | 192 | 0.2% |
| Syrian | 71 | 0.1% |
| Thai | 3,580 | 4.5% |
| Tongan | 33 | 0.0% |
| Turkish | 49 | 0.1% |
| Ukrainian | 219 | 0.3% |
| Uruguayan | 12 | 0.0% |
| Venezuelan | 47 | 0.1% |
| Vietnamese | 71 | 0.1% |
| Welsh | 481 | 0.6% |
| Yugoslavian | 34 | 0.0% | View All 115 Rows |
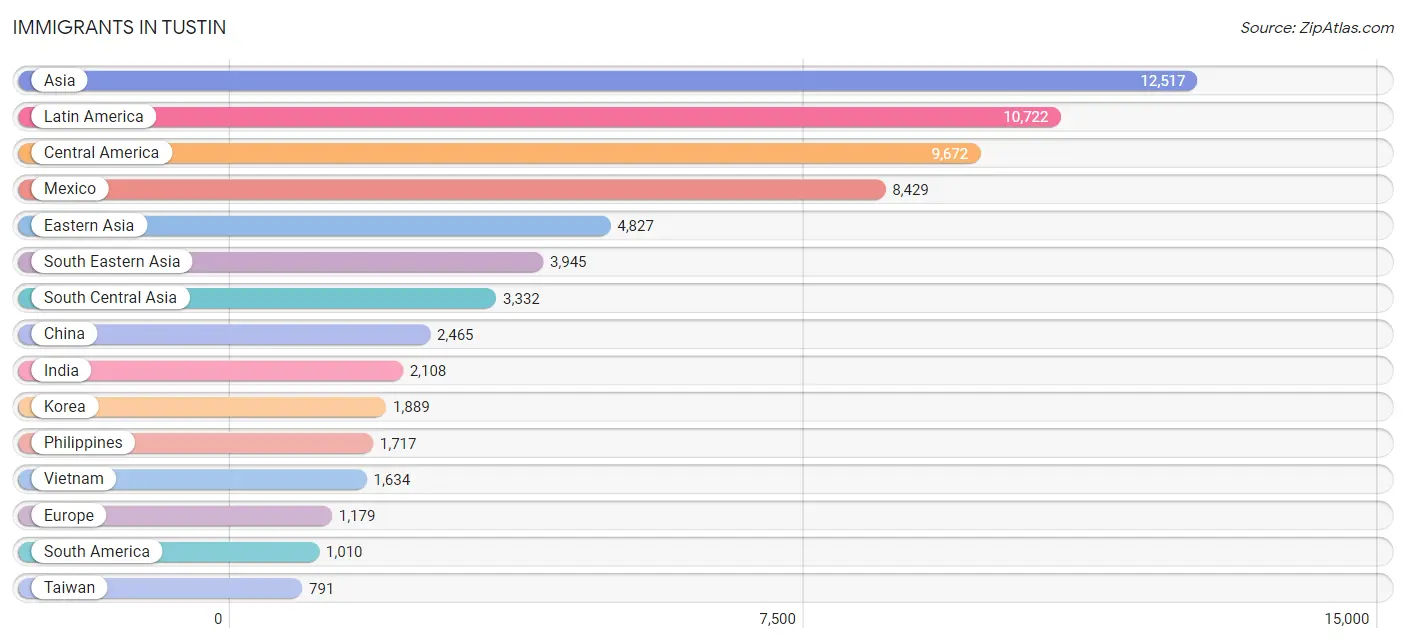
Immigrants in Tustin
The most numerous immigrant groups reported in Tustin came from Asia (12,517 | 15.7%), Latin America (10,722 | 13.5%), Central America (9,672 | 12.2%), Mexico (8,429 | 10.6%), and Eastern Asia (4,827 | 6.1%), together accounting for 58.1% of all Tustin residents.
| Immigration Origin | # Population | % Population |
| Afghanistan | 274 | 0.3% |
| Africa | 265 | 0.3% |
| Argentina | 70 | 0.1% |
| Armenia | 73 | 0.1% |
| Asia | 12,517 | 15.7% |
| Australia | 22 | 0.0% |
| Austria | 8 | 0.0% |
| Bangladesh | 147 | 0.2% |
| Belarus | 53 | 0.1% |
| Belize | 10 | 0.0% |
| Bolivia | 249 | 0.3% |
| Brazil | 124 | 0.2% |
| Bulgaria | 38 | 0.1% |
| Cambodia | 272 | 0.3% |
| Canada | 262 | 0.3% |
| Caribbean | 40 | 0.1% |
| Central America | 9,672 | 12.2% |
| Chile | 45 | 0.1% |
| China | 2,465 | 3.1% |
| Colombia | 132 | 0.2% |
| Costa Rica | 25 | 0.0% |
| Cuba | 8 | 0.0% |
| Czechoslovakia | 126 | 0.2% |
| Dominican Republic | 18 | 0.0% |
| Eastern Africa | 51 | 0.1% |
| Eastern Asia | 4,827 | 6.1% |
| Eastern Europe | 604 | 0.8% |
| Ecuador | 55 | 0.1% |
| Egypt | 107 | 0.1% |
| El Salvador | 607 | 0.8% |
| England | 30 | 0.0% |
| Ethiopia | 8 | 0.0% |
| Europe | 1,179 | 1.5% |
| Fiji | 20 | 0.0% |
| France | 9 | 0.0% |
| Germany | 90 | 0.1% |
| Guatemala | 511 | 0.6% |
| Hong Kong | 357 | 0.4% |
| Hungary | 17 | 0.0% |
| India | 2,108 | 2.6% |
| Indonesia | 63 | 0.1% |
| Iran | 475 | 0.6% |
| Iraq | 86 | 0.1% |
| Ireland | 58 | 0.1% |
| Israel | 9 | 0.0% |
| Italy | 105 | 0.1% |
| Jamaica | 8 | 0.0% |
| Japan | 473 | 0.6% |
| Jordan | 9 | 0.0% |
| Kenya | 22 | 0.0% |
| Korea | 1,889 | 2.4% |
| Laos | 17 | 0.0% |
| Latin America | 10,722 | 13.5% |
| Lebanon | 65 | 0.1% |
| Malaysia | 87 | 0.1% |
| Mexico | 8,429 | 10.6% |
| Middle Africa | 15 | 0.0% |
| Nepal | 73 | 0.1% |
| Netherlands | 96 | 0.1% |
| Nicaragua | 46 | 0.1% |
| Nigeria | 49 | 0.1% |
| Northern Africa | 107 | 0.1% |
| Northern Europe | 246 | 0.3% |
| Norway | 5 | 0.0% |
| Oceania | 80 | 0.1% |
| Pakistan | 238 | 0.3% |
| Panama | 44 | 0.1% |
| Peru | 265 | 0.3% |
| Philippines | 1,717 | 2.2% |
| Poland | 78 | 0.1% |
| Romania | 24 | 0.0% |
| Russia | 117 | 0.2% |
| Scotland | 63 | 0.1% |
| Singapore | 12 | 0.0% |
| South Africa | 9 | 0.0% |
| South America | 1,010 | 1.3% |
| South Central Asia | 3,332 | 4.2% |
| South Eastern Asia | 3,945 | 5.0% |
| Southern Europe | 108 | 0.1% |
| Spain | 3 | 0.0% |
| Sri Lanka | 17 | 0.0% |
| Sweden | 28 | 0.0% |
| Switzerland | 18 | 0.0% |
| Syria | 63 | 0.1% |
| Taiwan | 791 | 1.0% |
| Thailand | 26 | 0.0% |
| Turkey | 35 | 0.0% |
| Ukraine | 107 | 0.1% |
| Venezuela | 52 | 0.1% |
| Vietnam | 1,634 | 2.1% |
| Western Africa | 49 | 0.1% |
| Western Asia | 400 | 0.5% |
| Western Europe | 221 | 0.3% |
| Zimbabwe | 21 | 0.0% | View All 94 Rows |
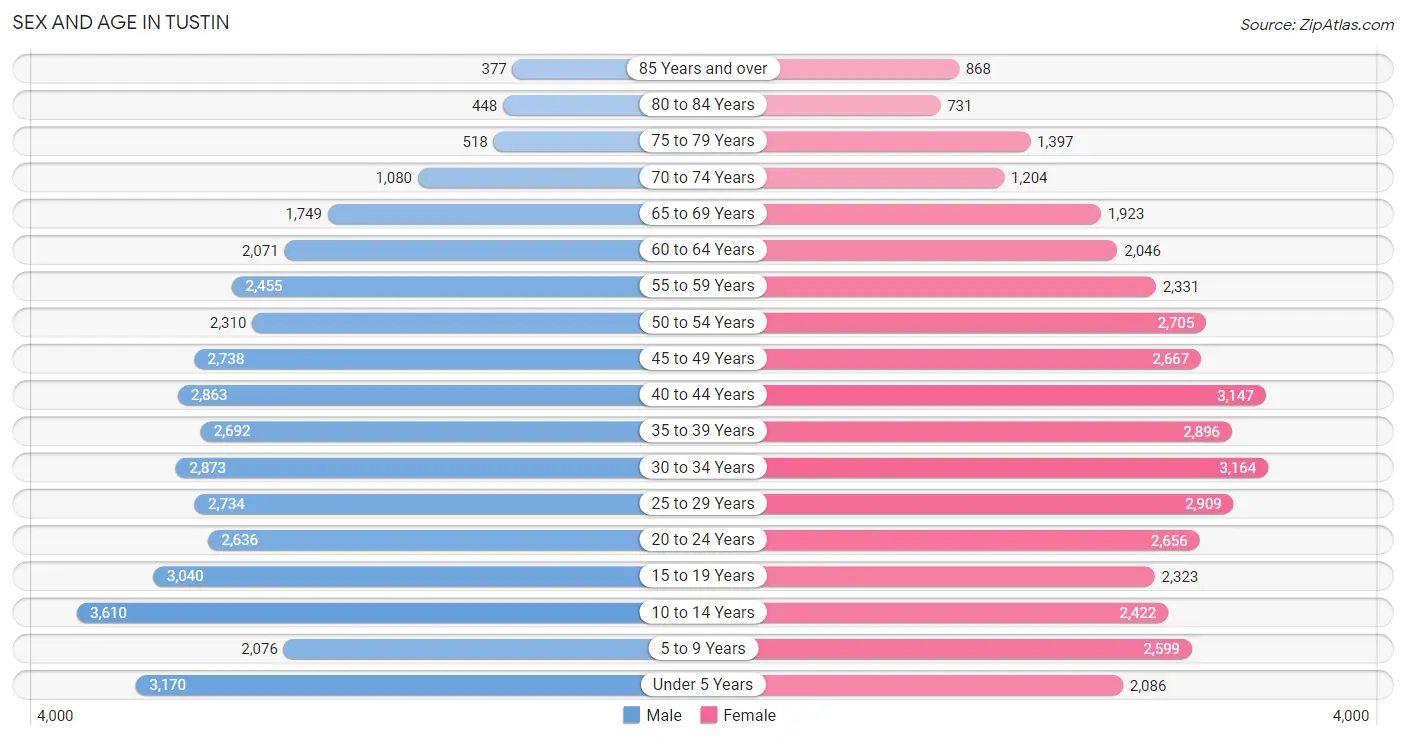
Sex and Age in Tustin
Sex and Age in Tustin
The most populous age groups in Tustin are 10 to 14 Years (3,610 | 9.1%) for men and 30 to 34 Years (3,164 | 7.9%) for women.
| Age Bracket | Male | Female |
| Under 5 Years | 3,170 (8.0%) | 2,086 (5.2%) |
| 5 to 9 Years | 2,076 (5.3%) | 2,599 (6.5%) |
| 10 to 14 Years | 3,610 (9.1%) | 2,422 (6.0%) |
| 15 to 19 Years | 3,040 (7.7%) | 2,323 (5.8%) |
| 20 to 24 Years | 2,636 (6.7%) | 2,656 (6.6%) |
| 25 to 29 Years | 2,734 (6.9%) | 2,909 (7.3%) |
| 30 to 34 Years | 2,873 (7.3%) | 3,164 (7.9%) |
| 35 to 39 Years | 2,692 (6.8%) | 2,896 (7.2%) |
| 40 to 44 Years | 2,863 (7.3%) | 3,147 (7.9%) |
| 45 to 49 Years | 2,738 (6.9%) | 2,667 (6.7%) |
| 50 to 54 Years | 2,310 (5.9%) | 2,705 (6.8%) |
| 55 to 59 Years | 2,455 (6.2%) | 2,331 (5.8%) |
| 60 to 64 Years | 2,071 (5.2%) | 2,046 (5.1%) |
| 65 to 69 Years | 1,749 (4.4%) | 1,923 (4.8%) |
| 70 to 74 Years | 1,080 (2.7%) | 1,204 (3.0%) |
| 75 to 79 Years | 518 (1.3%) | 1,397 (3.5%) |
| 80 to 84 Years | 448 (1.1%) | 731 (1.8%) |
| 85 Years and over | 377 (1.0%) | 868 (2.2%) |
| Total | 39,440 (100.0%) | 40,074 (100.0%) |
Families and Households in Tustin
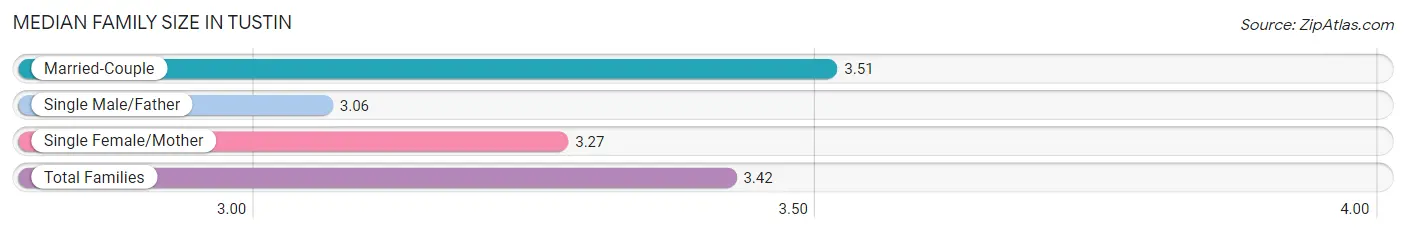
Median Family Size in Tustin
The median family size in Tustin is 3.42 persons per family, with married-couple families (13,931 | 72.1%) accounting for the largest median family size of 3.51 persons per family. On the other hand, single male/father families (1,688 | 8.7%) represent the smallest median family size with 3.06 persons per family.
| Family Type | # Families | Family Size |
| Married-Couple | 13,931 (72.1%) | 3.51 |
| Single Male/Father | 1,688 (8.7%) | 3.06 |
| Single Female/Mother | 3,701 (19.2%) | 3.27 |
| Total Families | 19,320 (100.0%) | 3.42 |
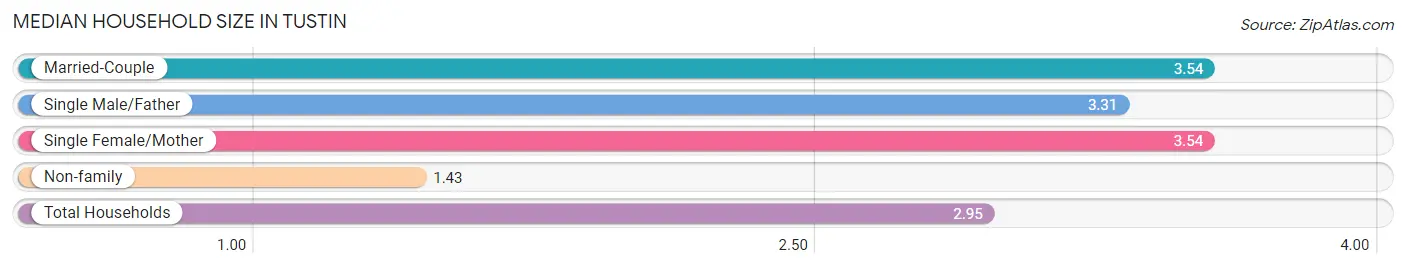
Median Household Size in Tustin
The median household size in Tustin is 2.95 persons per household, with married-couple households (13,931 | 52.5%) accounting for the largest median household size of 3.54 persons per household. non-family households (7,188 | 27.1%) represent the smallest median household size with 1.43 persons per household.
| Household Type | # Households | Household Size |
| Married-Couple | 13,931 (52.5%) | 3.54 |
| Single Male/Father | 1,688 (6.4%) | 3.31 |
| Single Female/Mother | 3,701 (14.0%) | 3.54 |
| Non-family | 7,188 (27.1%) | 1.43 |
| Total Households | 26,508 (100.0%) | 2.95 |
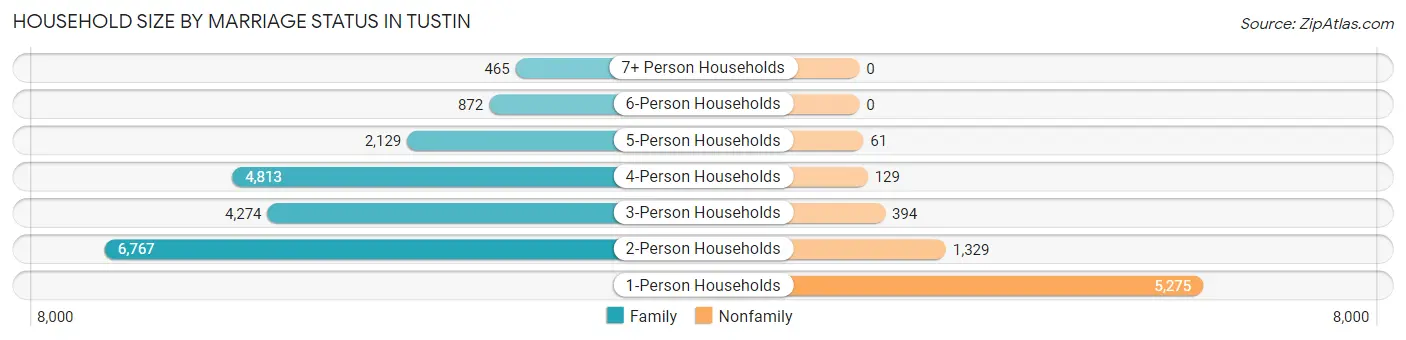
Household Size by Marriage Status in Tustin
Out of a total of 26,508 households in Tustin, 19,320 (72.9%) are family households, while 7,188 (27.1%) are nonfamily households. The most numerous type of family households are 2-person households, comprising 6,767, and the most common type of nonfamily households are 1-person households, comprising 5,275.
| Household Size | Family Households | Nonfamily Households |
| 1-Person Households | - | 5,275 (19.9%) |
| 2-Person Households | 6,767 (25.5%) | 1,329 (5.0%) |
| 3-Person Households | 4,274 (16.1%) | 394 (1.5%) |
| 4-Person Households | 4,813 (18.2%) | 129 (0.5%) |
| 5-Person Households | 2,129 (8.0%) | 61 (0.2%) |
| 6-Person Households | 872 (3.3%) | 0 (0.0%) |
| 7+ Person Households | 465 (1.8%) | 0 (0.0%) |
| Total | 19,320 (72.9%) | 7,188 (27.1%) |
Female Fertility in Tustin
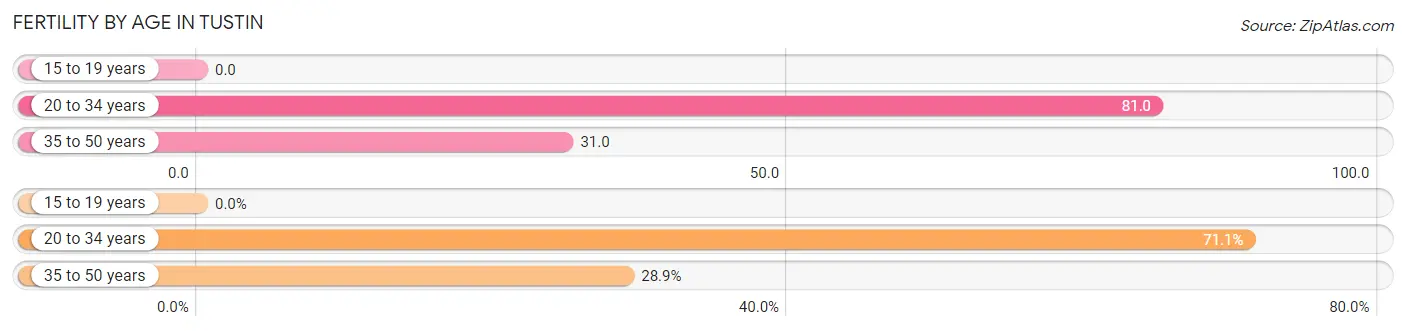
Fertility by Age in Tustin
Average fertility rate in Tustin is 49.0 births per 1,000 women. Women in the age bracket of 20 to 34 years have the highest fertility rate with 81.0 births per 1,000 women. Women in the age bracket of 20 to 34 years acount for 71.1% of all women with births.
| Age Bracket | Women with Births | Births / 1,000 Women |
| 15 to 19 years | 0 (0.0%) | 0.0 |
| 20 to 34 years | 710 (71.1%) | 81.0 |
| 35 to 50 years | 289 (28.9%) | 31.0 |
| Total | 999 (100.0%) | 49.0 |
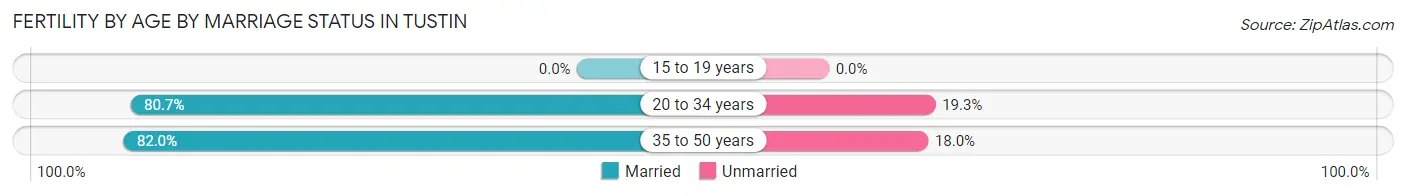
Fertility by Age by Marriage Status in Tustin
81.1% of women with births (999) in Tustin are married. The highest percentage of unmarried women with births falls into 20 to 34 years age bracket with 19.3% of them unmarried at the time of birth, while the lowest percentage of unmarried women with births belong to 35 to 50 years age bracket with 18.0% of them unmarried.
| Age Bracket | Married | Unmarried |
| 15 to 19 years | 0 (0.0%) | 0 (0.0%) |
| 20 to 34 years | 573 (80.7%) | 137 (19.3%) |
| 35 to 50 years | 237 (82.0%) | 52 (18.0%) |
| Total | 810 (81.1%) | 189 (18.9%) |
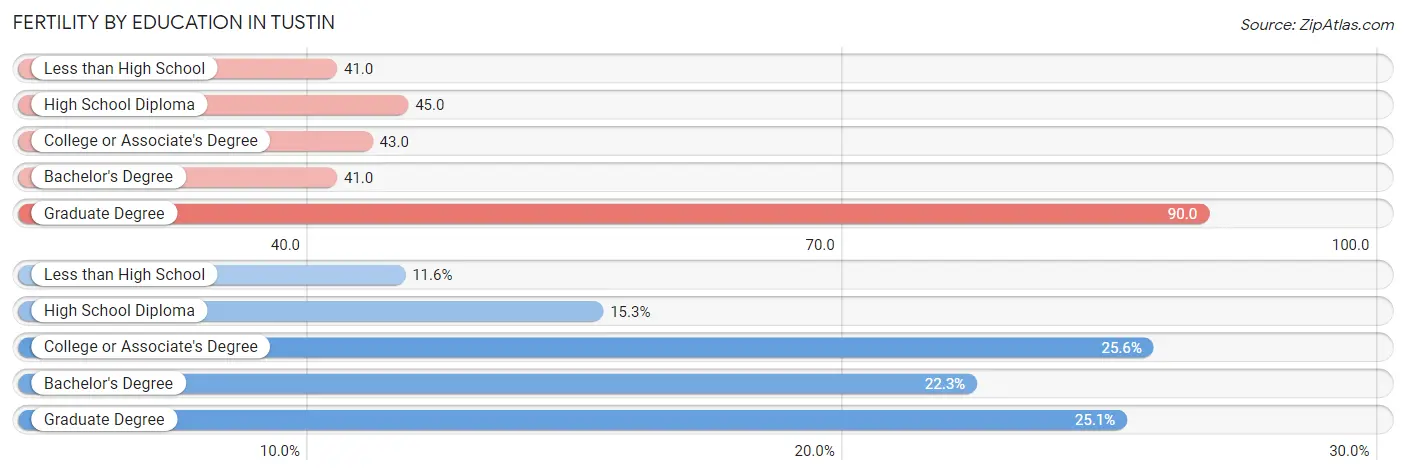
Fertility by Education in Tustin
Average fertility rate in Tustin is 49.0 births per 1,000 women. Women with the education attainment of graduate degree have the highest fertility rate of 90.0 births per 1,000 women, while women with the education attainment of less than high school have the lowest fertility at 41.0 births per 1,000 women. Women with the education attainment of college or associate's degree represent 25.6% of all women with births.
| Educational Attainment | Women with Births | Births / 1,000 Women |
| Less than High School | 116 (11.6%) | 41.0 |
| High School Diploma | 153 (15.3%) | 45.0 |
| College or Associate's Degree | 256 (25.6%) | 43.0 |
| Bachelor's Degree | 223 (22.3%) | 41.0 |
| Graduate Degree | 251 (25.1%) | 90.0 |
| Total | 999 (100.0%) | 49.0 |
Fertility by Education by Marriage Status in Tustin
18.9% of women with births in Tustin are unmarried. Women with the educational attainment of graduate degree are most likely to be married with 100.0% of them married at childbirth, while women with the educational attainment of less than high school are least likely to be married with 43.1% of them unmarried at childbirth.
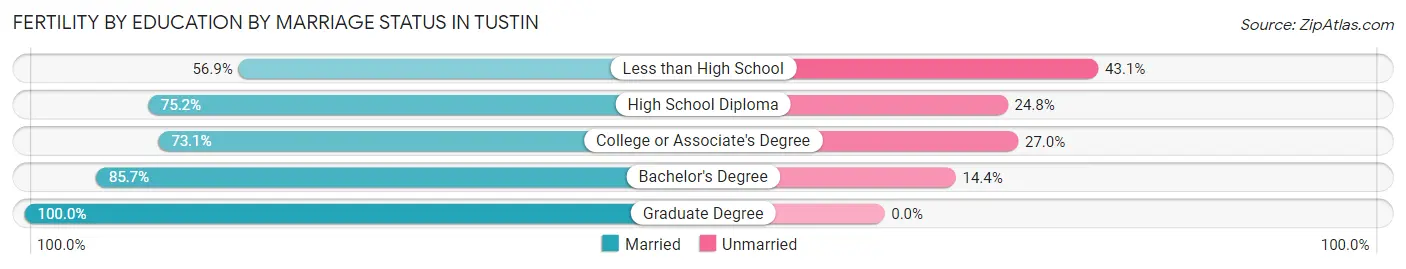
| Educational Attainment | Married | Unmarried |
| Less than High School | 66 (56.9%) | 50 (43.1%) |
| High School Diploma | 115 (75.2%) | 38 (24.8%) |
| College or Associate's Degree | 187 (73.1%) | 69 (27.0%) |
| Bachelor's Degree | 191 (85.7%) | 32 (14.3%) |
| Graduate Degree | 251 (100.0%) | 0 (0.0%) |
| Total | 810 (81.1%) | 189 (18.9%) |
Employment Characteristics in Tustin
Employment by Class of Employer in Tustin
Among the 39,912 employed individuals in Tustin, private company employees (28,367 | 71.1%), self-employed (incorporated) (2,516 | 6.3%), and self-employed (not incorporated) (2,515 | 6.3%) make up the most common classes of employment.
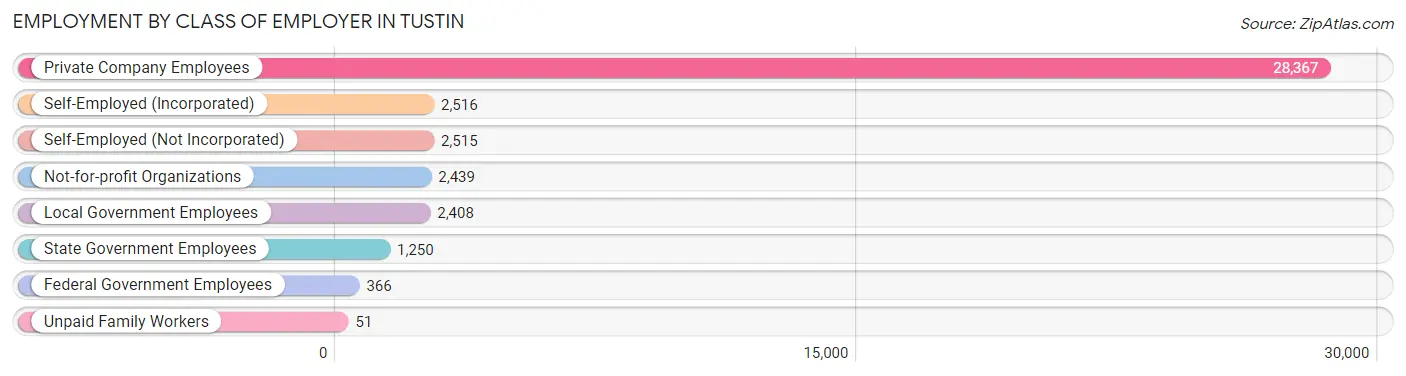
| Employer Class | # Employees | % Employees |
| Private Company Employees | 28,367 | 71.1% |
| Self-Employed (Incorporated) | 2,516 | 6.3% |
| Self-Employed (Not Incorporated) | 2,515 | 6.3% |
| Not-for-profit Organizations | 2,439 | 6.1% |
| Local Government Employees | 2,408 | 6.0% |
| State Government Employees | 1,250 | 3.1% |
| Federal Government Employees | 366 | 0.9% |
| Unpaid Family Workers | 51 | 0.1% |
| Total | 39,912 | 100.0% |
Employment Status by Age in Tustin
According to the labor force statistics for Tustin, out of the total population over 16 years of age (62,774), 69.0% or 43,314 individuals are in the labor force, with 5.9% or 2,556 of them unemployed. The age group with the highest labor force participation rate is 30 to 34 years, with 86.9% or 5,246 individuals in the labor force. Within the labor force, the 16 to 19 years age range has the highest percentage of unemployed individuals, with 20.6% or 268 of them being unemployed.
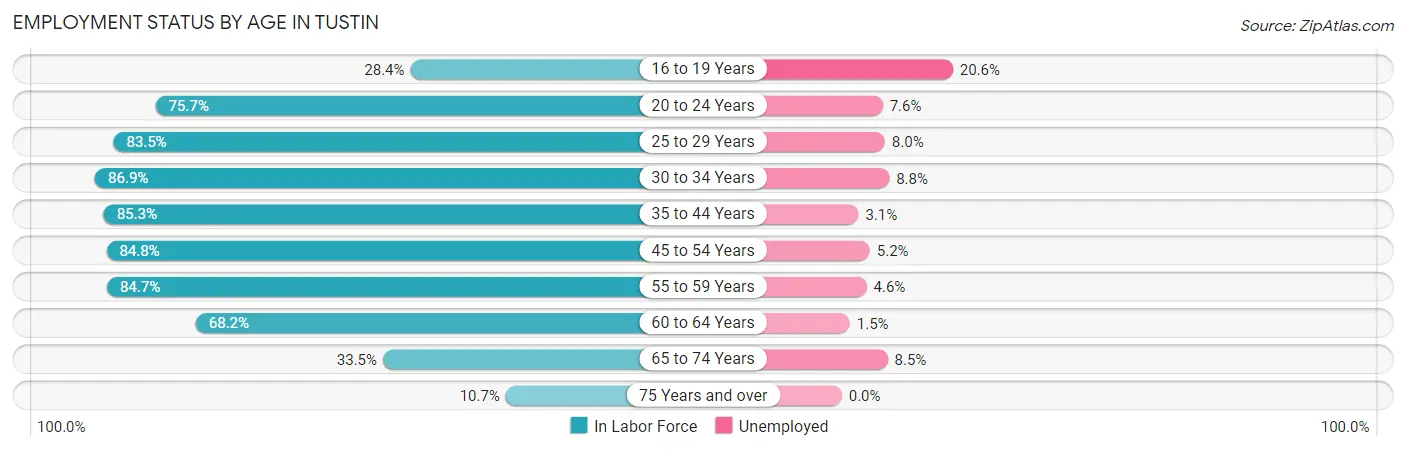
| Age Bracket | In Labor Force | Unemployed |
| 16 to 19 Years | 1,302 (28.4%) | 268 (20.6%) |
| 20 to 24 Years | 4,006 (75.7%) | 304 (7.6%) |
| 25 to 29 Years | 4,712 (83.5%) | 377 (8.0%) |
| 30 to 34 Years | 5,246 (86.9%) | 462 (8.8%) |
| 35 to 44 Years | 9,893 (85.3%) | 307 (3.1%) |
| 45 to 54 Years | 8,836 (84.8%) | 459 (5.2%) |
| 55 to 59 Years | 4,054 (84.7%) | 186 (4.6%) |
| 60 to 64 Years | 2,808 (68.2%) | 42 (1.5%) |
| 65 to 74 Years | 1,995 (33.5%) | 170 (8.5%) |
| 75 Years and over | 464 (10.7%) | 0 (0.0%) |
| Total | 43,314 (69.0%) | 2,556 (5.9%) |
Employment Status by Educational Attainment in Tustin
According to labor force statistics for Tustin, 83.5% of individuals (35,572) out of the total population between 25 and 64 years of age (42,601) are in the labor force, with 5.1% or 1,814 of them being unemployed. The group with the highest labor force participation rate are those with the educational attainment of bachelor's degree or higher, with 88.5% or 17,437 individuals in the labor force. Within the labor force, individuals with less than high school education have the highest percentage of unemployment, with 8.9% or 342 of them being unemployed.
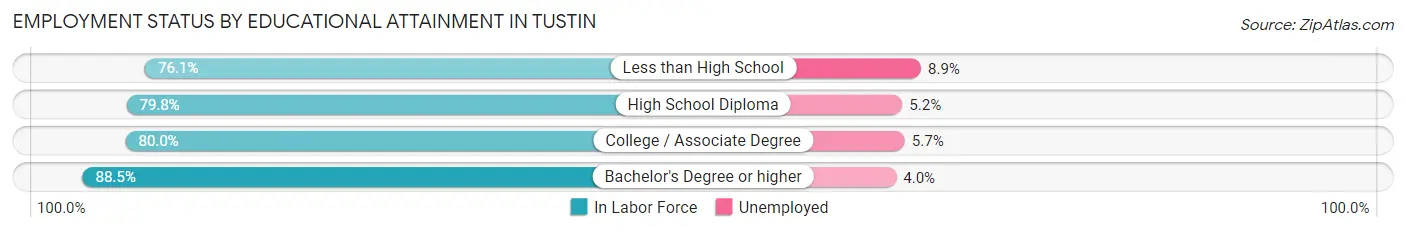
| Educational Attainment | In Labor Force | Unemployed |
| Less than High School | 3,844 (76.1%) | 450 (8.9%) |
| High School Diploma | 5,821 (79.8%) | 379 (5.2%) |
| College / Associate Degree | 8,442 (80.0%) | 602 (5.7%) |
| Bachelor's Degree or higher | 17,437 (88.5%) | 788 (4.0%) |
| Total | 35,572 (83.5%) | 2,173 (5.1%) |
Employment Occupations by Sex in Tustin
Management, Business, Science and Arts Occupations
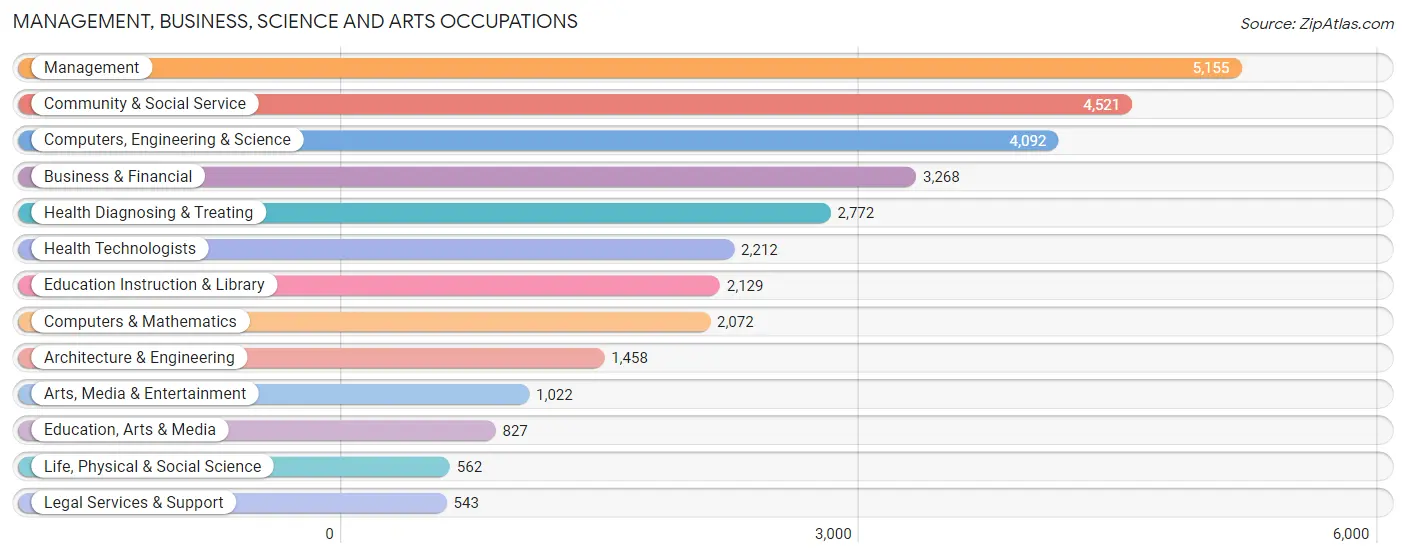
The most common Management, Business, Science and Arts occupations in Tustin are Management (5,155 | 12.7%), Community & Social Service (4,521 | 11.1%), Computers, Engineering & Science (4,092 | 10.1%), Business & Financial (3,268 | 8.0%), and Health Diagnosing & Treating (2,772 | 6.8%).
Management, Business, Science and Arts Occupations by Sex
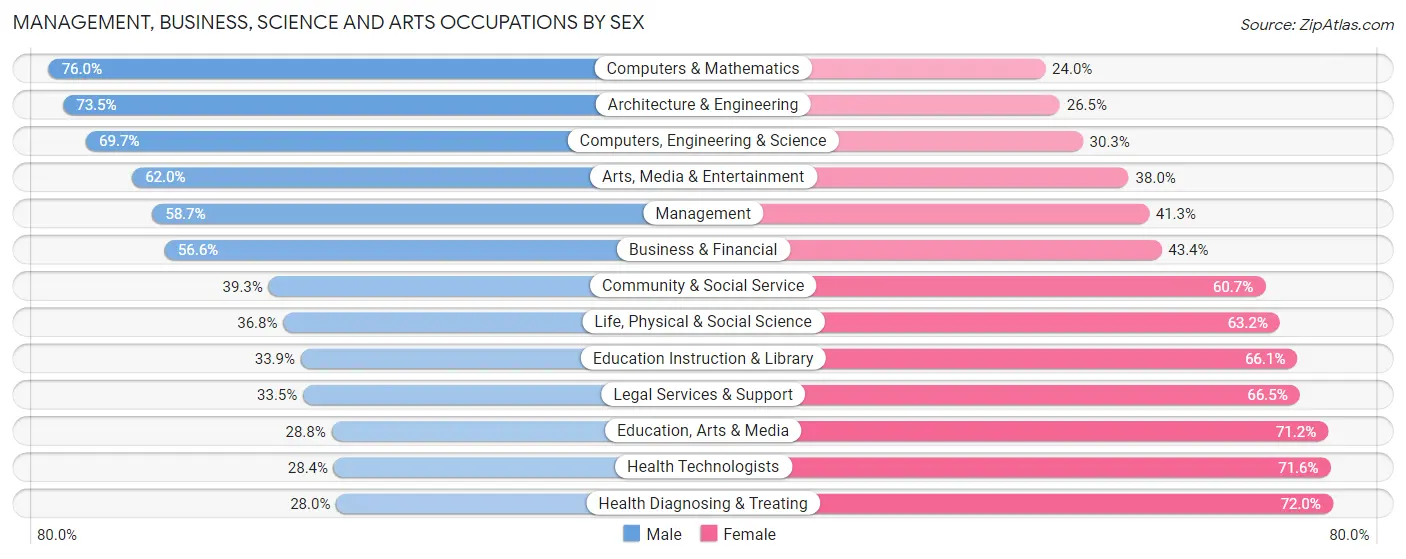
Within the Management, Business, Science and Arts occupations in Tustin, the most male-oriented occupations are Computers & Mathematics (76.0%), Architecture & Engineering (73.5%), and Computers, Engineering & Science (69.7%), while the most female-oriented occupations are Health Diagnosing & Treating (72.0%), Health Technologists (71.6%), and Education, Arts & Media (71.2%).
| Occupation | Male | Female |
| Management | 3,025 (58.7%) | 2,130 (41.3%) |
| Business & Financial | 1,849 (56.6%) | 1,419 (43.4%) |
| Computers, Engineering & Science | 2,853 (69.7%) | 1,239 (30.3%) |
| Computers & Mathematics | 1,574 (76.0%) | 498 (24.0%) |
| Architecture & Engineering | 1,072 (73.5%) | 386 (26.5%) |
| Life, Physical & Social Science | 207 (36.8%) | 355 (63.2%) |
| Community & Social Service | 1,776 (39.3%) | 2,745 (60.7%) |
| Education, Arts & Media | 238 (28.8%) | 589 (71.2%) |
| Legal Services & Support | 182 (33.5%) | 361 (66.5%) |
| Education Instruction & Library | 722 (33.9%) | 1,407 (66.1%) |
| Arts, Media & Entertainment | 634 (62.0%) | 388 (38.0%) |
| Health Diagnosing & Treating | 776 (28.0%) | 1,996 (72.0%) |
| Health Technologists | 628 (28.4%) | 1,584 (71.6%) |
| Total (Category) | 10,279 (51.9%) | 9,529 (48.1%) |
| Total (Overall) | 21,698 (53.3%) | 19,017 (46.7%) |
Services Occupations
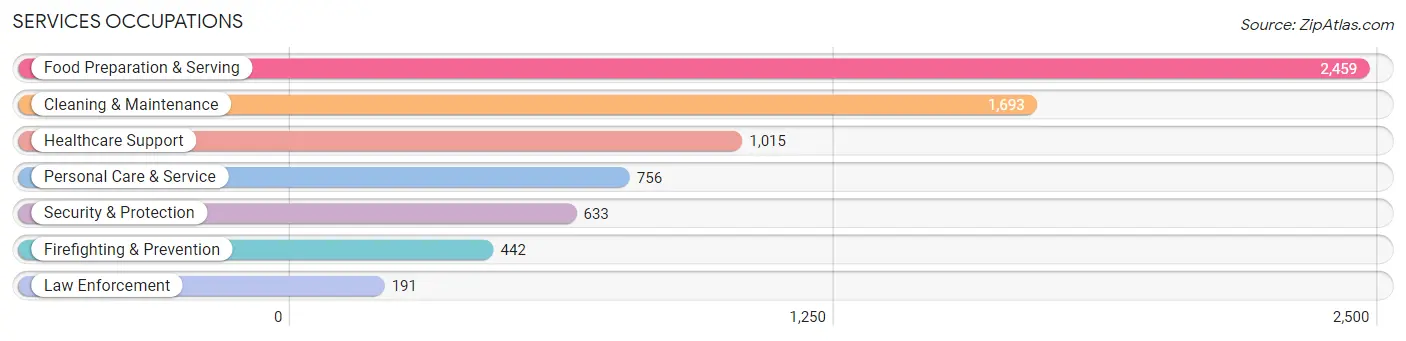
The most common Services occupations in Tustin are Food Preparation & Serving (2,459 | 6.0%), Cleaning & Maintenance (1,693 | 4.2%), Healthcare Support (1,015 | 2.5%), Personal Care & Service (756 | 1.9%), and Security & Protection (633 | 1.5%).
Services Occupations by Sex
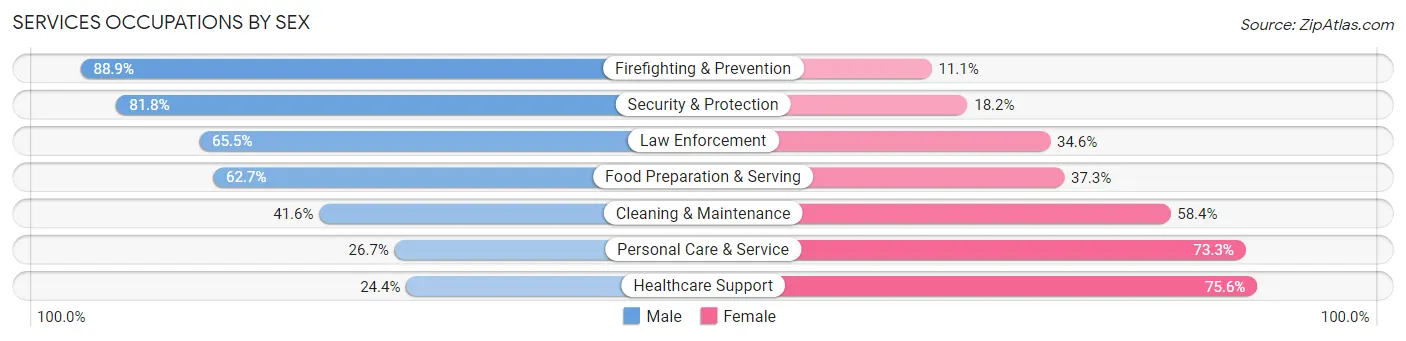
Within the Services occupations in Tustin, the most male-oriented occupations are Firefighting & Prevention (88.9%), Security & Protection (81.8%), and Law Enforcement (65.4%), while the most female-oriented occupations are Healthcare Support (75.6%), Personal Care & Service (73.3%), and Cleaning & Maintenance (58.4%).
| Occupation | Male | Female |
| Healthcare Support | 248 (24.4%) | 767 (75.6%) |
| Security & Protection | 518 (81.8%) | 115 (18.2%) |
| Firefighting & Prevention | 393 (88.9%) | 49 (11.1%) |
| Law Enforcement | 125 (65.4%) | 66 (34.5%) |
| Food Preparation & Serving | 1,541 (62.7%) | 918 (37.3%) |
| Cleaning & Maintenance | 705 (41.6%) | 988 (58.4%) |
| Personal Care & Service | 202 (26.7%) | 554 (73.3%) |
| Total (Category) | 3,214 (49.0%) | 3,342 (51.0%) |
| Total (Overall) | 21,698 (53.3%) | 19,017 (46.7%) |
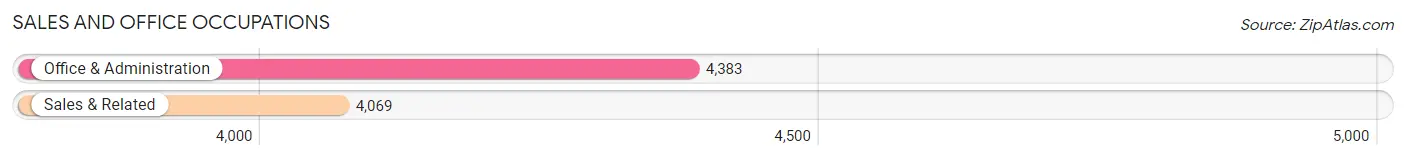
Sales and Office Occupations
The most common Sales and Office occupations in Tustin are Office & Administration (4,383 | 10.8%), and Sales & Related (4,069 | 10.0%).
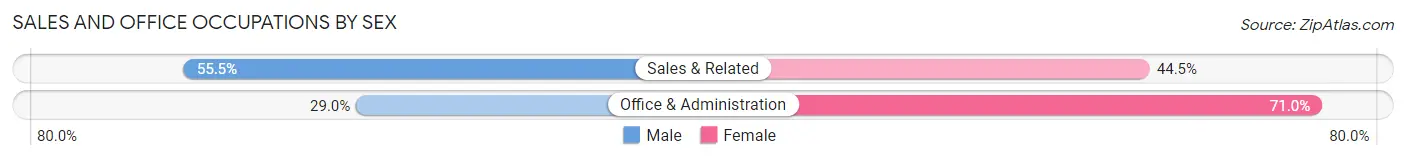
Sales and Office Occupations by Sex
| Occupation | Male | Female |
| Sales & Related | 2,258 (55.5%) | 1,811 (44.5%) |
| Office & Administration | 1,271 (29.0%) | 3,112 (71.0%) |
| Total (Category) | 3,529 (41.7%) | 4,923 (58.3%) |
| Total (Overall) | 21,698 (53.3%) | 19,017 (46.7%) |
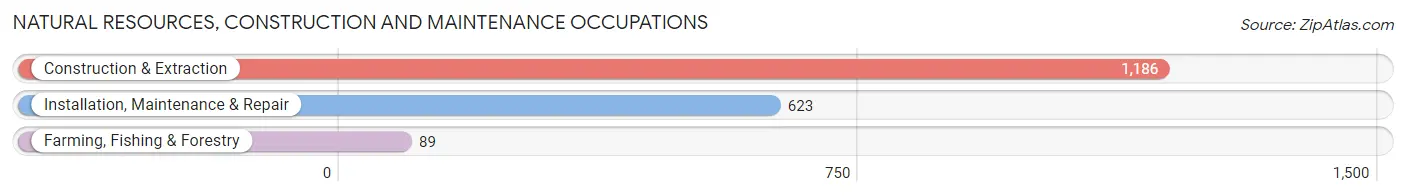
Natural Resources, Construction and Maintenance Occupations
The most common Natural Resources, Construction and Maintenance occupations in Tustin are Construction & Extraction (1,186 | 2.9%), Installation, Maintenance & Repair (623 | 1.5%), and Farming, Fishing & Forestry (89 | 0.2%).
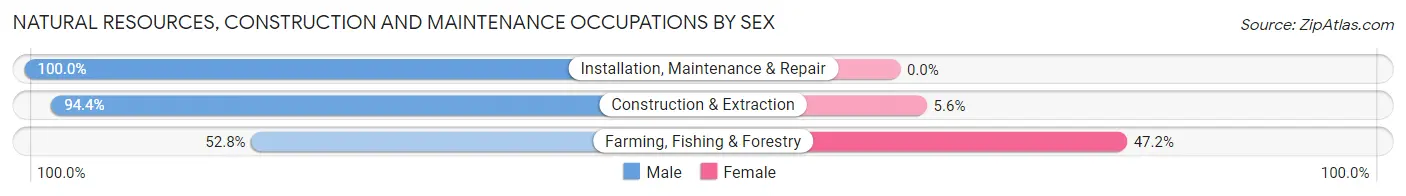
Natural Resources, Construction and Maintenance Occupations by Sex
| Occupation | Male | Female |
| Farming, Fishing & Forestry | 47 (52.8%) | 42 (47.2%) |
| Construction & Extraction | 1,120 (94.4%) | 66 (5.6%) |
| Installation, Maintenance & Repair | 623 (100.0%) | 0 (0.0%) |
| Total (Category) | 1,790 (94.3%) | 108 (5.7%) |
| Total (Overall) | 21,698 (53.3%) | 19,017 (46.7%) |
Production, Transportation and Moving Occupations
The most common Production, Transportation and Moving occupations in Tustin are Production (1,899 | 4.7%), Material Moving (1,150 | 2.8%), and Transportation (952 | 2.3%).
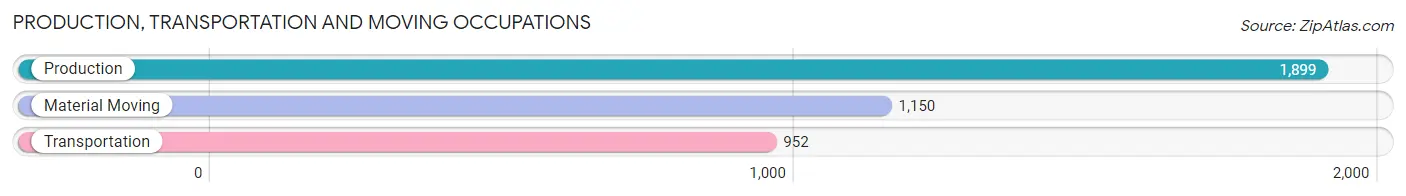
Production, Transportation and Moving Occupations by Sex
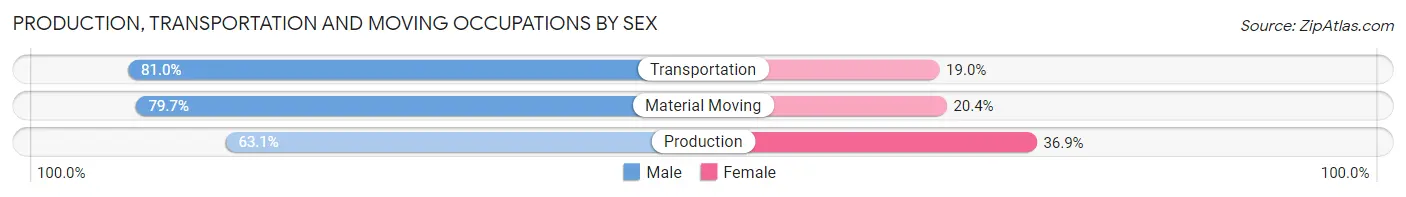
| Occupation | Male | Female |
| Production | 1,199 (63.1%) | 700 (36.9%) |
| Transportation | 771 (81.0%) | 181 (19.0%) |
| Material Moving | 916 (79.6%) | 234 (20.3%) |
| Total (Category) | 2,886 (72.1%) | 1,115 (27.9%) |
| Total (Overall) | 21,698 (53.3%) | 19,017 (46.7%) |
Employment Industries by Sex in Tustin
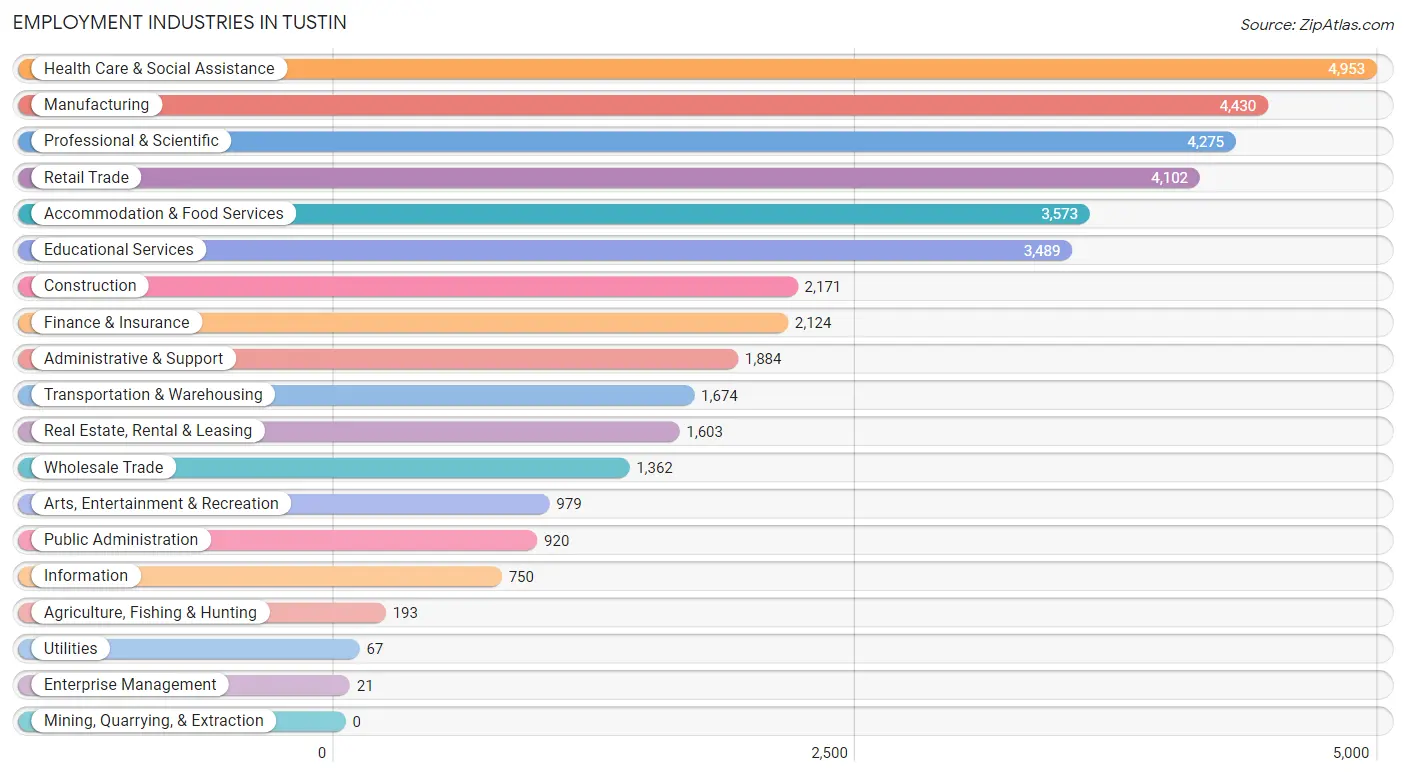
Employment Industries in Tustin
The major employment industries in Tustin include Health Care & Social Assistance (4,953 | 12.2%), Manufacturing (4,430 | 10.9%), Professional & Scientific (4,275 | 10.5%), Retail Trade (4,102 | 10.1%), and Accommodation & Food Services (3,573 | 8.8%).
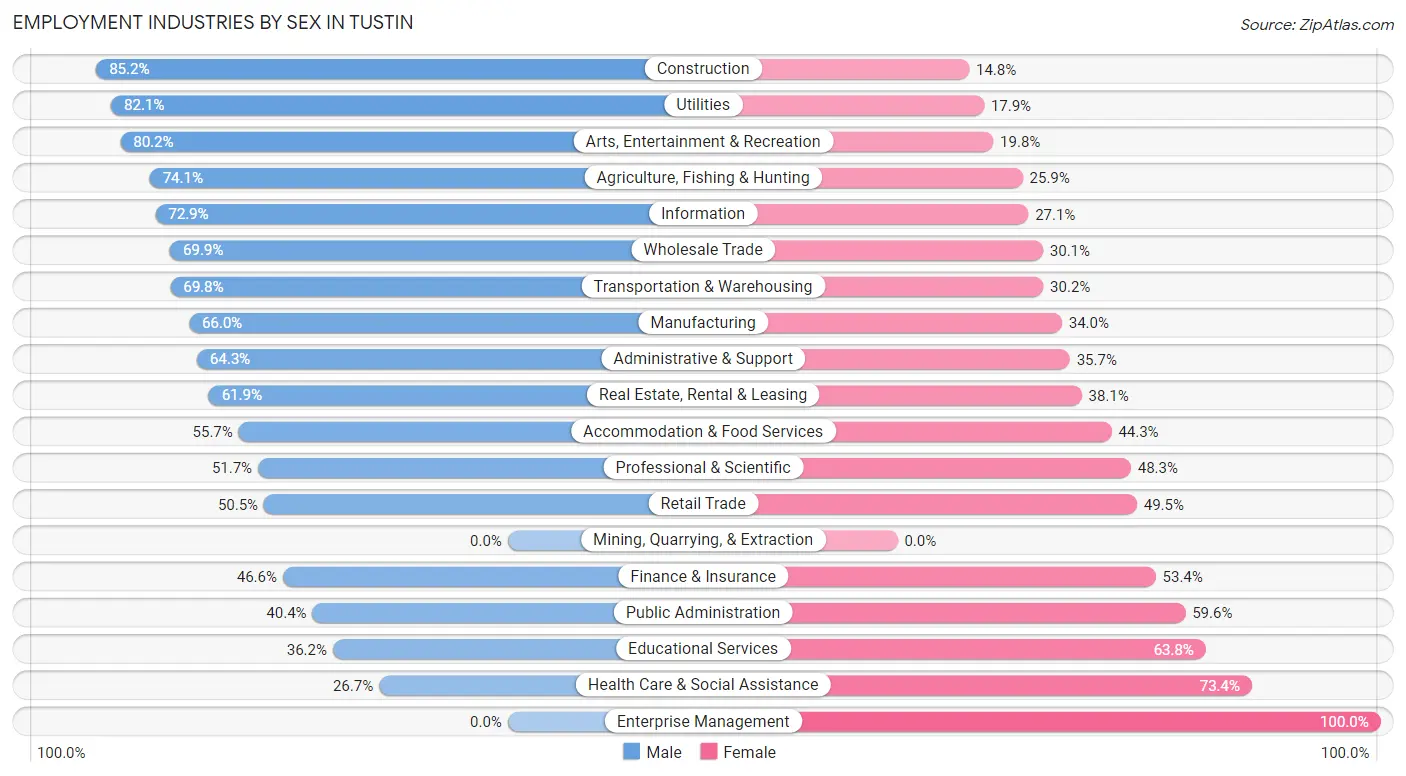
Employment Industries by Sex in Tustin
The Tustin industries that see more men than women are Construction (85.2%), Utilities (82.1%), and Arts, Entertainment & Recreation (80.2%), whereas the industries that tend to have a higher number of women are Enterprise Management (100.0%), Health Care & Social Assistance (73.4%), and Educational Services (63.8%).
| Industry | Male | Female |
| Agriculture, Fishing & Hunting | 143 (74.1%) | 50 (25.9%) |
| Mining, Quarrying, & Extraction | 0 (0.0%) | 0 (0.0%) |
| Construction | 1,849 (85.2%) | 322 (14.8%) |
| Manufacturing | 2,923 (66.0%) | 1,507 (34.0%) |
| Wholesale Trade | 952 (69.9%) | 410 (30.1%) |
| Retail Trade | 2,070 (50.5%) | 2,032 (49.5%) |
| Transportation & Warehousing | 1,169 (69.8%) | 505 (30.2%) |
| Utilities | 55 (82.1%) | 12 (17.9%) |
| Information | 547 (72.9%) | 203 (27.1%) |
| Finance & Insurance | 989 (46.6%) | 1,135 (53.4%) |
| Real Estate, Rental & Leasing | 992 (61.9%) | 611 (38.1%) |
| Professional & Scientific | 2,210 (51.7%) | 2,065 (48.3%) |
| Enterprise Management | 0 (0.0%) | 21 (100.0%) |
| Administrative & Support | 1,212 (64.3%) | 672 (35.7%) |
| Educational Services | 1,263 (36.2%) | 2,226 (63.8%) |
| Health Care & Social Assistance | 1,320 (26.7%) | 3,633 (73.4%) |
| Arts, Entertainment & Recreation | 785 (80.2%) | 194 (19.8%) |
| Accommodation & Food Services | 1,990 (55.7%) | 1,583 (44.3%) |
| Public Administration | 372 (40.4%) | 548 (59.6%) |
| Total | 21,698 (53.3%) | 19,017 (46.7%) |
Education in Tustin
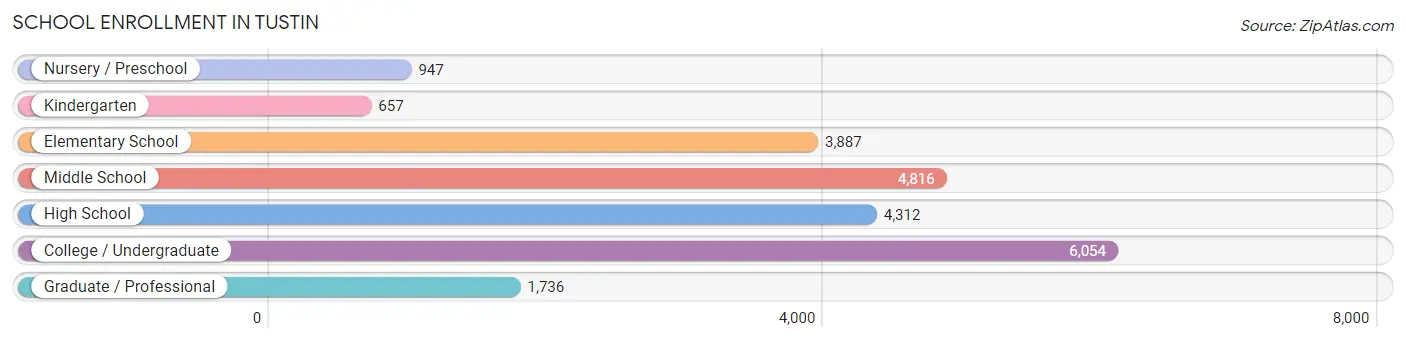
School Enrollment in Tustin
The most common levels of schooling among the 22,409 students in Tustin are college / undergraduate (6,054 | 27.0%), middle school (4,816 | 21.5%), and high school (4,312 | 19.2%).
| School Level | # Students | % Students |
| Nursery / Preschool | 947 | 4.2% |
| Kindergarten | 657 | 2.9% |
| Elementary School | 3,887 | 17.3% |
| Middle School | 4,816 | 21.5% |
| High School | 4,312 | 19.2% |
| College / Undergraduate | 6,054 | 27.0% |
| Graduate / Professional | 1,736 | 7.7% |
| Total | 22,409 | 100.0% |
School Enrollment by Age by Funding Source in Tustin
Out of a total of 22,409 students who are enrolled in schools in Tustin, 3,384 (15.1%) attend a private institution, while the remaining 19,025 (84.9%) are enrolled in public schools. The age group of 3 to 4 year olds has the highest likelihood of being enrolled in private schools, with 408 (58.7% in the age bracket) enrolled. Conversely, the age group of 15 to 17 year olds has the lowest likelihood of being enrolled in a private school, with 2,830 (95.6% in the age bracket) attending a public institution.
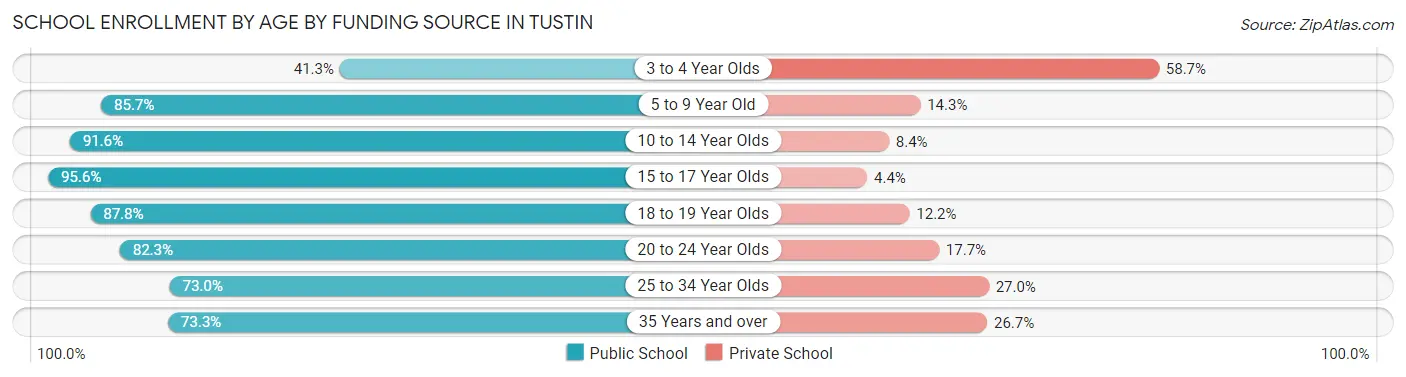
| Age Bracket | Public School | Private School |
| 3 to 4 Year Olds | 287 (41.3%) | 408 (58.7%) |
| 5 to 9 Year Old | 3,805 (85.7%) | 633 (14.3%) |
| 10 to 14 Year Olds | 5,484 (91.6%) | 504 (8.4%) |
| 15 to 17 Year Olds | 2,830 (95.6%) | 129 (4.4%) |
| 18 to 19 Year Olds | 1,670 (87.8%) | 233 (12.2%) |
| 20 to 24 Year Olds | 2,328 (82.3%) | 502 (17.7%) |
| 25 to 34 Year Olds | 1,378 (73.0%) | 510 (27.0%) |
| 35 Years and over | 1,252 (73.3%) | 456 (26.7%) |
| Total | 19,025 (84.9%) | 3,384 (15.1%) |
Educational Attainment by Field of Study in Tustin
Business (4,708 | 18.2%), engineering (3,308 | 12.8%), social sciences (2,316 | 9.0%), computers & mathematics (2,027 | 7.9%), and science & technology (1,905 | 7.4%) are the most common fields of study among 25,813 individuals in Tustin who have obtained a bachelor's degree or higher.
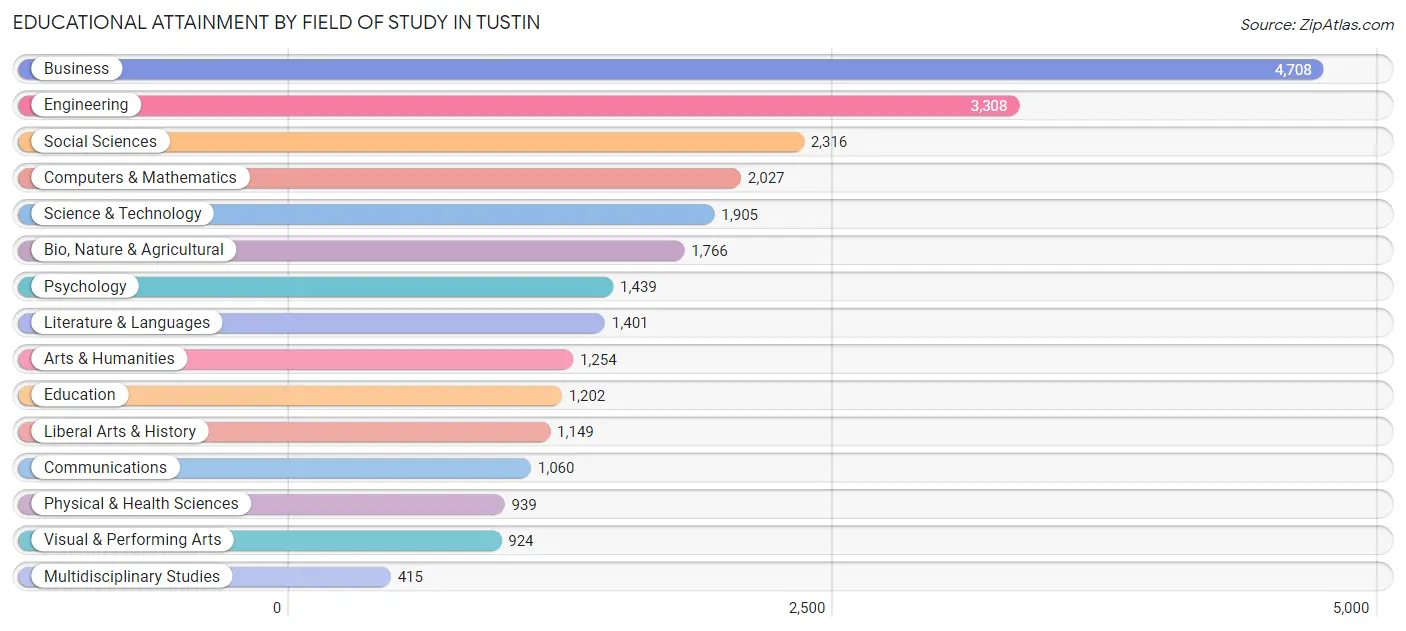
| Field of Study | # Graduates | % Graduates |
| Computers & Mathematics | 2,027 | 7.9% |
| Bio, Nature & Agricultural | 1,766 | 6.8% |
| Physical & Health Sciences | 939 | 3.6% |
| Psychology | 1,439 | 5.6% |
| Social Sciences | 2,316 | 9.0% |
| Engineering | 3,308 | 12.8% |
| Multidisciplinary Studies | 415 | 1.6% |
| Science & Technology | 1,905 | 7.4% |
| Business | 4,708 | 18.2% |
| Education | 1,202 | 4.7% |
| Literature & Languages | 1,401 | 5.4% |
| Liberal Arts & History | 1,149 | 4.4% |
| Visual & Performing Arts | 924 | 3.6% |
| Communications | 1,060 | 4.1% |
| Arts & Humanities | 1,254 | 4.9% |
| Total | 25,813 | 100.0% |
Transportation & Commute in Tustin
Vehicle Availability by Sex in Tustin
The most prevalent vehicle ownership categories in Tustin are males with 2 vehicles (9,847, accounting for 45.8%) and females with 2 vehicles (8,852, making up 53.8%).
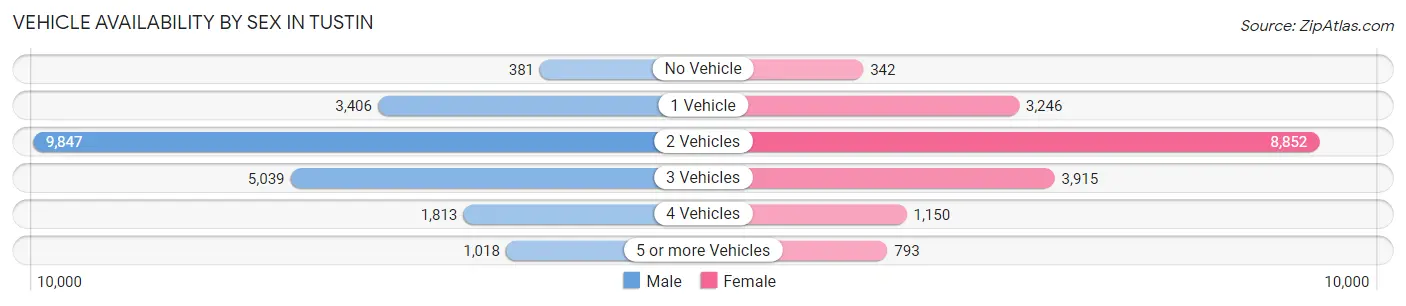
| Vehicles Available | Male | Female |
| No Vehicle | 381 (1.8%) | 342 (1.9%) |
| 1 Vehicle | 3,406 (15.8%) | 3,246 (17.7%) |
| 2 Vehicles | 9,847 (45.8%) | 8,852 (48.4%) |
| 3 Vehicles | 5,039 (23.4%) | 3,915 (21.4%) |
| 4 Vehicles | 1,813 (8.4%) | 1,150 (6.3%) |
| 5 or more Vehicles | 1,018 (4.7%) | 793 (4.3%) |
| Total | 21,504 (100.0%) | 18,298 (100.0%) |
Commute Time in Tustin
The most frequently occuring commute durations in Tustin are 15 to 19 minutes (6,678 commuters, 19.5%), 20 to 24 minutes (6,668 commuters, 19.4%), and 30 to 34 minutes (5,989 commuters, 17.4%).
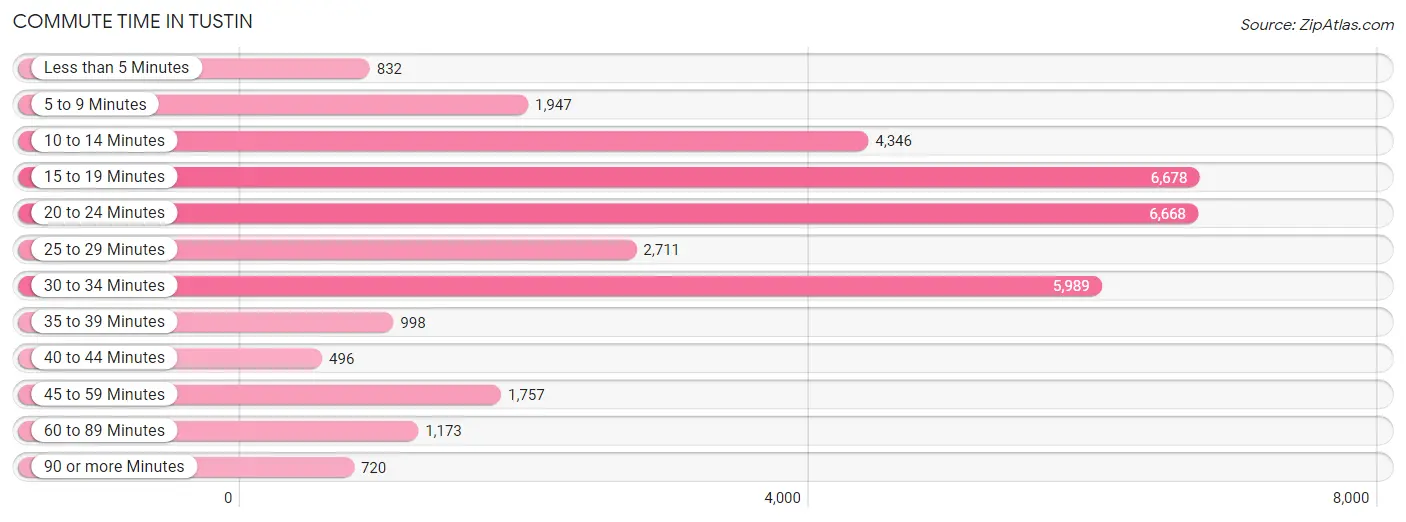
| Commute Time | # Commuters | % Commuters |
| Less than 5 Minutes | 832 | 2.4% |
| 5 to 9 Minutes | 1,947 | 5.7% |
| 10 to 14 Minutes | 4,346 | 12.7% |
| 15 to 19 Minutes | 6,678 | 19.5% |
| 20 to 24 Minutes | 6,668 | 19.4% |
| 25 to 29 Minutes | 2,711 | 7.9% |
| 30 to 34 Minutes | 5,989 | 17.4% |
| 35 to 39 Minutes | 998 | 2.9% |
| 40 to 44 Minutes | 496 | 1.5% |
| 45 to 59 Minutes | 1,757 | 5.1% |
| 60 to 89 Minutes | 1,173 | 3.4% |
| 90 or more Minutes | 720 | 2.1% |
Commute Time by Sex in Tustin
The most common commute times in Tustin are 20 to 24 minutes (3,834 commuters, 20.6%) for males and 15 to 19 minutes (3,018 commuters, 19.2%) for females.
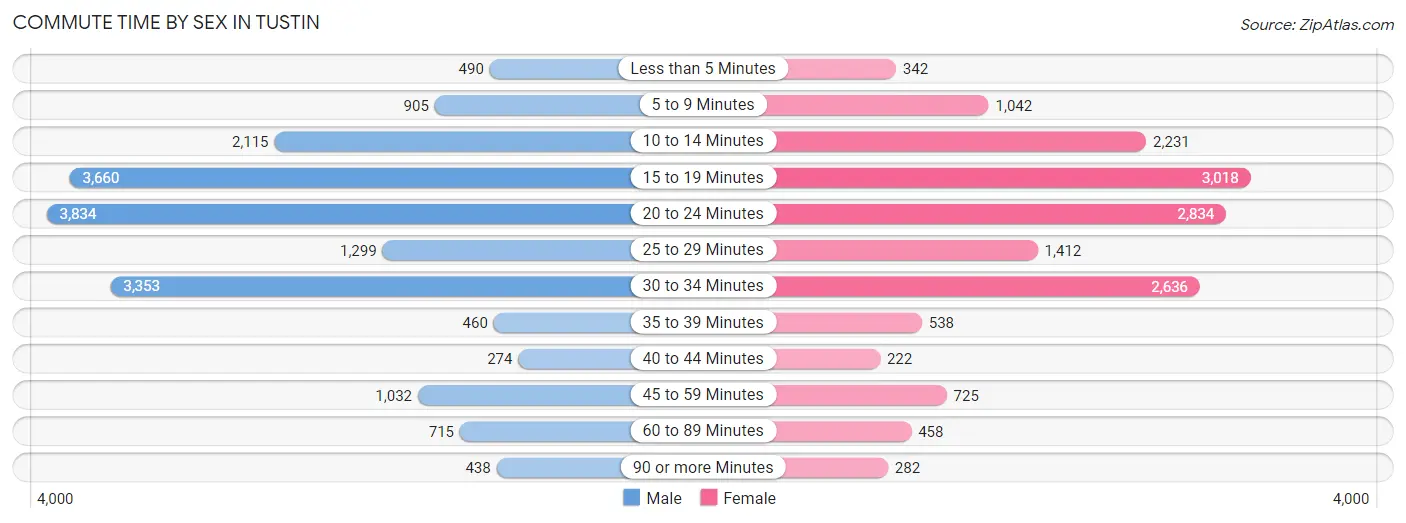
| Commute Time | Male | Female |
| Less than 5 Minutes | 490 (2.6%) | 342 (2.2%) |
| 5 to 9 Minutes | 905 (4.9%) | 1,042 (6.6%) |
| 10 to 14 Minutes | 2,115 (11.4%) | 2,231 (14.2%) |
| 15 to 19 Minutes | 3,660 (19.7%) | 3,018 (19.2%) |
| 20 to 24 Minutes | 3,834 (20.6%) | 2,834 (18.0%) |
| 25 to 29 Minutes | 1,299 (7.0%) | 1,412 (9.0%) |
| 30 to 34 Minutes | 3,353 (18.0%) | 2,636 (16.8%) |
| 35 to 39 Minutes | 460 (2.5%) | 538 (3.4%) |
| 40 to 44 Minutes | 274 (1.5%) | 222 (1.4%) |
| 45 to 59 Minutes | 1,032 (5.6%) | 725 (4.6%) |
| 60 to 89 Minutes | 715 (3.8%) | 458 (2.9%) |
| 90 or more Minutes | 438 (2.4%) | 282 (1.8%) |
Time of Departure to Work by Sex in Tustin
The most frequent times of departure to work in Tustin are 8:00 AM to 8:29 AM (2,963, 16.0%) for males and 8:00 AM to 8:29 AM (2,850, 18.1%) for females.
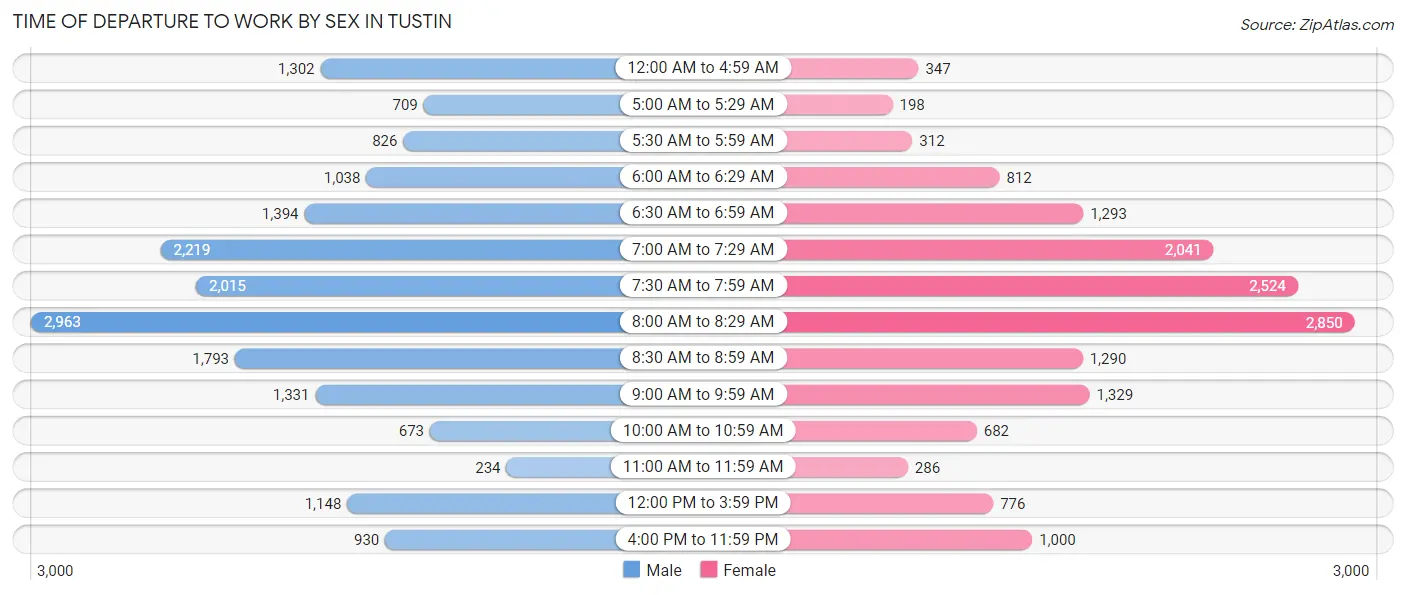
| Time of Departure | Male | Female |
| 12:00 AM to 4:59 AM | 1,302 (7.0%) | 347 (2.2%) |
| 5:00 AM to 5:29 AM | 709 (3.8%) | 198 (1.3%) |
| 5:30 AM to 5:59 AM | 826 (4.4%) | 312 (2.0%) |
| 6:00 AM to 6:29 AM | 1,038 (5.6%) | 812 (5.2%) |
| 6:30 AM to 6:59 AM | 1,394 (7.5%) | 1,293 (8.2%) |
| 7:00 AM to 7:29 AM | 2,219 (11.9%) | 2,041 (13.0%) |
| 7:30 AM to 7:59 AM | 2,015 (10.8%) | 2,524 (16.0%) |
| 8:00 AM to 8:29 AM | 2,963 (16.0%) | 2,850 (18.1%) |
| 8:30 AM to 8:59 AM | 1,793 (9.7%) | 1,290 (8.2%) |
| 9:00 AM to 9:59 AM | 1,331 (7.2%) | 1,329 (8.4%) |
| 10:00 AM to 10:59 AM | 673 (3.6%) | 682 (4.3%) |
| 11:00 AM to 11:59 AM | 234 (1.3%) | 286 (1.8%) |
| 12:00 PM to 3:59 PM | 1,148 (6.2%) | 776 (4.9%) |
| 4:00 PM to 11:59 PM | 930 (5.0%) | 1,000 (6.4%) |
| Total | 18,575 (100.0%) | 15,740 (100.0%) |
Housing Occupancy in Tustin
Occupancy by Ownership in Tustin
Of the total 26,508 dwellings in Tustin, owner-occupied units account for 13,318 (50.2%), while renter-occupied units make up 13,190 (49.8%).
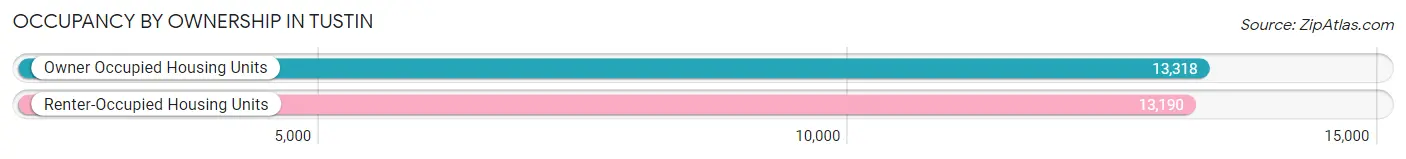
| Occupancy | # Housing Units | % Housing Units |
| Owner Occupied Housing Units | 13,318 | 50.2% |
| Renter-Occupied Housing Units | 13,190 | 49.8% |
| Total Occupied Housing Units | 26,508 | 100.0% |
Occupancy by Household Size in Tustin
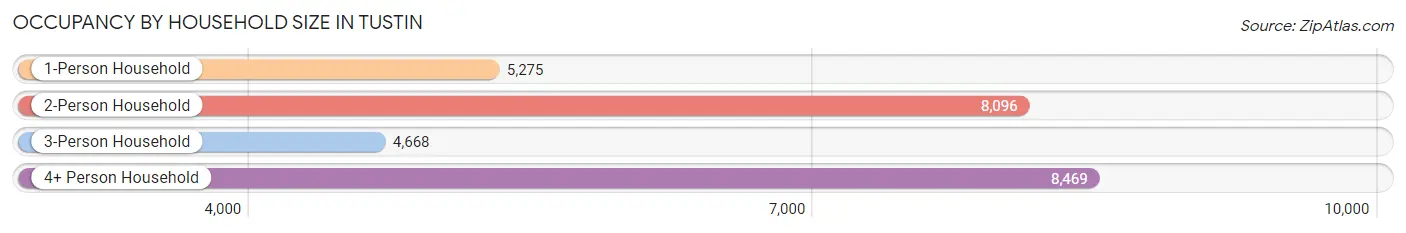
| Household Size | # Housing Units | % Housing Units |
| 1-Person Household | 5,275 | 19.9% |
| 2-Person Household | 8,096 | 30.5% |
| 3-Person Household | 4,668 | 17.6% |
| 4+ Person Household | 8,469 | 32.0% |
| Total Housing Units | 26,508 | 100.0% |
Occupancy by Ownership by Household Size in Tustin
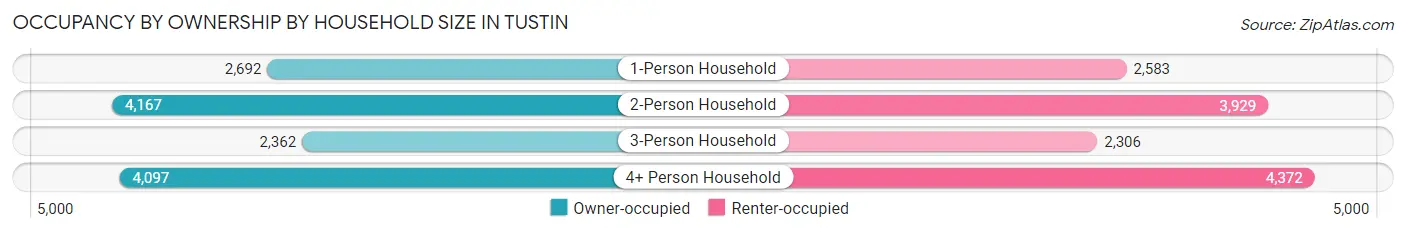
| Household Size | Owner-occupied | Renter-occupied |
| 1-Person Household | 2,692 (51.0%) | 2,583 (49.0%) |
| 2-Person Household | 4,167 (51.5%) | 3,929 (48.5%) |
| 3-Person Household | 2,362 (50.6%) | 2,306 (49.4%) |
| 4+ Person Household | 4,097 (48.4%) | 4,372 (51.6%) |
| Total Housing Units | 13,318 (50.2%) | 13,190 (49.8%) |
Occupancy by Educational Attainment in Tustin
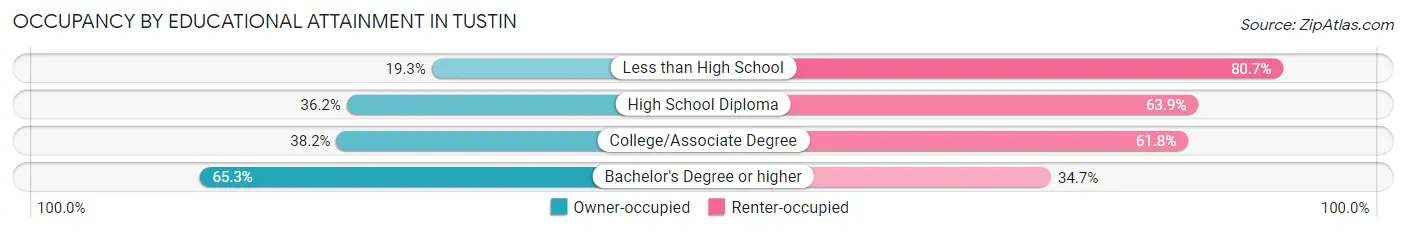
| Household Size | Owner-occupied | Renter-occupied |
| Less than High School | 407 (19.3%) | 1,702 (80.7%) |
| High School Diploma | 1,256 (36.1%) | 2,218 (63.8%) |
| College/Associate Degree | 2,833 (38.2%) | 4,588 (61.8%) |
| Bachelor's Degree or higher | 8,822 (65.3%) | 4,682 (34.7%) |
Occupancy by Age of Householder in Tustin
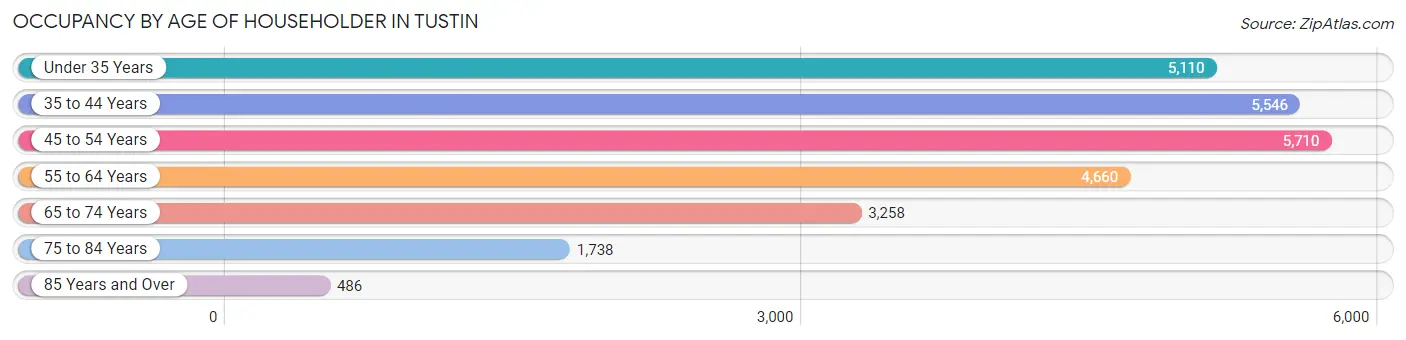
| Age Bracket | # Households | % Households |
| Under 35 Years | 5,110 | 19.3% |
| 35 to 44 Years | 5,546 | 20.9% |
| 45 to 54 Years | 5,710 | 21.5% |
| 55 to 64 Years | 4,660 | 17.6% |
| 65 to 74 Years | 3,258 | 12.3% |
| 75 to 84 Years | 1,738 | 6.6% |
| 85 Years and Over | 486 | 1.8% |
| Total | 26,508 | 100.0% |
Housing Finances in Tustin
Median Income by Occupancy in Tustin
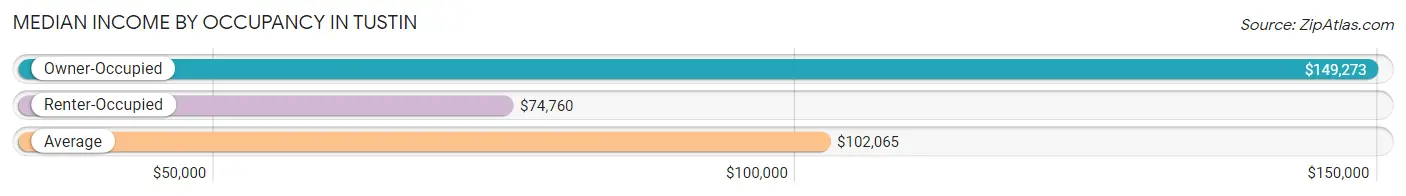
| Occupancy Type | # Households | Median Income |
| Owner-Occupied | 13,318 (50.2%) | $149,273 |
| Renter-Occupied | 13,190 (49.8%) | $74,760 |
| Average | 26,508 (100.0%) | $102,065 |
Occupancy by Householder Income Bracket in Tustin
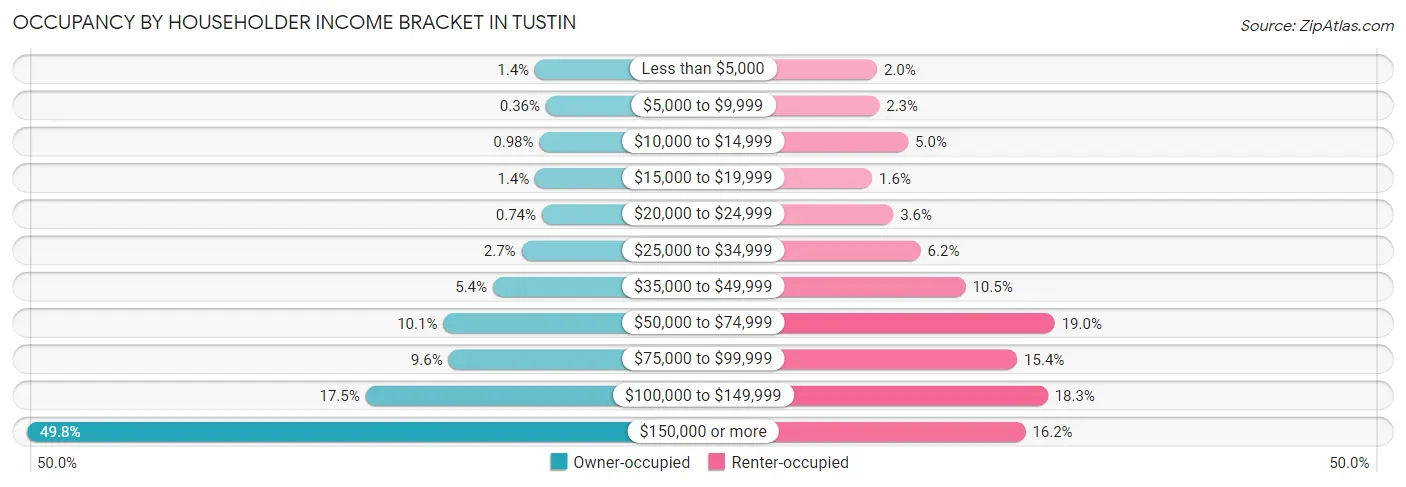
| Income Bracket | Owner-occupied | Renter-occupied |
| Less than $5,000 | 187 (1.4%) | 269 (2.0%) |
| $5,000 to $9,999 | 48 (0.4%) | 298 (2.3%) |
| $10,000 to $14,999 | 131 (1.0%) | 661 (5.0%) |
| $15,000 to $19,999 | 184 (1.4%) | 209 (1.6%) |
| $20,000 to $24,999 | 99 (0.7%) | 474 (3.6%) |
| $25,000 to $34,999 | 357 (2.7%) | 818 (6.2%) |
| $35,000 to $49,999 | 719 (5.4%) | 1,381 (10.5%) |
| $50,000 to $74,999 | 1,349 (10.1%) | 2,502 (19.0%) |
| $75,000 to $99,999 | 1,282 (9.6%) | 2,030 (15.4%) |
| $100,000 to $149,999 | 2,335 (17.5%) | 2,414 (18.3%) |
| $150,000 or more | 6,627 (49.8%) | 2,134 (16.2%) |
| Total | 13,318 (100.0%) | 13,190 (100.0%) |
Monthly Housing Cost Tiers in Tustin
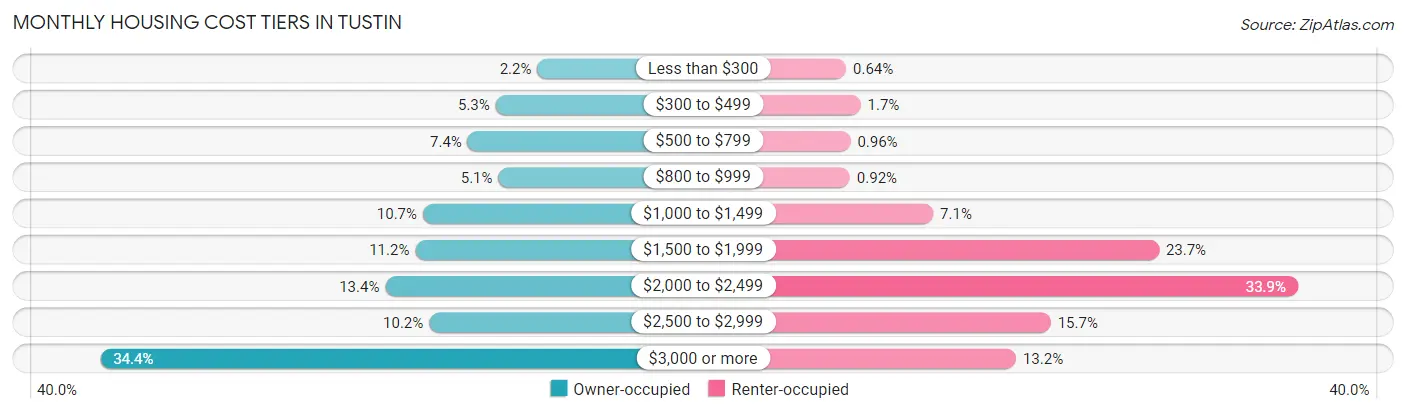
| Monthly Cost | Owner-occupied | Renter-occupied |
| Less than $300 | 298 (2.2%) | 84 (0.6%) |
| $300 to $499 | 707 (5.3%) | 226 (1.7%) |
| $500 to $799 | 981 (7.4%) | 126 (1.0%) |
| $800 to $999 | 680 (5.1%) | 121 (0.9%) |
| $1,000 to $1,499 | 1,421 (10.7%) | 930 (7.0%) |
| $1,500 to $1,999 | 1,496 (11.2%) | 3,123 (23.7%) |
| $2,000 to $2,499 | 1,790 (13.4%) | 4,471 (33.9%) |
| $2,500 to $2,999 | 1,360 (10.2%) | 2,072 (15.7%) |
| $3,000 or more | 4,585 (34.4%) | 1,734 (13.2%) |
| Total | 13,318 (100.0%) | 13,190 (100.0%) |
Physical Housing Characteristics in Tustin
Housing Structures in Tustin
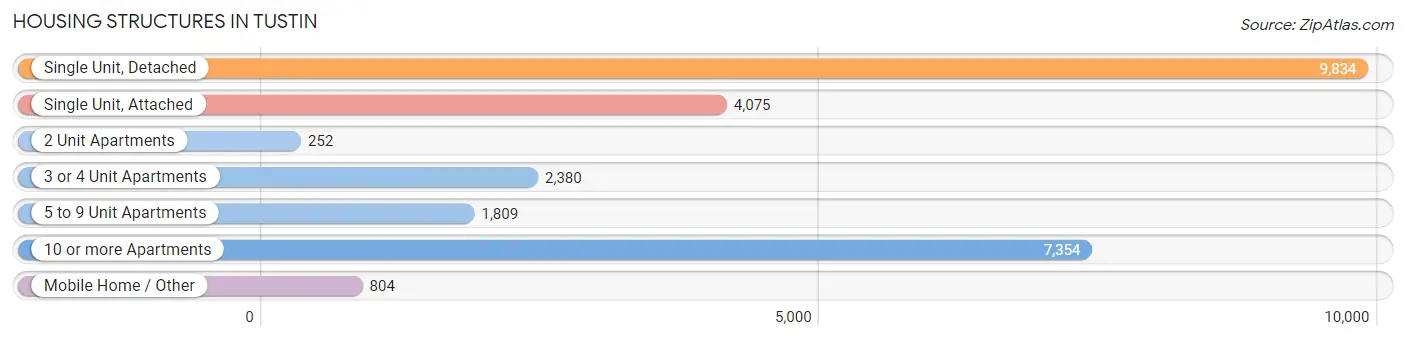
| Structure Type | # Housing Units | % Housing Units |
| Single Unit, Detached | 9,834 | 37.1% |
| Single Unit, Attached | 4,075 | 15.4% |
| 2 Unit Apartments | 252 | 0.9% |
| 3 or 4 Unit Apartments | 2,380 | 9.0% |
| 5 to 9 Unit Apartments | 1,809 | 6.8% |
| 10 or more Apartments | 7,354 | 27.7% |
| Mobile Home / Other | 804 | 3.0% |
| Total | 26,508 | 100.0% |
Housing Structures by Occupancy in Tustin
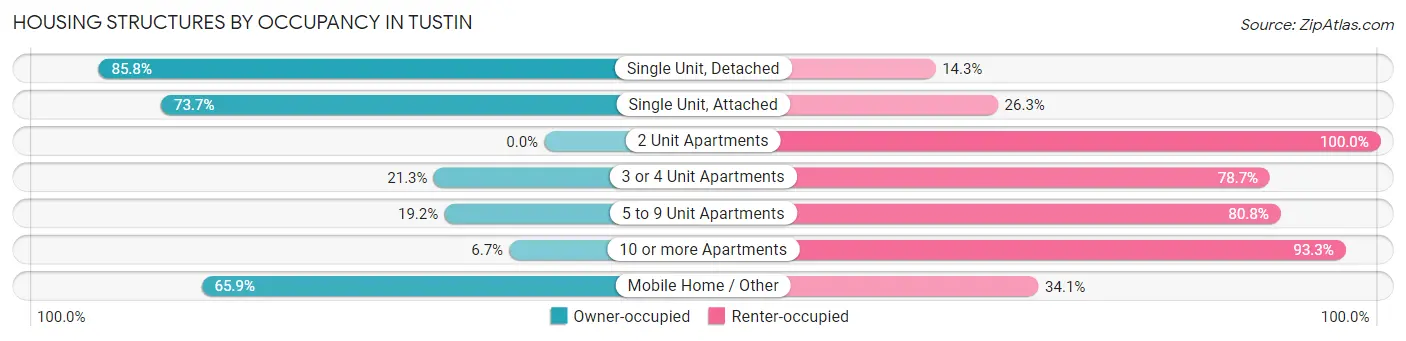
| Structure Type | Owner-occupied | Renter-occupied |
| Single Unit, Detached | 8,433 (85.8%) | 1,401 (14.2%) |
| Single Unit, Attached | 3,004 (73.7%) | 1,071 (26.3%) |
| 2 Unit Apartments | 0 (0.0%) | 252 (100.0%) |
| 3 or 4 Unit Apartments | 507 (21.3%) | 1,873 (78.7%) |
| 5 to 9 Unit Apartments | 348 (19.2%) | 1,461 (80.8%) |
| 10 or more Apartments | 496 (6.7%) | 6,858 (93.3%) |
| Mobile Home / Other | 530 (65.9%) | 274 (34.1%) |
| Total | 13,318 (50.2%) | 13,190 (49.8%) |
Housing Structures by Number of Rooms in Tustin
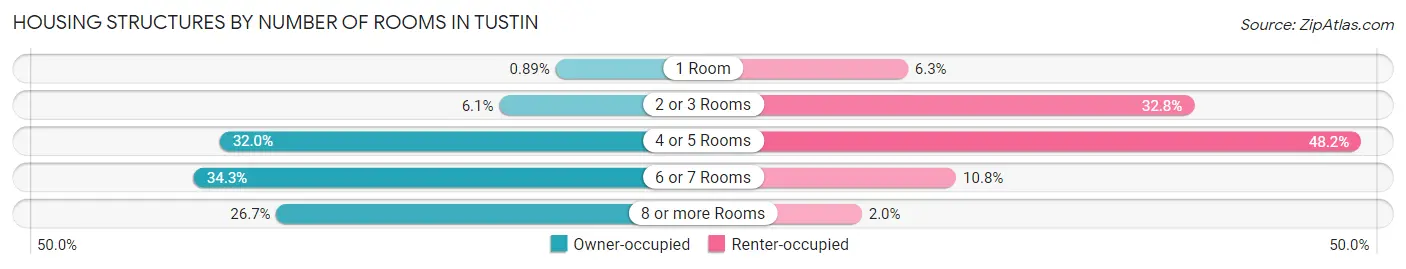
| Number of Rooms | Owner-occupied | Renter-occupied |
| 1 Room | 119 (0.9%) | 828 (6.3%) |
| 2 or 3 Rooms | 813 (6.1%) | 4,320 (32.8%) |
| 4 or 5 Rooms | 4,255 (32.0%) | 6,357 (48.2%) |
| 6 or 7 Rooms | 4,574 (34.3%) | 1,418 (10.7%) |
| 8 or more Rooms | 3,557 (26.7%) | 267 (2.0%) |
| Total | 13,318 (100.0%) | 13,190 (100.0%) |
Housing Structure by Heating Type in Tustin
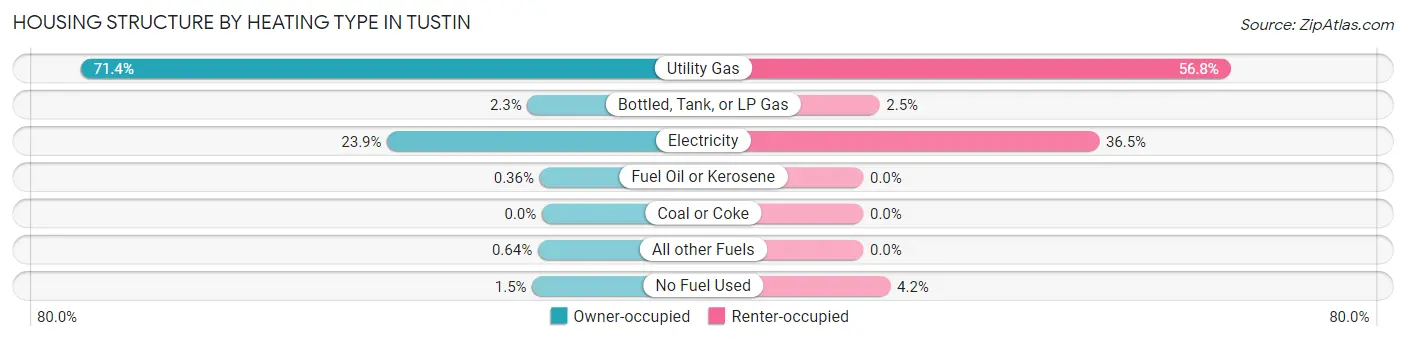
| Heating Type | Owner-occupied | Renter-occupied |
| Utility Gas | 9,502 (71.4%) | 7,496 (56.8%) |
| Bottled, Tank, or LP Gas | 300 (2.2%) | 333 (2.5%) |
| Electricity | 3,185 (23.9%) | 4,810 (36.5%) |
| Fuel Oil or Kerosene | 48 (0.4%) | 0 (0.0%) |
| Coal or Coke | 0 (0.0%) | 0 (0.0%) |
| All other Fuels | 85 (0.6%) | 0 (0.0%) |
| No Fuel Used | 198 (1.5%) | 551 (4.2%) |
| Total | 13,318 (100.0%) | 13,190 (100.0%) |
Household Vehicle Usage in Tustin
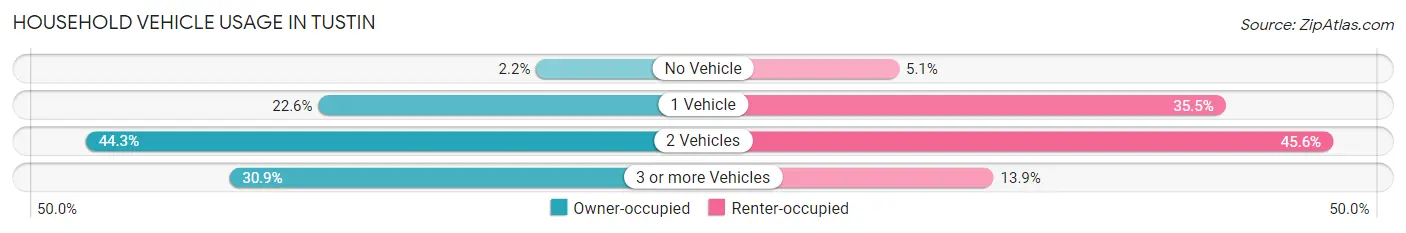
| Vehicles per Household | Owner-occupied | Renter-occupied |
| No Vehicle | 298 (2.2%) | 666 (5.1%) |
| 1 Vehicle | 3,007 (22.6%) | 4,685 (35.5%) |
| 2 Vehicles | 5,899 (44.3%) | 6,008 (45.6%) |
| 3 or more Vehicles | 4,114 (30.9%) | 1,831 (13.9%) |
| Total | 13,318 (100.0%) | 13,190 (100.0%) |
Real Estate & Mortgages in Tustin
Real Estate and Mortgage Overview in Tustin
| Characteristic | Without Mortgage | With Mortgage |
| Housing Units | 4,426 | 8,892 |
| Median Property Value | $866,700 | $842,000 |
| Median Household Income | $99,512 | $4,857 |
| Monthly Housing Costs | $864 | $4,585 |
| Real Estate Taxes | $4,850 | $80 |
Property Value by Mortgage Status in Tustin
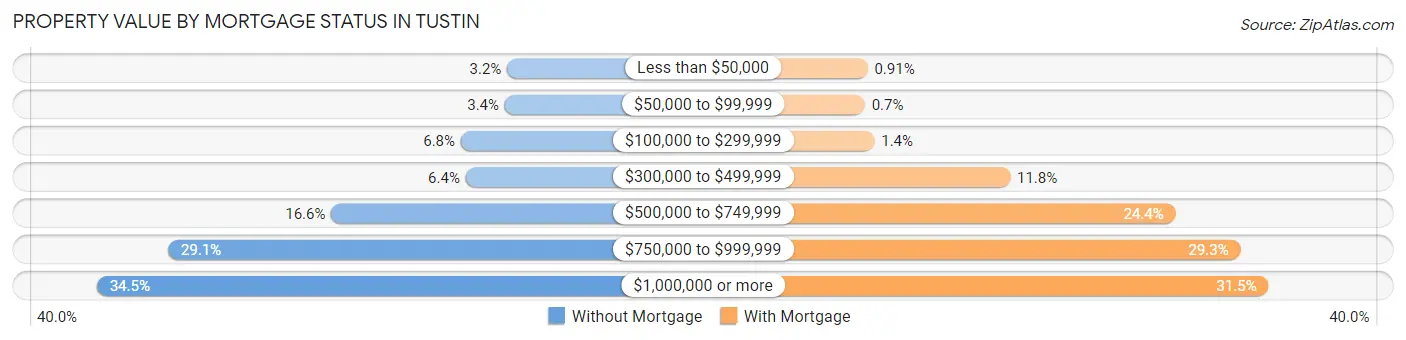
| Property Value | Without Mortgage | With Mortgage |
| Less than $50,000 | 143 (3.2%) | 81 (0.9%) |
| $50,000 to $99,999 | 151 (3.4%) | 62 (0.7%) |
| $100,000 to $299,999 | 299 (6.8%) | 127 (1.4%) |
| $300,000 to $499,999 | 283 (6.4%) | 1,047 (11.8%) |
| $500,000 to $749,999 | 736 (16.6%) | 2,169 (24.4%) |
| $750,000 to $999,999 | 1,287 (29.1%) | 2,608 (29.3%) |
| $1,000,000 or more | 1,527 (34.5%) | 2,798 (31.5%) |
| Total | 4,426 (100.0%) | 8,892 (100.0%) |
Household Income by Mortgage Status in Tustin
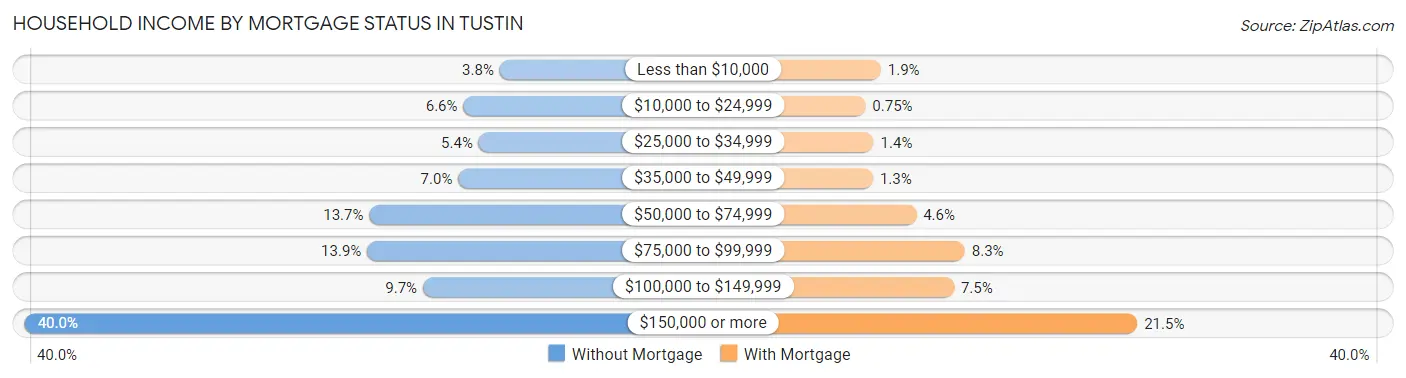
| Household Income | Without Mortgage | With Mortgage |
| Less than $10,000 | 168 (3.8%) | 172 (1.9%) |
| $10,000 to $24,999 | 291 (6.6%) | 67 (0.7%) |
| $25,000 to $34,999 | 239 (5.4%) | 123 (1.4%) |
| $35,000 to $49,999 | 308 (7.0%) | 118 (1.3%) |
| $50,000 to $74,999 | 608 (13.7%) | 411 (4.6%) |
| $75,000 to $99,999 | 615 (13.9%) | 741 (8.3%) |
| $100,000 to $149,999 | 427 (9.7%) | 667 (7.5%) |
| $150,000 or more | 1,770 (40.0%) | 1,908 (21.5%) |
| Total | 4,426 (100.0%) | 8,892 (100.0%) |
Property Value to Household Income Ratio in Tustin
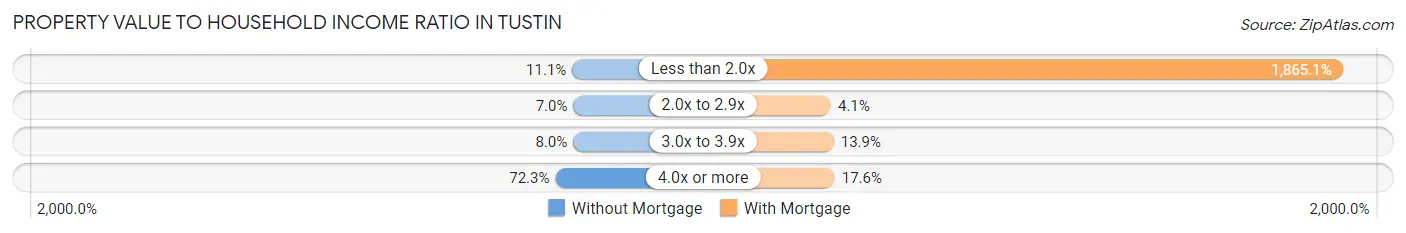
| Value-to-Income Ratio | Without Mortgage | With Mortgage |
| Less than 2.0x | 492 (11.1%) | 165,848 (1,865.1%) |
| 2.0x to 2.9x | 309 (7.0%) | 361 (4.1%) |
| 3.0x to 3.9x | 354 (8.0%) | 1,237 (13.9%) |
| 4.0x or more | 3,198 (72.3%) | 1,566 (17.6%) |
| Total | 4,426 (100.0%) | 8,892 (100.0%) |
Real Estate Taxes by Mortgage Status in Tustin
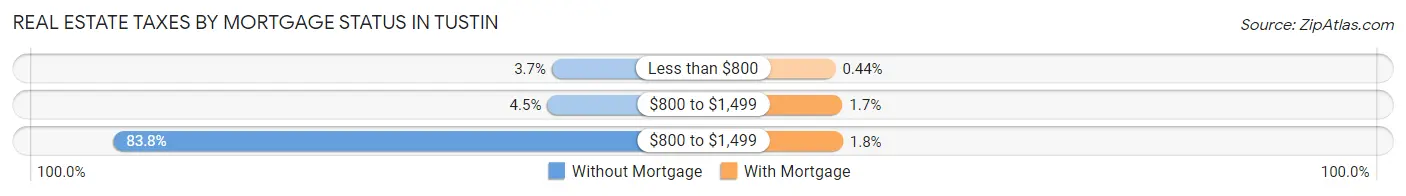
| Property Taxes | Without Mortgage | With Mortgage |
| Less than $800 | 164 (3.7%) | 39 (0.4%) |
| $800 to $1,499 | 201 (4.5%) | 152 (1.7%) |
| $800 to $1,499 | 3,708 (83.8%) | 159 (1.8%) |
| Total | 4,426 (100.0%) | 8,892 (100.0%) |
Health & Disability in Tustin
Health Insurance Coverage by Age in Tustin
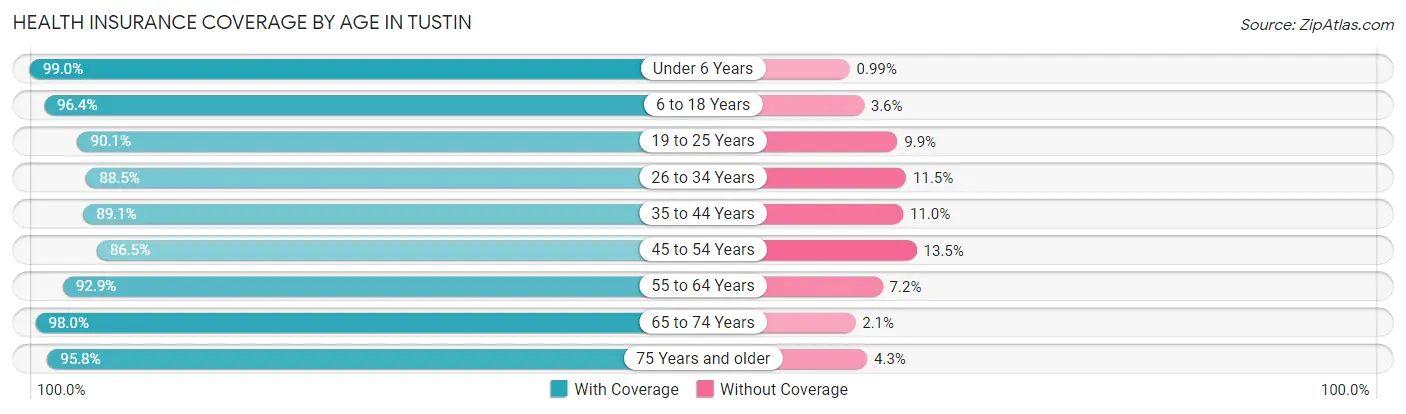
| Age Bracket | With Coverage | Without Coverage |
| Under 6 Years | 5,919 (99.0%) | 59 (1.0%) |
| 6 to 18 Years | 13,730 (96.4%) | 517 (3.6%) |
| 19 to 25 Years | 6,777 (90.1%) | 744 (9.9%) |
| 26 to 34 Years | 9,304 (88.5%) | 1,213 (11.5%) |
| 35 to 44 Years | 10,327 (89.0%) | 1,270 (11.0%) |
| 45 to 54 Years | 9,007 (86.5%) | 1,402 (13.5%) |
| 55 to 64 Years | 8,264 (92.8%) | 636 (7.1%) |
| 65 to 74 Years | 5,816 (98.0%) | 122 (2.1%) |
| 75 Years and older | 4,058 (95.8%) | 180 (4.3%) |
| Total | 73,202 (92.3%) | 6,143 (7.7%) |
Health Insurance Coverage by Citizenship Status in Tustin
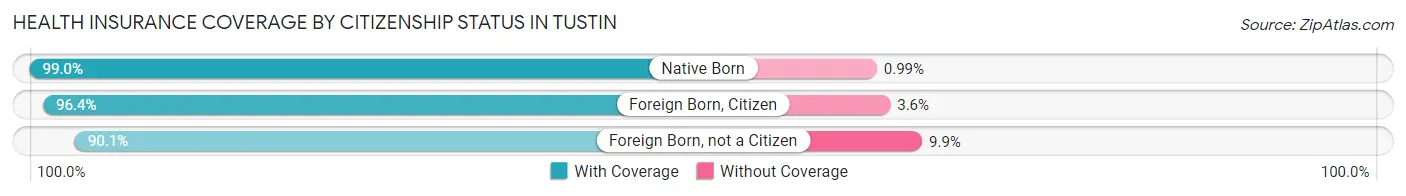
| Citizenship Status | With Coverage | Without Coverage |
| Native Born | 5,919 (99.0%) | 59 (1.0%) |
| Foreign Born, Citizen | 13,730 (96.4%) | 517 (3.6%) |
| Foreign Born, not a Citizen | 6,777 (90.1%) | 744 (9.9%) |
Health Insurance Coverage by Household Income in Tustin
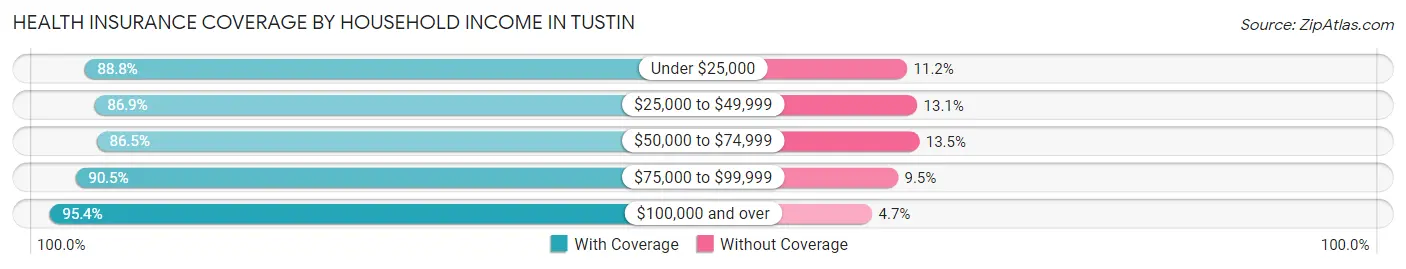
| Household Income | With Coverage | Without Coverage |
| Under $25,000 | 4,485 (88.8%) | 566 (11.2%) |
| $25,000 to $49,999 | 7,476 (86.9%) | 1,125 (13.1%) |
| $50,000 to $74,999 | 9,330 (86.5%) | 1,455 (13.5%) |
| $75,000 to $99,999 | 8,550 (90.5%) | 899 (9.5%) |
| $100,000 and over | 42,304 (95.4%) | 2,064 (4.6%) |
Public vs Private Health Insurance Coverage by Age in Tustin
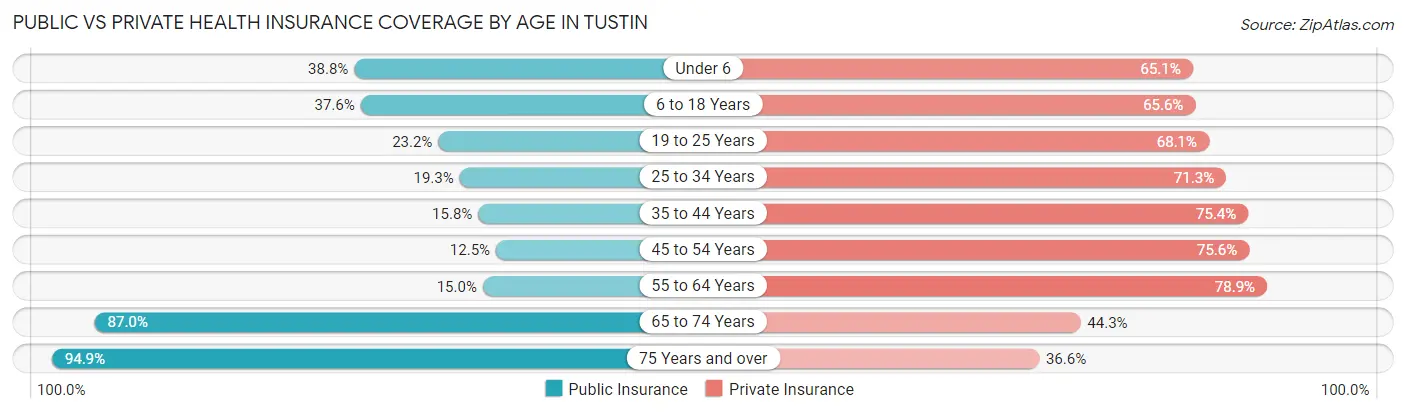
| Age Bracket | Public Insurance | Private Insurance |
| Under 6 | 2,321 (38.8%) | 3,892 (65.1%) |
| 6 to 18 Years | 5,363 (37.6%) | 9,345 (65.6%) |
| 19 to 25 Years | 1,747 (23.2%) | 5,124 (68.1%) |
| 25 to 34 Years | 2,027 (19.3%) | 7,501 (71.3%) |
| 35 to 44 Years | 1,834 (15.8%) | 8,745 (75.4%) |
| 45 to 54 Years | 1,303 (12.5%) | 7,868 (75.6%) |
| 55 to 64 Years | 1,331 (15.0%) | 7,022 (78.9%) |
| 65 to 74 Years | 5,166 (87.0%) | 2,630 (44.3%) |
| 75 Years and over | 4,023 (94.9%) | 1,551 (36.6%) |
| Total | 25,115 (31.7%) | 53,678 (67.6%) |
Disability Status by Sex by Age in Tustin
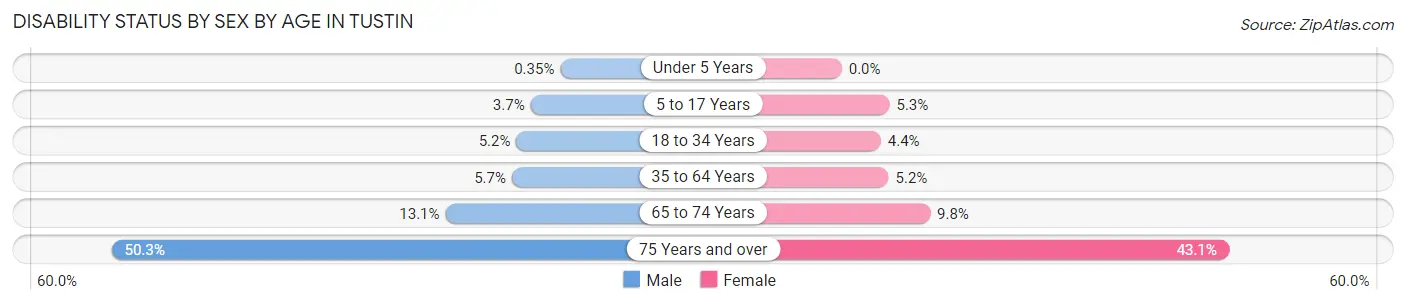
| Age Bracket | Male | Female |
| Under 5 Years | 11 (0.4%) | 0 (0.0%) |
| 5 to 17 Years | 273 (3.7%) | 333 (5.3%) |
| 18 to 34 Years | 497 (5.2%) | 427 (4.3%) |
| 35 to 64 Years | 867 (5.7%) | 822 (5.2%) |
| 65 to 74 Years | 370 (13.1%) | 307 (9.8%) |
| 75 Years and over | 655 (50.3%) | 1,265 (43.1%) |
Disability Class by Sex by Age in Tustin
Disability Class: Hearing Difficulty
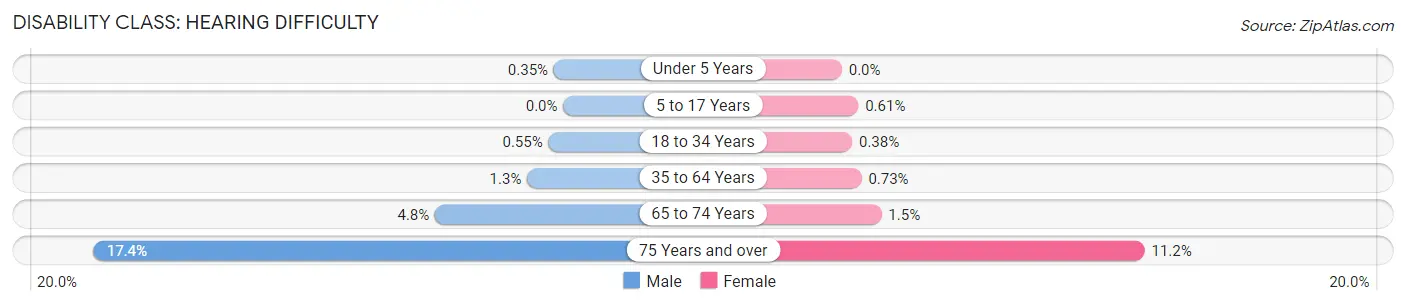
| Age Bracket | Male | Female |
| Under 5 Years | 11 (0.4%) | 0 (0.0%) |
| 5 to 17 Years | 0 (0.0%) | 38 (0.6%) |
| 18 to 34 Years | 52 (0.5%) | 37 (0.4%) |
| 35 to 64 Years | 202 (1.3%) | 115 (0.7%) |
| 65 to 74 Years | 134 (4.8%) | 46 (1.5%) |
| 75 Years and over | 227 (17.4%) | 330 (11.2%) |
Disability Class: Vision Difficulty
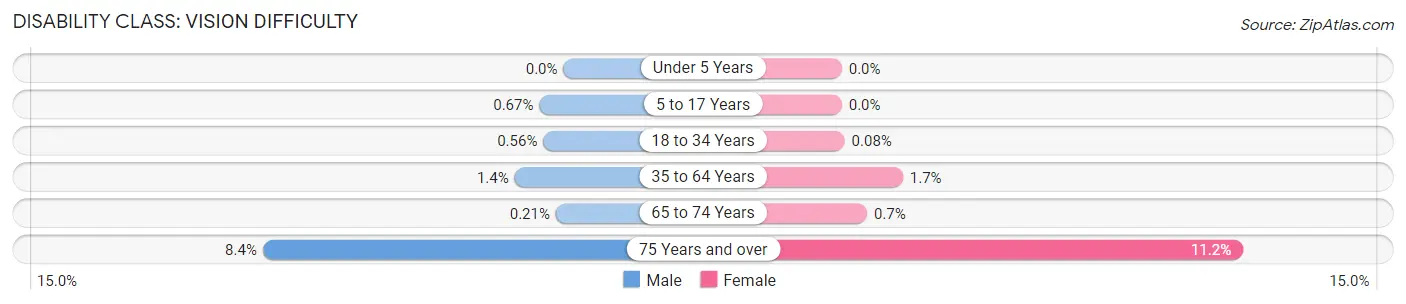
| Age Bracket | Male | Female |
| Under 5 Years | 0 (0.0%) | 0 (0.0%) |
| 5 to 17 Years | 50 (0.7%) | 0 (0.0%) |
| 18 to 34 Years | 53 (0.6%) | 8 (0.1%) |
| 35 to 64 Years | 206 (1.4%) | 268 (1.7%) |
| 65 to 74 Years | 6 (0.2%) | 22 (0.7%) |
| 75 Years and over | 109 (8.4%) | 328 (11.2%) |
Disability Class: Cognitive Difficulty
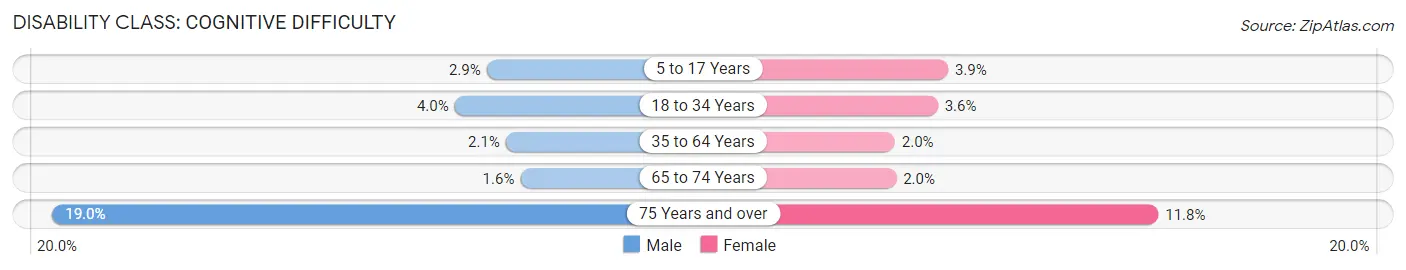
| Age Bracket | Male | Female |
| 5 to 17 Years | 213 (2.9%) | 247 (3.9%) |
| 18 to 34 Years | 383 (4.0%) | 349 (3.6%) |
| 35 to 64 Years | 324 (2.1%) | 311 (2.0%) |
| 65 to 74 Years | 45 (1.6%) | 63 (2.0%) |
| 75 Years and over | 247 (19.0%) | 345 (11.7%) |
Disability Class: Ambulatory Difficulty
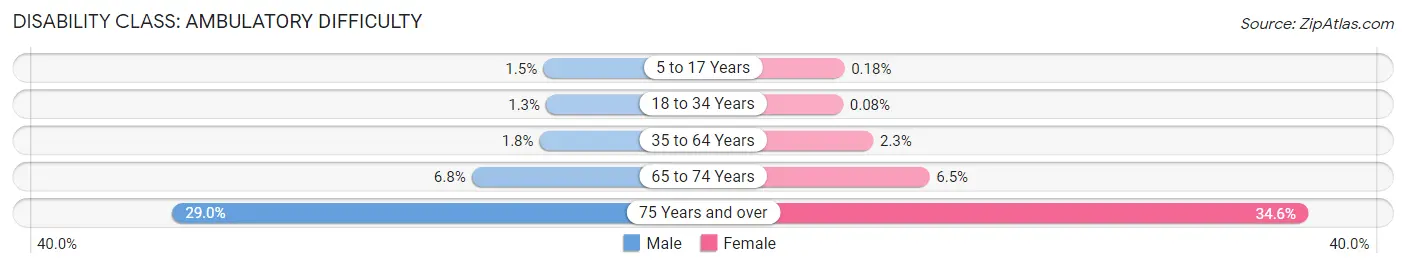
| Age Bracket | Male | Female |
| 5 to 17 Years | 113 (1.5%) | 11 (0.2%) |
| 18 to 34 Years | 123 (1.3%) | 8 (0.1%) |
| 35 to 64 Years | 269 (1.8%) | 367 (2.3%) |
| 65 to 74 Years | 192 (6.8%) | 203 (6.5%) |
| 75 Years and over | 378 (29.0%) | 1,016 (34.6%) |
Disability Class: Self-Care Difficulty
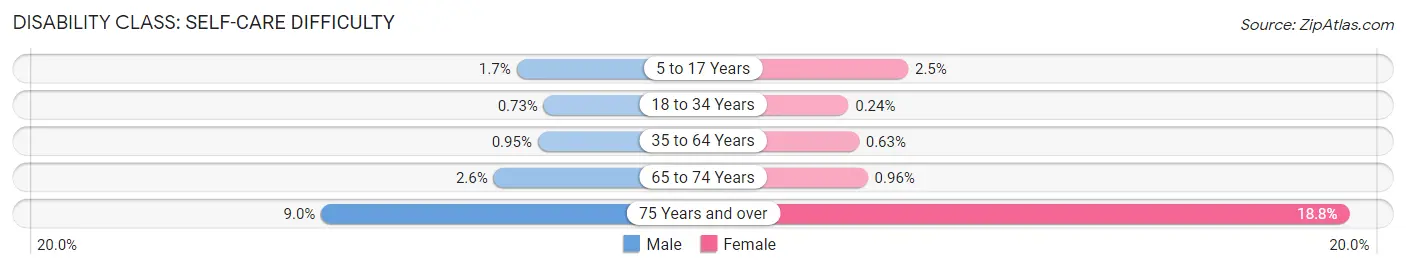
| Age Bracket | Male | Female |
| 5 to 17 Years | 130 (1.7%) | 154 (2.5%) |
| 18 to 34 Years | 69 (0.7%) | 24 (0.2%) |
| 35 to 64 Years | 143 (0.9%) | 100 (0.6%) |
| 65 to 74 Years | 73 (2.6%) | 30 (1.0%) |
| 75 Years and over | 117 (9.0%) | 553 (18.8%) |
Technology Access in Tustin
Computing Device Access in Tustin
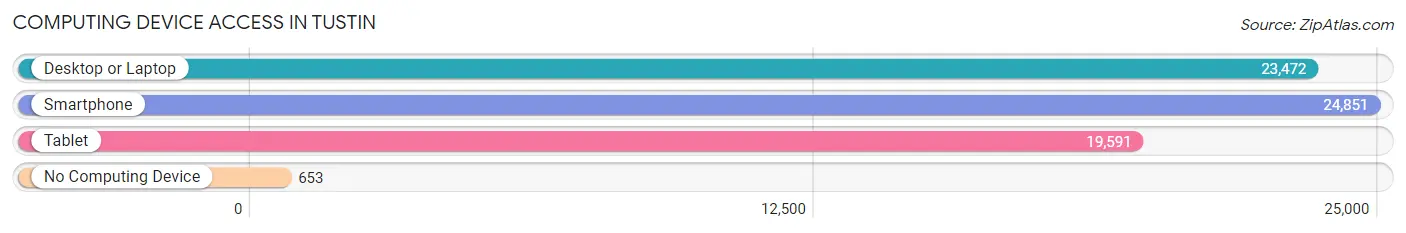
| Device Type | # Households | % Households |
| Desktop or Laptop | 23,472 | 88.5% |
| Smartphone | 24,851 | 93.8% |
| Tablet | 19,591 | 73.9% |
| No Computing Device | 653 | 2.5% |
| Total | 26,508 | 100.0% |
Internet Access in Tustin
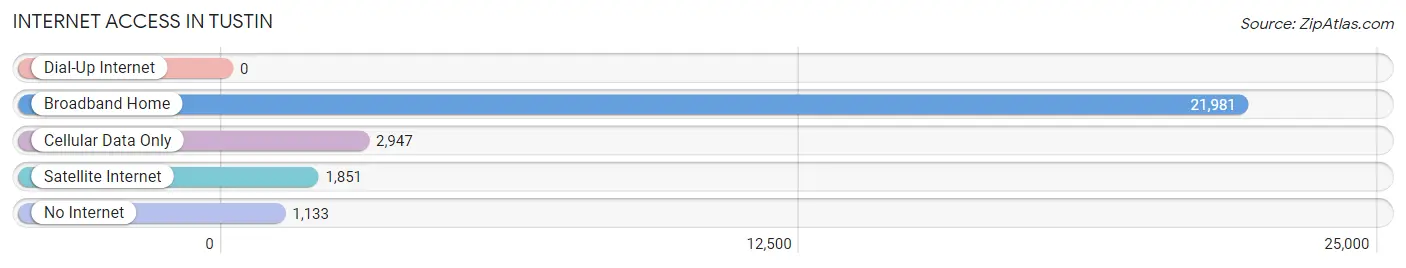
| Internet Type | # Households | % Households |
| Dial-Up Internet | 0 | 0.0% |
| Broadband Home | 21,981 | 82.9% |
| Cellular Data Only | 2,947 | 11.1% |
| Satellite Internet | 1,851 | 7.0% |
| No Internet | 1,133 | 4.3% |
| Total | 26,508 | 100.0% |
Tustin Summary
Tustin, California is a city located in Orange County, California. It is bordered by the cities of Santa Ana, Irvine, and Orange. The city has a population of 81,344 as of the 2020 census, making it the 24th most populous city in Orange County.
History
Tustin was founded in 1868 by Columbus Tustin, a carriage maker from Northern California. He purchased 1,000 acres of land in what is now Tustin and named it after himself. The city was incorporated in 1927 and has since grown to become one of the most populous cities in Orange County.
Geography
Tustin is located in the heart of Orange County, California. It is bordered by the cities of Santa Ana, Irvine, and Orange. The city has a total area of 11.2 square miles, of which 11.1 square miles is land and 0.1 square miles is water. The city is located in the Santa Ana Mountains and is surrounded by hills and canyons.
Economy
Tustin is home to a variety of businesses and industries. The city is home to several major employers, including Beckman Coulter, Inc., Ingram Micro, and the Tustin Unified School District. The city is also home to several shopping centers, including The District at Tustin Legacy, Tustin Marketplace, and Tustin Ranch Plaza.
Demographics
As of the 2020 census, Tustin had a population of 81,344. The racial makeup of the city was 57.2% White, 8.2% African American, 0.7% Native American, 24.3% Asian, 0.3% Pacific Islander, 5.2% from other races, and 4.2% from two or more races. Hispanic or Latino of any race were 18.2% of the population.
The median income for a household in Tustin was $87,845, and the median income for a family was $103,845. The per capita income for the city was $37,845. About 8.2% of families and 10.3% of the population were below the poverty line, including 14.2% of those under age 18 and 6.2% of those age 65 or over.
Conclusion
Tustin, California is a city located in Orange County, California. It was founded in 1868 by Columbus Tustin and has since grown to become one of the most populous cities in Orange County. The city has a total area of 11.2 square miles and is bordered by the cities of Santa Ana, Irvine, and Orange. Tustin is home to a variety of businesses and industries, and the city has a population of 81,344 as of the 2020 census. The median income for a household in Tustin was $87,845, and the median income for a family was $103,845. The city is a diverse and vibrant community with a rich history and a bright future.
Common Questions
What is Per Capita Income in Tustin?
Per Capita income in Tustin is $47,648.
What is the Median Family Income in Tustin?
Median Family Income in Tustin is $116,749.
What is the Median Household income in Tustin?
Median Household Income in Tustin is $102,065.
What is Income or Wage Gap in Tustin?
Income or Wage Gap in Tustin is 26.5%.
Women in Tustin earn 73.5 cents for every dollar earned by a man.
What is Family Income Deficit in Tustin?
Family Income Deficit in Tustin is $8,794.
Families that are below poverty line in Tustin earn $8,794 less on average than the poverty threshold level.
What is Inequality or Gini Index in Tustin?
Inequality or Gini Index in Tustin is 0.45.
What is the Total Population of Tustin?
Total Population of Tustin is 79,514.
What is the Total Male Population of Tustin?
Total Male Population of Tustin is 39,440.
What is the Total Female Population of Tustin?
Total Female Population of Tustin is 40,074.
What is the Ratio of Males per 100 Females in Tustin?
There are 98.42 Males per 100 Females in Tustin.
What is the Ratio of Females per 100 Males in Tustin?
There are 101.61 Females per 100 Males in Tustin.
What is the Median Population Age in Tustin?
Median Population Age in Tustin is 36.2 Years.
What is the Average Family Size in Tustin
Average Family Size in Tustin is 3.4 People.
What is the Average Household Size in Tustin
Average Household Size in Tustin is 3.0 People.
How Large is the Labor Force in Tustin?
There are 43,314 People in the Labor Forcein in Tustin.
What is the Percentage of People in the Labor Force in Tustin?
69.0% of People are in the Labor Force in Tustin.
What is the Unemployment Rate in Tustin?
Unemployment Rate in Tustin is 5.9%.