Rancho Palos Verdes, CA Map & Demographics
Rancho Palos Verdes Map
Rancho Palos Verdes Overview
$81,344
PER CAPITA INCOME
$184,718
AVG FAMILY INCOME
$166,747
AVG HOUSEHOLD INCOME
50.5%
WAGE / INCOME GAP [ % ]
49.5¢/ $1
WAGE / INCOME GAP [ $ ]
0.44
INEQUALITY / GINI INDEX
41,805
TOTAL POPULATION
20,343
MALE POPULATION
21,462
FEMALE POPULATION
94.79
MALES / 100 FEMALES
105.50
FEMALES / 100 MALES
49.8
MEDIAN AGE
3.1
AVG FAMILY SIZE
2.7
AVG HOUSEHOLD SIZE
19,221
LABOR FORCE [ PEOPLE ]
56.0%
PERCENT IN LABOR FORCE
5.1%
UNEMPLOYMENT RATE
Rancho Palos Verdes Zip Codes
Income in Rancho Palos Verdes
Income Overview in Rancho Palos Verdes
Per Capita Income in Rancho Palos Verdes is $81,344, while median incomes of families and households are $184,718 and $166,747 respectively.
| Characteristic | Number | Measure |
| Per Capita Income | 41,805 | $81,344 |
| Median Family Income | 12,027 | $184,718 |
| Mean Family Income | 12,027 | $241,030 |
| Median Household Income | 15,351 | $166,747 |
| Mean Household Income | 15,351 | $218,700 |
| Income Deficit | 12,027 | $0 |
| Wage / Income Gap (%) | 41,805 | 50.51% |
| Wage / Income Gap ($) | 41,805 | 49.49¢ per $1 |
| Gini / Inequality Index | 41,805 | 0.44 |
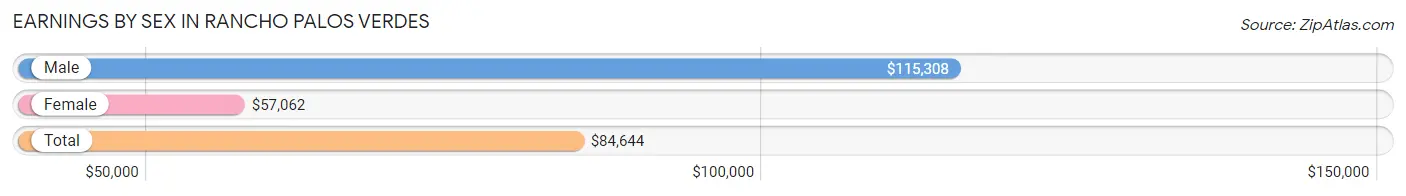
Earnings by Sex in Rancho Palos Verdes
Average Earnings in Rancho Palos Verdes are $84,644, $115,308 for men and $57,062 for women, a difference of 50.5%.
| Sex | Number | Average Earnings |
| Male | 10,697 (53.9%) | $115,308 |
| Female | 9,134 (46.1%) | $57,062 |
| Total | 19,831 (100.0%) | $84,644 |
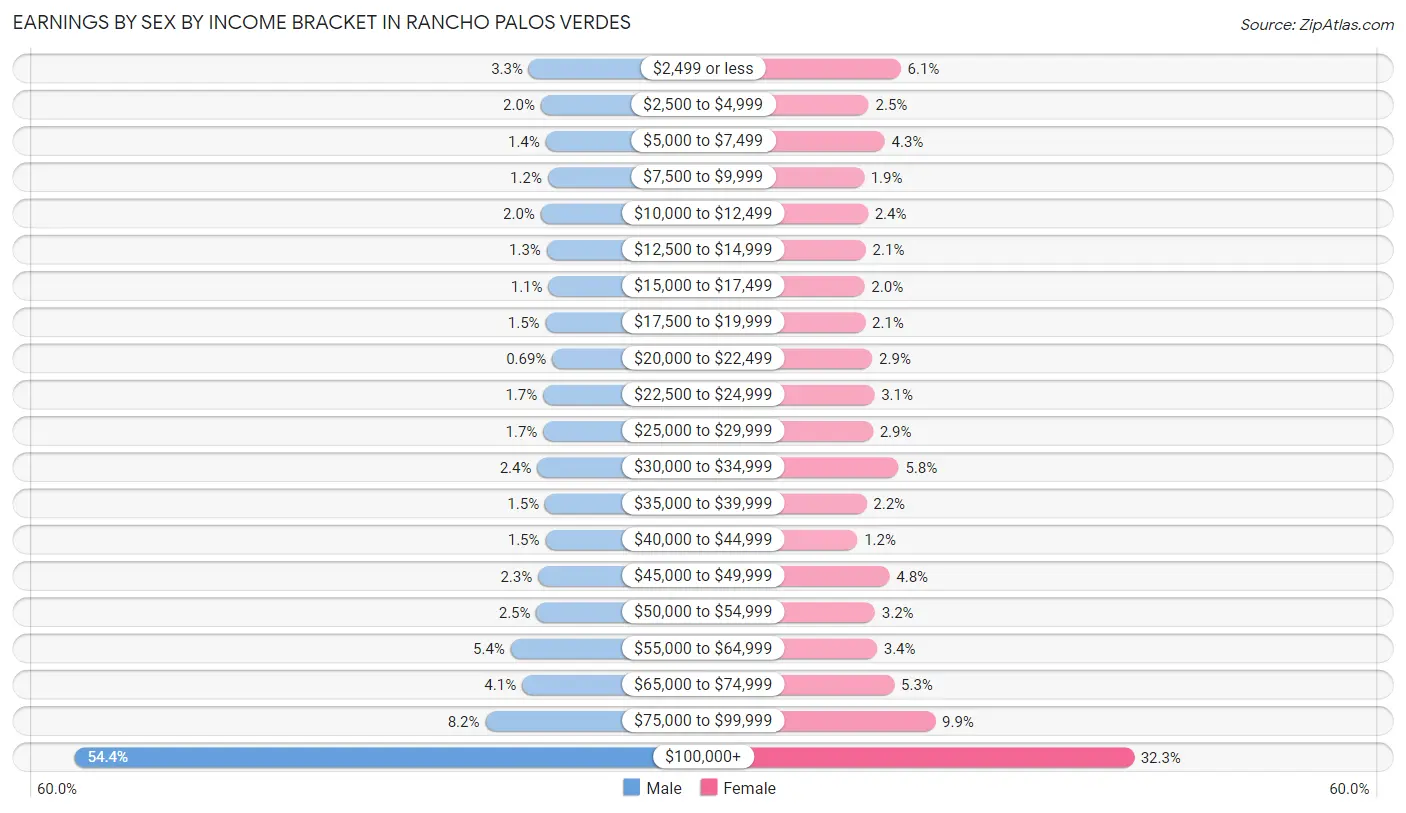
Earnings by Sex by Income Bracket in Rancho Palos Verdes
The most common earnings brackets in Rancho Palos Verdes are $100,000+ for men (5,816 | 54.4%) and $100,000+ for women (2,946 | 32.3%).
| Income | Male | Female |
| $2,499 or less | 355 (3.3%) | 553 (6.0%) |
| $2,500 to $4,999 | 212 (2.0%) | 224 (2.5%) |
| $5,000 to $7,499 | 153 (1.4%) | 388 (4.3%) |
| $7,500 to $9,999 | 127 (1.2%) | 174 (1.9%) |
| $10,000 to $12,499 | 213 (2.0%) | 215 (2.4%) |
| $12,500 to $14,999 | 140 (1.3%) | 194 (2.1%) |
| $15,000 to $17,499 | 120 (1.1%) | 181 (2.0%) |
| $17,500 to $19,999 | 155 (1.5%) | 187 (2.1%) |
| $20,000 to $22,499 | 74 (0.7%) | 260 (2.9%) |
| $22,500 to $24,999 | 184 (1.7%) | 281 (3.1%) |
| $25,000 to $29,999 | 183 (1.7%) | 266 (2.9%) |
| $30,000 to $34,999 | 253 (2.4%) | 531 (5.8%) |
| $35,000 to $39,999 | 160 (1.5%) | 201 (2.2%) |
| $40,000 to $44,999 | 156 (1.5%) | 107 (1.2%) |
| $45,000 to $49,999 | 244 (2.3%) | 437 (4.8%) |
| $50,000 to $54,999 | 264 (2.5%) | 288 (3.2%) |
| $55,000 to $64,999 | 573 (5.4%) | 308 (3.4%) |
| $65,000 to $74,999 | 437 (4.1%) | 486 (5.3%) |
| $75,000 to $99,999 | 878 (8.2%) | 907 (9.9%) |
| $100,000+ | 5,816 (54.4%) | 2,946 (32.3%) |
| Total | 10,697 (100.0%) | 9,134 (100.0%) |
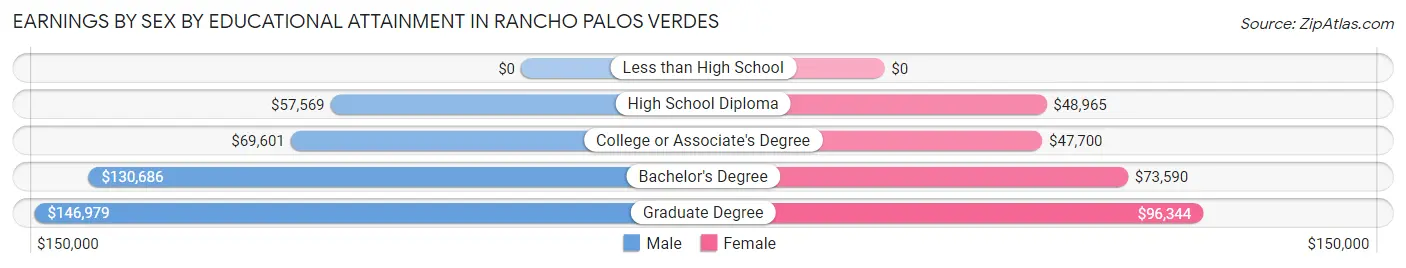
Earnings by Sex by Educational Attainment in Rancho Palos Verdes
Average earnings in Rancho Palos Verdes are $121,491 for men and $70,987 for women, a difference of 41.6%. Men with an educational attainment of graduate degree enjoy the highest average annual earnings of $146,979, while those with high school diploma education earn the least with $57,569. Women with an educational attainment of graduate degree earn the most with the average annual earnings of $96,344, while those with college or associate's degree education have the smallest earnings of $47,700.
| Educational Attainment | Male Income | Female Income |
| Less than High School | - | - |
| High School Diploma | $57,569 | $48,965 |
| College or Associate's Degree | $69,601 | $47,700 |
| Bachelor's Degree | $130,686 | $73,590 |
| Graduate Degree | $146,979 | $96,344 |
| Total | $121,491 | $70,987 |
Family Income in Rancho Palos Verdes
Family Income Brackets in Rancho Palos Verdes
According to the Rancho Palos Verdes family income data, there are 5,665 families falling into the $200,000+ income range, which is the most common income bracket and makes up 47.1% of all families. Conversely, the $10,000 to $14,999 income bracket is the least frequent group with only 36 families (0.3%) belonging to this category.
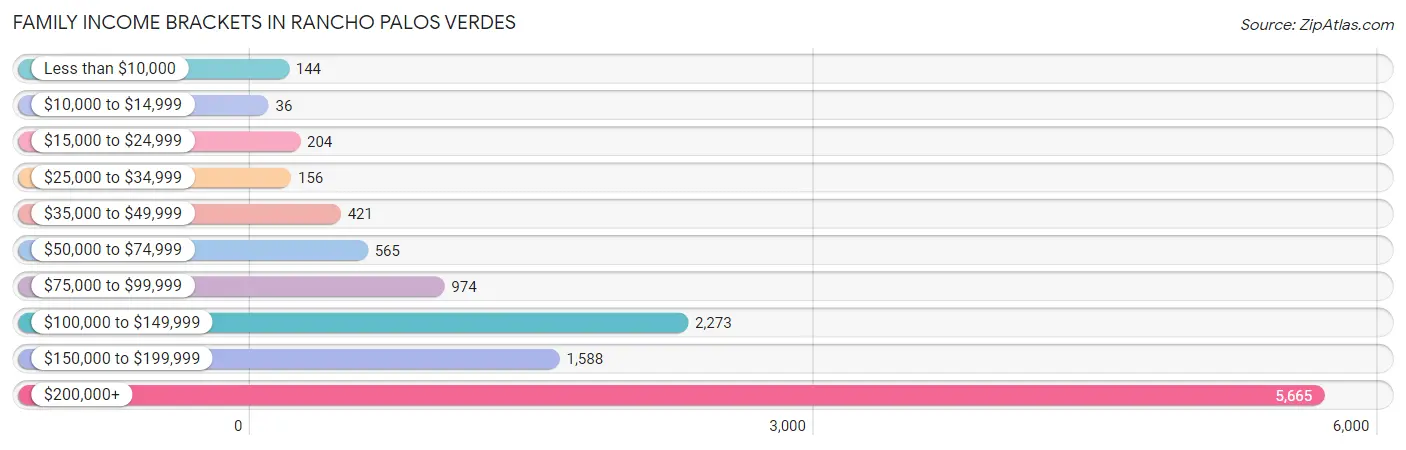
| Income Bracket | # Families | % Families |
| Less than $10,000 | 144 | 1.2% |
| $10,000 to $14,999 | 36 | 0.3% |
| $15,000 to $24,999 | 204 | 1.7% |
| $25,000 to $34,999 | 156 | 1.3% |
| $35,000 to $49,999 | 421 | 3.5% |
| $50,000 to $74,999 | 565 | 4.7% |
| $75,000 to $99,999 | 974 | 8.1% |
| $100,000 to $149,999 | 2,273 | 18.9% |
| $150,000 to $199,999 | 1,588 | 13.2% |
| $200,000+ | 5,665 | 47.1% |
Family Income by Famaliy Size in Rancho Palos Verdes
6-person families (178 | 1.5%) account for the highest median family income in Rancho Palos Verdes with $249,821 per family, while 2-person families (5,600 | 46.6%) have the highest median income of $80,092 per family member.
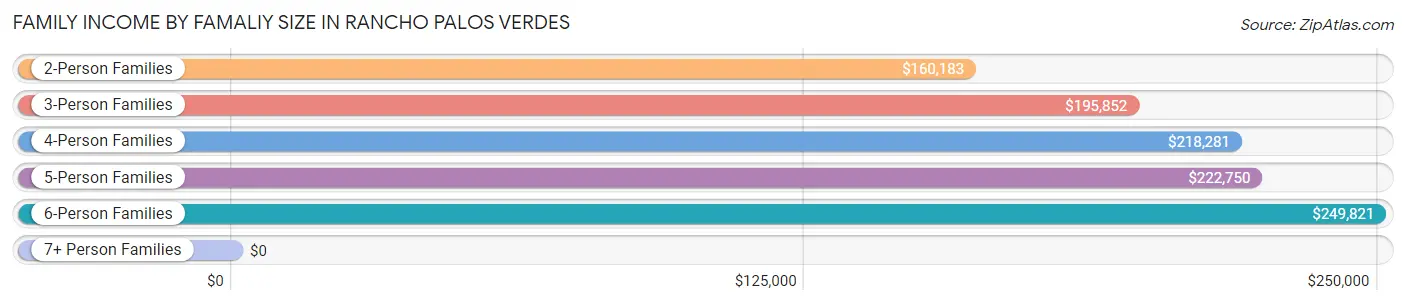
| Income Bracket | # Families | Median Income |
| 2-Person Families | 5,600 (46.6%) | $160,183 |
| 3-Person Families | 2,784 (23.2%) | $195,852 |
| 4-Person Families | 2,784 (23.2%) | $218,281 |
| 5-Person Families | 637 (5.3%) | $222,750 |
| 6-Person Families | 178 (1.5%) | $249,821 |
| 7+ Person Families | 44 (0.4%) | $0 |
| Total | 12,027 (100.0%) | $184,718 |
Family Income by Number of Earners in Rancho Palos Verdes
The median family income in Rancho Palos Verdes is $184,718, with families comprising 3+ earners (1,042) having the highest median family income of $249,500, while families with no earners (2,102) have the lowest median family income of $133,846, accounting for 8.7% and 17.5% of families, respectively.
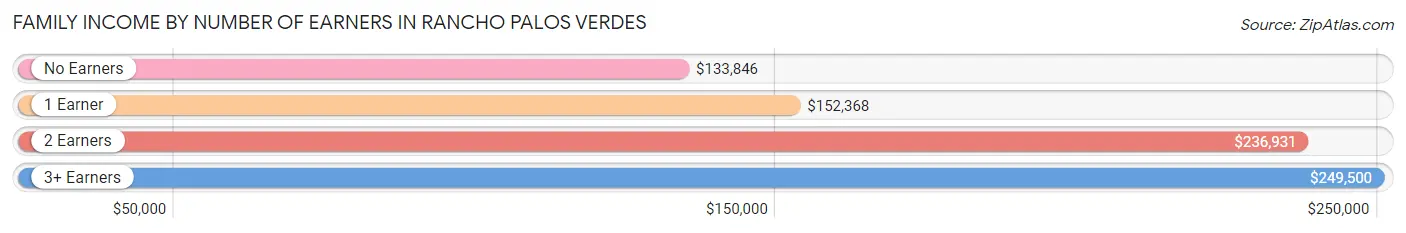
| Number of Earners | # Families | Median Income |
| No Earners | 2,102 (17.5%) | $133,846 |
| 1 Earner | 4,084 (34.0%) | $152,368 |
| 2 Earners | 4,799 (39.9%) | $236,931 |
| 3+ Earners | 1,042 (8.7%) | $249,500 |
| Total | 12,027 (100.0%) | $184,718 |
Household Income in Rancho Palos Verdes
Household Income Brackets in Rancho Palos Verdes
With 6,233 households falling in the category, the $200,000+ income range is the most frequent in Rancho Palos Verdes, accounting for 40.6% of all households. In contrast, only 77 households (0.5%) fall into the $10,000 to $14,999 income bracket, making it the least populous group.
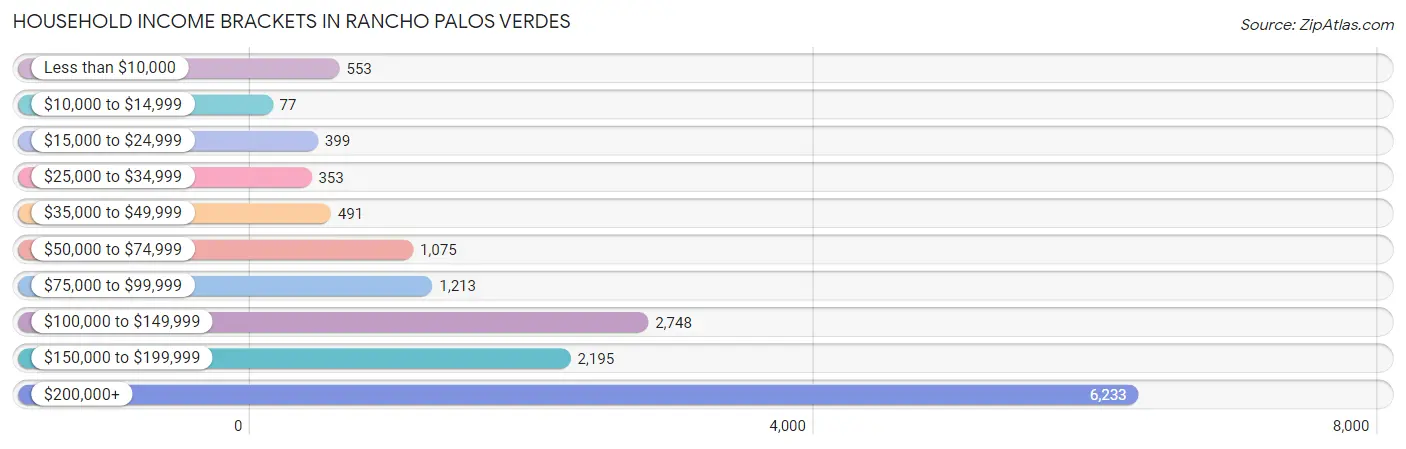
| Income Bracket | # Households | % Households |
| Less than $10,000 | 553 | 3.6% |
| $10,000 to $14,999 | 77 | 0.5% |
| $15,000 to $24,999 | 399 | 2.6% |
| $25,000 to $34,999 | 353 | 2.3% |
| $35,000 to $49,999 | 491 | 3.2% |
| $50,000 to $74,999 | 1,075 | 7.0% |
| $75,000 to $99,999 | 1,213 | 7.9% |
| $100,000 to $149,999 | 2,748 | 17.9% |
| $150,000 to $199,999 | 2,195 | 14.3% |
| $200,000+ | 6,233 | 40.6% |
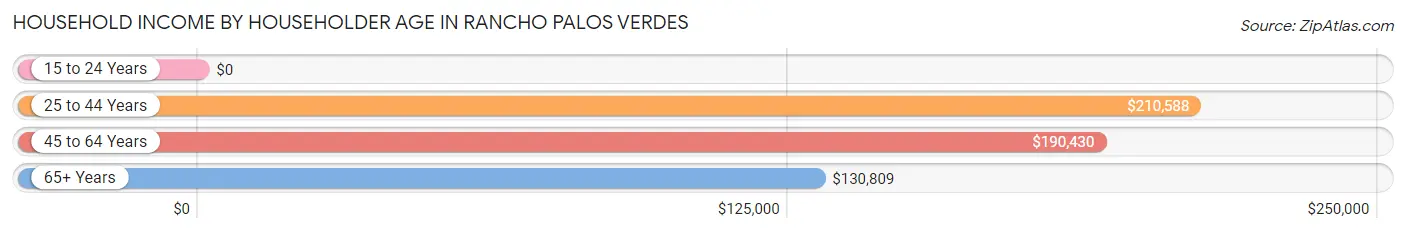
Household Income by Householder Age in Rancho Palos Verdes
The median household income in Rancho Palos Verdes is $166,747, with the highest median household income of $210,588 found in the 25 to 44 years age bracket for the primary householder. A total of 2,272 households (14.8%) fall into this category. Meanwhile, the 15 to 24 years age bracket for the primary householder has the lowest median household income of $0, with 106 households (0.7%) in this group.
| Income Bracket | # Households | Median Income |
| 15 to 24 Years | 106 (0.7%) | $0 |
| 25 to 44 Years | 2,272 (14.8%) | $210,588 |
| 45 to 64 Years | 6,485 (42.2%) | $190,430 |
| 65+ Years | 6,488 (42.3%) | $130,809 |
| Total | 15,351 (100.0%) | $166,747 |
Poverty in Rancho Palos Verdes
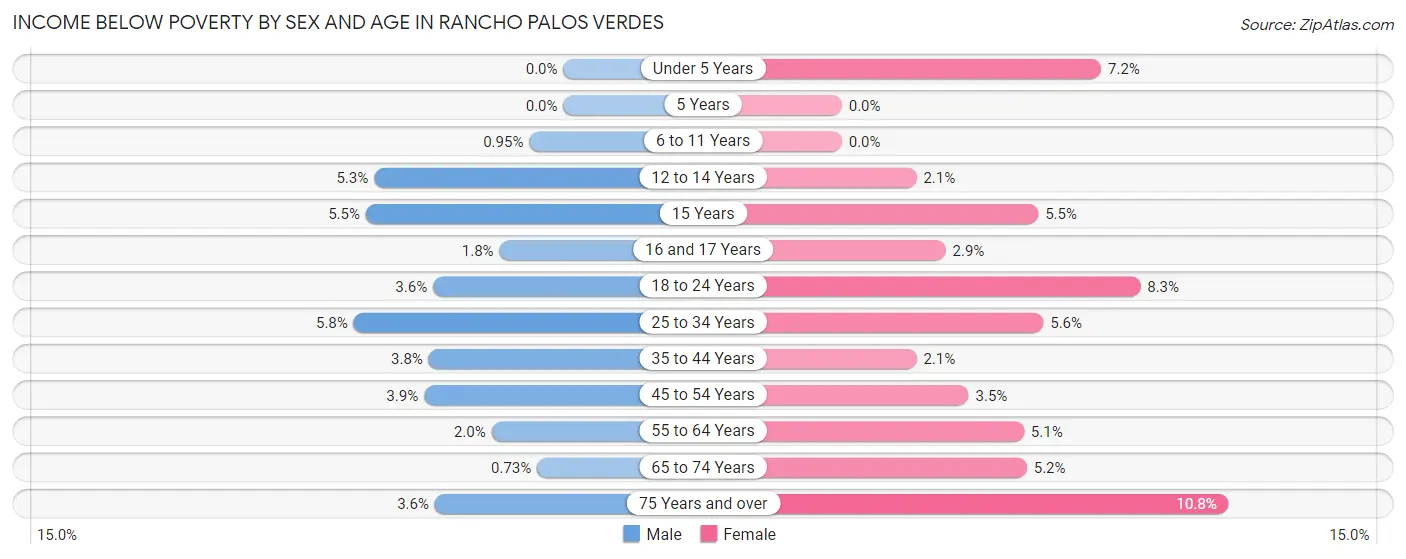
Income Below Poverty by Sex and Age in Rancho Palos Verdes
With 2.7% poverty level for males and 5.2% for females among the residents of Rancho Palos Verdes, 25 to 34 year old males and 75 year old and over females are the most vulnerable to poverty, with 73 males (5.8%) and 335 females (10.8%) in their respective age groups living below the poverty level.
| Age Bracket | Male | Female |
| Under 5 Years | 0 (0.0%) | 76 (7.2%) |
| 5 Years | 0 (0.0%) | 0 (0.0%) |
| 6 to 11 Years | 16 (0.9%) | 0 (0.0%) |
| 12 to 14 Years | 35 (5.3%) | 18 (2.1%) |
| 15 Years | 17 (5.5%) | 14 (5.5%) |
| 16 and 17 Years | 14 (1.8%) | 14 (2.9%) |
| 18 to 24 Years | 48 (3.6%) | 115 (8.3%) |
| 25 to 34 Years | 73 (5.8%) | 59 (5.6%) |
| 35 to 44 Years | 80 (3.7%) | 42 (2.1%) |
| 45 to 54 Years | 106 (3.9%) | 114 (3.5%) |
| 55 to 64 Years | 61 (2.0%) | 193 (5.1%) |
| 65 to 74 Years | 21 (0.7%) | 132 (5.1%) |
| 75 Years and over | 84 (3.6%) | 335 (10.8%) |
| Total | 555 (2.7%) | 1,112 (5.2%) |
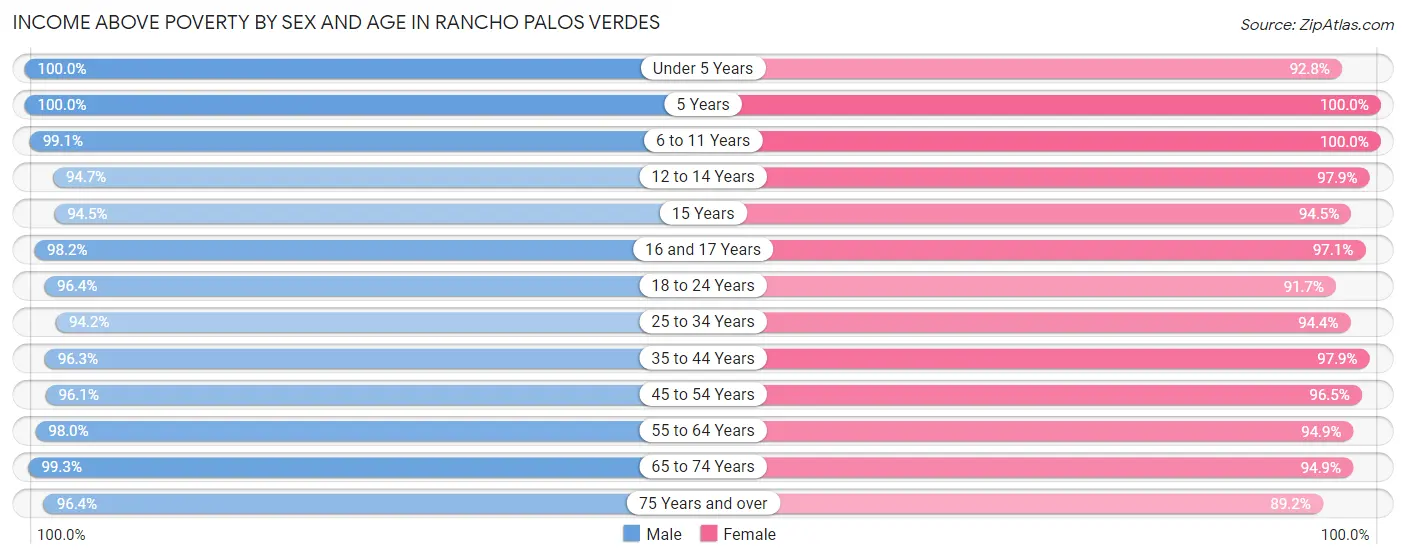
Income Above Poverty by Sex and Age in Rancho Palos Verdes
According to the poverty statistics in Rancho Palos Verdes, males aged under 5 years and females aged 5 years are the age groups that are most secure financially, with 100.0% of males and 100.0% of females in these age groups living above the poverty line.
| Age Bracket | Male | Female |
| Under 5 Years | 865 (100.0%) | 976 (92.8%) |
| 5 Years | 213 (100.0%) | 37 (100.0%) |
| 6 to 11 Years | 1,669 (99.1%) | 1,451 (100.0%) |
| 12 to 14 Years | 629 (94.7%) | 849 (97.9%) |
| 15 Years | 292 (94.5%) | 242 (94.5%) |
| 16 and 17 Years | 771 (98.2%) | 470 (97.1%) |
| 18 to 24 Years | 1,273 (96.4%) | 1,269 (91.7%) |
| 25 to 34 Years | 1,177 (94.2%) | 993 (94.4%) |
| 35 to 44 Years | 2,055 (96.3%) | 1,980 (97.9%) |
| 45 to 54 Years | 2,626 (96.1%) | 3,116 (96.5%) |
| 55 to 64 Years | 2,984 (98.0%) | 3,612 (94.9%) |
| 65 to 74 Years | 2,870 (99.3%) | 2,433 (94.9%) |
| 75 Years and over | 2,260 (96.4%) | 2,775 (89.2%) |
| Total | 19,684 (97.3%) | 20,203 (94.8%) |
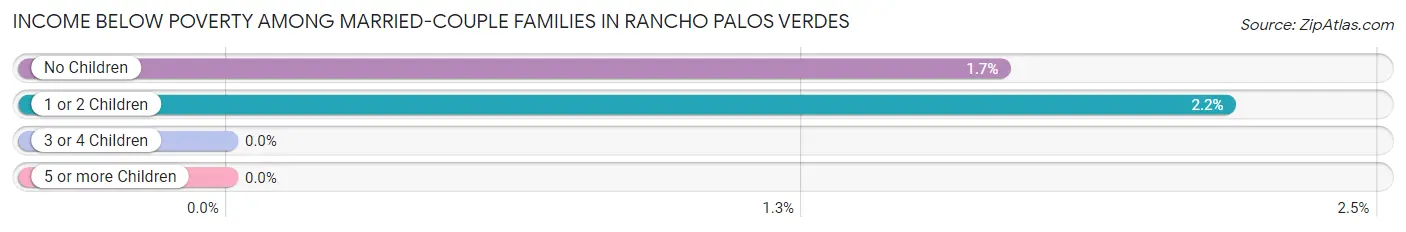
Income Below Poverty Among Married-Couple Families in Rancho Palos Verdes
The poverty statistics for married-couple families in Rancho Palos Verdes show that 1.8% or 185 of the total 10,284 families live below the poverty line. Families with 1 or 2 children have the highest poverty rate of 2.2%, comprising of 80 families. On the other hand, families with 3 or 4 children have the lowest poverty rate of 0.0%, which includes 0 families.
| Children | Above Poverty | Below Poverty |
| No Children | 6,133 (98.3%) | 105 (1.7%) |
| 1 or 2 Children | 3,600 (97.8%) | 80 (2.2%) |
| 3 or 4 Children | 366 (100.0%) | 0 (0.0%) |
| 5 or more Children | 0 (0.0%) | 0 (0.0%) |
| Total | 10,099 (98.2%) | 185 (1.8%) |
Income Below Poverty Among Single-Parent Households in Rancho Palos Verdes
According to the poverty data in Rancho Palos Verdes, 2.7% or 9 single-father households and 6.8% or 96 single-mother households are living below the poverty line. Among single-father households, those with 1 or 2 children have the highest poverty rate, with 9 households (8.6%) experiencing poverty. Likewise, among single-mother households, those with 1 or 2 children have the highest poverty rate, with 34 households (10.1%) falling below the poverty line.
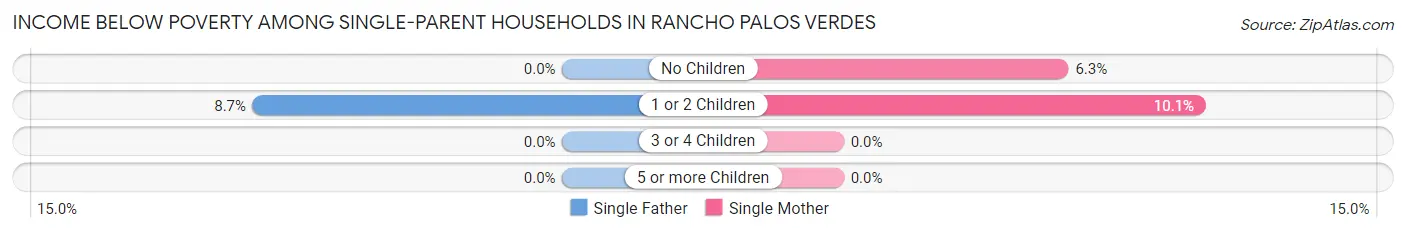
| Children | Single Father | Single Mother |
| No Children | 0 (0.0%) | 62 (6.3%) |
| 1 or 2 Children | 9 (8.6%) | 34 (10.1%) |
| 3 or 4 Children | 0 (0.0%) | 0 (0.0%) |
| 5 or more Children | 0 (0.0%) | 0 (0.0%) |
| Total | 9 (2.7%) | 96 (6.8%) |
Income Below Poverty Among Married-Couple vs Single-Parent Households in Rancho Palos Verdes
The poverty data for Rancho Palos Verdes shows that 185 of the married-couple family households (1.8%) and 105 of the single-parent households (6.0%) are living below the poverty level. Within the married-couple family households, those with 1 or 2 children have the highest poverty rate, with 80 households (2.2%) falling below the poverty line. Among the single-parent households, those with 1 or 2 children have the highest poverty rate, with 43 household (9.8%) living below poverty.
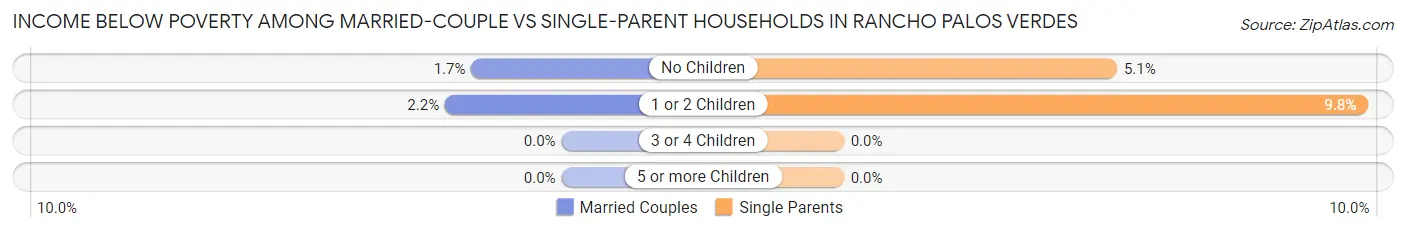
| Children | Married-Couple Families | Single-Parent Households |
| No Children | 105 (1.7%) | 62 (5.1%) |
| 1 or 2 Children | 80 (2.2%) | 43 (9.8%) |
| 3 or 4 Children | 0 (0.0%) | 0 (0.0%) |
| 5 or more Children | 0 (0.0%) | 0 (0.0%) |
| Total | 185 (1.8%) | 105 (6.0%) |
Race in Rancho Palos Verdes
The most populous races in Rancho Palos Verdes are White / Caucasian (20,972 | 50.2%), Asian (13,547 | 32.4%), and Hispanic or Latino (4,569 | 10.9%).
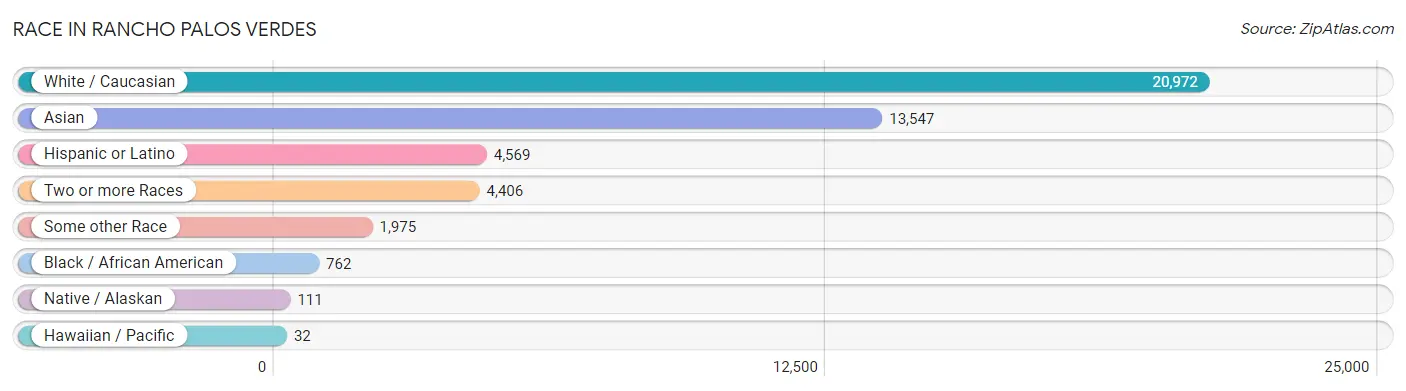
| Race | # Population | % Population |
| Asian | 13,547 | 32.4% |
| Black / African American | 762 | 1.8% |
| Hawaiian / Pacific | 32 | 0.1% |
| Hispanic or Latino | 4,569 | 10.9% |
| Native / Alaskan | 111 | 0.3% |
| White / Caucasian | 20,972 | 50.2% |
| Two or more Races | 4,406 | 10.5% |
| Some other Race | 1,975 | 4.7% |
| Total | 41,805 | 100.0% |
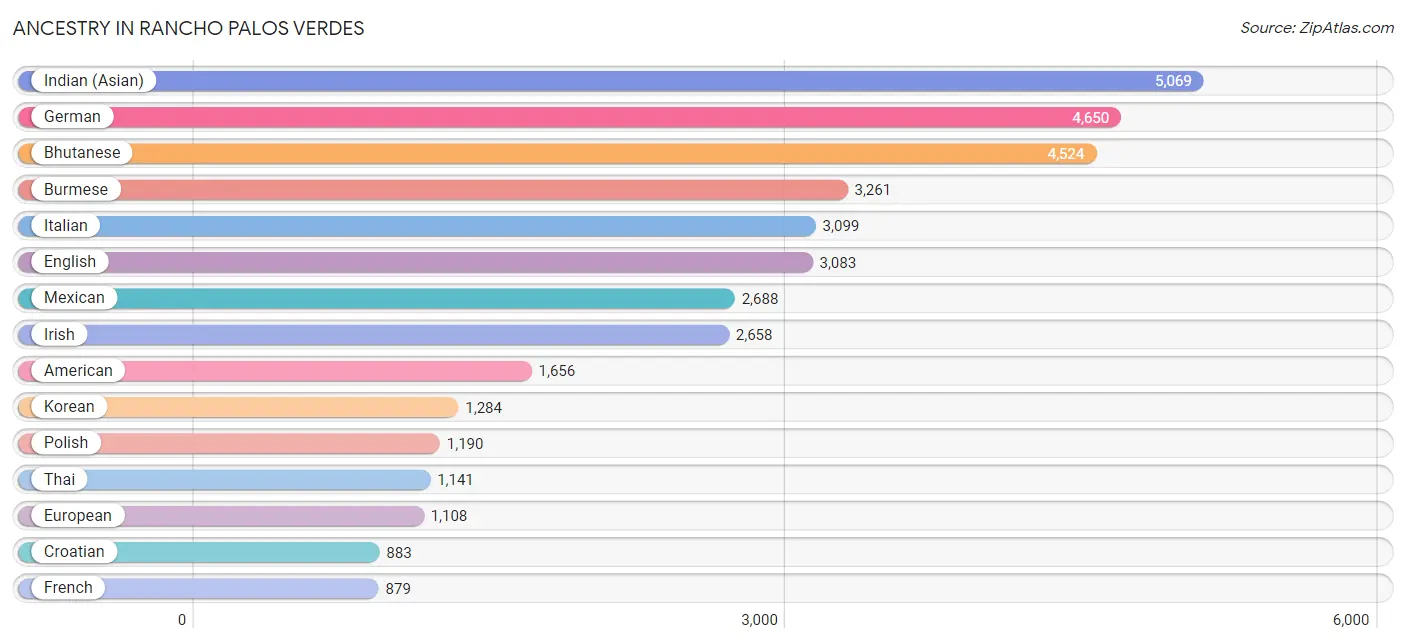
Ancestry in Rancho Palos Verdes
The most populous ancestries reported in Rancho Palos Verdes are Indian (Asian) (5,069 | 12.1%), German (4,650 | 11.1%), Bhutanese (4,524 | 10.8%), Burmese (3,261 | 7.8%), and Italian (3,099 | 7.4%), together accounting for 49.3% of all Rancho Palos Verdes residents.
| Ancestry | # Population | % Population |
| Albanian | 9 | 0.0% |
| American | 1,656 | 4.0% |
| Apache | 49 | 0.1% |
| Arab | 521 | 1.3% |
| Arapaho | 25 | 0.1% |
| Argentinean | 67 | 0.2% |
| Armenian | 244 | 0.6% |
| Assyrian / Chaldean / Syriac | 8 | 0.0% |
| Austrian | 229 | 0.5% |
| Belgian | 54 | 0.1% |
| Bhutanese | 4,524 | 10.8% |
| Blackfeet | 35 | 0.1% |
| Brazilian | 87 | 0.2% |
| British | 293 | 0.7% |
| Bulgarian | 120 | 0.3% |
| Burmese | 3,261 | 7.8% |
| Cajun | 8 | 0.0% |
| Cambodian | 12 | 0.0% |
| Canadian | 81 | 0.2% |
| Celtic | 14 | 0.0% |
| Central American | 321 | 0.8% |
| Cherokee | 123 | 0.3% |
| Chickasaw | 7 | 0.0% |
| Choctaw | 22 | 0.1% |
| Colombian | 240 | 0.6% |
| Costa Rican | 18 | 0.0% |
| Croatian | 883 | 2.1% |
| Cuban | 189 | 0.4% |
| Czech | 256 | 0.6% |
| Czechoslovakian | 82 | 0.2% |
| Danish | 209 | 0.5% |
| Dutch | 305 | 0.7% |
| Eastern European | 119 | 0.3% |
| Ecuadorian | 74 | 0.2% |
| Egyptian | 240 | 0.6% |
| English | 3,083 | 7.4% |
| Estonian | 42 | 0.1% |
| Ethiopian | 10 | 0.0% |
| European | 1,108 | 2.6% |
| Filipino | 833 | 2.0% |
| Finnish | 90 | 0.2% |
| French | 879 | 2.1% |
| French Canadian | 110 | 0.3% |
| German | 4,650 | 11.1% |
| Greek | 256 | 0.6% |
| Guamanian / Chamorro | 31 | 0.1% |
| Guatemalan | 52 | 0.1% |
| Honduran | 22 | 0.1% |
| Hopi | 15 | 0.0% |
| Hungarian | 281 | 0.7% |
| Indian (Asian) | 5,069 | 12.1% |
| Iranian | 705 | 1.7% |
| Iraqi | 16 | 0.0% |
| Irish | 2,658 | 6.4% |
| Iroquois | 7 | 0.0% |
| Israeli | 43 | 0.1% |
| Italian | 3,099 | 7.4% |
| Japanese | 104 | 0.3% |
| Jordanian | 29 | 0.1% |
| Korean | 1,284 | 3.1% |
| Latvian | 34 | 0.1% |
| Lebanese | 191 | 0.5% |
| Liberian | 266 | 0.6% |
| Lithuanian | 25 | 0.1% |
| Mexican | 2,688 | 6.4% |
| Mexican American Indian | 105 | 0.3% |
| Moroccan | 13 | 0.0% |
| Native Hawaiian | 63 | 0.2% |
| Navajo | 40 | 0.1% |
| Nicaraguan | 92 | 0.2% |
| Nigerian | 201 | 0.5% |
| Northern European | 65 | 0.2% |
| Norwegian | 420 | 1.0% |
| Pakistani | 171 | 0.4% |
| Peruvian | 201 | 0.5% |
| Polish | 1,190 | 2.9% |
| Portuguese | 205 | 0.5% |
| Puerto Rican | 364 | 0.9% |
| Russian | 505 | 1.2% |
| Salvadoran | 137 | 0.3% |
| Scandinavian | 68 | 0.2% |
| Scotch-Irish | 283 | 0.7% |
| Scottish | 313 | 0.7% |
| Serbian | 18 | 0.0% |
| Sioux | 14 | 0.0% |
| Slavic | 65 | 0.2% |
| Slovene | 31 | 0.1% |
| South American | 627 | 1.5% |
| Spaniard | 89 | 0.2% |
| Spanish | 242 | 0.6% |
| Sri Lankan | 477 | 1.1% |
| Subsaharan African | 294 | 0.7% |
| Swedish | 660 | 1.6% |
| Swiss | 558 | 1.3% |
| Syrian | 12 | 0.0% |
| Thai | 1,141 | 2.7% |
| Turkish | 47 | 0.1% |
| Ukrainian | 66 | 0.2% |
| Venezuelan | 45 | 0.1% |
| Welsh | 131 | 0.3% |
| West Indian | 7 | 0.0% |
| Yugoslavian | 10 | 0.0% | View All 102 Rows |
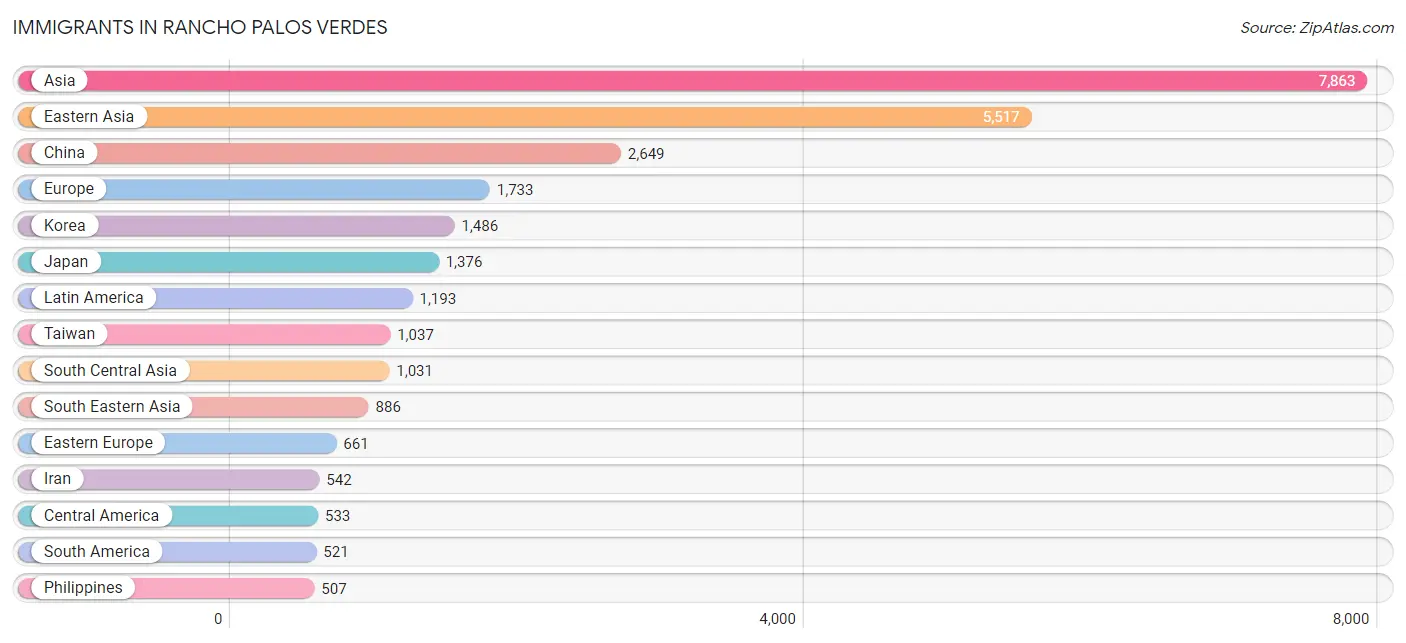
Immigrants in Rancho Palos Verdes
The most numerous immigrant groups reported in Rancho Palos Verdes came from Asia (7,863 | 18.8%), Eastern Asia (5,517 | 13.2%), China (2,649 | 6.3%), Europe (1,733 | 4.2%), and Korea (1,486 | 3.5%), together accounting for 46.0% of all Rancho Palos Verdes residents.
| Immigration Origin | # Population | % Population |
| Africa | 218 | 0.5% |
| Argentina | 109 | 0.3% |
| Armenia | 14 | 0.0% |
| Asia | 7,863 | 18.8% |
| Australia | 24 | 0.1% |
| Austria | 10 | 0.0% |
| Brazil | 177 | 0.4% |
| Bulgaria | 83 | 0.2% |
| Cambodia | 51 | 0.1% |
| Canada | 212 | 0.5% |
| Caribbean | 139 | 0.3% |
| Central America | 533 | 1.3% |
| China | 2,649 | 6.3% |
| Colombia | 65 | 0.2% |
| Costa Rica | 18 | 0.0% |
| Croatia | 186 | 0.4% |
| Cuba | 116 | 0.3% |
| Czechoslovakia | 105 | 0.3% |
| Eastern Africa | 10 | 0.0% |
| Eastern Asia | 5,517 | 13.2% |
| Eastern Europe | 661 | 1.6% |
| Ecuador | 33 | 0.1% |
| Egypt | 105 | 0.3% |
| El Salvador | 48 | 0.1% |
| England | 250 | 0.6% |
| Ethiopia | 10 | 0.0% |
| Europe | 1,733 | 4.2% |
| Fiji | 35 | 0.1% |
| France | 27 | 0.1% |
| Germany | 121 | 0.3% |
| Greece | 11 | 0.0% |
| Guatemala | 13 | 0.0% |
| Honduras | 22 | 0.1% |
| Hong Kong | 415 | 1.0% |
| Hungary | 57 | 0.1% |
| India | 404 | 1.0% |
| Indonesia | 11 | 0.0% |
| Iran | 542 | 1.3% |
| Ireland | 14 | 0.0% |
| Israel | 57 | 0.1% |
| Italy | 103 | 0.3% |
| Japan | 1,376 | 3.3% |
| Jordan | 31 | 0.1% |
| Korea | 1,486 | 3.5% |
| Latin America | 1,193 | 2.9% |
| Latvia | 28 | 0.1% |
| Lebanon | 232 | 0.5% |
| Liberia | 83 | 0.2% |
| Mexico | 418 | 1.0% |
| Micronesia | 1 | 0.0% |
| Morocco | 13 | 0.0% |
| Nepal | 11 | 0.0% |
| Nicaragua | 14 | 0.0% |
| Nigeria | 7 | 0.0% |
| Northern Africa | 118 | 0.3% |
| Northern Europe | 501 | 1.2% |
| Norway | 8 | 0.0% |
| Oceania | 60 | 0.1% |
| Pakistan | 16 | 0.0% |
| Peru | 107 | 0.3% |
| Philippines | 507 | 1.2% |
| Poland | 42 | 0.1% |
| Russia | 110 | 0.3% |
| Singapore | 113 | 0.3% |
| South America | 521 | 1.3% |
| South Central Asia | 1,031 | 2.5% |
| South Eastern Asia | 886 | 2.1% |
| Southern Europe | 134 | 0.3% |
| Spain | 20 | 0.1% |
| Sri Lanka | 58 | 0.1% |
| Sweden | 39 | 0.1% |
| Switzerland | 279 | 0.7% |
| Syria | 11 | 0.0% |
| Taiwan | 1,037 | 2.5% |
| Thailand | 62 | 0.2% |
| Turkey | 47 | 0.1% |
| Ukraine | 31 | 0.1% |
| Venezuela | 30 | 0.1% |
| Vietnam | 142 | 0.3% |
| Western Africa | 90 | 0.2% |
| Western Asia | 392 | 0.9% |
| Western Europe | 437 | 1.1% | View All 82 Rows |
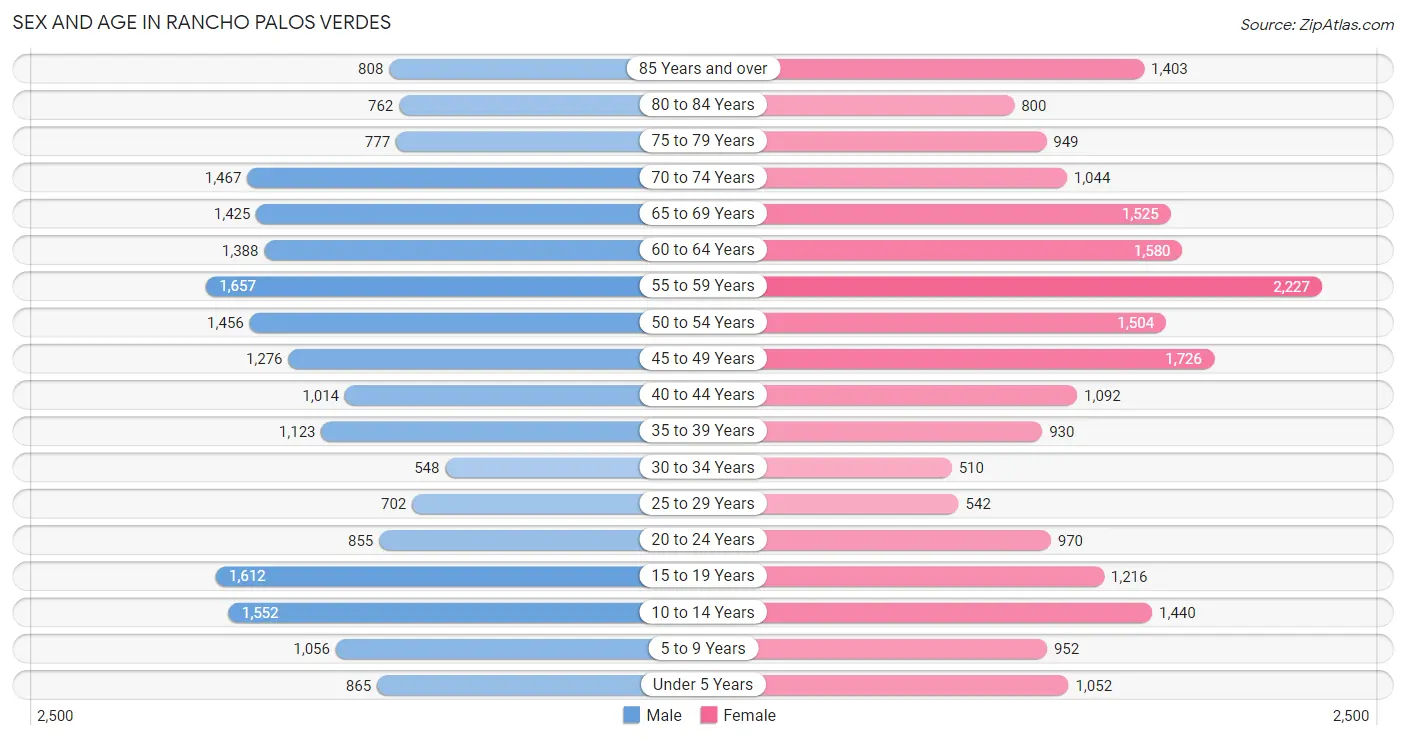
Sex and Age in Rancho Palos Verdes
Sex and Age in Rancho Palos Verdes
The most populous age groups in Rancho Palos Verdes are 55 to 59 Years (1,657 | 8.2%) for men and 55 to 59 Years (2,227 | 10.4%) for women.
| Age Bracket | Male | Female |
| Under 5 Years | 865 (4.3%) | 1,052 (4.9%) |
| 5 to 9 Years | 1,056 (5.2%) | 952 (4.4%) |
| 10 to 14 Years | 1,552 (7.6%) | 1,440 (6.7%) |
| 15 to 19 Years | 1,612 (7.9%) | 1,216 (5.7%) |
| 20 to 24 Years | 855 (4.2%) | 970 (4.5%) |
| 25 to 29 Years | 702 (3.5%) | 542 (2.5%) |
| 30 to 34 Years | 548 (2.7%) | 510 (2.4%) |
| 35 to 39 Years | 1,123 (5.5%) | 930 (4.3%) |
| 40 to 44 Years | 1,014 (5.0%) | 1,092 (5.1%) |
| 45 to 49 Years | 1,276 (6.3%) | 1,726 (8.0%) |
| 50 to 54 Years | 1,456 (7.2%) | 1,504 (7.0%) |
| 55 to 59 Years | 1,657 (8.2%) | 2,227 (10.4%) |
| 60 to 64 Years | 1,388 (6.8%) | 1,580 (7.4%) |
| 65 to 69 Years | 1,425 (7.0%) | 1,525 (7.1%) |
| 70 to 74 Years | 1,467 (7.2%) | 1,044 (4.9%) |
| 75 to 79 Years | 777 (3.8%) | 949 (4.4%) |
| 80 to 84 Years | 762 (3.7%) | 800 (3.7%) |
| 85 Years and over | 808 (4.0%) | 1,403 (6.5%) |
| Total | 20,343 (100.0%) | 21,462 (100.0%) |
Families and Households in Rancho Palos Verdes
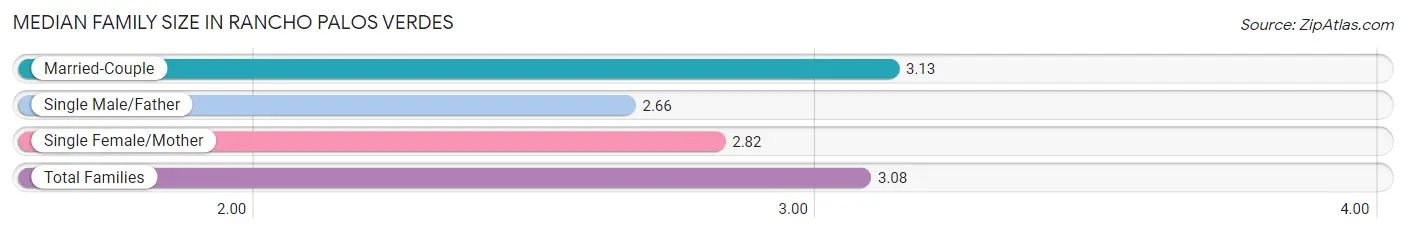
Median Family Size in Rancho Palos Verdes
The median family size in Rancho Palos Verdes is 3.08 persons per family, with married-couple families (10,284 | 85.5%) accounting for the largest median family size of 3.13 persons per family. On the other hand, single male/father families (335 | 2.8%) represent the smallest median family size with 2.66 persons per family.
| Family Type | # Families | Family Size |
| Married-Couple | 10,284 (85.5%) | 3.13 |
| Single Male/Father | 335 (2.8%) | 2.66 |
| Single Female/Mother | 1,408 (11.7%) | 2.82 |
| Total Families | 12,027 (100.0%) | 3.08 |
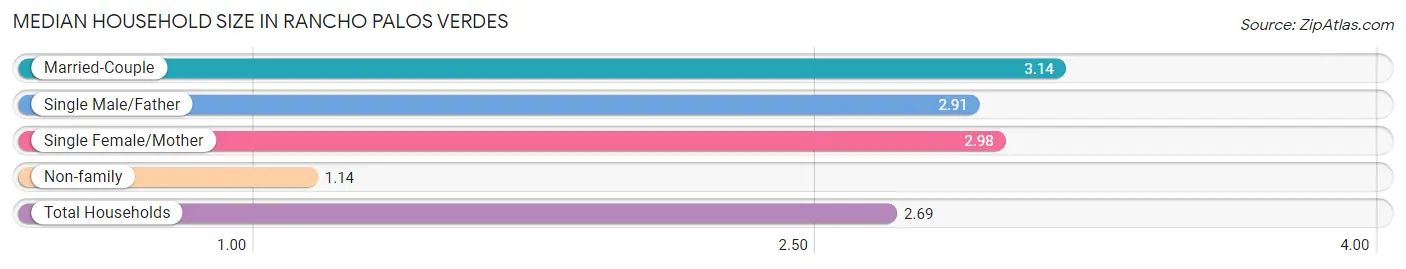
Median Household Size in Rancho Palos Verdes
The median household size in Rancho Palos Verdes is 2.69 persons per household, with married-couple households (10,284 | 67.0%) accounting for the largest median household size of 3.14 persons per household. non-family households (3,324 | 21.6%) represent the smallest median household size with 1.14 persons per household.
| Household Type | # Households | Household Size |
| Married-Couple | 10,284 (67.0%) | 3.14 |
| Single Male/Father | 335 (2.2%) | 2.91 |
| Single Female/Mother | 1,408 (9.2%) | 2.98 |
| Non-family | 3,324 (21.6%) | 1.14 |
| Total Households | 15,351 (100.0%) | 2.69 |
Household Size by Marriage Status in Rancho Palos Verdes
Out of a total of 15,351 households in Rancho Palos Verdes, 12,027 (78.3%) are family households, while 3,324 (21.6%) are nonfamily households. The most numerous type of family households are 2-person households, comprising 5,375, and the most common type of nonfamily households are 1-person households, comprising 2,907.
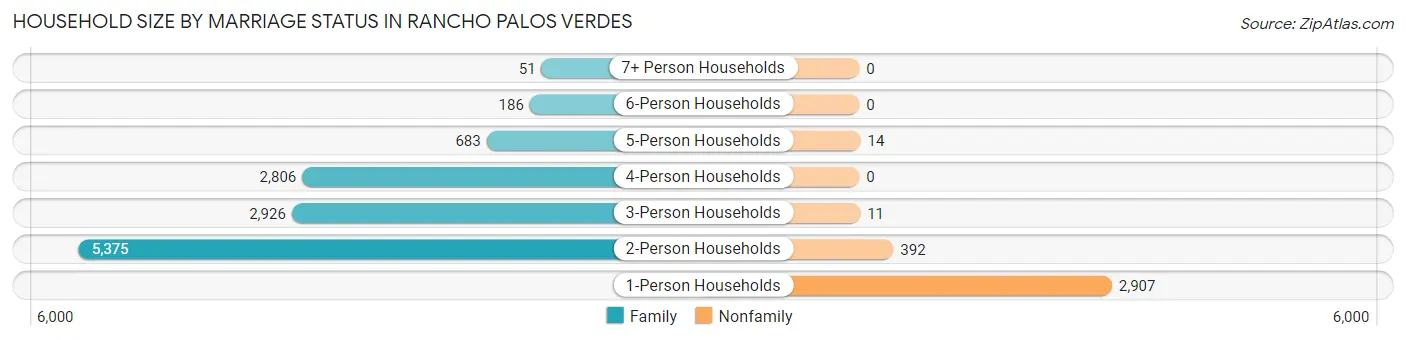
| Household Size | Family Households | Nonfamily Households |
| 1-Person Households | - | 2,907 (18.9%) |
| 2-Person Households | 5,375 (35.0%) | 392 (2.5%) |
| 3-Person Households | 2,926 (19.1%) | 11 (0.1%) |
| 4-Person Households | 2,806 (18.3%) | 0 (0.0%) |
| 5-Person Households | 683 (4.4%) | 14 (0.1%) |
| 6-Person Households | 186 (1.2%) | 0 (0.0%) |
| 7+ Person Households | 51 (0.3%) | 0 (0.0%) |
| Total | 12,027 (78.3%) | 3,324 (21.6%) |
Female Fertility in Rancho Palos Verdes
Fertility by Age in Rancho Palos Verdes
Average fertility rate in Rancho Palos Verdes is 34.0 births per 1,000 women. Women in the age bracket of 20 to 34 years have the highest fertility rate with 69.0 births per 1,000 women. Women in the age bracket of 20 to 34 years acount for 55.4% of all women with births.
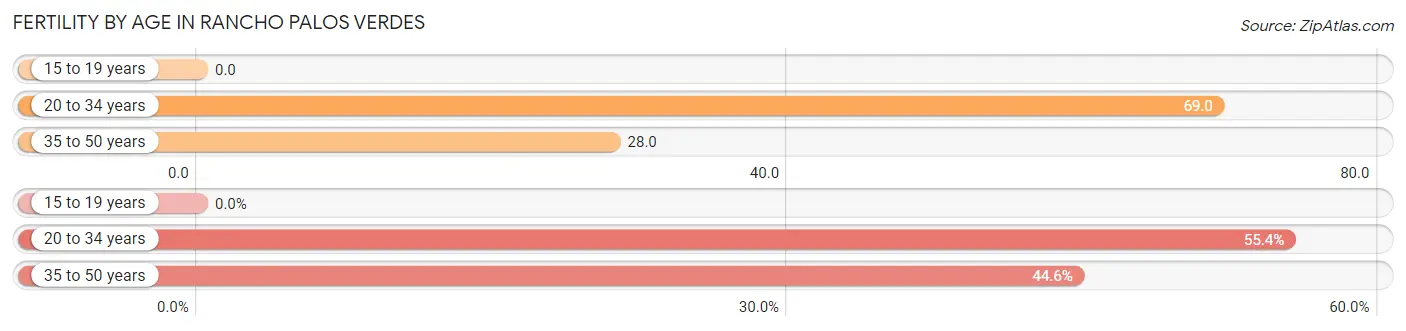
| Age Bracket | Women with Births | Births / 1,000 Women |
| 15 to 19 years | 0 (0.0%) | 0.0 |
| 20 to 34 years | 139 (55.4%) | 69.0 |
| 35 to 50 years | 112 (44.6%) | 28.0 |
| Total | 251 (100.0%) | 34.0 |
Fertility by Age by Marriage Status in Rancho Palos Verdes
70.5% of women with births (251) in Rancho Palos Verdes are married. The highest percentage of unmarried women with births falls into 20 to 34 years age bracket with 53.2% of them unmarried at the time of birth, while the lowest percentage of unmarried women with births belong to 35 to 50 years age bracket with 0.0% of them unmarried.
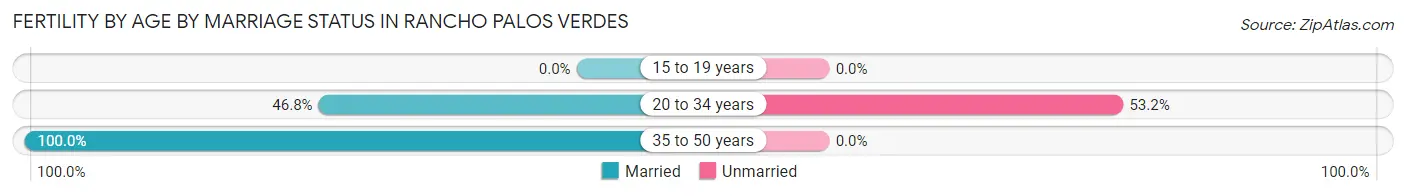
| Age Bracket | Married | Unmarried |
| 15 to 19 years | 0 (0.0%) | 0 (0.0%) |
| 20 to 34 years | 65 (46.8%) | 74 (53.2%) |
| 35 to 50 years | 112 (100.0%) | 0 (0.0%) |
| Total | 177 (70.5%) | 74 (29.5%) |
Fertility by Education in Rancho Palos Verdes
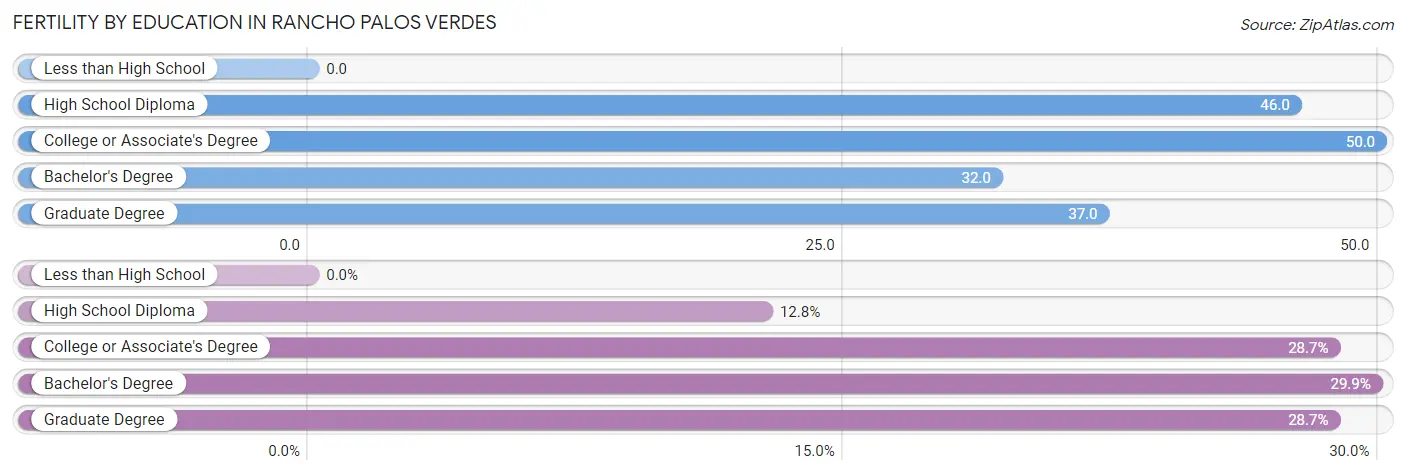
| Educational Attainment | Women with Births | Births / 1,000 Women |
| Less than High School | 0 (0.0%) | 0.0 |
| High School Diploma | 32 (12.8%) | 46.0 |
| College or Associate's Degree | 72 (28.7%) | 50.0 |
| Bachelor's Degree | 75 (29.9%) | 32.0 |
| Graduate Degree | 72 (28.7%) | 37.0 |
| Total | 251 (100.0%) | 34.0 |
Fertility by Education by Marriage Status in Rancho Palos Verdes
29.5% of women with births in Rancho Palos Verdes are unmarried. Women with the educational attainment of high school diploma are most likely to be married with 100.0% of them married at childbirth, while women with the educational attainment of college or associate's degree are least likely to be married with 93.1% of them unmarried at childbirth.
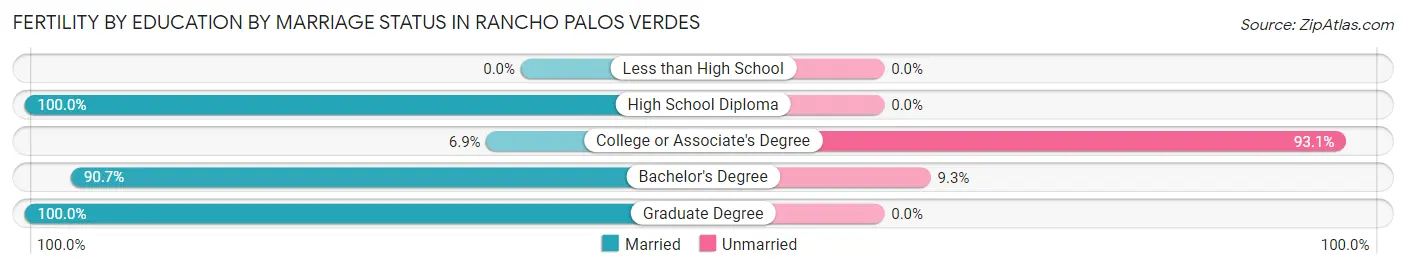
| Educational Attainment | Married | Unmarried |
| Less than High School | 0 (0.0%) | 0 (0.0%) |
| High School Diploma | 32 (100.0%) | 0 (0.0%) |
| College or Associate's Degree | 5 (6.9%) | 67 (93.1%) |
| Bachelor's Degree | 68 (90.7%) | 7 (9.3%) |
| Graduate Degree | 72 (100.0%) | 0 (0.0%) |
| Total | 177 (70.5%) | 74 (29.5%) |
Employment Characteristics in Rancho Palos Verdes
Employment by Class of Employer in Rancho Palos Verdes
Among the 17,770 employed individuals in Rancho Palos Verdes, private company employees (10,253 | 57.7%), self-employed (incorporated) (1,815 | 10.2%), and self-employed (not incorporated) (1,781 | 10.0%) make up the most common classes of employment.
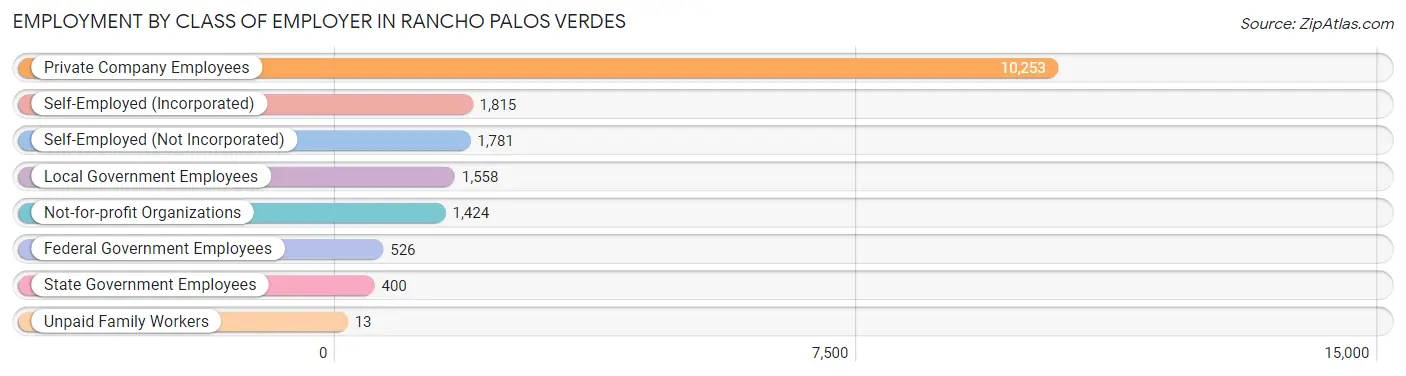
| Employer Class | # Employees | % Employees |
| Private Company Employees | 10,253 | 57.7% |
| Self-Employed (Incorporated) | 1,815 | 10.2% |
| Self-Employed (Not Incorporated) | 1,781 | 10.0% |
| Not-for-profit Organizations | 1,424 | 8.0% |
| Local Government Employees | 1,558 | 8.8% |
| State Government Employees | 400 | 2.2% |
| Federal Government Employees | 526 | 3.0% |
| Unpaid Family Workers | 13 | 0.1% |
| Total | 17,770 | 100.0% |
Employment Status by Age in Rancho Palos Verdes
According to the labor force statistics for Rancho Palos Verdes, out of the total population over 16 years of age (34,323), 56.0% or 19,221 individuals are in the labor force, with 5.1% or 980 of them unemployed. The age group with the highest labor force participation rate is 55 to 59 years, with 82.1% or 3,189 individuals in the labor force. Within the labor force, the 16 to 19 years age range has the highest percentage of unemployed individuals, with 16.8% or 77 of them being unemployed.
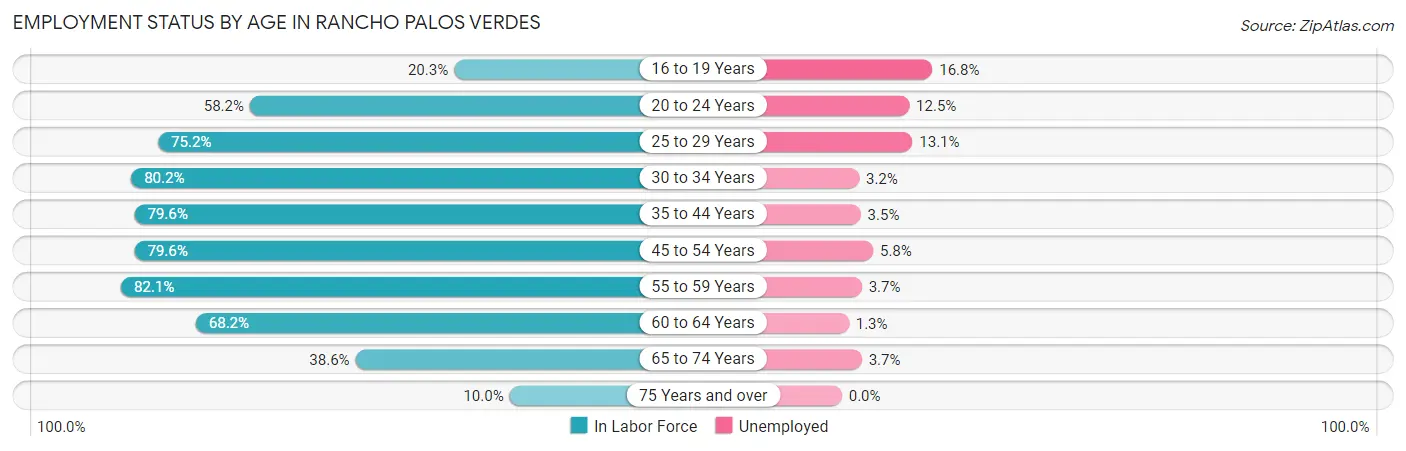
| Age Bracket | In Labor Force | Unemployed |
| 16 to 19 Years | 459 (20.3%) | 77 (16.8%) |
| 20 to 24 Years | 1,062 (58.2%) | 133 (12.5%) |
| 25 to 29 Years | 935 (75.2%) | 122 (13.1%) |
| 30 to 34 Years | 849 (80.2%) | 27 (3.2%) |
| 35 to 44 Years | 3,311 (79.6%) | 116 (3.5%) |
| 45 to 54 Years | 4,746 (79.6%) | 275 (5.8%) |
| 55 to 59 Years | 3,189 (82.1%) | 118 (3.7%) |
| 60 to 64 Years | 2,024 (68.2%) | 26 (1.3%) |
| 65 to 74 Years | 2,108 (38.6%) | 78 (3.7%) |
| 75 Years and over | 550 (10.0%) | 0 (0.0%) |
| Total | 19,221 (56.0%) | 980 (5.1%) |
Employment Status by Educational Attainment in Rancho Palos Verdes
According to labor force statistics for Rancho Palos Verdes, 78.1% of individuals (15,054) out of the total population between 25 and 64 years of age (19,275) are in the labor force, with 4.6% or 692 of them being unemployed. The group with the highest labor force participation rate are those with the educational attainment of bachelor's degree or higher, with 81.0% or 11,043 individuals in the labor force. Within the labor force, individuals with less than high school education have the highest percentage of unemployment, with 5.8% or 10 of them being unemployed.
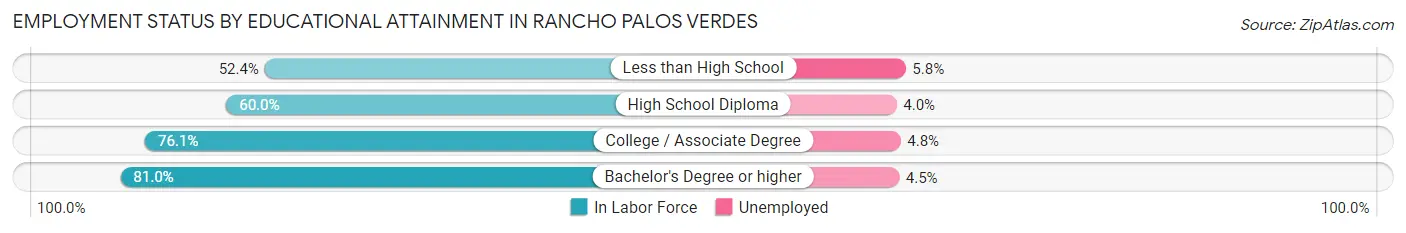
| Educational Attainment | In Labor Force | Unemployed |
| Less than High School | 172 (52.4%) | 19 (5.8%) |
| High School Diploma | 745 (60.0%) | 50 (4.0%) |
| College / Associate Degree | 3,099 (76.1%) | 195 (4.8%) |
| Bachelor's Degree or higher | 11,043 (81.0%) | 613 (4.5%) |
| Total | 15,054 (78.1%) | 887 (4.6%) |
Employment Occupations by Sex in Rancho Palos Verdes
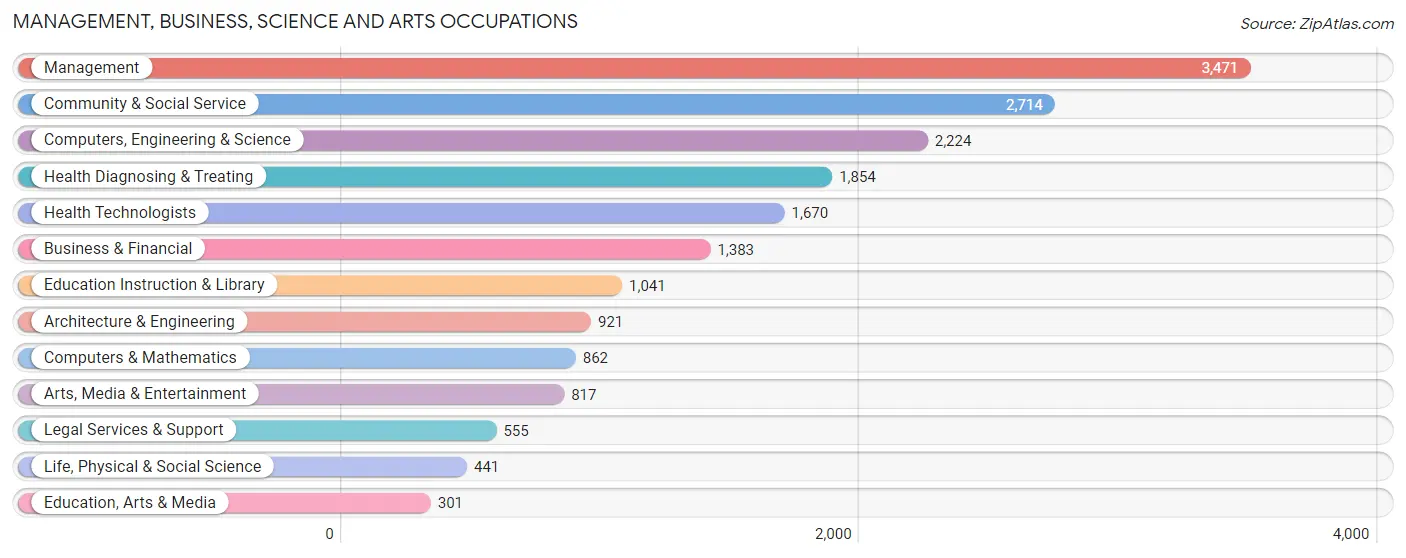
Management, Business, Science and Arts Occupations
The most common Management, Business, Science and Arts occupations in Rancho Palos Verdes are Management (3,471 | 19.0%), Community & Social Service (2,714 | 14.9%), Computers, Engineering & Science (2,224 | 12.2%), Health Diagnosing & Treating (1,854 | 10.2%), and Health Technologists (1,670 | 9.2%).
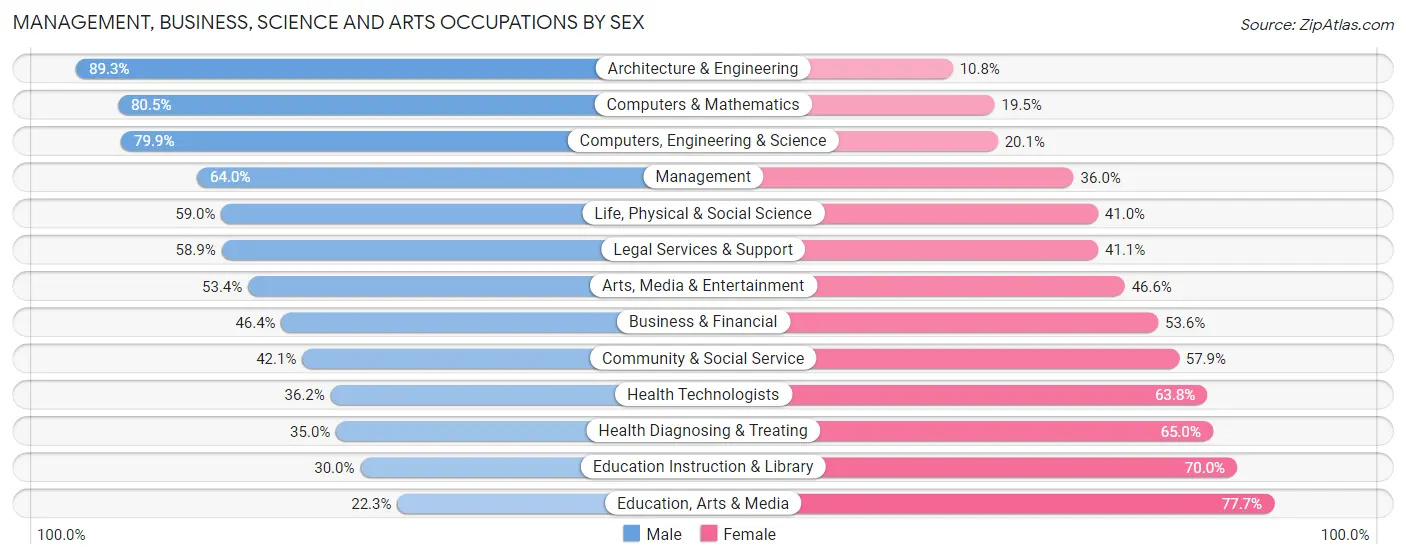
Management, Business, Science and Arts Occupations by Sex
Within the Management, Business, Science and Arts occupations in Rancho Palos Verdes, the most male-oriented occupations are Architecture & Engineering (89.2%), Computers & Mathematics (80.5%), and Computers, Engineering & Science (79.9%), while the most female-oriented occupations are Education, Arts & Media (77.7%), Education Instruction & Library (70.0%), and Health Diagnosing & Treating (65.0%).
| Occupation | Male | Female |
| Management | 2,222 (64.0%) | 1,249 (36.0%) |
| Business & Financial | 642 (46.4%) | 741 (53.6%) |
| Computers, Engineering & Science | 1,776 (79.9%) | 448 (20.1%) |
| Computers & Mathematics | 694 (80.5%) | 168 (19.5%) |
| Architecture & Engineering | 822 (89.2%) | 99 (10.7%) |
| Life, Physical & Social Science | 260 (59.0%) | 181 (41.0%) |
| Community & Social Service | 1,142 (42.1%) | 1,572 (57.9%) |
| Education, Arts & Media | 67 (22.3%) | 234 (77.7%) |
| Legal Services & Support | 327 (58.9%) | 228 (41.1%) |
| Education Instruction & Library | 312 (30.0%) | 729 (70.0%) |
| Arts, Media & Entertainment | 436 (53.4%) | 381 (46.6%) |
| Health Diagnosing & Treating | 649 (35.0%) | 1,205 (65.0%) |
| Health Technologists | 604 (36.2%) | 1,066 (63.8%) |
| Total (Category) | 6,431 (55.2%) | 5,215 (44.8%) |
| Total (Overall) | 9,957 (54.6%) | 8,271 (45.4%) |
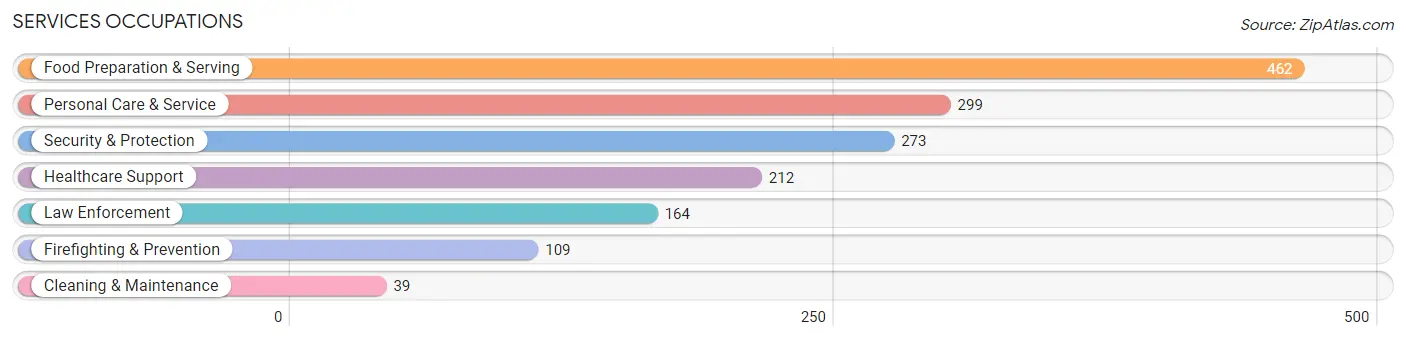
Services Occupations
The most common Services occupations in Rancho Palos Verdes are Food Preparation & Serving (462 | 2.5%), Personal Care & Service (299 | 1.6%), Security & Protection (273 | 1.5%), Healthcare Support (212 | 1.2%), and Law Enforcement (164 | 0.9%).
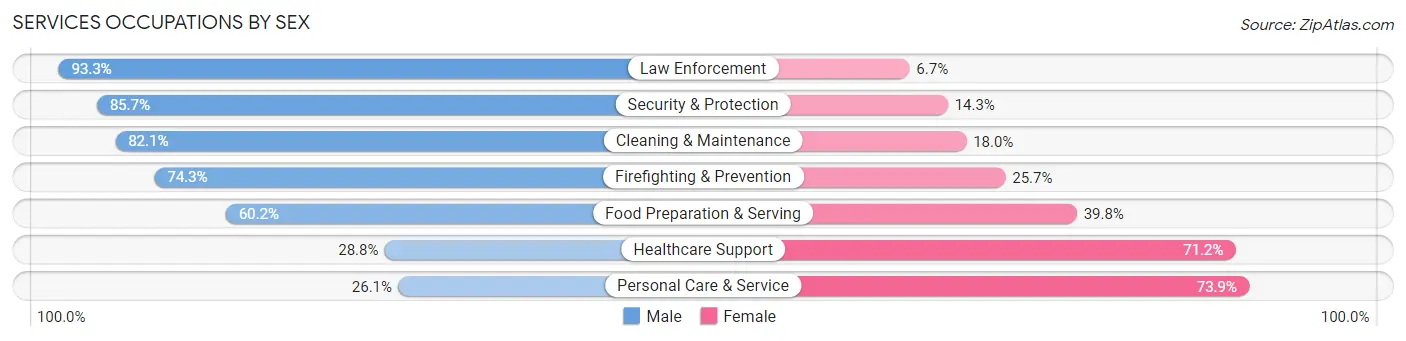
Services Occupations by Sex
Within the Services occupations in Rancho Palos Verdes, the most male-oriented occupations are Law Enforcement (93.3%), Security & Protection (85.7%), and Cleaning & Maintenance (82.1%), while the most female-oriented occupations are Personal Care & Service (73.9%), Healthcare Support (71.2%), and Food Preparation & Serving (39.8%).
| Occupation | Male | Female |
| Healthcare Support | 61 (28.8%) | 151 (71.2%) |
| Security & Protection | 234 (85.7%) | 39 (14.3%) |
| Firefighting & Prevention | 81 (74.3%) | 28 (25.7%) |
| Law Enforcement | 153 (93.3%) | 11 (6.7%) |
| Food Preparation & Serving | 278 (60.2%) | 184 (39.8%) |
| Cleaning & Maintenance | 32 (82.1%) | 7 (17.9%) |
| Personal Care & Service | 78 (26.1%) | 221 (73.9%) |
| Total (Category) | 683 (53.1%) | 602 (46.9%) |
| Total (Overall) | 9,957 (54.6%) | 8,271 (45.4%) |
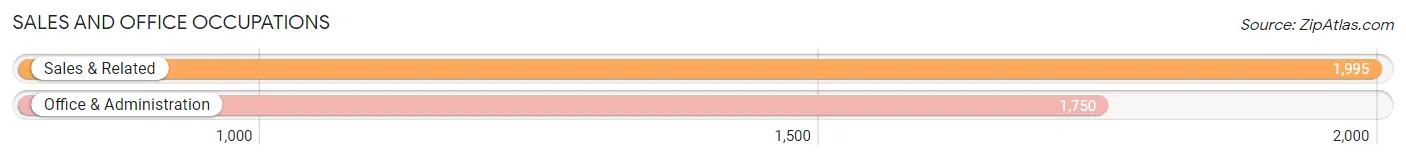
Sales and Office Occupations
The most common Sales and Office occupations in Rancho Palos Verdes are Sales & Related (1,995 | 10.9%), and Office & Administration (1,750 | 9.6%).
Sales and Office Occupations by Sex
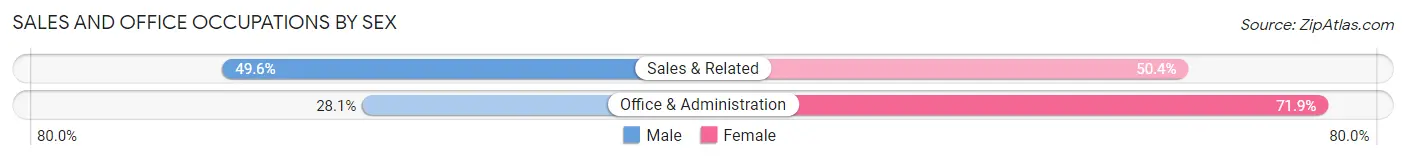
| Occupation | Male | Female |
| Sales & Related | 989 (49.6%) | 1,006 (50.4%) |
| Office & Administration | 491 (28.1%) | 1,259 (71.9%) |
| Total (Category) | 1,480 (39.5%) | 2,265 (60.5%) |
| Total (Overall) | 9,957 (54.6%) | 8,271 (45.4%) |
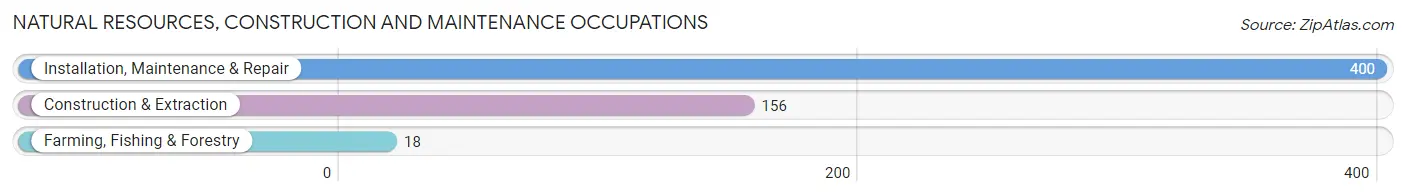
Natural Resources, Construction and Maintenance Occupations
The most common Natural Resources, Construction and Maintenance occupations in Rancho Palos Verdes are Installation, Maintenance & Repair (400 | 2.2%), Construction & Extraction (156 | 0.9%), and Farming, Fishing & Forestry (18 | 0.1%).
Natural Resources, Construction and Maintenance Occupations by Sex
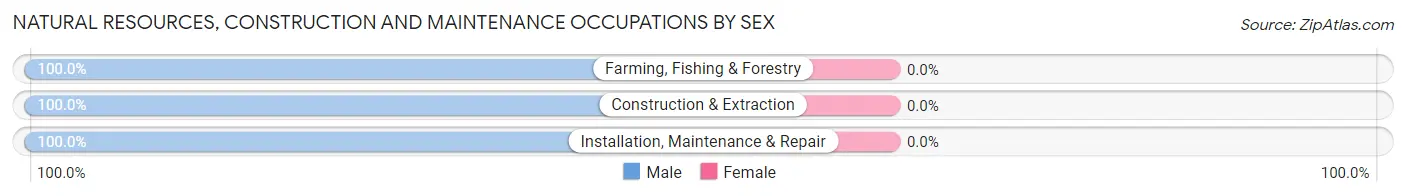
| Occupation | Male | Female |
| Farming, Fishing & Forestry | 18 (100.0%) | 0 (0.0%) |
| Construction & Extraction | 156 (100.0%) | 0 (0.0%) |
| Installation, Maintenance & Repair | 400 (100.0%) | 0 (0.0%) |
| Total (Category) | 574 (100.0%) | 0 (0.0%) |
| Total (Overall) | 9,957 (54.6%) | 8,271 (45.4%) |
Production, Transportation and Moving Occupations
The most common Production, Transportation and Moving occupations in Rancho Palos Verdes are Material Moving (420 | 2.3%), Transportation (304 | 1.7%), and Production (254 | 1.4%).
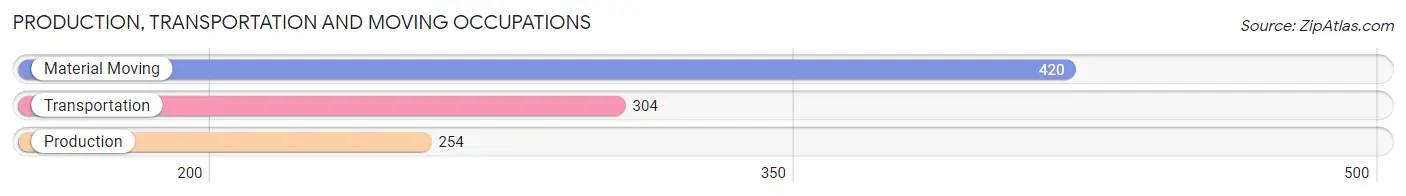
Production, Transportation and Moving Occupations by Sex
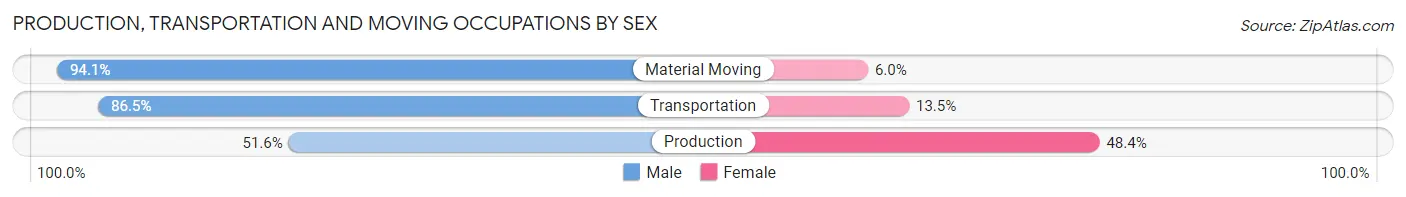
| Occupation | Male | Female |
| Production | 131 (51.6%) | 123 (48.4%) |
| Transportation | 263 (86.5%) | 41 (13.5%) |
| Material Moving | 395 (94.1%) | 25 (5.9%) |
| Total (Category) | 789 (80.7%) | 189 (19.3%) |
| Total (Overall) | 9,957 (54.6%) | 8,271 (45.4%) |
Employment Industries by Sex in Rancho Palos Verdes
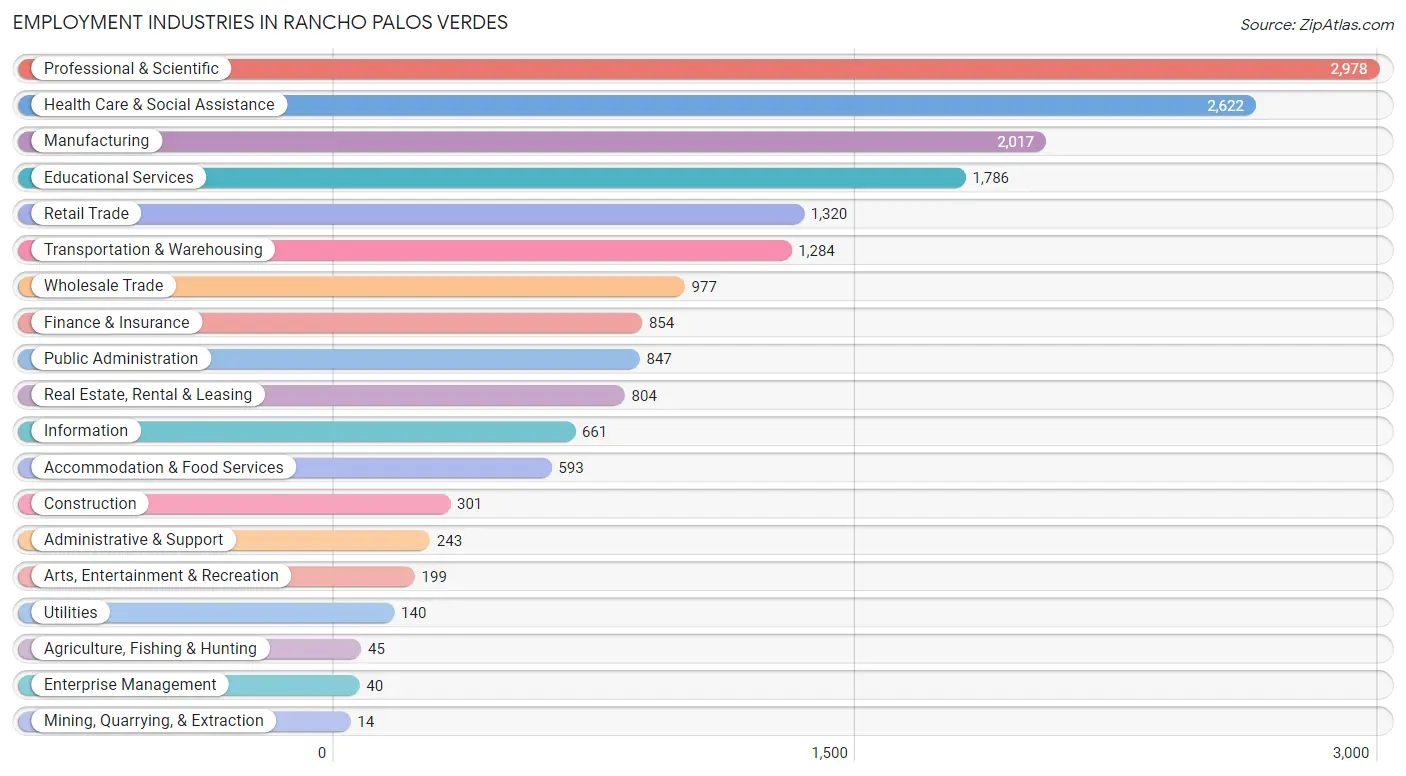
Employment Industries in Rancho Palos Verdes
The major employment industries in Rancho Palos Verdes include Professional & Scientific (2,978 | 16.3%), Health Care & Social Assistance (2,622 | 14.4%), Manufacturing (2,017 | 11.1%), Educational Services (1,786 | 9.8%), and Retail Trade (1,320 | 7.2%).
Employment Industries by Sex in Rancho Palos Verdes
The Rancho Palos Verdes industries that see more men than women are Agriculture, Fishing & Hunting (100.0%), Mining, Quarrying, & Extraction (100.0%), and Transportation & Warehousing (74.9%), whereas the industries that tend to have a higher number of women are Administrative & Support (75.7%), Enterprise Management (72.5%), and Arts, Entertainment & Recreation (70.9%).
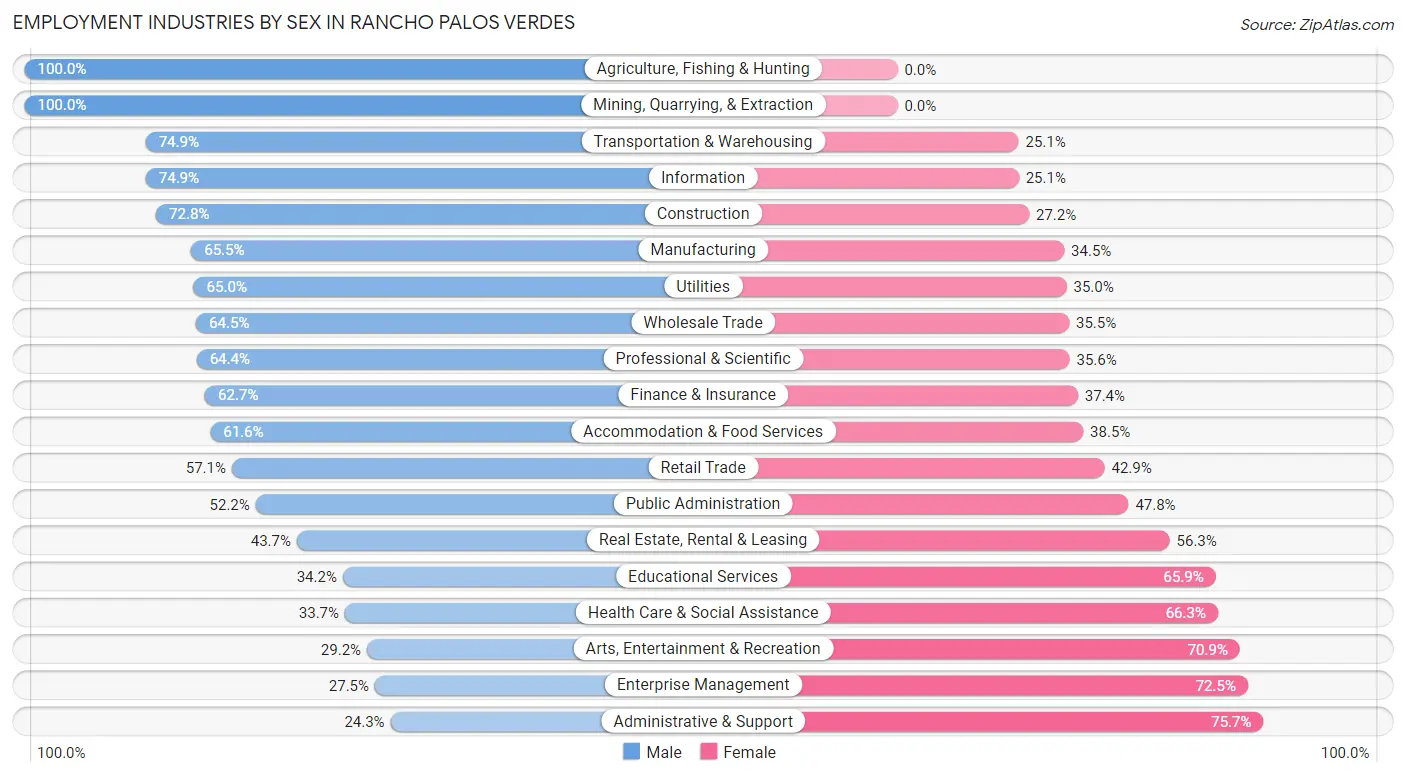
| Industry | Male | Female |
| Agriculture, Fishing & Hunting | 45 (100.0%) | 0 (0.0%) |
| Mining, Quarrying, & Extraction | 14 (100.0%) | 0 (0.0%) |
| Construction | 219 (72.8%) | 82 (27.2%) |
| Manufacturing | 1,321 (65.5%) | 696 (34.5%) |
| Wholesale Trade | 630 (64.5%) | 347 (35.5%) |
| Retail Trade | 754 (57.1%) | 566 (42.9%) |
| Transportation & Warehousing | 962 (74.9%) | 322 (25.1%) |
| Utilities | 91 (65.0%) | 49 (35.0%) |
| Information | 495 (74.9%) | 166 (25.1%) |
| Finance & Insurance | 535 (62.6%) | 319 (37.3%) |
| Real Estate, Rental & Leasing | 351 (43.7%) | 453 (56.3%) |
| Professional & Scientific | 1,917 (64.4%) | 1,061 (35.6%) |
| Enterprise Management | 11 (27.5%) | 29 (72.5%) |
| Administrative & Support | 59 (24.3%) | 184 (75.7%) |
| Educational Services | 610 (34.2%) | 1,176 (65.8%) |
| Health Care & Social Assistance | 884 (33.7%) | 1,738 (66.3%) |
| Arts, Entertainment & Recreation | 58 (29.1%) | 141 (70.9%) |
| Accommodation & Food Services | 365 (61.6%) | 228 (38.5%) |
| Public Administration | 442 (52.2%) | 405 (47.8%) |
| Total | 9,957 (54.6%) | 8,271 (45.4%) |
Education in Rancho Palos Verdes
School Enrollment in Rancho Palos Verdes
The most common levels of schooling among the 10,195 students in Rancho Palos Verdes are high school (2,428 | 23.8%), middle school (2,204 | 21.6%), and college / undergraduate (2,097 | 20.6%).
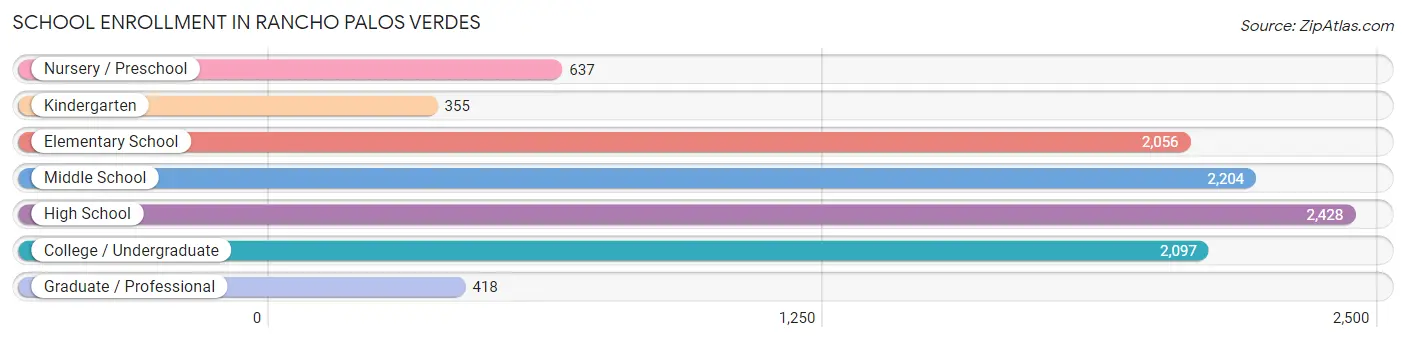
| School Level | # Students | % Students |
| Nursery / Preschool | 637 | 6.2% |
| Kindergarten | 355 | 3.5% |
| Elementary School | 2,056 | 20.2% |
| Middle School | 2,204 | 21.6% |
| High School | 2,428 | 23.8% |
| College / Undergraduate | 2,097 | 20.6% |
| Graduate / Professional | 418 | 4.1% |
| Total | 10,195 | 100.0% |
School Enrollment by Age by Funding Source in Rancho Palos Verdes
Out of a total of 10,195 students who are enrolled in schools in Rancho Palos Verdes, 2,324 (22.8%) attend a private institution, while the remaining 7,871 (77.2%) are enrolled in public schools. The age group of 3 to 4 year olds has the highest likelihood of being enrolled in private schools, with 383 (69.9% in the age bracket) enrolled. Conversely, the age group of 15 to 17 year olds has the lowest likelihood of being enrolled in a private school, with 1,711 (93.8% in the age bracket) attending a public institution.
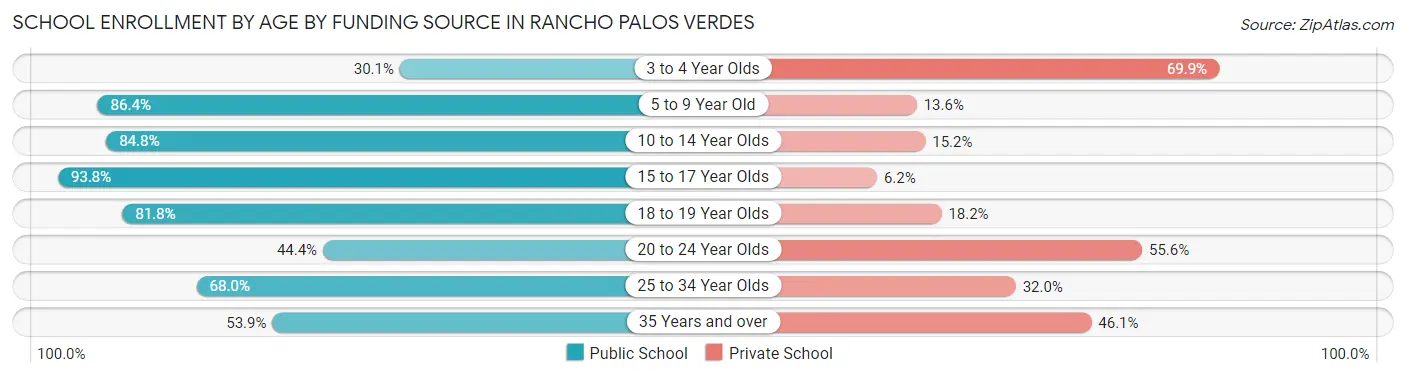
| Age Bracket | Public School | Private School |
| 3 to 4 Year Olds | 165 (30.1%) | 383 (69.9%) |
| 5 to 9 Year Old | 1,669 (86.4%) | 263 (13.6%) |
| 10 to 14 Year Olds | 2,526 (84.8%) | 453 (15.2%) |
| 15 to 17 Year Olds | 1,711 (93.8%) | 113 (6.2%) |
| 18 to 19 Year Olds | 804 (81.8%) | 179 (18.2%) |
| 20 to 24 Year Olds | 439 (44.4%) | 549 (55.6%) |
| 25 to 34 Year Olds | 227 (68.0%) | 107 (32.0%) |
| 35 Years and over | 327 (53.9%) | 280 (46.1%) |
| Total | 7,871 (77.2%) | 2,324 (22.8%) |
Educational Attainment by Field of Study in Rancho Palos Verdes
Business (4,057 | 18.3%), engineering (3,410 | 15.4%), social sciences (1,888 | 8.5%), science & technology (1,771 | 8.0%), and bio, nature & agricultural (1,743 | 7.9%) are the most common fields of study among 22,162 individuals in Rancho Palos Verdes who have obtained a bachelor's degree or higher.
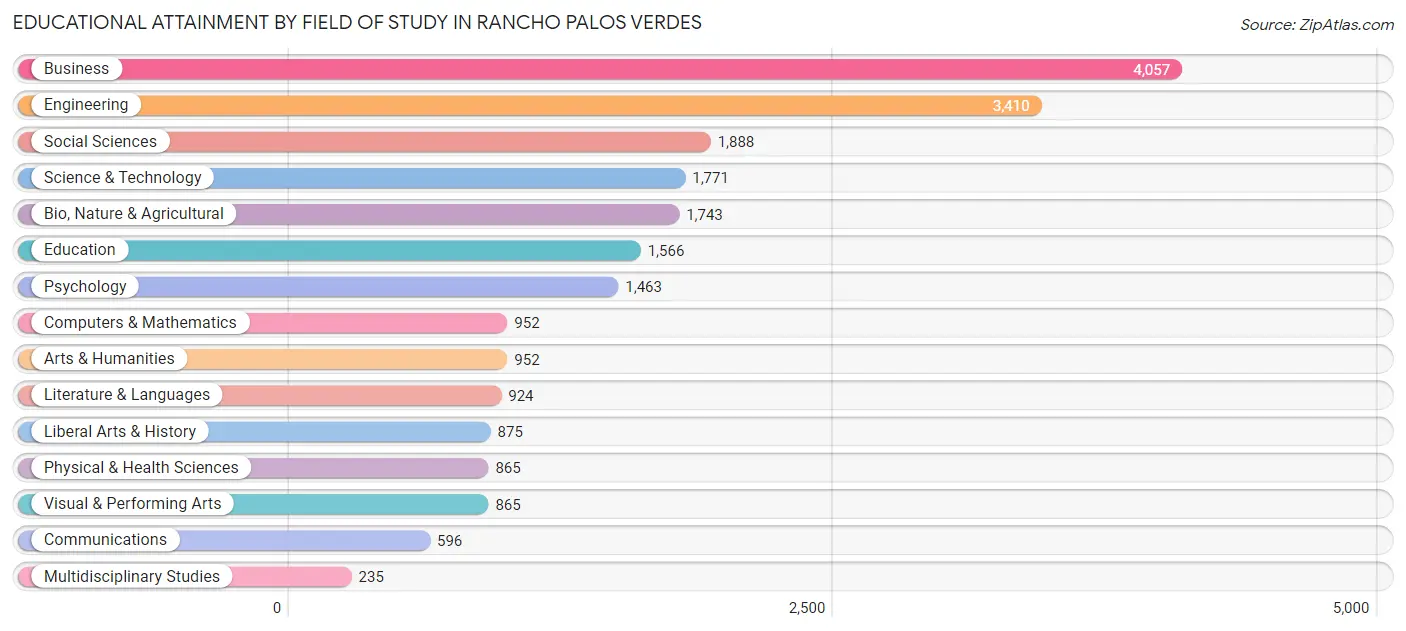
| Field of Study | # Graduates | % Graduates |
| Computers & Mathematics | 952 | 4.3% |
| Bio, Nature & Agricultural | 1,743 | 7.9% |
| Physical & Health Sciences | 865 | 3.9% |
| Psychology | 1,463 | 6.6% |
| Social Sciences | 1,888 | 8.5% |
| Engineering | 3,410 | 15.4% |
| Multidisciplinary Studies | 235 | 1.1% |
| Science & Technology | 1,771 | 8.0% |
| Business | 4,057 | 18.3% |
| Education | 1,566 | 7.1% |
| Literature & Languages | 924 | 4.2% |
| Liberal Arts & History | 875 | 4.0% |
| Visual & Performing Arts | 865 | 3.9% |
| Communications | 596 | 2.7% |
| Arts & Humanities | 952 | 4.3% |
| Total | 22,162 | 100.0% |
Transportation & Commute in Rancho Palos Verdes
Vehicle Availability by Sex in Rancho Palos Verdes
The most prevalent vehicle ownership categories in Rancho Palos Verdes are males with 2 vehicles (4,426, accounting for 45.3%) and females with 2 vehicles (3,495, making up 56.2%).
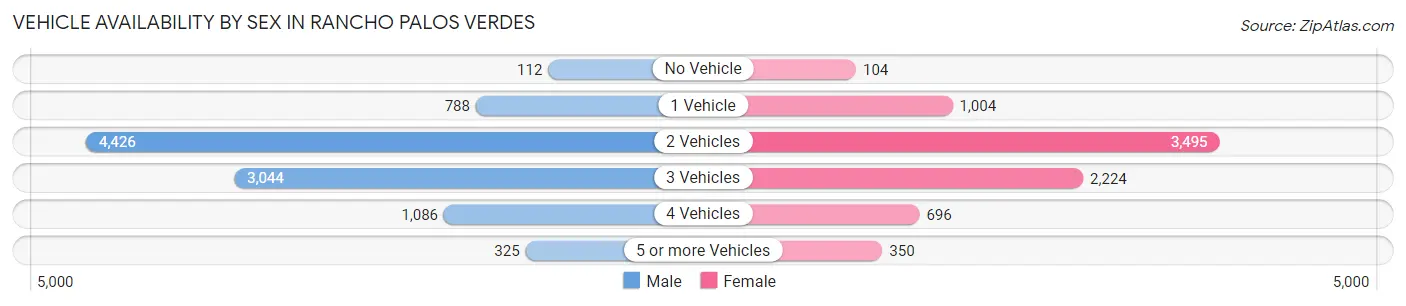
| Vehicles Available | Male | Female |
| No Vehicle | 112 (1.1%) | 104 (1.3%) |
| 1 Vehicle | 788 (8.1%) | 1,004 (12.8%) |
| 2 Vehicles | 4,426 (45.3%) | 3,495 (44.4%) |
| 3 Vehicles | 3,044 (31.1%) | 2,224 (28.2%) |
| 4 Vehicles | 1,086 (11.1%) | 696 (8.8%) |
| 5 or more Vehicles | 325 (3.3%) | 350 (4.4%) |
| Total | 9,781 (100.0%) | 7,873 (100.0%) |
Commute Time in Rancho Palos Verdes
The most frequently occuring commute durations in Rancho Palos Verdes are 30 to 34 minutes (2,219 commuters, 16.0%), 20 to 24 minutes (1,976 commuters, 14.3%), and 45 to 59 minutes (1,621 commuters, 11.7%).
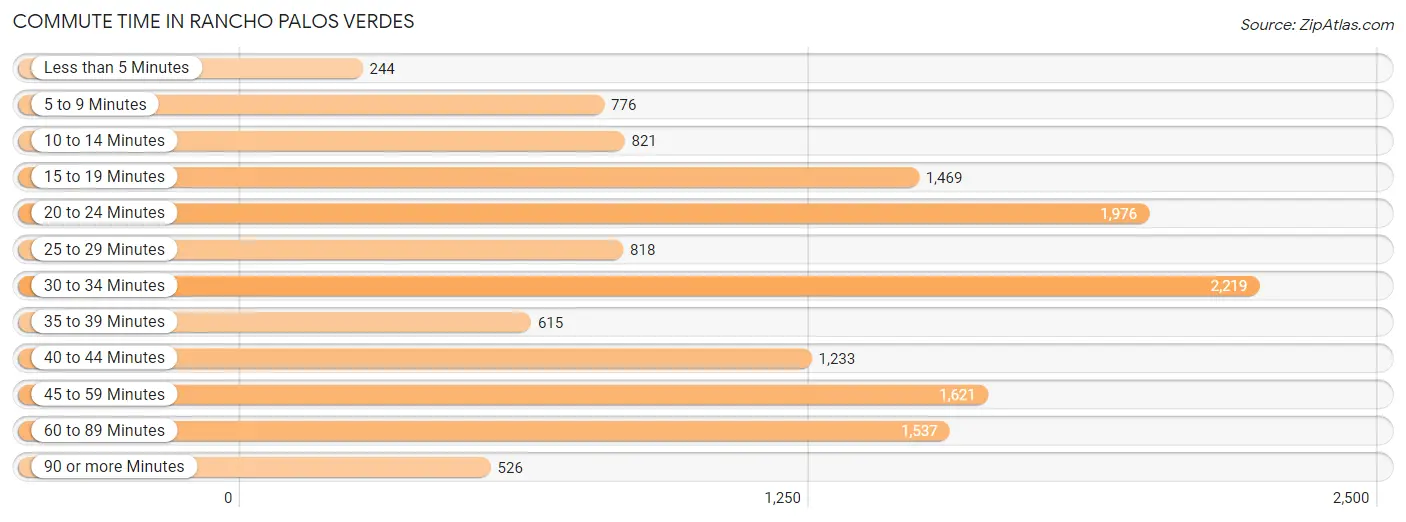
| Commute Time | # Commuters | % Commuters |
| Less than 5 Minutes | 244 | 1.8% |
| 5 to 9 Minutes | 776 | 5.6% |
| 10 to 14 Minutes | 821 | 5.9% |
| 15 to 19 Minutes | 1,469 | 10.6% |
| 20 to 24 Minutes | 1,976 | 14.3% |
| 25 to 29 Minutes | 818 | 5.9% |
| 30 to 34 Minutes | 2,219 | 16.0% |
| 35 to 39 Minutes | 615 | 4.4% |
| 40 to 44 Minutes | 1,233 | 8.9% |
| 45 to 59 Minutes | 1,621 | 11.7% |
| 60 to 89 Minutes | 1,537 | 11.1% |
| 90 or more Minutes | 526 | 3.8% |
Commute Time by Sex in Rancho Palos Verdes
The most common commute times in Rancho Palos Verdes are 30 to 34 minutes (1,426 commuters, 18.1%) for males and 30 to 34 minutes (793 commuters, 13.2%) for females.
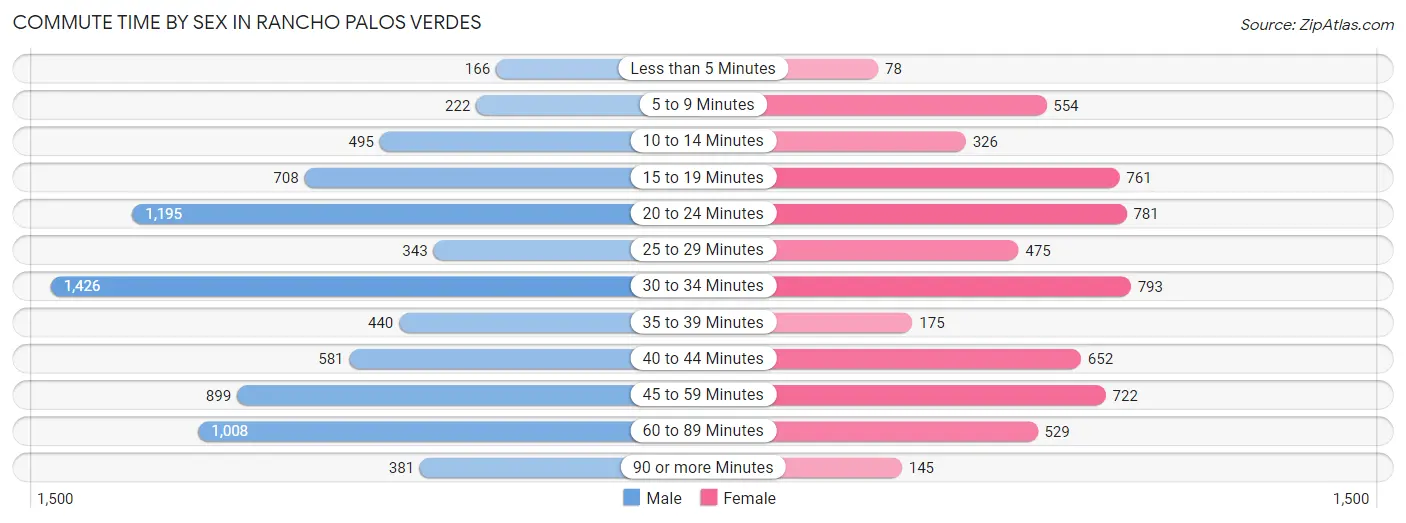
| Commute Time | Male | Female |
| Less than 5 Minutes | 166 (2.1%) | 78 (1.3%) |
| 5 to 9 Minutes | 222 (2.8%) | 554 (9.2%) |
| 10 to 14 Minutes | 495 (6.3%) | 326 (5.4%) |
| 15 to 19 Minutes | 708 (9.0%) | 761 (12.7%) |
| 20 to 24 Minutes | 1,195 (15.2%) | 781 (13.0%) |
| 25 to 29 Minutes | 343 (4.4%) | 475 (7.9%) |
| 30 to 34 Minutes | 1,426 (18.1%) | 793 (13.2%) |
| 35 to 39 Minutes | 440 (5.6%) | 175 (2.9%) |
| 40 to 44 Minutes | 581 (7.4%) | 652 (10.9%) |
| 45 to 59 Minutes | 899 (11.4%) | 722 (12.0%) |
| 60 to 89 Minutes | 1,008 (12.8%) | 529 (8.8%) |
| 90 or more Minutes | 381 (4.8%) | 145 (2.4%) |
Time of Departure to Work by Sex in Rancho Palos Verdes
The most frequent times of departure to work in Rancho Palos Verdes are 7:00 AM to 7:29 AM (1,432, 18.2%) for males and 8:00 AM to 8:29 AM (1,521, 25.4%) for females.
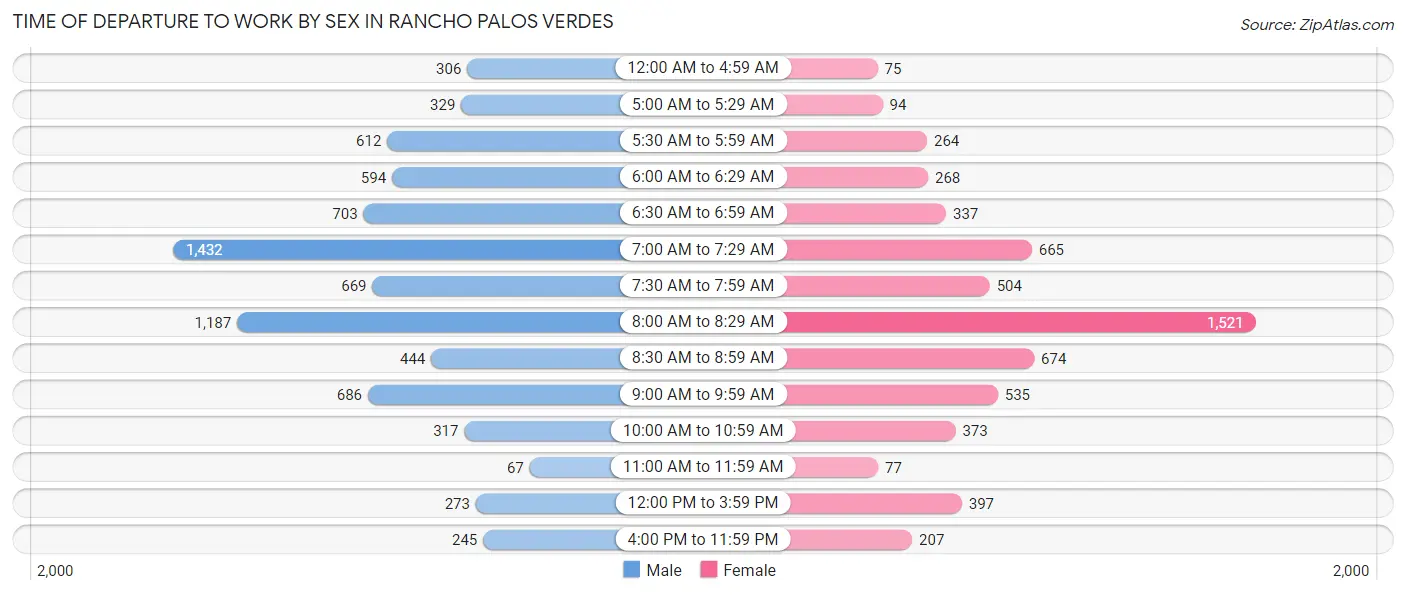
| Time of Departure | Male | Female |
| 12:00 AM to 4:59 AM | 306 (3.9%) | 75 (1.3%) |
| 5:00 AM to 5:29 AM | 329 (4.2%) | 94 (1.6%) |
| 5:30 AM to 5:59 AM | 612 (7.8%) | 264 (4.4%) |
| 6:00 AM to 6:29 AM | 594 (7.5%) | 268 (4.5%) |
| 6:30 AM to 6:59 AM | 703 (8.9%) | 337 (5.6%) |
| 7:00 AM to 7:29 AM | 1,432 (18.2%) | 665 (11.1%) |
| 7:30 AM to 7:59 AM | 669 (8.5%) | 504 (8.4%) |
| 8:00 AM to 8:29 AM | 1,187 (15.1%) | 1,521 (25.4%) |
| 8:30 AM to 8:59 AM | 444 (5.7%) | 674 (11.3%) |
| 9:00 AM to 9:59 AM | 686 (8.7%) | 535 (8.9%) |
| 10:00 AM to 10:59 AM | 317 (4.0%) | 373 (6.2%) |
| 11:00 AM to 11:59 AM | 67 (0.9%) | 77 (1.3%) |
| 12:00 PM to 3:59 PM | 273 (3.5%) | 397 (6.6%) |
| 4:00 PM to 11:59 PM | 245 (3.1%) | 207 (3.5%) |
| Total | 7,864 (100.0%) | 5,991 (100.0%) |
Housing Occupancy in Rancho Palos Verdes
Occupancy by Ownership in Rancho Palos Verdes
Of the total 15,351 dwellings in Rancho Palos Verdes, owner-occupied units account for 12,243 (79.7%), while renter-occupied units make up 3,108 (20.3%).
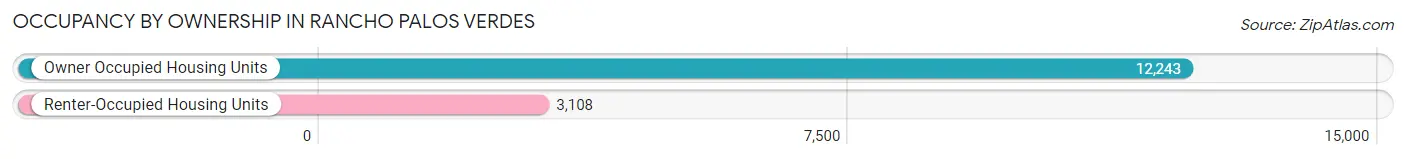
| Occupancy | # Housing Units | % Housing Units |
| Owner Occupied Housing Units | 12,243 | 79.7% |
| Renter-Occupied Housing Units | 3,108 | 20.3% |
| Total Occupied Housing Units | 15,351 | 100.0% |
Occupancy by Household Size in Rancho Palos Verdes
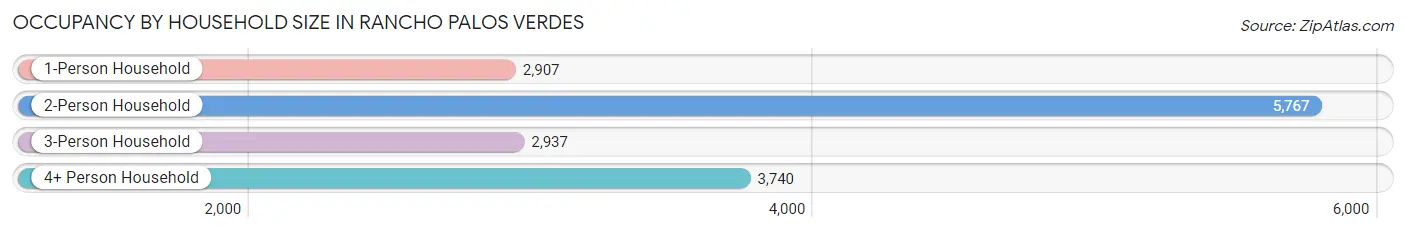
| Household Size | # Housing Units | % Housing Units |
| 1-Person Household | 2,907 | 18.9% |
| 2-Person Household | 5,767 | 37.6% |
| 3-Person Household | 2,937 | 19.1% |
| 4+ Person Household | 3,740 | 24.4% |
| Total Housing Units | 15,351 | 100.0% |
Occupancy by Ownership by Household Size in Rancho Palos Verdes
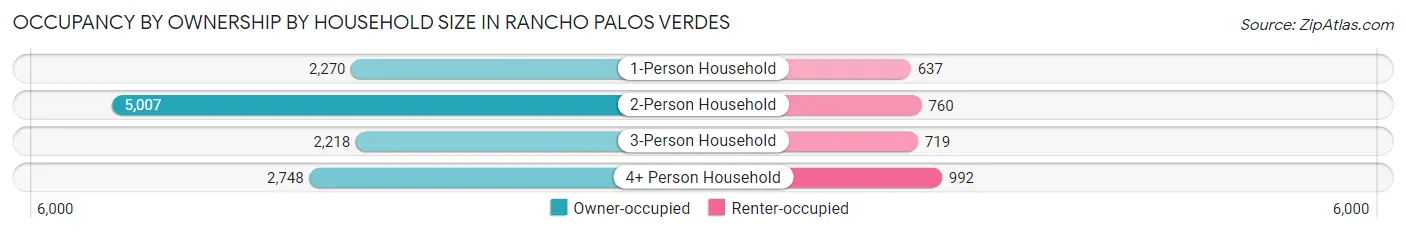
| Household Size | Owner-occupied | Renter-occupied |
| 1-Person Household | 2,270 (78.1%) | 637 (21.9%) |
| 2-Person Household | 5,007 (86.8%) | 760 (13.2%) |
| 3-Person Household | 2,218 (75.5%) | 719 (24.5%) |
| 4+ Person Household | 2,748 (73.5%) | 992 (26.5%) |
| Total Housing Units | 12,243 (79.7%) | 3,108 (20.3%) |
Occupancy by Educational Attainment in Rancho Palos Verdes
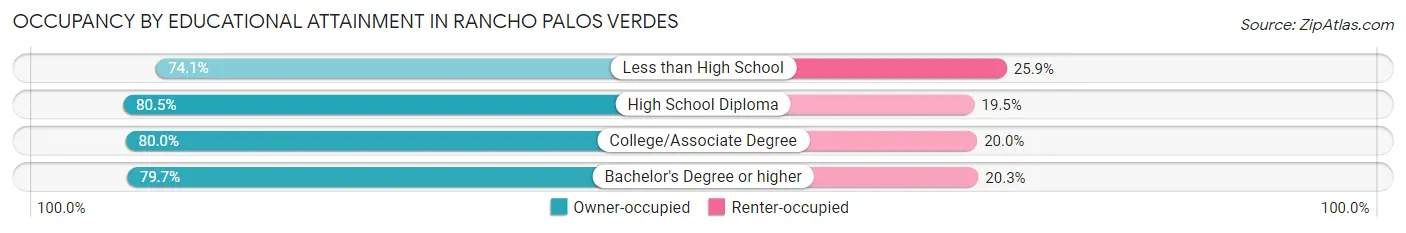
| Household Size | Owner-occupied | Renter-occupied |
| Less than High School | 143 (74.1%) | 50 (25.9%) |
| High School Diploma | 833 (80.5%) | 202 (19.5%) |
| College/Associate Degree | 2,152 (80.0%) | 539 (20.0%) |
| Bachelor's Degree or higher | 9,115 (79.7%) | 2,317 (20.3%) |
Occupancy by Age of Householder in Rancho Palos Verdes
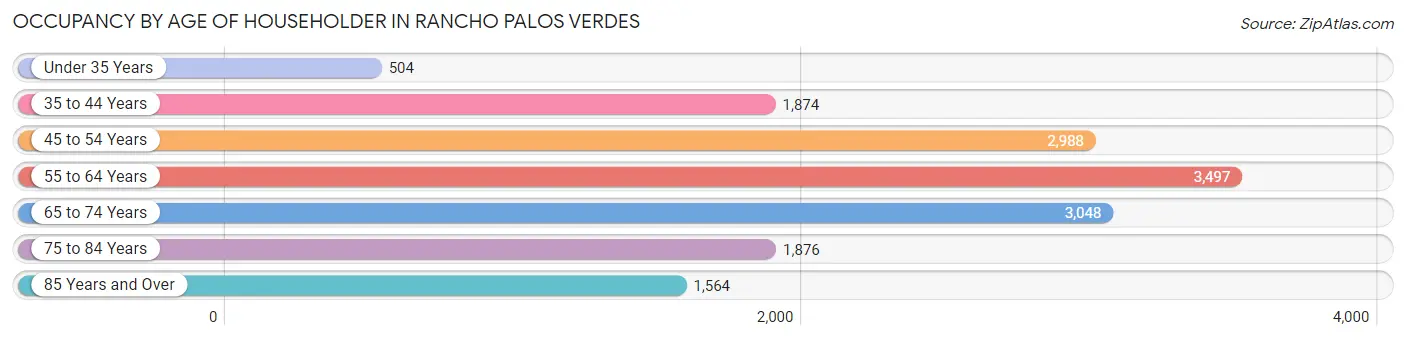
| Age Bracket | # Households | % Households |
| Under 35 Years | 504 | 3.3% |
| 35 to 44 Years | 1,874 | 12.2% |
| 45 to 54 Years | 2,988 | 19.5% |
| 55 to 64 Years | 3,497 | 22.8% |
| 65 to 74 Years | 3,048 | 19.9% |
| 75 to 84 Years | 1,876 | 12.2% |
| 85 Years and Over | 1,564 | 10.2% |
| Total | 15,351 | 100.0% |
Housing Finances in Rancho Palos Verdes
Median Income by Occupancy in Rancho Palos Verdes
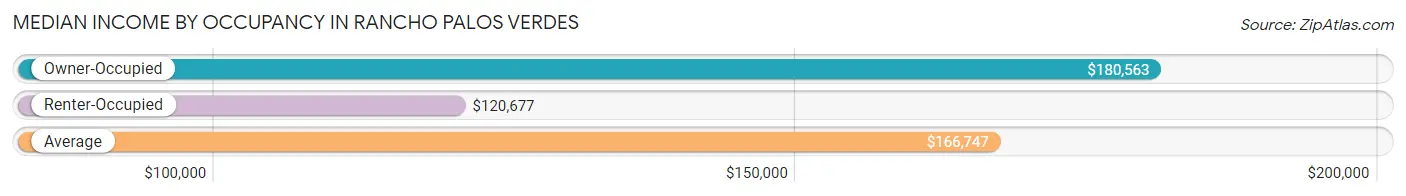
| Occupancy Type | # Households | Median Income |
| Owner-Occupied | 12,243 (79.7%) | $180,563 |
| Renter-Occupied | 3,108 (20.3%) | $120,677 |
| Average | 15,351 (100.0%) | $166,747 |
Occupancy by Householder Income Bracket in Rancho Palos Verdes
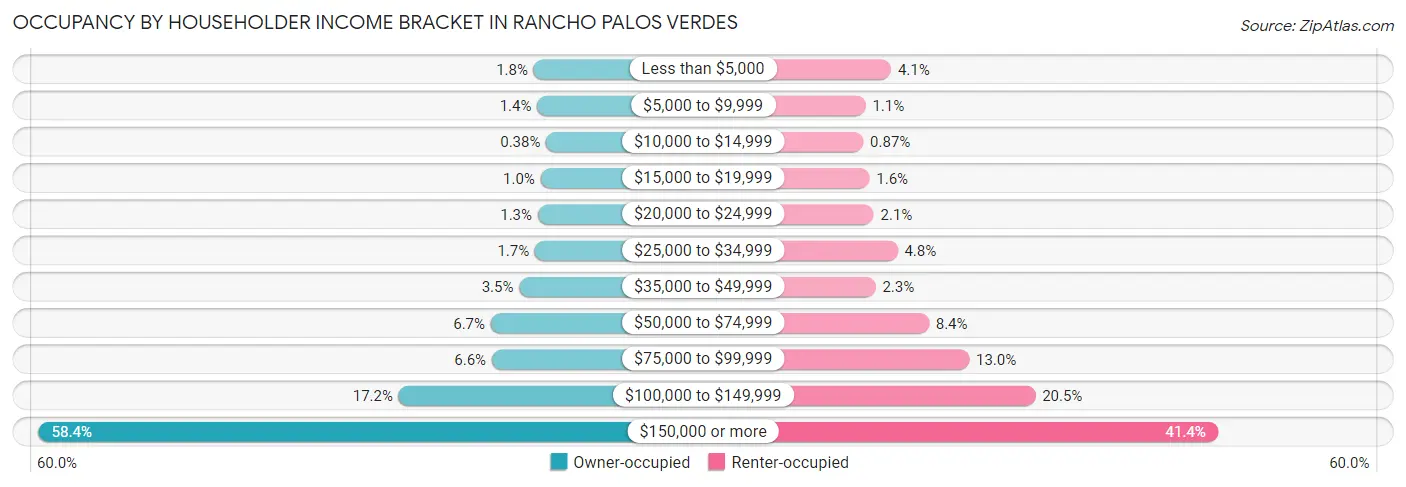
| Income Bracket | Owner-occupied | Renter-occupied |
| Less than $5,000 | 221 (1.8%) | 126 (4.1%) |
| $5,000 to $9,999 | 173 (1.4%) | 35 (1.1%) |
| $10,000 to $14,999 | 46 (0.4%) | 27 (0.9%) |
| $15,000 to $19,999 | 125 (1.0%) | 49 (1.6%) |
| $20,000 to $24,999 | 164 (1.3%) | 64 (2.1%) |
| $25,000 to $34,999 | 203 (1.7%) | 149 (4.8%) |
| $35,000 to $49,999 | 424 (3.5%) | 71 (2.3%) |
| $50,000 to $74,999 | 822 (6.7%) | 260 (8.4%) |
| $75,000 to $99,999 | 807 (6.6%) | 403 (13.0%) |
| $100,000 to $149,999 | 2,109 (17.2%) | 638 (20.5%) |
| $150,000 or more | 7,149 (58.4%) | 1,286 (41.4%) |
| Total | 12,243 (100.0%) | 3,108 (100.0%) |
Monthly Housing Cost Tiers in Rancho Palos Verdes
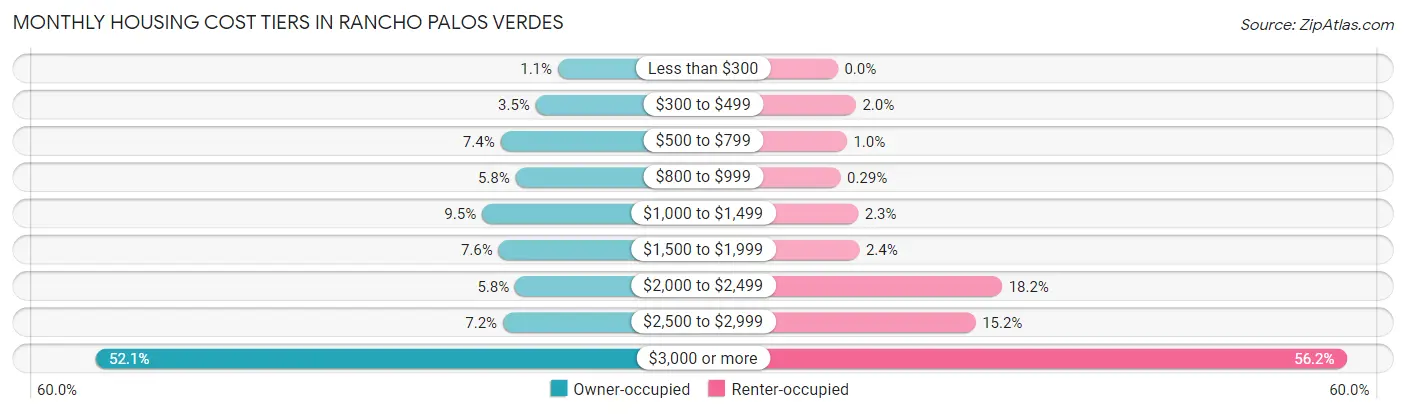
| Monthly Cost | Owner-occupied | Renter-occupied |
| Less than $300 | 133 (1.1%) | 0 (0.0%) |
| $300 to $499 | 433 (3.5%) | 62 (2.0%) |
| $500 to $799 | 910 (7.4%) | 31 (1.0%) |
| $800 to $999 | 705 (5.8%) | 9 (0.3%) |
| $1,000 to $1,499 | 1,160 (9.5%) | 70 (2.2%) |
| $1,500 to $1,999 | 935 (7.6%) | 74 (2.4%) |
| $2,000 to $2,499 | 713 (5.8%) | 564 (18.1%) |
| $2,500 to $2,999 | 876 (7.2%) | 473 (15.2%) |
| $3,000 or more | 6,378 (52.1%) | 1,747 (56.2%) |
| Total | 12,243 (100.0%) | 3,108 (100.0%) |
Physical Housing Characteristics in Rancho Palos Verdes
Housing Structures in Rancho Palos Verdes
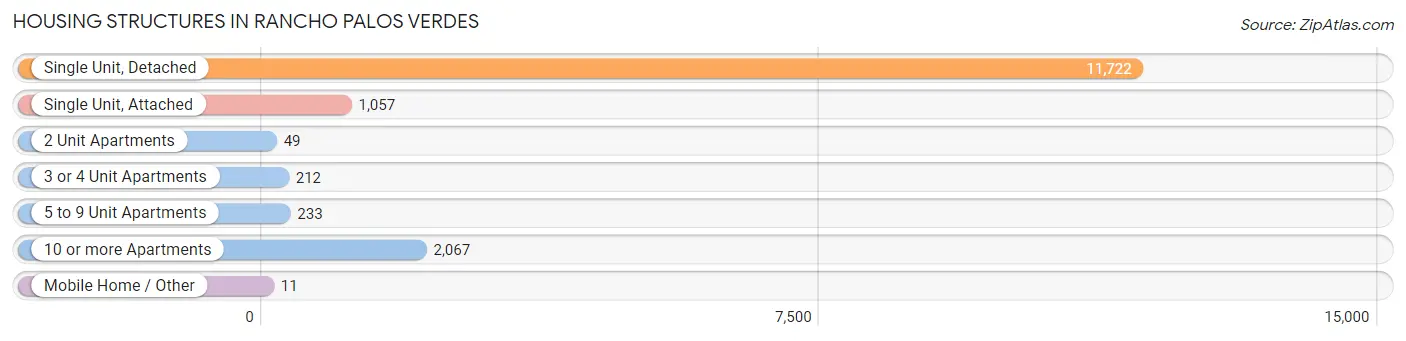
| Structure Type | # Housing Units | % Housing Units |
| Single Unit, Detached | 11,722 | 76.4% |
| Single Unit, Attached | 1,057 | 6.9% |
| 2 Unit Apartments | 49 | 0.3% |
| 3 or 4 Unit Apartments | 212 | 1.4% |
| 5 to 9 Unit Apartments | 233 | 1.5% |
| 10 or more Apartments | 2,067 | 13.5% |
| Mobile Home / Other | 11 | 0.1% |
| Total | 15,351 | 100.0% |
Housing Structures by Occupancy in Rancho Palos Verdes
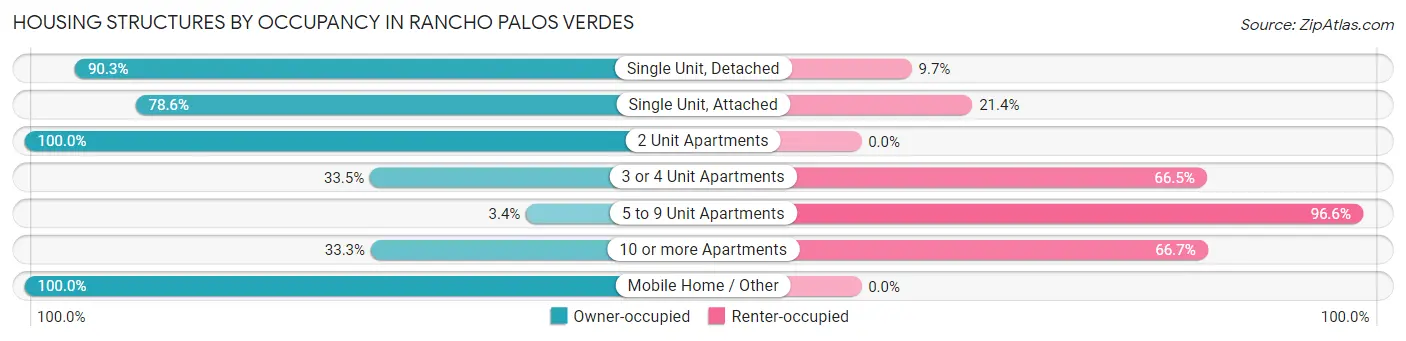
| Structure Type | Owner-occupied | Renter-occupied |
| Single Unit, Detached | 10,584 (90.3%) | 1,138 (9.7%) |
| Single Unit, Attached | 831 (78.6%) | 226 (21.4%) |
| 2 Unit Apartments | 49 (100.0%) | 0 (0.0%) |
| 3 or 4 Unit Apartments | 71 (33.5%) | 141 (66.5%) |
| 5 to 9 Unit Apartments | 8 (3.4%) | 225 (96.6%) |
| 10 or more Apartments | 689 (33.3%) | 1,378 (66.7%) |
| Mobile Home / Other | 11 (100.0%) | 0 (0.0%) |
| Total | 12,243 (79.7%) | 3,108 (20.3%) |
Housing Structures by Number of Rooms in Rancho Palos Verdes
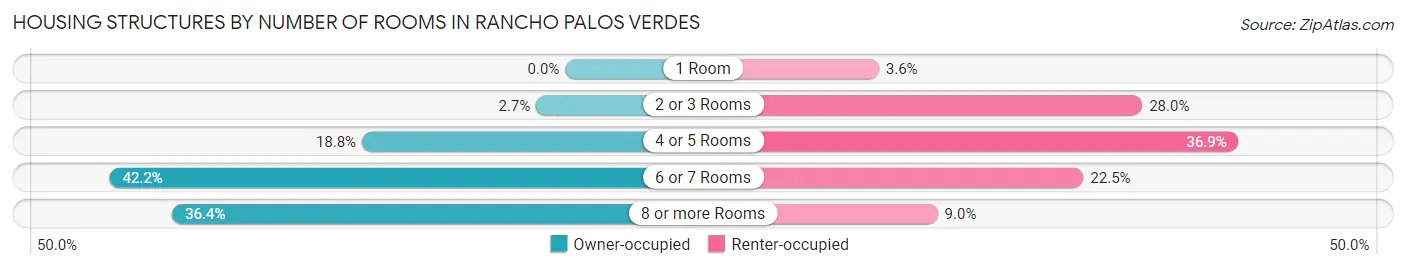
| Number of Rooms | Owner-occupied | Renter-occupied |
| 1 Room | 0 (0.0%) | 112 (3.6%) |
| 2 or 3 Rooms | 329 (2.7%) | 869 (28.0%) |
| 4 or 5 Rooms | 2,302 (18.8%) | 1,146 (36.9%) |
| 6 or 7 Rooms | 5,160 (42.1%) | 700 (22.5%) |
| 8 or more Rooms | 4,452 (36.4%) | 281 (9.0%) |
| Total | 12,243 (100.0%) | 3,108 (100.0%) |
Housing Structure by Heating Type in Rancho Palos Verdes
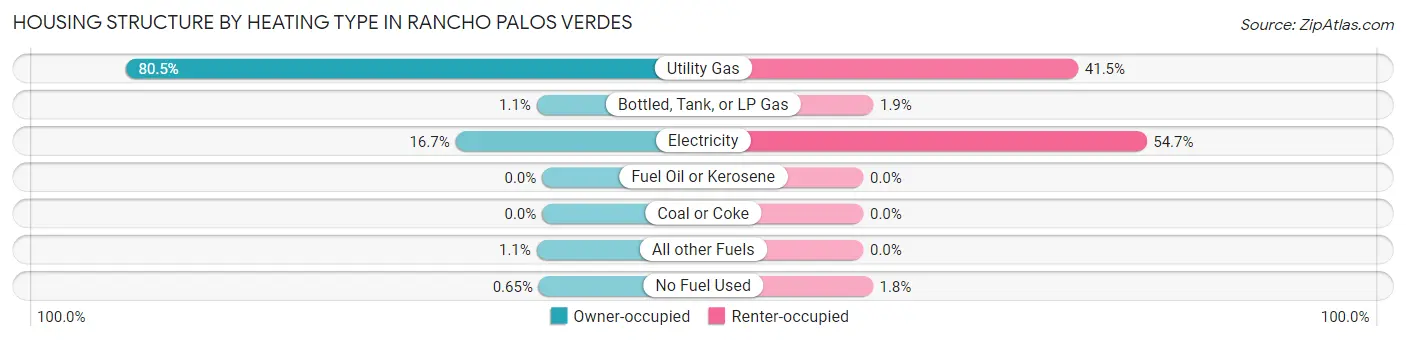
| Heating Type | Owner-occupied | Renter-occupied |
| Utility Gas | 9,857 (80.5%) | 1,290 (41.5%) |
| Bottled, Tank, or LP Gas | 128 (1.1%) | 60 (1.9%) |
| Electricity | 2,049 (16.7%) | 1,701 (54.7%) |
| Fuel Oil or Kerosene | 0 (0.0%) | 0 (0.0%) |
| Coal or Coke | 0 (0.0%) | 0 (0.0%) |
| All other Fuels | 130 (1.1%) | 0 (0.0%) |
| No Fuel Used | 79 (0.6%) | 57 (1.8%) |
| Total | 12,243 (100.0%) | 3,108 (100.0%) |
Household Vehicle Usage in Rancho Palos Verdes
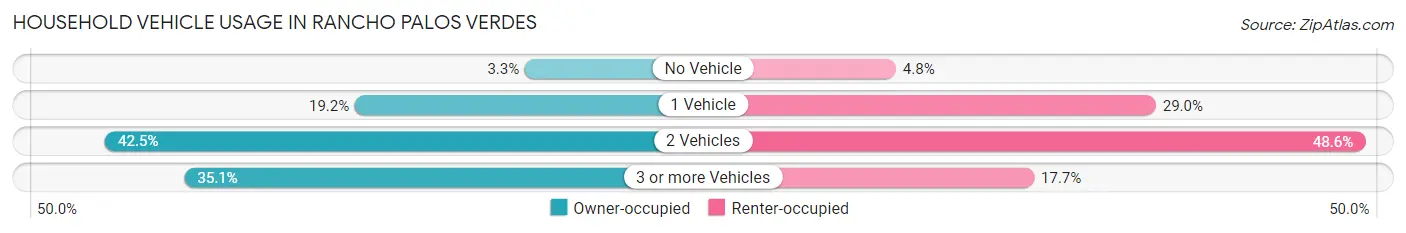
| Vehicles per Household | Owner-occupied | Renter-occupied |
| No Vehicle | 402 (3.3%) | 148 (4.8%) |
| 1 Vehicle | 2,345 (19.2%) | 902 (29.0%) |
| 2 Vehicles | 5,201 (42.5%) | 1,509 (48.5%) |
| 3 or more Vehicles | 4,295 (35.1%) | 549 (17.7%) |
| Total | 12,243 (100.0%) | 3,108 (100.0%) |
Real Estate & Mortgages in Rancho Palos Verdes
Real Estate and Mortgage Overview in Rancho Palos Verdes
| Characteristic | Without Mortgage | With Mortgage |
| Housing Units | 4,135 | 8,108 |
| Median Property Value | $1,361,600 | $1,443,600 |
| Median Household Income | $136,483 | $5,317 |
| Monthly Housing Costs | $994 | $6,251 |
| Real Estate Taxes | $6,390 | $34 |
Property Value by Mortgage Status in Rancho Palos Verdes
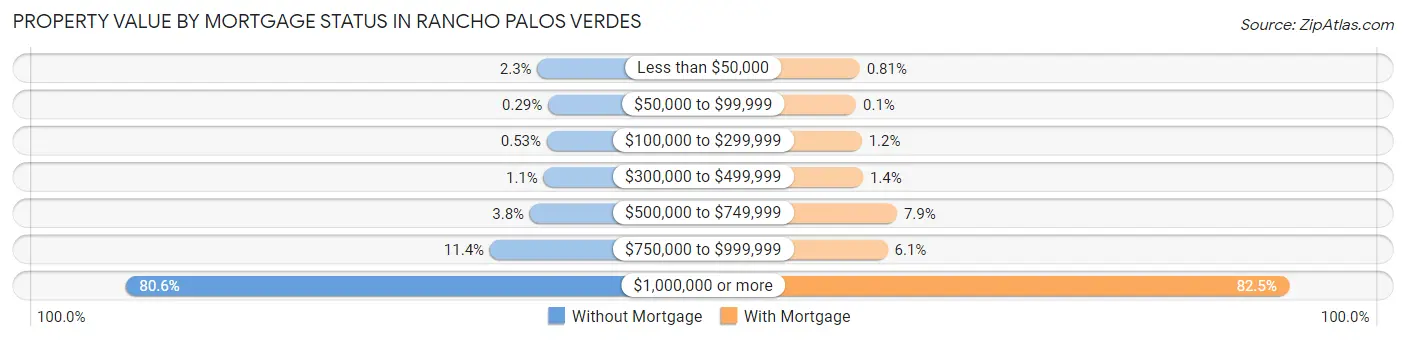
| Property Value | Without Mortgage | With Mortgage |
| Less than $50,000 | 96 (2.3%) | 66 (0.8%) |
| $50,000 to $99,999 | 12 (0.3%) | 8 (0.1%) |
| $100,000 to $299,999 | 22 (0.5%) | 95 (1.2%) |
| $300,000 to $499,999 | 47 (1.1%) | 114 (1.4%) |
| $500,000 to $749,999 | 155 (3.7%) | 640 (7.9%) |
| $750,000 to $999,999 | 470 (11.4%) | 495 (6.1%) |
| $1,000,000 or more | 3,333 (80.6%) | 6,690 (82.5%) |
| Total | 4,135 (100.0%) | 8,108 (100.0%) |
Household Income by Mortgage Status in Rancho Palos Verdes
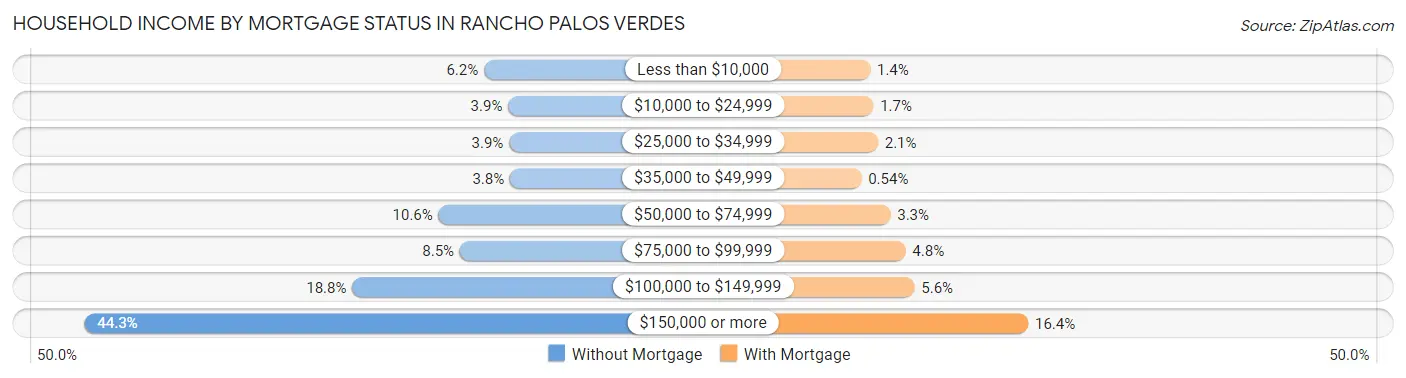
| Household Income | Without Mortgage | With Mortgage |
| Less than $10,000 | 258 (6.2%) | 112 (1.4%) |
| $10,000 to $24,999 | 163 (3.9%) | 136 (1.7%) |
| $25,000 to $34,999 | 159 (3.8%) | 172 (2.1%) |
| $35,000 to $49,999 | 156 (3.8%) | 44 (0.5%) |
| $50,000 to $74,999 | 437 (10.6%) | 268 (3.3%) |
| $75,000 to $99,999 | 353 (8.5%) | 385 (4.8%) |
| $100,000 to $149,999 | 777 (18.8%) | 454 (5.6%) |
| $150,000 or more | 1,832 (44.3%) | 1,332 (16.4%) |
| Total | 4,135 (100.0%) | 8,108 (100.0%) |
Property Value to Household Income Ratio in Rancho Palos Verdes
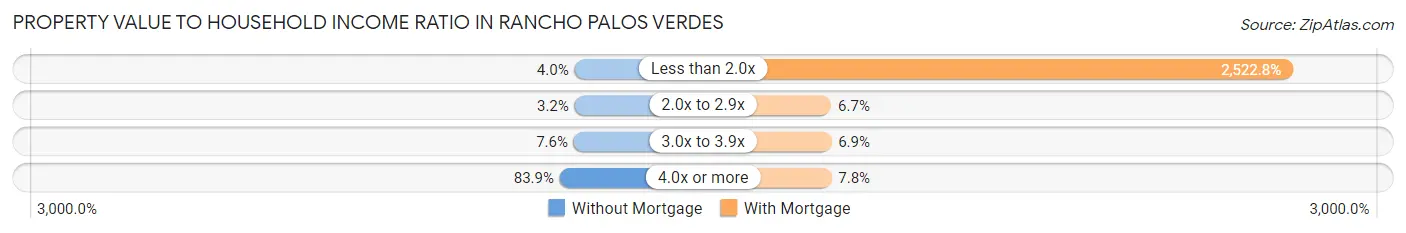
| Value-to-Income Ratio | Without Mortgage | With Mortgage |
| Less than 2.0x | 164 (4.0%) | 204,552 (2,522.8%) |
| 2.0x to 2.9x | 134 (3.2%) | 540 (6.7%) |
| 3.0x to 3.9x | 314 (7.6%) | 559 (6.9%) |
| 4.0x or more | 3,470 (83.9%) | 633 (7.8%) |
| Total | 4,135 (100.0%) | 8,108 (100.0%) |
Real Estate Taxes by Mortgage Status in Rancho Palos Verdes
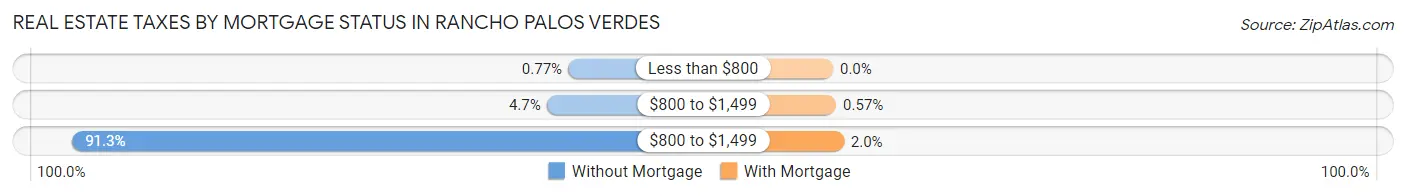
| Property Taxes | Without Mortgage | With Mortgage |
| Less than $800 | 32 (0.8%) | 0 (0.0%) |
| $800 to $1,499 | 193 (4.7%) | 46 (0.6%) |
| $800 to $1,499 | 3,775 (91.3%) | 160 (2.0%) |
| Total | 4,135 (100.0%) | 8,108 (100.0%) |
Health & Disability in Rancho Palos Verdes
Health Insurance Coverage by Age in Rancho Palos Verdes
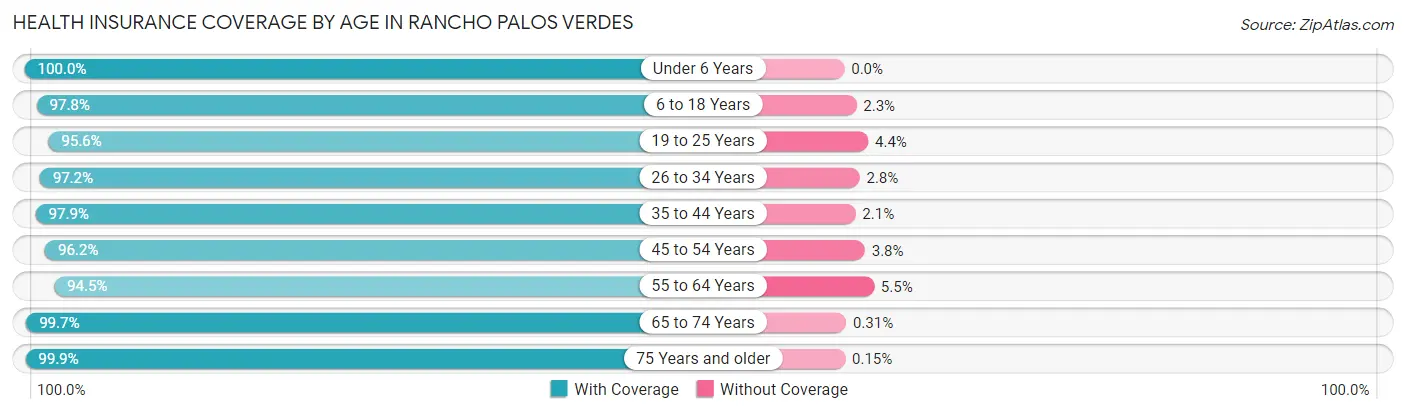
| Age Bracket | With Coverage | Without Coverage |
| Under 6 Years | 2,167 (100.0%) | 0 (0.0%) |
| 6 to 18 Years | 7,005 (97.8%) | 161 (2.2%) |
| 19 to 25 Years | 2,367 (95.6%) | 110 (4.4%) |
| 26 to 34 Years | 1,981 (97.2%) | 58 (2.8%) |
| 35 to 44 Years | 4,059 (97.9%) | 86 (2.1%) |
| 45 to 54 Years | 5,734 (96.2%) | 228 (3.8%) |
| 55 to 64 Years | 6,472 (94.5%) | 378 (5.5%) |
| 65 to 74 Years | 5,439 (99.7%) | 17 (0.3%) |
| 75 Years and older | 5,446 (99.9%) | 8 (0.2%) |
| Total | 40,670 (97.5%) | 1,046 (2.5%) |
Health Insurance Coverage by Citizenship Status in Rancho Palos Verdes
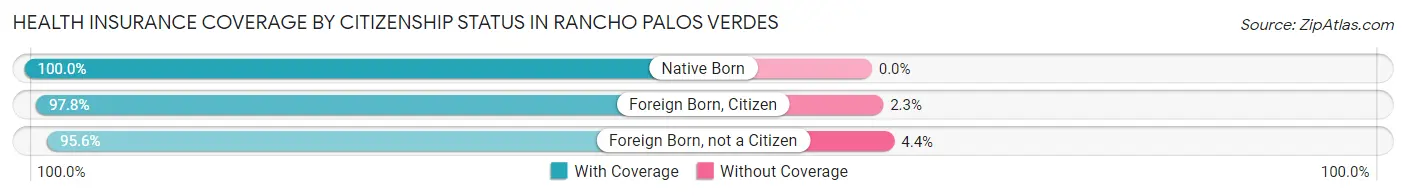
| Citizenship Status | With Coverage | Without Coverage |
| Native Born | 2,167 (100.0%) | 0 (0.0%) |
| Foreign Born, Citizen | 7,005 (97.8%) | 161 (2.2%) |
| Foreign Born, not a Citizen | 2,367 (95.6%) | 110 (4.4%) |
Health Insurance Coverage by Household Income in Rancho Palos Verdes
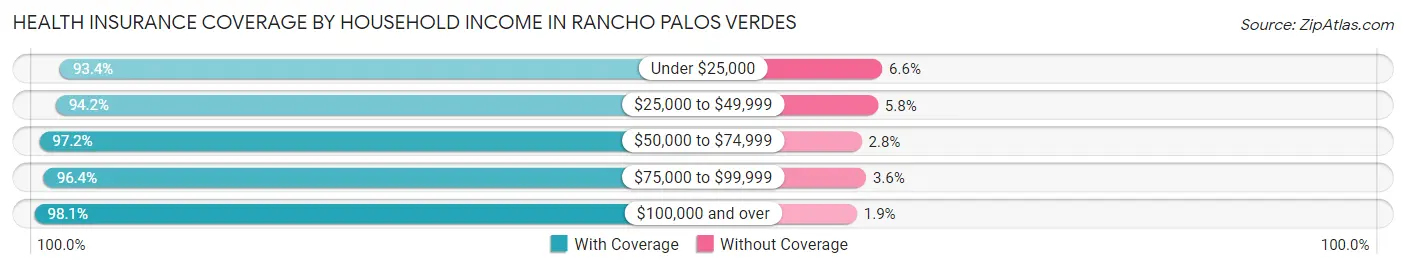
| Household Income | With Coverage | Without Coverage |
| Under $25,000 | 1,550 (93.4%) | 110 (6.6%) |
| $25,000 to $49,999 | 1,518 (94.2%) | 94 (5.8%) |
| $50,000 to $74,999 | 2,036 (97.2%) | 58 (2.8%) |
| $75,000 to $99,999 | 3,267 (96.4%) | 122 (3.6%) |
| $100,000 and over | 31,874 (98.1%) | 612 (1.9%) |
Public vs Private Health Insurance Coverage by Age in Rancho Palos Verdes
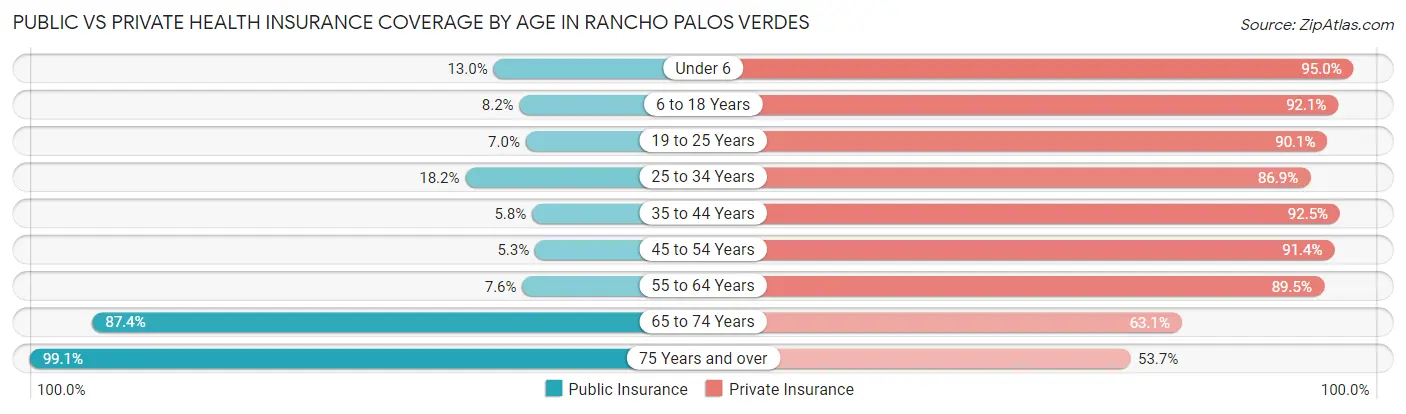
| Age Bracket | Public Insurance | Private Insurance |
| Under 6 | 281 (13.0%) | 2,058 (95.0%) |
| 6 to 18 Years | 584 (8.2%) | 6,602 (92.1%) |
| 19 to 25 Years | 173 (7.0%) | 2,232 (90.1%) |
| 25 to 34 Years | 371 (18.2%) | 1,772 (86.9%) |
| 35 to 44 Years | 241 (5.8%) | 3,832 (92.4%) |
| 45 to 54 Years | 313 (5.2%) | 5,450 (91.4%) |
| 55 to 64 Years | 521 (7.6%) | 6,127 (89.4%) |
| 65 to 74 Years | 4,770 (87.4%) | 3,442 (63.1%) |
| 75 Years and over | 5,402 (99.1%) | 2,928 (53.7%) |
| Total | 12,656 (30.3%) | 34,443 (82.6%) |
Disability Status by Sex by Age in Rancho Palos Verdes
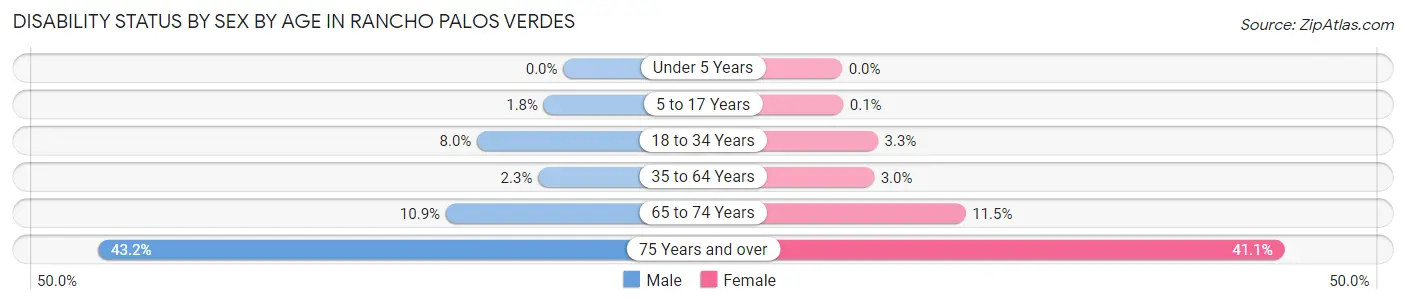
| Age Bracket | Male | Female |
| Under 5 Years | 0 (0.0%) | 0 (0.0%) |
| 5 to 17 Years | 67 (1.8%) | 3 (0.1%) |
| 18 to 34 Years | 208 (8.0%) | 83 (3.3%) |
| 35 to 64 Years | 184 (2.3%) | 268 (3.0%) |
| 65 to 74 Years | 315 (10.9%) | 294 (11.5%) |
| 75 Years and over | 1,012 (43.2%) | 1,278 (41.1%) |
Disability Class by Sex by Age in Rancho Palos Verdes
Disability Class: Hearing Difficulty
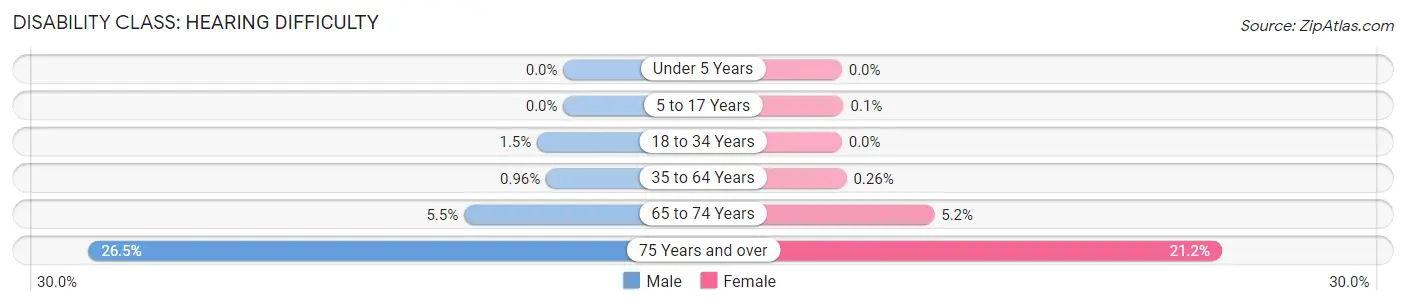
| Age Bracket | Male | Female |
| Under 5 Years | 0 (0.0%) | 0 (0.0%) |
| 5 to 17 Years | 0 (0.0%) | 3 (0.1%) |
| 18 to 34 Years | 38 (1.5%) | 0 (0.0%) |
| 35 to 64 Years | 76 (1.0%) | 24 (0.3%) |
| 65 to 74 Years | 160 (5.5%) | 132 (5.1%) |
| 75 Years and over | 620 (26.5%) | 658 (21.2%) |
Disability Class: Vision Difficulty
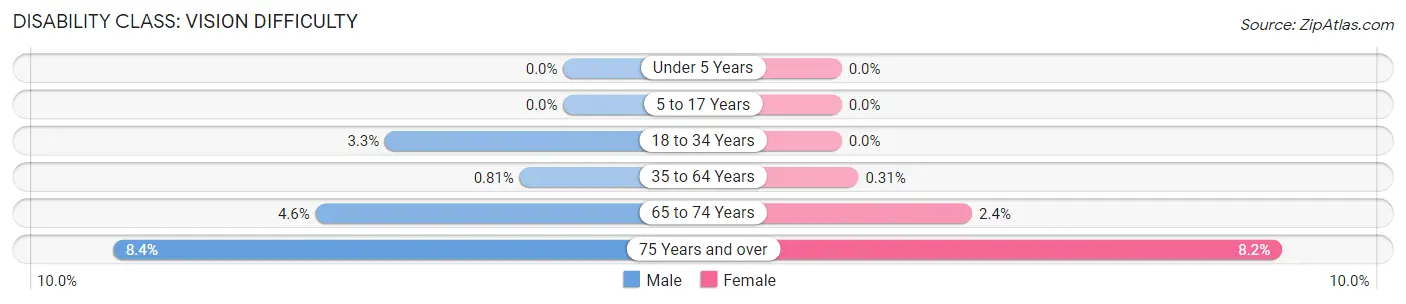
| Age Bracket | Male | Female |
| Under 5 Years | 0 (0.0%) | 0 (0.0%) |
| 5 to 17 Years | 0 (0.0%) | 0 (0.0%) |
| 18 to 34 Years | 86 (3.3%) | 0 (0.0%) |
| 35 to 64 Years | 64 (0.8%) | 28 (0.3%) |
| 65 to 74 Years | 133 (4.6%) | 62 (2.4%) |
| 75 Years and over | 196 (8.4%) | 254 (8.2%) |
Disability Class: Cognitive Difficulty
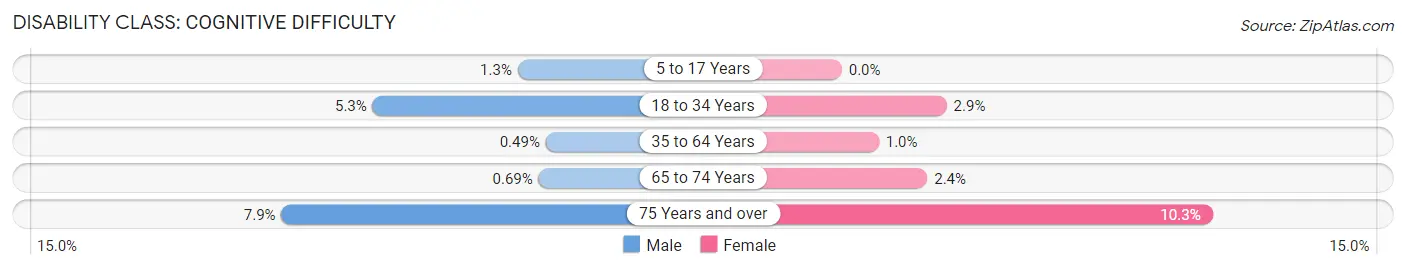
| Age Bracket | Male | Female |
| 5 to 17 Years | 47 (1.3%) | 0 (0.0%) |
| 18 to 34 Years | 138 (5.3%) | 73 (2.9%) |
| 35 to 64 Years | 39 (0.5%) | 93 (1.0%) |
| 65 to 74 Years | 20 (0.7%) | 61 (2.4%) |
| 75 Years and over | 184 (7.9%) | 321 (10.3%) |
Disability Class: Ambulatory Difficulty
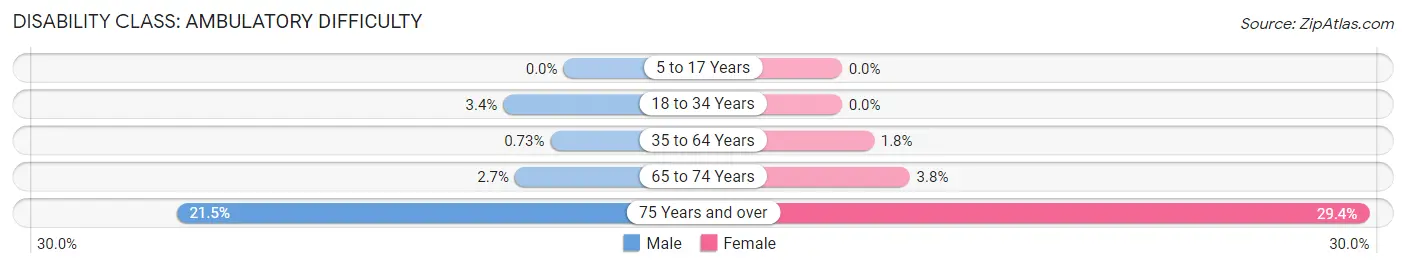
| Age Bracket | Male | Female |
| 5 to 17 Years | 0 (0.0%) | 0 (0.0%) |
| 18 to 34 Years | 87 (3.4%) | 0 (0.0%) |
| 35 to 64 Years | 58 (0.7%) | 161 (1.8%) |
| 65 to 74 Years | 78 (2.7%) | 97 (3.8%) |
| 75 Years and over | 505 (21.5%) | 913 (29.4%) |
Disability Class: Self-Care Difficulty
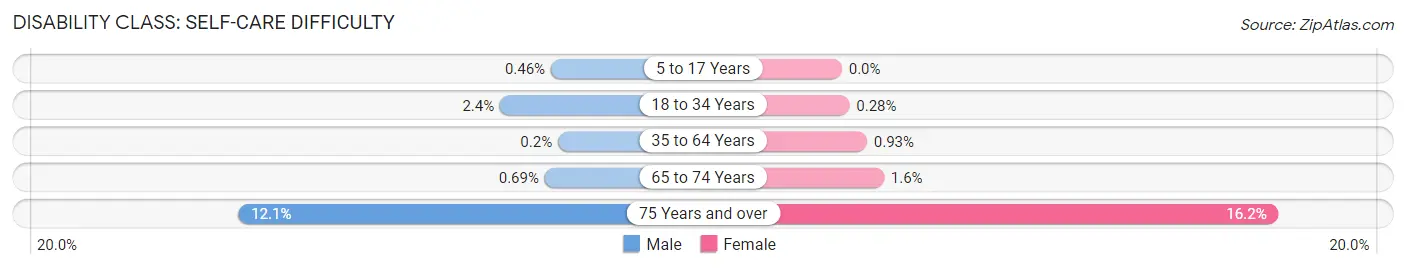
| Age Bracket | Male | Female |
| 5 to 17 Years | 17 (0.5%) | 0 (0.0%) |
| 18 to 34 Years | 61 (2.4%) | 7 (0.3%) |
| 35 to 64 Years | 16 (0.2%) | 84 (0.9%) |
| 65 to 74 Years | 20 (0.7%) | 40 (1.6%) |
| 75 Years and over | 283 (12.1%) | 504 (16.2%) |
Technology Access in Rancho Palos Verdes
Computing Device Access in Rancho Palos Verdes
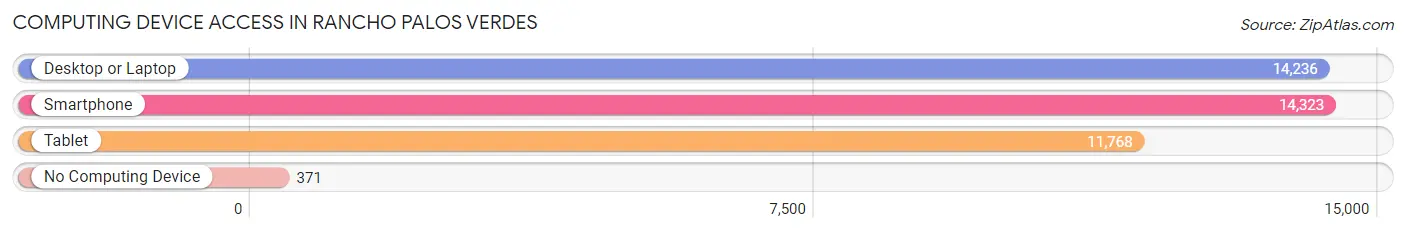
| Device Type | # Households | % Households |
| Desktop or Laptop | 14,236 | 92.7% |
| Smartphone | 14,323 | 93.3% |
| Tablet | 11,768 | 76.7% |
| No Computing Device | 371 | 2.4% |
| Total | 15,351 | 100.0% |
Internet Access in Rancho Palos Verdes
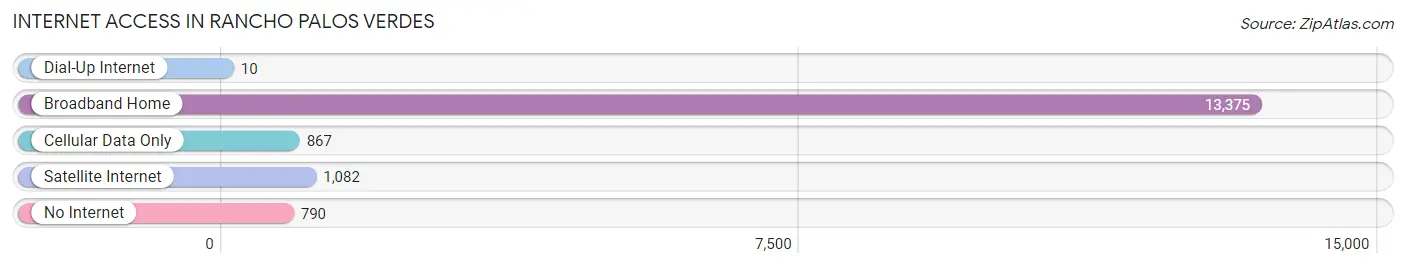
| Internet Type | # Households | % Households |
| Dial-Up Internet | 10 | 0.1% |
| Broadband Home | 13,375 | 87.1% |
| Cellular Data Only | 867 | 5.7% |
| Satellite Internet | 1,082 | 7.0% |
| No Internet | 790 | 5.1% |
| Total | 15,351 | 100.0% |
Rancho Palos Verdes Summary
Rancho Palos Verdes (RPV) is a city located in Los Angeles County, California. It is situated on the Palos Verdes Peninsula, a coastal region of the Pacific Ocean. The city is known for its stunning views of the ocean, its rolling hills, and its lush green landscapes.
History
Rancho Palos Verdes was originally inhabited by the Tongva people, who were the original inhabitants of the Los Angeles Basin. The area was first explored by Spanish explorer Gaspar de Portola in 1769. In 1784, the land was granted to Jose Loreto and Juan Capistrano Sepulveda by the Spanish government. The land was then divided into five separate ranchos, including Rancho Palos Verdes.
In the late 19th century, the area was developed by Frank Vanderlip, who purchased the land from the Sepulveda family. Vanderlip built a large estate on the land, which he named Palos Verdes. The estate was later sold to the Robinson family, who developed the area into a residential community.
In 1973, the city of Rancho Palos Verdes was incorporated. The city was designed to be a residential community, with a focus on preserving the natural beauty of the area.
Geography
Rancho Palos Verdes is located on the Palos Verdes Peninsula, which is a coastal region of the Pacific Ocean. The city is bordered by the cities of Rolling Hills Estates, San Pedro, and Torrance. The city is situated on a series of rolling hills, which provide stunning views of the ocean. The city is also home to a number of parks and open spaces, including the Palos Verdes Nature Preserve and the Point Vicente Interpretive Center.
The climate in Rancho Palos Verdes is mild and temperate, with warm summers and mild winters. The average temperature in the summer is around 75 degrees Fahrenheit, and the average temperature in the winter is around 55 degrees Fahrenheit.
Economy
Rancho Palos Verdes is home to a number of businesses and industries. The city is home to a number of technology companies, including SpaceX, which is headquartered in the city. The city is also home to a number of retail stores, restaurants, and other businesses.
The city is also home to a number of educational institutions, including California State University, Dominguez Hills, Marymount College, and the University of Southern California.
Demographics
As of the 2010 census, the population of Rancho Palos Verdes was 42,643. The racial makeup of the city was 75.3% White, 8.2% Asian, 6.7% Hispanic or Latino, and 5.2% African American. The median household income in the city was $118,871, and the median home value was $1,039,000.
Rancho Palos Verdes is a diverse and vibrant city, with a strong sense of community. The city is known for its stunning views of the ocean, its rolling hills, and its lush green landscapes. The city is also home to a number of businesses and industries, as well as a number of educational institutions.
Common Questions
What is Per Capita Income in Rancho Palos Verdes?
Per Capita income in Rancho Palos Verdes is $81,344.
What is the Median Family Income in Rancho Palos Verdes?
Median Family Income in Rancho Palos Verdes is $184,718.
What is the Median Household income in Rancho Palos Verdes?
Median Household Income in Rancho Palos Verdes is $166,747.
What is Income or Wage Gap in Rancho Palos Verdes?
Income or Wage Gap in Rancho Palos Verdes is 50.5%.
Women in Rancho Palos Verdes earn 49.5 cents for every dollar earned by a man.
What is Inequality or Gini Index in Rancho Palos Verdes?
Inequality or Gini Index in Rancho Palos Verdes is 0.44.
What is the Total Population of Rancho Palos Verdes?
Total Population of Rancho Palos Verdes is 41,805.
What is the Total Male Population of Rancho Palos Verdes?
Total Male Population of Rancho Palos Verdes is 20,343.
What is the Total Female Population of Rancho Palos Verdes?
Total Female Population of Rancho Palos Verdes is 21,462.
What is the Ratio of Males per 100 Females in Rancho Palos Verdes?
There are 94.79 Males per 100 Females in Rancho Palos Verdes.
What is the Ratio of Females per 100 Males in Rancho Palos Verdes?
There are 105.50 Females per 100 Males in Rancho Palos Verdes.
What is the Median Population Age in Rancho Palos Verdes?
Median Population Age in Rancho Palos Verdes is 49.8 Years.
What is the Average Family Size in Rancho Palos Verdes
Average Family Size in Rancho Palos Verdes is 3.1 People.
What is the Average Household Size in Rancho Palos Verdes
Average Household Size in Rancho Palos Verdes is 2.7 People.
How Large is the Labor Force in Rancho Palos Verdes?
There are 19,221 People in the Labor Forcein in Rancho Palos Verdes.
What is the Percentage of People in the Labor Force in Rancho Palos Verdes?
56.0% of People are in the Labor Force in Rancho Palos Verdes.
What is the Unemployment Rate in Rancho Palos Verdes?
Unemployment Rate in Rancho Palos Verdes is 5.1%.