Des Plaines, IL Map & Demographics
Des Plaines Map
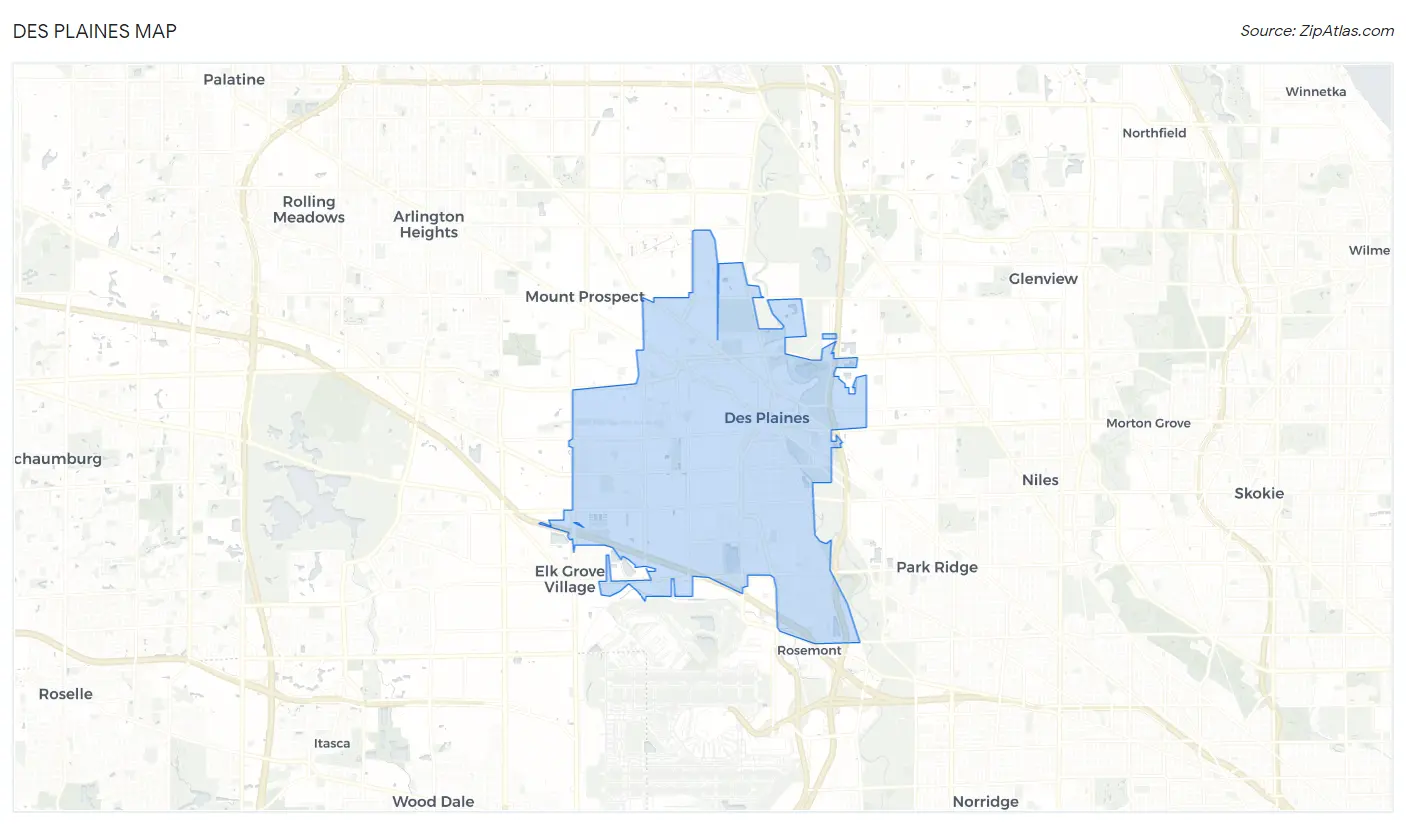
Des Plaines Overview
$42,057
PER CAPITA INCOME
$106,684
AVG FAMILY INCOME
$86,552
AVG HOUSEHOLD INCOME
30.5%
WAGE / INCOME GAP [ % ]
69.5¢/ $1
WAGE / INCOME GAP [ $ ]
$13,986
FAMILY INCOME DEFICIT
0.42
INEQUALITY / GINI INDEX
60,087
TOTAL POPULATION
29,437
MALE POPULATION
30,650
FEMALE POPULATION
96.04
MALES / 100 FEMALES
104.12
FEMALES / 100 MALES
42.5
MEDIAN AGE
3.2
AVG FAMILY SIZE
2.6
AVG HOUSEHOLD SIZE
32,154
LABOR FORCE [ PEOPLE ]
65.3%
PERCENT IN LABOR FORCE
4.6%
UNEMPLOYMENT RATE
Income in Des Plaines
Income Overview in Des Plaines
Per Capita Income in Des Plaines is $42,057, while median incomes of families and households are $106,684 and $86,552 respectively.
| Characteristic | Number | Measure |
| Per Capita Income | 60,087 | $42,057 |
| Median Family Income | 15,326 | $106,684 |
| Mean Family Income | 15,326 | $125,180 |
| Median Household Income | 22,887 | $86,552 |
| Mean Household Income | 22,887 | $108,646 |
| Income Deficit | 15,326 | $13,986 |
| Wage / Income Gap (%) | 60,087 | 30.52% |
| Wage / Income Gap ($) | 60,087 | 69.48¢ per $1 |
| Gini / Inequality Index | 60,087 | 0.42 |
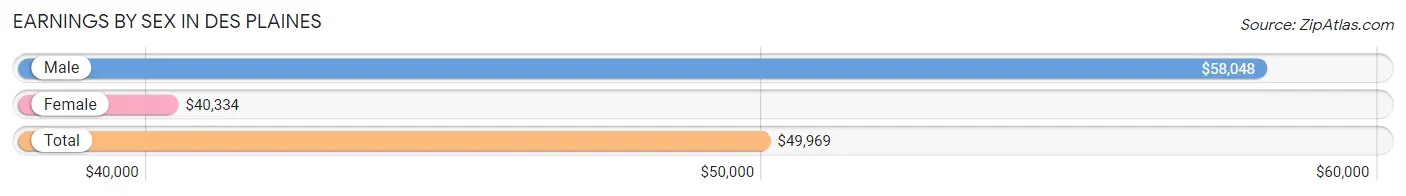
Earnings by Sex in Des Plaines
Average Earnings in Des Plaines are $49,969, $58,048 for men and $40,334 for women, a difference of 30.5%.
| Sex | Number | Average Earnings |
| Male | 17,389 (53.6%) | $58,048 |
| Female | 15,025 (46.4%) | $40,334 |
| Total | 32,414 (100.0%) | $49,969 |
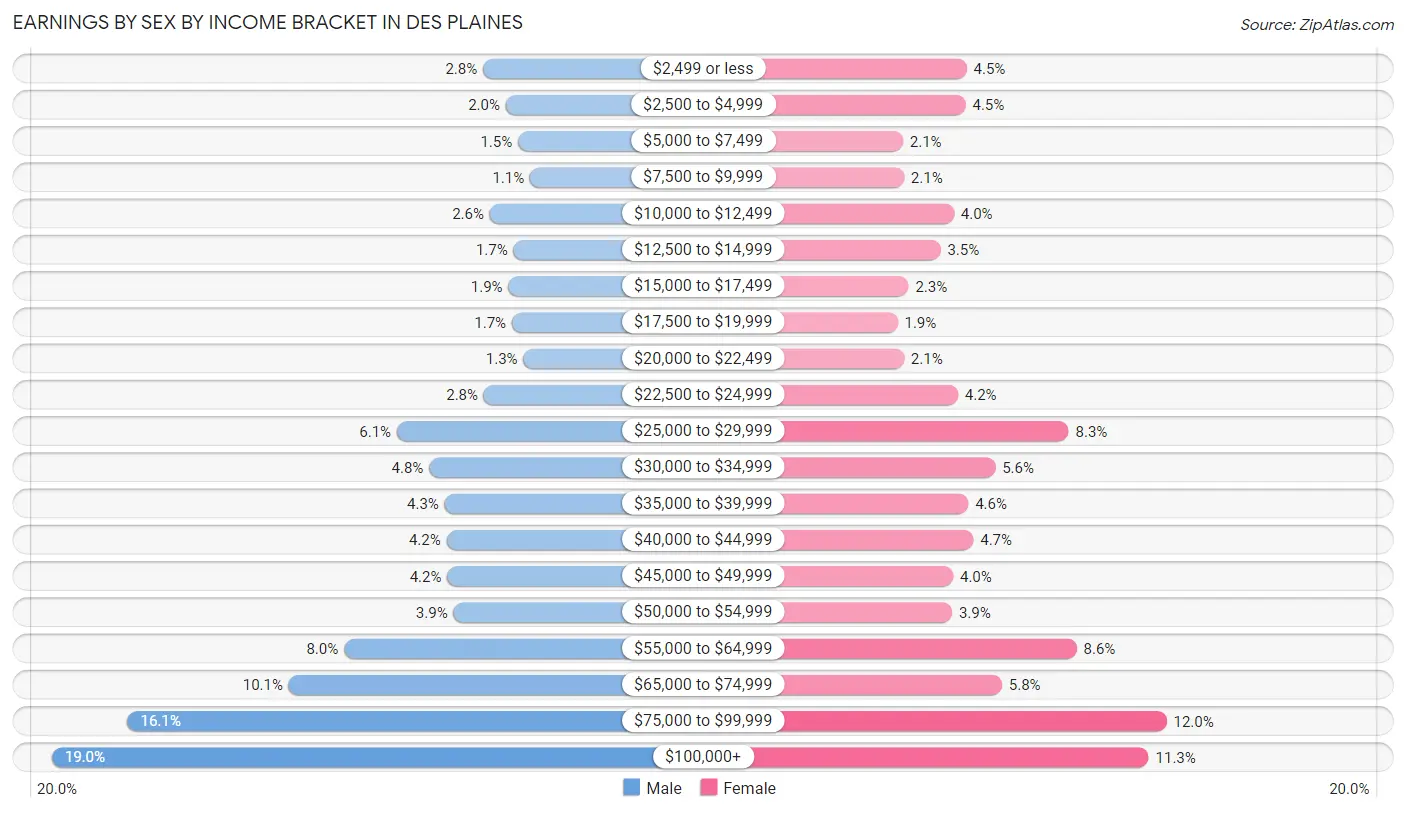
Earnings by Sex by Income Bracket in Des Plaines
The most common earnings brackets in Des Plaines are $100,000+ for men (3,300 | 19.0%) and $75,000 to $99,999 for women (1,800 | 12.0%).
| Income | Male | Female |
| $2,499 or less | 491 (2.8%) | 675 (4.5%) |
| $2,500 to $4,999 | 343 (2.0%) | 669 (4.4%) |
| $5,000 to $7,499 | 262 (1.5%) | 315 (2.1%) |
| $7,500 to $9,999 | 184 (1.1%) | 322 (2.1%) |
| $10,000 to $12,499 | 447 (2.6%) | 603 (4.0%) |
| $12,500 to $14,999 | 292 (1.7%) | 527 (3.5%) |
| $15,000 to $17,499 | 325 (1.9%) | 347 (2.3%) |
| $17,500 to $19,999 | 303 (1.7%) | 286 (1.9%) |
| $20,000 to $22,499 | 227 (1.3%) | 322 (2.1%) |
| $22,500 to $24,999 | 486 (2.8%) | 625 (4.2%) |
| $25,000 to $29,999 | 1,052 (6.0%) | 1,248 (8.3%) |
| $30,000 to $34,999 | 841 (4.8%) | 836 (5.6%) |
| $35,000 to $39,999 | 741 (4.3%) | 683 (4.5%) |
| $40,000 to $44,999 | 729 (4.2%) | 712 (4.7%) |
| $45,000 to $49,999 | 723 (4.2%) | 598 (4.0%) |
| $50,000 to $54,999 | 683 (3.9%) | 592 (3.9%) |
| $55,000 to $64,999 | 1,397 (8.0%) | 1,293 (8.6%) |
| $65,000 to $74,999 | 1,757 (10.1%) | 873 (5.8%) |
| $75,000 to $99,999 | 2,806 (16.1%) | 1,800 (12.0%) |
| $100,000+ | 3,300 (19.0%) | 1,699 (11.3%) |
| Total | 17,389 (100.0%) | 15,025 (100.0%) |
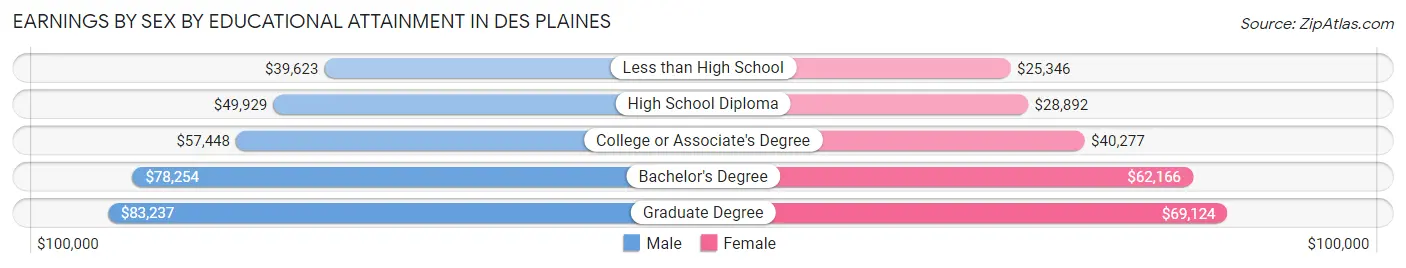
Earnings by Sex by Educational Attainment in Des Plaines
Average earnings in Des Plaines are $64,786 for men and $46,260 for women, a difference of 28.6%. Men with an educational attainment of graduate degree enjoy the highest average annual earnings of $83,237, while those with less than high school education earn the least with $39,623. Women with an educational attainment of graduate degree earn the most with the average annual earnings of $69,124, while those with less than high school education have the smallest earnings of $25,346.
| Educational Attainment | Male Income | Female Income |
| Less than High School | $39,623 | $25,346 |
| High School Diploma | $49,929 | $28,892 |
| College or Associate's Degree | $57,448 | $40,277 |
| Bachelor's Degree | $78,254 | $62,166 |
| Graduate Degree | $83,237 | $69,124 |
| Total | $64,786 | $46,260 |
Family Income in Des Plaines
Family Income Brackets in Des Plaines
According to the Des Plaines family income data, there are 3,893 families falling into the $100,000 to $149,999 income range, which is the most common income bracket and makes up 25.4% of all families. Conversely, the $10,000 to $14,999 income bracket is the least frequent group with only 77 families (0.5%) belonging to this category.
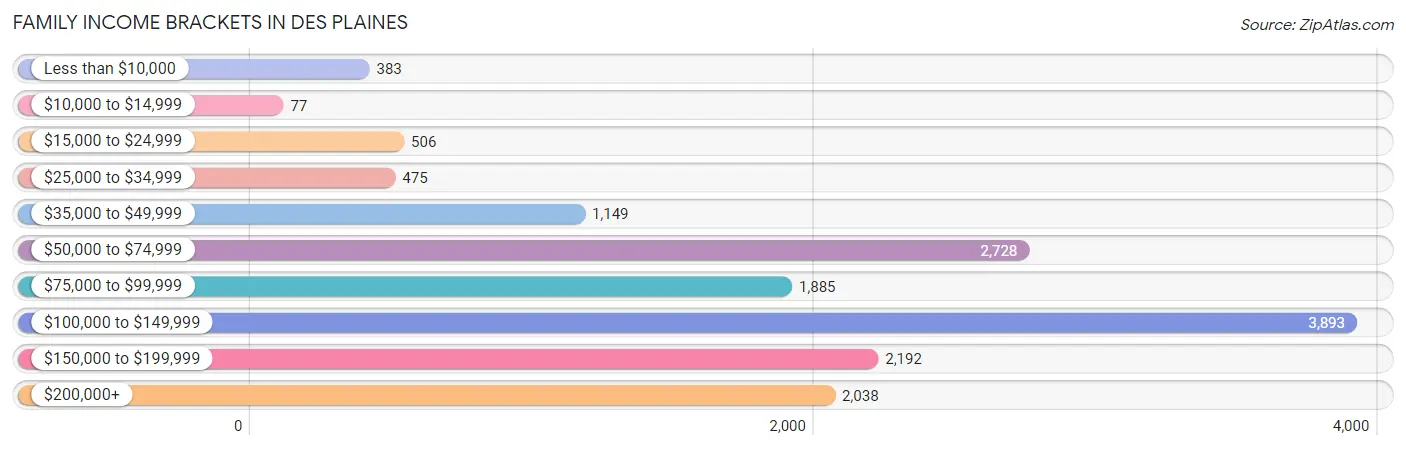
| Income Bracket | # Families | % Families |
| Less than $10,000 | 383 | 2.5% |
| $10,000 to $14,999 | 77 | 0.5% |
| $15,000 to $24,999 | 506 | 3.3% |
| $25,000 to $34,999 | 475 | 3.1% |
| $35,000 to $49,999 | 1,149 | 7.5% |
| $50,000 to $74,999 | 2,728 | 17.8% |
| $75,000 to $99,999 | 1,885 | 12.3% |
| $100,000 to $149,999 | 3,893 | 25.4% |
| $150,000 to $199,999 | 2,192 | 14.3% |
| $200,000+ | 2,038 | 13.3% |
Family Income by Famaliy Size in Des Plaines
5-person families (1,278 | 8.3%) account for the highest median family income in Des Plaines with $141,835 per family, while 2-person families (6,555 | 42.8%) have the highest median income of $45,286 per family member.
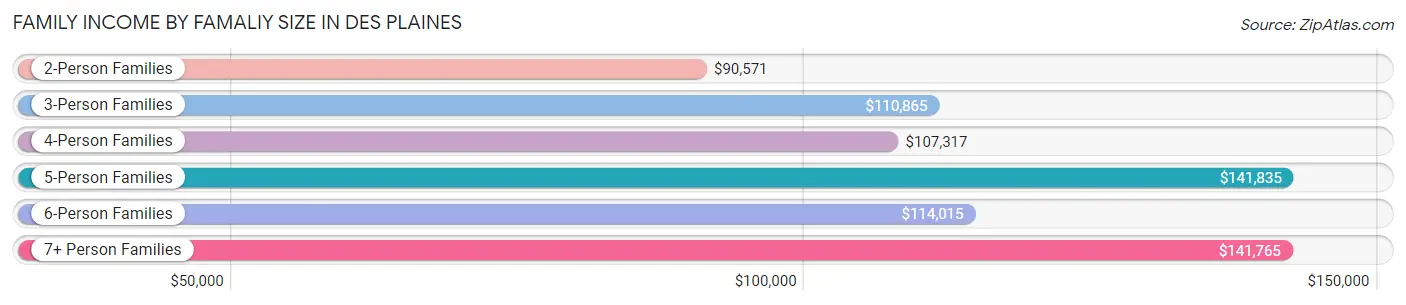
| Income Bracket | # Families | Median Income |
| 2-Person Families | 6,555 (42.8%) | $90,571 |
| 3-Person Families | 3,687 (24.1%) | $110,865 |
| 4-Person Families | 3,080 (20.1%) | $107,317 |
| 5-Person Families | 1,278 (8.3%) | $141,835 |
| 6-Person Families | 446 (2.9%) | $114,015 |
| 7+ Person Families | 280 (1.8%) | $141,765 |
| Total | 15,326 (100.0%) | $106,684 |
Family Income by Number of Earners in Des Plaines
The median family income in Des Plaines is $106,684, with families comprising 3+ earners (2,593) having the highest median family income of $146,121, while families with no earners (1,821) have the lowest median family income of $47,043, accounting for 16.9% and 11.9% of families, respectively.
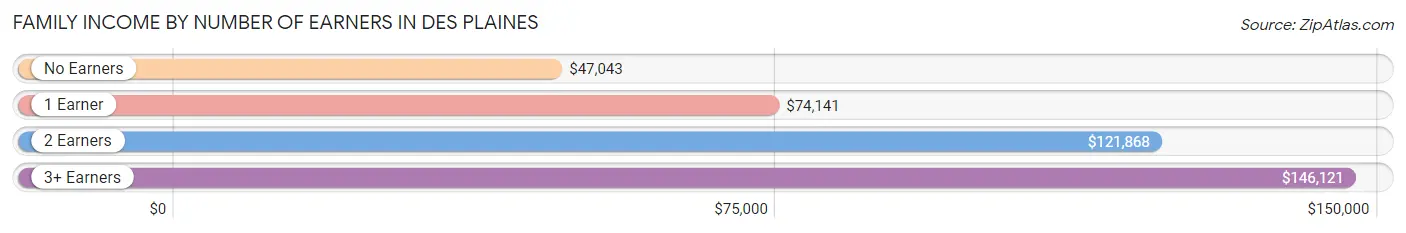
| Number of Earners | # Families | Median Income |
| No Earners | 1,821 (11.9%) | $47,043 |
| 1 Earner | 4,614 (30.1%) | $74,141 |
| 2 Earners | 6,298 (41.1%) | $121,868 |
| 3+ Earners | 2,593 (16.9%) | $146,121 |
| Total | 15,326 (100.0%) | $106,684 |
Household Income in Des Plaines
Household Income Brackets in Des Plaines
With 5,012 households falling in the category, the $100,000 to $149,999 income range is the most frequent in Des Plaines, accounting for 21.9% of all households. In contrast, only 435 households (1.9%) fall into the $10,000 to $14,999 income bracket, making it the least populous group.
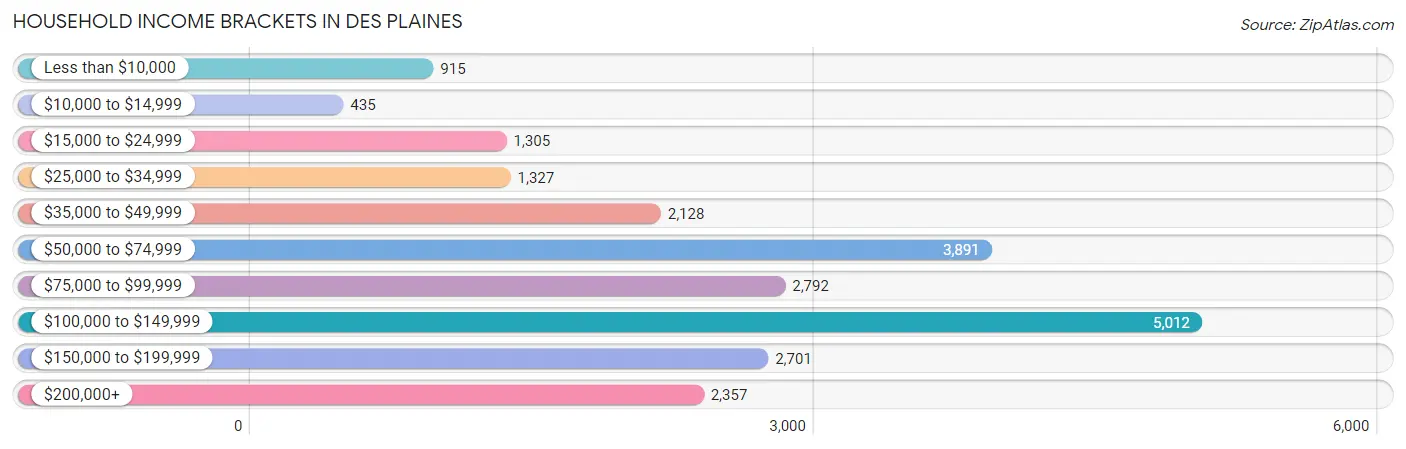
| Income Bracket | # Households | % Households |
| Less than $10,000 | 915 | 4.0% |
| $10,000 to $14,999 | 435 | 1.9% |
| $15,000 to $24,999 | 1,305 | 5.7% |
| $25,000 to $34,999 | 1,327 | 5.8% |
| $35,000 to $49,999 | 2,128 | 9.3% |
| $50,000 to $74,999 | 3,891 | 17.0% |
| $75,000 to $99,999 | 2,792 | 12.2% |
| $100,000 to $149,999 | 5,012 | 21.9% |
| $150,000 to $199,999 | 2,701 | 11.8% |
| $200,000+ | 2,357 | 10.3% |
Household Income by Householder Age in Des Plaines
The median household income in Des Plaines is $86,552, with the highest median household income of $105,854 found in the 25 to 44 years age bracket for the primary householder. A total of 6,466 households (28.2%) fall into this category. Meanwhile, the 15 to 24 years age bracket for the primary householder has the lowest median household income of $0, with 139 households (0.6%) in this group.
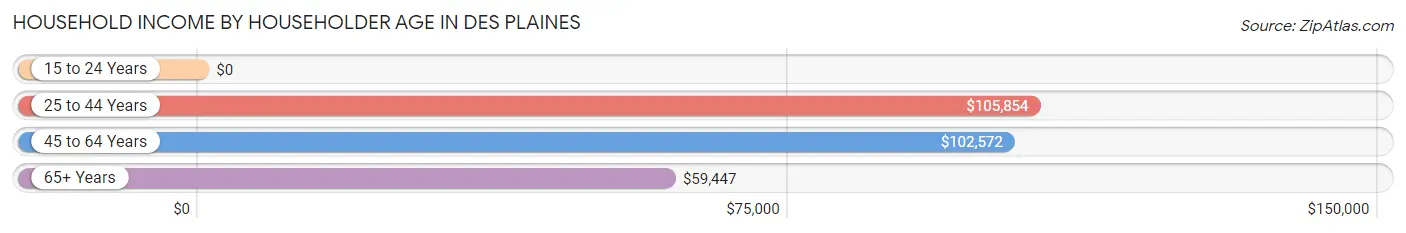
| Income Bracket | # Households | Median Income |
| 15 to 24 Years | 139 (0.6%) | $0 |
| 25 to 44 Years | 6,466 (28.2%) | $105,854 |
| 45 to 64 Years | 9,237 (40.4%) | $102,572 |
| 65+ Years | 7,045 (30.8%) | $59,447 |
| Total | 22,887 (100.0%) | $86,552 |
Poverty in Des Plaines
Income Below Poverty by Sex and Age in Des Plaines
With 7.0% poverty level for males and 7.9% for females among the residents of Des Plaines, 16 and 17 year old males and 6 to 11 year old females are the most vulnerable to poverty, with 190 males (26.7%) and 268 females (12.0%) in their respective age groups living below the poverty level.
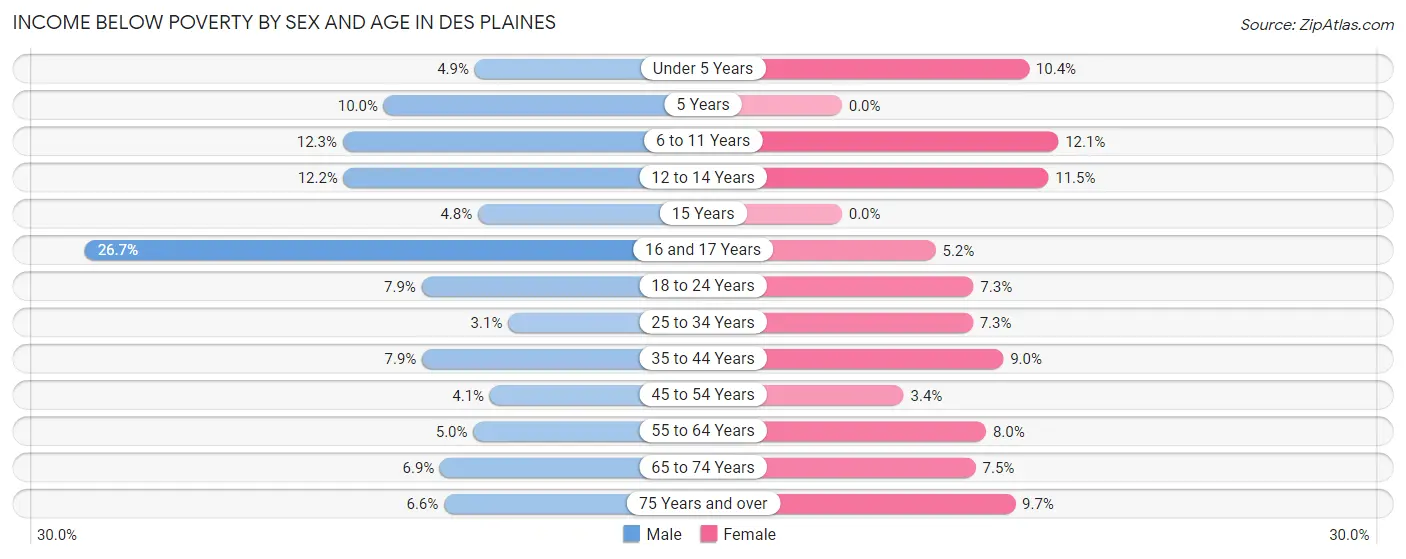
| Age Bracket | Male | Female |
| Under 5 Years | 70 (4.9%) | 173 (10.4%) |
| 5 Years | 28 (10.0%) | 0 (0.0%) |
| 6 to 11 Years | 276 (12.3%) | 268 (12.0%) |
| 12 to 14 Years | 139 (12.2%) | 108 (11.5%) |
| 15 Years | 17 (4.8%) | 0 (0.0%) |
| 16 and 17 Years | 190 (26.7%) | 36 (5.2%) |
| 18 to 24 Years | 167 (7.9%) | 149 (7.3%) |
| 25 to 34 Years | 121 (3.1%) | 262 (7.3%) |
| 35 to 44 Years | 303 (7.9%) | 341 (9.0%) |
| 45 to 54 Years | 148 (4.1%) | 132 (3.4%) |
| 55 to 64 Years | 212 (5.0%) | 367 (8.0%) |
| 65 to 74 Years | 202 (6.9%) | 227 (7.4%) |
| 75 Years and over | 132 (6.6%) | 321 (9.7%) |
| Total | 2,005 (7.0%) | 2,384 (7.9%) |
Income Above Poverty by Sex and Age in Des Plaines
According to the poverty statistics in Des Plaines, males aged 25 to 34 years and females aged 5 years are the age groups that are most secure financially, with 96.9% of males and 100.0% of females in these age groups living above the poverty line.
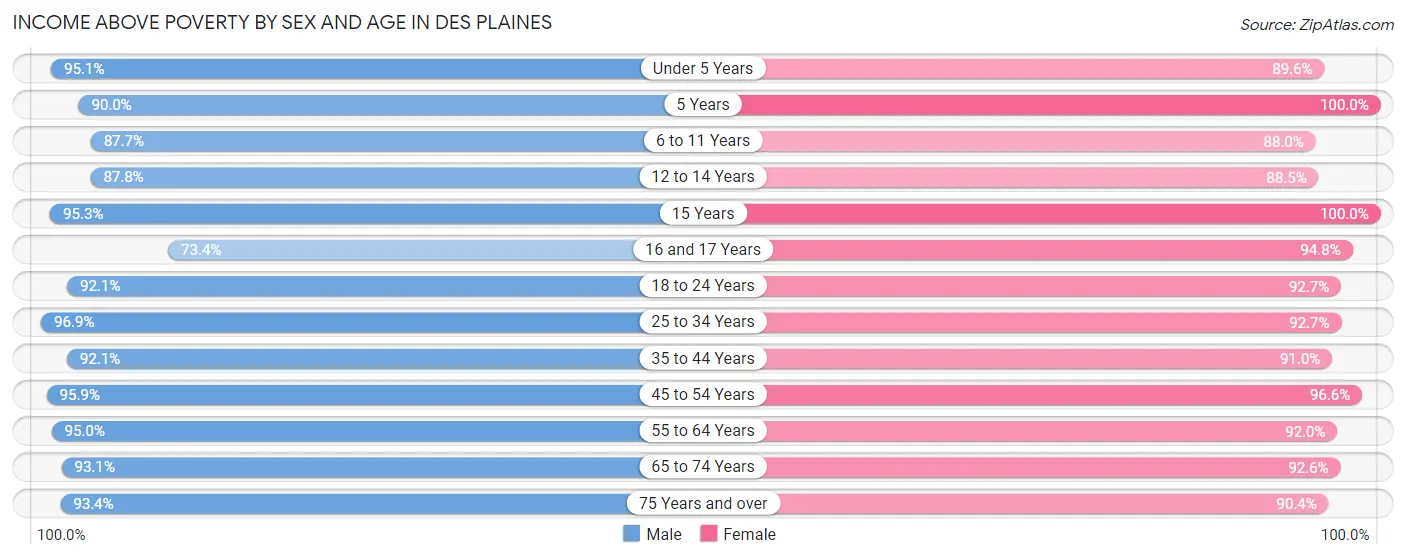
| Age Bracket | Male | Female |
| Under 5 Years | 1,349 (95.1%) | 1,487 (89.6%) |
| 5 Years | 252 (90.0%) | 158 (100.0%) |
| 6 to 11 Years | 1,972 (87.7%) | 1,956 (87.9%) |
| 12 to 14 Years | 998 (87.8%) | 831 (88.5%) |
| 15 Years | 341 (95.3%) | 315 (100.0%) |
| 16 and 17 Years | 523 (73.4%) | 654 (94.8%) |
| 18 to 24 Years | 1,949 (92.1%) | 1,885 (92.7%) |
| 25 to 34 Years | 3,818 (96.9%) | 3,330 (92.7%) |
| 35 to 44 Years | 3,550 (92.1%) | 3,452 (91.0%) |
| 45 to 54 Years | 3,468 (95.9%) | 3,701 (96.6%) |
| 55 to 64 Years | 4,022 (95.0%) | 4,201 (92.0%) |
| 65 to 74 Years | 2,741 (93.1%) | 2,819 (92.5%) |
| 75 Years and over | 1,857 (93.4%) | 3,006 (90.3%) |
| Total | 26,840 (93.0%) | 27,795 (92.1%) |
Income Below Poverty Among Married-Couple Families in Des Plaines
The poverty statistics for married-couple families in Des Plaines show that 3.6% or 424 of the total 11,652 families live below the poverty line. Families with 5 or more children have the highest poverty rate of 39.6%, comprising of 42 families. On the other hand, families with no children have the lowest poverty rate of 2.3%, which includes 157 families.
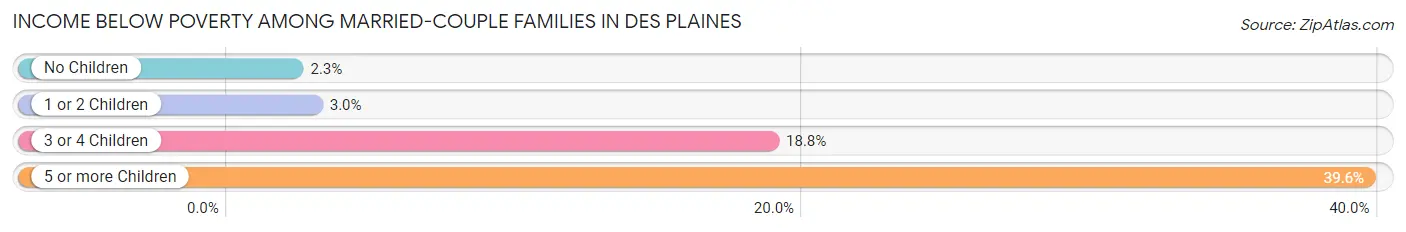
| Children | Above Poverty | Below Poverty |
| No Children | 6,735 (97.7%) | 157 (2.3%) |
| 1 or 2 Children | 3,981 (97.1%) | 121 (2.9%) |
| 3 or 4 Children | 448 (81.2%) | 104 (18.8%) |
| 5 or more Children | 64 (60.4%) | 42 (39.6%) |
| Total | 11,228 (96.4%) | 424 (3.6%) |
Income Below Poverty Among Single-Parent Households in Des Plaines
According to the poverty data in Des Plaines, 8.9% or 102 single-father households and 9.5% or 241 single-mother households are living below the poverty line. Among single-father households, those with 1 or 2 children have the highest poverty rate, with 88 households (15.3%) experiencing poverty. Likewise, among single-mother households, those with 3 or 4 children have the highest poverty rate, with 47 households (26.4%) falling below the poverty line.
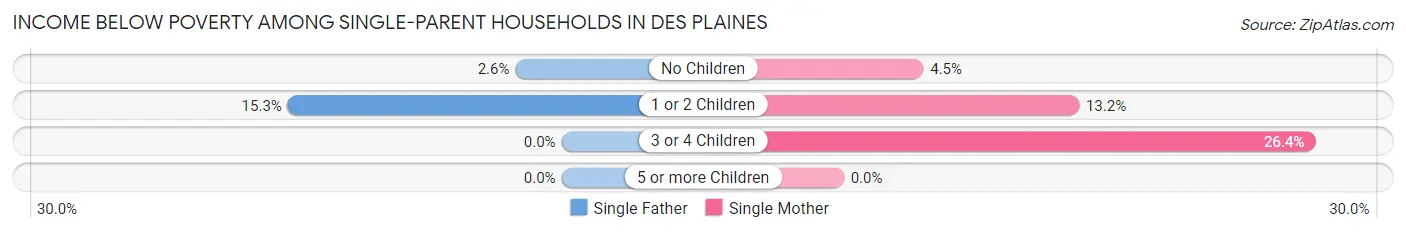
| Children | Single Father | Single Mother |
| No Children | 14 (2.6%) | 59 (4.4%) |
| 1 or 2 Children | 88 (15.3%) | 135 (13.2%) |
| 3 or 4 Children | 0 (0.0%) | 47 (26.4%) |
| 5 or more Children | 0 (0.0%) | 0 (0.0%) |
| Total | 102 (8.9%) | 241 (9.5%) |
Income Below Poverty Among Married-Couple vs Single-Parent Households in Des Plaines
The poverty data for Des Plaines shows that 424 of the married-couple family households (3.6%) and 343 of the single-parent households (9.3%) are living below the poverty level. Within the married-couple family households, those with 5 or more children have the highest poverty rate, with 42 households (39.6%) falling below the poverty line. Among the single-parent households, those with 3 or 4 children have the highest poverty rate, with 47 household (23.0%) living below poverty.
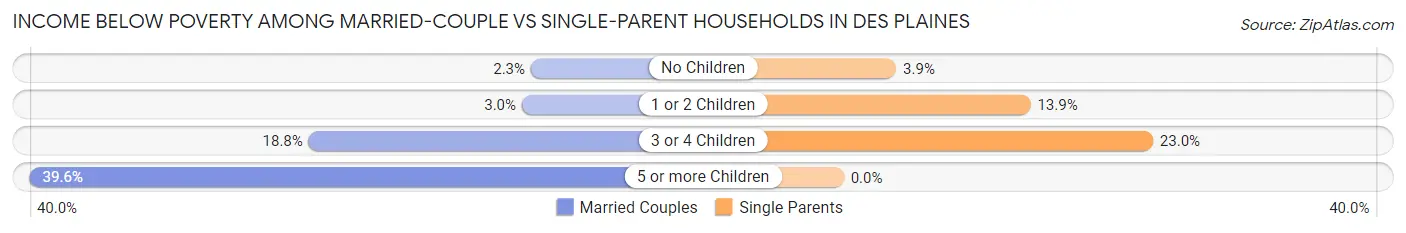
| Children | Married-Couple Families | Single-Parent Households |
| No Children | 157 (2.3%) | 73 (3.9%) |
| 1 or 2 Children | 121 (2.9%) | 223 (13.9%) |
| 3 or 4 Children | 104 (18.8%) | 47 (23.0%) |
| 5 or more Children | 42 (39.6%) | 0 (0.0%) |
| Total | 424 (3.6%) | 343 (9.3%) |
Race in Des Plaines
The most populous races in Des Plaines are White / Caucasian (39,913 | 66.4%), Hispanic or Latino (12,449 | 20.7%), and Asian (7,942 | 13.2%).
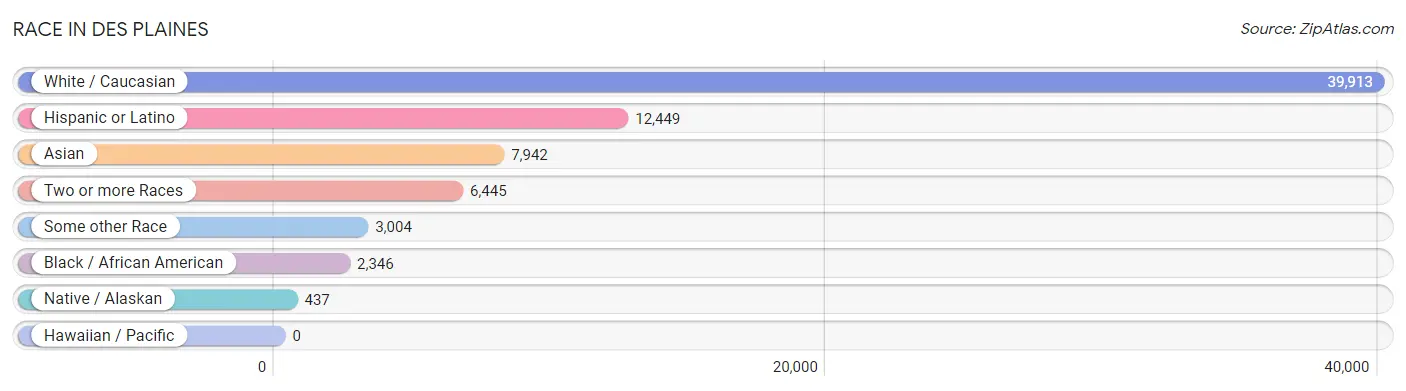
| Race | # Population | % Population |
| Asian | 7,942 | 13.2% |
| Black / African American | 2,346 | 3.9% |
| Hawaiian / Pacific | 0 | 0.0% |
| Hispanic or Latino | 12,449 | 20.7% |
| Native / Alaskan | 437 | 0.7% |
| White / Caucasian | 39,913 | 66.4% |
| Two or more Races | 6,445 | 10.7% |
| Some other Race | 3,004 | 5.0% |
| Total | 60,087 | 100.0% |
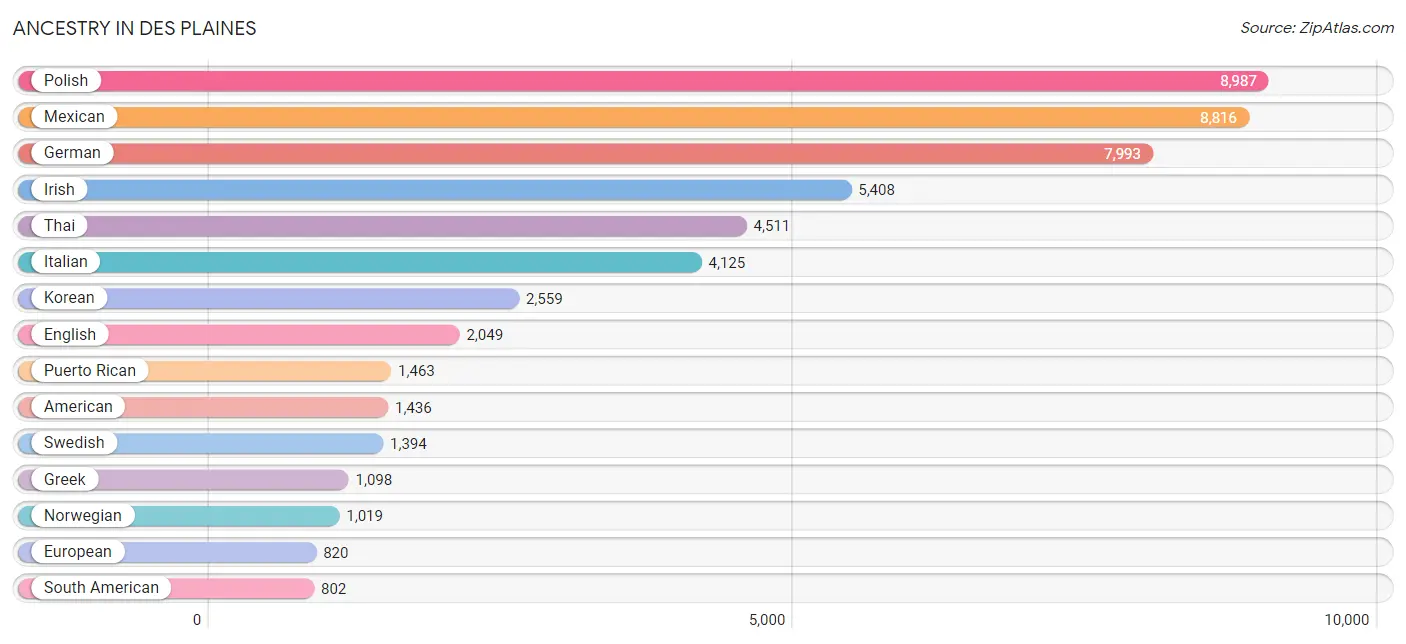
Ancestry in Des Plaines
The most populous ancestries reported in Des Plaines are Polish (8,987 | 15.0%), Mexican (8,816 | 14.7%), German (7,993 | 13.3%), Irish (5,408 | 9.0%), and Thai (4,511 | 7.5%), together accounting for 59.4% of all Des Plaines residents.
| Ancestry | # Population | % Population |
| African | 85 | 0.1% |
| Albanian | 59 | 0.1% |
| American | 1,436 | 2.4% |
| Arab | 747 | 1.2% |
| Argentinean | 19 | 0.0% |
| Armenian | 78 | 0.1% |
| Assyrian / Chaldean / Syriac | 256 | 0.4% |
| Austrian | 247 | 0.4% |
| Bangladeshi | 8 | 0.0% |
| Belgian | 86 | 0.1% |
| Belizean | 11 | 0.0% |
| Bhutanese | 111 | 0.2% |
| Blackfeet | 23 | 0.0% |
| Bolivian | 28 | 0.1% |
| Brazilian | 15 | 0.0% |
| British | 141 | 0.2% |
| Bulgarian | 536 | 0.9% |
| Burmese | 514 | 0.9% |
| Cambodian | 10 | 0.0% |
| Canadian | 13 | 0.0% |
| Central American | 700 | 1.2% |
| Central American Indian | 79 | 0.1% |
| Cherokee | 140 | 0.2% |
| Chippewa | 3 | 0.0% |
| Colombian | 288 | 0.5% |
| Creek | 3 | 0.0% |
| Croatian | 204 | 0.3% |
| Cuban | 203 | 0.3% |
| Czech | 631 | 1.1% |
| Czechoslovakian | 22 | 0.0% |
| Danish | 335 | 0.6% |
| Dominican | 12 | 0.0% |
| Dutch | 327 | 0.5% |
| Eastern European | 134 | 0.2% |
| Ecuadorian | 182 | 0.3% |
| Egyptian | 9 | 0.0% |
| English | 2,049 | 3.4% |
| European | 820 | 1.4% |
| Finnish | 113 | 0.2% |
| French | 714 | 1.2% |
| French Canadian | 114 | 0.2% |
| German | 7,993 | 13.3% |
| Greek | 1,098 | 1.8% |
| Guamanian / Chamorro | 26 | 0.0% |
| Guatemalan | 301 | 0.5% |
| Haitian | 136 | 0.2% |
| Honduran | 110 | 0.2% |
| Hungarian | 202 | 0.3% |
| Indian (Asian) | 510 | 0.9% |
| Iranian | 24 | 0.0% |
| Iraqi | 388 | 0.6% |
| Irish | 5,408 | 9.0% |
| Israeli | 20 | 0.0% |
| Italian | 4,125 | 6.9% |
| Jamaican | 132 | 0.2% |
| Japanese | 5 | 0.0% |
| Jordanian | 70 | 0.1% |
| Kenyan | 1 | 0.0% |
| Korean | 2,559 | 4.3% |
| Laotian | 11 | 0.0% |
| Latvian | 69 | 0.1% |
| Lebanese | 100 | 0.2% |
| Lithuanian | 424 | 0.7% |
| Luxembourger | 41 | 0.1% |
| Macedonian | 97 | 0.2% |
| Malaysian | 24 | 0.0% |
| Mexican | 8,816 | 14.7% |
| Mexican American Indian | 215 | 0.4% |
| Moroccan | 29 | 0.1% |
| New Zealander | 8 | 0.0% |
| Nigerian | 106 | 0.2% |
| Northern European | 80 | 0.1% |
| Norwegian | 1,019 | 1.7% |
| Pakistani | 126 | 0.2% |
| Palestinian | 18 | 0.0% |
| Panamanian | 18 | 0.0% |
| Peruvian | 90 | 0.2% |
| Polish | 8,987 | 15.0% |
| Portuguese | 40 | 0.1% |
| Puerto Rican | 1,463 | 2.4% |
| Romanian | 634 | 1.1% |
| Russian | 706 | 1.2% |
| Salvadoran | 271 | 0.4% |
| Samoan | 31 | 0.1% |
| Scandinavian | 95 | 0.2% |
| Scotch-Irish | 91 | 0.2% |
| Scottish | 328 | 0.5% |
| Serbian | 389 | 0.6% |
| Sioux | 3 | 0.0% |
| Slavic | 65 | 0.1% |
| Slovak | 284 | 0.5% |
| Slovene | 40 | 0.1% |
| South African | 6 | 0.0% |
| South American | 802 | 1.3% |
| South American Indian | 27 | 0.0% |
| Spaniard | 102 | 0.2% |
| Spanish | 126 | 0.2% |
| Sri Lankan | 108 | 0.2% |
| Subsaharan African | 284 | 0.5% |
| Swedish | 1,394 | 2.3% |
| Swiss | 68 | 0.1% |
| Syrian | 21 | 0.0% |
| Thai | 4,511 | 7.5% |
| Turkish | 17 | 0.0% |
| Ugandan | 45 | 0.1% |
| Ukrainian | 790 | 1.3% |
| Venezuelan | 67 | 0.1% |
| Vietnamese | 33 | 0.1% |
| Welsh | 127 | 0.2% |
| Yugoslavian | 495 | 0.8% | View All 110 Rows |
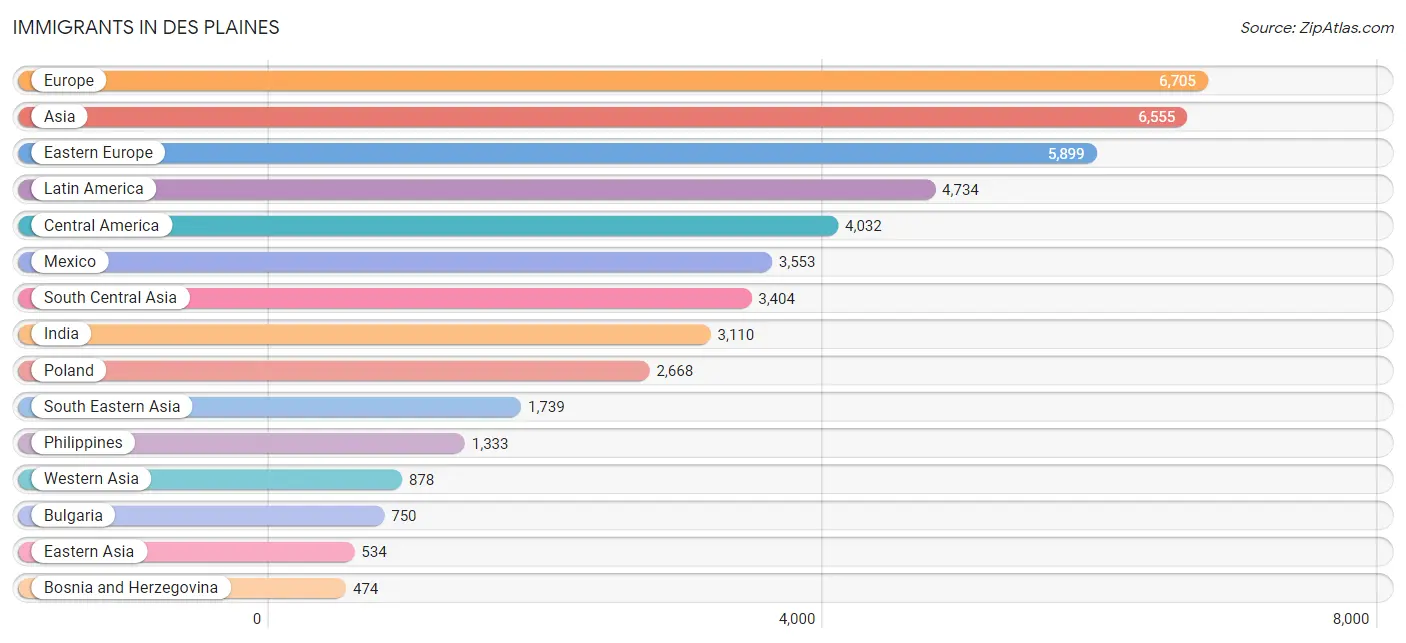
Immigrants in Des Plaines
The most numerous immigrant groups reported in Des Plaines came from Europe (6,705 | 11.2%), Asia (6,555 | 10.9%), Eastern Europe (5,899 | 9.8%), Latin America (4,734 | 7.9%), and Central America (4,032 | 6.7%), together accounting for 46.5% of all Des Plaines residents.
| Immigration Origin | # Population | % Population |
| Africa | 420 | 0.7% |
| Albania | 16 | 0.0% |
| Argentina | 37 | 0.1% |
| Asia | 6,555 | 10.9% |
| Austria | 36 | 0.1% |
| Bangladesh | 33 | 0.1% |
| Belarus | 210 | 0.4% |
| Belize | 11 | 0.0% |
| Bosnia and Herzegovina | 474 | 0.8% |
| Brazil | 23 | 0.0% |
| Bulgaria | 750 | 1.3% |
| Cambodia | 5 | 0.0% |
| Canada | 73 | 0.1% |
| Caribbean | 276 | 0.5% |
| Central America | 4,032 | 6.7% |
| China | 80 | 0.1% |
| Colombia | 165 | 0.3% |
| Croatia | 25 | 0.0% |
| Cuba | 17 | 0.0% |
| Czechoslovakia | 118 | 0.2% |
| Eastern Africa | 55 | 0.1% |
| Eastern Asia | 534 | 0.9% |
| Eastern Europe | 5,899 | 9.8% |
| Ecuador | 136 | 0.2% |
| El Salvador | 254 | 0.4% |
| England | 46 | 0.1% |
| Europe | 6,705 | 11.2% |
| France | 21 | 0.0% |
| Germany | 269 | 0.4% |
| Greece | 193 | 0.3% |
| Guatemala | 119 | 0.2% |
| Haiti | 108 | 0.2% |
| Honduras | 49 | 0.1% |
| Hong Kong | 8 | 0.0% |
| Hungary | 25 | 0.0% |
| India | 3,110 | 5.2% |
| Indonesia | 11 | 0.0% |
| Iran | 24 | 0.0% |
| Iraq | 365 | 0.6% |
| Ireland | 37 | 0.1% |
| Israel | 13 | 0.0% |
| Italy | 134 | 0.2% |
| Jamaica | 151 | 0.3% |
| Japan | 25 | 0.0% |
| Jordan | 67 | 0.1% |
| Kazakhstan | 18 | 0.0% |
| Kenya | 1 | 0.0% |
| Korea | 419 | 0.7% |
| Latin America | 4,734 | 7.9% |
| Lithuania | 11 | 0.0% |
| Mexico | 3,553 | 5.9% |
| Middle Africa | 31 | 0.1% |
| Moldova | 13 | 0.0% |
| Morocco | 10 | 0.0% |
| Netherlands | 17 | 0.0% |
| Nicaragua | 17 | 0.0% |
| Nigeria | 141 | 0.2% |
| North Macedonia | 123 | 0.2% |
| Northern Africa | 176 | 0.3% |
| Northern Europe | 136 | 0.2% |
| Norway | 9 | 0.0% |
| Oceania | 8 | 0.0% |
| Pakistan | 177 | 0.3% |
| Panama | 29 | 0.1% |
| Philippines | 1,333 | 2.2% |
| Poland | 2,668 | 4.4% |
| Romania | 385 | 0.6% |
| Russia | 186 | 0.3% |
| Saudi Arabia | 50 | 0.1% |
| Scotland | 22 | 0.0% |
| Serbia | 209 | 0.4% |
| South Africa | 6 | 0.0% |
| South America | 426 | 0.7% |
| South Central Asia | 3,404 | 5.7% |
| South Eastern Asia | 1,739 | 2.9% |
| Southern Europe | 327 | 0.5% |
| Sweden | 11 | 0.0% |
| Syria | 145 | 0.2% |
| Taiwan | 10 | 0.0% |
| Thailand | 106 | 0.2% |
| Turkey | 88 | 0.2% |
| Uganda | 35 | 0.1% |
| Ukraine | 392 | 0.6% |
| Venezuela | 65 | 0.1% |
| Vietnam | 266 | 0.4% |
| Western Africa | 141 | 0.2% |
| Western Asia | 878 | 1.5% |
| Western Europe | 343 | 0.6% |
| Zimbabwe | 10 | 0.0% | View All 89 Rows |
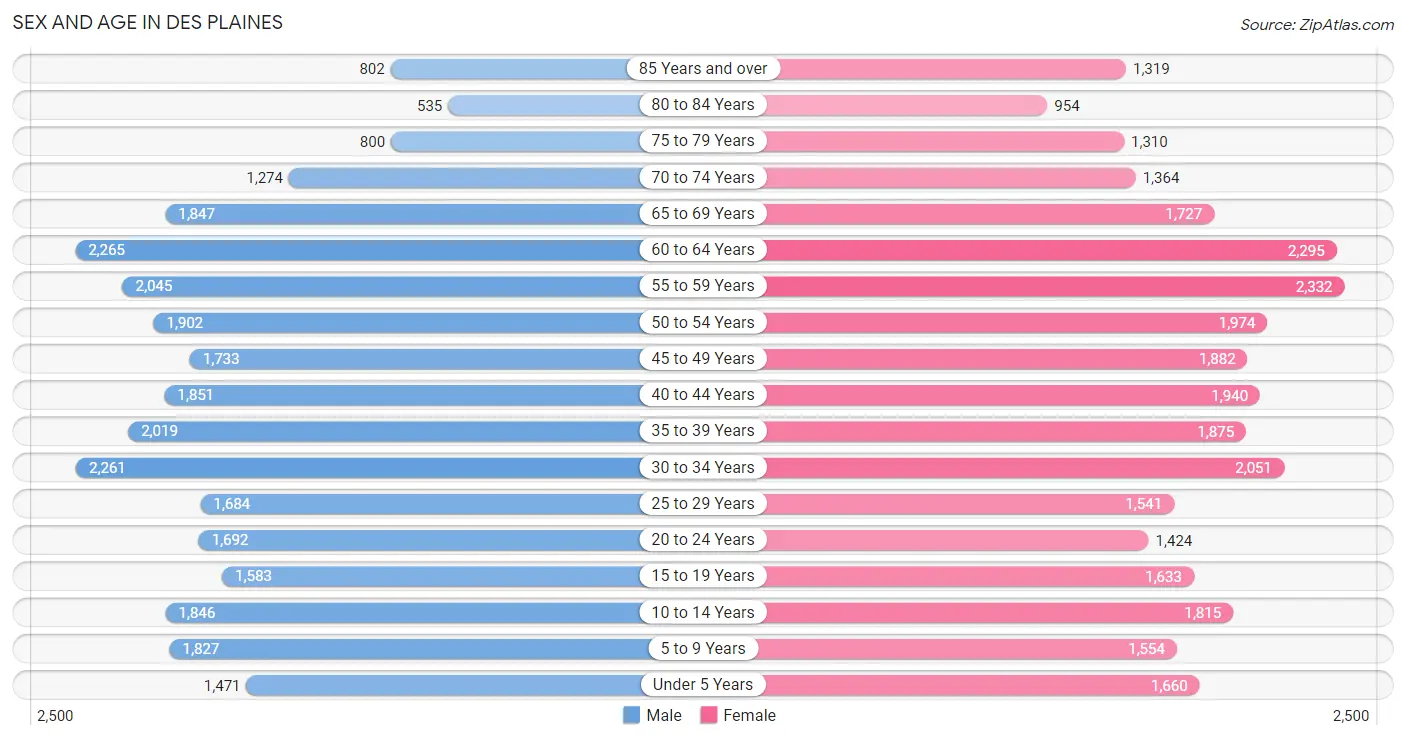
Sex and Age in Des Plaines
Sex and Age in Des Plaines
The most populous age groups in Des Plaines are 60 to 64 Years (2,265 | 7.7%) for men and 55 to 59 Years (2,332 | 7.6%) for women.
| Age Bracket | Male | Female |
| Under 5 Years | 1,471 (5.0%) | 1,660 (5.4%) |
| 5 to 9 Years | 1,827 (6.2%) | 1,554 (5.1%) |
| 10 to 14 Years | 1,846 (6.3%) | 1,815 (5.9%) |
| 15 to 19 Years | 1,583 (5.4%) | 1,633 (5.3%) |
| 20 to 24 Years | 1,692 (5.8%) | 1,424 (4.6%) |
| 25 to 29 Years | 1,684 (5.7%) | 1,541 (5.0%) |
| 30 to 34 Years | 2,261 (7.7%) | 2,051 (6.7%) |
| 35 to 39 Years | 2,019 (6.9%) | 1,875 (6.1%) |
| 40 to 44 Years | 1,851 (6.3%) | 1,940 (6.3%) |
| 45 to 49 Years | 1,733 (5.9%) | 1,882 (6.1%) |
| 50 to 54 Years | 1,902 (6.5%) | 1,974 (6.4%) |
| 55 to 59 Years | 2,045 (7.0%) | 2,332 (7.6%) |
| 60 to 64 Years | 2,265 (7.7%) | 2,295 (7.5%) |
| 65 to 69 Years | 1,847 (6.3%) | 1,727 (5.6%) |
| 70 to 74 Years | 1,274 (4.3%) | 1,364 (4.4%) |
| 75 to 79 Years | 800 (2.7%) | 1,310 (4.3%) |
| 80 to 84 Years | 535 (1.8%) | 954 (3.1%) |
| 85 Years and over | 802 (2.7%) | 1,319 (4.3%) |
| Total | 29,437 (100.0%) | 30,650 (100.0%) |
Families and Households in Des Plaines
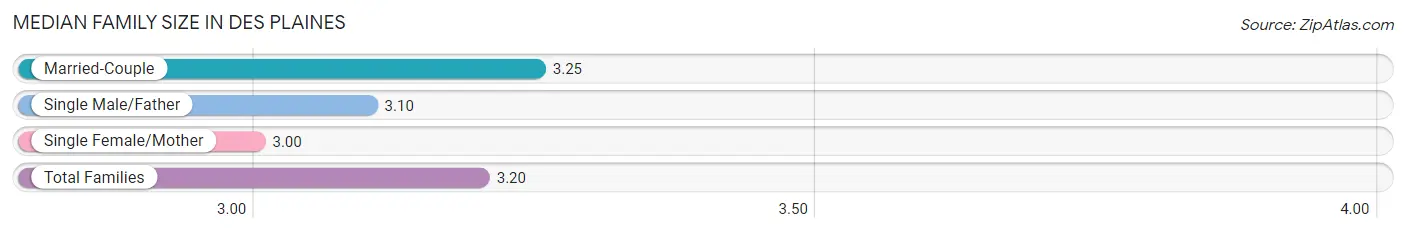
Median Family Size in Des Plaines
The median family size in Des Plaines is 3.20 persons per family, with married-couple families (11,652 | 76.0%) accounting for the largest median family size of 3.25 persons per family. On the other hand, single female/mother families (2,530 | 16.5%) represent the smallest median family size with 3.00 persons per family.
| Family Type | # Families | Family Size |
| Married-Couple | 11,652 (76.0%) | 3.25 |
| Single Male/Father | 1,144 (7.5%) | 3.10 |
| Single Female/Mother | 2,530 (16.5%) | 3.00 |
| Total Families | 15,326 (100.0%) | 3.20 |
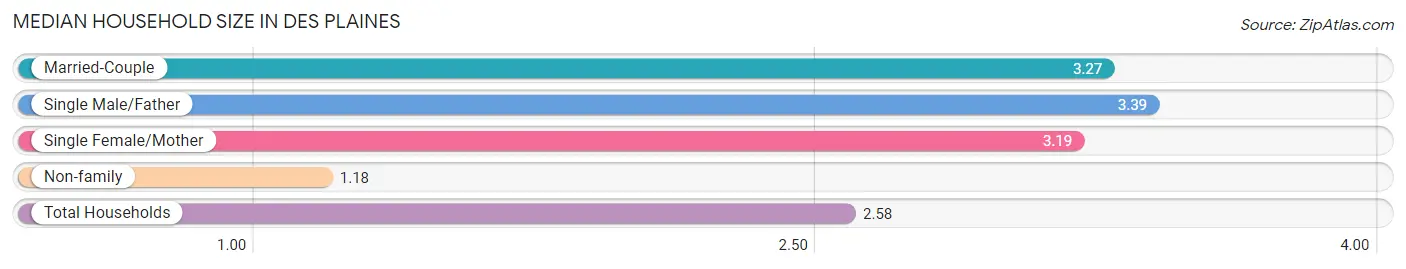
Median Household Size in Des Plaines
The median household size in Des Plaines is 2.58 persons per household, with single male/father households (1,144 | 5.0%) accounting for the largest median household size of 3.39 persons per household. non-family households (7,561 | 33.0%) represent the smallest median household size with 1.18 persons per household.
| Household Type | # Households | Household Size |
| Married-Couple | 11,652 (50.9%) | 3.27 |
| Single Male/Father | 1,144 (5.0%) | 3.39 |
| Single Female/Mother | 2,530 (11.1%) | 3.19 |
| Non-family | 7,561 (33.0%) | 1.18 |
| Total Households | 22,887 (100.0%) | 2.58 |
Household Size by Marriage Status in Des Plaines
Out of a total of 22,887 households in Des Plaines, 15,326 (67.0%) are family households, while 7,561 (33.0%) are nonfamily households. The most numerous type of family households are 2-person households, comprising 6,240, and the most common type of nonfamily households are 1-person households, comprising 6,580.
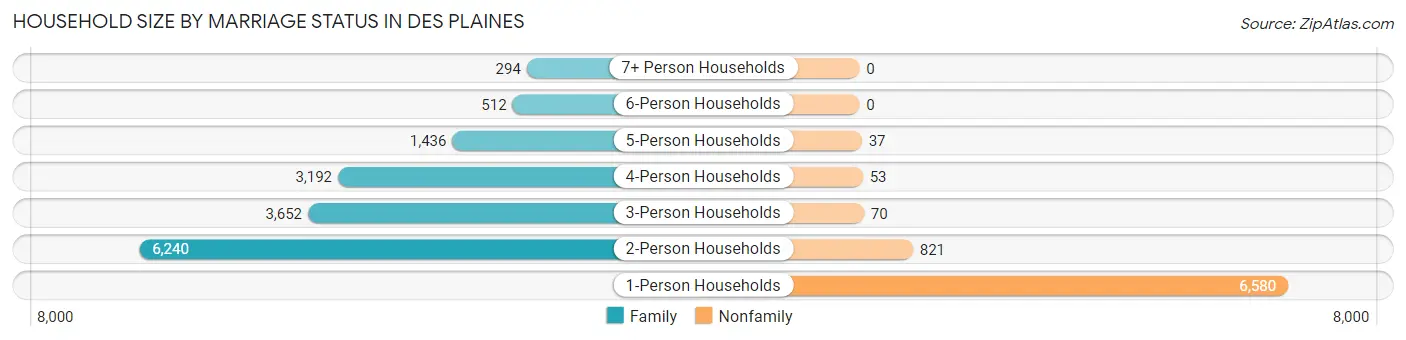
| Household Size | Family Households | Nonfamily Households |
| 1-Person Households | - | 6,580 (28.7%) |
| 2-Person Households | 6,240 (27.3%) | 821 (3.6%) |
| 3-Person Households | 3,652 (16.0%) | 70 (0.3%) |
| 4-Person Households | 3,192 (14.0%) | 53 (0.2%) |
| 5-Person Households | 1,436 (6.3%) | 37 (0.2%) |
| 6-Person Households | 512 (2.2%) | 0 (0.0%) |
| 7+ Person Households | 294 (1.3%) | 0 (0.0%) |
| Total | 15,326 (67.0%) | 7,561 (33.0%) |
Female Fertility in Des Plaines
Fertility by Age in Des Plaines
Average fertility rate in Des Plaines is 47.0 births per 1,000 women. Women in the age bracket of 20 to 34 years have the highest fertility rate with 80.0 births per 1,000 women. Women in the age bracket of 20 to 34 years acount for 66.1% of all women with births.
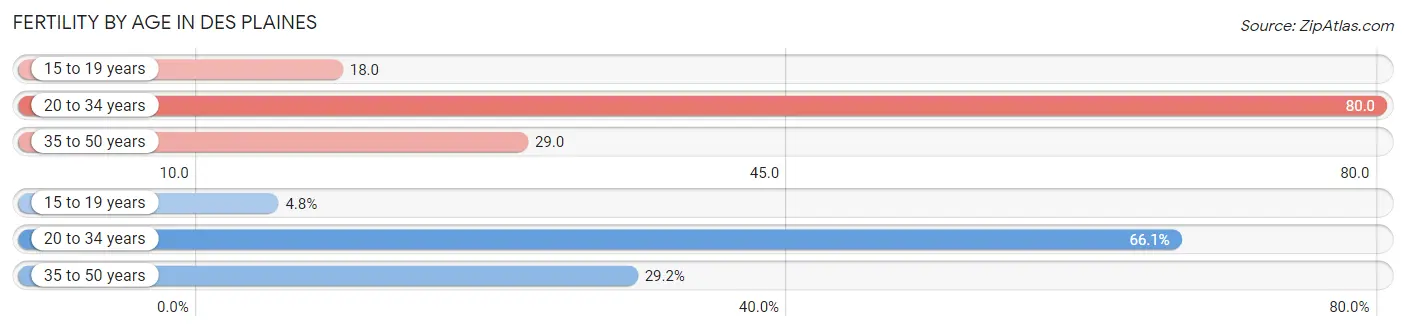
| Age Bracket | Women with Births | Births / 1,000 Women |
| 15 to 19 years | 29 (4.8%) | 18.0 |
| 20 to 34 years | 401 (66.1%) | 80.0 |
| 35 to 50 years | 177 (29.2%) | 29.0 |
| Total | 607 (100.0%) | 47.0 |
Fertility by Age by Marriage Status in Des Plaines
81.5% of women with births (607) in Des Plaines are married. The highest percentage of unmarried women with births falls into 15 to 19 years age bracket with 89.7% of them unmarried at the time of birth, while the lowest percentage of unmarried women with births belong to 20 to 34 years age bracket with 11.7% of them unmarried.
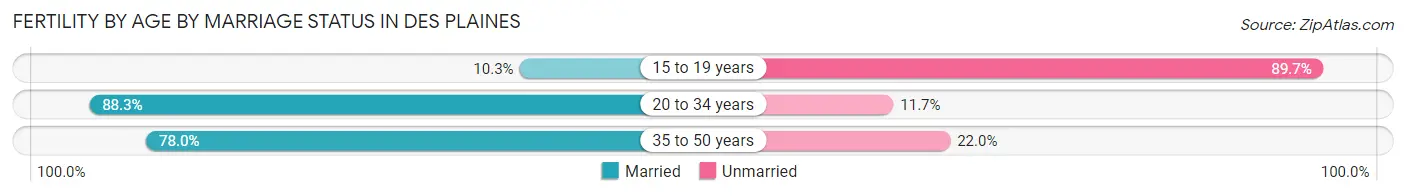
| Age Bracket | Married | Unmarried |
| 15 to 19 years | 3 (10.3%) | 26 (89.7%) |
| 20 to 34 years | 354 (88.3%) | 47 (11.7%) |
| 35 to 50 years | 138 (78.0%) | 39 (22.0%) |
| Total | 495 (81.6%) | 112 (18.4%) |
Fertility by Education in Des Plaines
Average fertility rate in Des Plaines is 47.0 births per 1,000 women. Women with the education attainment of bachelor's degree have the highest fertility rate of 69.0 births per 1,000 women, while women with the education attainment of college or associate's degree have the lowest fertility at 30.0 births per 1,000 women. Women with the education attainment of bachelor's degree represent 36.9% of all women with births.
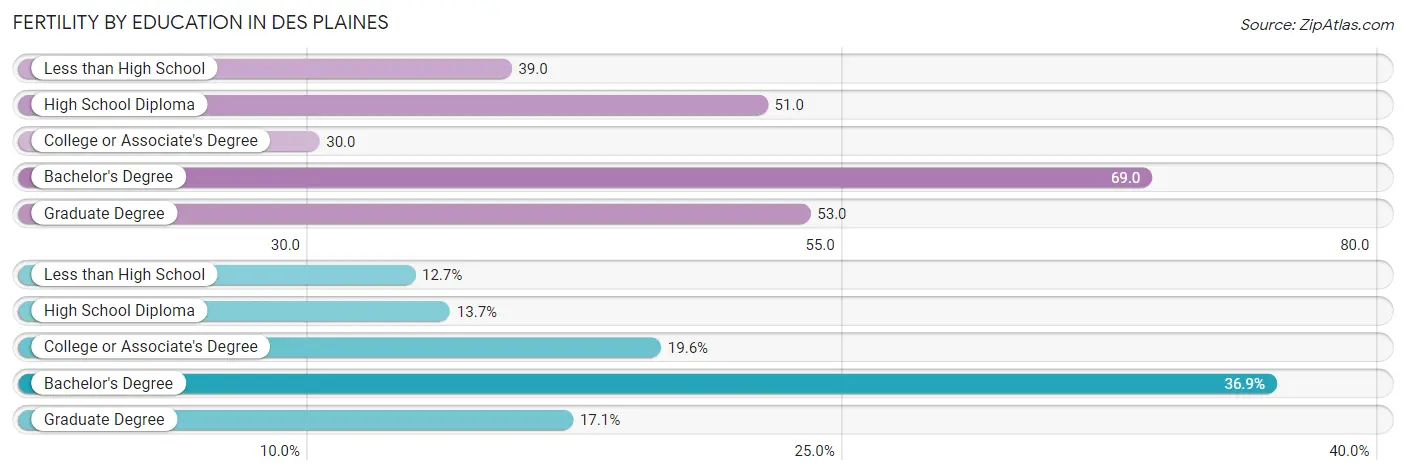
| Educational Attainment | Women with Births | Births / 1,000 Women |
| Less than High School | 77 (12.7%) | 39.0 |
| High School Diploma | 83 (13.7%) | 51.0 |
| College or Associate's Degree | 119 (19.6%) | 30.0 |
| Bachelor's Degree | 224 (36.9%) | 69.0 |
| Graduate Degree | 104 (17.1%) | 53.0 |
| Total | 607 (100.0%) | 47.0 |
Fertility by Education by Marriage Status in Des Plaines
18.4% of women with births in Des Plaines are unmarried. Women with the educational attainment of less than high school are most likely to be married with 100.0% of them married at childbirth, while women with the educational attainment of college or associate's degree are least likely to be married with 44.5% of them unmarried at childbirth.
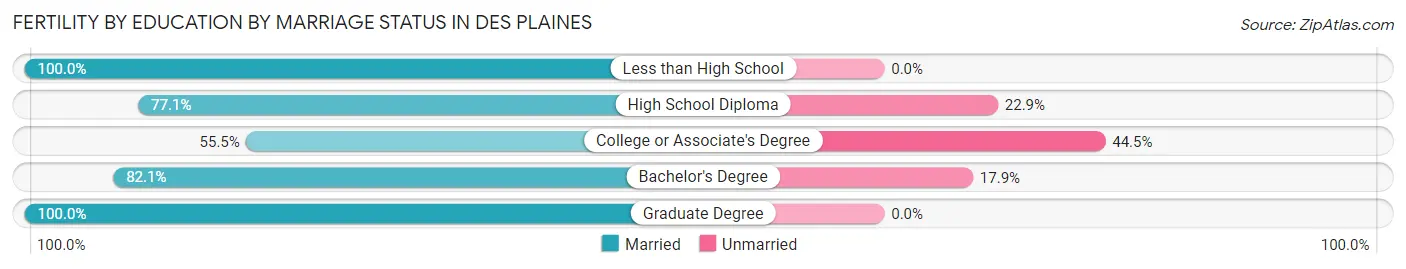
| Educational Attainment | Married | Unmarried |
| Less than High School | 77 (100.0%) | 0 (0.0%) |
| High School Diploma | 64 (77.1%) | 19 (22.9%) |
| College or Associate's Degree | 66 (55.5%) | 53 (44.5%) |
| Bachelor's Degree | 184 (82.1%) | 40 (17.9%) |
| Graduate Degree | 104 (100.0%) | 0 (0.0%) |
| Total | 495 (81.6%) | 112 (18.4%) |
Employment Characteristics in Des Plaines
Employment by Class of Employer in Des Plaines
Among the 30,185 employed individuals in Des Plaines, private company employees (21,244 | 70.4%), not-for-profit organizations (2,979 | 9.9%), and local government employees (1,772 | 5.9%) make up the most common classes of employment.
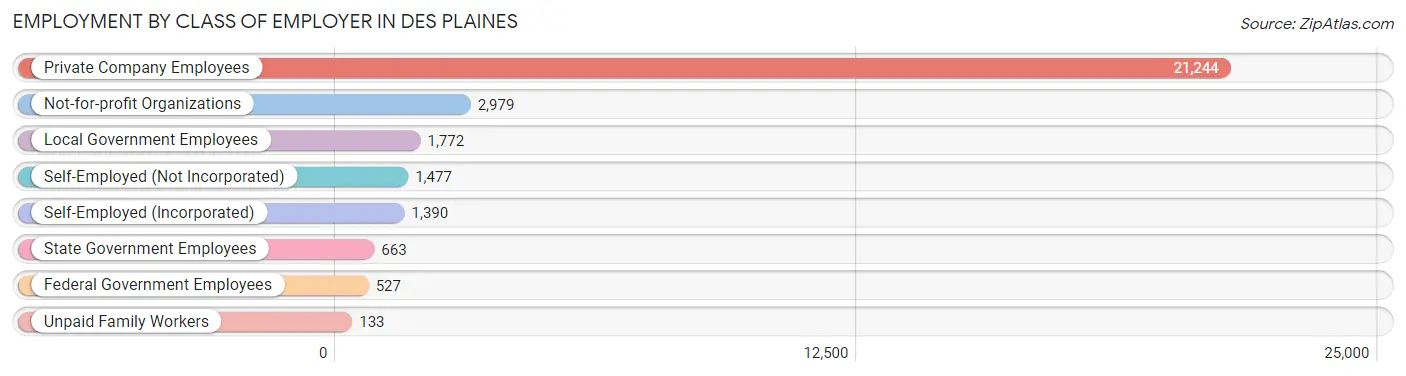
| Employer Class | # Employees | % Employees |
| Private Company Employees | 21,244 | 70.4% |
| Self-Employed (Incorporated) | 1,390 | 4.6% |
| Self-Employed (Not Incorporated) | 1,477 | 4.9% |
| Not-for-profit Organizations | 2,979 | 9.9% |
| Local Government Employees | 1,772 | 5.9% |
| State Government Employees | 663 | 2.2% |
| Federal Government Employees | 527 | 1.8% |
| Unpaid Family Workers | 133 | 0.4% |
| Total | 30,185 | 100.0% |
Employment Status by Age in Des Plaines
According to the labor force statistics for Des Plaines, out of the total population over 16 years of age (49,241), 65.3% or 32,154 individuals are in the labor force, with 4.6% or 1,479 of them unemployed. The age group with the highest labor force participation rate is 25 to 29 years, with 91.5% or 2,951 individuals in the labor force. Within the labor force, the 16 to 19 years age range has the highest percentage of unemployed individuals, with 23.5% or 218 of them being unemployed.
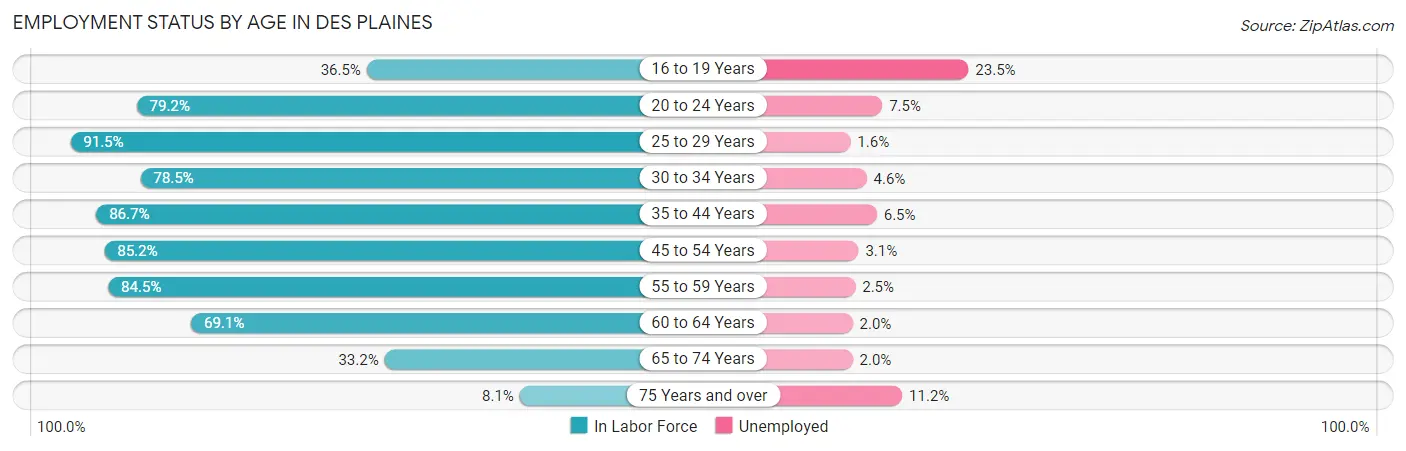
| Age Bracket | In Labor Force | Unemployed |
| 16 to 19 Years | 928 (36.5%) | 218 (23.5%) |
| 20 to 24 Years | 2,468 (79.2%) | 185 (7.5%) |
| 25 to 29 Years | 2,951 (91.5%) | 47 (1.6%) |
| 30 to 34 Years | 3,385 (78.5%) | 156 (4.6%) |
| 35 to 44 Years | 6,663 (86.7%) | 433 (6.5%) |
| 45 to 54 Years | 6,382 (85.2%) | 198 (3.1%) |
| 55 to 59 Years | 3,699 (84.5%) | 92 (2.5%) |
| 60 to 64 Years | 3,151 (69.1%) | 63 (2.0%) |
| 65 to 74 Years | 2,062 (33.2%) | 41 (2.0%) |
| 75 Years and over | 463 (8.1%) | 52 (11.2%) |
| Total | 32,154 (65.3%) | 1,479 (4.6%) |
Employment Status by Educational Attainment in Des Plaines
According to labor force statistics for Des Plaines, 82.9% of individuals (26,238) out of the total population between 25 and 64 years of age (31,650) are in the labor force, with 3.8% or 997 of them being unemployed. The group with the highest labor force participation rate are those with the educational attainment of bachelor's degree or higher, with 88.2% or 11,501 individuals in the labor force. Within the labor force, individuals with high school diploma education have the highest percentage of unemployment, with 6.1% or 284 of them being unemployed.
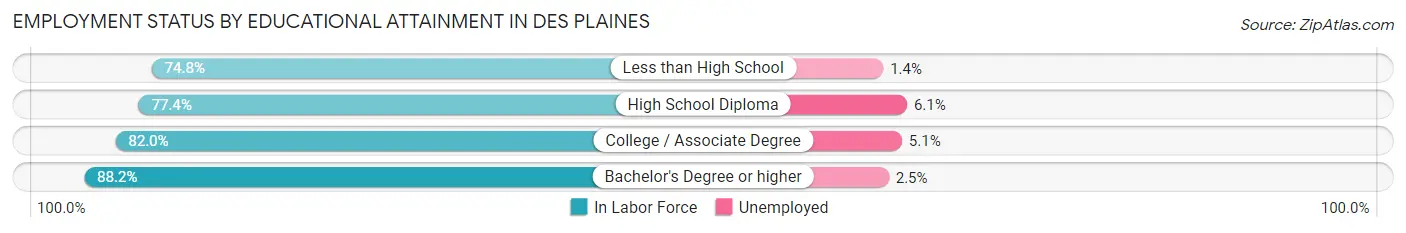
| Educational Attainment | In Labor Force | Unemployed |
| Less than High School | 2,619 (74.8%) | 49 (1.4%) |
| High School Diploma | 4,659 (77.4%) | 367 (6.1%) |
| College / Associate Degree | 7,454 (82.0%) | 464 (5.1%) |
| Bachelor's Degree or higher | 11,501 (88.2%) | 326 (2.5%) |
| Total | 26,238 (82.9%) | 1,203 (3.8%) |
Employment Occupations by Sex in Des Plaines
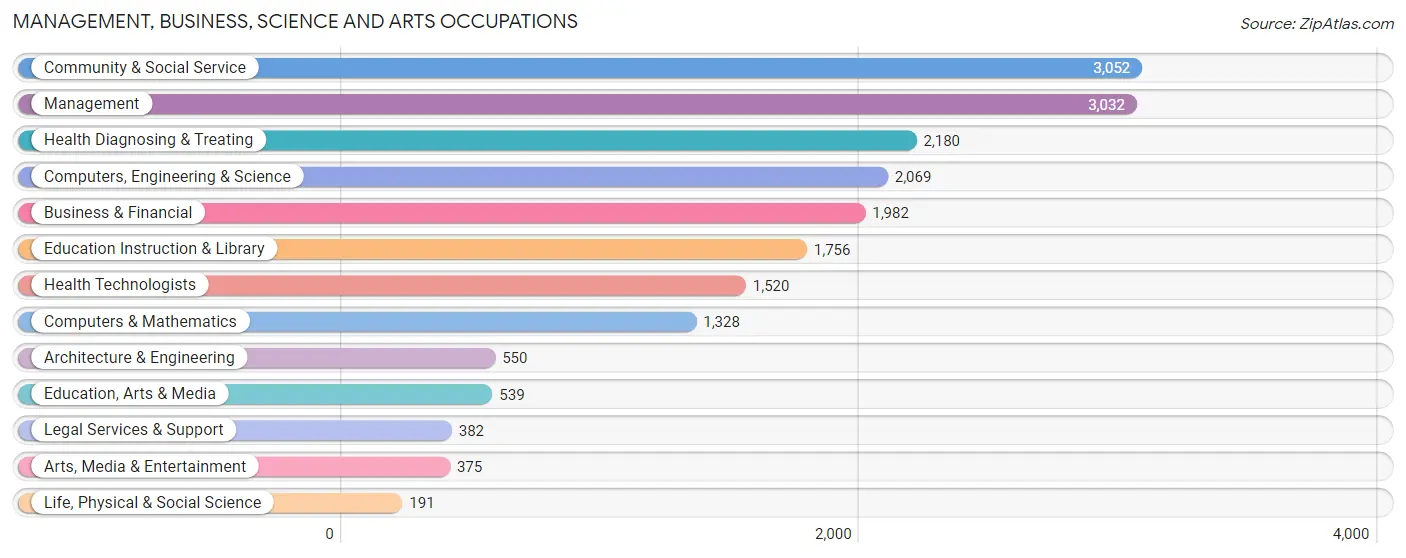
Management, Business, Science and Arts Occupations
The most common Management, Business, Science and Arts occupations in Des Plaines are Community & Social Service (3,052 | 10.0%), Management (3,032 | 9.9%), Health Diagnosing & Treating (2,180 | 7.1%), Computers, Engineering & Science (2,069 | 6.8%), and Business & Financial (1,982 | 6.5%).
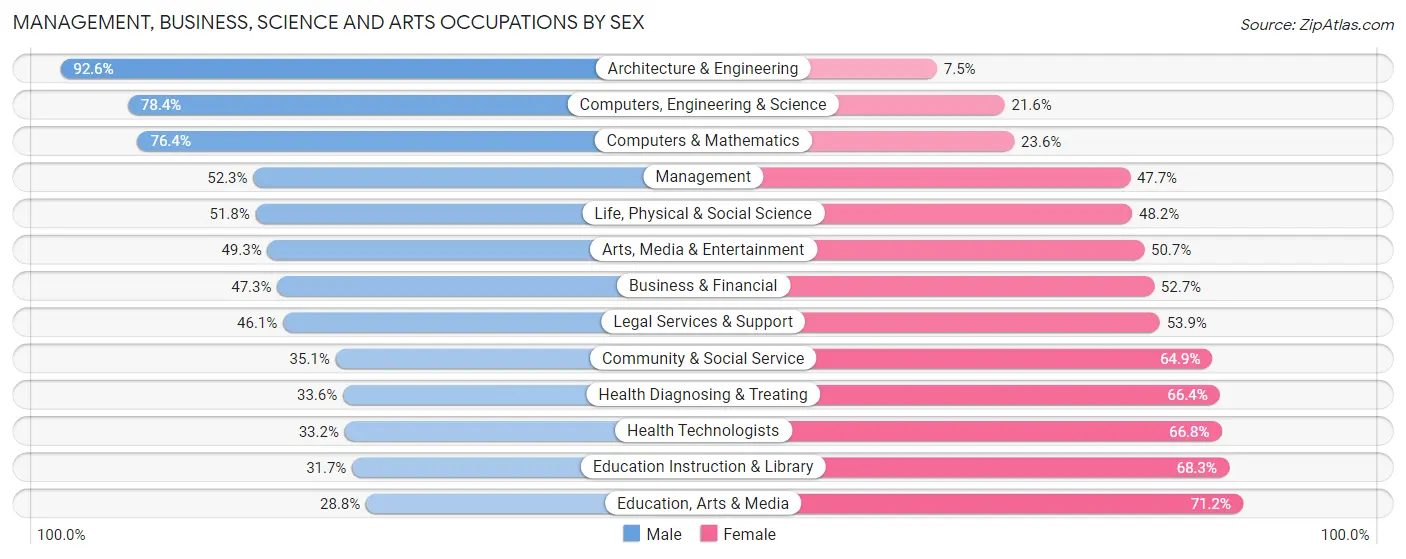
Management, Business, Science and Arts Occupations by Sex
Within the Management, Business, Science and Arts occupations in Des Plaines, the most male-oriented occupations are Architecture & Engineering (92.5%), Computers, Engineering & Science (78.4%), and Computers & Mathematics (76.4%), while the most female-oriented occupations are Education, Arts & Media (71.2%), Education Instruction & Library (68.3%), and Health Technologists (66.8%).
| Occupation | Male | Female |
| Management | 1,585 (52.3%) | 1,447 (47.7%) |
| Business & Financial | 937 (47.3%) | 1,045 (52.7%) |
| Computers, Engineering & Science | 1,623 (78.4%) | 446 (21.6%) |
| Computers & Mathematics | 1,015 (76.4%) | 313 (23.6%) |
| Architecture & Engineering | 509 (92.5%) | 41 (7.4%) |
| Life, Physical & Social Science | 99 (51.8%) | 92 (48.2%) |
| Community & Social Service | 1,072 (35.1%) | 1,980 (64.9%) |
| Education, Arts & Media | 155 (28.8%) | 384 (71.2%) |
| Legal Services & Support | 176 (46.1%) | 206 (53.9%) |
| Education Instruction & Library | 556 (31.7%) | 1,200 (68.3%) |
| Arts, Media & Entertainment | 185 (49.3%) | 190 (50.7%) |
| Health Diagnosing & Treating | 732 (33.6%) | 1,448 (66.4%) |
| Health Technologists | 505 (33.2%) | 1,015 (66.8%) |
| Total (Category) | 5,949 (48.3%) | 6,366 (51.7%) |
| Total (Overall) | 16,521 (53.9%) | 14,112 (46.1%) |
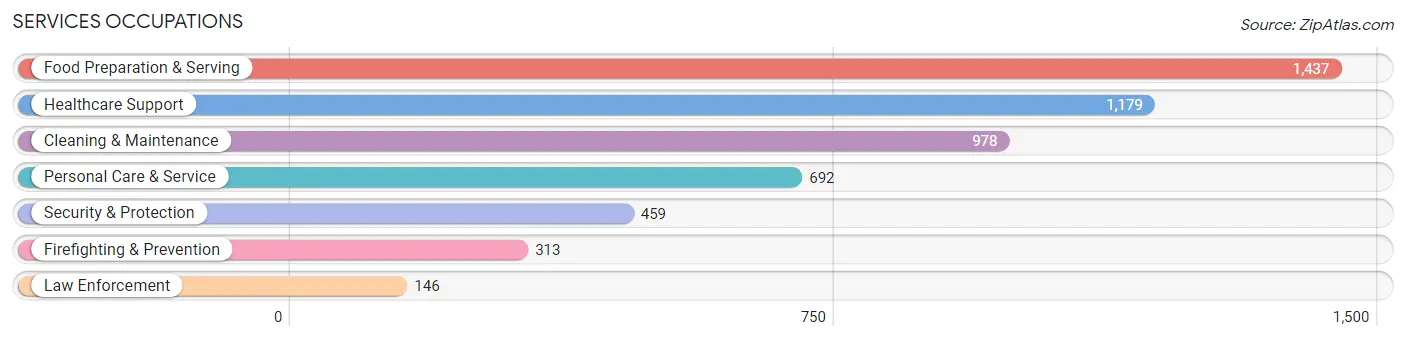
Services Occupations
The most common Services occupations in Des Plaines are Food Preparation & Serving (1,437 | 4.7%), Healthcare Support (1,179 | 3.8%), Cleaning & Maintenance (978 | 3.2%), Personal Care & Service (692 | 2.3%), and Security & Protection (459 | 1.5%).
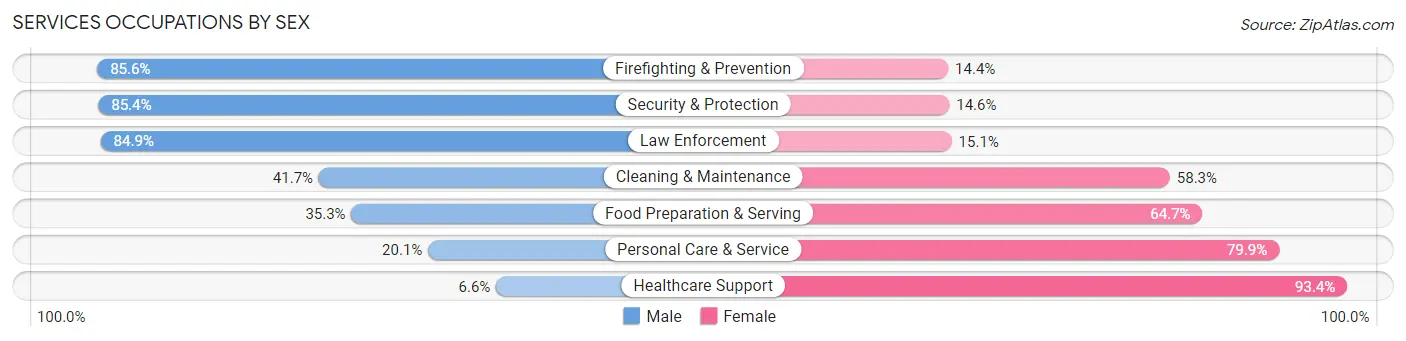
Services Occupations by Sex
Within the Services occupations in Des Plaines, the most male-oriented occupations are Firefighting & Prevention (85.6%), Security & Protection (85.4%), and Law Enforcement (84.9%), while the most female-oriented occupations are Healthcare Support (93.4%), Personal Care & Service (79.9%), and Food Preparation & Serving (64.7%).
| Occupation | Male | Female |
| Healthcare Support | 78 (6.6%) | 1,101 (93.4%) |
| Security & Protection | 392 (85.4%) | 67 (14.6%) |
| Firefighting & Prevention | 268 (85.6%) | 45 (14.4%) |
| Law Enforcement | 124 (84.9%) | 22 (15.1%) |
| Food Preparation & Serving | 507 (35.3%) | 930 (64.7%) |
| Cleaning & Maintenance | 408 (41.7%) | 570 (58.3%) |
| Personal Care & Service | 139 (20.1%) | 553 (79.9%) |
| Total (Category) | 1,524 (32.1%) | 3,221 (67.9%) |
| Total (Overall) | 16,521 (53.9%) | 14,112 (46.1%) |
Sales and Office Occupations
The most common Sales and Office occupations in Des Plaines are Office & Administration (3,367 | 11.0%), and Sales & Related (2,938 | 9.6%).

Sales and Office Occupations by Sex
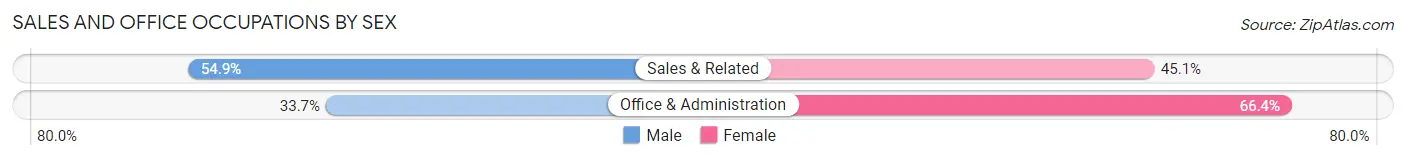
| Occupation | Male | Female |
| Sales & Related | 1,612 (54.9%) | 1,326 (45.1%) |
| Office & Administration | 1,133 (33.7%) | 2,234 (66.3%) |
| Total (Category) | 2,745 (43.5%) | 3,560 (56.5%) |
| Total (Overall) | 16,521 (53.9%) | 14,112 (46.1%) |
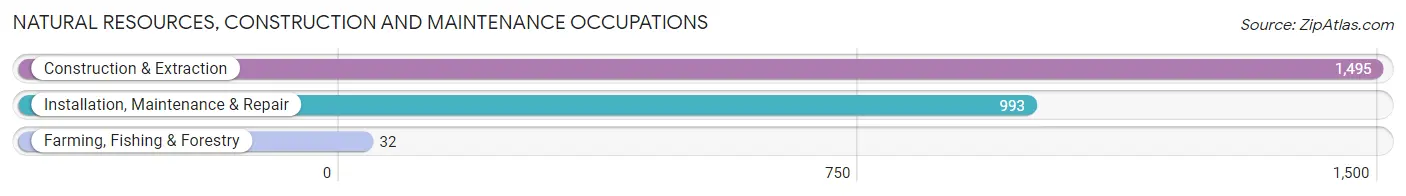
Natural Resources, Construction and Maintenance Occupations
The most common Natural Resources, Construction and Maintenance occupations in Des Plaines are Construction & Extraction (1,495 | 4.9%), Installation, Maintenance & Repair (993 | 3.2%), and Farming, Fishing & Forestry (32 | 0.1%).
Natural Resources, Construction and Maintenance Occupations by Sex
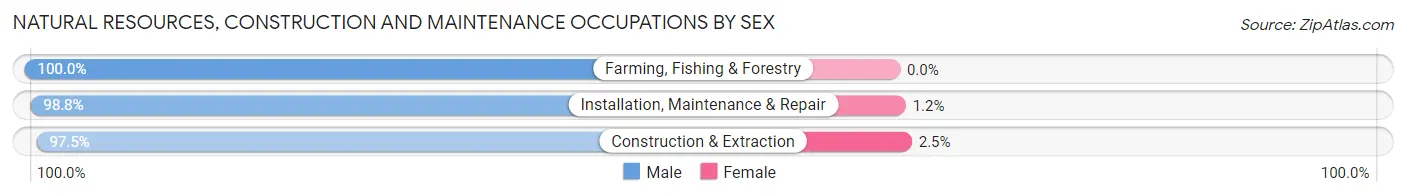
| Occupation | Male | Female |
| Farming, Fishing & Forestry | 32 (100.0%) | 0 (0.0%) |
| Construction & Extraction | 1,458 (97.5%) | 37 (2.5%) |
| Installation, Maintenance & Repair | 981 (98.8%) | 12 (1.2%) |
| Total (Category) | 2,471 (98.1%) | 49 (1.9%) |
| Total (Overall) | 16,521 (53.9%) | 14,112 (46.1%) |
Production, Transportation and Moving Occupations
The most common Production, Transportation and Moving occupations in Des Plaines are Production (1,708 | 5.6%), Material Moving (1,555 | 5.1%), and Transportation (1,485 | 4.9%).
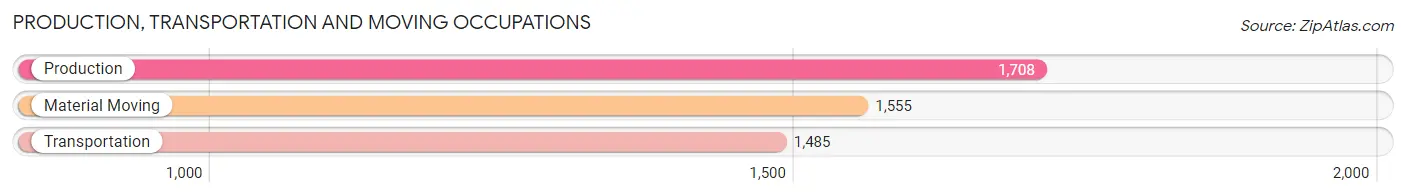
Production, Transportation and Moving Occupations by Sex
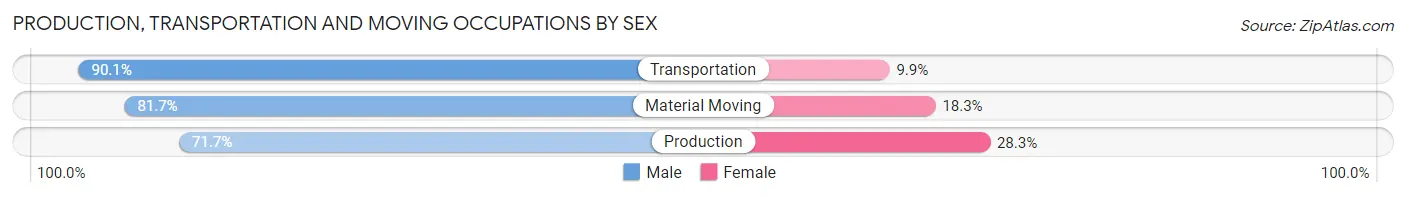
| Occupation | Male | Female |
| Production | 1,224 (71.7%) | 484 (28.3%) |
| Transportation | 1,338 (90.1%) | 147 (9.9%) |
| Material Moving | 1,270 (81.7%) | 285 (18.3%) |
| Total (Category) | 3,832 (80.7%) | 916 (19.3%) |
| Total (Overall) | 16,521 (53.9%) | 14,112 (46.1%) |
Employment Industries by Sex in Des Plaines
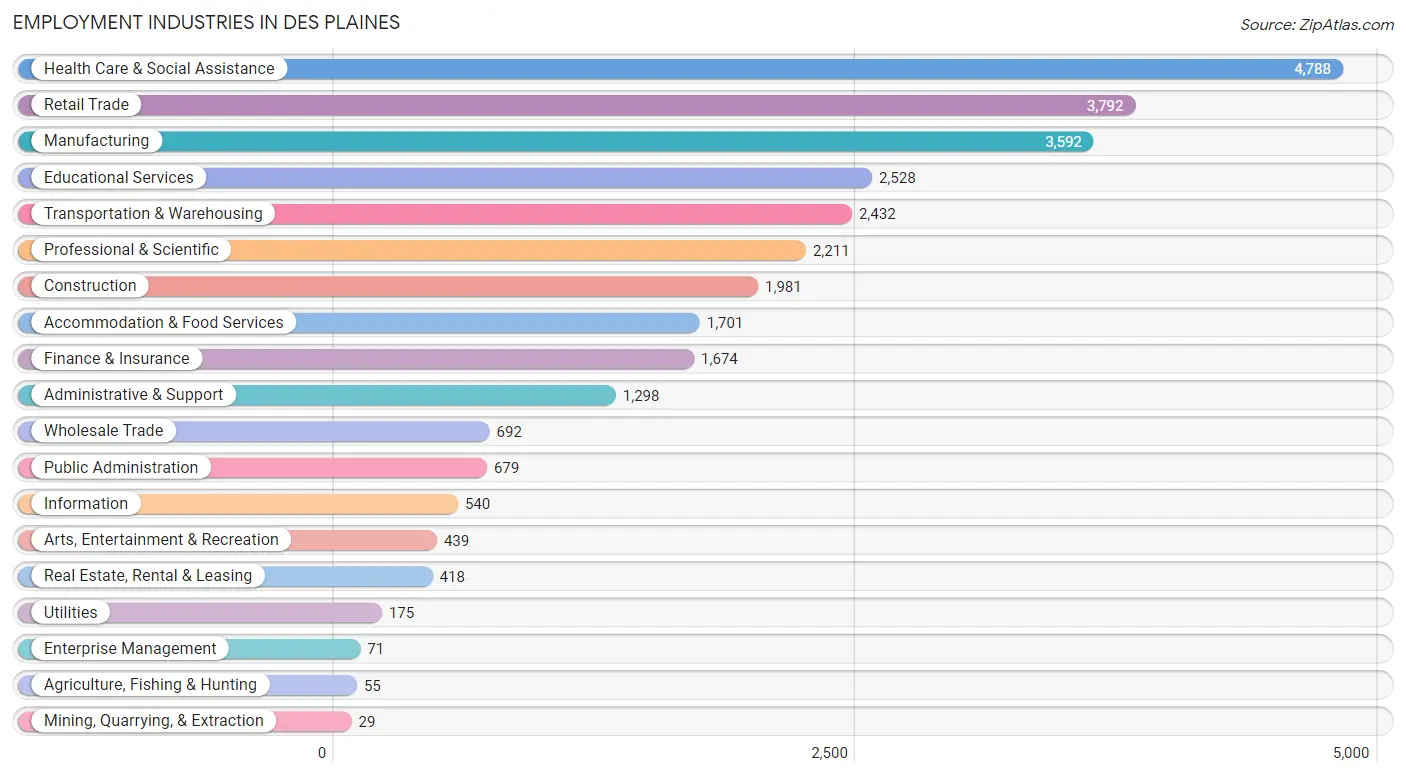
Employment Industries in Des Plaines
The major employment industries in Des Plaines include Health Care & Social Assistance (4,788 | 15.6%), Retail Trade (3,792 | 12.4%), Manufacturing (3,592 | 11.7%), Educational Services (2,528 | 8.3%), and Transportation & Warehousing (2,432 | 7.9%).
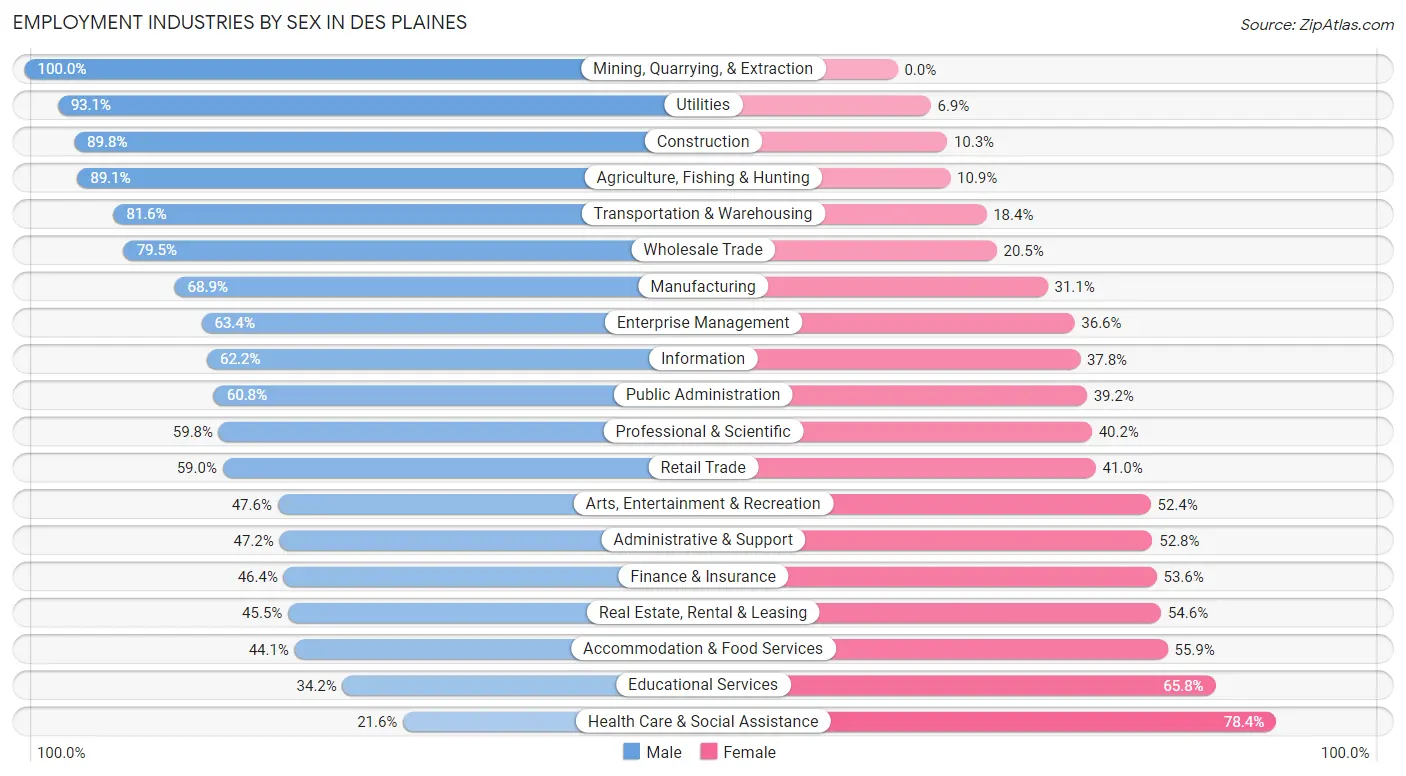
Employment Industries by Sex in Des Plaines
The Des Plaines industries that see more men than women are Mining, Quarrying, & Extraction (100.0%), Utilities (93.1%), and Construction (89.7%), whereas the industries that tend to have a higher number of women are Health Care & Social Assistance (78.4%), Educational Services (65.8%), and Accommodation & Food Services (55.9%).
| Industry | Male | Female |
| Agriculture, Fishing & Hunting | 49 (89.1%) | 6 (10.9%) |
| Mining, Quarrying, & Extraction | 29 (100.0%) | 0 (0.0%) |
| Construction | 1,778 (89.7%) | 203 (10.2%) |
| Manufacturing | 2,476 (68.9%) | 1,116 (31.1%) |
| Wholesale Trade | 550 (79.5%) | 142 (20.5%) |
| Retail Trade | 2,237 (59.0%) | 1,555 (41.0%) |
| Transportation & Warehousing | 1,985 (81.6%) | 447 (18.4%) |
| Utilities | 163 (93.1%) | 12 (6.9%) |
| Information | 336 (62.2%) | 204 (37.8%) |
| Finance & Insurance | 776 (46.4%) | 898 (53.6%) |
| Real Estate, Rental & Leasing | 190 (45.5%) | 228 (54.5%) |
| Professional & Scientific | 1,322 (59.8%) | 889 (40.2%) |
| Enterprise Management | 45 (63.4%) | 26 (36.6%) |
| Administrative & Support | 613 (47.2%) | 685 (52.8%) |
| Educational Services | 864 (34.2%) | 1,664 (65.8%) |
| Health Care & Social Assistance | 1,036 (21.6%) | 3,752 (78.4%) |
| Arts, Entertainment & Recreation | 209 (47.6%) | 230 (52.4%) |
| Accommodation & Food Services | 750 (44.1%) | 951 (55.9%) |
| Public Administration | 413 (60.8%) | 266 (39.2%) |
| Total | 16,521 (53.9%) | 14,112 (46.1%) |
Education in Des Plaines
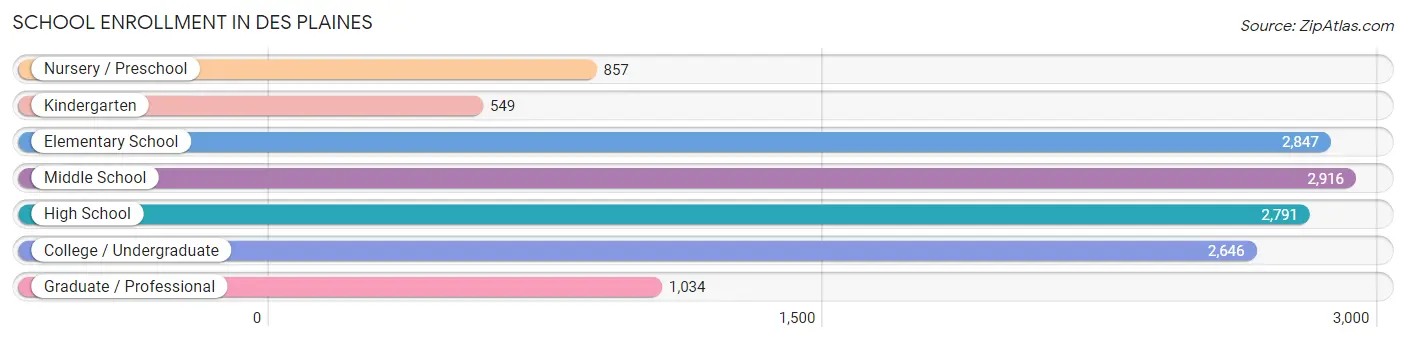
School Enrollment in Des Plaines
The most common levels of schooling among the 13,640 students in Des Plaines are middle school (2,916 | 21.4%), elementary school (2,847 | 20.9%), and high school (2,791 | 20.5%).
| School Level | # Students | % Students |
| Nursery / Preschool | 857 | 6.3% |
| Kindergarten | 549 | 4.0% |
| Elementary School | 2,847 | 20.9% |
| Middle School | 2,916 | 21.4% |
| High School | 2,791 | 20.5% |
| College / Undergraduate | 2,646 | 19.4% |
| Graduate / Professional | 1,034 | 7.6% |
| Total | 13,640 | 100.0% |
School Enrollment by Age by Funding Source in Des Plaines
Out of a total of 13,640 students who are enrolled in schools in Des Plaines, 2,660 (19.5%) attend a private institution, while the remaining 10,980 (80.5%) are enrolled in public schools. The age group of 35 years and over has the highest likelihood of being enrolled in private schools, with 496 (54.7% in the age bracket) enrolled. Conversely, the age group of 15 to 17 year olds has the lowest likelihood of being enrolled in a private school, with 1,890 (92.2% in the age bracket) attending a public institution.
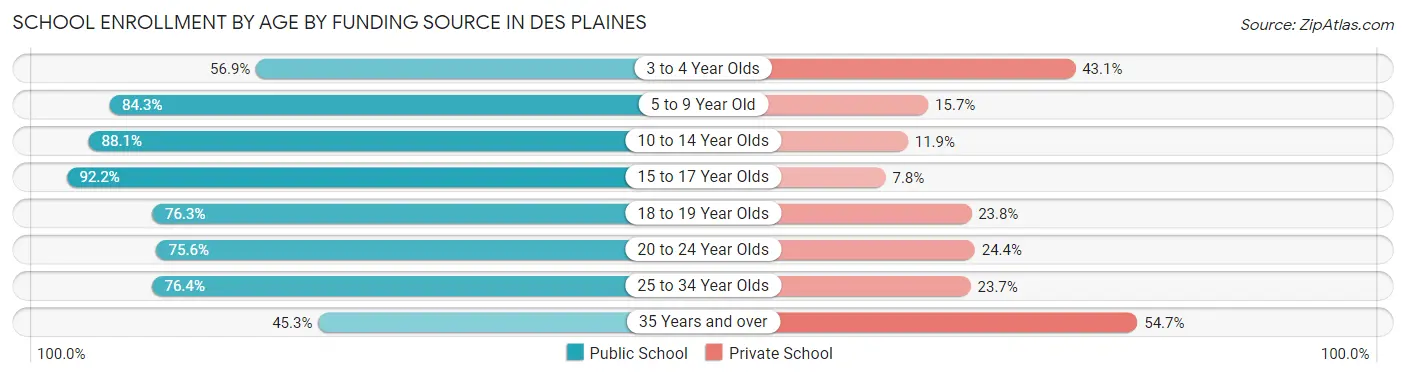
| Age Bracket | Public School | Private School |
| 3 to 4 Year Olds | 439 (56.9%) | 333 (43.1%) |
| 5 to 9 Year Old | 2,714 (84.3%) | 507 (15.7%) |
| 10 to 14 Year Olds | 3,179 (88.1%) | 431 (11.9%) |
| 15 to 17 Year Olds | 1,890 (92.2%) | 160 (7.8%) |
| 18 to 19 Year Olds | 687 (76.2%) | 214 (23.7%) |
| 20 to 24 Year Olds | 851 (75.6%) | 275 (24.4%) |
| 25 to 34 Year Olds | 804 (76.3%) | 249 (23.6%) |
| 35 Years and over | 411 (45.3%) | 496 (54.7%) |
| Total | 10,980 (80.5%) | 2,660 (19.5%) |
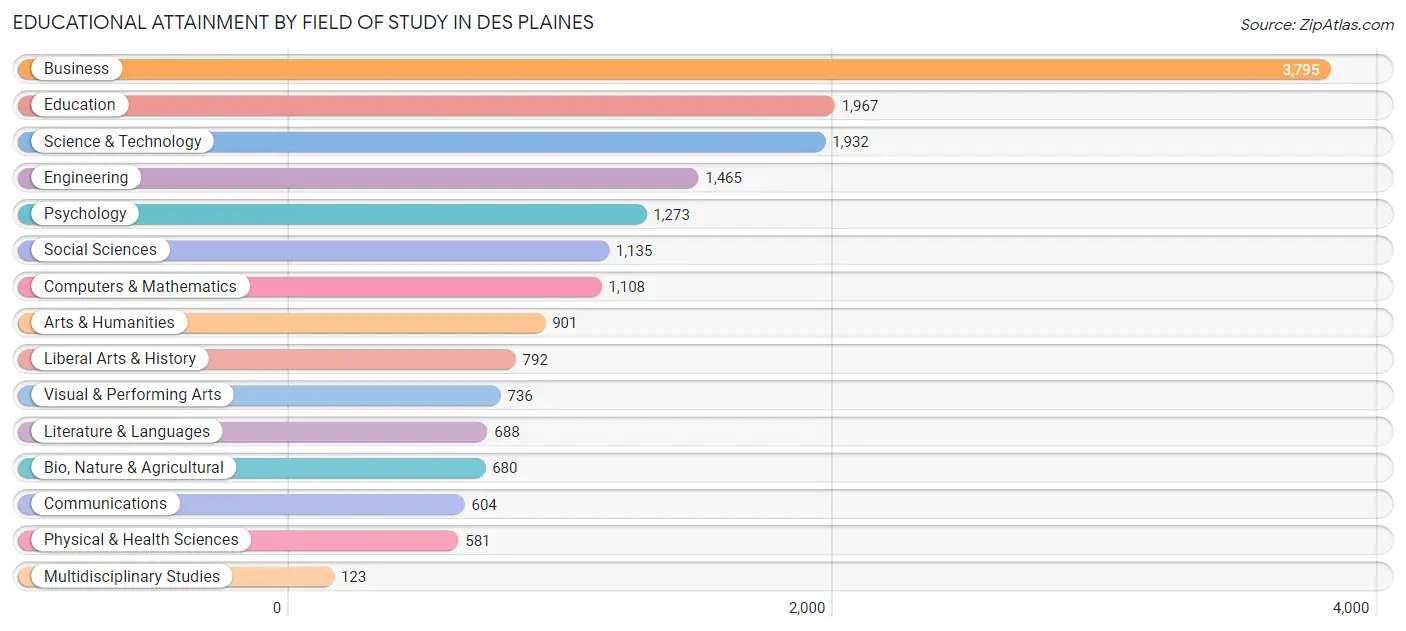
Educational Attainment by Field of Study in Des Plaines
Business (3,795 | 21.3%), education (1,967 | 11.1%), science & technology (1,932 | 10.9%), engineering (1,465 | 8.2%), and psychology (1,273 | 7.2%) are the most common fields of study among 17,780 individuals in Des Plaines who have obtained a bachelor's degree or higher.
| Field of Study | # Graduates | % Graduates |
| Computers & Mathematics | 1,108 | 6.2% |
| Bio, Nature & Agricultural | 680 | 3.8% |
| Physical & Health Sciences | 581 | 3.3% |
| Psychology | 1,273 | 7.2% |
| Social Sciences | 1,135 | 6.4% |
| Engineering | 1,465 | 8.2% |
| Multidisciplinary Studies | 123 | 0.7% |
| Science & Technology | 1,932 | 10.9% |
| Business | 3,795 | 21.3% |
| Education | 1,967 | 11.1% |
| Literature & Languages | 688 | 3.9% |
| Liberal Arts & History | 792 | 4.4% |
| Visual & Performing Arts | 736 | 4.1% |
| Communications | 604 | 3.4% |
| Arts & Humanities | 901 | 5.1% |
| Total | 17,780 | 100.0% |
Transportation & Commute in Des Plaines
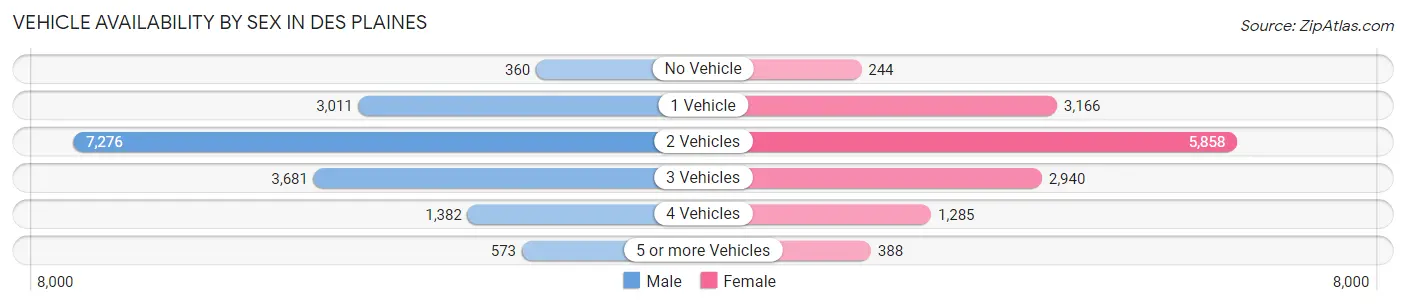
Vehicle Availability by Sex in Des Plaines
The most prevalent vehicle ownership categories in Des Plaines are males with 2 vehicles (7,276, accounting for 44.7%) and females with 2 vehicles (5,858, making up 52.4%).
| Vehicles Available | Male | Female |
| No Vehicle | 360 (2.2%) | 244 (1.8%) |
| 1 Vehicle | 3,011 (18.5%) | 3,166 (22.8%) |
| 2 Vehicles | 7,276 (44.7%) | 5,858 (42.2%) |
| 3 Vehicles | 3,681 (22.6%) | 2,940 (21.2%) |
| 4 Vehicles | 1,382 (8.5%) | 1,285 (9.3%) |
| 5 or more Vehicles | 573 (3.5%) | 388 (2.8%) |
| Total | 16,283 (100.0%) | 13,881 (100.0%) |
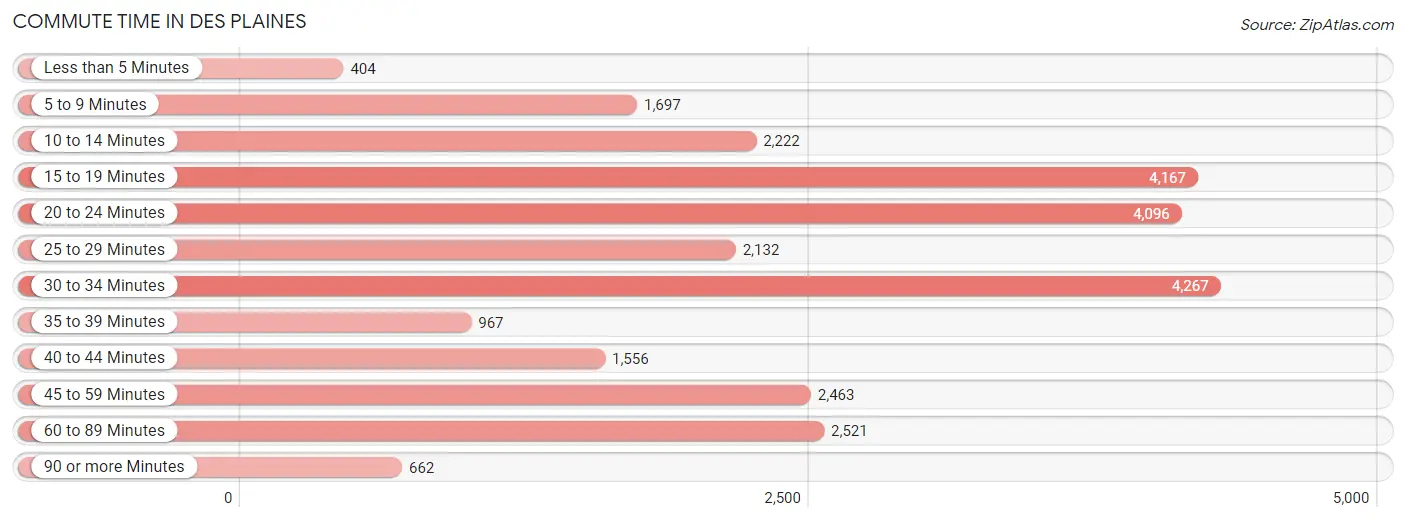
Commute Time in Des Plaines
The most frequently occuring commute durations in Des Plaines are 30 to 34 minutes (4,267 commuters, 15.7%), 15 to 19 minutes (4,167 commuters, 15.3%), and 20 to 24 minutes (4,096 commuters, 15.1%).
| Commute Time | # Commuters | % Commuters |
| Less than 5 Minutes | 404 | 1.5% |
| 5 to 9 Minutes | 1,697 | 6.2% |
| 10 to 14 Minutes | 2,222 | 8.2% |
| 15 to 19 Minutes | 4,167 | 15.3% |
| 20 to 24 Minutes | 4,096 | 15.1% |
| 25 to 29 Minutes | 2,132 | 7.9% |
| 30 to 34 Minutes | 4,267 | 15.7% |
| 35 to 39 Minutes | 967 | 3.6% |
| 40 to 44 Minutes | 1,556 | 5.7% |
| 45 to 59 Minutes | 2,463 | 9.1% |
| 60 to 89 Minutes | 2,521 | 9.3% |
| 90 or more Minutes | 662 | 2.4% |
Commute Time by Sex in Des Plaines
The most common commute times in Des Plaines are 30 to 34 minutes (2,285 commuters, 15.5%) for males and 20 to 24 minutes (2,136 commuters, 17.2%) for females.
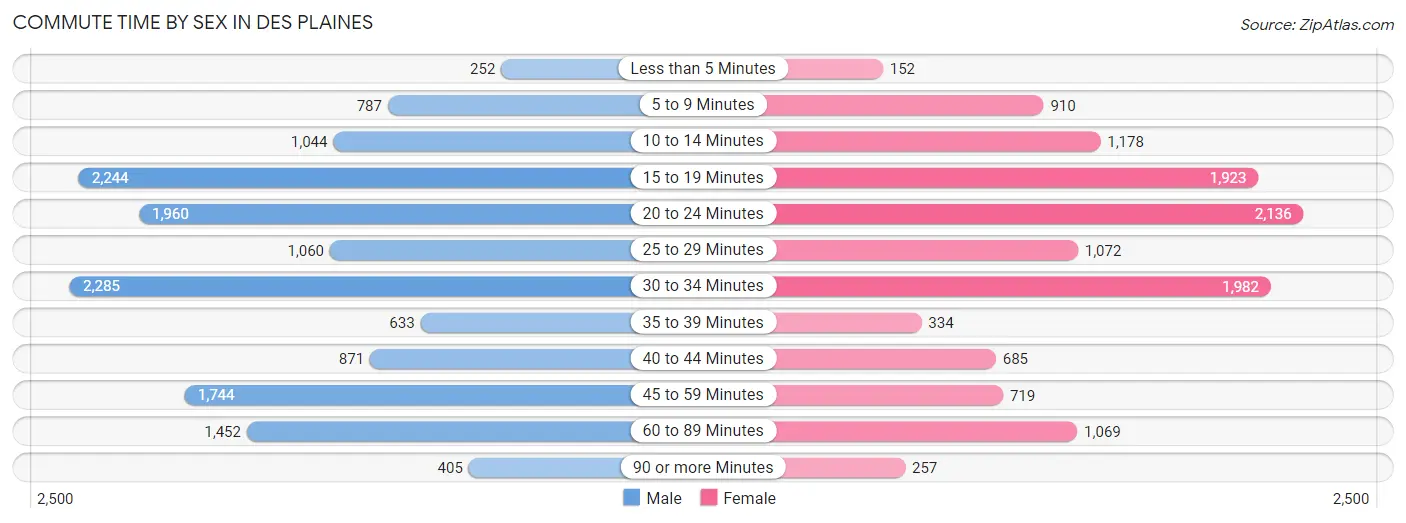
| Commute Time | Male | Female |
| Less than 5 Minutes | 252 (1.7%) | 152 (1.2%) |
| 5 to 9 Minutes | 787 (5.3%) | 910 (7.3%) |
| 10 to 14 Minutes | 1,044 (7.1%) | 1,178 (9.5%) |
| 15 to 19 Minutes | 2,244 (15.2%) | 1,923 (15.5%) |
| 20 to 24 Minutes | 1,960 (13.3%) | 2,136 (17.2%) |
| 25 to 29 Minutes | 1,060 (7.2%) | 1,072 (8.6%) |
| 30 to 34 Minutes | 2,285 (15.5%) | 1,982 (16.0%) |
| 35 to 39 Minutes | 633 (4.3%) | 334 (2.7%) |
| 40 to 44 Minutes | 871 (5.9%) | 685 (5.5%) |
| 45 to 59 Minutes | 1,744 (11.8%) | 719 (5.8%) |
| 60 to 89 Minutes | 1,452 (9.9%) | 1,069 (8.6%) |
| 90 or more Minutes | 405 (2.8%) | 257 (2.1%) |
Time of Departure to Work by Sex in Des Plaines
The most frequent times of departure to work in Des Plaines are 7:00 AM to 7:29 AM (2,411, 16.4%) for males and 7:00 AM to 7:29 AM (2,095, 16.9%) for females.
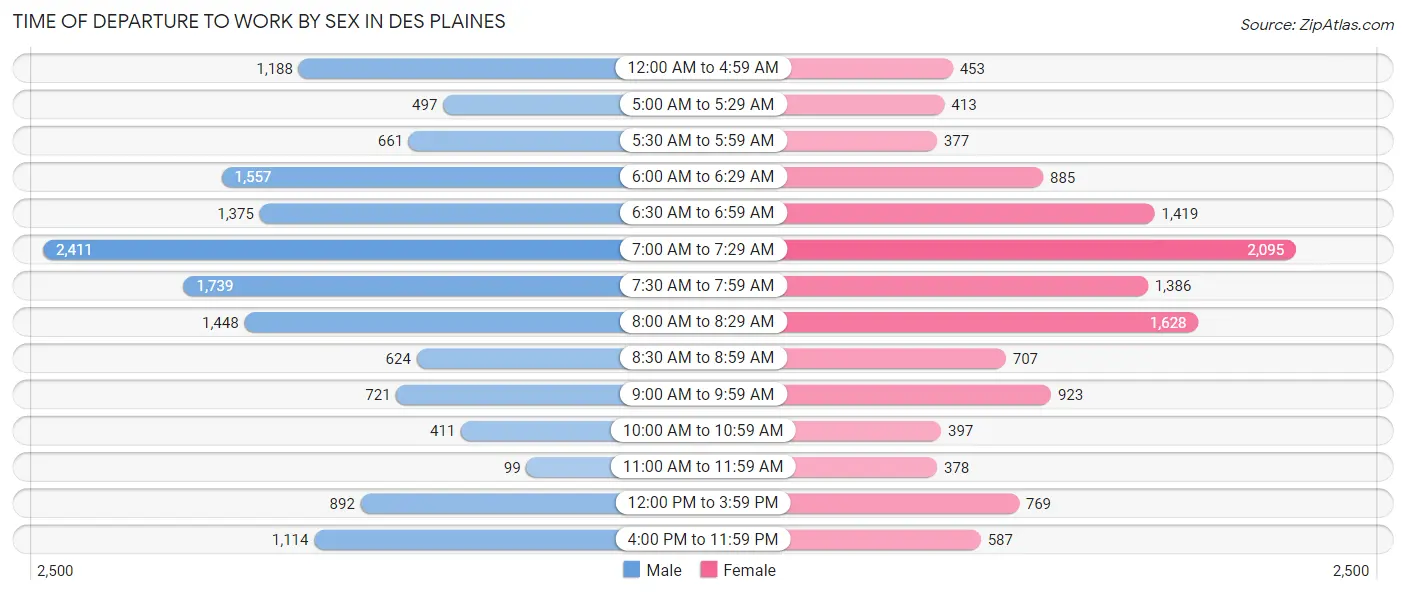
| Time of Departure | Male | Female |
| 12:00 AM to 4:59 AM | 1,188 (8.1%) | 453 (3.6%) |
| 5:00 AM to 5:29 AM | 497 (3.4%) | 413 (3.3%) |
| 5:30 AM to 5:59 AM | 661 (4.5%) | 377 (3.0%) |
| 6:00 AM to 6:29 AM | 1,557 (10.6%) | 885 (7.1%) |
| 6:30 AM to 6:59 AM | 1,375 (9.3%) | 1,419 (11.4%) |
| 7:00 AM to 7:29 AM | 2,411 (16.4%) | 2,095 (16.9%) |
| 7:30 AM to 7:59 AM | 1,739 (11.8%) | 1,386 (11.2%) |
| 8:00 AM to 8:29 AM | 1,448 (9.8%) | 1,628 (13.1%) |
| 8:30 AM to 8:59 AM | 624 (4.2%) | 707 (5.7%) |
| 9:00 AM to 9:59 AM | 721 (4.9%) | 923 (7.4%) |
| 10:00 AM to 10:59 AM | 411 (2.8%) | 397 (3.2%) |
| 11:00 AM to 11:59 AM | 99 (0.7%) | 378 (3.0%) |
| 12:00 PM to 3:59 PM | 892 (6.0%) | 769 (6.2%) |
| 4:00 PM to 11:59 PM | 1,114 (7.6%) | 587 (4.7%) |
| Total | 14,737 (100.0%) | 12,417 (100.0%) |
Housing Occupancy in Des Plaines
Occupancy by Ownership in Des Plaines
Of the total 22,887 dwellings in Des Plaines, owner-occupied units account for 18,000 (78.6%), while renter-occupied units make up 4,887 (21.3%).
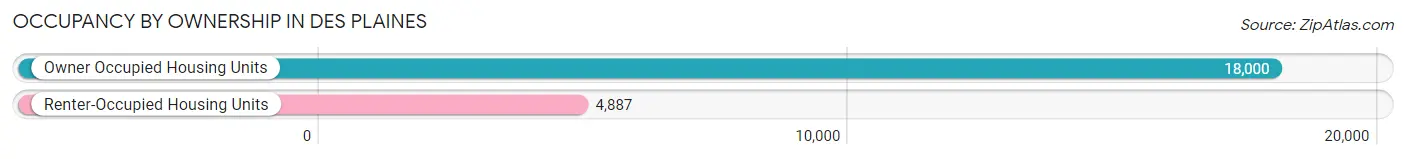
| Occupancy | # Housing Units | % Housing Units |
| Owner Occupied Housing Units | 18,000 | 78.6% |
| Renter-Occupied Housing Units | 4,887 | 21.3% |
| Total Occupied Housing Units | 22,887 | 100.0% |
Occupancy by Household Size in Des Plaines
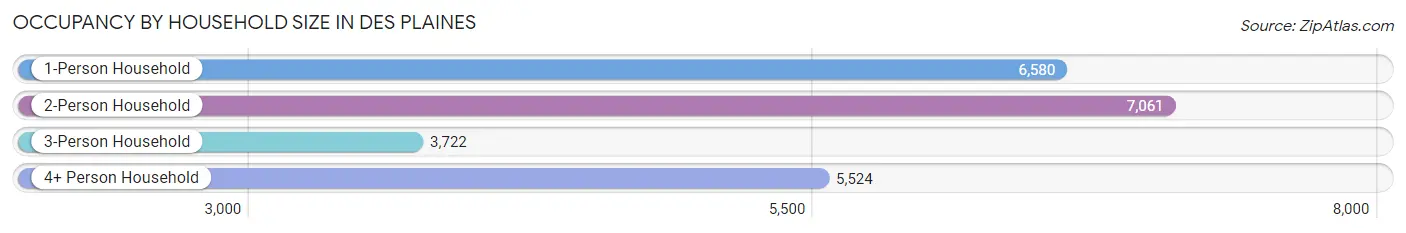
| Household Size | # Housing Units | % Housing Units |
| 1-Person Household | 6,580 | 28.7% |
| 2-Person Household | 7,061 | 30.8% |
| 3-Person Household | 3,722 | 16.3% |
| 4+ Person Household | 5,524 | 24.1% |
| Total Housing Units | 22,887 | 100.0% |
Occupancy by Ownership by Household Size in Des Plaines
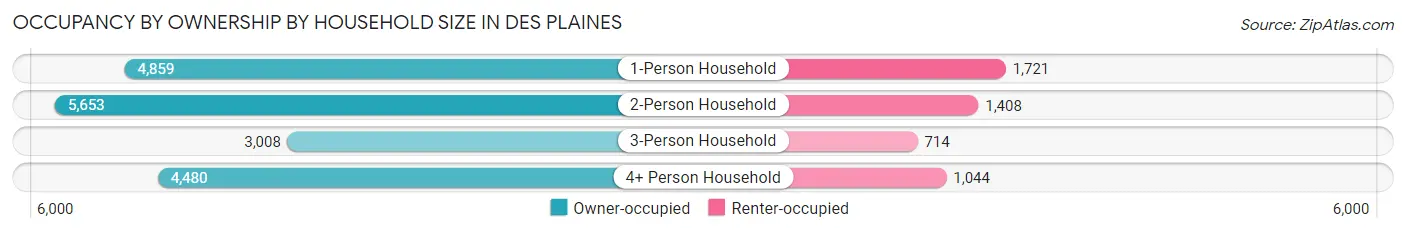
| Household Size | Owner-occupied | Renter-occupied |
| 1-Person Household | 4,859 (73.8%) | 1,721 (26.2%) |
| 2-Person Household | 5,653 (80.1%) | 1,408 (19.9%) |
| 3-Person Household | 3,008 (80.8%) | 714 (19.2%) |
| 4+ Person Household | 4,480 (81.1%) | 1,044 (18.9%) |
| Total Housing Units | 18,000 (78.6%) | 4,887 (21.3%) |
Occupancy by Educational Attainment in Des Plaines
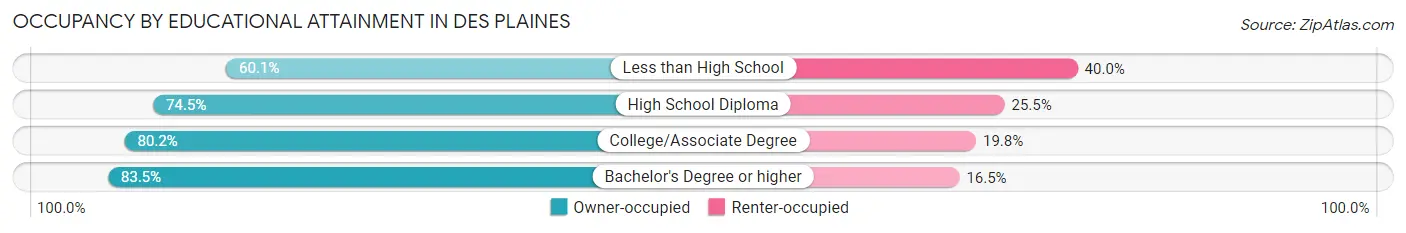
| Household Size | Owner-occupied | Renter-occupied |
| Less than High School | 1,311 (60.1%) | 872 (40.0%) |
| High School Diploma | 3,101 (74.5%) | 1,059 (25.5%) |
| College/Associate Degree | 5,469 (80.2%) | 1,350 (19.8%) |
| Bachelor's Degree or higher | 8,119 (83.5%) | 1,606 (16.5%) |
Occupancy by Age of Householder in Des Plaines
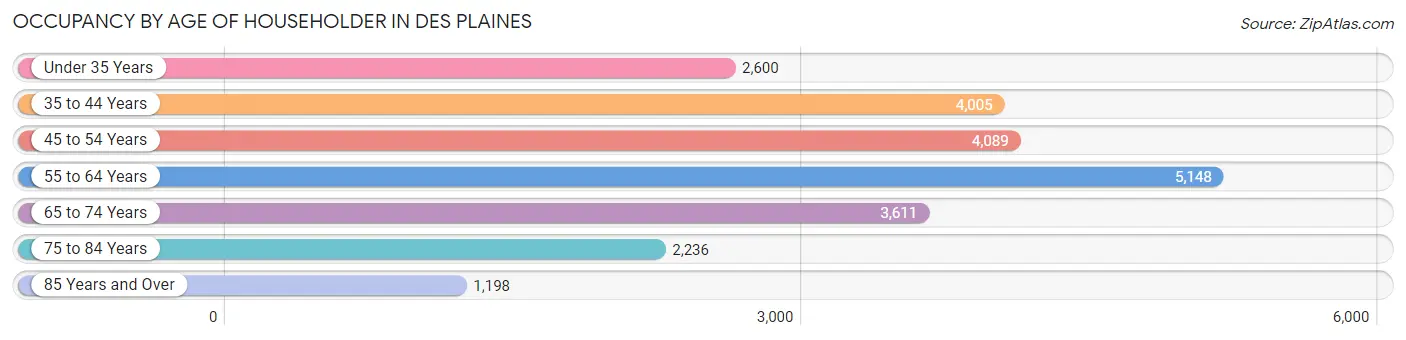
| Age Bracket | # Households | % Households |
| Under 35 Years | 2,600 | 11.4% |
| 35 to 44 Years | 4,005 | 17.5% |
| 45 to 54 Years | 4,089 | 17.9% |
| 55 to 64 Years | 5,148 | 22.5% |
| 65 to 74 Years | 3,611 | 15.8% |
| 75 to 84 Years | 2,236 | 9.8% |
| 85 Years and Over | 1,198 | 5.2% |
| Total | 22,887 | 100.0% |
Housing Finances in Des Plaines
Median Income by Occupancy in Des Plaines
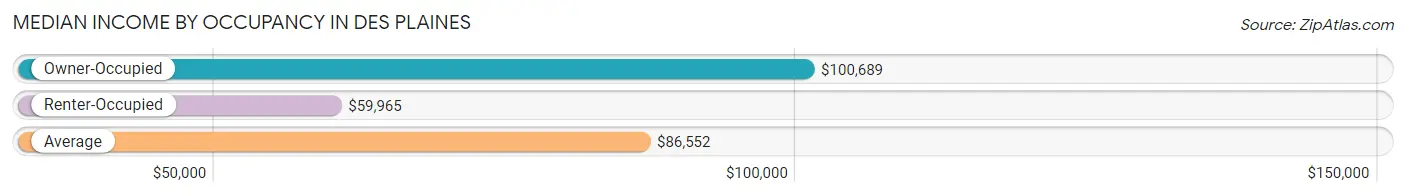
| Occupancy Type | # Households | Median Income |
| Owner-Occupied | 18,000 (78.6%) | $100,689 |
| Renter-Occupied | 4,887 (21.3%) | $59,965 |
| Average | 22,887 (100.0%) | $86,552 |
Occupancy by Householder Income Bracket in Des Plaines
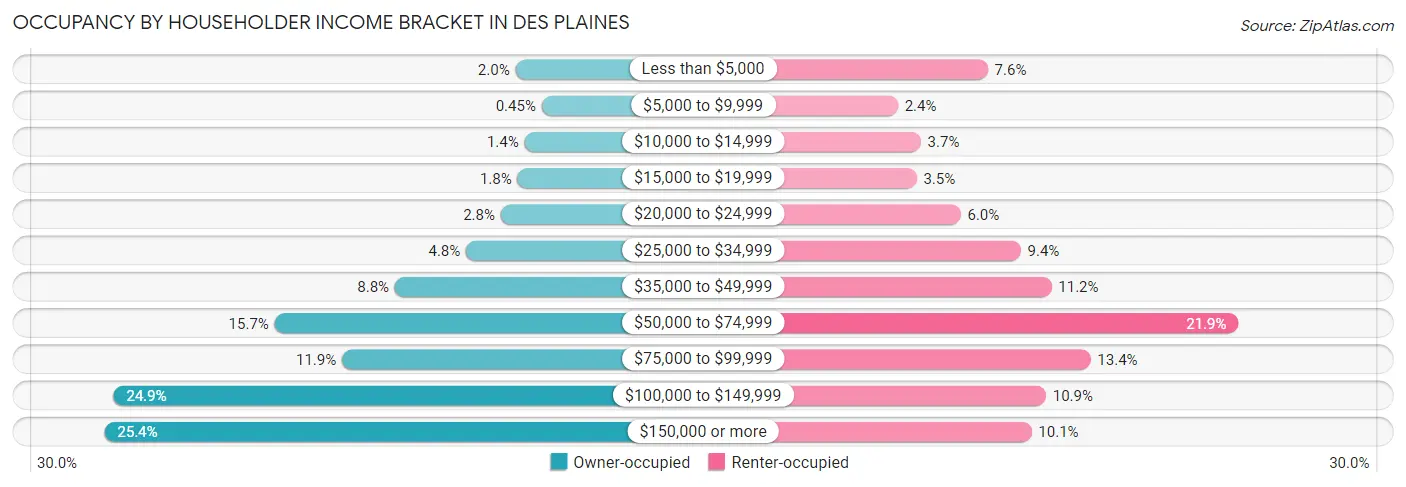
| Income Bracket | Owner-occupied | Renter-occupied |
| Less than $5,000 | 351 (1.9%) | 369 (7.5%) |
| $5,000 to $9,999 | 81 (0.4%) | 118 (2.4%) |
| $10,000 to $14,999 | 258 (1.4%) | 182 (3.7%) |
| $15,000 to $19,999 | 330 (1.8%) | 170 (3.5%) |
| $20,000 to $24,999 | 502 (2.8%) | 293 (6.0%) |
| $25,000 to $34,999 | 858 (4.8%) | 461 (9.4%) |
| $35,000 to $49,999 | 1,591 (8.8%) | 547 (11.2%) |
| $50,000 to $74,999 | 2,827 (15.7%) | 1,069 (21.9%) |
| $75,000 to $99,999 | 2,135 (11.9%) | 656 (13.4%) |
| $100,000 to $149,999 | 4,487 (24.9%) | 531 (10.9%) |
| $150,000 or more | 4,580 (25.4%) | 491 (10.1%) |
| Total | 18,000 (100.0%) | 4,887 (100.0%) |
Monthly Housing Cost Tiers in Des Plaines
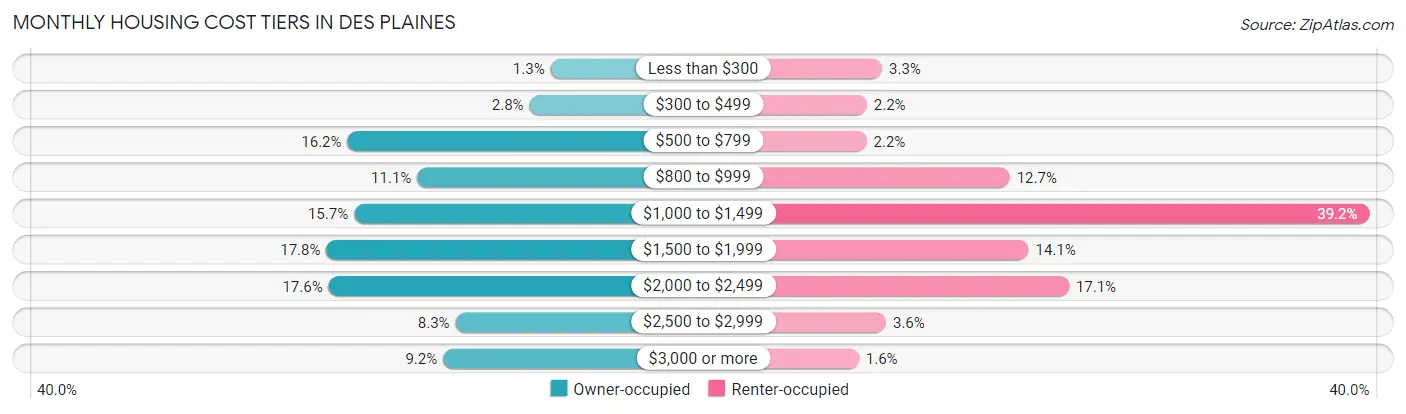
| Monthly Cost | Owner-occupied | Renter-occupied |
| Less than $300 | 228 (1.3%) | 161 (3.3%) |
| $300 to $499 | 507 (2.8%) | 106 (2.2%) |
| $500 to $799 | 2,922 (16.2%) | 105 (2.1%) |
| $800 to $999 | 1,997 (11.1%) | 620 (12.7%) |
| $1,000 to $1,499 | 2,834 (15.7%) | 1,914 (39.2%) |
| $1,500 to $1,999 | 3,201 (17.8%) | 688 (14.1%) |
| $2,000 to $2,499 | 3,171 (17.6%) | 833 (17.1%) |
| $2,500 to $2,999 | 1,488 (8.3%) | 175 (3.6%) |
| $3,000 or more | 1,652 (9.2%) | 77 (1.6%) |
| Total | 18,000 (100.0%) | 4,887 (100.0%) |
Physical Housing Characteristics in Des Plaines
Housing Structures in Des Plaines
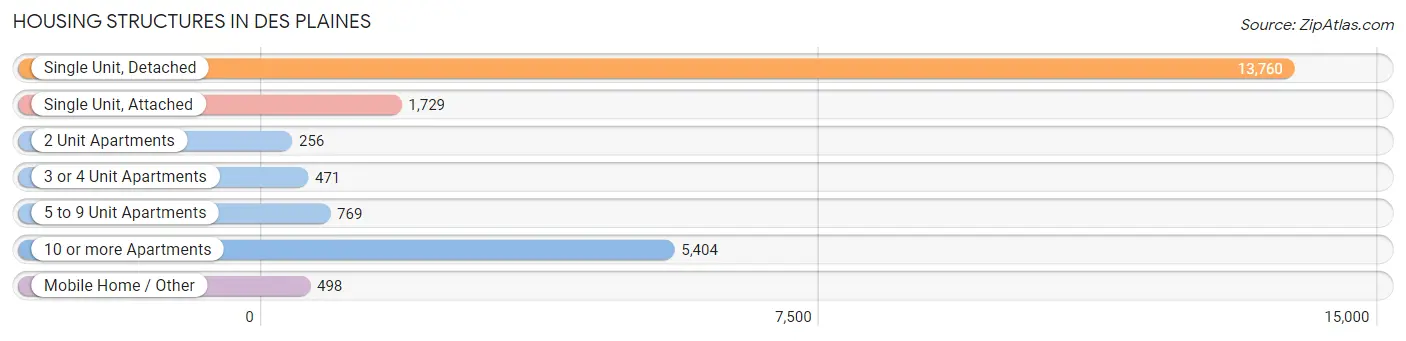
| Structure Type | # Housing Units | % Housing Units |
| Single Unit, Detached | 13,760 | 60.1% |
| Single Unit, Attached | 1,729 | 7.5% |
| 2 Unit Apartments | 256 | 1.1% |
| 3 or 4 Unit Apartments | 471 | 2.1% |
| 5 to 9 Unit Apartments | 769 | 3.4% |
| 10 or more Apartments | 5,404 | 23.6% |
| Mobile Home / Other | 498 | 2.2% |
| Total | 22,887 | 100.0% |
Housing Structures by Occupancy in Des Plaines
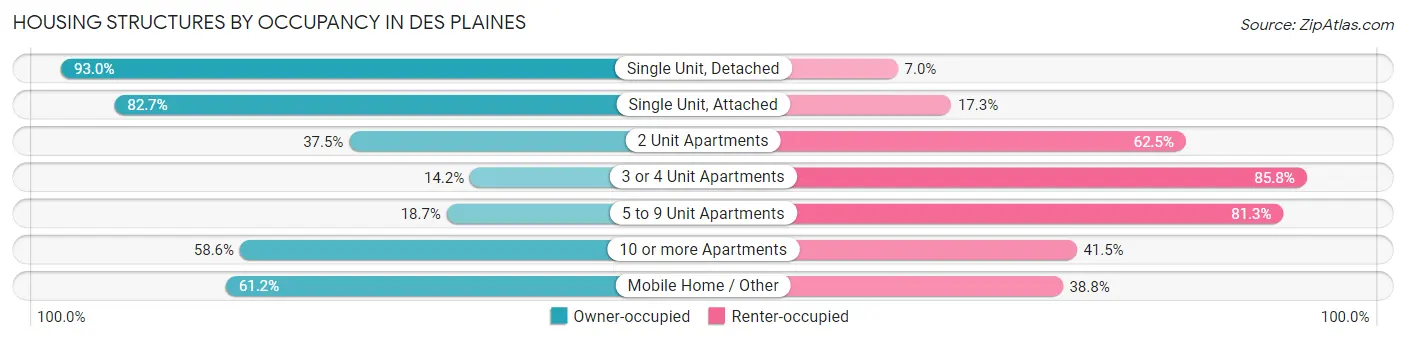
| Structure Type | Owner-occupied | Renter-occupied |
| Single Unit, Detached | 12,794 (93.0%) | 966 (7.0%) |
| Single Unit, Attached | 1,430 (82.7%) | 299 (17.3%) |
| 2 Unit Apartments | 96 (37.5%) | 160 (62.5%) |
| 3 or 4 Unit Apartments | 67 (14.2%) | 404 (85.8%) |
| 5 to 9 Unit Apartments | 144 (18.7%) | 625 (81.3%) |
| 10 or more Apartments | 3,164 (58.6%) | 2,240 (41.4%) |
| Mobile Home / Other | 305 (61.2%) | 193 (38.8%) |
| Total | 18,000 (78.6%) | 4,887 (21.3%) |
Housing Structures by Number of Rooms in Des Plaines
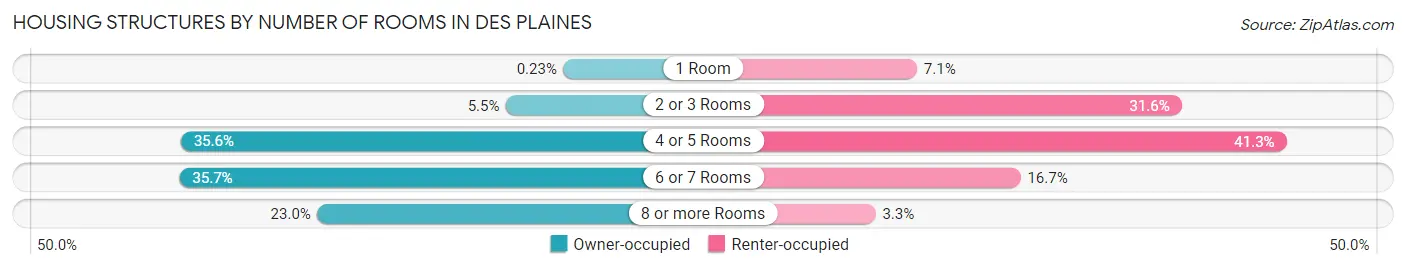
| Number of Rooms | Owner-occupied | Renter-occupied |
| 1 Room | 42 (0.2%) | 348 (7.1%) |
| 2 or 3 Rooms | 998 (5.5%) | 1,544 (31.6%) |
| 4 or 5 Rooms | 6,400 (35.6%) | 2,018 (41.3%) |
| 6 or 7 Rooms | 6,422 (35.7%) | 816 (16.7%) |
| 8 or more Rooms | 4,138 (23.0%) | 161 (3.3%) |
| Total | 18,000 (100.0%) | 4,887 (100.0%) |
Housing Structure by Heating Type in Des Plaines
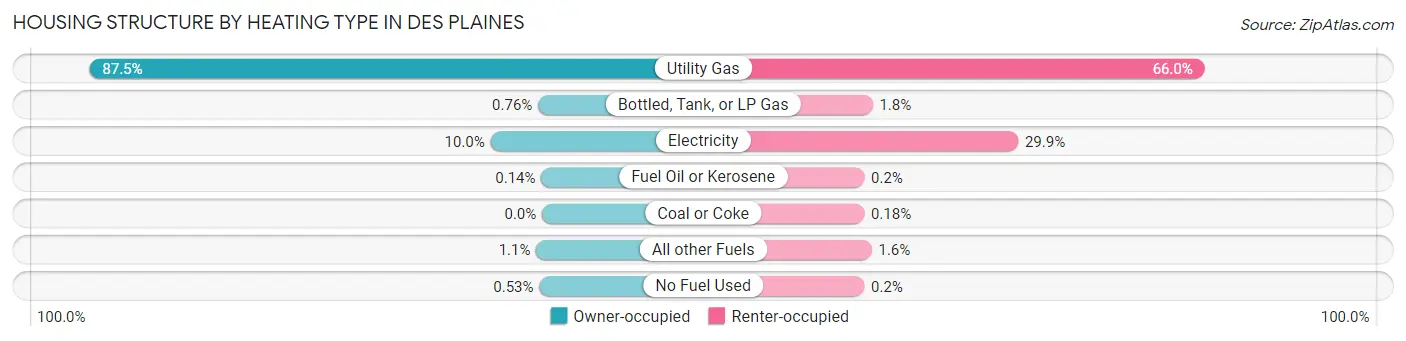
| Heating Type | Owner-occupied | Renter-occupied |
| Utility Gas | 15,746 (87.5%) | 3,226 (66.0%) |
| Bottled, Tank, or LP Gas | 136 (0.8%) | 89 (1.8%) |
| Electricity | 1,795 (10.0%) | 1,463 (29.9%) |
| Fuel Oil or Kerosene | 26 (0.1%) | 10 (0.2%) |
| Coal or Coke | 0 (0.0%) | 9 (0.2%) |
| All other Fuels | 202 (1.1%) | 80 (1.6%) |
| No Fuel Used | 95 (0.5%) | 10 (0.2%) |
| Total | 18,000 (100.0%) | 4,887 (100.0%) |
Household Vehicle Usage in Des Plaines
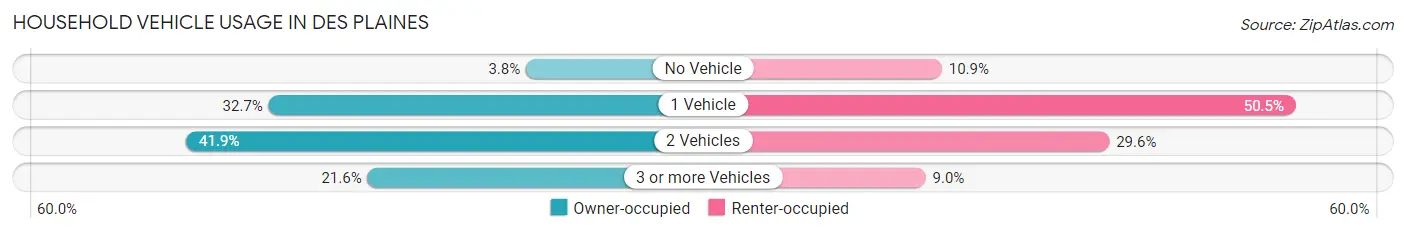
| Vehicles per Household | Owner-occupied | Renter-occupied |
| No Vehicle | 690 (3.8%) | 530 (10.8%) |
| 1 Vehicle | 5,879 (32.7%) | 2,468 (50.5%) |
| 2 Vehicles | 7,544 (41.9%) | 1,447 (29.6%) |
| 3 or more Vehicles | 3,887 (21.6%) | 442 (9.0%) |
| Total | 18,000 (100.0%) | 4,887 (100.0%) |
Real Estate & Mortgages in Des Plaines
Real Estate and Mortgage Overview in Des Plaines
| Characteristic | Without Mortgage | With Mortgage |
| Housing Units | 6,930 | 11,070 |
| Median Property Value | $280,600 | $320,200 |
| Median Household Income | $73,644 | $3,354 |
| Monthly Housing Costs | $810 | $1,617 |
| Real Estate Taxes | $5,645 | $183 |
Property Value by Mortgage Status in Des Plaines
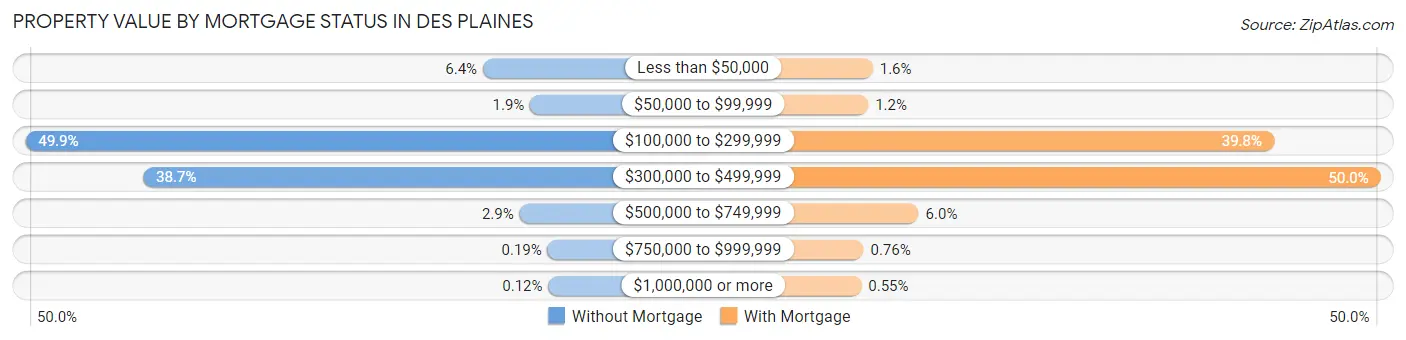
| Property Value | Without Mortgage | With Mortgage |
| Less than $50,000 | 440 (6.4%) | 182 (1.6%) |
| $50,000 to $99,999 | 128 (1.8%) | 134 (1.2%) |
| $100,000 to $299,999 | 3,460 (49.9%) | 4,409 (39.8%) |
| $300,000 to $499,999 | 2,683 (38.7%) | 5,535 (50.0%) |
| $500,000 to $749,999 | 198 (2.9%) | 665 (6.0%) |
| $750,000 to $999,999 | 13 (0.2%) | 84 (0.8%) |
| $1,000,000 or more | 8 (0.1%) | 61 (0.5%) |
| Total | 6,930 (100.0%) | 11,070 (100.0%) |
Household Income by Mortgage Status in Des Plaines
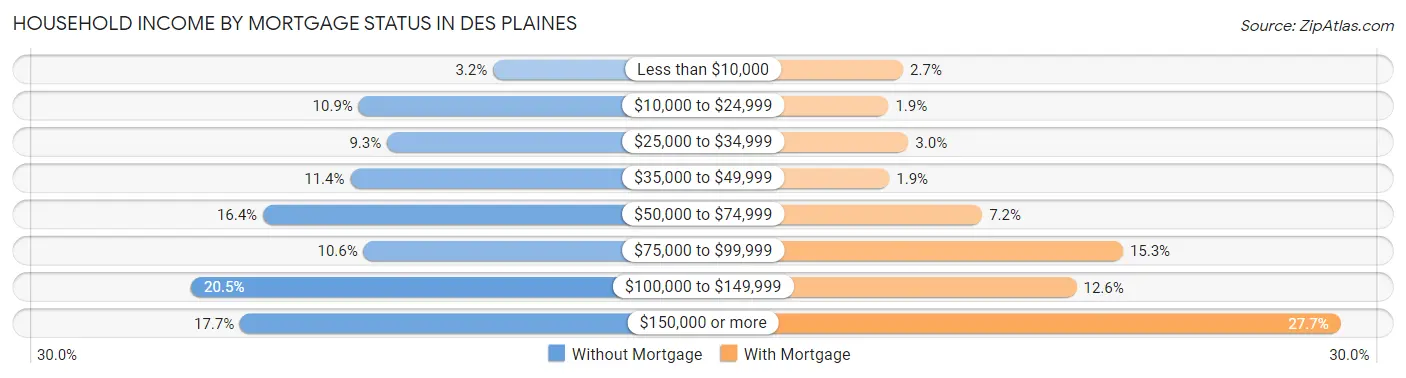
| Household Income | Without Mortgage | With Mortgage |
| Less than $10,000 | 224 (3.2%) | 301 (2.7%) |
| $10,000 to $24,999 | 756 (10.9%) | 208 (1.9%) |
| $25,000 to $34,999 | 644 (9.3%) | 334 (3.0%) |
| $35,000 to $49,999 | 789 (11.4%) | 214 (1.9%) |
| $50,000 to $74,999 | 1,135 (16.4%) | 802 (7.2%) |
| $75,000 to $99,999 | 737 (10.6%) | 1,692 (15.3%) |
| $100,000 to $149,999 | 1,419 (20.5%) | 1,398 (12.6%) |
| $150,000 or more | 1,226 (17.7%) | 3,068 (27.7%) |
| Total | 6,930 (100.0%) | 11,070 (100.0%) |
Property Value to Household Income Ratio in Des Plaines
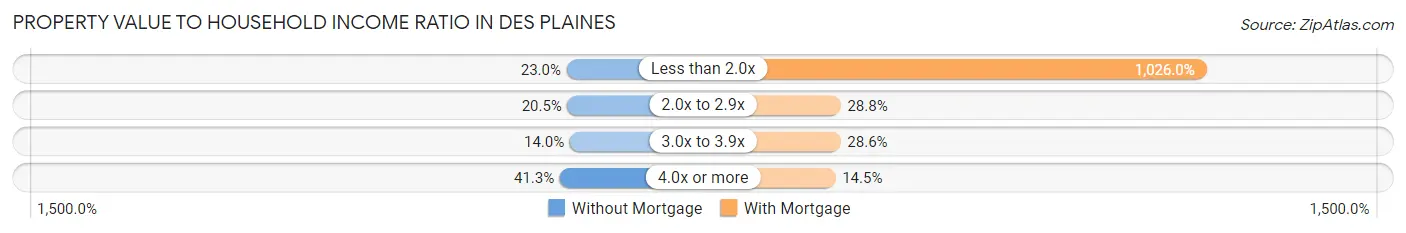
| Value-to-Income Ratio | Without Mortgage | With Mortgage |
| Less than 2.0x | 1,594 (23.0%) | 113,583 (1,026.0%) |
| 2.0x to 2.9x | 1,422 (20.5%) | 3,183 (28.7%) |
| 3.0x to 3.9x | 970 (14.0%) | 3,165 (28.6%) |
| 4.0x or more | 2,862 (41.3%) | 1,602 (14.5%) |
| Total | 6,930 (100.0%) | 11,070 (100.0%) |
Real Estate Taxes by Mortgage Status in Des Plaines
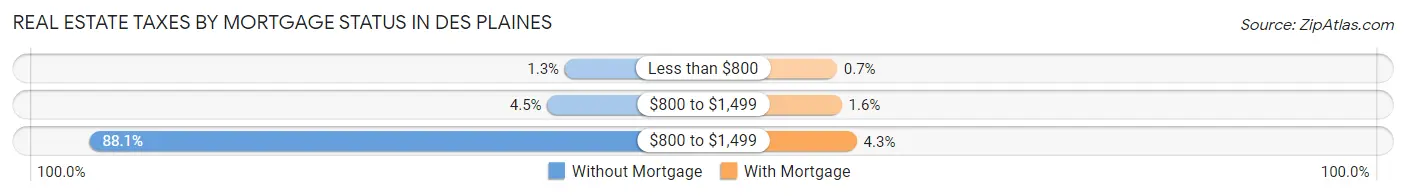
| Property Taxes | Without Mortgage | With Mortgage |
| Less than $800 | 91 (1.3%) | 78 (0.7%) |
| $800 to $1,499 | 312 (4.5%) | 173 (1.6%) |
| $800 to $1,499 | 6,106 (88.1%) | 477 (4.3%) |
| Total | 6,930 (100.0%) | 11,070 (100.0%) |
Health & Disability in Des Plaines
Health Insurance Coverage by Age in Des Plaines
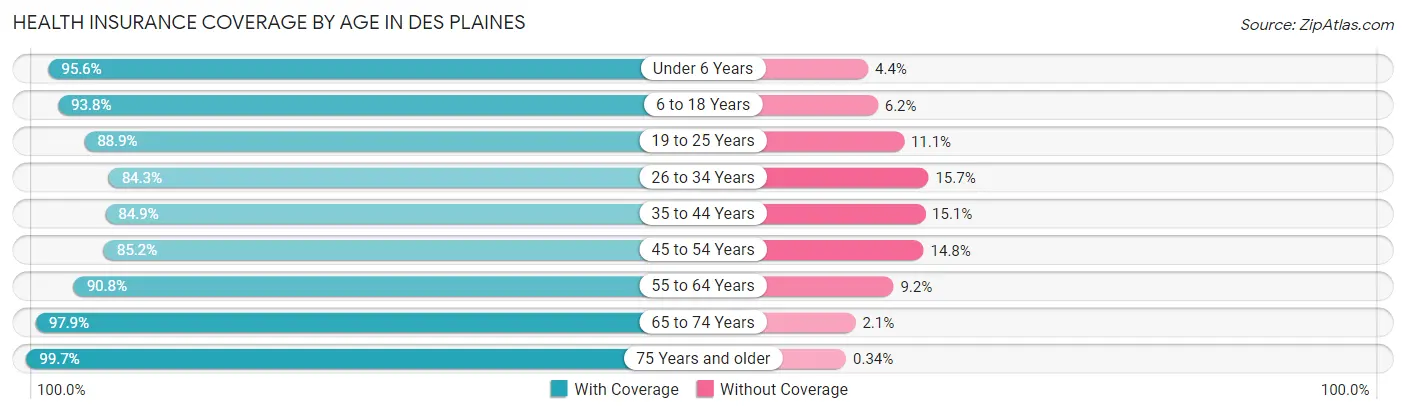
| Age Bracket | With Coverage | Without Coverage |
| Under 6 Years | 3,447 (95.6%) | 160 (4.4%) |
| 6 to 18 Years | 8,486 (93.8%) | 565 (6.2%) |
| 19 to 25 Years | 3,829 (88.9%) | 479 (11.1%) |
| 26 to 34 Years | 5,848 (84.3%) | 1,089 (15.7%) |
| 35 to 44 Years | 6,494 (84.9%) | 1,152 (15.1%) |
| 45 to 54 Years | 6,336 (85.2%) | 1,100 (14.8%) |
| 55 to 64 Years | 7,995 (90.8%) | 807 (9.2%) |
| 65 to 74 Years | 5,864 (97.9%) | 125 (2.1%) |
| 75 Years and older | 5,298 (99.7%) | 18 (0.3%) |
| Total | 53,597 (90.7%) | 5,495 (9.3%) |
Health Insurance Coverage by Citizenship Status in Des Plaines

| Citizenship Status | With Coverage | Without Coverage |
| Native Born | 3,447 (95.6%) | 160 (4.4%) |
| Foreign Born, Citizen | 8,486 (93.8%) | 565 (6.2%) |
| Foreign Born, not a Citizen | 3,829 (88.9%) | 479 (11.1%) |
Health Insurance Coverage by Household Income in Des Plaines
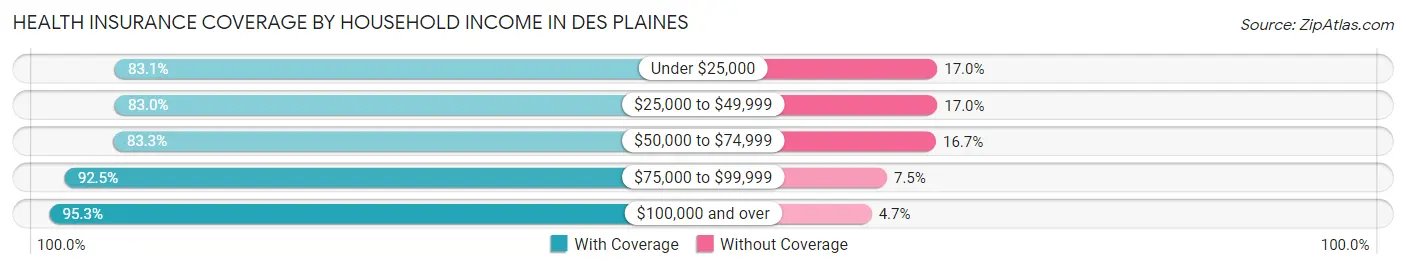
| Household Income | With Coverage | Without Coverage |
| Under $25,000 | 3,757 (83.1%) | 767 (17.0%) |
| $25,000 to $49,999 | 5,504 (83.0%) | 1,125 (17.0%) |
| $50,000 to $74,999 | 7,987 (83.3%) | 1,603 (16.7%) |
| $75,000 to $99,999 | 6,023 (92.5%) | 491 (7.5%) |
| $100,000 and over | 30,221 (95.3%) | 1,480 (4.7%) |
Public vs Private Health Insurance Coverage by Age in Des Plaines
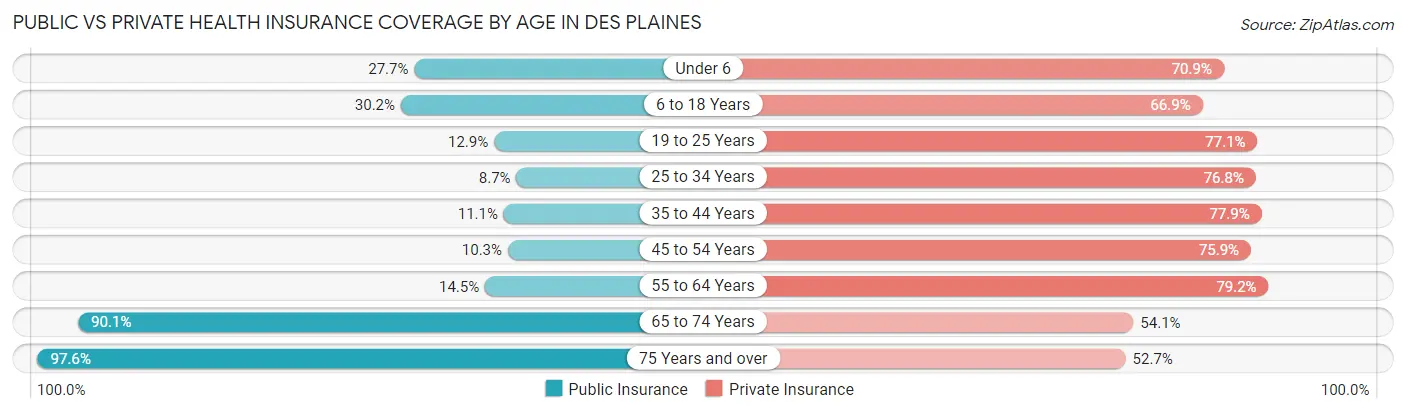
| Age Bracket | Public Insurance | Private Insurance |
| Under 6 | 998 (27.7%) | 2,557 (70.9%) |
| 6 to 18 Years | 2,730 (30.2%) | 6,059 (66.9%) |
| 19 to 25 Years | 554 (12.9%) | 3,323 (77.1%) |
| 25 to 34 Years | 604 (8.7%) | 5,330 (76.8%) |
| 35 to 44 Years | 845 (11.1%) | 5,956 (77.9%) |
| 45 to 54 Years | 766 (10.3%) | 5,647 (75.9%) |
| 55 to 64 Years | 1,280 (14.5%) | 6,970 (79.2%) |
| 65 to 74 Years | 5,394 (90.1%) | 3,242 (54.1%) |
| 75 Years and over | 5,188 (97.6%) | 2,801 (52.7%) |
| Total | 18,359 (31.1%) | 41,885 (70.9%) |
Disability Status by Sex by Age in Des Plaines
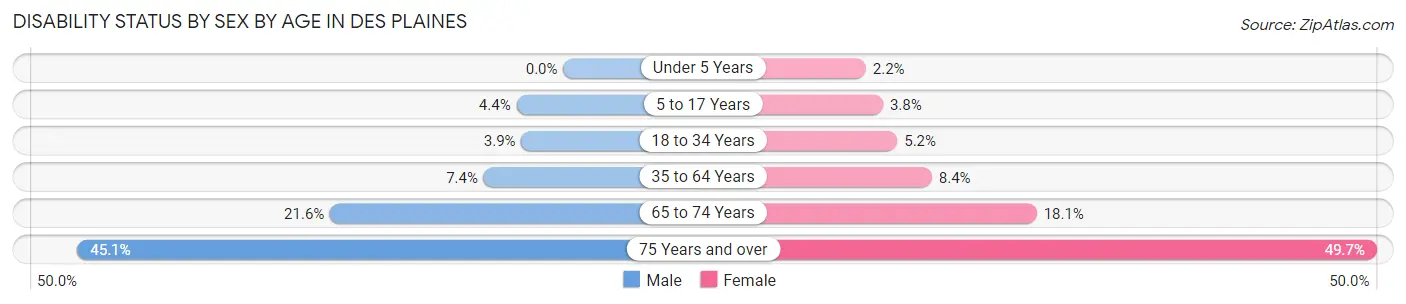
| Age Bracket | Male | Female |
| Under 5 Years | 0 (0.0%) | 37 (2.2%) |
| 5 to 17 Years | 206 (4.3%) | 167 (3.8%) |
| 18 to 34 Years | 235 (3.9%) | 290 (5.1%) |
| 35 to 64 Years | 863 (7.4%) | 1,019 (8.4%) |
| 65 to 74 Years | 637 (21.6%) | 551 (18.1%) |
| 75 Years and over | 897 (45.1%) | 1,652 (49.6%) |
Disability Class by Sex by Age in Des Plaines
Disability Class: Hearing Difficulty
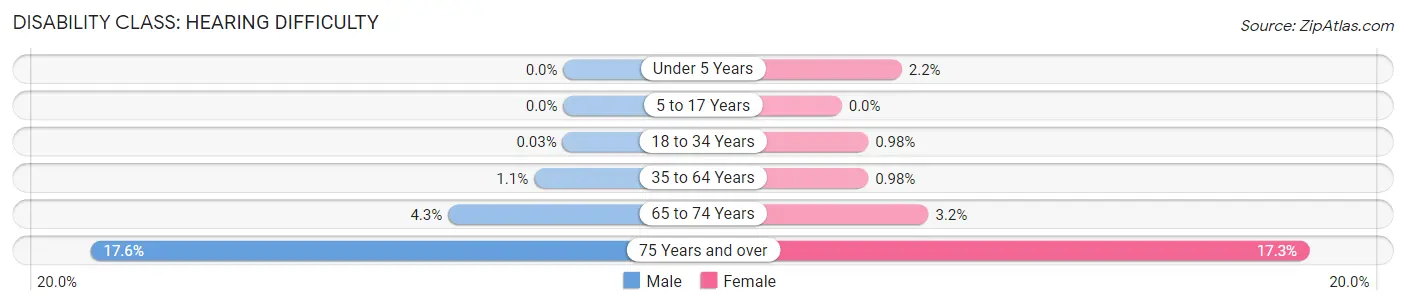
| Age Bracket | Male | Female |
| Under 5 Years | 0 (0.0%) | 37 (2.2%) |
| 5 to 17 Years | 0 (0.0%) | 0 (0.0%) |
| 18 to 34 Years | 2 (0.0%) | 55 (1.0%) |
| 35 to 64 Years | 127 (1.1%) | 119 (1.0%) |
| 65 to 74 Years | 126 (4.3%) | 98 (3.2%) |
| 75 Years and over | 349 (17.5%) | 577 (17.3%) |
Disability Class: Vision Difficulty
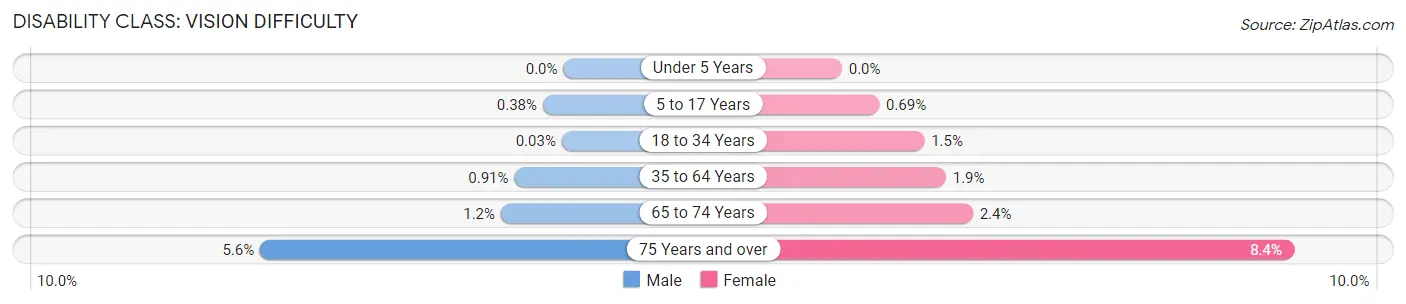
| Age Bracket | Male | Female |
| Under 5 Years | 0 (0.0%) | 0 (0.0%) |
| 5 to 17 Years | 18 (0.4%) | 30 (0.7%) |
| 18 to 34 Years | 2 (0.0%) | 86 (1.5%) |
| 35 to 64 Years | 106 (0.9%) | 235 (1.9%) |
| 65 to 74 Years | 34 (1.2%) | 74 (2.4%) |
| 75 Years and over | 112 (5.6%) | 279 (8.4%) |
Disability Class: Cognitive Difficulty
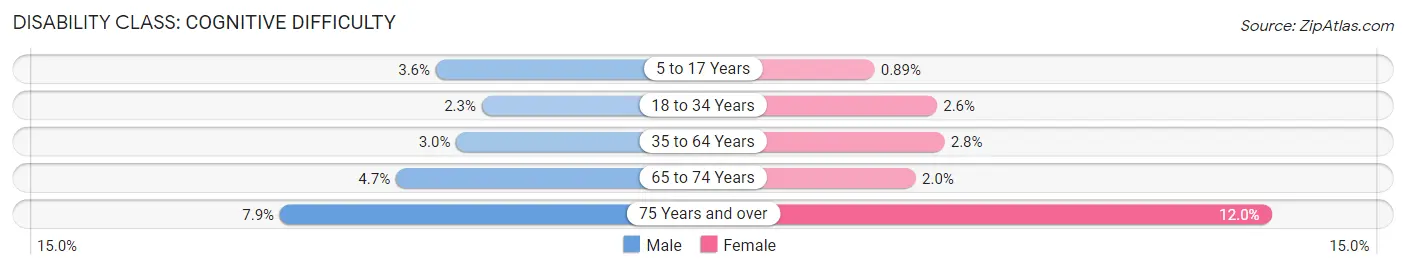
| Age Bracket | Male | Female |
| 5 to 17 Years | 168 (3.5%) | 39 (0.9%) |
| 18 to 34 Years | 137 (2.3%) | 148 (2.6%) |
| 35 to 64 Years | 348 (3.0%) | 346 (2.8%) |
| 65 to 74 Years | 137 (4.7%) | 62 (2.0%) |
| 75 Years and over | 157 (7.9%) | 398 (12.0%) |
Disability Class: Ambulatory Difficulty
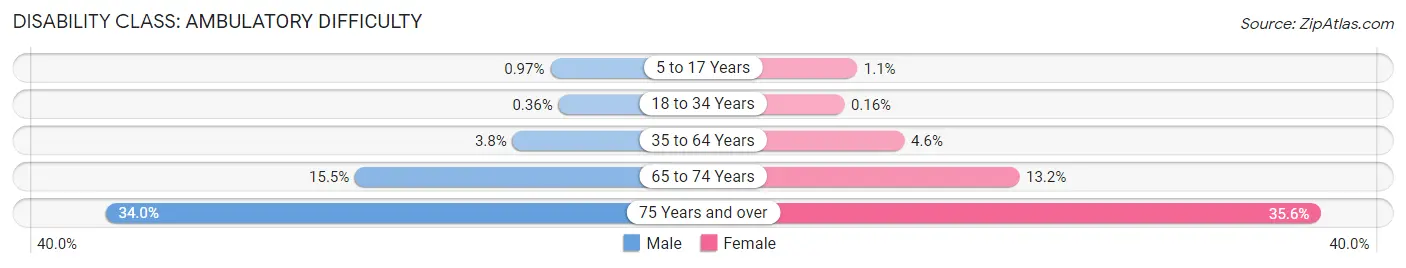
| Age Bracket | Male | Female |
| 5 to 17 Years | 46 (1.0%) | 49 (1.1%) |
| 18 to 34 Years | 22 (0.4%) | 9 (0.2%) |
| 35 to 64 Years | 441 (3.8%) | 565 (4.6%) |
| 65 to 74 Years | 455 (15.5%) | 401 (13.2%) |
| 75 Years and over | 676 (34.0%) | 1,184 (35.6%) |
Disability Class: Self-Care Difficulty
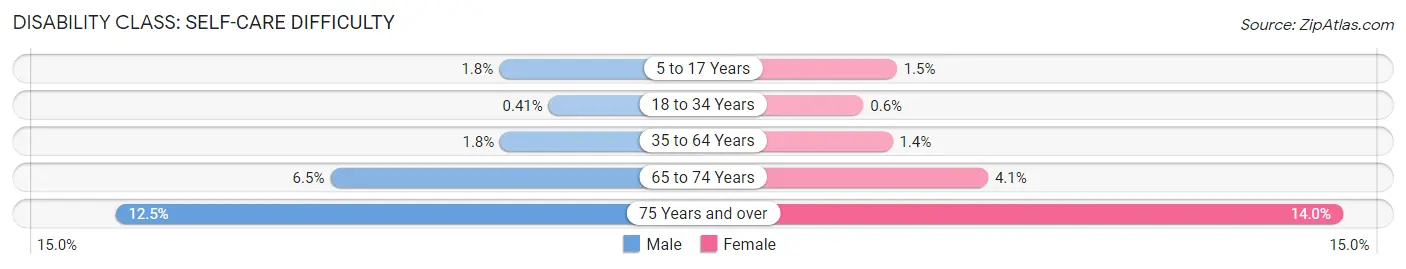
| Age Bracket | Male | Female |
| 5 to 17 Years | 85 (1.8%) | 67 (1.5%) |
| 18 to 34 Years | 25 (0.4%) | 34 (0.6%) |
| 35 to 64 Years | 206 (1.8%) | 172 (1.4%) |
| 65 to 74 Years | 191 (6.5%) | 124 (4.1%) |
| 75 Years and over | 248 (12.5%) | 464 (14.0%) |
Technology Access in Des Plaines
Computing Device Access in Des Plaines
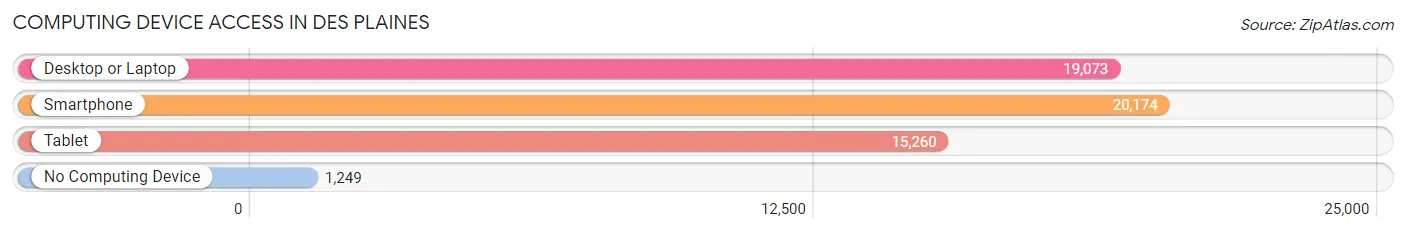
| Device Type | # Households | % Households |
| Desktop or Laptop | 19,073 | 83.3% |
| Smartphone | 20,174 | 88.1% |
| Tablet | 15,260 | 66.7% |
| No Computing Device | 1,249 | 5.5% |
| Total | 22,887 | 100.0% |
Internet Access in Des Plaines
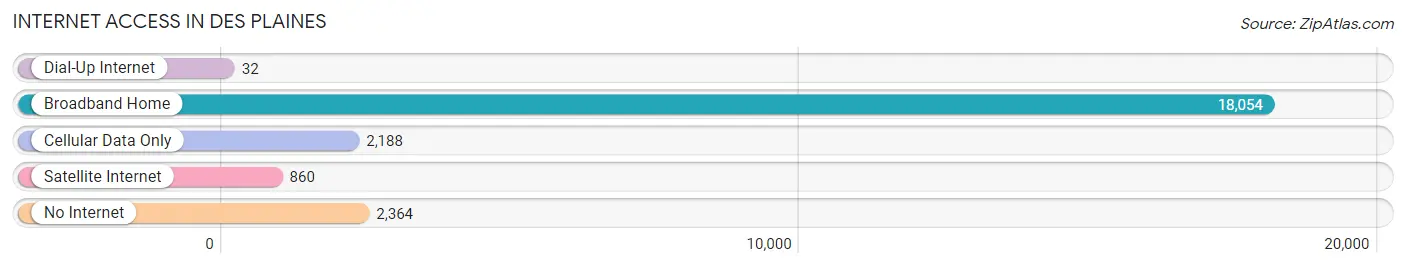
| Internet Type | # Households | % Households |
| Dial-Up Internet | 32 | 0.1% |
| Broadband Home | 18,054 | 78.9% |
| Cellular Data Only | 2,188 | 9.6% |
| Satellite Internet | 860 | 3.8% |
| No Internet | 2,364 | 10.3% |
| Total | 22,887 | 100.0% |
Des Plaines Summary
Des Plaines, Illinois is a city located in Cook County, Illinois, United States. It is a suburb of Chicago and is located approximately 15 miles northwest of the city. As of the 2010 census, the population of Des Plaines was 58,364.
History
The area that is now Des Plaines was originally inhabited by the Potawatomi Native American tribe. The first non-native settlers arrived in the area in the early 19th century. The first permanent settler was a man named Jesse F. Foster, who arrived in 1835. Foster built a log cabin and began farming the land.
In 1839, the first post office was established in the area and the town was named after the Des Plaines River, which runs through the area. The town was officially incorporated in 1857.
In the late 19th century, the area began to grow rapidly as the Chicago and North Western Railway built a line through the town. This allowed for easy access to Chicago and the surrounding area.
In the early 20th century, Des Plaines became a popular destination for Chicagoans looking to escape the city. The town was known for its many parks and recreational areas, as well as its proximity to the Des Plaines River.
In the 1950s, the town began to experience a population boom as many people moved to the area from Chicago. This population boom continued into the 1960s and 1970s, and the town’s population grew to over 58,000 by the 2010 census.
Geography
Des Plaines is located in northeastern Illinois, approximately 15 miles northwest of Chicago. The city is situated on the Des Plaines River, which runs through the city. The city is bordered by the cities of Park Ridge to the north, Niles to the east, Glenview to the south, and Mount Prospect to the west.
The city has a total area of 8.9 square miles, of which 8.7 square miles is land and 0.2 square miles is water. The city is located at an elevation of 645 feet above sea level.
Economy
Des Plaines is home to a variety of businesses and industries. The city is home to several large corporations, including Allstate Insurance, Baxter International, and the Chicago Tribune. The city is also home to a number of smaller businesses, including restaurants, retail stores, and professional services.
The city’s largest employer is the Allstate Insurance Company, which employs over 4,000 people in the city. Other major employers include Baxter International, the Chicago Tribune, and the City of Des Plaines.
Demographics
As of the 2010 census, the population of Des Plaines was 58,364. The racial makeup of the city was 75.3% White, 8.2% African American, 0.3% Native American, 8.2% Asian, and 4.2% from other races. Hispanic or Latino of any race were 13.3% of the population.
The median household income in Des Plaines was $60,945, and the median family income was $71,945. The per capita income for the city was $30,945. About 5.3% of families and 7.2% of the population were below the poverty line.
Common Questions
What is Per Capita Income in Des Plaines?
Per Capita income in Des Plaines is $42,057.
What is the Median Family Income in Des Plaines?
Median Family Income in Des Plaines is $106,684.
What is the Median Household income in Des Plaines?
Median Household Income in Des Plaines is $86,552.
What is Income or Wage Gap in Des Plaines?
Income or Wage Gap in Des Plaines is 30.5%.
Women in Des Plaines earn 69.5 cents for every dollar earned by a man.
What is Family Income Deficit in Des Plaines?
Family Income Deficit in Des Plaines is $13,986.
Families that are below poverty line in Des Plaines earn $13,986 less on average than the poverty threshold level.
What is Inequality or Gini Index in Des Plaines?
Inequality or Gini Index in Des Plaines is 0.42.
What is the Total Population of Des Plaines?
Total Population of Des Plaines is 60,087.
What is the Total Male Population of Des Plaines?
Total Male Population of Des Plaines is 29,437.
What is the Total Female Population of Des Plaines?
Total Female Population of Des Plaines is 30,650.
What is the Ratio of Males per 100 Females in Des Plaines?
There are 96.04 Males per 100 Females in Des Plaines.
What is the Ratio of Females per 100 Males in Des Plaines?
There are 104.12 Females per 100 Males in Des Plaines.
What is the Median Population Age in Des Plaines?
Median Population Age in Des Plaines is 42.5 Years.
What is the Average Family Size in Des Plaines
Average Family Size in Des Plaines is 3.2 People.
What is the Average Household Size in Des Plaines
Average Household Size in Des Plaines is 2.6 People.
How Large is the Labor Force in Des Plaines?
There are 32,154 People in the Labor Forcein in Des Plaines.
What is the Percentage of People in the Labor Force in Des Plaines?
65.3% of People are in the Labor Force in Des Plaines.
What is the Unemployment Rate in Des Plaines?
Unemployment Rate in Des Plaines is 4.6%.