Wilmington, NC Map & Demographics
Wilmington Map
Wilmington Overview
$42,750
PER CAPITA INCOME
$84,883
AVG FAMILY INCOME
$58,908
AVG HOUSEHOLD INCOME
28.2%
WAGE / INCOME GAP [ % ]
71.8¢/ $1
WAGE / INCOME GAP [ $ ]
$11,000
FAMILY INCOME DEFICIT
0.52
INEQUALITY / GINI INDEX
116,933
TOTAL POPULATION
54,588
MALE POPULATION
62,345
FEMALE POPULATION
87.56
MALES / 100 FEMALES
114.21
FEMALES / 100 MALES
37.6
MEDIAN AGE
2.9
AVG FAMILY SIZE
2.1
AVG HOUSEHOLD SIZE
63,857
LABOR FORCE [ PEOPLE ]
64.2%
PERCENT IN LABOR FORCE
4.9%
UNEMPLOYMENT RATE
Wilmington Area Codes
Income in Wilmington
Income Overview in Wilmington
Per Capita Income in Wilmington is $42,750, while median incomes of families and households are $84,883 and $58,908 respectively.
| Characteristic | Number | Measure |
| Per Capita Income | 116,933 | $42,750 |
| Median Family Income | 25,182 | $84,883 |
| Mean Family Income | 25,182 | $127,809 |
| Median Household Income | 53,374 | $58,908 |
| Mean Household Income | 53,374 | $91,678 |
| Income Deficit | 25,182 | $11,000 |
| Wage / Income Gap (%) | 116,933 | 28.17% |
| Wage / Income Gap ($) | 116,933 | 71.83¢ per $1 |
| Gini / Inequality Index | 116,933 | 0.52 |
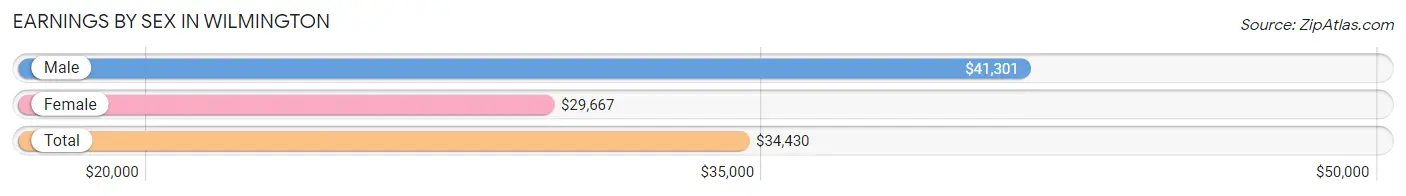
Earnings by Sex in Wilmington
Average Earnings in Wilmington are $34,430, $41,301 for men and $29,667 for women, a difference of 28.2%.
| Sex | Number | Average Earnings |
| Male | 33,204 (49.2%) | $41,301 |
| Female | 34,239 (50.8%) | $29,667 |
| Total | 67,443 (100.0%) | $34,430 |
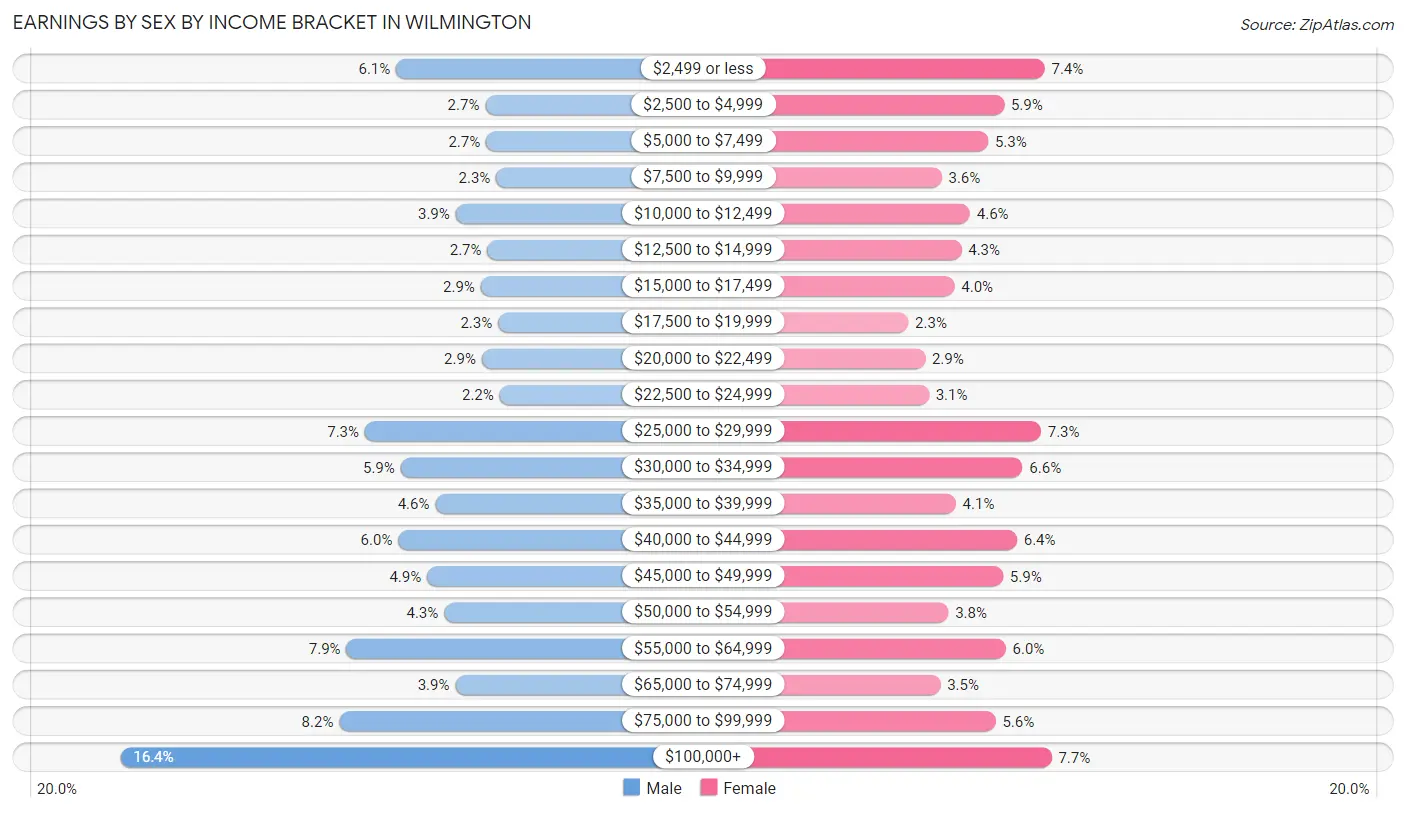
Earnings by Sex by Income Bracket in Wilmington
The most common earnings brackets in Wilmington are $100,000+ for men (5,450 | 16.4%) and $100,000+ for women (2,626 | 7.7%).
| Income | Male | Female |
| $2,499 or less | 2,020 (6.1%) | 2,536 (7.4%) |
| $2,500 to $4,999 | 910 (2.7%) | 2,015 (5.9%) |
| $5,000 to $7,499 | 900 (2.7%) | 1,812 (5.3%) |
| $7,500 to $9,999 | 773 (2.3%) | 1,216 (3.5%) |
| $10,000 to $12,499 | 1,280 (3.8%) | 1,577 (4.6%) |
| $12,500 to $14,999 | 882 (2.7%) | 1,470 (4.3%) |
| $15,000 to $17,499 | 965 (2.9%) | 1,380 (4.0%) |
| $17,500 to $19,999 | 750 (2.3%) | 787 (2.3%) |
| $20,000 to $22,499 | 954 (2.9%) | 1,004 (2.9%) |
| $22,500 to $24,999 | 729 (2.2%) | 1,050 (3.1%) |
| $25,000 to $29,999 | 2,408 (7.2%) | 2,490 (7.3%) |
| $30,000 to $34,999 | 1,964 (5.9%) | 2,254 (6.6%) |
| $35,000 to $39,999 | 1,531 (4.6%) | 1,397 (4.1%) |
| $40,000 to $44,999 | 1,993 (6.0%) | 2,180 (6.4%) |
| $45,000 to $49,999 | 1,632 (4.9%) | 2,002 (5.9%) |
| $50,000 to $54,999 | 1,420 (4.3%) | 1,302 (3.8%) |
| $55,000 to $64,999 | 2,636 (7.9%) | 2,038 (5.9%) |
| $65,000 to $74,999 | 1,282 (3.9%) | 1,197 (3.5%) |
| $75,000 to $99,999 | 2,725 (8.2%) | 1,906 (5.6%) |
| $100,000+ | 5,450 (16.4%) | 2,626 (7.7%) |
| Total | 33,204 (100.0%) | 34,239 (100.0%) |
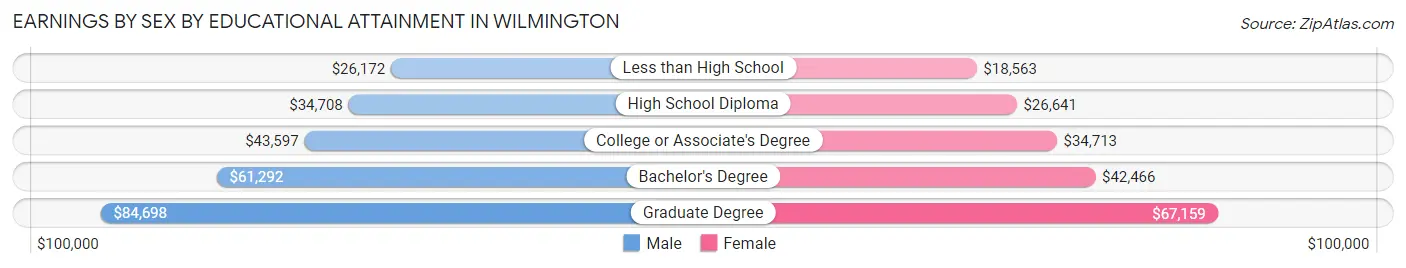
Earnings by Sex by Educational Attainment in Wilmington
Average earnings in Wilmington are $49,636 for men and $38,661 for women, a difference of 22.1%. Men with an educational attainment of graduate degree enjoy the highest average annual earnings of $84,698, while those with less than high school education earn the least with $26,172. Women with an educational attainment of graduate degree earn the most with the average annual earnings of $67,159, while those with less than high school education have the smallest earnings of $18,563.
| Educational Attainment | Male Income | Female Income |
| Less than High School | $26,172 | $18,563 |
| High School Diploma | $34,708 | $26,641 |
| College or Associate's Degree | $43,597 | $34,713 |
| Bachelor's Degree | $61,292 | $42,466 |
| Graduate Degree | $84,698 | $67,159 |
| Total | $49,636 | $38,661 |
Family Income in Wilmington
Family Income Brackets in Wilmington
According to the Wilmington family income data, there are 4,986 families falling into the $100,000 to $149,999 income range, which is the most common income bracket and makes up 19.8% of all families. Conversely, the $10,000 to $14,999 income bracket is the least frequent group with only 806 families (3.2%) belonging to this category.
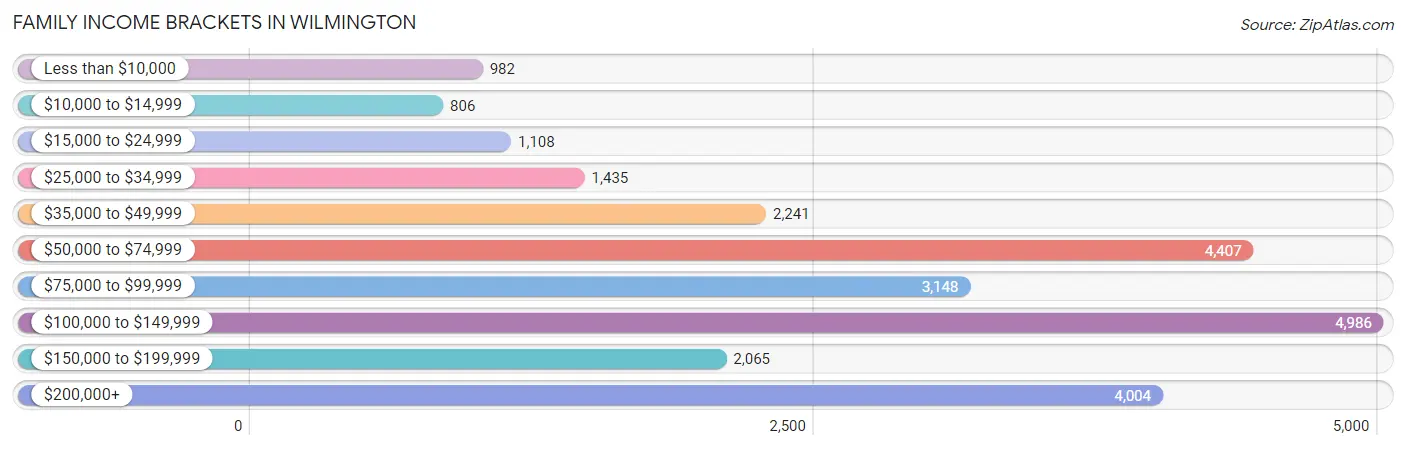
| Income Bracket | # Families | % Families |
| Less than $10,000 | 982 | 3.9% |
| $10,000 to $14,999 | 806 | 3.2% |
| $15,000 to $24,999 | 1,108 | 4.4% |
| $25,000 to $34,999 | 1,435 | 5.7% |
| $35,000 to $49,999 | 2,241 | 8.9% |
| $50,000 to $74,999 | 4,407 | 17.5% |
| $75,000 to $99,999 | 3,148 | 12.5% |
| $100,000 to $149,999 | 4,986 | 19.8% |
| $150,000 to $199,999 | 2,065 | 8.2% |
| $200,000+ | 4,004 | 15.9% |
Family Income by Famaliy Size in Wilmington
4-person families (3,610 | 14.3%) account for the highest median family income in Wilmington with $124,362 per family, while 2-person families (14,927 | 59.3%) have the highest median income of $40,952 per family member.
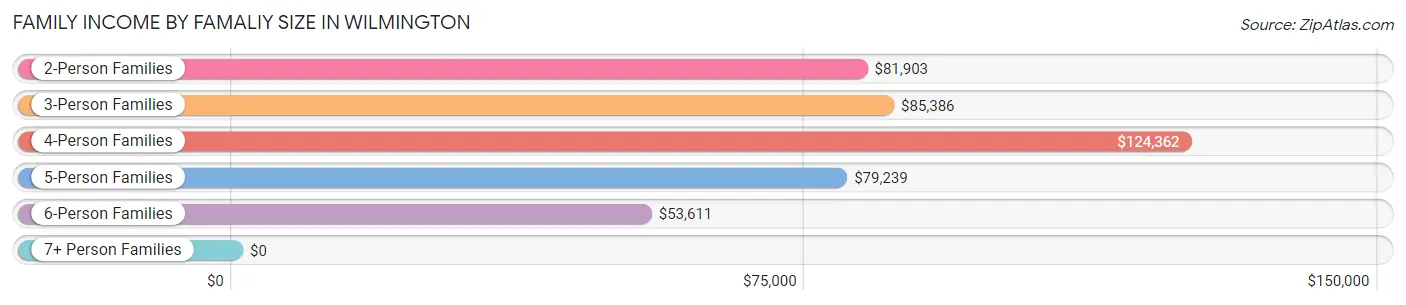
| Income Bracket | # Families | Median Income |
| 2-Person Families | 14,927 (59.3%) | $81,903 |
| 3-Person Families | 4,953 (19.7%) | $85,386 |
| 4-Person Families | 3,610 (14.3%) | $124,362 |
| 5-Person Families | 1,284 (5.1%) | $79,239 |
| 6-Person Families | 352 (1.4%) | $53,611 |
| 7+ Person Families | 56 (0.2%) | $0 |
| Total | 25,182 (100.0%) | $84,883 |
Family Income by Number of Earners in Wilmington
The median family income in Wilmington is $84,883, with families comprising 3+ earners (1,777) having the highest median family income of $128,922, while families with no earners (4,555) have the lowest median family income of $59,063, accounting for 7.1% and 18.1% of families, respectively.
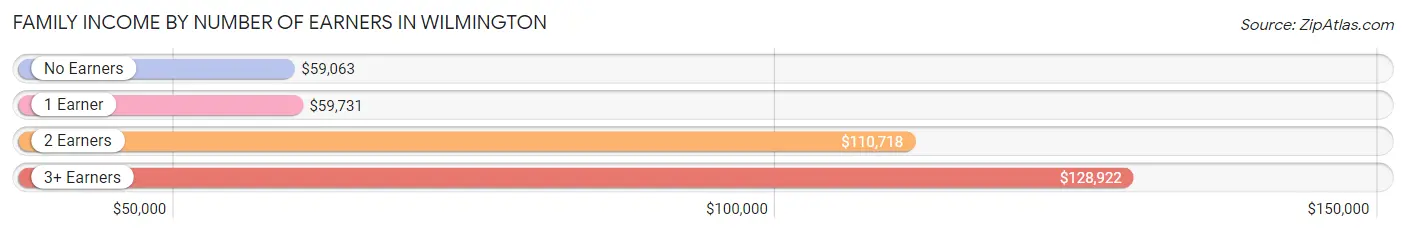
| Number of Earners | # Families | Median Income |
| No Earners | 4,555 (18.1%) | $59,063 |
| 1 Earner | 8,485 (33.7%) | $59,731 |
| 2 Earners | 10,365 (41.2%) | $110,718 |
| 3+ Earners | 1,777 (7.1%) | $128,922 |
| Total | 25,182 (100.0%) | $84,883 |
Household Income in Wilmington
Household Income Brackets in Wilmington
With 9,981 households falling in the category, the $50,000 to $74,999 income range is the most frequent in Wilmington, accounting for 18.7% of all households. In contrast, only 2,562 households (4.8%) fall into the $10,000 to $14,999 income bracket, making it the least populous group.
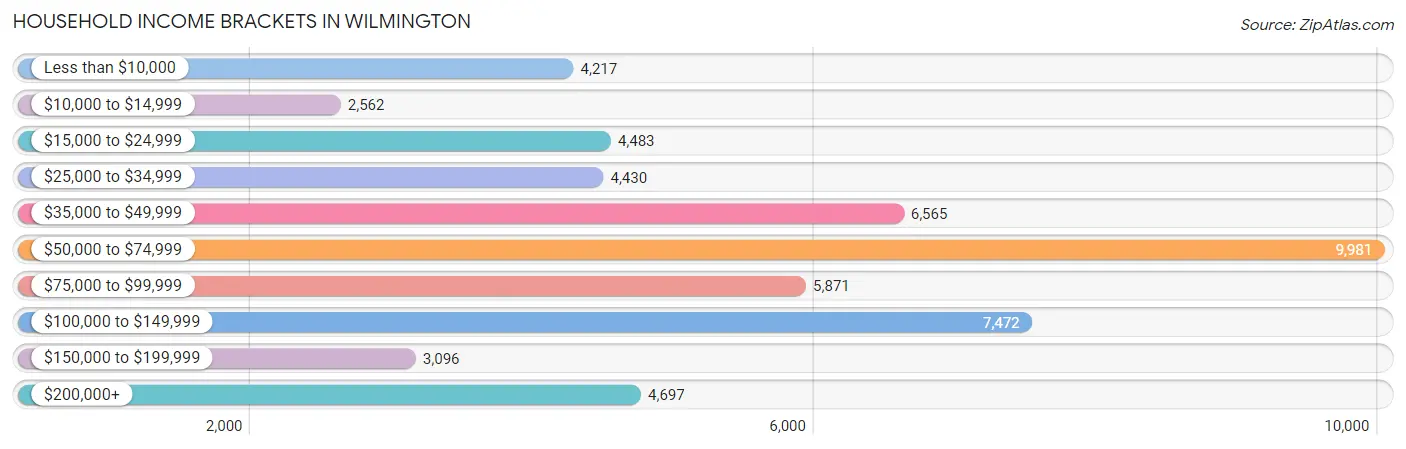
| Income Bracket | # Households | % Households |
| Less than $10,000 | 4,217 | 7.9% |
| $10,000 to $14,999 | 2,562 | 4.8% |
| $15,000 to $24,999 | 4,483 | 8.4% |
| $25,000 to $34,999 | 4,430 | 8.3% |
| $35,000 to $49,999 | 6,565 | 12.3% |
| $50,000 to $74,999 | 9,981 | 18.7% |
| $75,000 to $99,999 | 5,871 | 11.0% |
| $100,000 to $149,999 | 7,472 | 14.0% |
| $150,000 to $199,999 | 3,096 | 5.8% |
| $200,000+ | 4,697 | 8.8% |
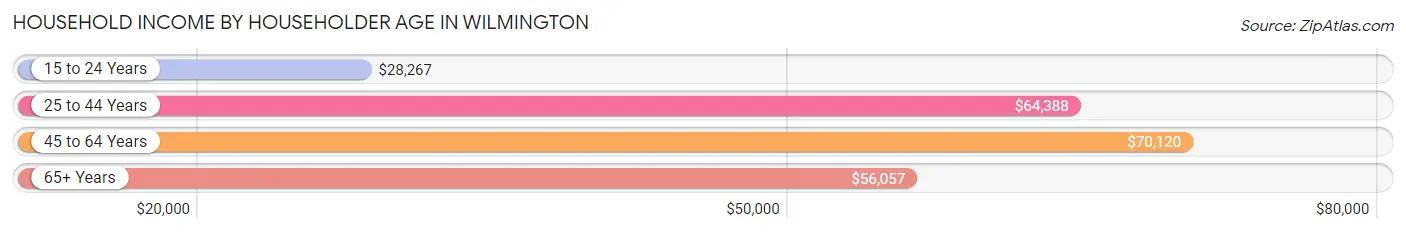
Household Income by Householder Age in Wilmington
The median household income in Wilmington is $58,908, with the highest median household income of $70,120 found in the 45 to 64 years age bracket for the primary householder. A total of 16,967 households (31.8%) fall into this category. Meanwhile, the 15 to 24 years age bracket for the primary householder has the lowest median household income of $28,267, with 5,213 households (9.8%) in this group.
| Income Bracket | # Households | Median Income |
| 15 to 24 Years | 5,213 (9.8%) | $28,267 |
| 25 to 44 Years | 16,919 (31.7%) | $64,388 |
| 45 to 64 Years | 16,967 (31.8%) | $70,120 |
| 65+ Years | 14,275 (26.8%) | $56,057 |
| Total | 53,374 (100.0%) | $58,908 |
Poverty in Wilmington
Income Below Poverty by Sex and Age in Wilmington
With 15.5% poverty level for males and 19.8% for females among the residents of Wilmington, 5 year old males and 18 to 24 year old females are the most vulnerable to poverty, with 263 males (39.1%) and 3,640 females (44.8%) in their respective age groups living below the poverty level.
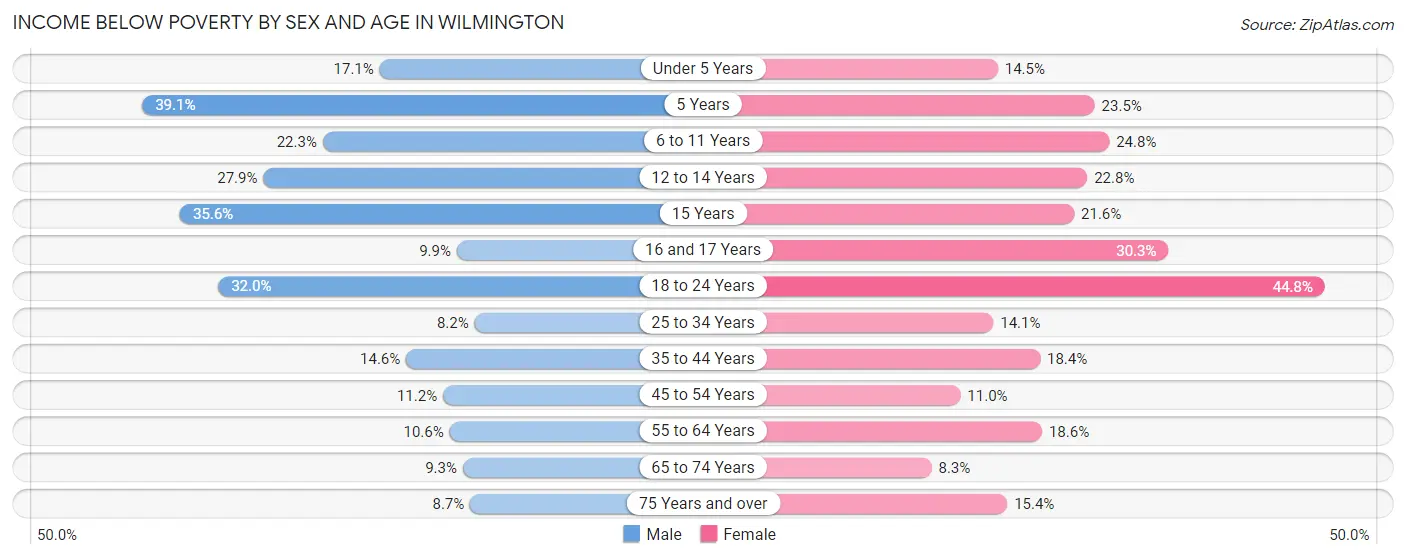
| Age Bracket | Male | Female |
| Under 5 Years | 469 (17.1%) | 316 (14.5%) |
| 5 Years | 263 (39.1%) | 111 (23.5%) |
| 6 to 11 Years | 810 (22.3%) | 809 (24.8%) |
| 12 to 14 Years | 342 (27.9%) | 395 (22.8%) |
| 15 Years | 211 (35.6%) | 152 (21.6%) |
| 16 and 17 Years | 113 (9.9%) | 306 (30.3%) |
| 18 to 24 Years | 2,200 (32.0%) | 3,640 (44.8%) |
| 25 to 34 Years | 665 (8.2%) | 1,201 (14.1%) |
| 35 to 44 Years | 935 (14.6%) | 1,331 (18.4%) |
| 45 to 54 Years | 715 (11.2%) | 669 (11.0%) |
| 55 to 64 Years | 722 (10.6%) | 1,541 (18.6%) |
| 65 to 74 Years | 456 (9.3%) | 572 (8.3%) |
| 75 Years and over | 299 (8.6%) | 801 (15.3%) |
| Total | 8,200 (15.5%) | 11,844 (19.8%) |
Income Above Poverty by Sex and Age in Wilmington
According to the poverty statistics in Wilmington, males aged 25 to 34 years and females aged 65 to 74 years are the age groups that are most secure financially, with 91.8% of males and 91.7% of females in these age groups living above the poverty line.
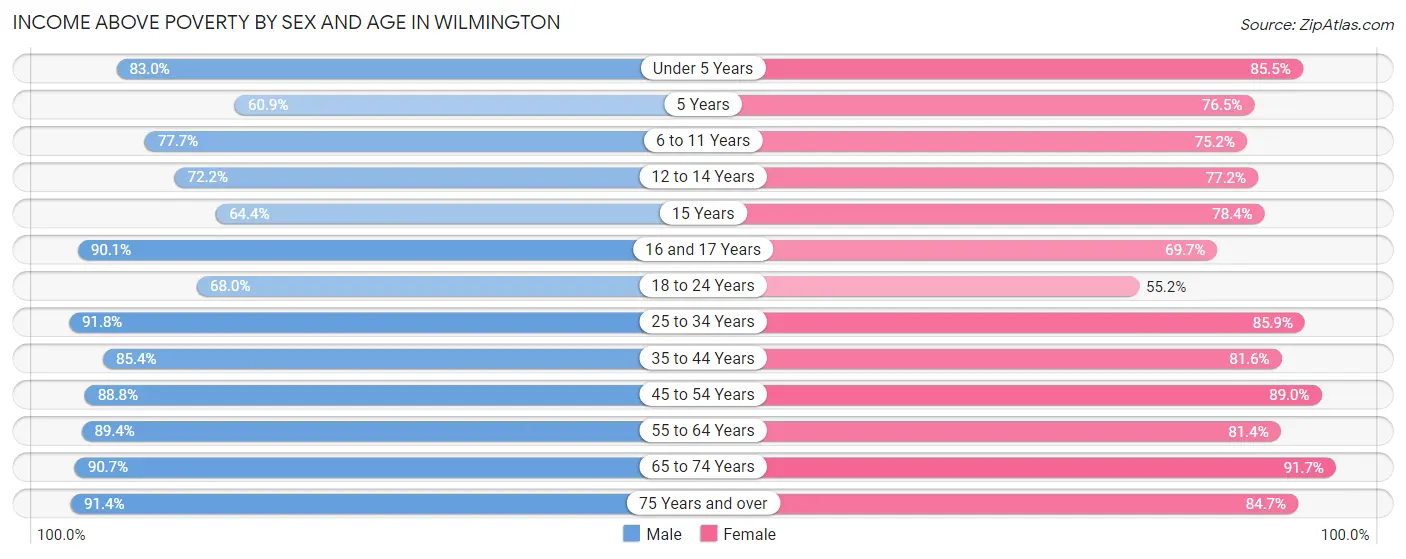
| Age Bracket | Male | Female |
| Under 5 Years | 2,281 (83.0%) | 1,866 (85.5%) |
| 5 Years | 410 (60.9%) | 362 (76.5%) |
| 6 to 11 Years | 2,817 (77.7%) | 2,450 (75.2%) |
| 12 to 14 Years | 886 (72.2%) | 1,339 (77.2%) |
| 15 Years | 382 (64.4%) | 553 (78.4%) |
| 16 and 17 Years | 1,030 (90.1%) | 704 (69.7%) |
| 18 to 24 Years | 4,668 (68.0%) | 4,481 (55.2%) |
| 25 to 34 Years | 7,402 (91.8%) | 7,342 (85.9%) |
| 35 to 44 Years | 5,475 (85.4%) | 5,903 (81.6%) |
| 45 to 54 Years | 5,688 (88.8%) | 5,408 (89.0%) |
| 55 to 64 Years | 6,117 (89.4%) | 6,751 (81.4%) |
| 65 to 74 Years | 4,432 (90.7%) | 6,292 (91.7%) |
| 75 Years and over | 3,157 (91.3%) | 4,418 (84.7%) |
| Total | 44,745 (84.5%) | 47,869 (80.2%) |
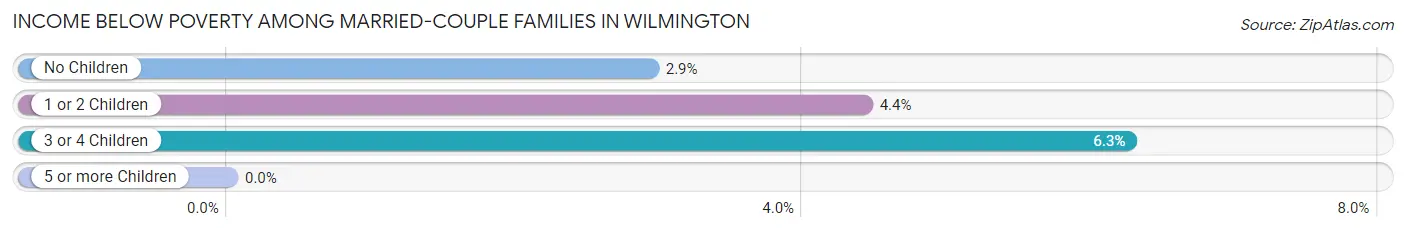
Income Below Poverty Among Married-Couple Families in Wilmington
The poverty statistics for married-couple families in Wilmington show that 3.5% or 646 of the total 18,324 families live below the poverty line. Families with 3 or 4 children have the highest poverty rate of 6.3%, comprising of 65 families. On the other hand, families with 5 or more children have the lowest poverty rate of 0.0%, which includes 0 families.
| Children | Above Poverty | Below Poverty |
| No Children | 11,922 (97.1%) | 360 (2.9%) |
| 1 or 2 Children | 4,775 (95.6%) | 221 (4.4%) |
| 3 or 4 Children | 973 (93.7%) | 65 (6.3%) |
| 5 or more Children | 8 (100.0%) | 0 (0.0%) |
| Total | 17,678 (96.5%) | 646 (3.5%) |
Income Below Poverty Among Single-Parent Households in Wilmington
According to the poverty data in Wilmington, 7.2% or 104 single-father households and 33.0% or 1,787 single-mother households are living below the poverty line. Among single-father households, those with 3 or 4 children have the highest poverty rate, with 18 households (20.2%) experiencing poverty. Likewise, among single-mother households, those with 5 or more children have the highest poverty rate, with 36 households (100.0%) falling below the poverty line.
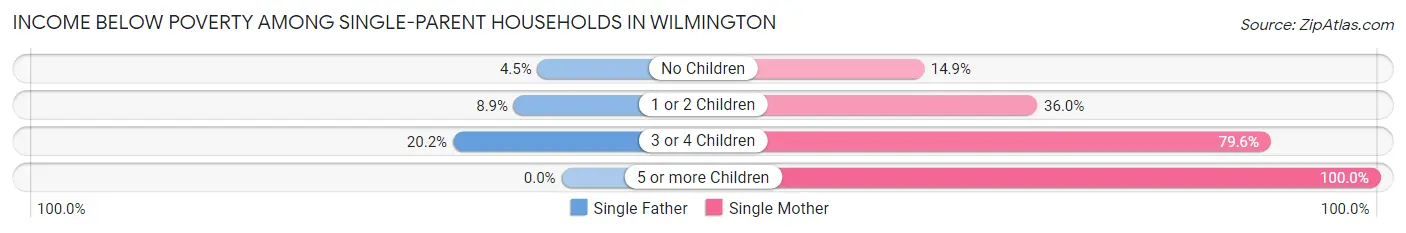
| Children | Single Father | Single Mother |
| No Children | 35 (4.5%) | 315 (14.9%) |
| 1 or 2 Children | 51 (8.9%) | 961 (36.0%) |
| 3 or 4 Children | 18 (20.2%) | 475 (79.6%) |
| 5 or more Children | 0 (0.0%) | 36 (100.0%) |
| Total | 104 (7.2%) | 1,787 (33.0%) |
Income Below Poverty Among Married-Couple vs Single-Parent Households in Wilmington
The poverty data for Wilmington shows that 646 of the married-couple family households (3.5%) and 1,891 of the single-parent households (27.6%) are living below the poverty level. Within the married-couple family households, those with 3 or 4 children have the highest poverty rate, with 65 households (6.3%) falling below the poverty line. Among the single-parent households, those with 5 or more children have the highest poverty rate, with 36 household (100.0%) living below poverty.
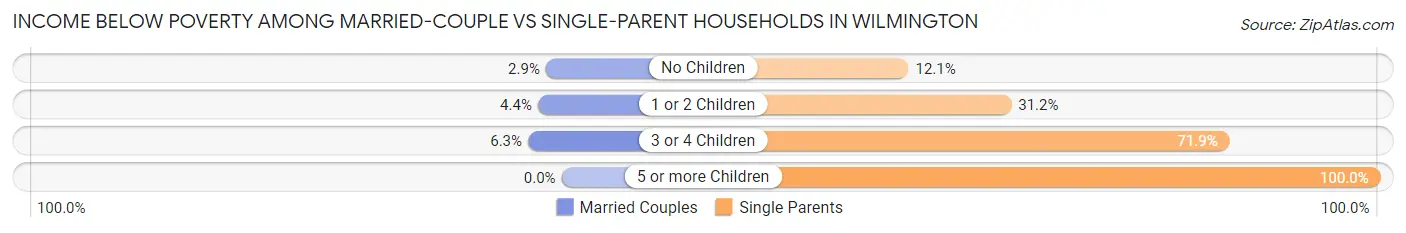
| Children | Married-Couple Families | Single-Parent Households |
| No Children | 360 (2.9%) | 350 (12.1%) |
| 1 or 2 Children | 221 (4.4%) | 1,012 (31.2%) |
| 3 or 4 Children | 65 (6.3%) | 493 (71.9%) |
| 5 or more Children | 0 (0.0%) | 36 (100.0%) |
| Total | 646 (3.5%) | 1,891 (27.6%) |
Race in Wilmington
The most populous races in Wilmington are White / Caucasian (86,966 | 74.4%), Black / African American (18,955 | 16.2%), and Hispanic or Latino (8,190 | 7.0%).
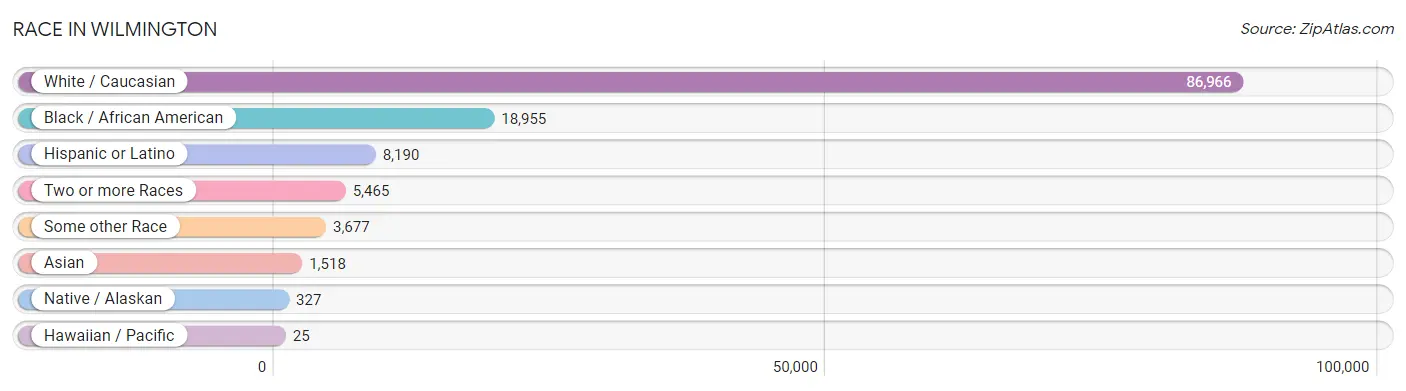
| Race | # Population | % Population |
| Asian | 1,518 | 1.3% |
| Black / African American | 18,955 | 16.2% |
| Hawaiian / Pacific | 25 | 0.0% |
| Hispanic or Latino | 8,190 | 7.0% |
| Native / Alaskan | 327 | 0.3% |
| White / Caucasian | 86,966 | 74.4% |
| Two or more Races | 5,465 | 4.7% |
| Some other Race | 3,677 | 3.1% |
| Total | 116,933 | 100.0% |
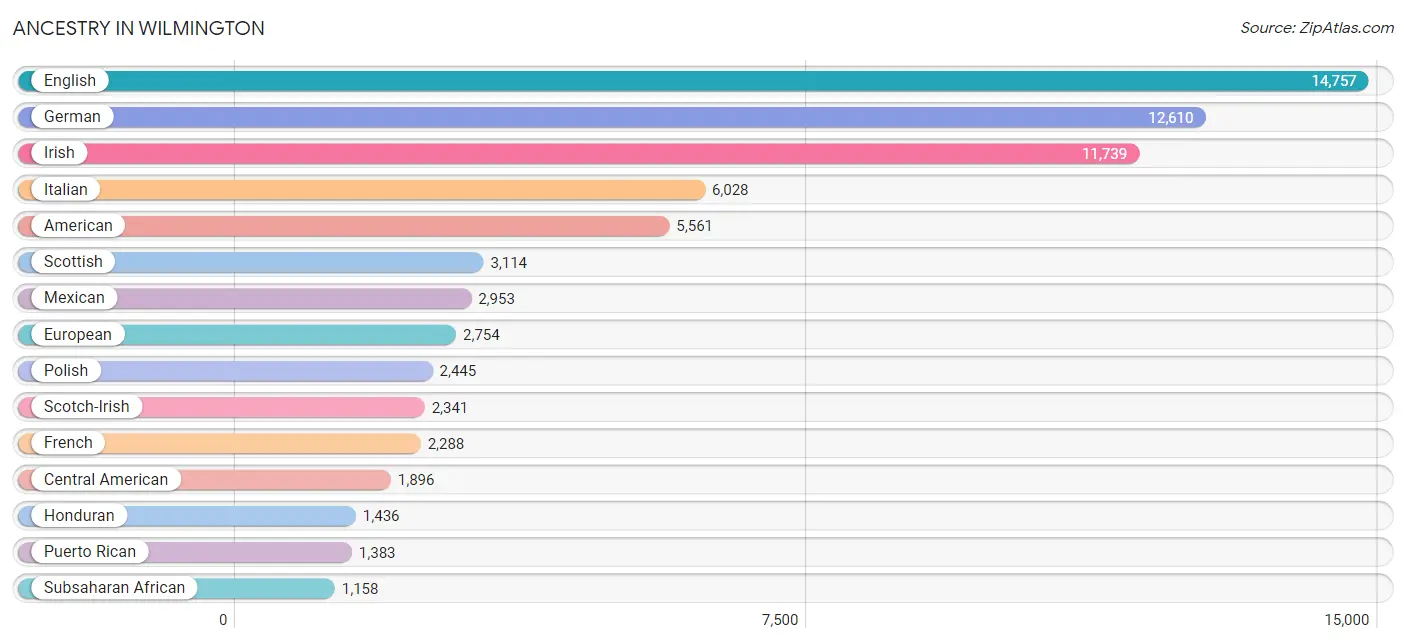
Ancestry in Wilmington
The most populous ancestries reported in Wilmington are English (14,757 | 12.6%), German (12,610 | 10.8%), Irish (11,739 | 10.0%), Italian (6,028 | 5.2%), and American (5,561 | 4.8%), together accounting for 43.4% of all Wilmington residents.
| Ancestry | # Population | % Population |
| Afghan | 4 | 0.0% |
| African | 857 | 0.7% |
| Albanian | 43 | 0.0% |
| American | 5,561 | 4.8% |
| Arab | 367 | 0.3% |
| Argentinean | 97 | 0.1% |
| Armenian | 109 | 0.1% |
| Austrian | 141 | 0.1% |
| Bangladeshi | 41 | 0.0% |
| Belgian | 117 | 0.1% |
| Bhutanese | 176 | 0.2% |
| Blackfeet | 33 | 0.0% |
| Brazilian | 337 | 0.3% |
| British | 915 | 0.8% |
| British West Indian | 24 | 0.0% |
| Burmese | 494 | 0.4% |
| Cambodian | 14 | 0.0% |
| Canadian | 304 | 0.3% |
| Cape Verdean | 12 | 0.0% |
| Celtic | 15 | 0.0% |
| Central American | 1,896 | 1.6% |
| Cherokee | 634 | 0.5% |
| Cheyenne | 32 | 0.0% |
| Chilean | 103 | 0.1% |
| Chippewa | 4 | 0.0% |
| Choctaw | 18 | 0.0% |
| Colombian | 407 | 0.4% |
| Comanche | 78 | 0.1% |
| Costa Rican | 71 | 0.1% |
| Croatian | 116 | 0.1% |
| Cuban | 487 | 0.4% |
| Cypriot | 23 | 0.0% |
| Czech | 371 | 0.3% |
| Danish | 333 | 0.3% |
| Dominican | 169 | 0.1% |
| Dutch | 894 | 0.8% |
| Eastern European | 760 | 0.6% |
| Ecuadorian | 4 | 0.0% |
| English | 14,757 | 12.6% |
| Estonian | 17 | 0.0% |
| European | 2,754 | 2.4% |
| Filipino | 87 | 0.1% |
| Finnish | 52 | 0.0% |
| French | 2,288 | 2.0% |
| French Canadian | 451 | 0.4% |
| German | 12,610 | 10.8% |
| Ghanaian | 69 | 0.1% |
| Greek | 583 | 0.5% |
| Guatemalan | 152 | 0.1% |
| Honduran | 1,436 | 1.2% |
| Hungarian | 428 | 0.4% |
| Indian (Asian) | 692 | 0.6% |
| Indonesian | 63 | 0.1% |
| Iranian | 4 | 0.0% |
| Irish | 11,739 | 10.0% |
| Iroquois | 38 | 0.0% |
| Israeli | 42 | 0.0% |
| Italian | 6,028 | 5.2% |
| Jamaican | 127 | 0.1% |
| Jordanian | 29 | 0.0% |
| Korean | 560 | 0.5% |
| Latvian | 23 | 0.0% |
| Lebanese | 249 | 0.2% |
| Lithuanian | 197 | 0.2% |
| Lumbee | 172 | 0.2% |
| Mexican | 2,953 | 2.5% |
| Mexican American Indian | 21 | 0.0% |
| Moroccan | 27 | 0.0% |
| Native Hawaiian | 25 | 0.0% |
| Navajo | 39 | 0.0% |
| Nicaraguan | 30 | 0.0% |
| Nigerian | 96 | 0.1% |
| Northern European | 172 | 0.2% |
| Norwegian | 882 | 0.7% |
| Pakistani | 110 | 0.1% |
| Palestinian | 18 | 0.0% |
| Panamanian | 23 | 0.0% |
| Pennsylvania German | 41 | 0.0% |
| Peruvian | 35 | 0.0% |
| Polish | 2,445 | 2.1% |
| Portuguese | 241 | 0.2% |
| Puerto Rican | 1,383 | 1.2% |
| Romanian | 48 | 0.0% |
| Russian | 531 | 0.4% |
| Salvadoran | 151 | 0.1% |
| Samoan | 43 | 0.0% |
| Scandinavian | 235 | 0.2% |
| Scotch-Irish | 2,341 | 2.0% |
| Scottish | 3,114 | 2.7% |
| Seminole | 8 | 0.0% |
| Serbian | 13 | 0.0% |
| Slavic | 39 | 0.0% |
| Slovak | 272 | 0.2% |
| Slovene | 6 | 0.0% |
| South African | 96 | 0.1% |
| South American | 890 | 0.8% |
| South American Indian | 91 | 0.1% |
| Spaniard | 137 | 0.1% |
| Spanish | 95 | 0.1% |
| Sri Lankan | 74 | 0.1% |
| Subsaharan African | 1,158 | 1.0% |
| Swedish | 873 | 0.7% |
| Swiss | 307 | 0.3% |
| Syrian | 27 | 0.0% |
| Thai | 194 | 0.2% |
| Trinidadian and Tobagonian | 13 | 0.0% |
| Turkish | 138 | 0.1% |
| Ukrainian | 225 | 0.2% |
| Venezuelan | 244 | 0.2% |
| Welsh | 525 | 0.4% |
| West Indian | 29 | 0.0% |
| Yugoslavian | 57 | 0.1% | View All 112 Rows |
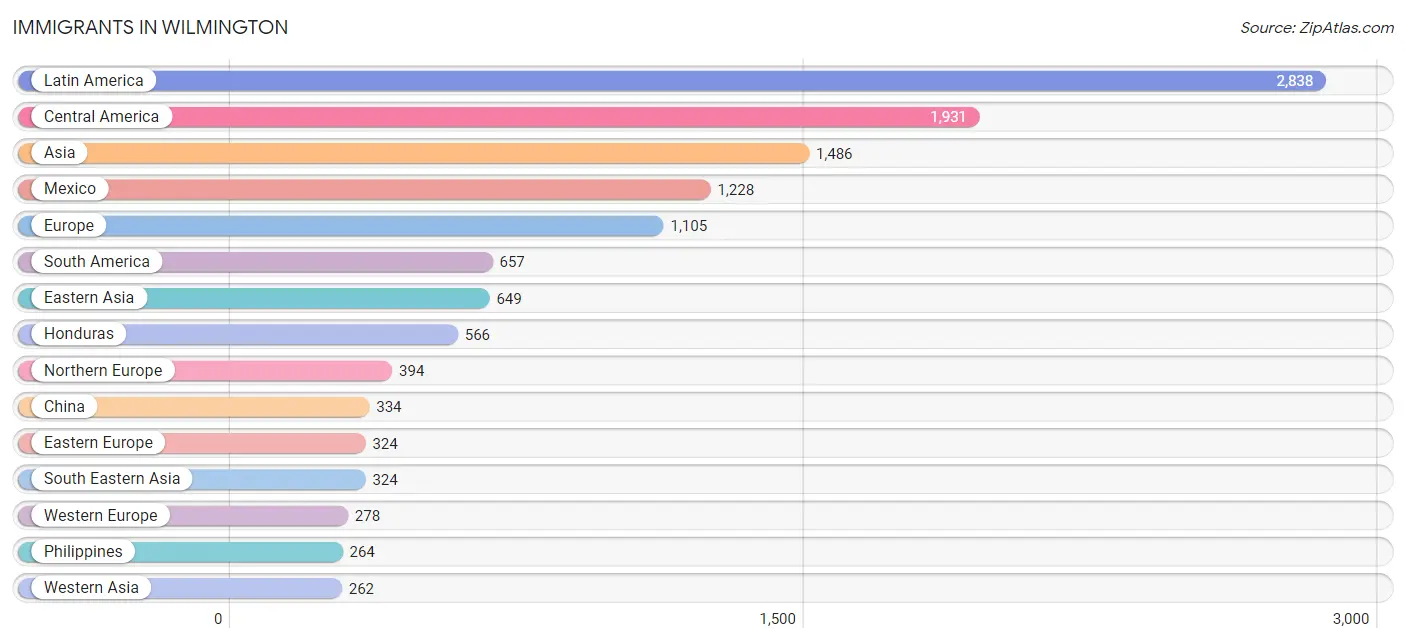
Immigrants in Wilmington
The most numerous immigrant groups reported in Wilmington came from Latin America (2,838 | 2.4%), Central America (1,931 | 1.7%), Asia (1,486 | 1.3%), Mexico (1,228 | 1.1%), and Europe (1,105 | 0.9%), together accounting for 7.3% of all Wilmington residents.
| Immigration Origin | # Population | % Population |
| Afghanistan | 110 | 0.1% |
| Africa | 187 | 0.2% |
| Argentina | 53 | 0.1% |
| Asia | 1,486 | 1.3% |
| Austria | 14 | 0.0% |
| Bangladesh | 59 | 0.1% |
| Barbados | 9 | 0.0% |
| Belgium | 22 | 0.0% |
| Bosnia and Herzegovina | 38 | 0.0% |
| Brazil | 121 | 0.1% |
| Canada | 237 | 0.2% |
| Caribbean | 250 | 0.2% |
| Central America | 1,931 | 1.7% |
| Chile | 103 | 0.1% |
| China | 334 | 0.3% |
| Colombia | 147 | 0.1% |
| Costa Rica | 60 | 0.1% |
| Cuba | 162 | 0.1% |
| Czechoslovakia | 122 | 0.1% |
| Eastern Africa | 71 | 0.1% |
| Eastern Asia | 649 | 0.6% |
| Eastern Europe | 324 | 0.3% |
| Ecuador | 17 | 0.0% |
| El Salvador | 77 | 0.1% |
| England | 201 | 0.2% |
| Europe | 1,105 | 0.9% |
| France | 37 | 0.0% |
| Germany | 172 | 0.2% |
| Greece | 78 | 0.1% |
| Honduras | 566 | 0.5% |
| Hungary | 10 | 0.0% |
| India | 11 | 0.0% |
| Ireland | 28 | 0.0% |
| Israel | 48 | 0.0% |
| Italy | 20 | 0.0% |
| Jamaica | 75 | 0.1% |
| Japan | 59 | 0.1% |
| Korea | 256 | 0.2% |
| Laos | 8 | 0.0% |
| Latin America | 2,838 | 2.4% |
| Latvia | 14 | 0.0% |
| Lebanon | 11 | 0.0% |
| Malaysia | 14 | 0.0% |
| Mexico | 1,228 | 1.1% |
| Middle Africa | 12 | 0.0% |
| Morocco | 27 | 0.0% |
| Netherlands | 33 | 0.0% |
| Northern Africa | 55 | 0.1% |
| Northern Europe | 394 | 0.3% |
| Oceania | 17 | 0.0% |
| Peru | 63 | 0.1% |
| Philippines | 264 | 0.2% |
| Poland | 22 | 0.0% |
| Romania | 23 | 0.0% |
| Russia | 65 | 0.1% |
| South Africa | 26 | 0.0% |
| South America | 657 | 0.6% |
| South Central Asia | 186 | 0.2% |
| South Eastern Asia | 324 | 0.3% |
| Southern Europe | 109 | 0.1% |
| Spain | 11 | 0.0% |
| Sweden | 42 | 0.0% |
| Taiwan | 32 | 0.0% |
| Thailand | 8 | 0.0% |
| Trinidad and Tobago | 4 | 0.0% |
| Turkey | 88 | 0.1% |
| Ukraine | 30 | 0.0% |
| Uzbekistan | 6 | 0.0% |
| Venezuela | 153 | 0.1% |
| Western Africa | 23 | 0.0% |
| Western Asia | 262 | 0.2% |
| Western Europe | 278 | 0.2% |
| Yemen | 72 | 0.1% |
| Zaire | 12 | 0.0% | View All 74 Rows |
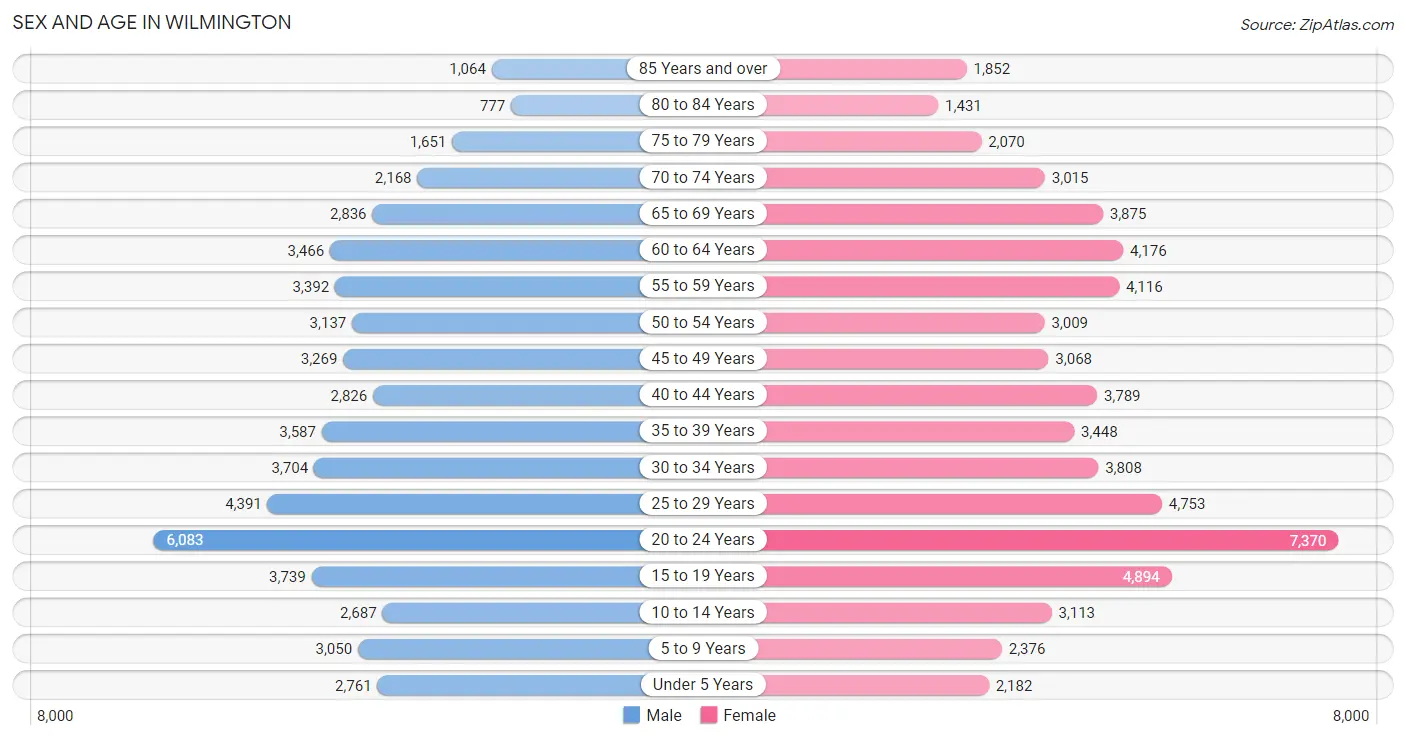
Sex and Age in Wilmington
Sex and Age in Wilmington
The most populous age groups in Wilmington are 20 to 24 Years (6,083 | 11.1%) for men and 20 to 24 Years (7,370 | 11.8%) for women.
| Age Bracket | Male | Female |
| Under 5 Years | 2,761 (5.1%) | 2,182 (3.5%) |
| 5 to 9 Years | 3,050 (5.6%) | 2,376 (3.8%) |
| 10 to 14 Years | 2,687 (4.9%) | 3,113 (5.0%) |
| 15 to 19 Years | 3,739 (6.9%) | 4,894 (7.9%) |
| 20 to 24 Years | 6,083 (11.1%) | 7,370 (11.8%) |
| 25 to 29 Years | 4,391 (8.0%) | 4,753 (7.6%) |
| 30 to 34 Years | 3,704 (6.8%) | 3,808 (6.1%) |
| 35 to 39 Years | 3,587 (6.6%) | 3,448 (5.5%) |
| 40 to 44 Years | 2,826 (5.2%) | 3,789 (6.1%) |
| 45 to 49 Years | 3,269 (6.0%) | 3,068 (4.9%) |
| 50 to 54 Years | 3,137 (5.8%) | 3,009 (4.8%) |
| 55 to 59 Years | 3,392 (6.2%) | 4,116 (6.6%) |
| 60 to 64 Years | 3,466 (6.4%) | 4,176 (6.7%) |
| 65 to 69 Years | 2,836 (5.2%) | 3,875 (6.2%) |
| 70 to 74 Years | 2,168 (4.0%) | 3,015 (4.8%) |
| 75 to 79 Years | 1,651 (3.0%) | 2,070 (3.3%) |
| 80 to 84 Years | 777 (1.4%) | 1,431 (2.3%) |
| 85 Years and over | 1,064 (1.9%) | 1,852 (3.0%) |
| Total | 54,588 (100.0%) | 62,345 (100.0%) |
Families and Households in Wilmington
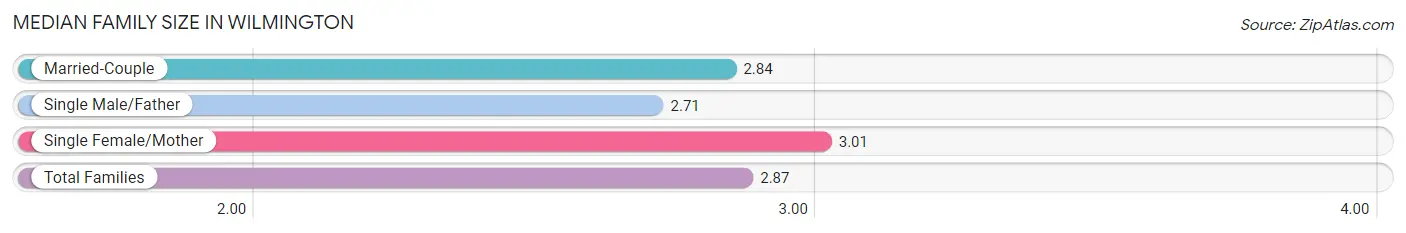
Median Family Size in Wilmington
The median family size in Wilmington is 2.87 persons per family, with single female/mother families (5,410 | 21.5%) accounting for the largest median family size of 3.01 persons per family. On the other hand, single male/father families (1,448 | 5.8%) represent the smallest median family size with 2.71 persons per family.
| Family Type | # Families | Family Size |
| Married-Couple | 18,324 (72.8%) | 2.84 |
| Single Male/Father | 1,448 (5.8%) | 2.71 |
| Single Female/Mother | 5,410 (21.5%) | 3.01 |
| Total Families | 25,182 (100.0%) | 2.87 |
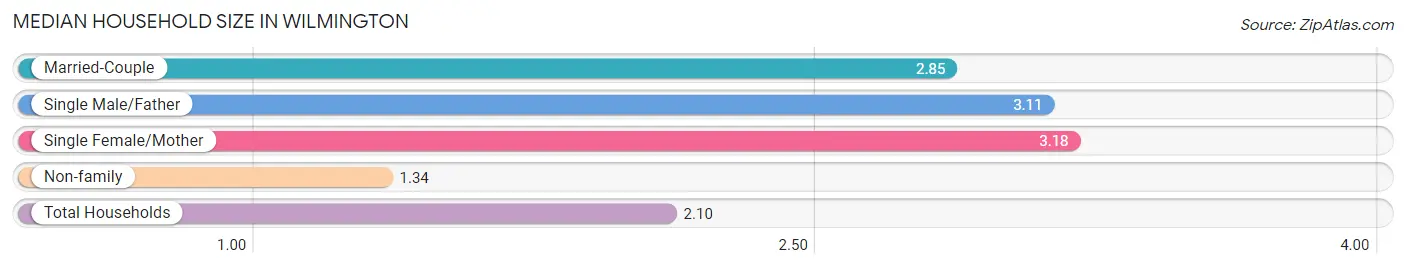
Median Household Size in Wilmington
The median household size in Wilmington is 2.10 persons per household, with single female/mother households (5,410 | 10.1%) accounting for the largest median household size of 3.18 persons per household. non-family households (28,192 | 52.8%) represent the smallest median household size with 1.34 persons per household.
| Household Type | # Households | Household Size |
| Married-Couple | 18,324 (34.3%) | 2.85 |
| Single Male/Father | 1,448 (2.7%) | 3.11 |
| Single Female/Mother | 5,410 (10.1%) | 3.18 |
| Non-family | 28,192 (52.8%) | 1.34 |
| Total Households | 53,374 (100.0%) | 2.10 |
Household Size by Marriage Status in Wilmington
Out of a total of 53,374 households in Wilmington, 25,182 (47.2%) are family households, while 28,192 (52.8%) are nonfamily households. The most numerous type of family households are 2-person households, comprising 14,053, and the most common type of nonfamily households are 1-person households, comprising 20,829.
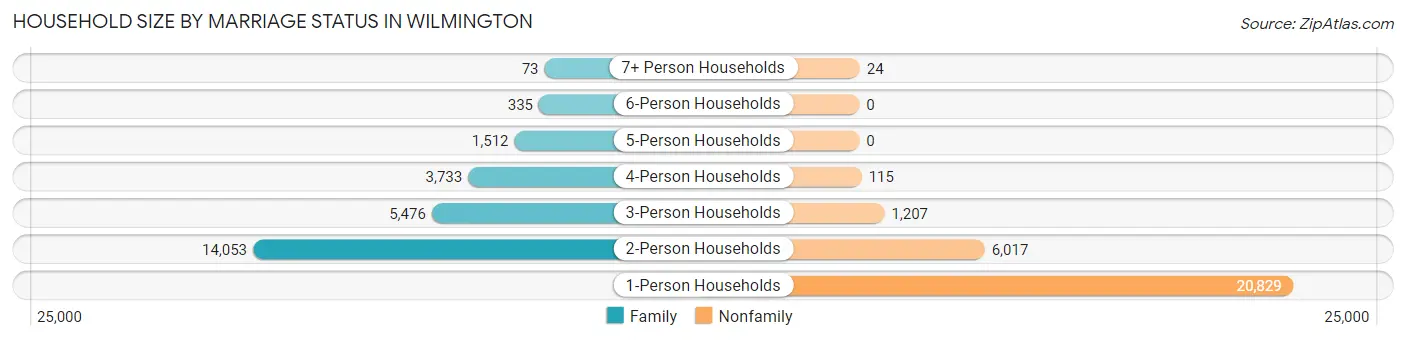
| Household Size | Family Households | Nonfamily Households |
| 1-Person Households | - | 20,829 (39.0%) |
| 2-Person Households | 14,053 (26.3%) | 6,017 (11.3%) |
| 3-Person Households | 5,476 (10.3%) | 1,207 (2.3%) |
| 4-Person Households | 3,733 (7.0%) | 115 (0.2%) |
| 5-Person Households | 1,512 (2.8%) | 0 (0.0%) |
| 6-Person Households | 335 (0.6%) | 0 (0.0%) |
| 7+ Person Households | 73 (0.1%) | 24 (0.0%) |
| Total | 25,182 (47.2%) | 28,192 (52.8%) |
Female Fertility in Wilmington
Fertility by Age in Wilmington
Average fertility rate in Wilmington is 24.0 births per 1,000 women. Women in the age bracket of 20 to 34 years have the highest fertility rate with 29.0 births per 1,000 women. Women in the age bracket of 20 to 34 years acount for 60.2% of all women with births.
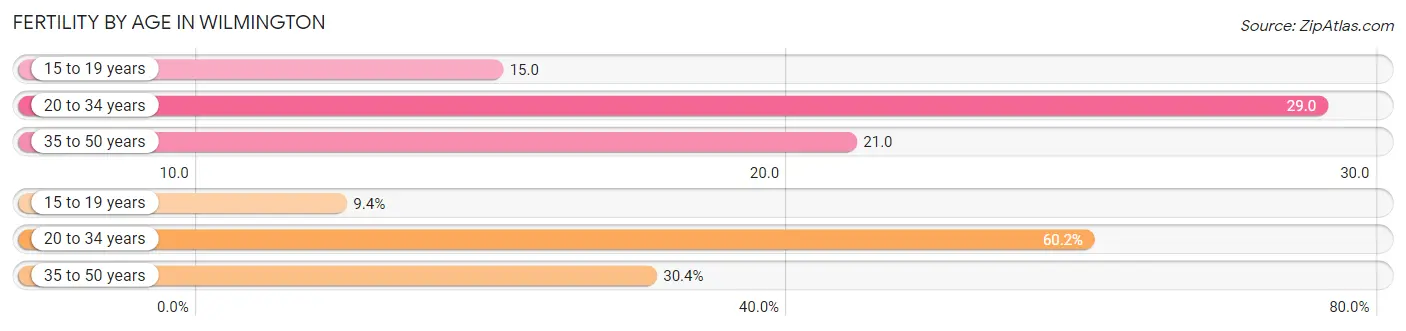
| Age Bracket | Women with Births | Births / 1,000 Women |
| 15 to 19 years | 71 (9.4%) | 15.0 |
| 20 to 34 years | 455 (60.2%) | 29.0 |
| 35 to 50 years | 230 (30.4%) | 21.0 |
| Total | 756 (100.0%) | 24.0 |
Fertility by Age by Marriage Status in Wilmington
65.1% of women with births (756) in Wilmington are married. The highest percentage of unmarried women with births falls into 15 to 19 years age bracket with 100.0% of them unmarried at the time of birth, while the lowest percentage of unmarried women with births belong to 35 to 50 years age bracket with 8.3% of them unmarried.
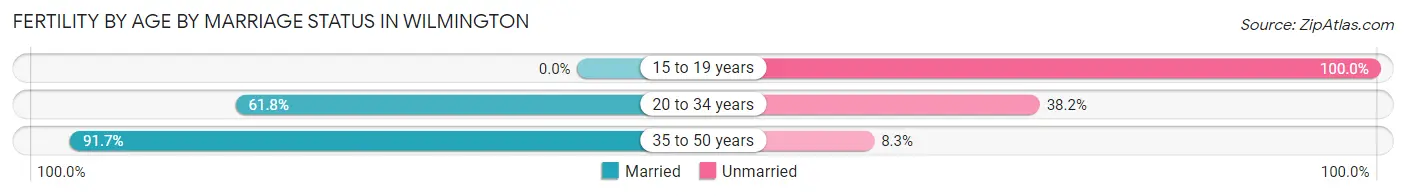
| Age Bracket | Married | Unmarried |
| 15 to 19 years | 0 (0.0%) | 71 (100.0%) |
| 20 to 34 years | 281 (61.8%) | 174 (38.2%) |
| 35 to 50 years | 211 (91.7%) | 19 (8.3%) |
| Total | 492 (65.1%) | 264 (34.9%) |
Fertility by Education in Wilmington
Average fertility rate in Wilmington is 24.0 births per 1,000 women. Women with the education attainment of less than high school have the highest fertility rate of 47.0 births per 1,000 women, while women with the education attainment of college or associate's degree have the lowest fertility at 12.0 births per 1,000 women. Women with the education attainment of high school diploma represent 24.7% of all women with births.
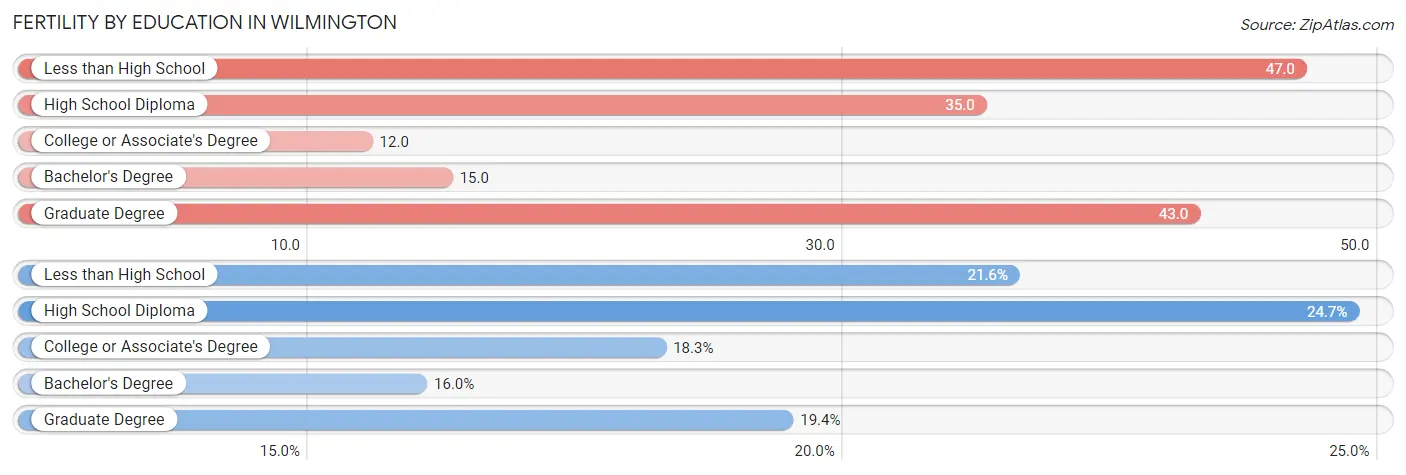
| Educational Attainment | Women with Births | Births / 1,000 Women |
| Less than High School | 163 (21.6%) | 47.0 |
| High School Diploma | 187 (24.7%) | 35.0 |
| College or Associate's Degree | 138 (18.2%) | 12.0 |
| Bachelor's Degree | 121 (16.0%) | 15.0 |
| Graduate Degree | 147 (19.4%) | 43.0 |
| Total | 756 (100.0%) | 24.0 |
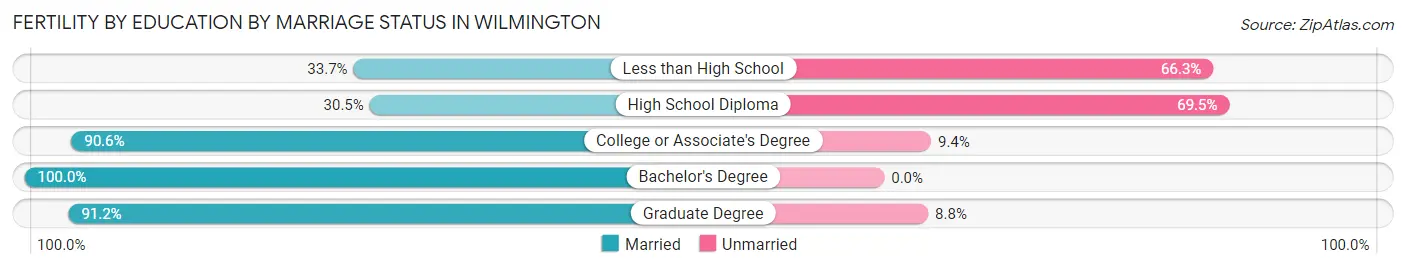
Fertility by Education by Marriage Status in Wilmington
34.9% of women with births in Wilmington are unmarried. Women with the educational attainment of bachelor's degree are most likely to be married with 100.0% of them married at childbirth, while women with the educational attainment of high school diploma are least likely to be married with 69.5% of them unmarried at childbirth.
| Educational Attainment | Married | Unmarried |
| Less than High School | 55 (33.7%) | 108 (66.3%) |
| High School Diploma | 57 (30.5%) | 130 (69.5%) |
| College or Associate's Degree | 125 (90.6%) | 13 (9.4%) |
| Bachelor's Degree | 121 (100.0%) | 0 (0.0%) |
| Graduate Degree | 134 (91.2%) | 13 (8.8%) |
| Total | 492 (65.1%) | 264 (34.9%) |
Employment Characteristics in Wilmington
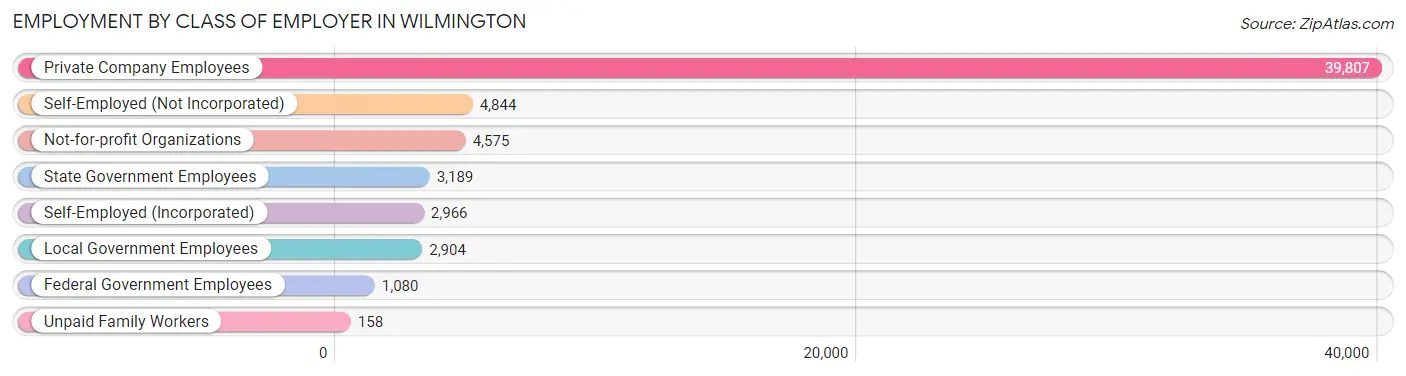
Employment by Class of Employer in Wilmington
Among the 59,523 employed individuals in Wilmington, private company employees (39,807 | 66.9%), self-employed (not incorporated) (4,844 | 8.1%), and not-for-profit organizations (4,575 | 7.7%) make up the most common classes of employment.
| Employer Class | # Employees | % Employees |
| Private Company Employees | 39,807 | 66.9% |
| Self-Employed (Incorporated) | 2,966 | 5.0% |
| Self-Employed (Not Incorporated) | 4,844 | 8.1% |
| Not-for-profit Organizations | 4,575 | 7.7% |
| Local Government Employees | 2,904 | 4.9% |
| State Government Employees | 3,189 | 5.4% |
| Federal Government Employees | 1,080 | 1.8% |
| Unpaid Family Workers | 158 | 0.3% |
| Total | 59,523 | 100.0% |
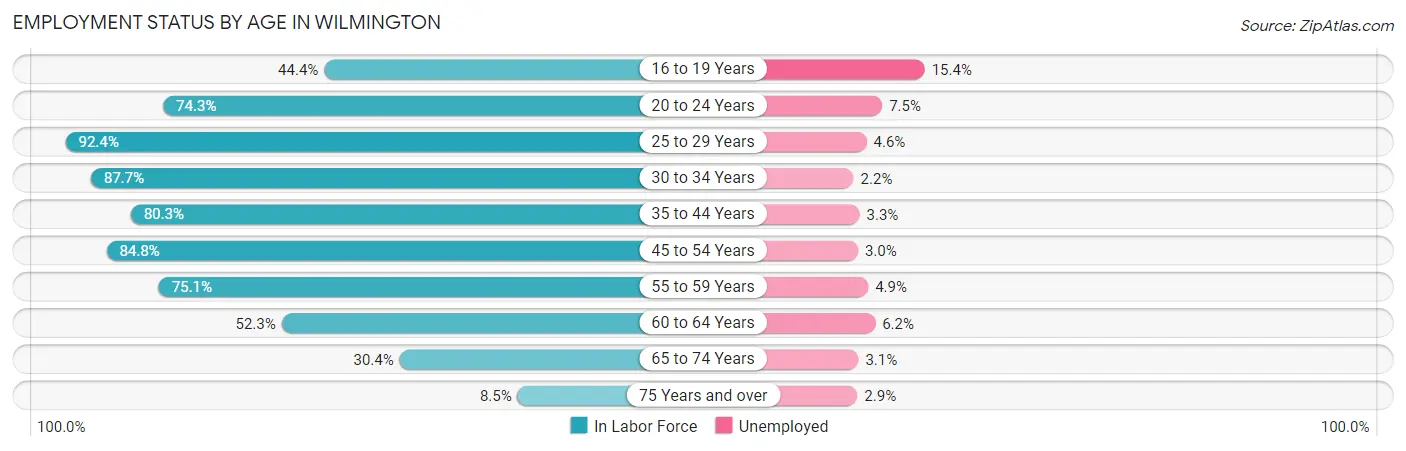
Employment Status by Age in Wilmington
According to the labor force statistics for Wilmington, out of the total population over 16 years of age (99,466), 64.2% or 63,857 individuals are in the labor force, with 4.9% or 3,129 of them unemployed. The age group with the highest labor force participation rate is 25 to 29 years, with 92.4% or 8,449 individuals in the labor force. Within the labor force, the 16 to 19 years age range has the highest percentage of unemployed individuals, with 15.4% or 502 of them being unemployed.
| Age Bracket | In Labor Force | Unemployed |
| 16 to 19 Years | 3,257 (44.4%) | 502 (15.4%) |
| 20 to 24 Years | 9,996 (74.3%) | 750 (7.5%) |
| 25 to 29 Years | 8,449 (92.4%) | 389 (4.6%) |
| 30 to 34 Years | 6,588 (87.7%) | 145 (2.2%) |
| 35 to 44 Years | 10,961 (80.3%) | 362 (3.3%) |
| 45 to 54 Years | 10,586 (84.8%) | 318 (3.0%) |
| 55 to 59 Years | 5,639 (75.1%) | 276 (4.9%) |
| 60 to 64 Years | 3,997 (52.3%) | 248 (6.2%) |
| 65 to 74 Years | 3,616 (30.4%) | 112 (3.1%) |
| 75 Years and over | 752 (8.5%) | 22 (2.9%) |
| Total | 63,857 (64.2%) | 3,129 (4.9%) |
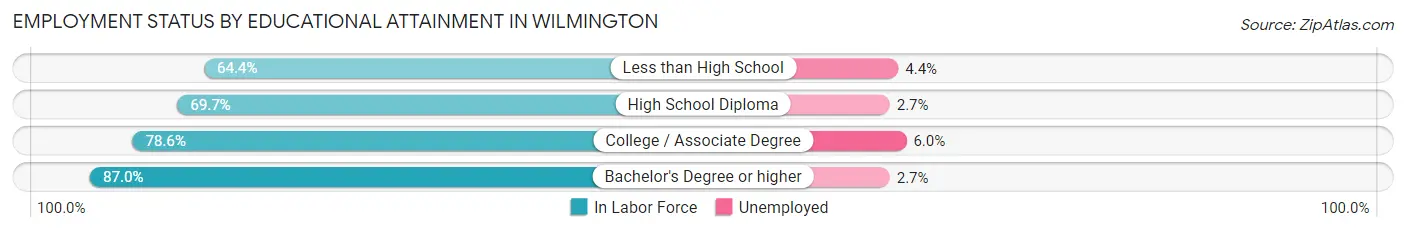
Employment Status by Educational Attainment in Wilmington
According to labor force statistics for Wilmington, 79.8% of individuals (46,235) out of the total population between 25 and 64 years of age (57,939) are in the labor force, with 3.8% or 1,757 of them being unemployed. The group with the highest labor force participation rate are those with the educational attainment of bachelor's degree or higher, with 87.0% or 22,427 individuals in the labor force. Within the labor force, individuals with college / associate degree education have the highest percentage of unemployment, with 6.0% or 834 of them being unemployed.
| Educational Attainment | In Labor Force | Unemployed |
| Less than High School | 2,351 (64.4%) | 161 (4.4%) |
| High School Diploma | 7,550 (69.7%) | 292 (2.7%) |
| College / Associate Degree | 13,895 (78.6%) | 1,061 (6.0%) |
| Bachelor's Degree or higher | 22,427 (87.0%) | 696 (2.7%) |
| Total | 46,235 (79.8%) | 2,202 (3.8%) |
Employment Occupations by Sex in Wilmington
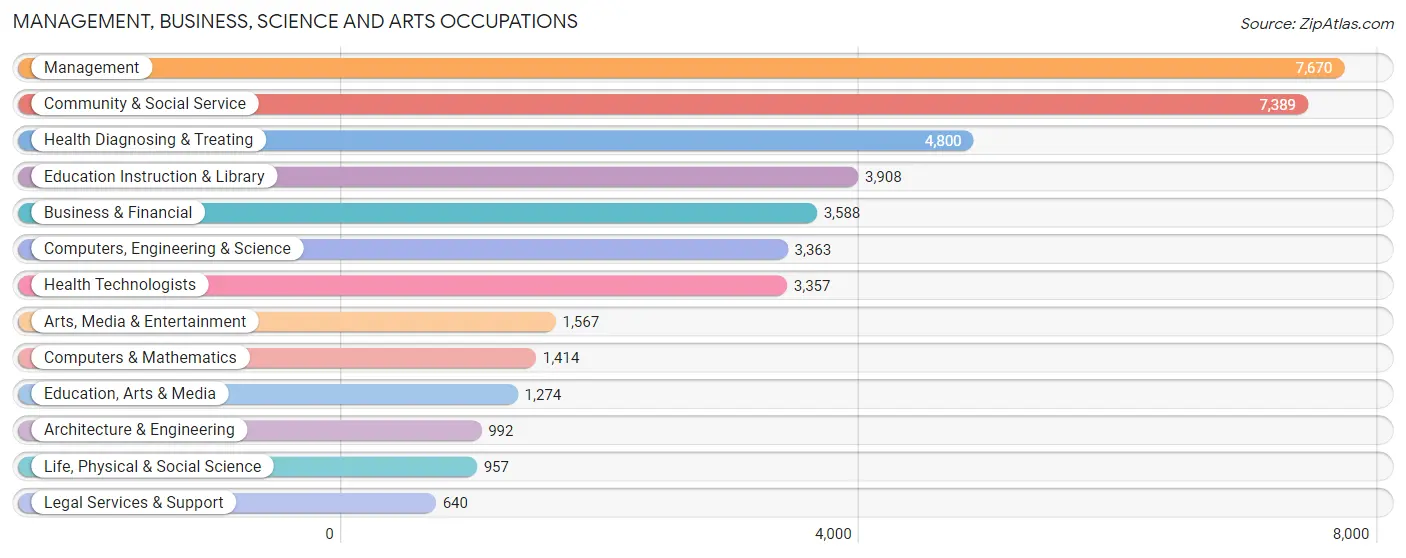
Management, Business, Science and Arts Occupations
The most common Management, Business, Science and Arts occupations in Wilmington are Management (7,670 | 12.7%), Community & Social Service (7,389 | 12.2%), Health Diagnosing & Treating (4,800 | 8.0%), Education Instruction & Library (3,908 | 6.5%), and Business & Financial (3,588 | 5.9%).
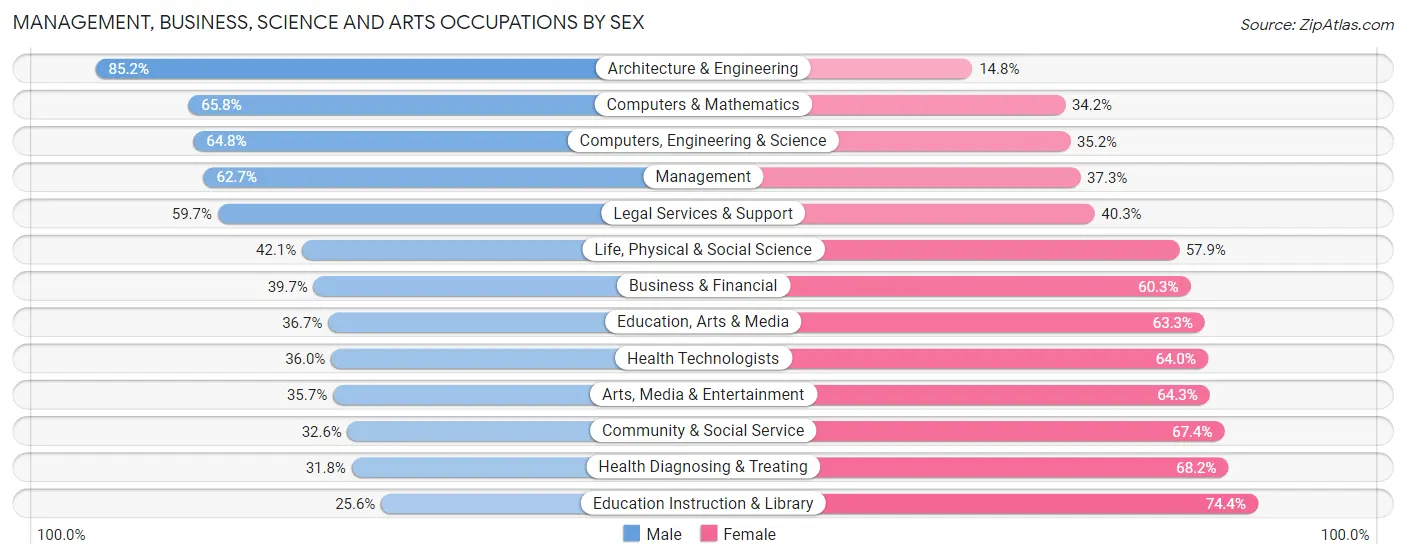
Management, Business, Science and Arts Occupations by Sex
Within the Management, Business, Science and Arts occupations in Wilmington, the most male-oriented occupations are Architecture & Engineering (85.2%), Computers & Mathematics (65.8%), and Computers, Engineering & Science (64.8%), while the most female-oriented occupations are Education Instruction & Library (74.4%), Health Diagnosing & Treating (68.2%), and Community & Social Service (67.4%).
| Occupation | Male | Female |
| Management | 4,806 (62.7%) | 2,864 (37.3%) |
| Business & Financial | 1,424 (39.7%) | 2,164 (60.3%) |
| Computers, Engineering & Science | 2,179 (64.8%) | 1,184 (35.2%) |
| Computers & Mathematics | 931 (65.8%) | 483 (34.2%) |
| Architecture & Engineering | 845 (85.2%) | 147 (14.8%) |
| Life, Physical & Social Science | 403 (42.1%) | 554 (57.9%) |
| Community & Social Service | 2,409 (32.6%) | 4,980 (67.4%) |
| Education, Arts & Media | 467 (36.7%) | 807 (63.3%) |
| Legal Services & Support | 382 (59.7%) | 258 (40.3%) |
| Education Instruction & Library | 1,001 (25.6%) | 2,907 (74.4%) |
| Arts, Media & Entertainment | 559 (35.7%) | 1,008 (64.3%) |
| Health Diagnosing & Treating | 1,525 (31.8%) | 3,275 (68.2%) |
| Health Technologists | 1,210 (36.0%) | 2,147 (64.0%) |
| Total (Category) | 12,343 (46.0%) | 14,467 (54.0%) |
| Total (Overall) | 29,646 (49.1%) | 30,756 (50.9%) |
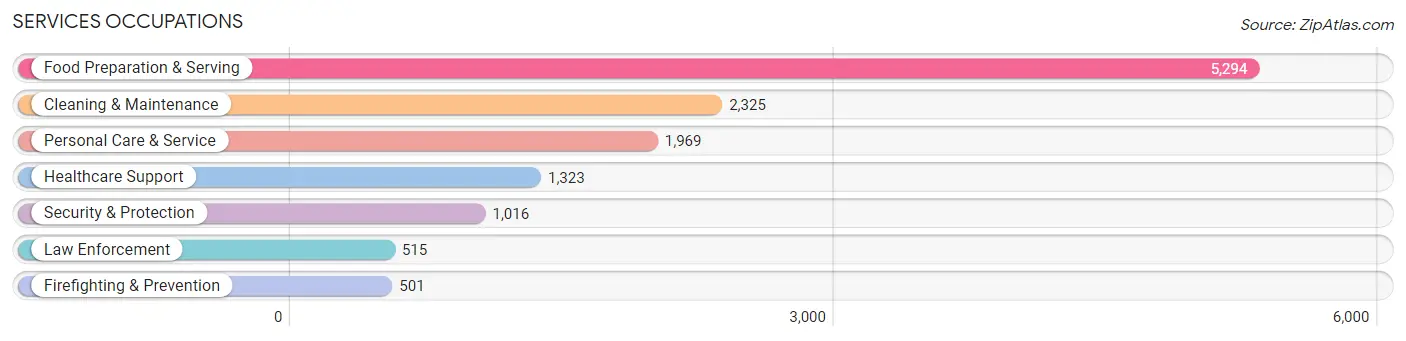
Services Occupations
The most common Services occupations in Wilmington are Food Preparation & Serving (5,294 | 8.8%), Cleaning & Maintenance (2,325 | 3.8%), Personal Care & Service (1,969 | 3.3%), Healthcare Support (1,323 | 2.2%), and Security & Protection (1,016 | 1.7%).
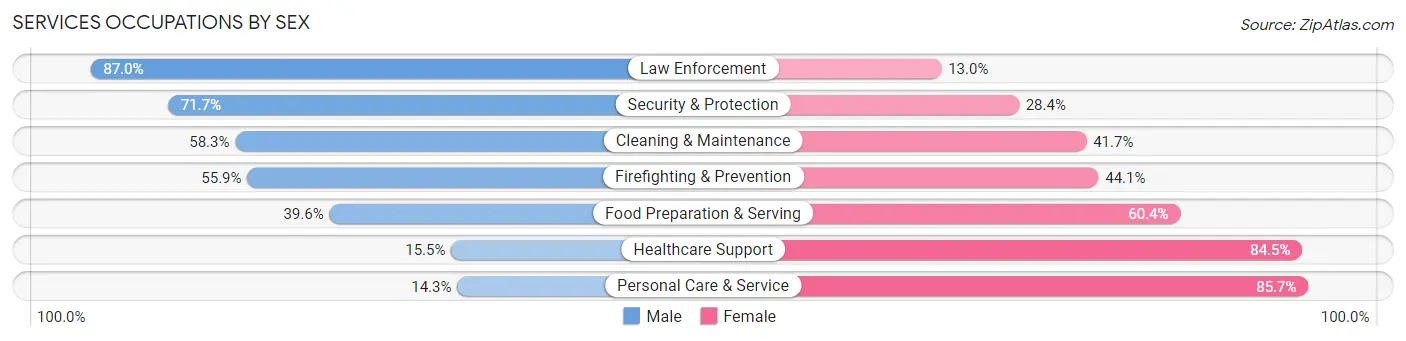
Services Occupations by Sex
Within the Services occupations in Wilmington, the most male-oriented occupations are Law Enforcement (87.0%), Security & Protection (71.7%), and Cleaning & Maintenance (58.3%), while the most female-oriented occupations are Personal Care & Service (85.7%), Healthcare Support (84.5%), and Food Preparation & Serving (60.4%).
| Occupation | Male | Female |
| Healthcare Support | 205 (15.5%) | 1,118 (84.5%) |
| Security & Protection | 728 (71.7%) | 288 (28.3%) |
| Firefighting & Prevention | 280 (55.9%) | 221 (44.1%) |
| Law Enforcement | 448 (87.0%) | 67 (13.0%) |
| Food Preparation & Serving | 2,098 (39.6%) | 3,196 (60.4%) |
| Cleaning & Maintenance | 1,355 (58.3%) | 970 (41.7%) |
| Personal Care & Service | 282 (14.3%) | 1,687 (85.7%) |
| Total (Category) | 4,668 (39.1%) | 7,259 (60.9%) |
| Total (Overall) | 29,646 (49.1%) | 30,756 (50.9%) |
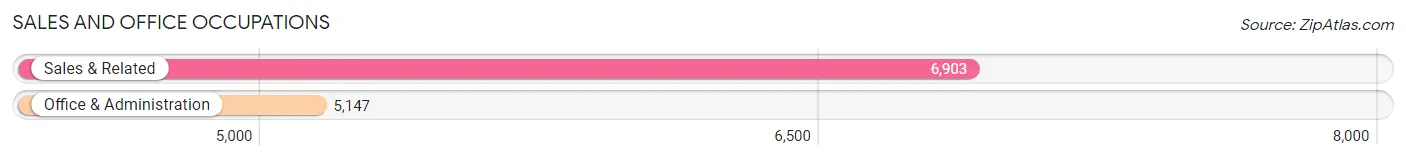
Sales and Office Occupations
The most common Sales and Office occupations in Wilmington are Sales & Related (6,903 | 11.4%), and Office & Administration (5,147 | 8.5%).
Sales and Office Occupations by Sex
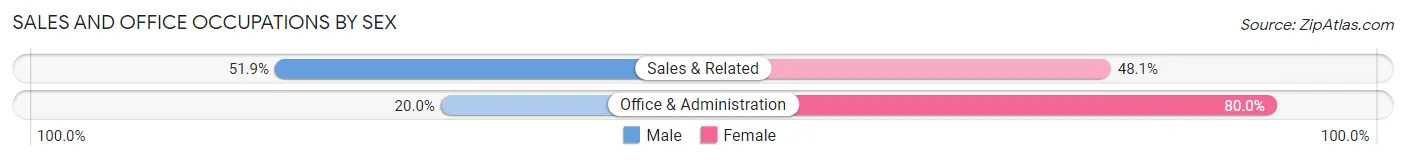
| Occupation | Male | Female |
| Sales & Related | 3,581 (51.9%) | 3,322 (48.1%) |
| Office & Administration | 1,029 (20.0%) | 4,118 (80.0%) |
| Total (Category) | 4,610 (38.3%) | 7,440 (61.7%) |
| Total (Overall) | 29,646 (49.1%) | 30,756 (50.9%) |
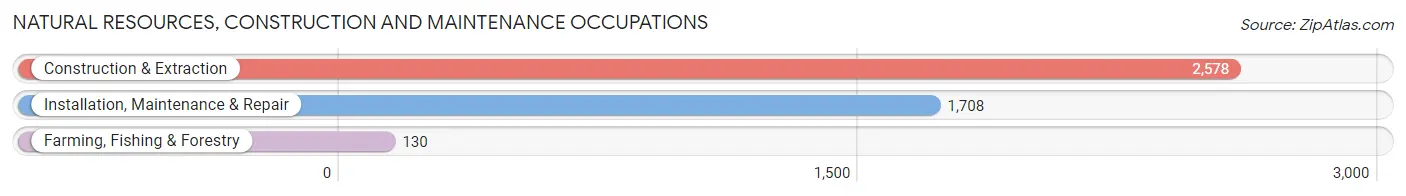
Natural Resources, Construction and Maintenance Occupations
The most common Natural Resources, Construction and Maintenance occupations in Wilmington are Construction & Extraction (2,578 | 4.3%), Installation, Maintenance & Repair (1,708 | 2.8%), and Farming, Fishing & Forestry (130 | 0.2%).
Natural Resources, Construction and Maintenance Occupations by Sex
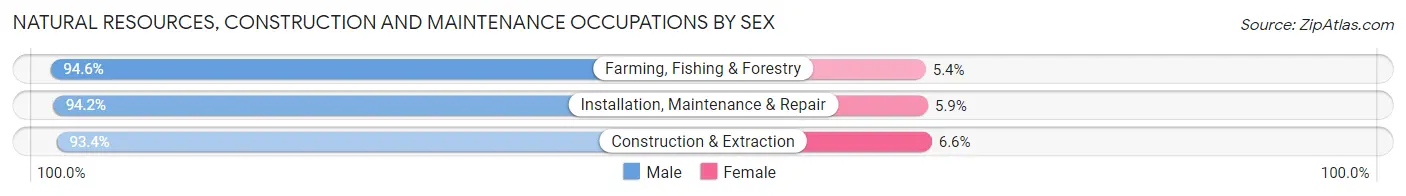
| Occupation | Male | Female |
| Farming, Fishing & Forestry | 123 (94.6%) | 7 (5.4%) |
| Construction & Extraction | 2,407 (93.4%) | 171 (6.6%) |
| Installation, Maintenance & Repair | 1,608 (94.2%) | 100 (5.9%) |
| Total (Category) | 4,138 (93.7%) | 278 (6.3%) |
| Total (Overall) | 29,646 (49.1%) | 30,756 (50.9%) |
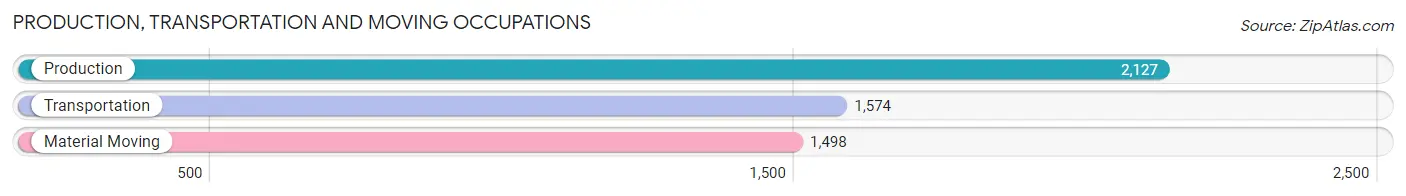
Production, Transportation and Moving Occupations
The most common Production, Transportation and Moving occupations in Wilmington are Production (2,127 | 3.5%), Transportation (1,574 | 2.6%), and Material Moving (1,498 | 2.5%).
Production, Transportation and Moving Occupations by Sex
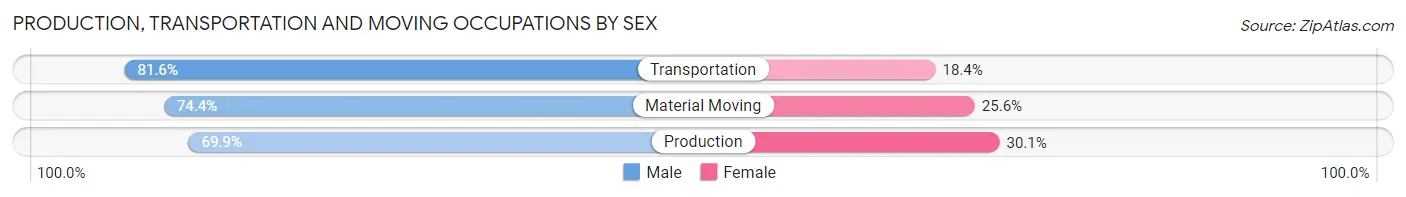
| Occupation | Male | Female |
| Production | 1,487 (69.9%) | 640 (30.1%) |
| Transportation | 1,285 (81.6%) | 289 (18.4%) |
| Material Moving | 1,115 (74.4%) | 383 (25.6%) |
| Total (Category) | 3,887 (74.8%) | 1,312 (25.2%) |
| Total (Overall) | 29,646 (49.1%) | 30,756 (50.9%) |
Employment Industries by Sex in Wilmington
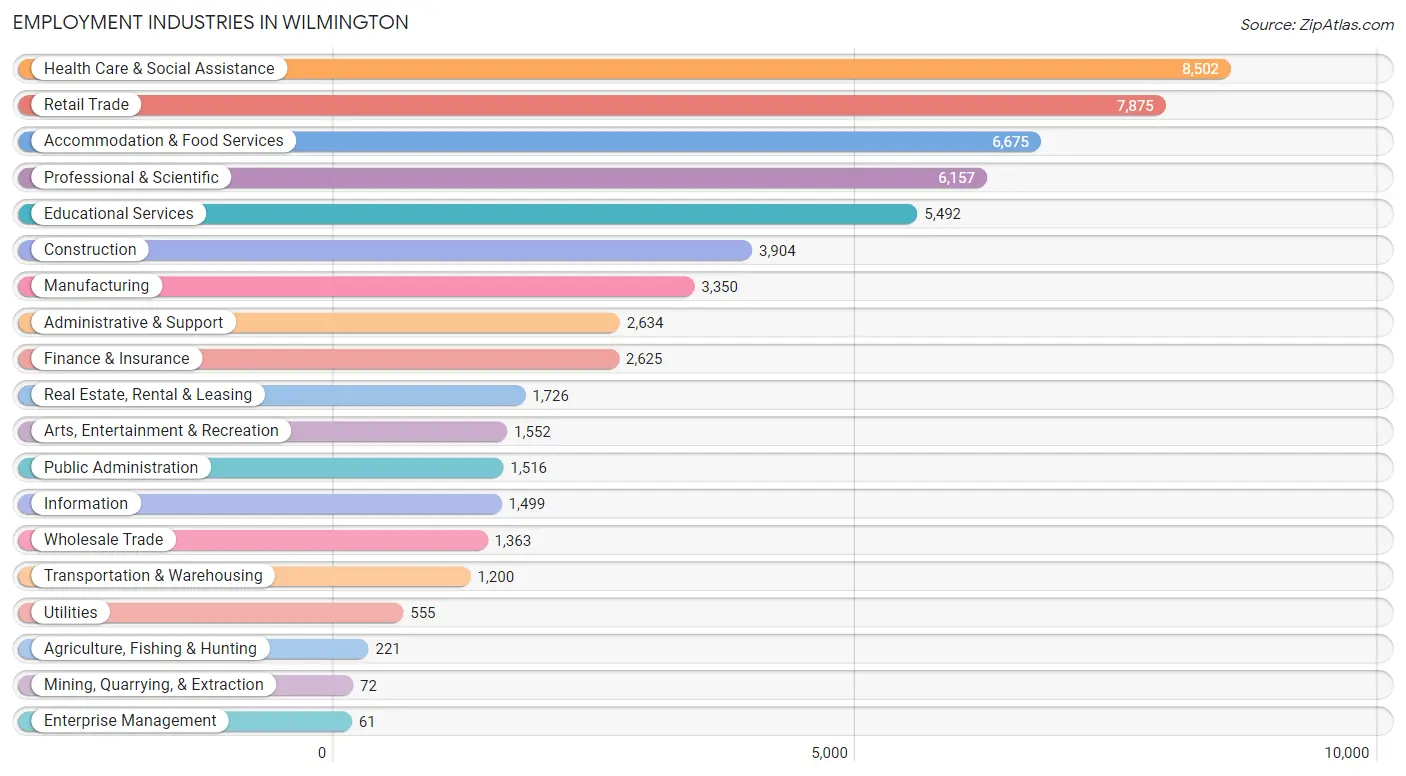
Employment Industries in Wilmington
The major employment industries in Wilmington include Health Care & Social Assistance (8,502 | 14.1%), Retail Trade (7,875 | 13.0%), Accommodation & Food Services (6,675 | 11.1%), Professional & Scientific (6,157 | 10.2%), and Educational Services (5,492 | 9.1%).
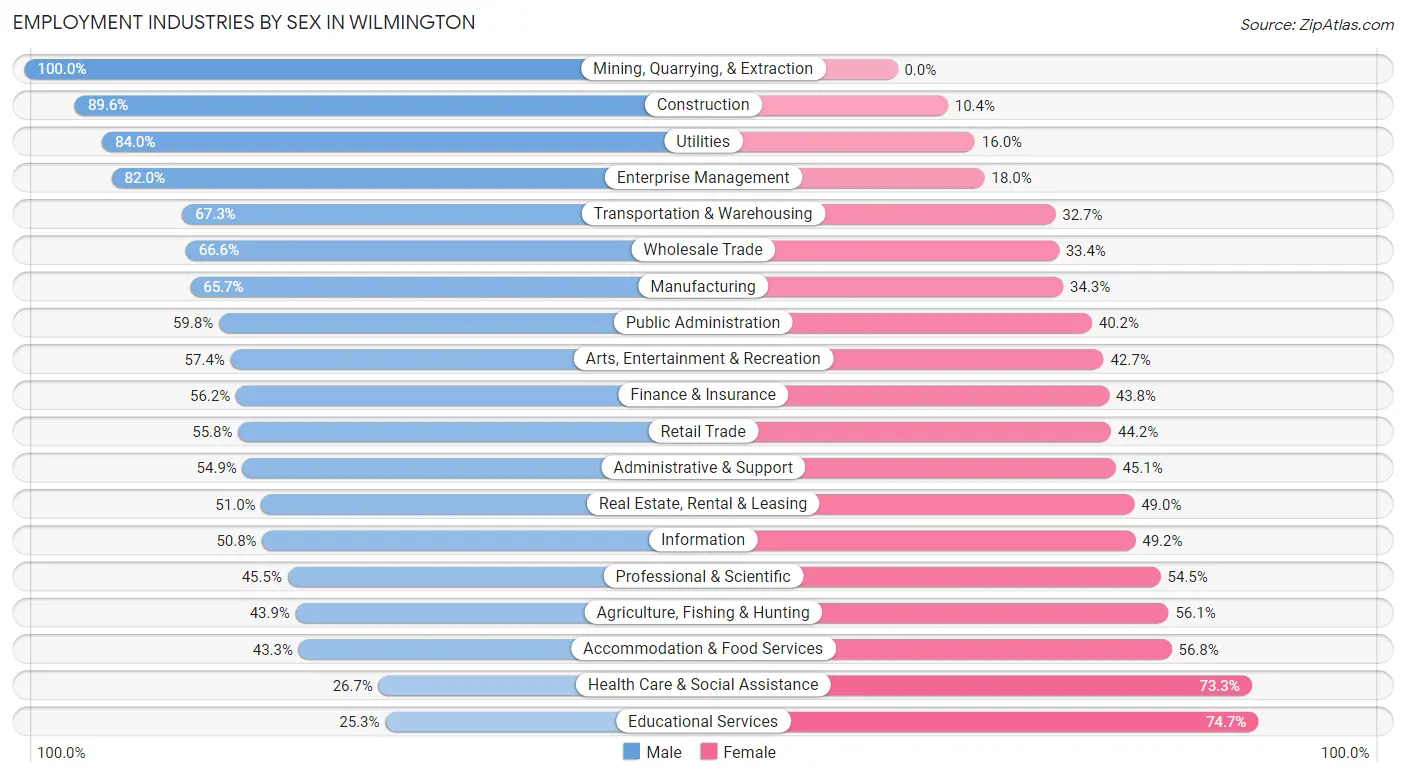
Employment Industries by Sex in Wilmington
The Wilmington industries that see more men than women are Mining, Quarrying, & Extraction (100.0%), Construction (89.6%), and Utilities (84.0%), whereas the industries that tend to have a higher number of women are Educational Services (74.7%), Health Care & Social Assistance (73.3%), and Accommodation & Food Services (56.8%).
| Industry | Male | Female |
| Agriculture, Fishing & Hunting | 97 (43.9%) | 124 (56.1%) |
| Mining, Quarrying, & Extraction | 72 (100.0%) | 0 (0.0%) |
| Construction | 3,497 (89.6%) | 407 (10.4%) |
| Manufacturing | 2,201 (65.7%) | 1,149 (34.3%) |
| Wholesale Trade | 908 (66.6%) | 455 (33.4%) |
| Retail Trade | 4,392 (55.8%) | 3,483 (44.2%) |
| Transportation & Warehousing | 808 (67.3%) | 392 (32.7%) |
| Utilities | 466 (84.0%) | 89 (16.0%) |
| Information | 761 (50.8%) | 738 (49.2%) |
| Finance & Insurance | 1,476 (56.2%) | 1,149 (43.8%) |
| Real Estate, Rental & Leasing | 880 (51.0%) | 846 (49.0%) |
| Professional & Scientific | 2,803 (45.5%) | 3,354 (54.5%) |
| Enterprise Management | 50 (82.0%) | 11 (18.0%) |
| Administrative & Support | 1,445 (54.9%) | 1,189 (45.1%) |
| Educational Services | 1,391 (25.3%) | 4,101 (74.7%) |
| Health Care & Social Assistance | 2,271 (26.7%) | 6,231 (73.3%) |
| Arts, Entertainment & Recreation | 890 (57.4%) | 662 (42.6%) |
| Accommodation & Food Services | 2,887 (43.2%) | 3,788 (56.8%) |
| Public Administration | 906 (59.8%) | 610 (40.2%) |
| Total | 29,646 (49.1%) | 30,756 (50.9%) |
Education in Wilmington
School Enrollment in Wilmington
The most common levels of schooling among the 30,477 students in Wilmington are college / undergraduate (13,188 | 43.3%), middle school (4,840 | 15.9%), and elementary school (4,221 | 13.9%).
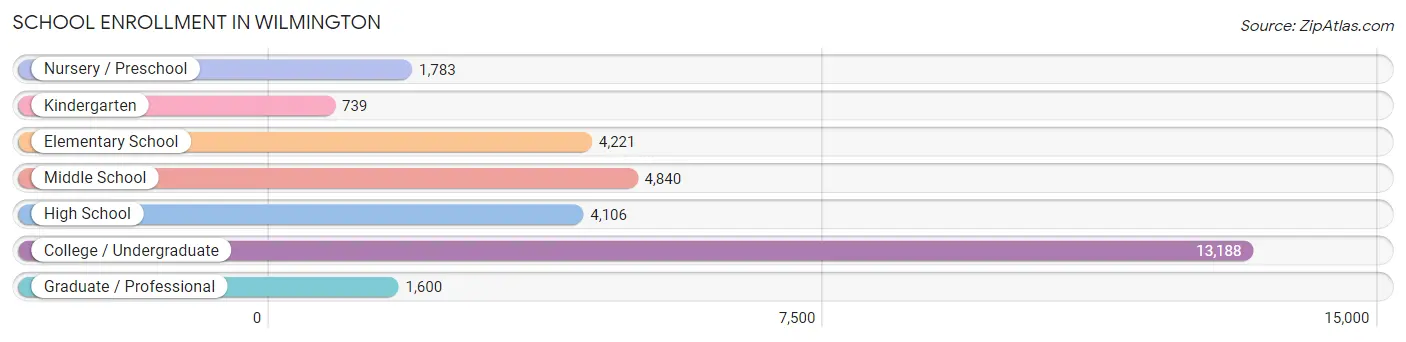
| School Level | # Students | % Students |
| Nursery / Preschool | 1,783 | 5.9% |
| Kindergarten | 739 | 2.4% |
| Elementary School | 4,221 | 13.9% |
| Middle School | 4,840 | 15.9% |
| High School | 4,106 | 13.5% |
| College / Undergraduate | 13,188 | 43.3% |
| Graduate / Professional | 1,600 | 5.2% |
| Total | 30,477 | 100.0% |
School Enrollment by Age by Funding Source in Wilmington
Out of a total of 30,477 students who are enrolled in schools in Wilmington, 4,389 (14.4%) attend a private institution, while the remaining 26,088 (85.6%) are enrolled in public schools. The age group of 3 to 4 year olds has the highest likelihood of being enrolled in private schools, with 403 (36.9% in the age bracket) enrolled. Conversely, the age group of 18 to 19 year olds has the lowest likelihood of being enrolled in a private school, with 4,490 (99.3% in the age bracket) attending a public institution.
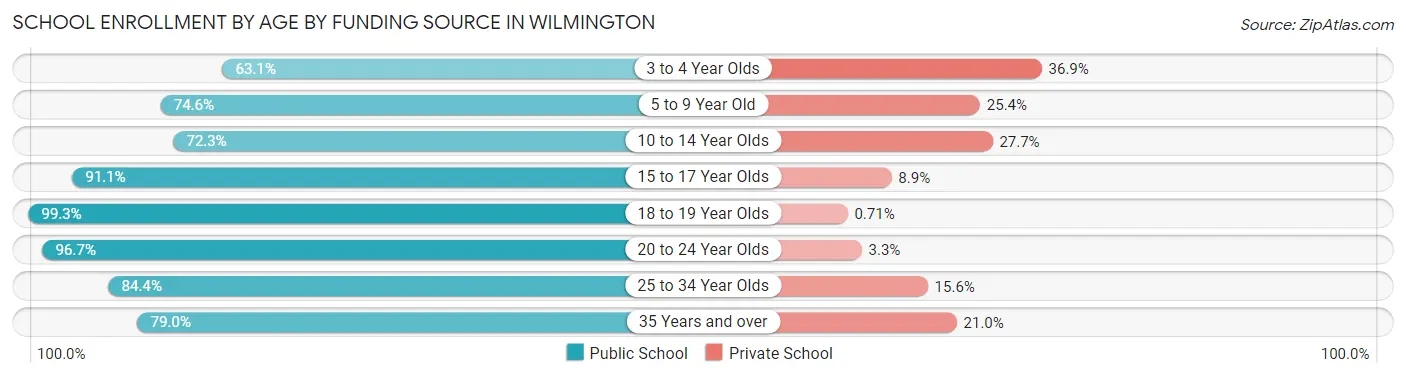
| Age Bracket | Public School | Private School |
| 3 to 4 Year Olds | 690 (63.1%) | 403 (36.9%) |
| 5 to 9 Year Old | 3,742 (74.6%) | 1,272 (25.4%) |
| 10 to 14 Year Olds | 4,153 (72.3%) | 1,592 (27.7%) |
| 15 to 17 Year Olds | 2,971 (91.1%) | 290 (8.9%) |
| 18 to 19 Year Olds | 4,490 (99.3%) | 32 (0.7%) |
| 20 to 24 Year Olds | 7,534 (96.7%) | 260 (3.3%) |
| 25 to 34 Year Olds | 1,553 (84.4%) | 288 (15.6%) |
| 35 Years and over | 953 (79.0%) | 254 (21.0%) |
| Total | 26,088 (85.6%) | 4,389 (14.4%) |
Educational Attainment by Field of Study in Wilmington
Business (6,666 | 18.2%), education (4,505 | 12.3%), bio, nature & agricultural (3,191 | 8.7%), science & technology (3,110 | 8.5%), and social sciences (2,953 | 8.1%) are the most common fields of study among 36,670 individuals in Wilmington who have obtained a bachelor's degree or higher.
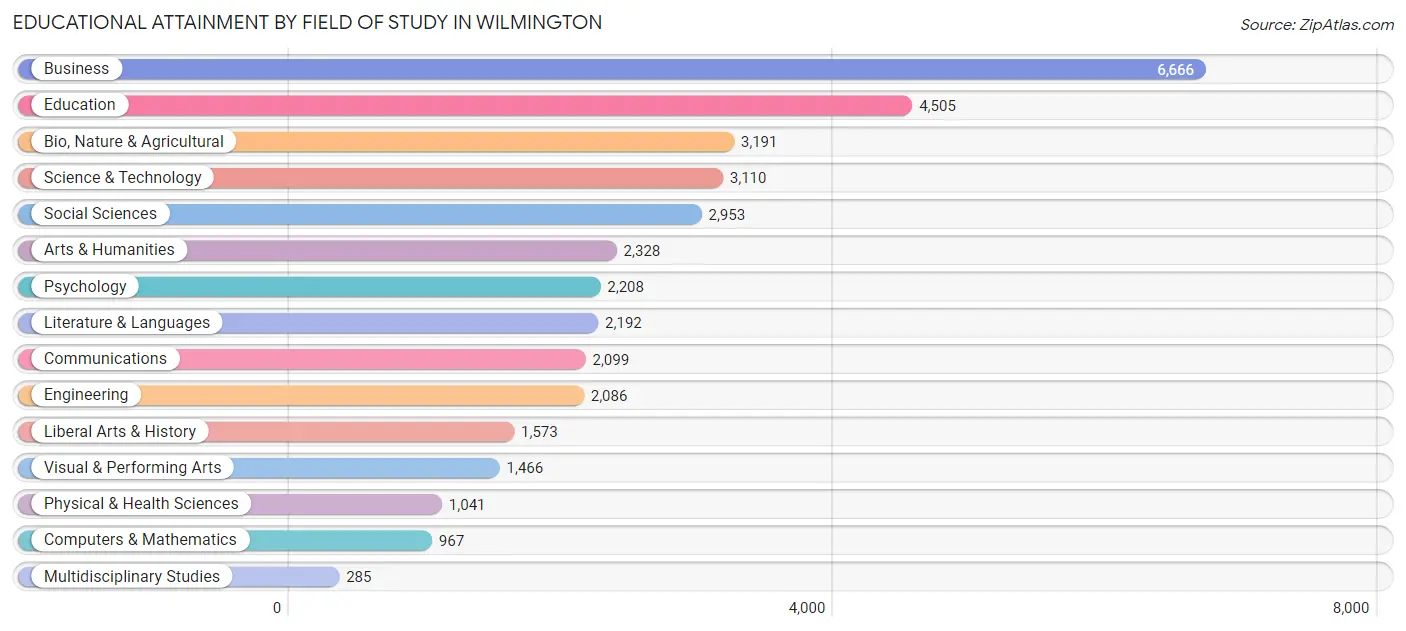
| Field of Study | # Graduates | % Graduates |
| Computers & Mathematics | 967 | 2.6% |
| Bio, Nature & Agricultural | 3,191 | 8.7% |
| Physical & Health Sciences | 1,041 | 2.8% |
| Psychology | 2,208 | 6.0% |
| Social Sciences | 2,953 | 8.1% |
| Engineering | 2,086 | 5.7% |
| Multidisciplinary Studies | 285 | 0.8% |
| Science & Technology | 3,110 | 8.5% |
| Business | 6,666 | 18.2% |
| Education | 4,505 | 12.3% |
| Literature & Languages | 2,192 | 6.0% |
| Liberal Arts & History | 1,573 | 4.3% |
| Visual & Performing Arts | 1,466 | 4.0% |
| Communications | 2,099 | 5.7% |
| Arts & Humanities | 2,328 | 6.4% |
| Total | 36,670 | 100.0% |
Transportation & Commute in Wilmington
Vehicle Availability by Sex in Wilmington
The most prevalent vehicle ownership categories in Wilmington are males with 2 vehicles (13,964, accounting for 48.2%) and females with 2 vehicles (11,739, making up 48.2%).
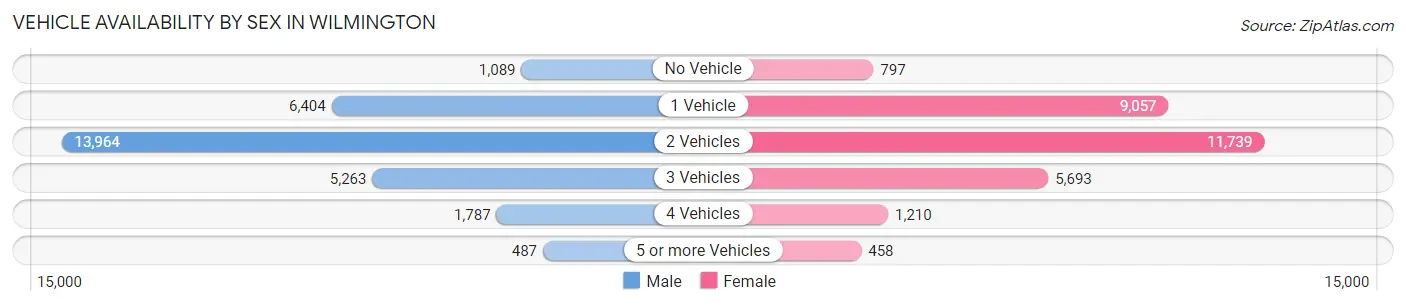
| Vehicles Available | Male | Female |
| No Vehicle | 1,089 (3.8%) | 797 (2.8%) |
| 1 Vehicle | 6,404 (22.1%) | 9,057 (31.3%) |
| 2 Vehicles | 13,964 (48.2%) | 11,739 (40.5%) |
| 3 Vehicles | 5,263 (18.1%) | 5,693 (19.7%) |
| 4 Vehicles | 1,787 (6.2%) | 1,210 (4.2%) |
| 5 or more Vehicles | 487 (1.7%) | 458 (1.6%) |
| Total | 28,994 (100.0%) | 28,954 (100.0%) |
Commute Time in Wilmington
The most frequently occuring commute durations in Wilmington are 15 to 19 minutes (12,763 commuters, 25.1%), 10 to 14 minutes (11,563 commuters, 22.8%), and 20 to 24 minutes (8,616 commuters, 17.0%).
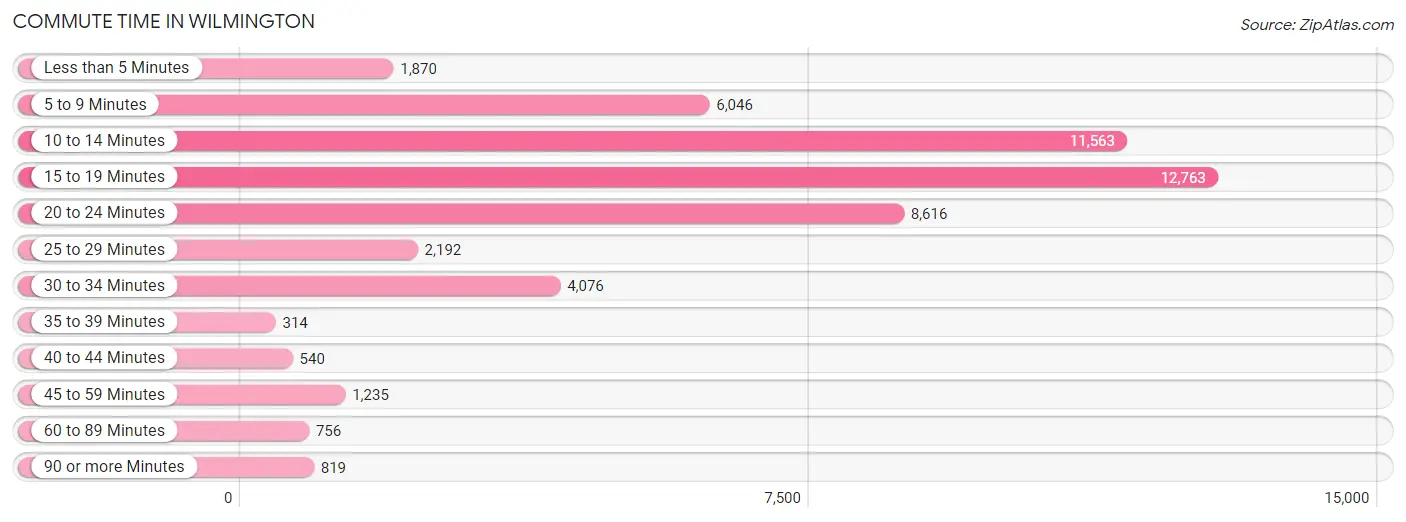
| Commute Time | # Commuters | % Commuters |
| Less than 5 Minutes | 1,870 | 3.7% |
| 5 to 9 Minutes | 6,046 | 11.9% |
| 10 to 14 Minutes | 11,563 | 22.8% |
| 15 to 19 Minutes | 12,763 | 25.1% |
| 20 to 24 Minutes | 8,616 | 17.0% |
| 25 to 29 Minutes | 2,192 | 4.3% |
| 30 to 34 Minutes | 4,076 | 8.0% |
| 35 to 39 Minutes | 314 | 0.6% |
| 40 to 44 Minutes | 540 | 1.1% |
| 45 to 59 Minutes | 1,235 | 2.4% |
| 60 to 89 Minutes | 756 | 1.5% |
| 90 or more Minutes | 819 | 1.6% |
Commute Time by Sex in Wilmington
The most common commute times in Wilmington are 15 to 19 minutes (6,323 commuters, 24.3%) for males and 15 to 19 minutes (6,440 commuters, 26.0%) for females.
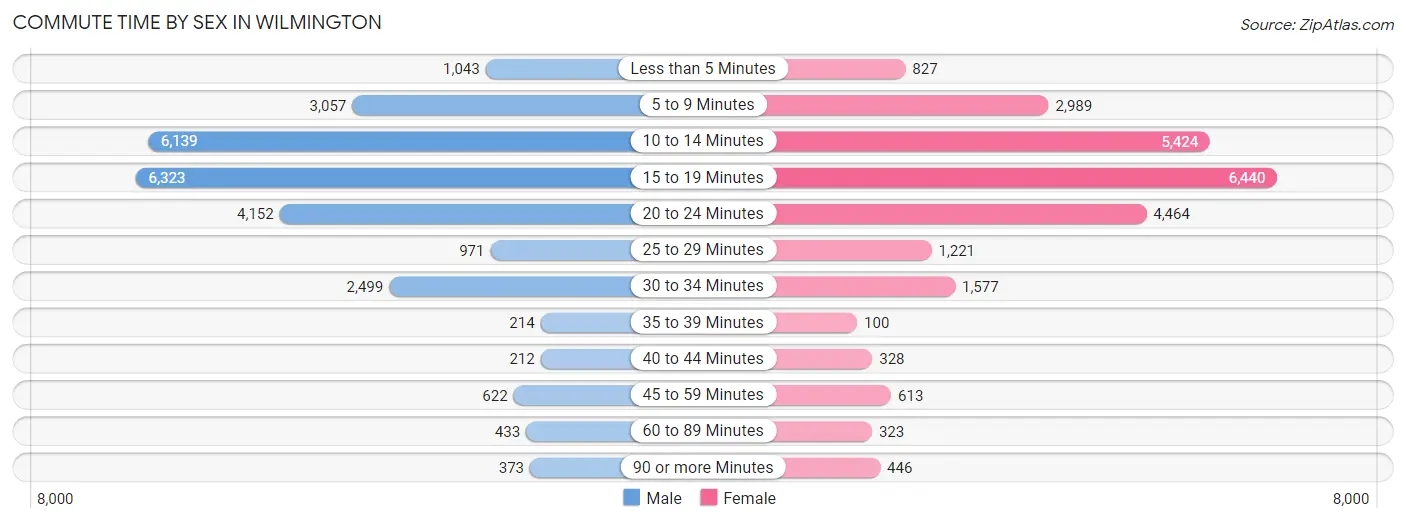
| Commute Time | Male | Female |
| Less than 5 Minutes | 1,043 (4.0%) | 827 (3.3%) |
| 5 to 9 Minutes | 3,057 (11.7%) | 2,989 (12.1%) |
| 10 to 14 Minutes | 6,139 (23.6%) | 5,424 (21.9%) |
| 15 to 19 Minutes | 6,323 (24.3%) | 6,440 (26.0%) |
| 20 to 24 Minutes | 4,152 (16.0%) | 4,464 (18.0%) |
| 25 to 29 Minutes | 971 (3.7%) | 1,221 (4.9%) |
| 30 to 34 Minutes | 2,499 (9.6%) | 1,577 (6.4%) |
| 35 to 39 Minutes | 214 (0.8%) | 100 (0.4%) |
| 40 to 44 Minutes | 212 (0.8%) | 328 (1.3%) |
| 45 to 59 Minutes | 622 (2.4%) | 613 (2.5%) |
| 60 to 89 Minutes | 433 (1.7%) | 323 (1.3%) |
| 90 or more Minutes | 373 (1.4%) | 446 (1.8%) |
Time of Departure to Work by Sex in Wilmington
The most frequent times of departure to work in Wilmington are 8:00 AM to 8:29 AM (3,918, 15.0%) for males and 7:30 AM to 7:59 AM (3,762, 15.2%) for females.
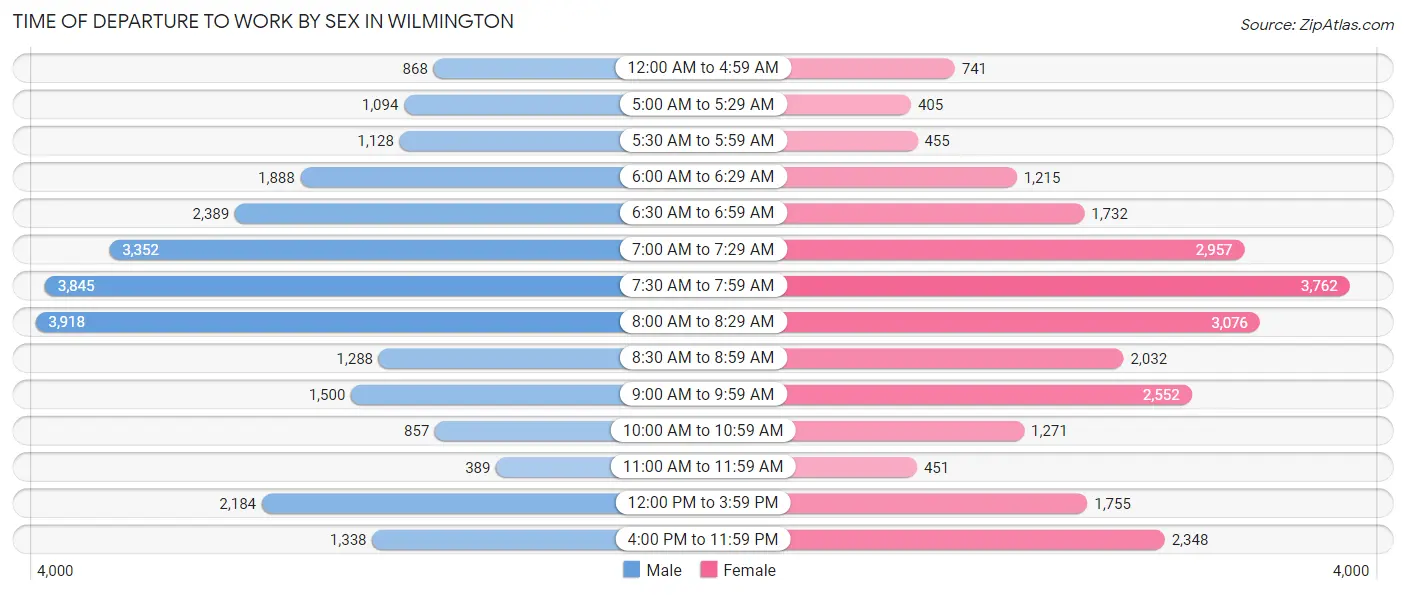
| Time of Departure | Male | Female |
| 12:00 AM to 4:59 AM | 868 (3.3%) | 741 (3.0%) |
| 5:00 AM to 5:29 AM | 1,094 (4.2%) | 405 (1.6%) |
| 5:30 AM to 5:59 AM | 1,128 (4.3%) | 455 (1.8%) |
| 6:00 AM to 6:29 AM | 1,888 (7.2%) | 1,215 (4.9%) |
| 6:30 AM to 6:59 AM | 2,389 (9.2%) | 1,732 (7.0%) |
| 7:00 AM to 7:29 AM | 3,352 (12.9%) | 2,957 (11.9%) |
| 7:30 AM to 7:59 AM | 3,845 (14.8%) | 3,762 (15.2%) |
| 8:00 AM to 8:29 AM | 3,918 (15.0%) | 3,076 (12.4%) |
| 8:30 AM to 8:59 AM | 1,288 (5.0%) | 2,032 (8.2%) |
| 9:00 AM to 9:59 AM | 1,500 (5.8%) | 2,552 (10.3%) |
| 10:00 AM to 10:59 AM | 857 (3.3%) | 1,271 (5.1%) |
| 11:00 AM to 11:59 AM | 389 (1.5%) | 451 (1.8%) |
| 12:00 PM to 3:59 PM | 2,184 (8.4%) | 1,755 (7.1%) |
| 4:00 PM to 11:59 PM | 1,338 (5.1%) | 2,348 (9.5%) |
| Total | 26,038 (100.0%) | 24,752 (100.0%) |
Housing Occupancy in Wilmington
Occupancy by Ownership in Wilmington
Of the total 53,374 dwellings in Wilmington, owner-occupied units account for 24,521 (45.9%), while renter-occupied units make up 28,853 (54.1%).
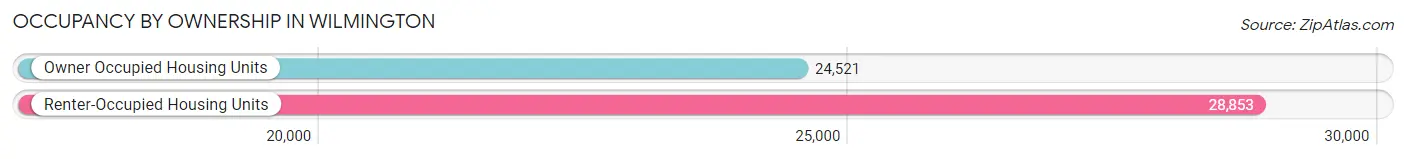
| Occupancy | # Housing Units | % Housing Units |
| Owner Occupied Housing Units | 24,521 | 45.9% |
| Renter-Occupied Housing Units | 28,853 | 54.1% |
| Total Occupied Housing Units | 53,374 | 100.0% |
Occupancy by Household Size in Wilmington
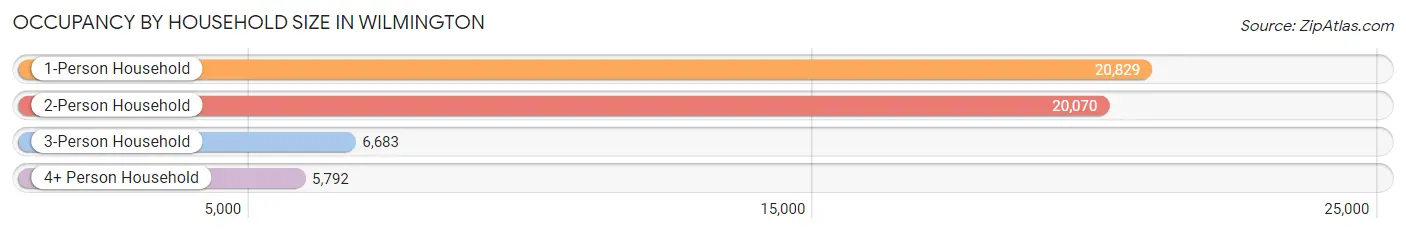
| Household Size | # Housing Units | % Housing Units |
| 1-Person Household | 20,829 | 39.0% |
| 2-Person Household | 20,070 | 37.6% |
| 3-Person Household | 6,683 | 12.5% |
| 4+ Person Household | 5,792 | 10.8% |
| Total Housing Units | 53,374 | 100.0% |
Occupancy by Ownership by Household Size in Wilmington
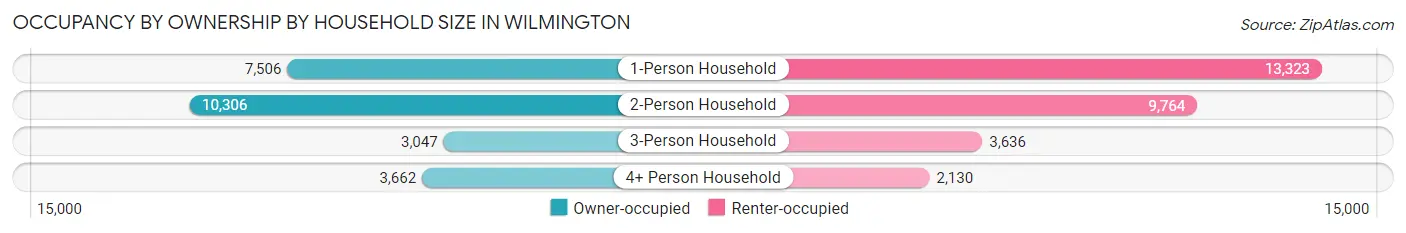
| Household Size | Owner-occupied | Renter-occupied |
| 1-Person Household | 7,506 (36.0%) | 13,323 (64.0%) |
| 2-Person Household | 10,306 (51.3%) | 9,764 (48.6%) |
| 3-Person Household | 3,047 (45.6%) | 3,636 (54.4%) |
| 4+ Person Household | 3,662 (63.2%) | 2,130 (36.8%) |
| Total Housing Units | 24,521 (45.9%) | 28,853 (54.1%) |
Occupancy by Educational Attainment in Wilmington
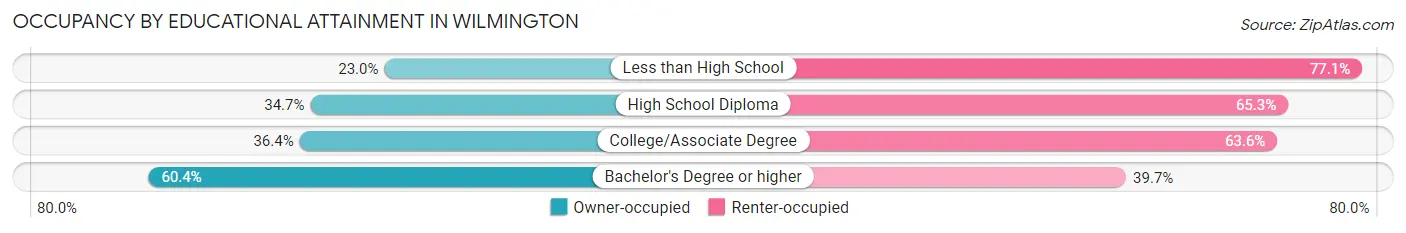
| Household Size | Owner-occupied | Renter-occupied |
| Less than High School | 660 (23.0%) | 2,216 (77.0%) |
| High School Diploma | 3,151 (34.7%) | 5,933 (65.3%) |
| College/Associate Degree | 6,508 (36.4%) | 11,373 (63.6%) |
| Bachelor's Degree or higher | 14,202 (60.4%) | 9,331 (39.7%) |
Occupancy by Age of Householder in Wilmington
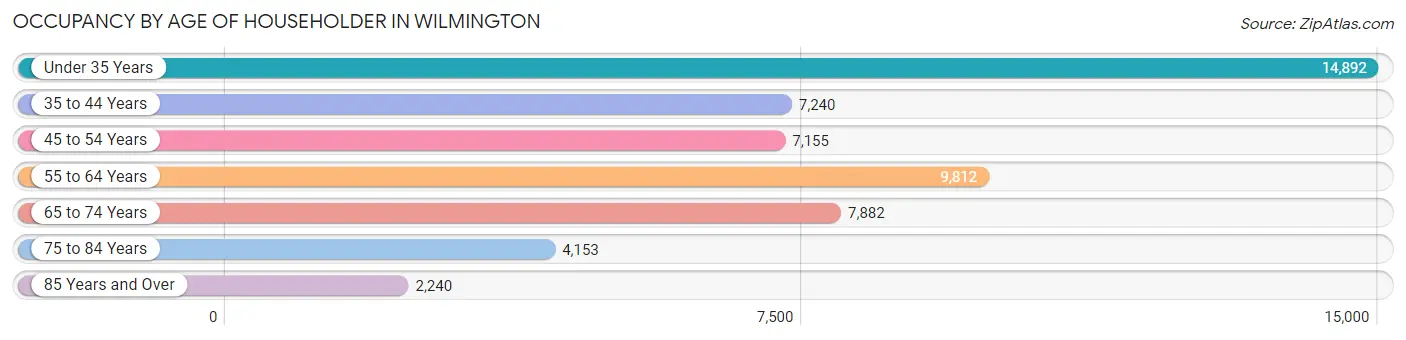
| Age Bracket | # Households | % Households |
| Under 35 Years | 14,892 | 27.9% |
| 35 to 44 Years | 7,240 | 13.6% |
| 45 to 54 Years | 7,155 | 13.4% |
| 55 to 64 Years | 9,812 | 18.4% |
| 65 to 74 Years | 7,882 | 14.8% |
| 75 to 84 Years | 4,153 | 7.8% |
| 85 Years and Over | 2,240 | 4.2% |
| Total | 53,374 | 100.0% |
Housing Finances in Wilmington
Median Income by Occupancy in Wilmington
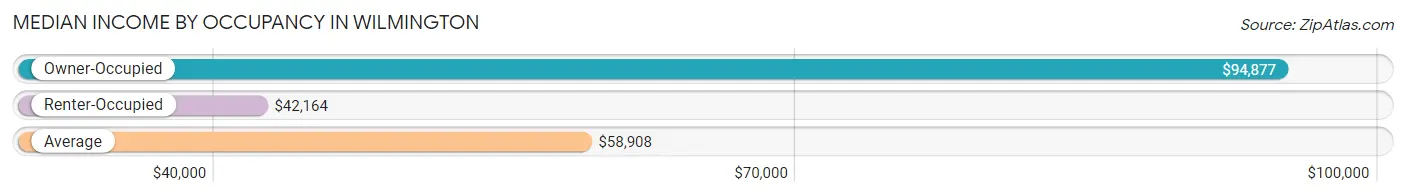
| Occupancy Type | # Households | Median Income |
| Owner-Occupied | 24,521 (45.9%) | $94,877 |
| Renter-Occupied | 28,853 (54.1%) | $42,164 |
| Average | 53,374 (100.0%) | $58,908 |
Occupancy by Householder Income Bracket in Wilmington
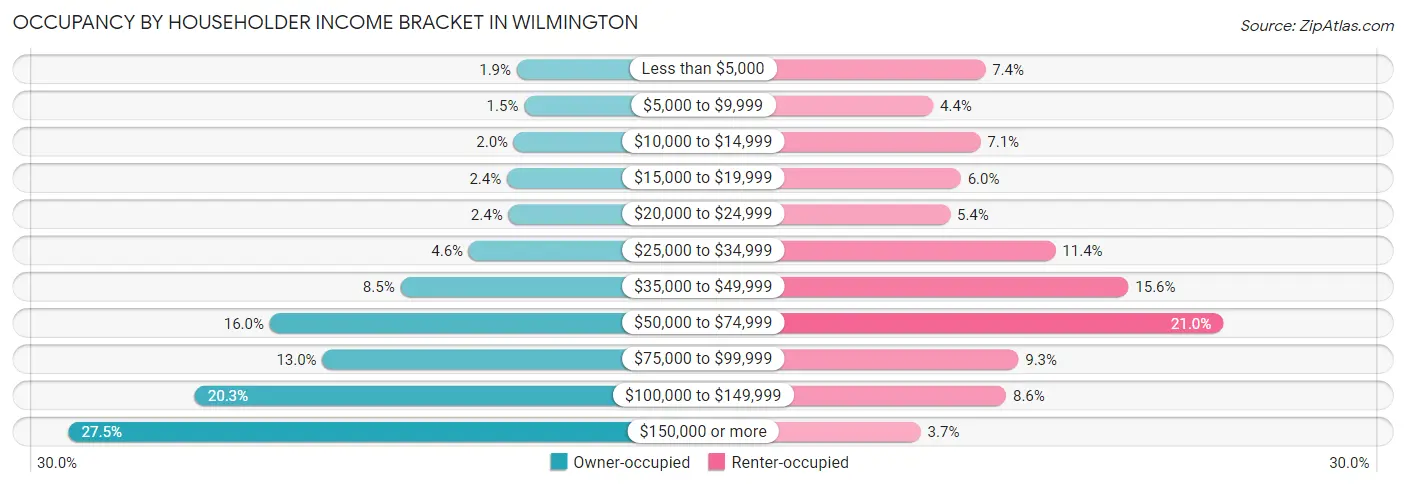
| Income Bracket | Owner-occupied | Renter-occupied |
| Less than $5,000 | 459 (1.9%) | 2,138 (7.4%) |
| $5,000 to $9,999 | 355 (1.5%) | 1,278 (4.4%) |
| $10,000 to $14,999 | 501 (2.0%) | 2,057 (7.1%) |
| $15,000 to $19,999 | 596 (2.4%) | 1,735 (6.0%) |
| $20,000 to $24,999 | 576 (2.4%) | 1,557 (5.4%) |
| $25,000 to $34,999 | 1,130 (4.6%) | 3,296 (11.4%) |
| $35,000 to $49,999 | 2,089 (8.5%) | 4,498 (15.6%) |
| $50,000 to $74,999 | 3,921 (16.0%) | 6,058 (21.0%) |
| $75,000 to $99,999 | 3,184 (13.0%) | 2,682 (9.3%) |
| $100,000 to $149,999 | 4,971 (20.3%) | 2,481 (8.6%) |
| $150,000 or more | 6,739 (27.5%) | 1,073 (3.7%) |
| Total | 24,521 (100.0%) | 28,853 (100.0%) |
Monthly Housing Cost Tiers in Wilmington
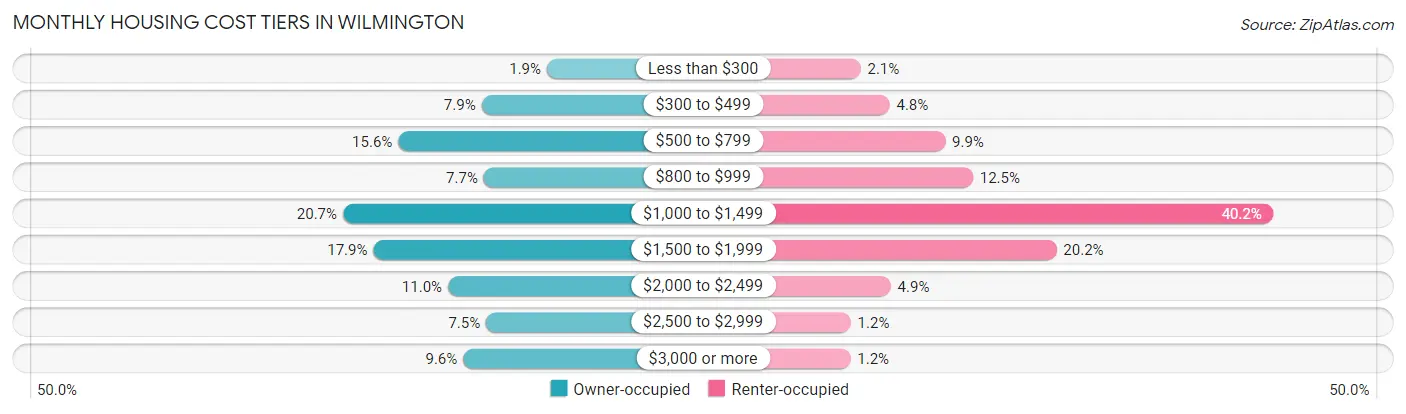
| Monthly Cost | Owner-occupied | Renter-occupied |
| Less than $300 | 472 (1.9%) | 616 (2.1%) |
| $300 to $499 | 1,947 (7.9%) | 1,386 (4.8%) |
| $500 to $799 | 3,828 (15.6%) | 2,860 (9.9%) |
| $800 to $999 | 1,895 (7.7%) | 3,594 (12.5%) |
| $1,000 to $1,499 | 5,077 (20.7%) | 11,587 (40.2%) |
| $1,500 to $1,999 | 4,390 (17.9%) | 5,816 (20.2%) |
| $2,000 to $2,499 | 2,705 (11.0%) | 1,414 (4.9%) |
| $2,500 to $2,999 | 1,845 (7.5%) | 351 (1.2%) |
| $3,000 or more | 2,362 (9.6%) | 343 (1.2%) |
| Total | 24,521 (100.0%) | 28,853 (100.0%) |
Physical Housing Characteristics in Wilmington
Housing Structures in Wilmington
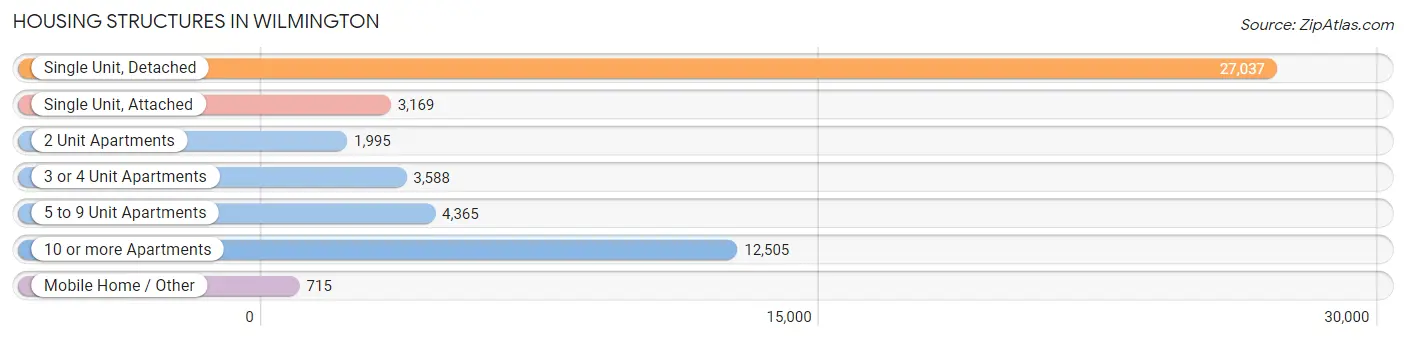
| Structure Type | # Housing Units | % Housing Units |
| Single Unit, Detached | 27,037 | 50.7% |
| Single Unit, Attached | 3,169 | 5.9% |
| 2 Unit Apartments | 1,995 | 3.7% |
| 3 or 4 Unit Apartments | 3,588 | 6.7% |
| 5 to 9 Unit Apartments | 4,365 | 8.2% |
| 10 or more Apartments | 12,505 | 23.4% |
| Mobile Home / Other | 715 | 1.3% |
| Total | 53,374 | 100.0% |
Housing Structures by Occupancy in Wilmington
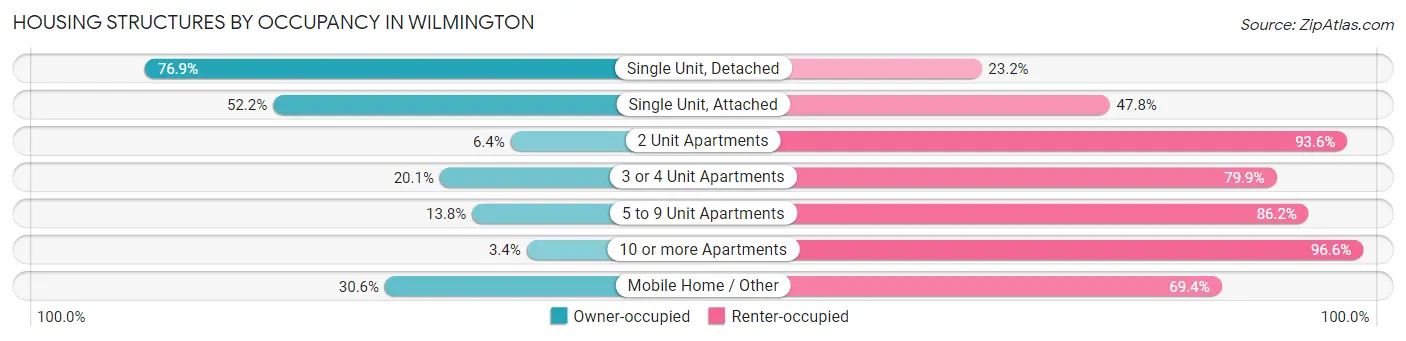
| Structure Type | Owner-occupied | Renter-occupied |
| Single Unit, Detached | 20,777 (76.8%) | 6,260 (23.2%) |
| Single Unit, Attached | 1,653 (52.2%) | 1,516 (47.8%) |
| 2 Unit Apartments | 128 (6.4%) | 1,867 (93.6%) |
| 3 or 4 Unit Apartments | 720 (20.1%) | 2,868 (79.9%) |
| 5 to 9 Unit Apartments | 604 (13.8%) | 3,761 (86.2%) |
| 10 or more Apartments | 420 (3.4%) | 12,085 (96.6%) |
| Mobile Home / Other | 219 (30.6%) | 496 (69.4%) |
| Total | 24,521 (45.9%) | 28,853 (54.1%) |
Housing Structures by Number of Rooms in Wilmington
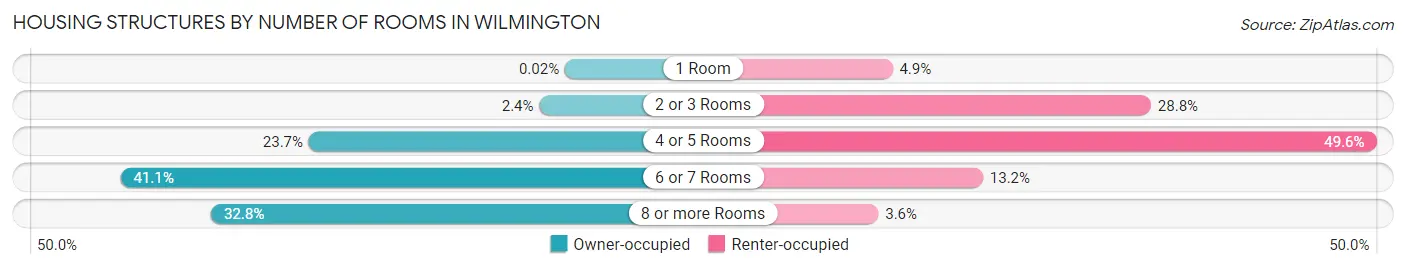
| Number of Rooms | Owner-occupied | Renter-occupied |
| 1 Room | 4 (0.0%) | 1,403 (4.9%) |
| 2 or 3 Rooms | 586 (2.4%) | 8,298 (28.8%) |
| 4 or 5 Rooms | 5,814 (23.7%) | 14,314 (49.6%) |
| 6 or 7 Rooms | 10,085 (41.1%) | 3,814 (13.2%) |
| 8 or more Rooms | 8,032 (32.8%) | 1,024 (3.5%) |
| Total | 24,521 (100.0%) | 28,853 (100.0%) |
Housing Structure by Heating Type in Wilmington
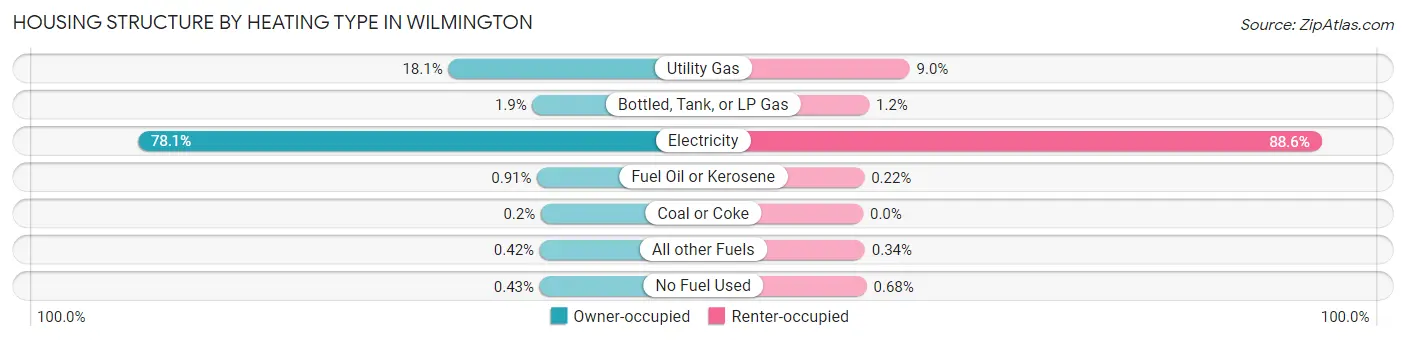
| Heating Type | Owner-occupied | Renter-occupied |
| Utility Gas | 4,435 (18.1%) | 2,598 (9.0%) |
| Bottled, Tank, or LP Gas | 454 (1.8%) | 338 (1.2%) |
| Electricity | 19,153 (78.1%) | 25,559 (88.6%) |
| Fuel Oil or Kerosene | 222 (0.9%) | 64 (0.2%) |
| Coal or Coke | 50 (0.2%) | 0 (0.0%) |
| All other Fuels | 102 (0.4%) | 98 (0.3%) |
| No Fuel Used | 105 (0.4%) | 196 (0.7%) |
| Total | 24,521 (100.0%) | 28,853 (100.0%) |
Household Vehicle Usage in Wilmington
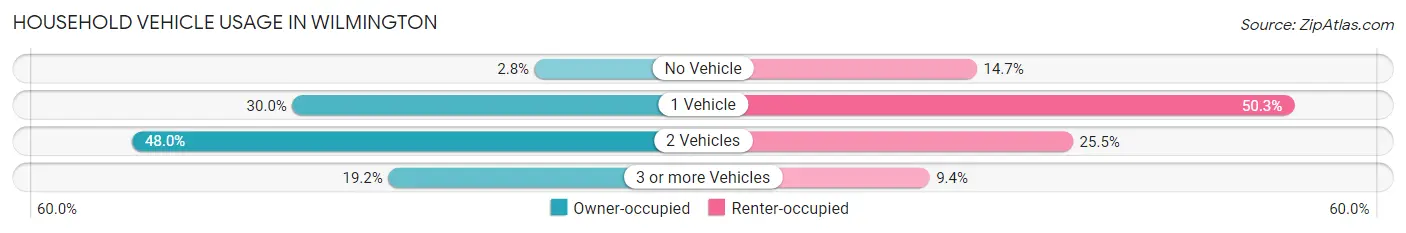
| Vehicles per Household | Owner-occupied | Renter-occupied |
| No Vehicle | 694 (2.8%) | 4,252 (14.7%) |
| 1 Vehicle | 7,349 (30.0%) | 14,517 (50.3%) |
| 2 Vehicles | 11,763 (48.0%) | 7,359 (25.5%) |
| 3 or more Vehicles | 4,715 (19.2%) | 2,725 (9.4%) |
| Total | 24,521 (100.0%) | 28,853 (100.0%) |
Real Estate & Mortgages in Wilmington
Real Estate and Mortgage Overview in Wilmington
| Characteristic | Without Mortgage | With Mortgage |
| Housing Units | 8,469 | 16,052 |
| Median Property Value | $312,700 | $320,900 |
| Median Household Income | $70,200 | $4,795 |
| Monthly Housing Costs | $657 | $2,294 |
| Real Estate Taxes | $2,458 | $250 |
Property Value by Mortgage Status in Wilmington
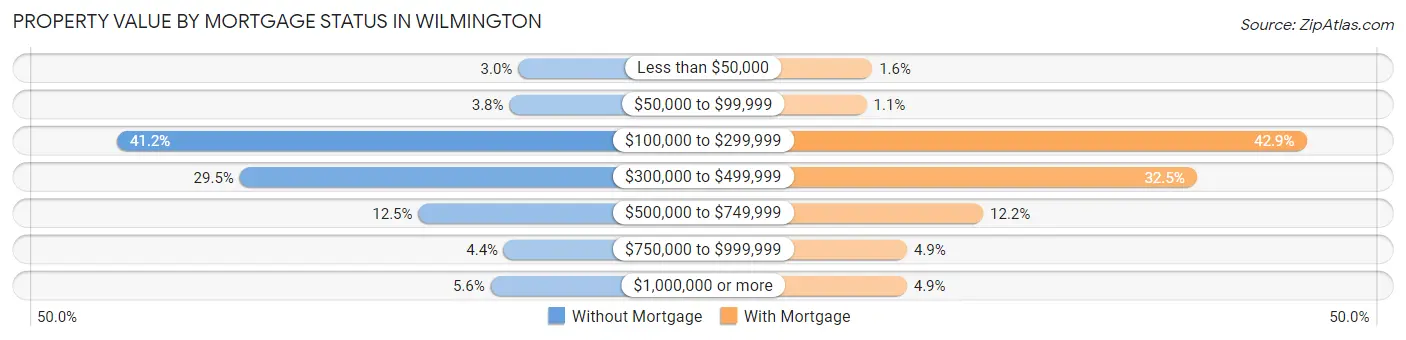
| Property Value | Without Mortgage | With Mortgage |
| Less than $50,000 | 253 (3.0%) | 256 (1.6%) |
| $50,000 to $99,999 | 324 (3.8%) | 168 (1.1%) |
| $100,000 to $299,999 | 3,489 (41.2%) | 6,891 (42.9%) |
| $300,000 to $499,999 | 2,500 (29.5%) | 5,216 (32.5%) |
| $500,000 to $749,999 | 1,059 (12.5%) | 1,951 (12.1%) |
| $750,000 to $999,999 | 368 (4.3%) | 787 (4.9%) |
| $1,000,000 or more | 476 (5.6%) | 783 (4.9%) |
| Total | 8,469 (100.0%) | 16,052 (100.0%) |
Household Income by Mortgage Status in Wilmington
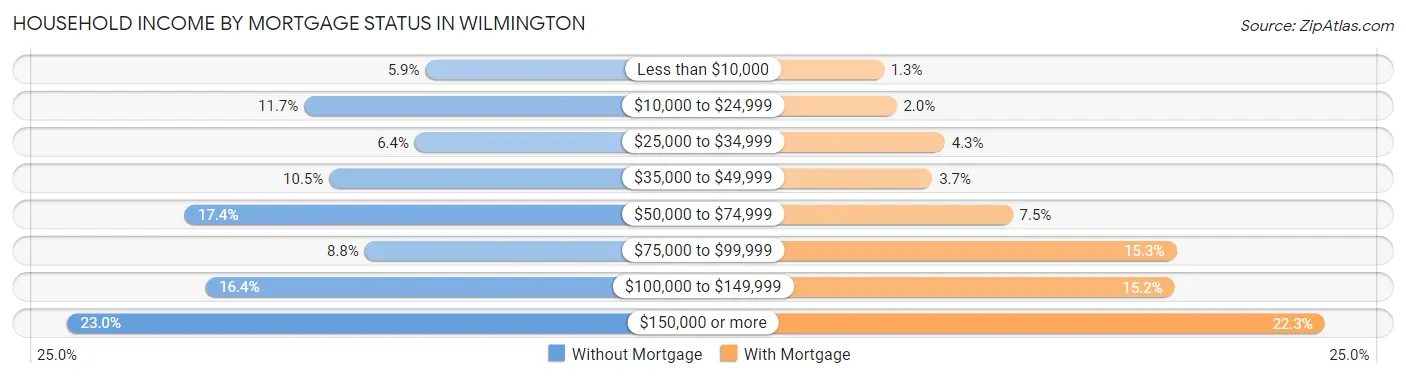
| Household Income | Without Mortgage | With Mortgage |
| Less than $10,000 | 501 (5.9%) | 215 (1.3%) |
| $10,000 to $24,999 | 990 (11.7%) | 313 (1.9%) |
| $25,000 to $34,999 | 544 (6.4%) | 683 (4.3%) |
| $35,000 to $49,999 | 889 (10.5%) | 586 (3.6%) |
| $50,000 to $74,999 | 1,470 (17.4%) | 1,200 (7.5%) |
| $75,000 to $99,999 | 746 (8.8%) | 2,451 (15.3%) |
| $100,000 to $149,999 | 1,385 (16.4%) | 2,438 (15.2%) |
| $150,000 or more | 1,944 (23.0%) | 3,586 (22.3%) |
| Total | 8,469 (100.0%) | 16,052 (100.0%) |
Property Value to Household Income Ratio in Wilmington
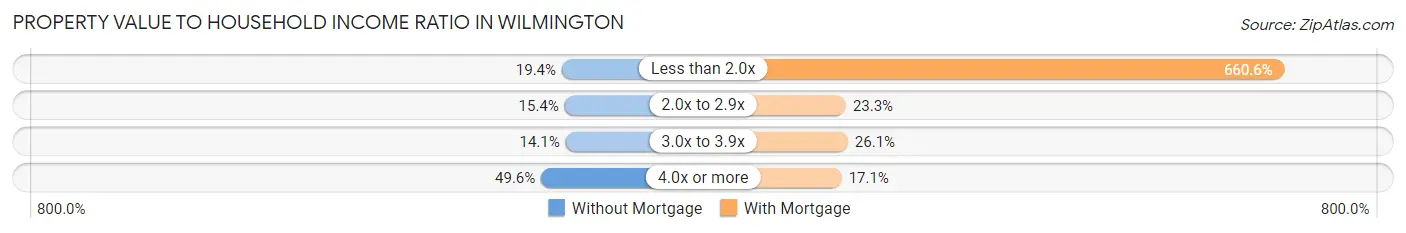
| Value-to-Income Ratio | Without Mortgage | With Mortgage |
| Less than 2.0x | 1,645 (19.4%) | 106,042 (660.6%) |
| 2.0x to 2.9x | 1,307 (15.4%) | 3,739 (23.3%) |
| 3.0x to 3.9x | 1,193 (14.1%) | 4,194 (26.1%) |
| 4.0x or more | 4,201 (49.6%) | 2,743 (17.1%) |
| Total | 8,469 (100.0%) | 16,052 (100.0%) |
Real Estate Taxes by Mortgage Status in Wilmington
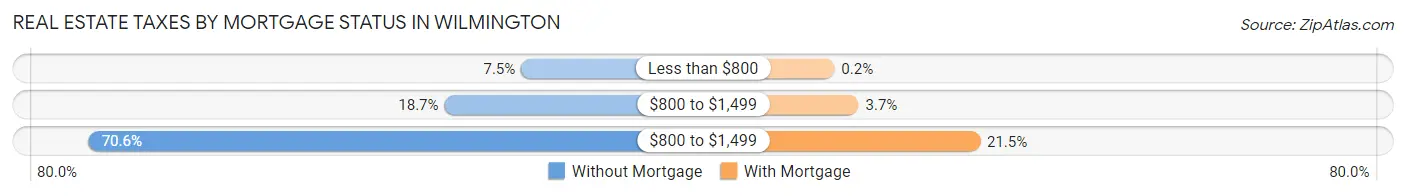
| Property Taxes | Without Mortgage | With Mortgage |
| Less than $800 | 631 (7.4%) | 32 (0.2%) |
| $800 to $1,499 | 1,581 (18.7%) | 599 (3.7%) |
| $800 to $1,499 | 5,981 (70.6%) | 3,448 (21.5%) |
| Total | 8,469 (100.0%) | 16,052 (100.0%) |
Health & Disability in Wilmington
Health Insurance Coverage by Age in Wilmington
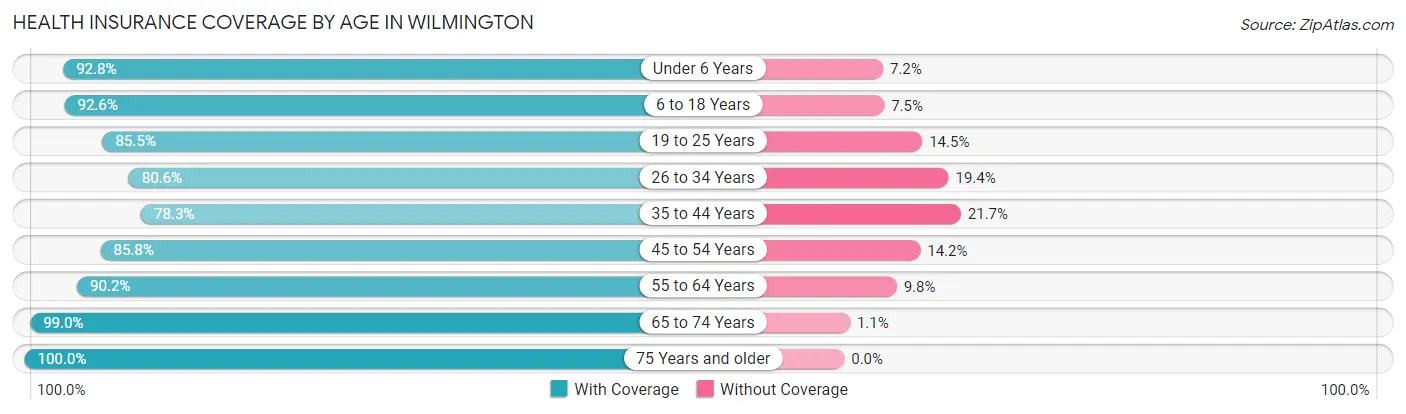
| Age Bracket | With Coverage | Without Coverage |
| Under 6 Years | 5,650 (92.8%) | 439 (7.2%) |
| 6 to 18 Years | 14,768 (92.5%) | 1,188 (7.4%) |
| 19 to 25 Years | 15,572 (85.5%) | 2,647 (14.5%) |
| 26 to 34 Years | 11,575 (80.6%) | 2,793 (19.4%) |
| 35 to 44 Years | 10,638 (78.3%) | 2,956 (21.7%) |
| 45 to 54 Years | 10,712 (85.8%) | 1,768 (14.2%) |
| 55 to 64 Years | 13,651 (90.2%) | 1,480 (9.8%) |
| 65 to 74 Years | 11,629 (99.0%) | 123 (1.1%) |
| 75 Years and older | 8,675 (100.0%) | 0 (0.0%) |
| Total | 102,870 (88.5%) | 13,394 (11.5%) |
Health Insurance Coverage by Citizenship Status in Wilmington
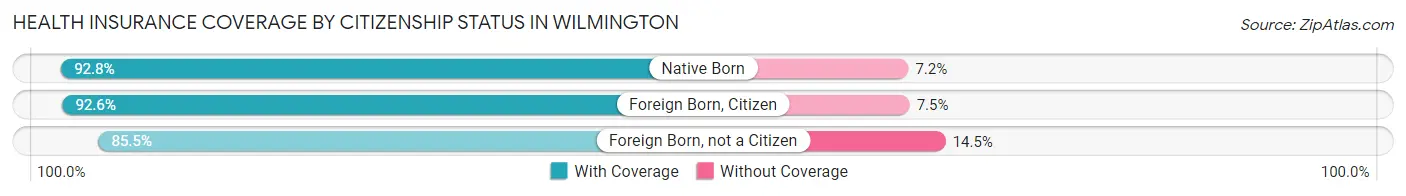
| Citizenship Status | With Coverage | Without Coverage |
| Native Born | 5,650 (92.8%) | 439 (7.2%) |
| Foreign Born, Citizen | 14,768 (92.5%) | 1,188 (7.4%) |
| Foreign Born, not a Citizen | 15,572 (85.5%) | 2,647 (14.5%) |
Health Insurance Coverage by Household Income in Wilmington
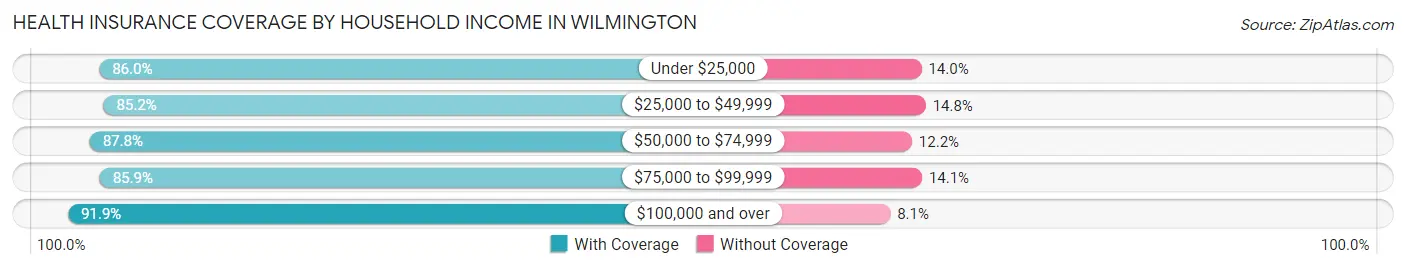
| Household Income | With Coverage | Without Coverage |
| Under $25,000 | 16,061 (86.0%) | 2,613 (14.0%) |
| $25,000 to $49,999 | 17,584 (85.2%) | 3,050 (14.8%) |
| $50,000 to $74,999 | 18,227 (87.8%) | 2,533 (12.2%) |
| $75,000 to $99,999 | 10,462 (85.9%) | 1,715 (14.1%) |
| $100,000 and over | 36,148 (91.9%) | 3,199 (8.1%) |
Public vs Private Health Insurance Coverage by Age in Wilmington
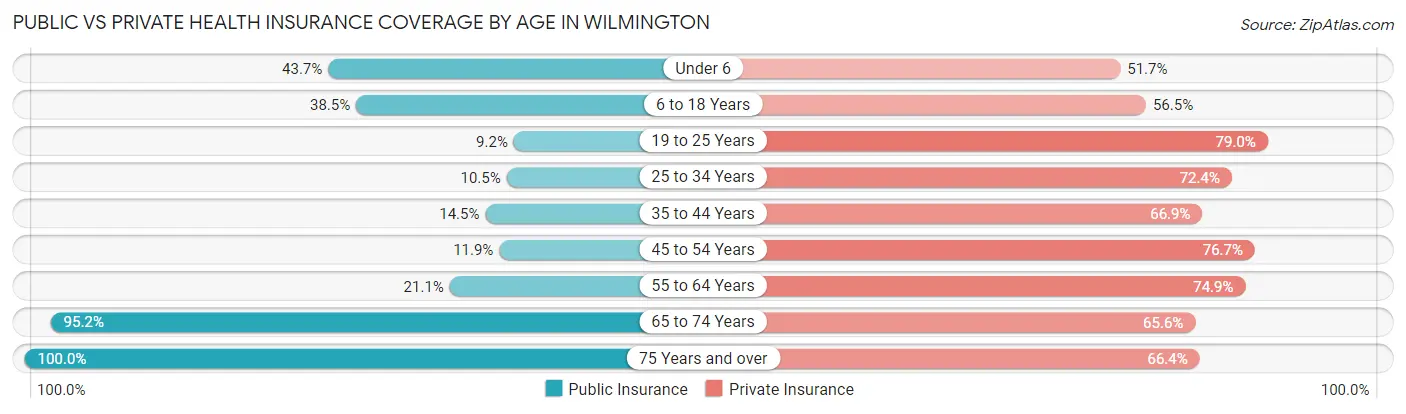
| Age Bracket | Public Insurance | Private Insurance |
| Under 6 | 2,659 (43.7%) | 3,148 (51.7%) |
| 6 to 18 Years | 6,140 (38.5%) | 9,008 (56.5%) |
| 19 to 25 Years | 1,678 (9.2%) | 14,400 (79.0%) |
| 25 to 34 Years | 1,515 (10.5%) | 10,398 (72.4%) |
| 35 to 44 Years | 1,969 (14.5%) | 9,096 (66.9%) |
| 45 to 54 Years | 1,486 (11.9%) | 9,567 (76.7%) |
| 55 to 64 Years | 3,193 (21.1%) | 11,331 (74.9%) |
| 65 to 74 Years | 11,184 (95.2%) | 7,707 (65.6%) |
| 75 Years and over | 8,675 (100.0%) | 5,759 (66.4%) |
| Total | 38,499 (33.1%) | 80,414 (69.2%) |
Disability Status by Sex by Age in Wilmington
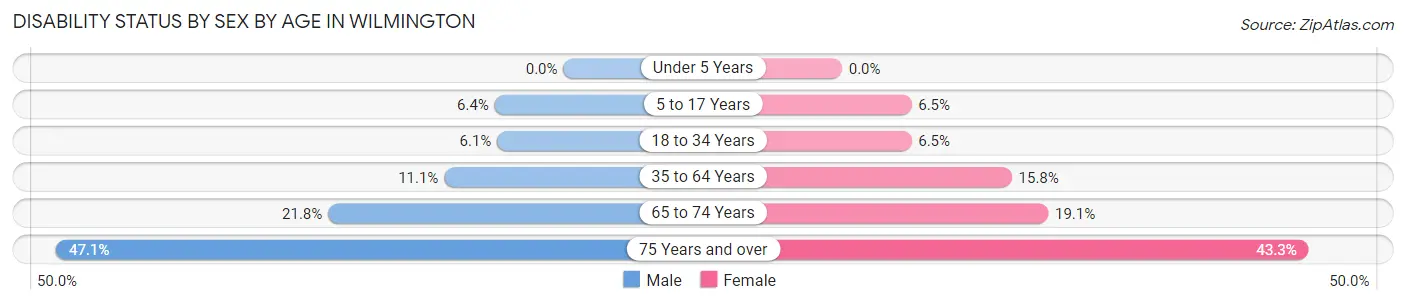
| Age Bracket | Male | Female |
| Under 5 Years | 0 (0.0%) | 0 (0.0%) |
| 5 to 17 Years | 476 (6.4%) | 466 (6.5%) |
| 18 to 34 Years | 977 (6.1%) | 1,232 (6.5%) |
| 35 to 64 Years | 2,168 (11.1%) | 3,404 (15.8%) |
| 65 to 74 Years | 1,067 (21.8%) | 1,314 (19.1%) |
| 75 Years and over | 1,627 (47.1%) | 2,261 (43.3%) |
Disability Class by Sex by Age in Wilmington
Disability Class: Hearing Difficulty
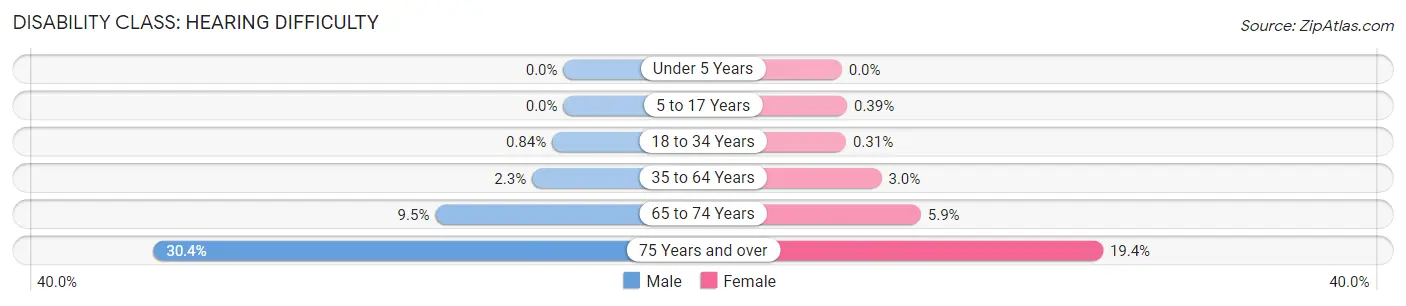
| Age Bracket | Male | Female |
| Under 5 Years | 0 (0.0%) | 0 (0.0%) |
| 5 to 17 Years | 0 (0.0%) | 28 (0.4%) |
| 18 to 34 Years | 134 (0.8%) | 59 (0.3%) |
| 35 to 64 Years | 456 (2.3%) | 638 (2.9%) |
| 65 to 74 Years | 465 (9.5%) | 403 (5.9%) |
| 75 Years and over | 1,052 (30.4%) | 1,012 (19.4%) |
Disability Class: Vision Difficulty
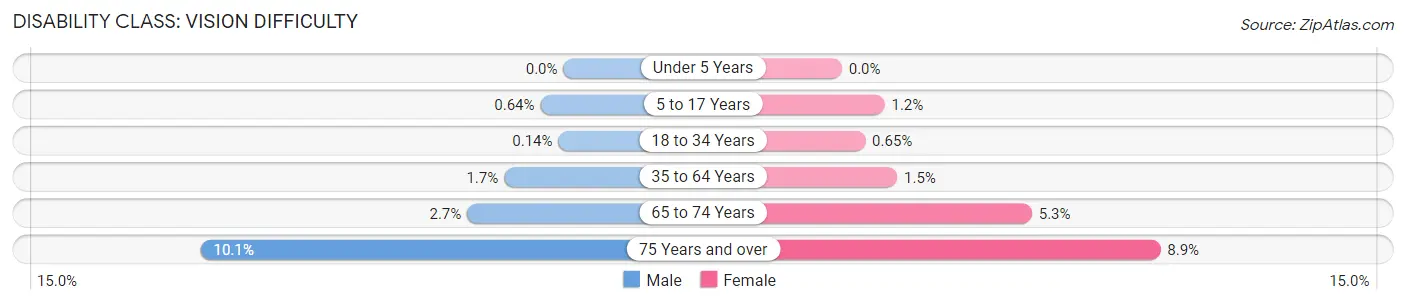
| Age Bracket | Male | Female |
| Under 5 Years | 0 (0.0%) | 0 (0.0%) |
| 5 to 17 Years | 48 (0.6%) | 86 (1.2%) |
| 18 to 34 Years | 23 (0.1%) | 125 (0.6%) |
| 35 to 64 Years | 324 (1.7%) | 333 (1.5%) |
| 65 to 74 Years | 131 (2.7%) | 363 (5.3%) |
| 75 Years and over | 349 (10.1%) | 463 (8.9%) |
Disability Class: Cognitive Difficulty
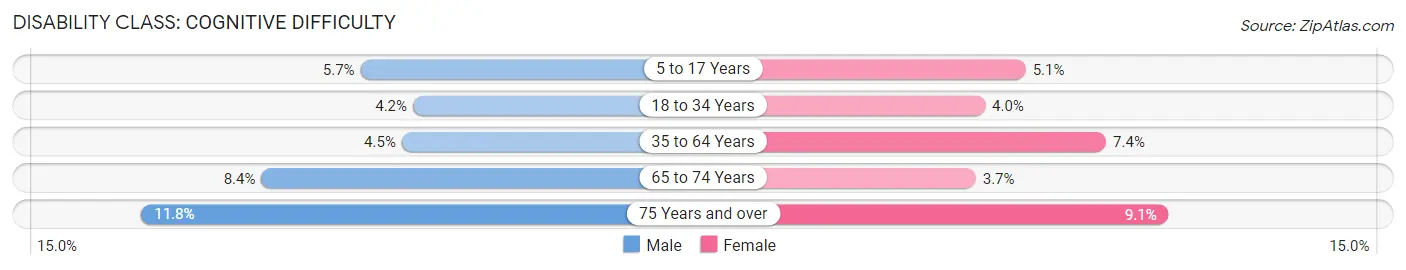
| Age Bracket | Male | Female |
| 5 to 17 Years | 422 (5.7%) | 370 (5.1%) |
| 18 to 34 Years | 666 (4.2%) | 762 (4.0%) |
| 35 to 64 Years | 882 (4.5%) | 1,589 (7.4%) |
| 65 to 74 Years | 411 (8.4%) | 256 (3.7%) |
| 75 Years and over | 406 (11.7%) | 475 (9.1%) |
Disability Class: Ambulatory Difficulty
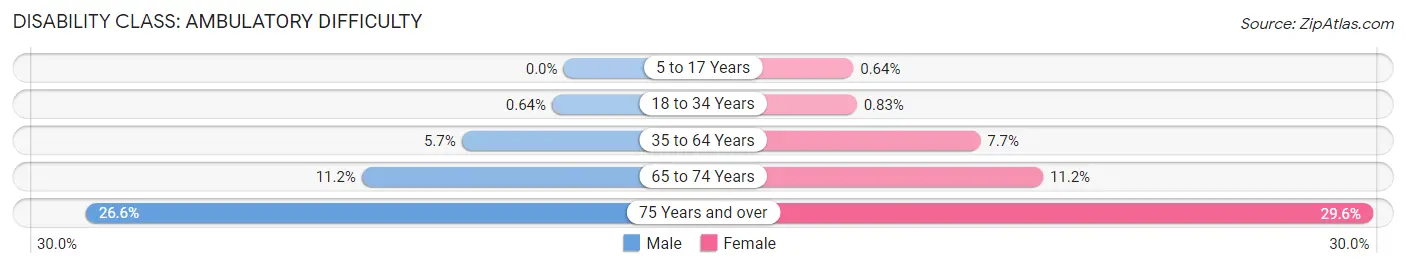
| Age Bracket | Male | Female |
| 5 to 17 Years | 0 (0.0%) | 46 (0.6%) |
| 18 to 34 Years | 101 (0.6%) | 159 (0.8%) |
| 35 to 64 Years | 1,112 (5.7%) | 1,665 (7.7%) |
| 65 to 74 Years | 549 (11.2%) | 769 (11.2%) |
| 75 Years and over | 919 (26.6%) | 1,543 (29.6%) |
Disability Class: Self-Care Difficulty
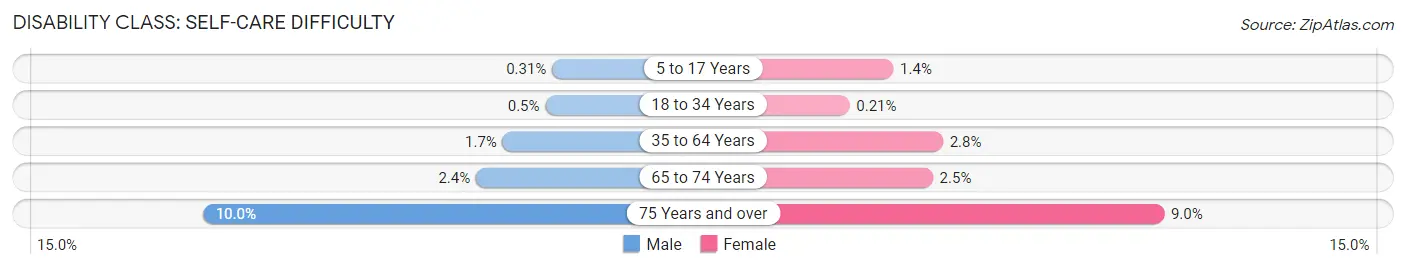
| Age Bracket | Male | Female |
| 5 to 17 Years | 23 (0.3%) | 103 (1.4%) |
| 18 to 34 Years | 80 (0.5%) | 40 (0.2%) |
| 35 to 64 Years | 331 (1.7%) | 607 (2.8%) |
| 65 to 74 Years | 119 (2.4%) | 174 (2.5%) |
| 75 Years and over | 347 (10.0%) | 468 (9.0%) |
Technology Access in Wilmington
Computing Device Access in Wilmington
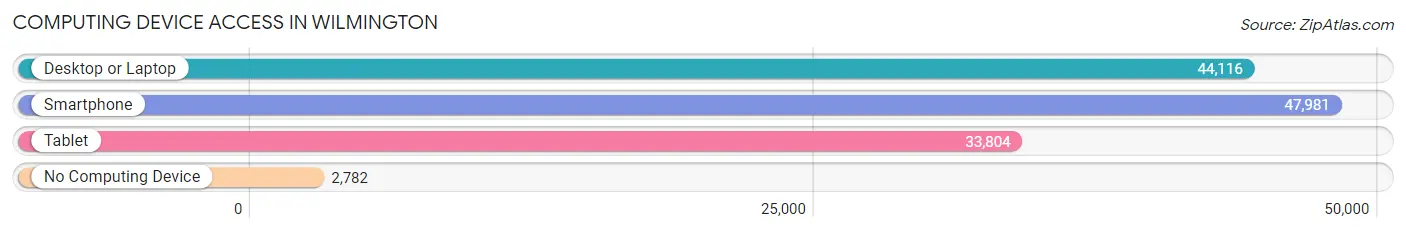
| Device Type | # Households | % Households |
| Desktop or Laptop | 44,116 | 82.7% |
| Smartphone | 47,981 | 89.9% |
| Tablet | 33,804 | 63.3% |
| No Computing Device | 2,782 | 5.2% |
| Total | 53,374 | 100.0% |
Internet Access in Wilmington
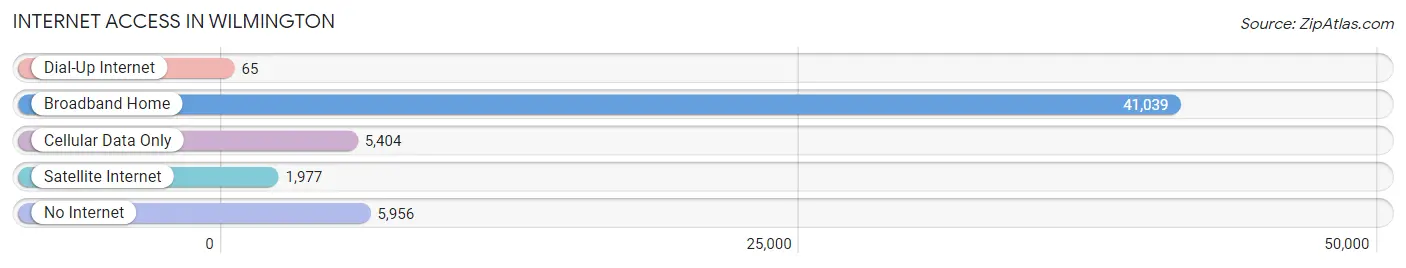
| Internet Type | # Households | % Households |
| Dial-Up Internet | 65 | 0.1% |
| Broadband Home | 41,039 | 76.9% |
| Cellular Data Only | 5,404 | 10.1% |
| Satellite Internet | 1,977 | 3.7% |
| No Internet | 5,956 | 11.2% |
| Total | 53,374 | 100.0% |
Wilmington Summary
Wilmington, North Carolina is a port city located in the southeastern corner of the state. It is the county seat of New Hanover County and the largest city in the Cape Fear region. Wilmington is situated on the banks of the Cape Fear River, which is a major shipping channel for the region. The city is known for its historic downtown district, which is home to many of the city’s most iconic buildings and attractions.
History
Wilmington was founded in 1739 by a group of Swiss and German immigrants led by John Watson. The city was named after Spencer Compton, the Earl of Wilmington. The city quickly grew in importance as a port city, and by the mid-1800s, it was the largest city in North Carolina. During the Civil War, Wilmington was a major port for the Confederacy, and it was the last major port to fall to Union forces in 1865.
In the late 19th century, Wilmington became a major industrial center, with the construction of the Atlantic Coast Line Railroad and the Atlantic Coast Line Shipyard. The city also became a major tourist destination, with the opening of the Wilmington Beach Boardwalk in the early 20th century.
Geography
Wilmington is located in the southeastern corner of North Carolina, on the banks of the Cape Fear River. The city is situated at the intersection of the Cape Fear and Northeast Cape Fear Rivers, which form a natural harbor. The city is bordered by the Atlantic Ocean to the east and the Intracoastal Waterway to the west. The city is located approximately 30 miles south of the state capital of Raleigh.
The city has a humid subtropical climate, with hot, humid summers and mild winters. The average annual temperature is around 70 degrees Fahrenheit, with an average high of around 85 degrees in the summer and an average low of around 55 degrees in the winter.
Economy
Wilmington’s economy is largely based on tourism, manufacturing, and shipping. The city is home to several major employers, including Corning, GE, and PPD. The city is also home to several major universities, including the University of North Carolina Wilmington and Cape Fear Community College.
The city is also home to several major tourist attractions, including the Wilmington Beach Boardwalk, the USS North Carolina Battleship Memorial, and the Cape Fear Museum. The city is also home to several major festivals, including the Azalea Festival and the Riverfest.
Demographics
As of the 2010 census, the population of Wilmington was 106,476. The city has a population density of 1,845 people per square mile. The racial makeup of the city is 63.3% White, 28.2% African American, 0.5% Native American, 2.2% Asian, and 5.8% from other races.
The median household income in Wilmington is $41,945, and the median family income is $50,945. The per capita income in the city is $25,945. The city has a poverty rate of 18.3%.
Wilmington is home to several major religious denominations, including Baptist, Methodist, Presbyterian, and Roman Catholic. The city is also home to several major cultural institutions, including the Wilmington Symphony Orchestra, the Wilmington Ballet, and the Thalian Hall Center for the Performing Arts.
Common Questions
What is Per Capita Income in Wilmington?
Per Capita income in Wilmington is $42,750.
What is the Median Family Income in Wilmington?
Median Family Income in Wilmington is $84,883.
What is the Median Household income in Wilmington?
Median Household Income in Wilmington is $58,908.
What is Income or Wage Gap in Wilmington?
Income or Wage Gap in Wilmington is 28.2%.
Women in Wilmington earn 71.8 cents for every dollar earned by a man.
What is Family Income Deficit in Wilmington?
Family Income Deficit in Wilmington is $11,000.
Families that are below poverty line in Wilmington earn $11,000 less on average than the poverty threshold level.
What is Inequality or Gini Index in Wilmington?
Inequality or Gini Index in Wilmington is 0.52.
What is the Total Population of Wilmington?
Total Population of Wilmington is 116,933.
What is the Total Male Population of Wilmington?
Total Male Population of Wilmington is 54,588.
What is the Total Female Population of Wilmington?
Total Female Population of Wilmington is 62,345.
What is the Ratio of Males per 100 Females in Wilmington?
There are 87.56 Males per 100 Females in Wilmington.
What is the Ratio of Females per 100 Males in Wilmington?
There are 114.21 Females per 100 Males in Wilmington.
What is the Median Population Age in Wilmington?
Median Population Age in Wilmington is 37.6 Years.
What is the Average Family Size in Wilmington
Average Family Size in Wilmington is 2.9 People.
What is the Average Household Size in Wilmington
Average Household Size in Wilmington is 2.1 People.
How Large is the Labor Force in Wilmington?
There are 63,857 People in the Labor Forcein in Wilmington.
What is the Percentage of People in the Labor Force in Wilmington?
64.2% of People are in the Labor Force in Wilmington.
What is the Unemployment Rate in Wilmington?
Unemployment Rate in Wilmington is 4.9%.