Anchorage, AK Map & Demographics
Anchorage Map
Anchorage Overview
$46,554
PER CAPITA INCOME
$115,272
AVG FAMILY INCOME
$95,731
AVG HOUSEHOLD INCOME
20.9%
WAGE / INCOME GAP [ % ]
79.1¢/ $1
WAGE / INCOME GAP [ $ ]
$10,129
FAMILY INCOME DEFICIT
0.43
INEQUALITY / GINI INDEX
290,674
TOTAL POPULATION
149,144
MALE POPULATION
141,530
FEMALE POPULATION
105.38
MALES / 100 FEMALES
94.89
FEMALES / 100 MALES
34.5
MEDIAN AGE
3.3
AVG FAMILY SIZE
2.6
AVG HOUSEHOLD SIZE
159,630
LABOR FORCE [ PEOPLE ]
69.9%
PERCENT IN LABOR FORCE
5.2%
UNEMPLOYMENT RATE
Anchorage Area Codes
Income in Anchorage
Income Overview in Anchorage
Per Capita Income in Anchorage is $46,554, while median incomes of families and households are $115,272 and $95,731 respectively.
| Characteristic | Number | Measure |
| Per Capita Income | 290,674 | $46,554 |
| Median Family Income | 68,213 | $115,272 |
| Mean Family Income | 68,213 | $141,690 |
| Median Household Income | 107,134 | $95,731 |
| Mean Household Income | 107,134 | $122,032 |
| Income Deficit | 68,213 | $10,129 |
| Wage / Income Gap (%) | 290,674 | 20.95% |
| Wage / Income Gap ($) | 290,674 | 79.05¢ per $1 |
| Gini / Inequality Index | 290,674 | 0.43 |
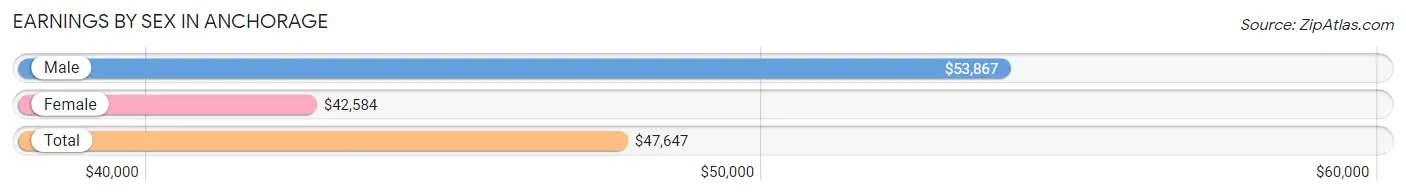
Earnings by Sex in Anchorage
Average Earnings in Anchorage are $47,647, $53,867 for men and $42,584 for women, a difference of 20.9%.
| Sex | Number | Average Earnings |
| Male | 90,831 (54.2%) | $53,867 |
| Female | 76,669 (45.8%) | $42,584 |
| Total | 167,500 (100.0%) | $47,647 |
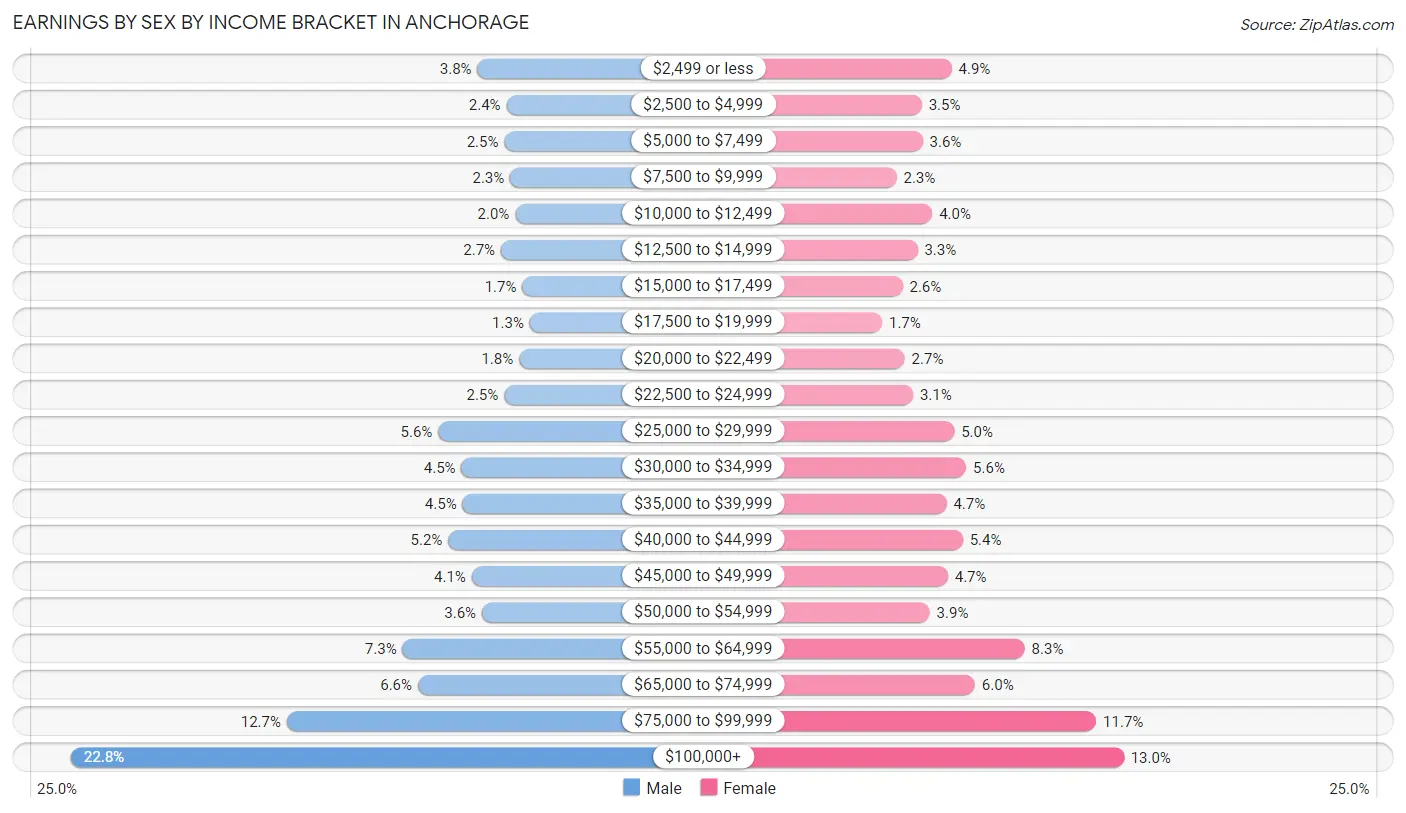
Earnings by Sex by Income Bracket in Anchorage
The most common earnings brackets in Anchorage are $100,000+ for men (20,739 | 22.8%) and $100,000+ for women (9,942 | 13.0%).
| Income | Male | Female |
| $2,499 or less | 3,438 (3.8%) | 3,767 (4.9%) |
| $2,500 to $4,999 | 2,206 (2.4%) | 2,689 (3.5%) |
| $5,000 to $7,499 | 2,294 (2.5%) | 2,725 (3.5%) |
| $7,500 to $9,999 | 2,051 (2.3%) | 1,787 (2.3%) |
| $10,000 to $12,499 | 1,831 (2.0%) | 3,068 (4.0%) |
| $12,500 to $14,999 | 2,439 (2.7%) | 2,540 (3.3%) |
| $15,000 to $17,499 | 1,531 (1.7%) | 1,998 (2.6%) |
| $17,500 to $19,999 | 1,219 (1.3%) | 1,262 (1.7%) |
| $20,000 to $22,499 | 1,670 (1.8%) | 2,079 (2.7%) |
| $22,500 to $24,999 | 2,303 (2.5%) | 2,380 (3.1%) |
| $25,000 to $29,999 | 5,118 (5.6%) | 3,860 (5.0%) |
| $30,000 to $34,999 | 4,126 (4.5%) | 4,282 (5.6%) |
| $35,000 to $39,999 | 4,082 (4.5%) | 3,584 (4.7%) |
| $40,000 to $44,999 | 4,686 (5.2%) | 4,165 (5.4%) |
| $45,000 to $49,999 | 3,685 (4.1%) | 3,629 (4.7%) |
| $50,000 to $54,999 | 3,249 (3.6%) | 2,972 (3.9%) |
| $55,000 to $64,999 | 6,629 (7.3%) | 6,386 (8.3%) |
| $65,000 to $74,999 | 5,977 (6.6%) | 4,601 (6.0%) |
| $75,000 to $99,999 | 11,558 (12.7%) | 8,953 (11.7%) |
| $100,000+ | 20,739 (22.8%) | 9,942 (13.0%) |
| Total | 90,831 (100.0%) | 76,669 (100.0%) |
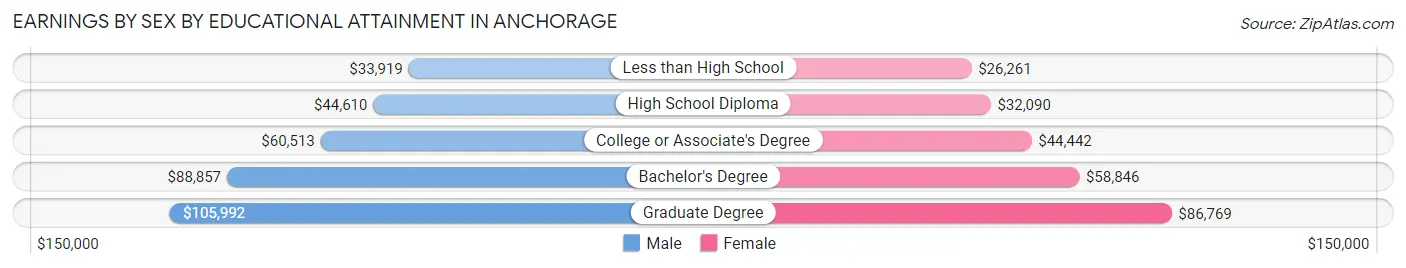
Earnings by Sex by Educational Attainment in Anchorage
Average earnings in Anchorage are $64,200 for men and $49,462 for women, a difference of 23.0%. Men with an educational attainment of graduate degree enjoy the highest average annual earnings of $105,992, while those with less than high school education earn the least with $33,919. Women with an educational attainment of graduate degree earn the most with the average annual earnings of $86,769, while those with less than high school education have the smallest earnings of $26,261.
| Educational Attainment | Male Income | Female Income |
| Less than High School | $33,919 | $26,261 |
| High School Diploma | $44,610 | $32,090 |
| College or Associate's Degree | $60,513 | $44,442 |
| Bachelor's Degree | $88,857 | $58,846 |
| Graduate Degree | $105,992 | $86,769 |
| Total | $64,200 | $49,462 |
Family Income in Anchorage
Family Income Brackets in Anchorage
According to the Anchorage family income data, there are 15,621 families falling into the $100,000 to $149,999 income range, which is the most common income bracket and makes up 22.9% of all families. Conversely, the $10,000 to $14,999 income bracket is the least frequent group with only 887 families (1.3%) belonging to this category.
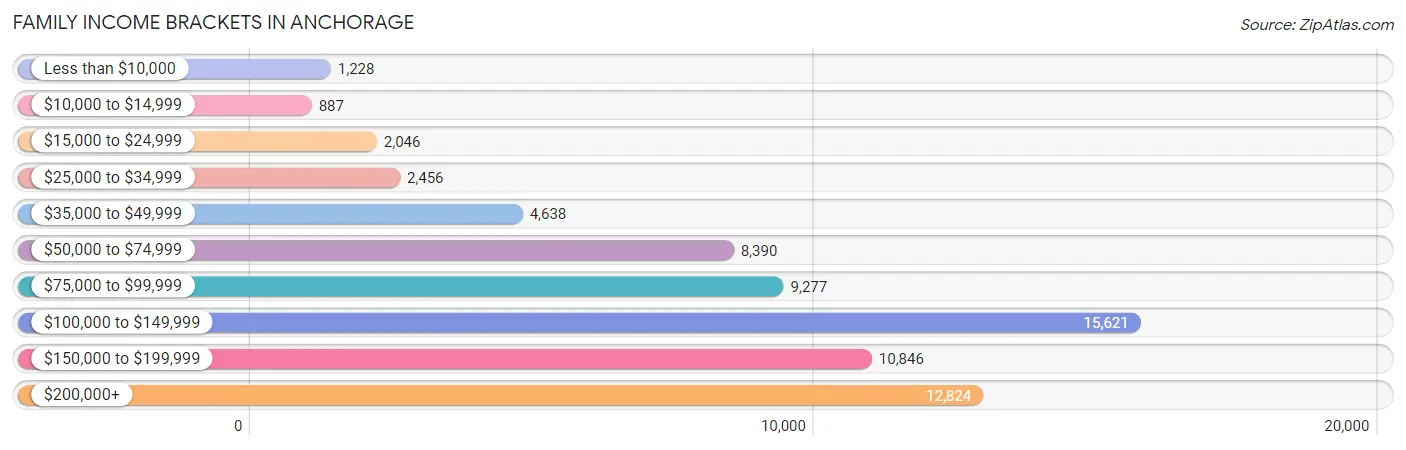
| Income Bracket | # Families | % Families |
| Less than $10,000 | 1,228 | 1.8% |
| $10,000 to $14,999 | 887 | 1.3% |
| $15,000 to $24,999 | 2,046 | 3.0% |
| $25,000 to $34,999 | 2,456 | 3.6% |
| $35,000 to $49,999 | 4,638 | 6.8% |
| $50,000 to $74,999 | 8,390 | 12.3% |
| $75,000 to $99,999 | 9,277 | 13.6% |
| $100,000 to $149,999 | 15,621 | 22.9% |
| $150,000 to $199,999 | 10,846 | 15.9% |
| $200,000+ | 12,824 | 18.8% |
Family Income by Famaliy Size in Anchorage
4-person families (13,144 | 19.3%) account for the highest median family income in Anchorage with $137,338 per family, while 2-person families (31,128 | 45.6%) have the highest median income of $51,358 per family member.
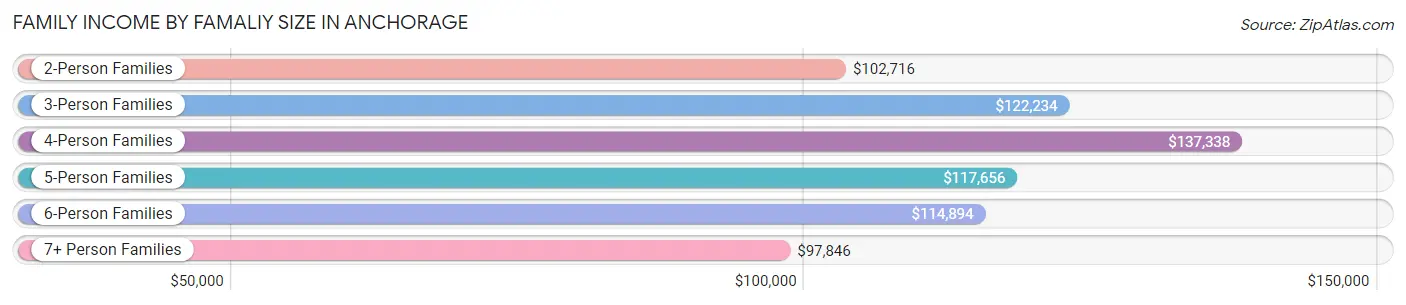
| Income Bracket | # Families | Median Income |
| 2-Person Families | 31,128 (45.6%) | $102,716 |
| 3-Person Families | 14,091 (20.7%) | $122,234 |
| 4-Person Families | 13,144 (19.3%) | $137,338 |
| 5-Person Families | 5,961 (8.7%) | $117,656 |
| 6-Person Families | 2,161 (3.2%) | $114,894 |
| 7+ Person Families | 1,728 (2.5%) | $97,846 |
| Total | 68,213 (100.0%) | $115,272 |
Family Income by Number of Earners in Anchorage
The median family income in Anchorage is $115,272, with families comprising 3+ earners (8,650) having the highest median family income of $160,814, while families with no earners (6,690) have the lowest median family income of $74,138, accounting for 12.7% and 9.8% of families, respectively.
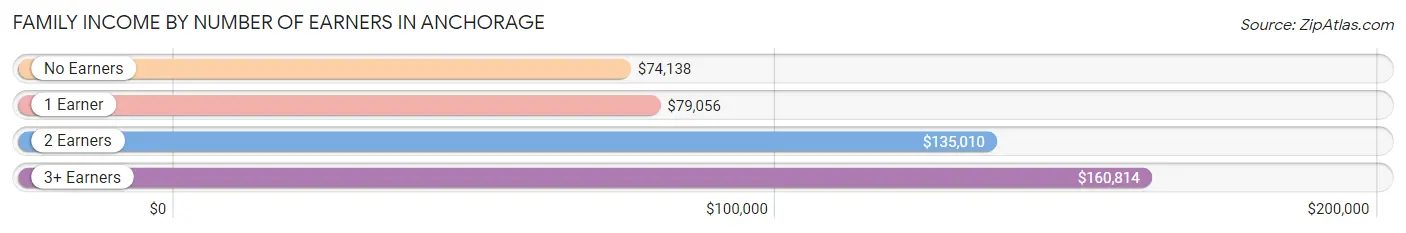
| Number of Earners | # Families | Median Income |
| No Earners | 6,690 (9.8%) | $74,138 |
| 1 Earner | 21,428 (31.4%) | $79,056 |
| 2 Earners | 31,445 (46.1%) | $135,010 |
| 3+ Earners | 8,650 (12.7%) | $160,814 |
| Total | 68,213 (100.0%) | $115,272 |
Household Income in Anchorage
Household Income Brackets in Anchorage
With 21,962 households falling in the category, the $100,000 to $149,999 income range is the most frequent in Anchorage, accounting for 20.5% of all households. In contrast, only 2,036 households (1.9%) fall into the $10,000 to $14,999 income bracket, making it the least populous group.
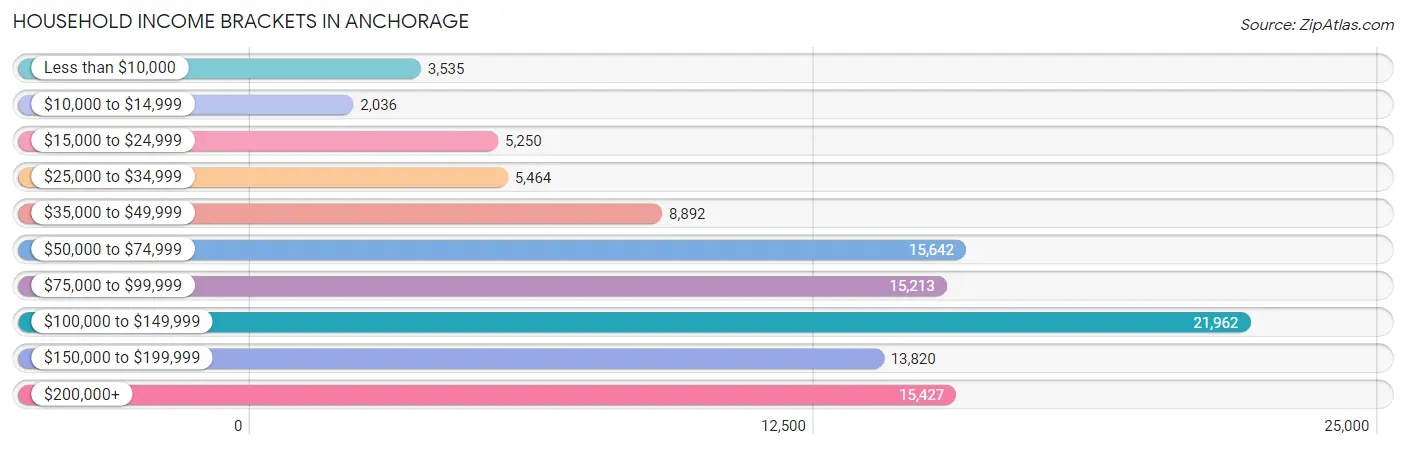
| Income Bracket | # Households | % Households |
| Less than $10,000 | 3,535 | 3.3% |
| $10,000 to $14,999 | 2,036 | 1.9% |
| $15,000 to $24,999 | 5,250 | 4.9% |
| $25,000 to $34,999 | 5,464 | 5.1% |
| $35,000 to $49,999 | 8,892 | 8.3% |
| $50,000 to $74,999 | 15,642 | 14.6% |
| $75,000 to $99,999 | 15,213 | 14.2% |
| $100,000 to $149,999 | 21,962 | 20.5% |
| $150,000 to $199,999 | 13,820 | 12.9% |
| $200,000+ | 15,427 | 14.4% |
Household Income by Householder Age in Anchorage
The median household income in Anchorage is $95,731, with the highest median household income of $117,260 found in the 45 to 64 years age bracket for the primary householder. A total of 38,126 households (35.6%) fall into this category. Meanwhile, the 15 to 24 years age bracket for the primary householder has the lowest median household income of $45,019, with 5,687 households (5.3%) in this group.
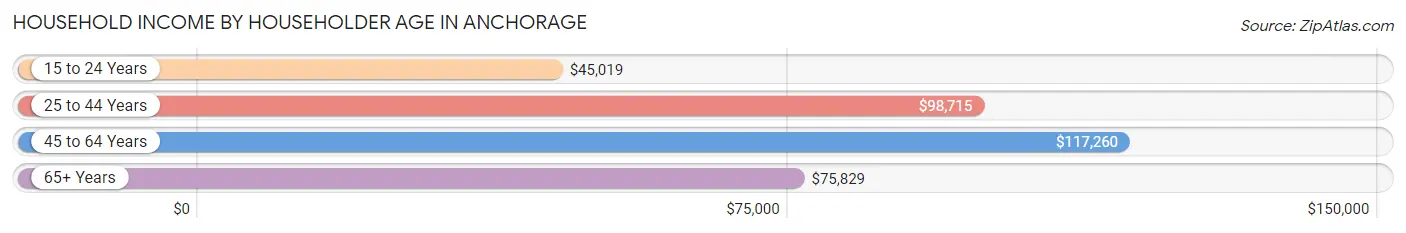
| Income Bracket | # Households | Median Income |
| 15 to 24 Years | 5,687 (5.3%) | $45,019 |
| 25 to 44 Years | 42,186 (39.4%) | $98,715 |
| 45 to 64 Years | 38,126 (35.6%) | $117,260 |
| 65+ Years | 21,135 (19.7%) | $75,829 |
| Total | 107,134 (100.0%) | $95,731 |
Poverty in Anchorage
Income Below Poverty by Sex and Age in Anchorage
With 8.7% poverty level for males and 10.6% for females among the residents of Anchorage, under 5 year old males and 18 to 24 year old females are the most vulnerable to poverty, with 1,551 males (15.8%) and 2,337 females (19.4%) in their respective age groups living below the poverty level.
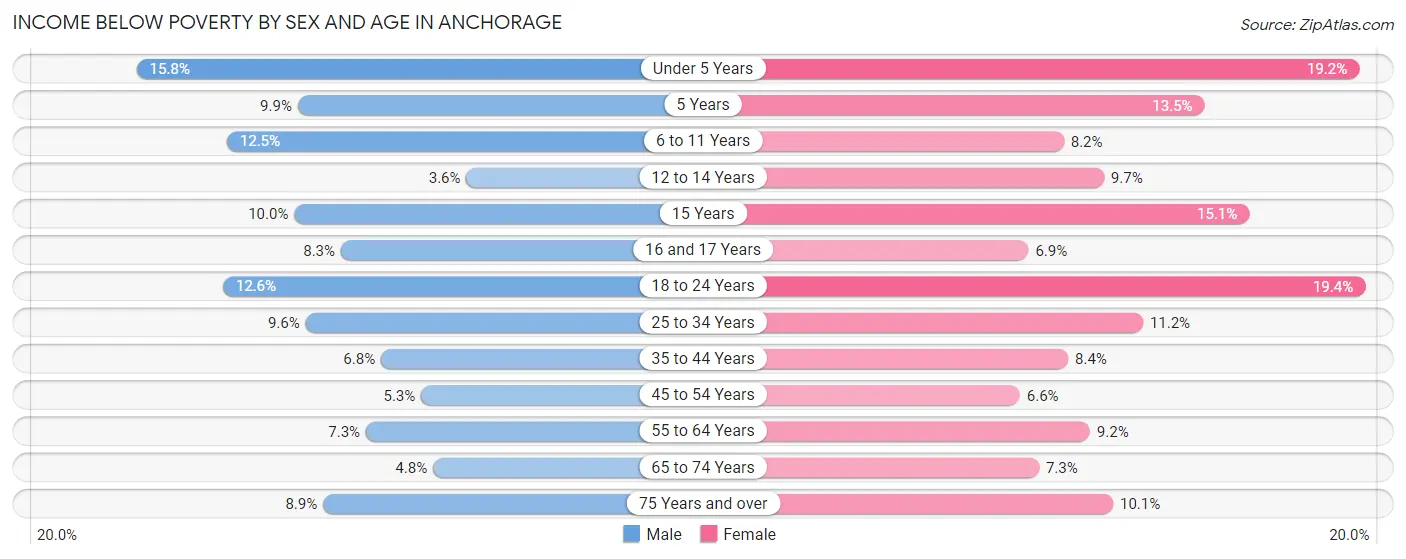
| Age Bracket | Male | Female |
| Under 5 Years | 1,551 (15.8%) | 1,824 (19.2%) |
| 5 Years | 166 (9.9%) | 308 (13.5%) |
| 6 to 11 Years | 1,510 (12.5%) | 963 (8.2%) |
| 12 to 14 Years | 211 (3.6%) | 444 (9.7%) |
| 15 Years | 204 (10.0%) | 301 (15.1%) |
| 16 and 17 Years | 292 (8.3%) | 240 (6.9%) |
| 18 to 24 Years | 1,815 (12.6%) | 2,337 (19.4%) |
| 25 to 34 Years | 2,362 (9.6%) | 2,593 (11.2%) |
| 35 to 44 Years | 1,364 (6.8%) | 1,648 (8.4%) |
| 45 to 54 Years | 920 (5.3%) | 1,091 (6.6%) |
| 55 to 64 Years | 1,265 (7.3%) | 1,556 (9.2%) |
| 65 to 74 Years | 540 (4.8%) | 833 (7.3%) |
| 75 Years and over | 447 (8.9%) | 630 (10.1%) |
| Total | 12,647 (8.7%) | 14,768 (10.6%) |
Income Above Poverty by Sex and Age in Anchorage
According to the poverty statistics in Anchorage, males aged 12 to 14 years and females aged 45 to 54 years are the age groups that are most secure financially, with 96.4% of males and 93.4% of females in these age groups living above the poverty line.
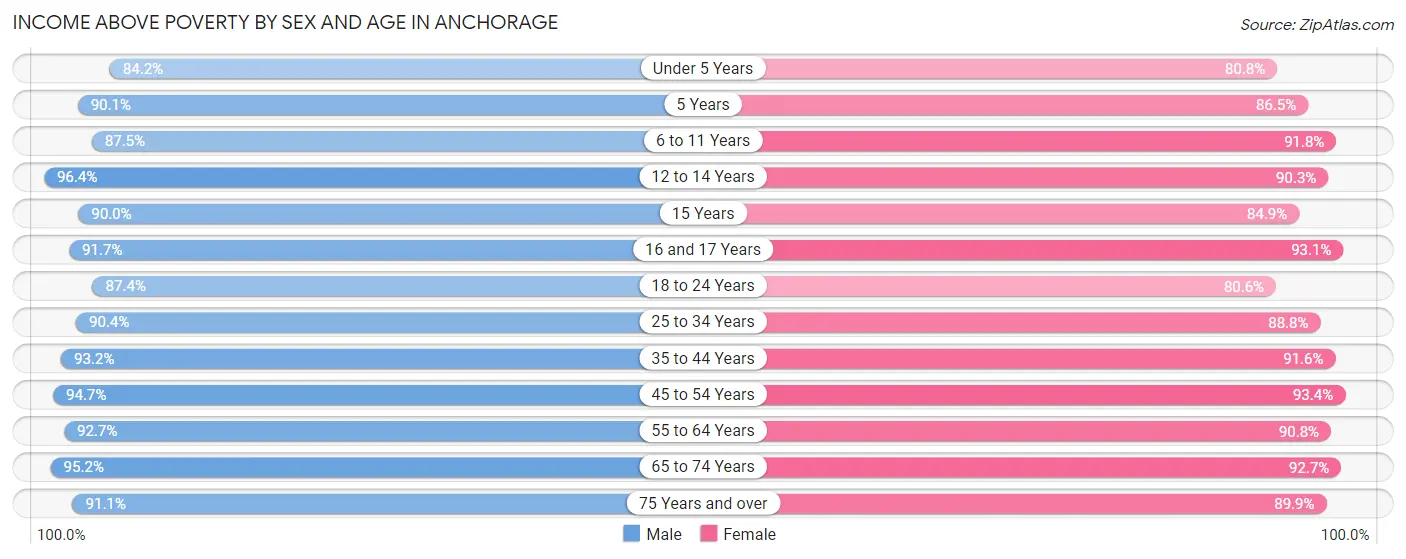
| Age Bracket | Male | Female |
| Under 5 Years | 8,241 (84.2%) | 7,674 (80.8%) |
| 5 Years | 1,518 (90.1%) | 1,981 (86.5%) |
| 6 to 11 Years | 10,576 (87.5%) | 10,729 (91.8%) |
| 12 to 14 Years | 5,653 (96.4%) | 4,121 (90.3%) |
| 15 Years | 1,838 (90.0%) | 1,690 (84.9%) |
| 16 and 17 Years | 3,243 (91.7%) | 3,221 (93.1%) |
| 18 to 24 Years | 12,547 (87.4%) | 9,700 (80.6%) |
| 25 to 34 Years | 22,310 (90.4%) | 20,596 (88.8%) |
| 35 to 44 Years | 18,771 (93.2%) | 17,969 (91.6%) |
| 45 to 54 Years | 16,491 (94.7%) | 15,424 (93.4%) |
| 55 to 64 Years | 15,988 (92.7%) | 15,333 (90.8%) |
| 65 to 74 Years | 10,619 (95.2%) | 10,547 (92.7%) |
| 75 Years and over | 4,563 (91.1%) | 5,628 (89.9%) |
| Total | 132,358 (91.3%) | 124,613 (89.4%) |
Income Below Poverty Among Married-Couple Families in Anchorage
The poverty statistics for married-couple families in Anchorage show that 3.2% or 1,641 of the total 51,020 families live below the poverty line. Families with 5 or more children have the highest poverty rate of 8.1%, comprising of 50 families. On the other hand, families with no children have the lowest poverty rate of 2.7%, which includes 754 families.
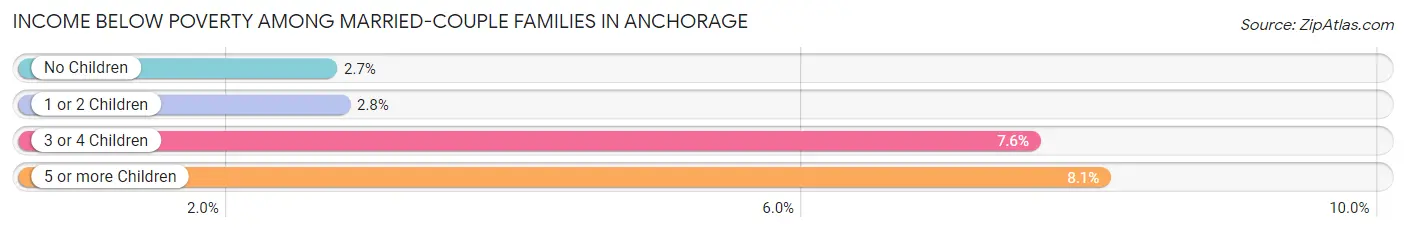
| Children | Above Poverty | Below Poverty |
| No Children | 27,288 (97.3%) | 754 (2.7%) |
| 1 or 2 Children | 17,394 (97.2%) | 498 (2.8%) |
| 3 or 4 Children | 4,128 (92.4%) | 339 (7.6%) |
| 5 or more Children | 569 (91.9%) | 50 (8.1%) |
| Total | 49,379 (96.8%) | 1,641 (3.2%) |
Income Below Poverty Among Single-Parent Households in Anchorage
According to the poverty data in Anchorage, 9.7% or 573 single-father households and 18.5% or 2,081 single-mother households are living below the poverty line. Among single-father households, those with 3 or 4 children have the highest poverty rate, with 81 households (13.0%) experiencing poverty. Likewise, among single-mother households, those with 5 or more children have the highest poverty rate, with 203 households (72.2%) falling below the poverty line.
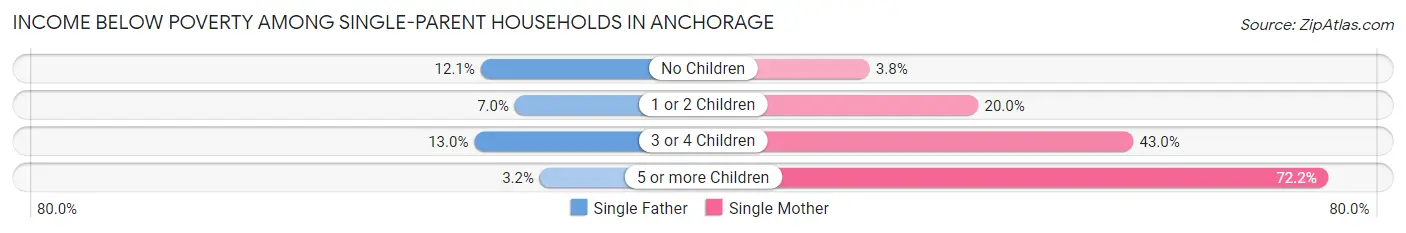
| Children | Single Father | Single Mother |
| No Children | 293 (12.0%) | 139 (3.8%) |
| 1 or 2 Children | 198 (7.0%) | 1,207 (20.0%) |
| 3 or 4 Children | 81 (13.0%) | 532 (43.0%) |
| 5 or more Children | 1 (3.2%) | 203 (72.2%) |
| Total | 573 (9.7%) | 2,081 (18.5%) |
Income Below Poverty Among Married-Couple vs Single-Parent Households in Anchorage
The poverty data for Anchorage shows that 1,641 of the married-couple family households (3.2%) and 2,654 of the single-parent households (15.4%) are living below the poverty level. Within the married-couple family households, those with 5 or more children have the highest poverty rate, with 50 households (8.1%) falling below the poverty line. Among the single-parent households, those with 5 or more children have the highest poverty rate, with 204 household (65.4%) living below poverty.
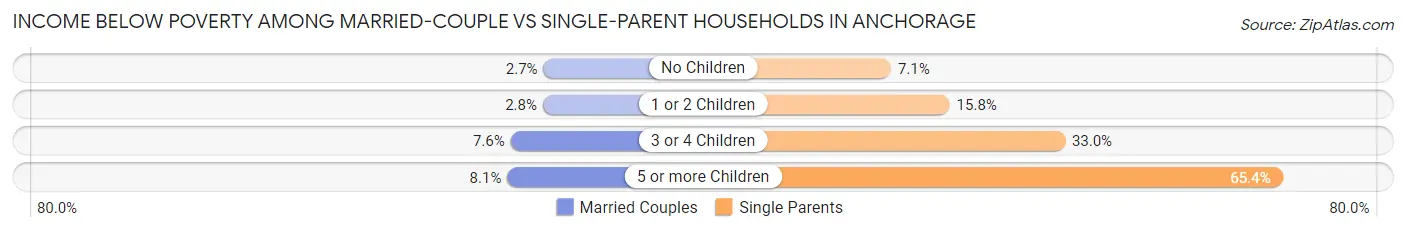
| Children | Married-Couple Families | Single-Parent Households |
| No Children | 754 (2.7%) | 432 (7.0%) |
| 1 or 2 Children | 498 (2.8%) | 1,405 (15.8%) |
| 3 or 4 Children | 339 (7.6%) | 613 (33.0%) |
| 5 or more Children | 50 (8.1%) | 204 (65.4%) |
| Total | 1,641 (3.2%) | 2,654 (15.4%) |
Race in Anchorage
The most populous races in Anchorage are White / Caucasian (172,004 | 59.2%), Two or more Races (36,963 | 12.7%), and Asian (28,440 | 9.8%).
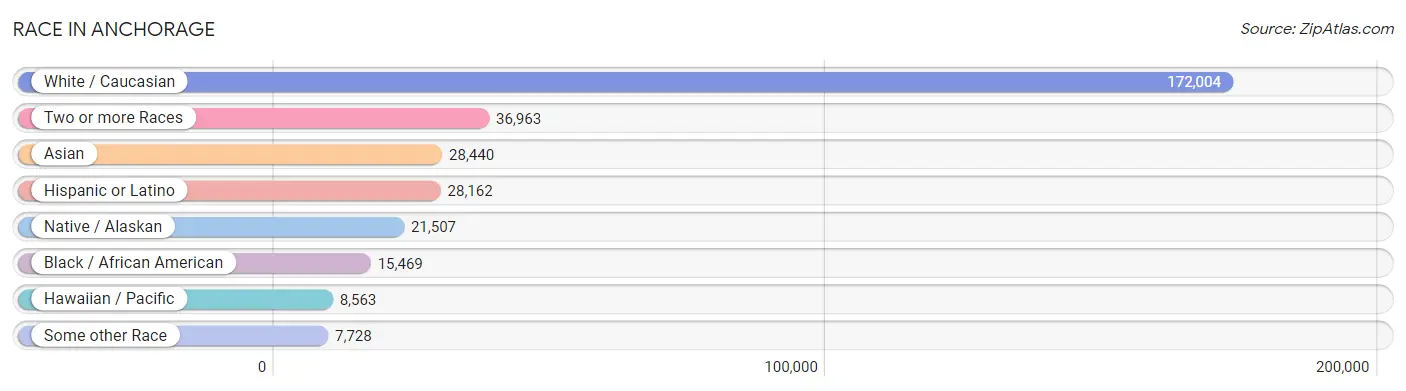
| Race | # Population | % Population |
| Asian | 28,440 | 9.8% |
| Black / African American | 15,469 | 5.3% |
| Hawaiian / Pacific | 8,563 | 2.9% |
| Hispanic or Latino | 28,162 | 9.7% |
| Native / Alaskan | 21,507 | 7.4% |
| White / Caucasian | 172,004 | 59.2% |
| Two or more Races | 36,963 | 12.7% |
| Some other Race | 7,728 | 2.7% |
| Total | 290,674 | 100.0% |
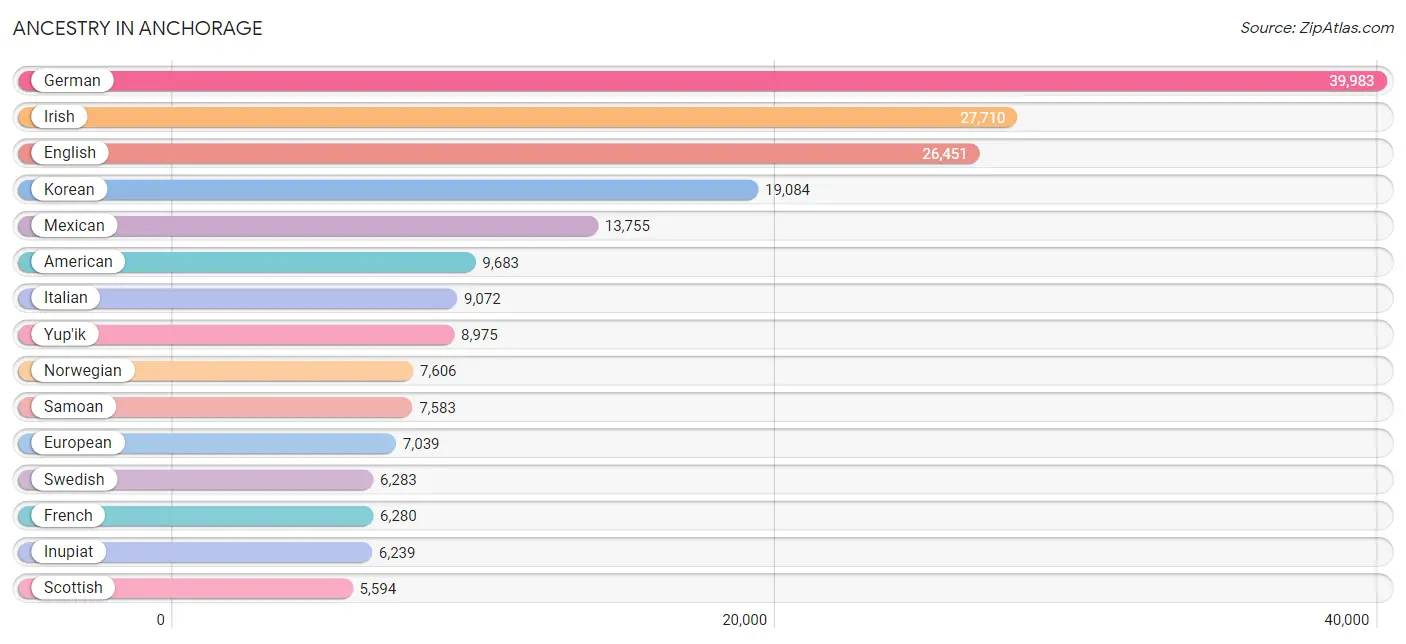
Ancestry in Anchorage
The most populous ancestries reported in Anchorage are German (39,983 | 13.8%), Irish (27,710 | 9.5%), English (26,451 | 9.1%), Korean (19,084 | 6.6%), and Mexican (13,755 | 4.7%), together accounting for 43.7% of all Anchorage residents.
| Ancestry | # Population | % Population |
| Afghan | 23 | 0.0% |
| African | 1,256 | 0.4% |
| Alaska Native | 4,849 | 1.7% |
| Alaskan Athabascan | 4,447 | 1.5% |
| Albanian | 249 | 0.1% |
| Aleut | 5,337 | 1.8% |
| American | 9,683 | 3.3% |
| Apache | 254 | 0.1% |
| Arab | 522 | 0.2% |
| Arapaho | 124 | 0.0% |
| Argentinean | 201 | 0.1% |
| Armenian | 124 | 0.0% |
| Australian | 124 | 0.0% |
| Austrian | 450 | 0.2% |
| Bangladeshi | 5,363 | 1.8% |
| Belgian | 258 | 0.1% |
| Bhutanese | 2,799 | 1.0% |
| Blackfeet | 508 | 0.2% |
| Brazilian | 146 | 0.1% |
| British | 2,665 | 0.9% |
| British West Indian | 7 | 0.0% |
| Bulgarian | 111 | 0.0% |
| Burmese | 4,133 | 1.4% |
| Cajun | 43 | 0.0% |
| Canadian | 789 | 0.3% |
| Carpatho Rusyn | 30 | 0.0% |
| Celtic | 73 | 0.0% |
| Central American | 1,647 | 0.6% |
| Central American Indian | 293 | 0.1% |
| Cherokee | 2,155 | 0.7% |
| Cheyenne | 19 | 0.0% |
| Chickasaw | 193 | 0.1% |
| Chilean | 10 | 0.0% |
| Chinese | 45 | 0.0% |
| Chippewa | 611 | 0.2% |
| Choctaw | 643 | 0.2% |
| Colombian | 1,116 | 0.4% |
| Comanche | 75 | 0.0% |
| Costa Rican | 84 | 0.0% |
| Creek | 236 | 0.1% |
| Croatian | 322 | 0.1% |
| Crow | 51 | 0.0% |
| Cuban | 1,309 | 0.4% |
| Cypriot | 10 | 0.0% |
| Czech | 1,339 | 0.5% |
| Czechoslovakian | 280 | 0.1% |
| Danish | 1,667 | 0.6% |
| Delaware | 9 | 0.0% |
| Dominican | 1,561 | 0.5% |
| Dutch | 3,734 | 1.3% |
| Eastern European | 786 | 0.3% |
| Ecuadorian | 825 | 0.3% |
| Egyptian | 103 | 0.0% |
| English | 26,451 | 9.1% |
| Estonian | 61 | 0.0% |
| Ethiopian | 109 | 0.0% |
| European | 7,039 | 2.4% |
| Filipino | 220 | 0.1% |
| Finnish | 1,597 | 0.5% |
| French | 6,280 | 2.2% |
| French American Indian | 86 | 0.0% |
| French Canadian | 1,348 | 0.5% |
| German | 39,983 | 13.8% |
| German Russian | 78 | 0.0% |
| Greek | 529 | 0.2% |
| Guamanian / Chamorro | 578 | 0.2% |
| Guatemalan | 362 | 0.1% |
| Guyanese | 83 | 0.0% |
| Haitian | 185 | 0.1% |
| Hmong | 10 | 0.0% |
| Honduran | 212 | 0.1% |
| Hopi | 93 | 0.0% |
| Hungarian | 708 | 0.2% |
| Icelander | 171 | 0.1% |
| Indian (Asian) | 2,505 | 0.9% |
| Indonesian | 17 | 0.0% |
| Inupiat | 6,239 | 2.1% |
| Iranian | 273 | 0.1% |
| Irish | 27,710 | 9.5% |
| Iroquois | 106 | 0.0% |
| Israeli | 12 | 0.0% |
| Italian | 9,072 | 3.1% |
| Jamaican | 264 | 0.1% |
| Japanese | 298 | 0.1% |
| Kenyan | 33 | 0.0% |
| Korean | 19,084 | 6.6% |
| Laotian | 178 | 0.1% |
| Latvian | 122 | 0.0% |
| Lebanese | 159 | 0.1% |
| Liberian | 135 | 0.1% |
| Lithuanian | 415 | 0.1% |
| Lumbee | 19 | 0.0% |
| Luxembourger | 12 | 0.0% |
| Macedonian | 208 | 0.1% |
| Malaysian | 901 | 0.3% |
| Marshallese | 37 | 0.0% |
| Menominee | 20 | 0.0% |
| Mexican | 13,755 | 4.7% |
| Mexican American Indian | 277 | 0.1% |
| Mongolian | 73 | 0.0% |
| Moroccan | 37 | 0.0% |
| Native Hawaiian | 2,136 | 0.7% |
| Navajo | 210 | 0.1% |
| Nepalese | 45 | 0.0% |
| New Zealander | 87 | 0.0% |
| Nicaraguan | 41 | 0.0% |
| Nigerian | 239 | 0.1% |
| Northern European | 978 | 0.3% |
| Norwegian | 7,606 | 2.6% |
| Okinawan | 13 | 0.0% |
| Osage | 87 | 0.0% |
| Pakistani | 1,086 | 0.4% |
| Palestinian | 9 | 0.0% |
| Panamanian | 448 | 0.2% |
| Paraguayan | 37 | 0.0% |
| Pennsylvania German | 23 | 0.0% |
| Peruvian | 363 | 0.1% |
| Polish | 5,164 | 1.8% |
| Portuguese | 661 | 0.2% |
| Potawatomi | 90 | 0.0% |
| Pueblo | 70 | 0.0% |
| Puerto Rican | 4,739 | 1.6% |
| Puget Sound Salish | 301 | 0.1% |
| Romanian | 229 | 0.1% |
| Russian | 3,182 | 1.1% |
| Salvadoran | 500 | 0.2% |
| Samoan | 7,583 | 2.6% |
| Scandinavian | 2,341 | 0.8% |
| Scotch-Irish | 3,051 | 1.1% |
| Scottish | 5,594 | 1.9% |
| Seminole | 31 | 0.0% |
| Serbian | 404 | 0.1% |
| Shoshone | 86 | 0.0% |
| Sierra Leonean | 45 | 0.0% |
| Sioux | 377 | 0.1% |
| Slavic | 283 | 0.1% |
| Slovak | 289 | 0.1% |
| Slovene | 92 | 0.0% |
| Somali | 214 | 0.1% |
| South African | 39 | 0.0% |
| South American | 2,686 | 0.9% |
| South American Indian | 76 | 0.0% |
| Spaniard | 1,092 | 0.4% |
| Spanish | 773 | 0.3% |
| Sri Lankan | 869 | 0.3% |
| Subsaharan African | 3,476 | 1.2% |
| Sudanese | 1,004 | 0.4% |
| Swedish | 6,283 | 2.2% |
| Swiss | 1,217 | 0.4% |
| Syrian | 36 | 0.0% |
| Thai | 1,117 | 0.4% |
| Tlingit-Haida | 1,785 | 0.6% |
| Tohono O'Odham | 75 | 0.0% |
| Tongan | 1,253 | 0.4% |
| Trinidadian and Tobagonian | 24 | 0.0% |
| Tsimshian | 332 | 0.1% |
| Turkish | 54 | 0.0% |
| Ukrainian | 1,002 | 0.3% |
| Venezuelan | 134 | 0.1% |
| Welsh | 2,009 | 0.7% |
| Yakama | 73 | 0.0% |
| Yaqui | 45 | 0.0% |
| Yugoslavian | 104 | 0.0% |
| Yuman | 69 | 0.0% |
| Yup'ik | 8,975 | 3.1% |
| Zimbabwean | 57 | 0.0% | View All 166 Rows |
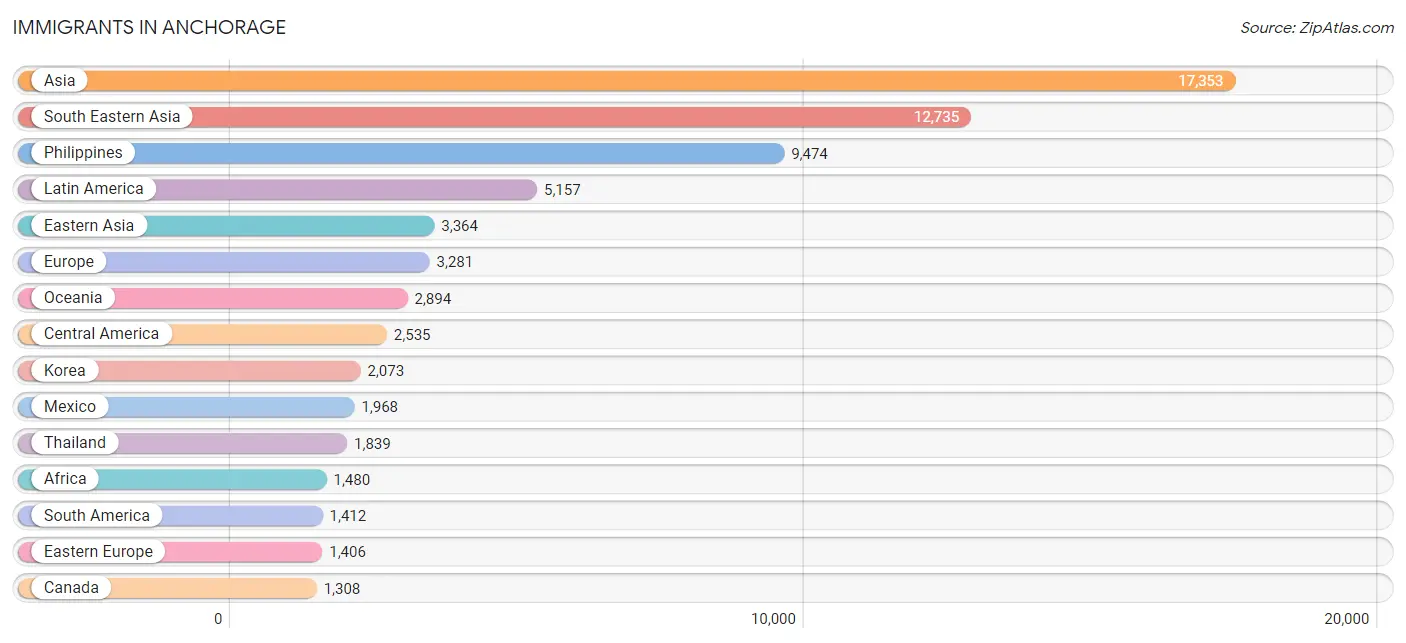
Immigrants in Anchorage
The most numerous immigrant groups reported in Anchorage came from Asia (17,353 | 6.0%), South Eastern Asia (12,735 | 4.4%), Philippines (9,474 | 3.3%), Latin America (5,157 | 1.8%), and Eastern Asia (3,364 | 1.2%), together accounting for 16.5% of all Anchorage residents.
| Immigration Origin | # Population | % Population |
| Africa | 1,480 | 0.5% |
| Argentina | 87 | 0.0% |
| Asia | 17,353 | 6.0% |
| Australia | 61 | 0.0% |
| Austria | 7 | 0.0% |
| Barbados | 6 | 0.0% |
| Belarus | 17 | 0.0% |
| Belize | 21 | 0.0% |
| Bosnia and Herzegovina | 40 | 0.0% |
| Brazil | 319 | 0.1% |
| Bulgaria | 61 | 0.0% |
| Cameroon | 56 | 0.0% |
| Canada | 1,308 | 0.4% |
| Caribbean | 1,210 | 0.4% |
| Central America | 2,535 | 0.9% |
| China | 895 | 0.3% |
| Colombia | 453 | 0.2% |
| Cuba | 214 | 0.1% |
| Czechoslovakia | 128 | 0.0% |
| Denmark | 2 | 0.0% |
| Dominica | 97 | 0.0% |
| Dominican Republic | 665 | 0.2% |
| Eastern Africa | 340 | 0.1% |
| Eastern Asia | 3,364 | 1.2% |
| Eastern Europe | 1,406 | 0.5% |
| Ecuador | 143 | 0.1% |
| Egypt | 25 | 0.0% |
| El Salvador | 197 | 0.1% |
| England | 191 | 0.1% |
| Ethiopia | 95 | 0.0% |
| Europe | 3,281 | 1.1% |
| Fiji | 195 | 0.1% |
| France | 74 | 0.0% |
| Germany | 532 | 0.2% |
| Ghana | 75 | 0.0% |
| Grenada | 35 | 0.0% |
| Guatemala | 164 | 0.1% |
| Haiti | 102 | 0.0% |
| Honduras | 54 | 0.0% |
| Hong Kong | 160 | 0.1% |
| Hungary | 15 | 0.0% |
| India | 357 | 0.1% |
| Indonesia | 65 | 0.0% |
| Iran | 225 | 0.1% |
| Ireland | 144 | 0.1% |
| Italy | 151 | 0.1% |
| Jamaica | 53 | 0.0% |
| Japan | 396 | 0.1% |
| Kazakhstan | 6 | 0.0% |
| Kenya | 53 | 0.0% |
| Korea | 2,073 | 0.7% |
| Laos | 948 | 0.3% |
| Latin America | 5,157 | 1.8% |
| Lebanon | 1 | 0.0% |
| Liberia | 90 | 0.0% |
| Lithuania | 125 | 0.0% |
| Malaysia | 95 | 0.0% |
| Mexico | 1,968 | 0.7% |
| Micronesia | 62 | 0.0% |
| Middle Africa | 168 | 0.1% |
| Moldova | 30 | 0.0% |
| Nepal | 258 | 0.1% |
| Netherlands | 26 | 0.0% |
| Nicaragua | 32 | 0.0% |
| Nigeria | 230 | 0.1% |
| North Macedonia | 96 | 0.0% |
| Northern Africa | 322 | 0.1% |
| Northern Europe | 945 | 0.3% |
| Norway | 98 | 0.0% |
| Oceania | 2,894 | 1.0% |
| Pakistan | 118 | 0.0% |
| Panama | 99 | 0.0% |
| Peru | 318 | 0.1% |
| Philippines | 9,474 | 3.3% |
| Poland | 106 | 0.0% |
| Romania | 45 | 0.0% |
| Russia | 401 | 0.1% |
| Scotland | 92 | 0.0% |
| Serbia | 56 | 0.0% |
| Somalia | 44 | 0.0% |
| South Africa | 95 | 0.0% |
| South America | 1,412 | 0.5% |
| South Central Asia | 1,027 | 0.4% |
| South Eastern Asia | 12,735 | 4.4% |
| Southern Europe | 208 | 0.1% |
| Spain | 57 | 0.0% |
| Sri Lanka | 26 | 0.0% |
| Sudan | 239 | 0.1% |
| Sweden | 99 | 0.0% |
| Switzerland | 73 | 0.0% |
| Syria | 45 | 0.0% |
| Taiwan | 171 | 0.1% |
| Thailand | 1,839 | 0.6% |
| Trinidad and Tobago | 38 | 0.0% |
| Turkey | 129 | 0.0% |
| Uganda | 16 | 0.0% |
| Ukraine | 188 | 0.1% |
| Uzbekistan | 10 | 0.0% |
| Venezuela | 71 | 0.0% |
| Vietnam | 288 | 0.1% |
| Western Africa | 484 | 0.2% |
| Western Asia | 227 | 0.1% |
| Western Europe | 712 | 0.2% |
| Zimbabwe | 57 | 0.0% | View All 104 Rows |
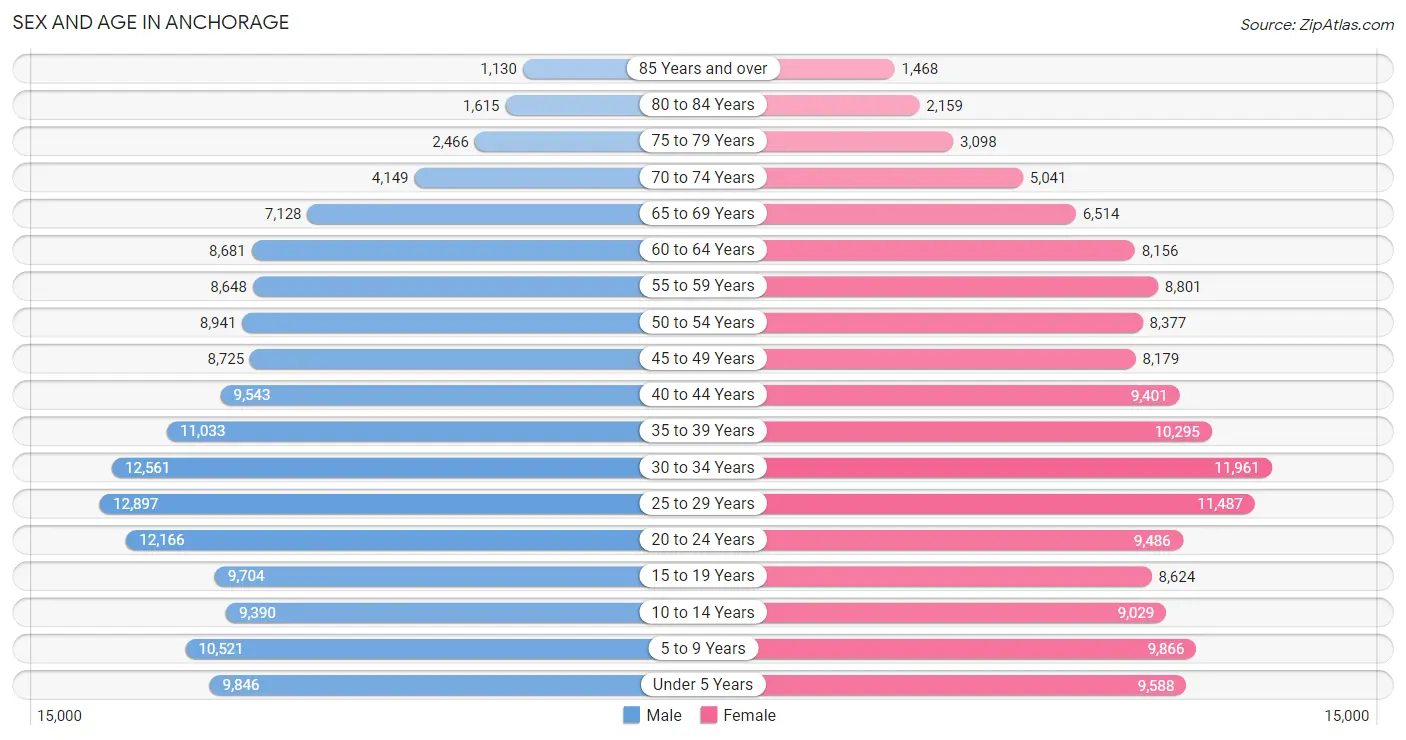
Sex and Age in Anchorage
Sex and Age in Anchorage
The most populous age groups in Anchorage are 25 to 29 Years (12,897 | 8.6%) for men and 30 to 34 Years (11,961 | 8.5%) for women.
| Age Bracket | Male | Female |
| Under 5 Years | 9,846 (6.6%) | 9,588 (6.8%) |
| 5 to 9 Years | 10,521 (7.0%) | 9,866 (7.0%) |
| 10 to 14 Years | 9,390 (6.3%) | 9,029 (6.4%) |
| 15 to 19 Years | 9,704 (6.5%) | 8,624 (6.1%) |
| 20 to 24 Years | 12,166 (8.2%) | 9,486 (6.7%) |
| 25 to 29 Years | 12,897 (8.6%) | 11,487 (8.1%) |
| 30 to 34 Years | 12,561 (8.4%) | 11,961 (8.5%) |
| 35 to 39 Years | 11,033 (7.4%) | 10,295 (7.3%) |
| 40 to 44 Years | 9,543 (6.4%) | 9,401 (6.6%) |
| 45 to 49 Years | 8,725 (5.9%) | 8,179 (5.8%) |
| 50 to 54 Years | 8,941 (6.0%) | 8,377 (5.9%) |
| 55 to 59 Years | 8,648 (5.8%) | 8,801 (6.2%) |
| 60 to 64 Years | 8,681 (5.8%) | 8,156 (5.8%) |
| 65 to 69 Years | 7,128 (4.8%) | 6,514 (4.6%) |
| 70 to 74 Years | 4,149 (2.8%) | 5,041 (3.6%) |
| 75 to 79 Years | 2,466 (1.7%) | 3,098 (2.2%) |
| 80 to 84 Years | 1,615 (1.1%) | 2,159 (1.5%) |
| 85 Years and over | 1,130 (0.8%) | 1,468 (1.0%) |
| Total | 149,144 (100.0%) | 141,530 (100.0%) |
Families and Households in Anchorage
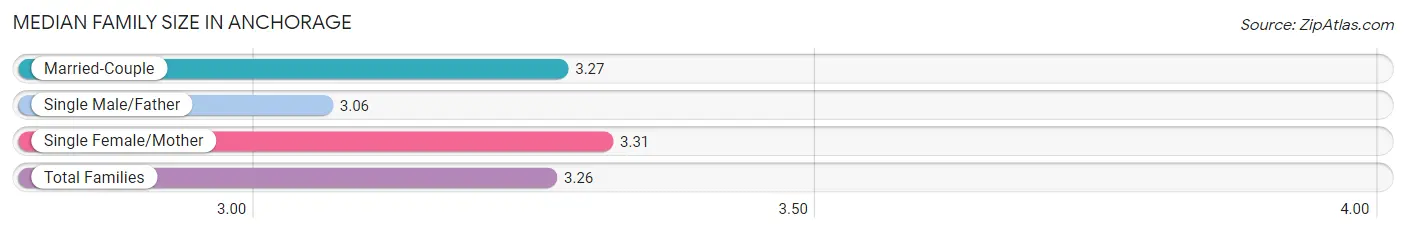
Median Family Size in Anchorage
The median family size in Anchorage is 3.26 persons per family, with single female/mother families (11,260 | 16.5%) accounting for the largest median family size of 3.31 persons per family. On the other hand, single male/father families (5,933 | 8.7%) represent the smallest median family size with 3.06 persons per family.
| Family Type | # Families | Family Size |
| Married-Couple | 51,020 (74.8%) | 3.27 |
| Single Male/Father | 5,933 (8.7%) | 3.06 |
| Single Female/Mother | 11,260 (16.5%) | 3.31 |
| Total Families | 68,213 (100.0%) | 3.26 |
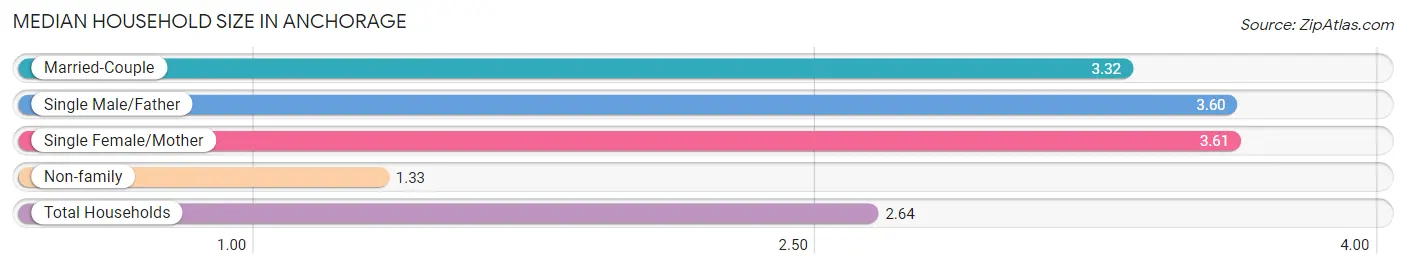
Median Household Size in Anchorage
The median household size in Anchorage is 2.64 persons per household, with single female/mother households (11,260 | 10.5%) accounting for the largest median household size of 3.61 persons per household. non-family households (38,921 | 36.3%) represent the smallest median household size with 1.33 persons per household.
| Household Type | # Households | Household Size |
| Married-Couple | 51,020 (47.6%) | 3.32 |
| Single Male/Father | 5,933 (5.5%) | 3.60 |
| Single Female/Mother | 11,260 (10.5%) | 3.61 |
| Non-family | 38,921 (36.3%) | 1.33 |
| Total Households | 107,134 (100.0%) | 2.64 |
Household Size by Marriage Status in Anchorage
Out of a total of 107,134 households in Anchorage, 68,213 (63.7%) are family households, while 38,921 (36.3%) are nonfamily households. The most numerous type of family households are 2-person households, comprising 28,013, and the most common type of nonfamily households are 1-person households, comprising 29,837.
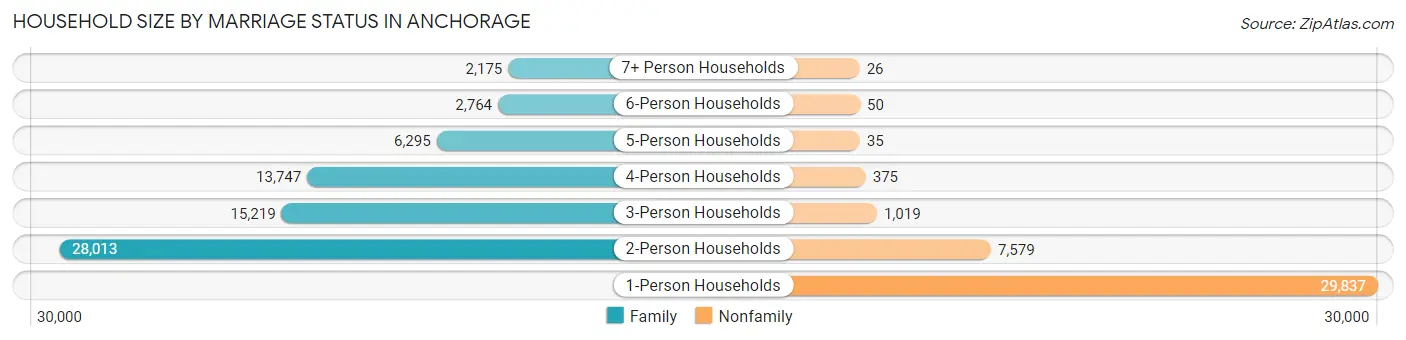
| Household Size | Family Households | Nonfamily Households |
| 1-Person Households | - | 29,837 (27.9%) |
| 2-Person Households | 28,013 (26.2%) | 7,579 (7.1%) |
| 3-Person Households | 15,219 (14.2%) | 1,019 (0.9%) |
| 4-Person Households | 13,747 (12.8%) | 375 (0.4%) |
| 5-Person Households | 6,295 (5.9%) | 35 (0.0%) |
| 6-Person Households | 2,764 (2.6%) | 50 (0.1%) |
| 7+ Person Households | 2,175 (2.0%) | 26 (0.0%) |
| Total | 68,213 (63.7%) | 38,921 (36.3%) |
Female Fertility in Anchorage
Fertility by Age in Anchorage
Average fertility rate in Anchorage is 61.0 births per 1,000 women. Women in the age bracket of 20 to 34 years have the highest fertility rate with 84.0 births per 1,000 women. Women in the age bracket of 20 to 34 years acount for 63.4% of all women with births.
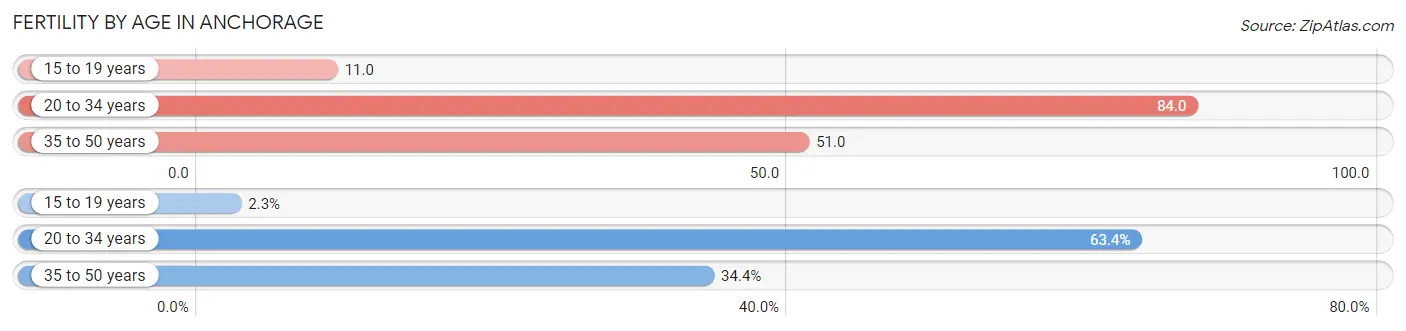
| Age Bracket | Women with Births | Births / 1,000 Women |
| 15 to 19 years | 99 (2.3%) | 11.0 |
| 20 to 34 years | 2,775 (63.4%) | 84.0 |
| 35 to 50 years | 1,504 (34.4%) | 51.0 |
| Total | 4,378 (100.0%) | 61.0 |
Fertility by Age by Marriage Status in Anchorage
66.9% of women with births (4,378) in Anchorage are married. The highest percentage of unmarried women with births falls into 15 to 19 years age bracket with 82.8% of them unmarried at the time of birth, while the lowest percentage of unmarried women with births belong to 35 to 50 years age bracket with 30.2% of them unmarried.
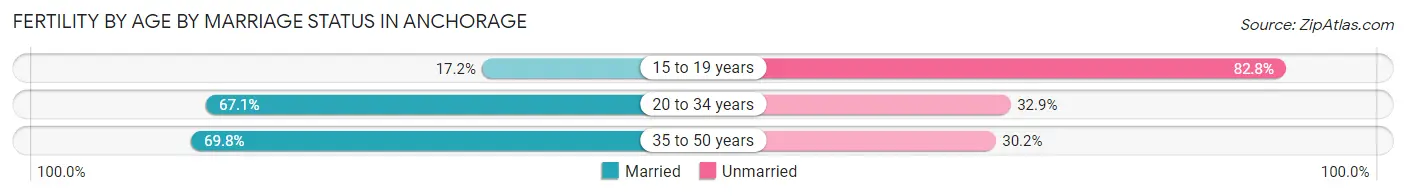
| Age Bracket | Married | Unmarried |
| 15 to 19 years | 17 (17.2%) | 82 (82.8%) |
| 20 to 34 years | 1,862 (67.1%) | 913 (32.9%) |
| 35 to 50 years | 1,050 (69.8%) | 454 (30.2%) |
| Total | 2,929 (66.9%) | 1,449 (33.1%) |
Fertility by Education in Anchorage
Average fertility rate in Anchorage is 61.0 births per 1,000 women. Women with the education attainment of graduate degree have the highest fertility rate of 82.0 births per 1,000 women, while women with the education attainment of less than high school have the lowest fertility at 43.0 births per 1,000 women. Women with the education attainment of college or associate's degree represent 25.9% of all women with births.
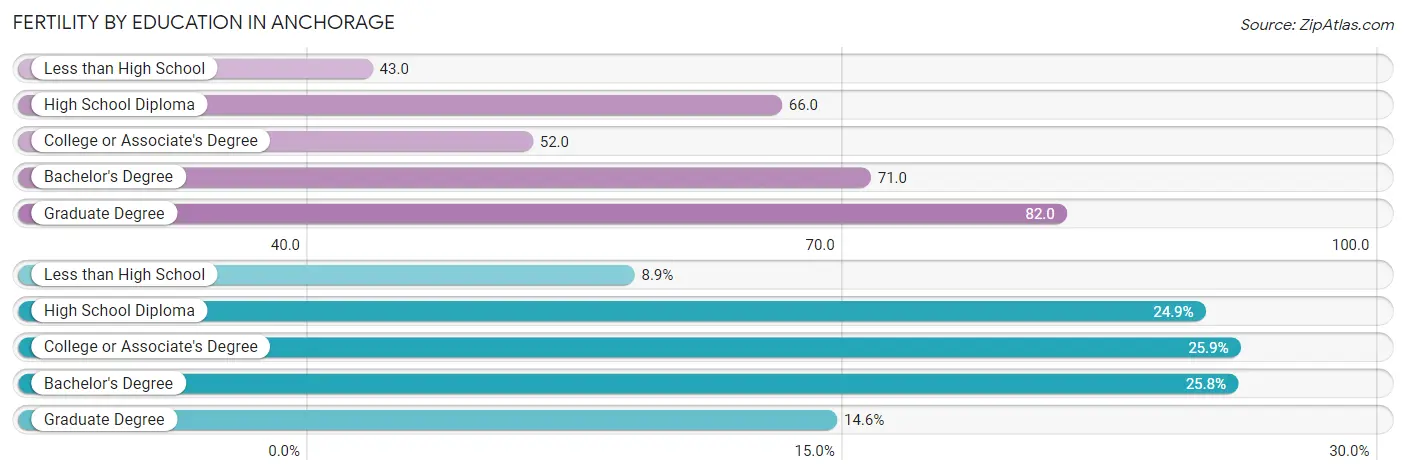
| Educational Attainment | Women with Births | Births / 1,000 Women |
| Less than High School | 388 (8.9%) | 43.0 |
| High School Diploma | 1,090 (24.9%) | 66.0 |
| College or Associate's Degree | 1,133 (25.9%) | 52.0 |
| Bachelor's Degree | 1,130 (25.8%) | 71.0 |
| Graduate Degree | 637 (14.5%) | 82.0 |
| Total | 4,378 (100.0%) | 61.0 |
Fertility by Education by Marriage Status in Anchorage
33.1% of women with births in Anchorage are unmarried. Women with the educational attainment of graduate degree are most likely to be married with 94.7% of them married at childbirth, while women with the educational attainment of less than high school are least likely to be married with 59.3% of them unmarried at childbirth.
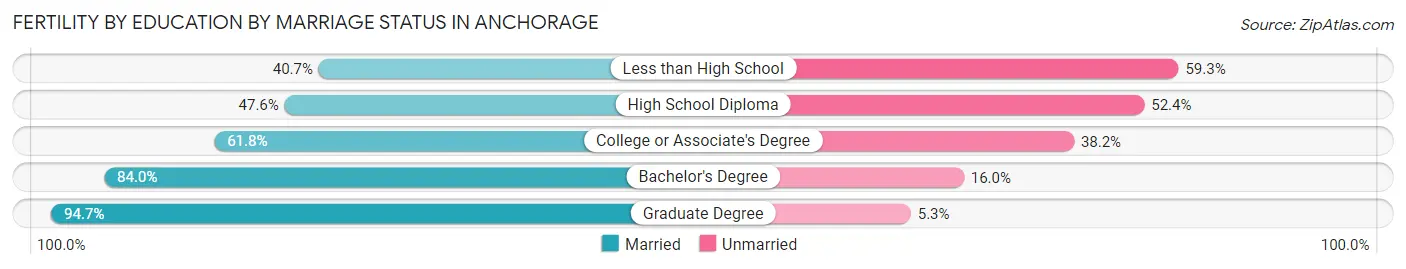
| Educational Attainment | Married | Unmarried |
| Less than High School | 158 (40.7%) | 230 (59.3%) |
| High School Diploma | 519 (47.6%) | 571 (52.4%) |
| College or Associate's Degree | 700 (61.8%) | 433 (38.2%) |
| Bachelor's Degree | 949 (84.0%) | 181 (16.0%) |
| Graduate Degree | 603 (94.7%) | 34 (5.3%) |
| Total | 2,929 (66.9%) | 1,449 (33.1%) |
Employment Characteristics in Anchorage
Employment by Class of Employer in Anchorage
Among the 148,597 employed individuals in Anchorage, private company employees (81,905 | 55.1%), federal government employees (18,944 | 12.8%), and not-for-profit organizations (14,505 | 9.8%) make up the most common classes of employment.
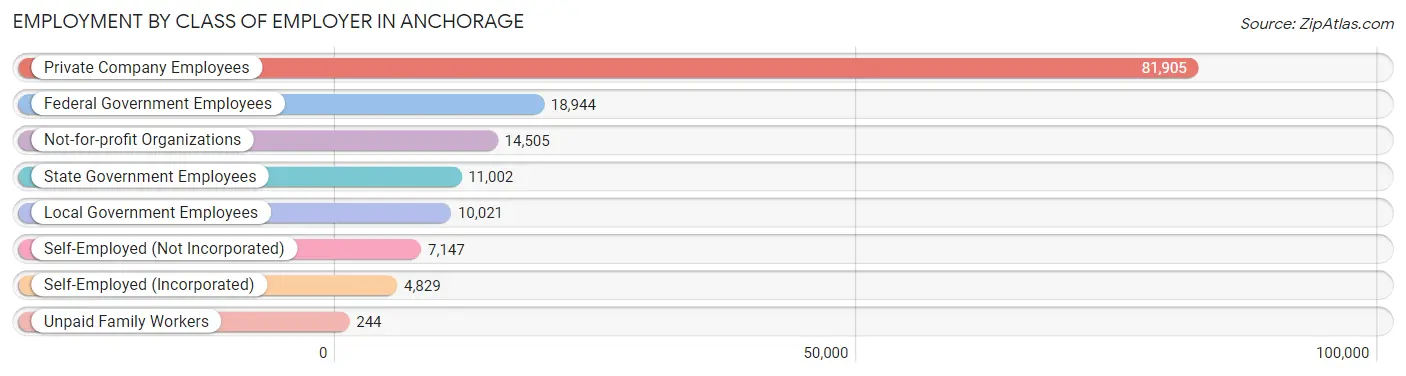
| Employer Class | # Employees | % Employees |
| Private Company Employees | 81,905 | 55.1% |
| Self-Employed (Incorporated) | 4,829 | 3.3% |
| Self-Employed (Not Incorporated) | 7,147 | 4.8% |
| Not-for-profit Organizations | 14,505 | 9.8% |
| Local Government Employees | 10,021 | 6.7% |
| State Government Employees | 11,002 | 7.4% |
| Federal Government Employees | 18,944 | 12.8% |
| Unpaid Family Workers | 244 | 0.2% |
| Total | 148,597 | 100.0% |
Employment Status by Age in Anchorage
According to the labor force statistics for Anchorage, out of the total population over 16 years of age (228,369), 69.9% or 159,630 individuals are in the labor force, with 5.2% or 8,301 of them unemployed. The age group with the highest labor force participation rate is 35 to 44 years, with 86.3% or 34,755 individuals in the labor force. Within the labor force, the 16 to 19 years age range has the highest percentage of unemployed individuals, with 15.0% or 999 of them being unemployed.
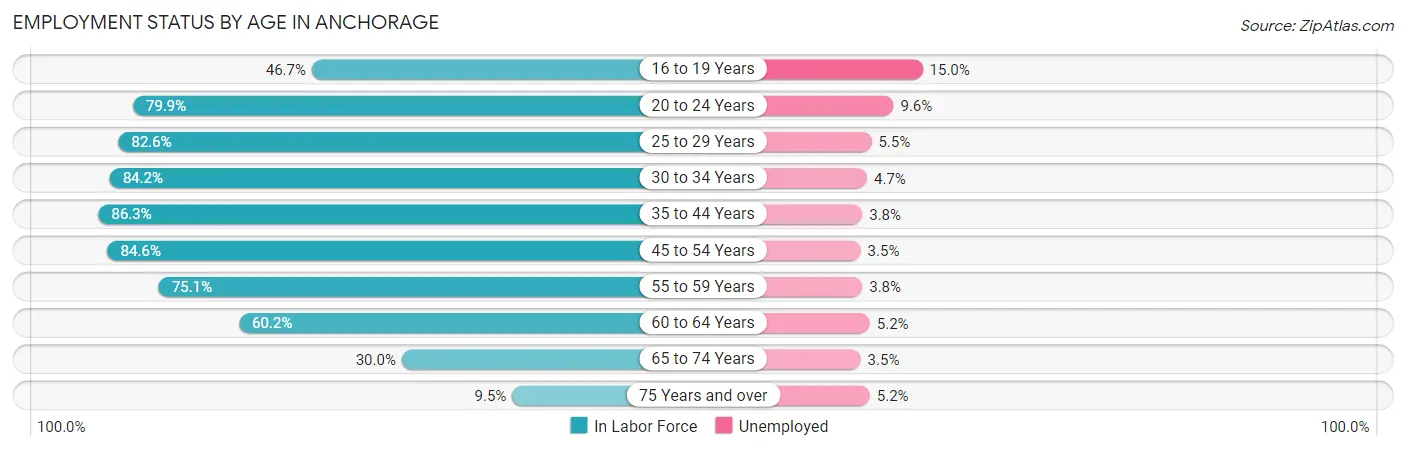
| Age Bracket | In Labor Force | Unemployed |
| 16 to 19 Years | 6,661 (46.7%) | 999 (15.0%) |
| 20 to 24 Years | 17,300 (79.9%) | 1,661 (9.6%) |
| 25 to 29 Years | 20,141 (82.6%) | 1,108 (5.5%) |
| 30 to 34 Years | 20,648 (84.2%) | 970 (4.7%) |
| 35 to 44 Years | 34,755 (86.3%) | 1,321 (3.8%) |
| 45 to 54 Years | 28,952 (84.6%) | 1,013 (3.5%) |
| 55 to 59 Years | 13,104 (75.1%) | 498 (3.8%) |
| 60 to 64 Years | 10,136 (60.2%) | 527 (5.2%) |
| 65 to 74 Years | 6,850 (30.0%) | 240 (3.5%) |
| 75 Years and over | 1,134 (9.5%) | 59 (5.2%) |
| Total | 159,630 (69.9%) | 8,301 (5.2%) |
Employment Status by Educational Attainment in Anchorage
According to labor force statistics for Anchorage, 81.0% of individuals (127,726) out of the total population between 25 and 64 years of age (157,686) are in the labor force, with 4.2% or 5,364 of them being unemployed. The group with the highest labor force participation rate are those with the educational attainment of bachelor's degree or higher, with 87.0% or 50,479 individuals in the labor force. Within the labor force, individuals with high school diploma education have the highest percentage of unemployment, with 6.8% or 1,939 of them being unemployed.
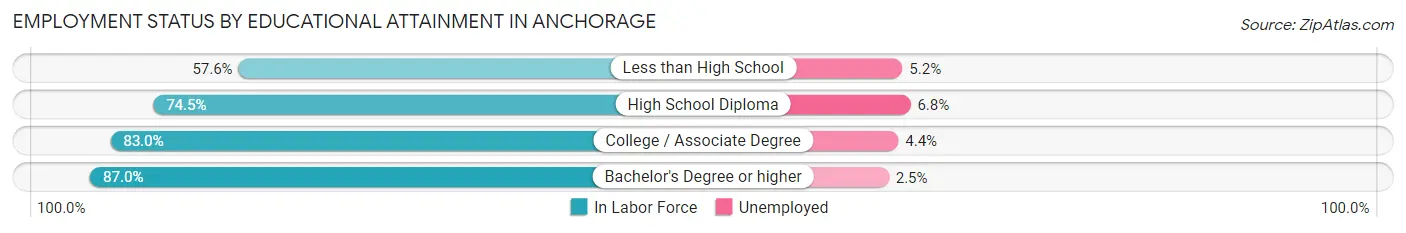
| Educational Attainment | In Labor Force | Unemployed |
| Less than High School | 5,073 (57.6%) | 458 (5.2%) |
| High School Diploma | 28,511 (74.5%) | 2,602 (6.8%) |
| College / Associate Degree | 43,646 (83.0%) | 2,314 (4.4%) |
| Bachelor's Degree or higher | 50,479 (87.0%) | 1,451 (2.5%) |
| Total | 127,726 (81.0%) | 6,623 (4.2%) |
Employment Occupations by Sex in Anchorage
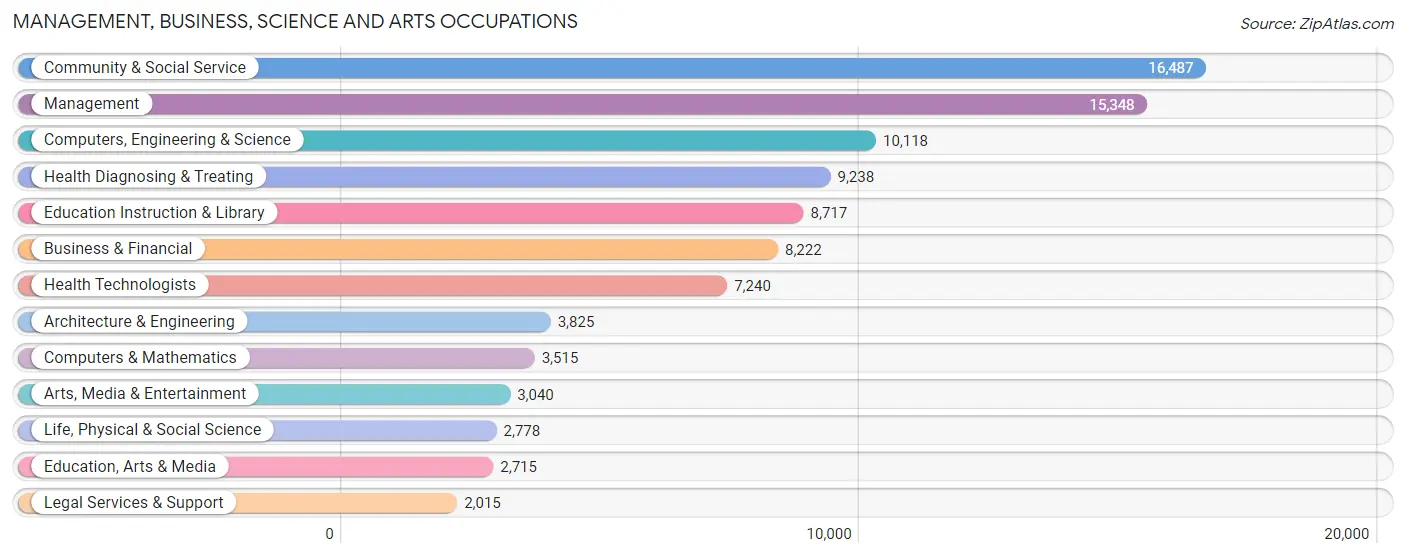
Management, Business, Science and Arts Occupations
The most common Management, Business, Science and Arts occupations in Anchorage are Community & Social Service (16,487 | 11.6%), Management (15,348 | 10.8%), Computers, Engineering & Science (10,118 | 7.1%), Health Diagnosing & Treating (9,238 | 6.5%), and Education Instruction & Library (8,717 | 6.1%).
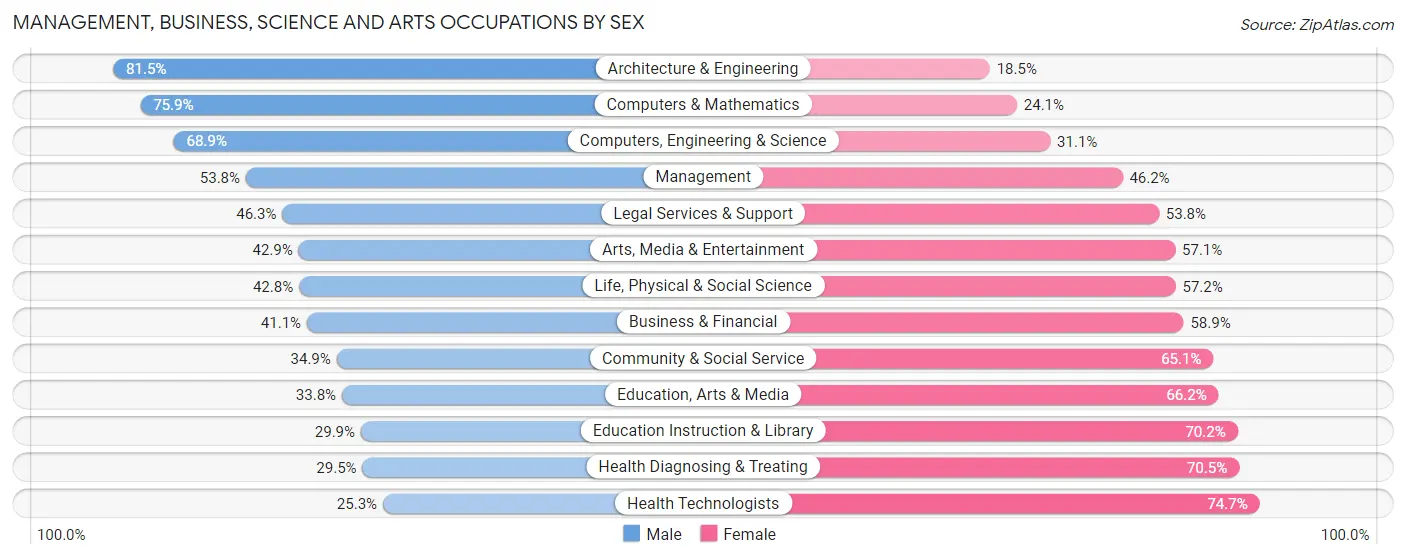
Management, Business, Science and Arts Occupations by Sex
Within the Management, Business, Science and Arts occupations in Anchorage, the most male-oriented occupations are Architecture & Engineering (81.5%), Computers & Mathematics (75.9%), and Computers, Engineering & Science (68.9%), while the most female-oriented occupations are Health Technologists (74.7%), Health Diagnosing & Treating (70.5%), and Education Instruction & Library (70.2%).
| Occupation | Male | Female |
| Management | 8,263 (53.8%) | 7,085 (46.2%) |
| Business & Financial | 3,380 (41.1%) | 4,842 (58.9%) |
| Computers, Engineering & Science | 6,973 (68.9%) | 3,145 (31.1%) |
| Computers & Mathematics | 2,667 (75.9%) | 848 (24.1%) |
| Architecture & Engineering | 3,118 (81.5%) | 707 (18.5%) |
| Life, Physical & Social Science | 1,188 (42.8%) | 1,590 (57.2%) |
| Community & Social Service | 5,755 (34.9%) | 10,732 (65.1%) |
| Education, Arts & Media | 918 (33.8%) | 1,797 (66.2%) |
| Legal Services & Support | 932 (46.3%) | 1,083 (53.7%) |
| Education Instruction & Library | 2,602 (29.8%) | 6,115 (70.2%) |
| Arts, Media & Entertainment | 1,303 (42.9%) | 1,737 (57.1%) |
| Health Diagnosing & Treating | 2,728 (29.5%) | 6,510 (70.5%) |
| Health Technologists | 1,829 (25.3%) | 5,411 (74.7%) |
| Total (Category) | 27,099 (45.6%) | 32,314 (54.4%) |
| Total (Overall) | 74,314 (52.2%) | 68,021 (47.8%) |
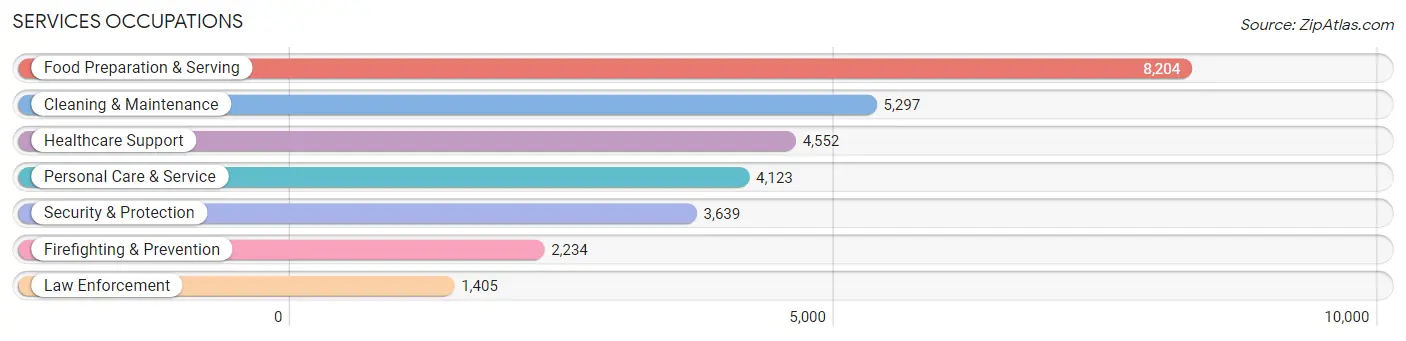
Services Occupations
The most common Services occupations in Anchorage are Food Preparation & Serving (8,204 | 5.8%), Cleaning & Maintenance (5,297 | 3.7%), Healthcare Support (4,552 | 3.2%), Personal Care & Service (4,123 | 2.9%), and Security & Protection (3,639 | 2.6%).
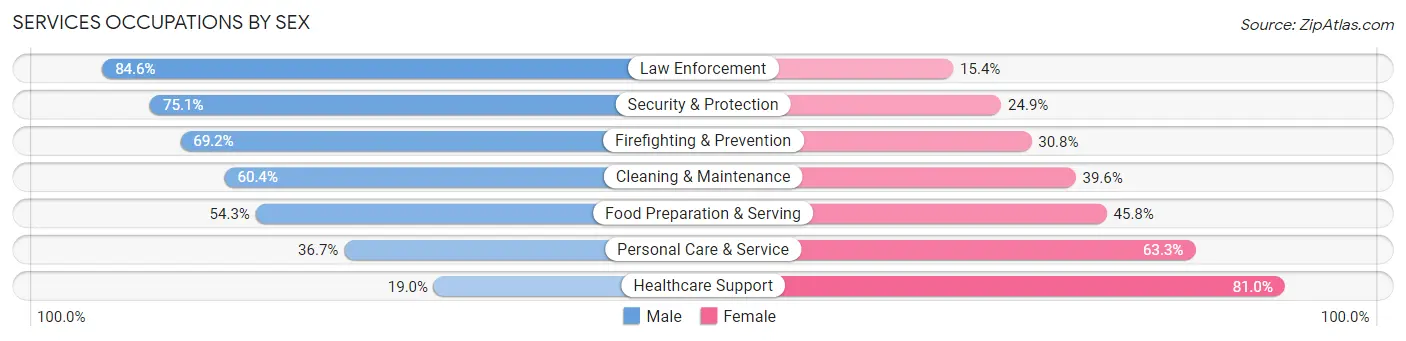
Services Occupations by Sex
Within the Services occupations in Anchorage, the most male-oriented occupations are Law Enforcement (84.6%), Security & Protection (75.1%), and Firefighting & Prevention (69.2%), while the most female-oriented occupations are Healthcare Support (81.0%), Personal Care & Service (63.3%), and Food Preparation & Serving (45.8%).
| Occupation | Male | Female |
| Healthcare Support | 863 (19.0%) | 3,689 (81.0%) |
| Security & Protection | 2,734 (75.1%) | 905 (24.9%) |
| Firefighting & Prevention | 1,545 (69.2%) | 689 (30.8%) |
| Law Enforcement | 1,189 (84.6%) | 216 (15.4%) |
| Food Preparation & Serving | 4,451 (54.2%) | 3,753 (45.8%) |
| Cleaning & Maintenance | 3,199 (60.4%) | 2,098 (39.6%) |
| Personal Care & Service | 1,514 (36.7%) | 2,609 (63.3%) |
| Total (Category) | 12,761 (49.4%) | 13,054 (50.6%) |
| Total (Overall) | 74,314 (52.2%) | 68,021 (47.8%) |
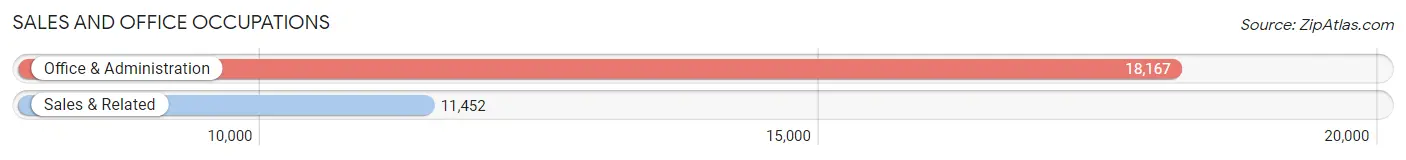
Sales and Office Occupations
The most common Sales and Office occupations in Anchorage are Office & Administration (18,167 | 12.8%), and Sales & Related (11,452 | 8.1%).
Sales and Office Occupations by Sex
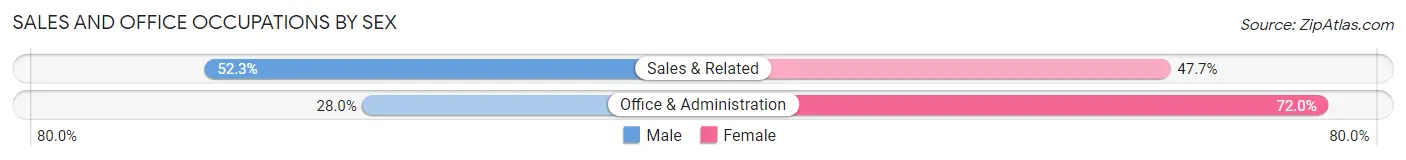
| Occupation | Male | Female |
| Sales & Related | 5,994 (52.3%) | 5,458 (47.7%) |
| Office & Administration | 5,087 (28.0%) | 13,080 (72.0%) |
| Total (Category) | 11,081 (37.4%) | 18,538 (62.6%) |
| Total (Overall) | 74,314 (52.2%) | 68,021 (47.8%) |
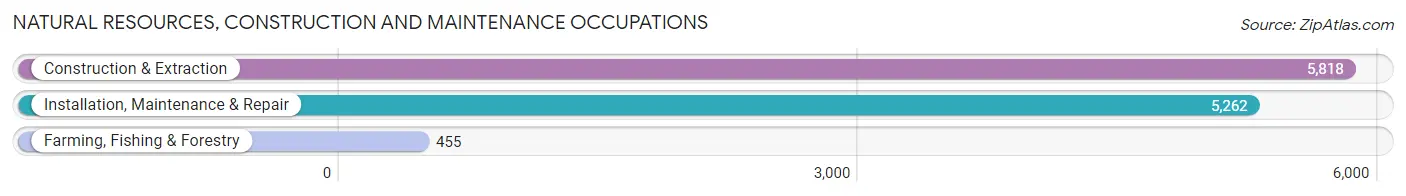
Natural Resources, Construction and Maintenance Occupations
The most common Natural Resources, Construction and Maintenance occupations in Anchorage are Construction & Extraction (5,818 | 4.1%), Installation, Maintenance & Repair (5,262 | 3.7%), and Farming, Fishing & Forestry (455 | 0.3%).
Natural Resources, Construction and Maintenance Occupations by Sex
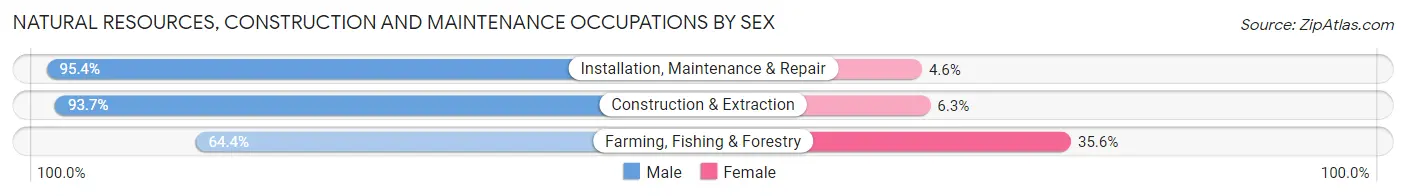
| Occupation | Male | Female |
| Farming, Fishing & Forestry | 293 (64.4%) | 162 (35.6%) |
| Construction & Extraction | 5,449 (93.7%) | 369 (6.3%) |
| Installation, Maintenance & Repair | 5,021 (95.4%) | 241 (4.6%) |
| Total (Category) | 10,763 (93.3%) | 772 (6.7%) |
| Total (Overall) | 74,314 (52.2%) | 68,021 (47.8%) |
Production, Transportation and Moving Occupations
The most common Production, Transportation and Moving occupations in Anchorage are Transportation (7,129 | 5.0%), Material Moving (5,400 | 3.8%), and Production (3,424 | 2.4%).
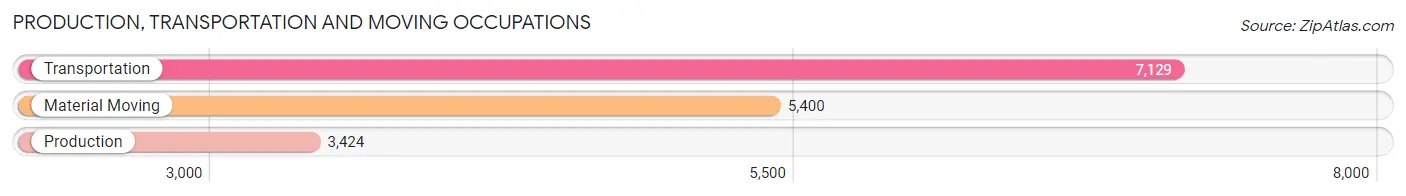
Production, Transportation and Moving Occupations by Sex
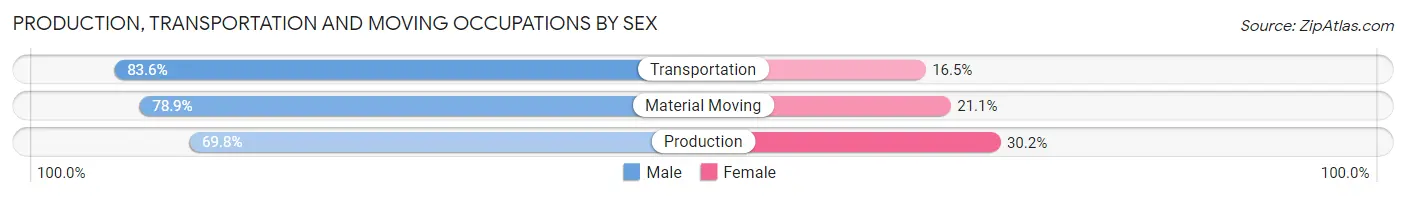
| Occupation | Male | Female |
| Production | 2,391 (69.8%) | 1,033 (30.2%) |
| Transportation | 5,956 (83.6%) | 1,173 (16.5%) |
| Material Moving | 4,263 (78.9%) | 1,137 (21.1%) |
| Total (Category) | 12,610 (79.0%) | 3,343 (21.0%) |
| Total (Overall) | 74,314 (52.2%) | 68,021 (47.8%) |
Employment Industries by Sex in Anchorage
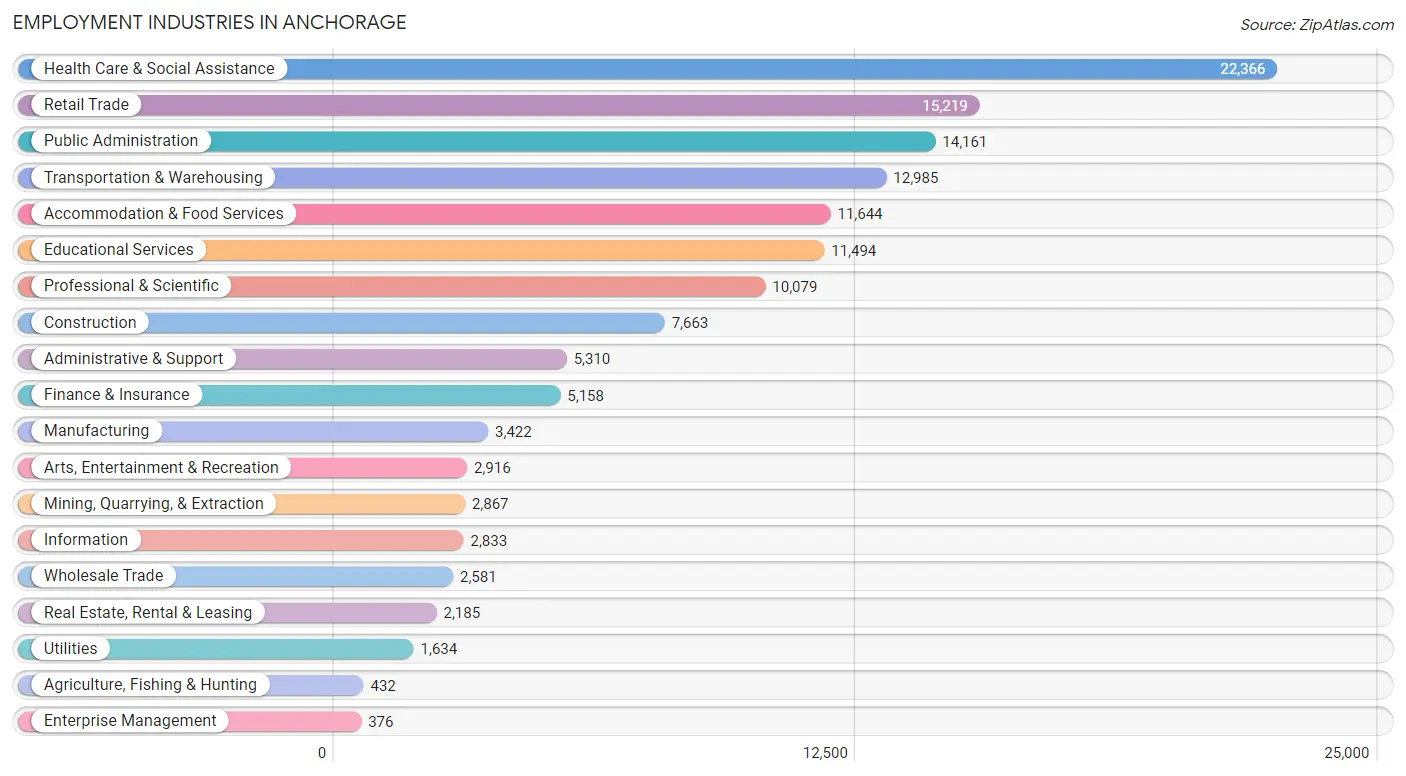
Employment Industries in Anchorage
The major employment industries in Anchorage include Health Care & Social Assistance (22,366 | 15.7%), Retail Trade (15,219 | 10.7%), Public Administration (14,161 | 10.0%), Transportation & Warehousing (12,985 | 9.1%), and Accommodation & Food Services (11,644 | 8.2%).
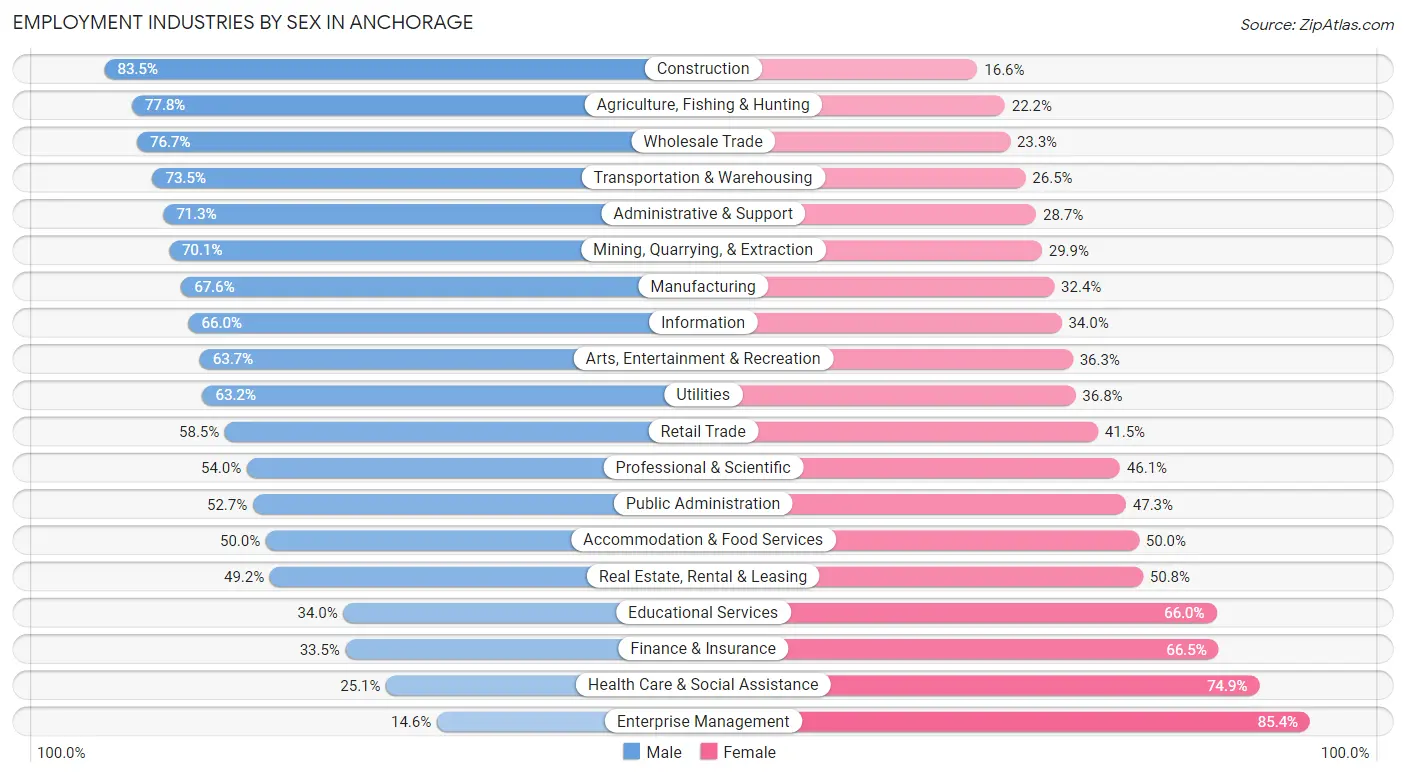
Employment Industries by Sex in Anchorage
The Anchorage industries that see more men than women are Construction (83.5%), Agriculture, Fishing & Hunting (77.8%), and Wholesale Trade (76.7%), whereas the industries that tend to have a higher number of women are Enterprise Management (85.4%), Health Care & Social Assistance (74.9%), and Finance & Insurance (66.5%).
| Industry | Male | Female |
| Agriculture, Fishing & Hunting | 336 (77.8%) | 96 (22.2%) |
| Mining, Quarrying, & Extraction | 2,010 (70.1%) | 857 (29.9%) |
| Construction | 6,395 (83.5%) | 1,268 (16.6%) |
| Manufacturing | 2,312 (67.6%) | 1,110 (32.4%) |
| Wholesale Trade | 1,980 (76.7%) | 601 (23.3%) |
| Retail Trade | 8,903 (58.5%) | 6,316 (41.5%) |
| Transportation & Warehousing | 9,545 (73.5%) | 3,440 (26.5%) |
| Utilities | 1,032 (63.2%) | 602 (36.8%) |
| Information | 1,871 (66.0%) | 962 (34.0%) |
| Finance & Insurance | 1,730 (33.5%) | 3,428 (66.5%) |
| Real Estate, Rental & Leasing | 1,075 (49.2%) | 1,110 (50.8%) |
| Professional & Scientific | 5,438 (53.9%) | 4,641 (46.1%) |
| Enterprise Management | 55 (14.6%) | 321 (85.4%) |
| Administrative & Support | 3,786 (71.3%) | 1,524 (28.7%) |
| Educational Services | 3,907 (34.0%) | 7,587 (66.0%) |
| Health Care & Social Assistance | 5,618 (25.1%) | 16,748 (74.9%) |
| Arts, Entertainment & Recreation | 1,858 (63.7%) | 1,058 (36.3%) |
| Accommodation & Food Services | 5,826 (50.0%) | 5,818 (50.0%) |
| Public Administration | 7,465 (52.7%) | 6,696 (47.3%) |
| Total | 74,314 (52.2%) | 68,021 (47.8%) |
Education in Anchorage
School Enrollment in Anchorage
The most common levels of schooling among the 69,490 students in Anchorage are elementary school (16,014 | 23.1%), high school (14,681 | 21.1%), and college / undergraduate (14,050 | 20.2%).
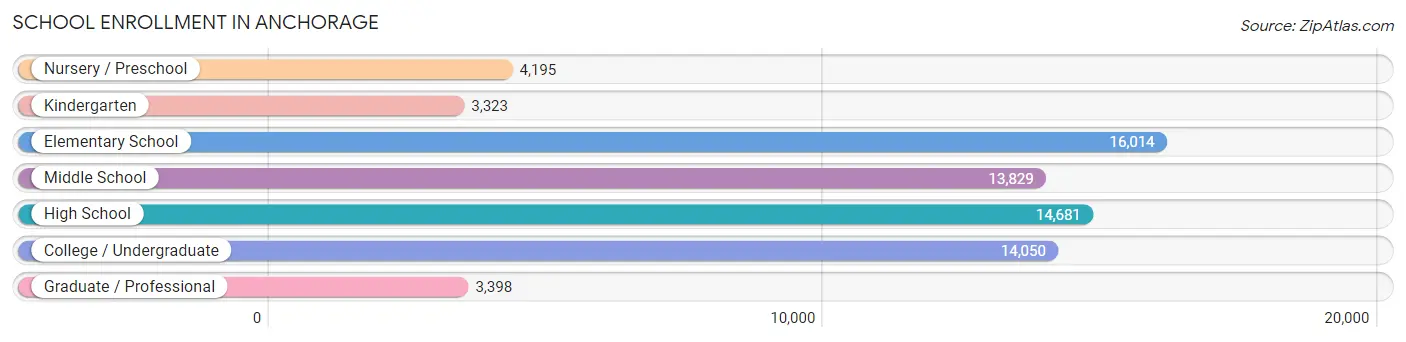
| School Level | # Students | % Students |
| Nursery / Preschool | 4,195 | 6.0% |
| Kindergarten | 3,323 | 4.8% |
| Elementary School | 16,014 | 23.1% |
| Middle School | 13,829 | 19.9% |
| High School | 14,681 | 21.1% |
| College / Undergraduate | 14,050 | 20.2% |
| Graduate / Professional | 3,398 | 4.9% |
| Total | 69,490 | 100.0% |
School Enrollment by Age by Funding Source in Anchorage
Out of a total of 69,490 students who are enrolled in schools in Anchorage, 10,424 (15.0%) attend a private institution, while the remaining 59,066 (85.0%) are enrolled in public schools. The age group of 3 to 4 year olds has the highest likelihood of being enrolled in private schools, with 1,241 (40.2% in the age bracket) enrolled. Conversely, the age group of 15 to 17 year olds has the lowest likelihood of being enrolled in a private school, with 9,812 (91.6% in the age bracket) attending a public institution.
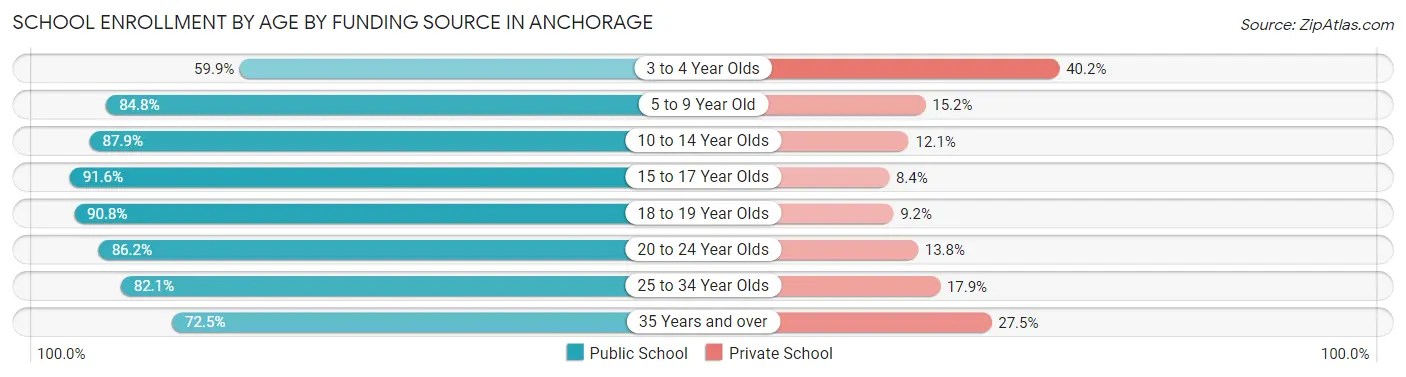
| Age Bracket | Public School | Private School |
| 3 to 4 Year Olds | 1,850 (59.9%) | 1,241 (40.2%) |
| 5 to 9 Year Old | 15,639 (84.8%) | 2,806 (15.2%) |
| 10 to 14 Year Olds | 15,621 (87.9%) | 2,150 (12.1%) |
| 15 to 17 Year Olds | 9,812 (91.6%) | 903 (8.4%) |
| 18 to 19 Year Olds | 3,481 (90.8%) | 354 (9.2%) |
| 20 to 24 Year Olds | 4,581 (86.2%) | 734 (13.8%) |
| 25 to 34 Year Olds | 5,059 (82.1%) | 1,105 (17.9%) |
| 35 Years and over | 3,012 (72.5%) | 1,142 (27.5%) |
| Total | 59,066 (85.0%) | 10,424 (15.0%) |
Educational Attainment by Field of Study in Anchorage
Business (12,037 | 15.5%), education (8,843 | 11.4%), science & technology (7,684 | 9.9%), bio, nature & agricultural (6,735 | 8.7%), and social sciences (6,709 | 8.7%) are the most common fields of study among 77,450 individuals in Anchorage who have obtained a bachelor's degree or higher.
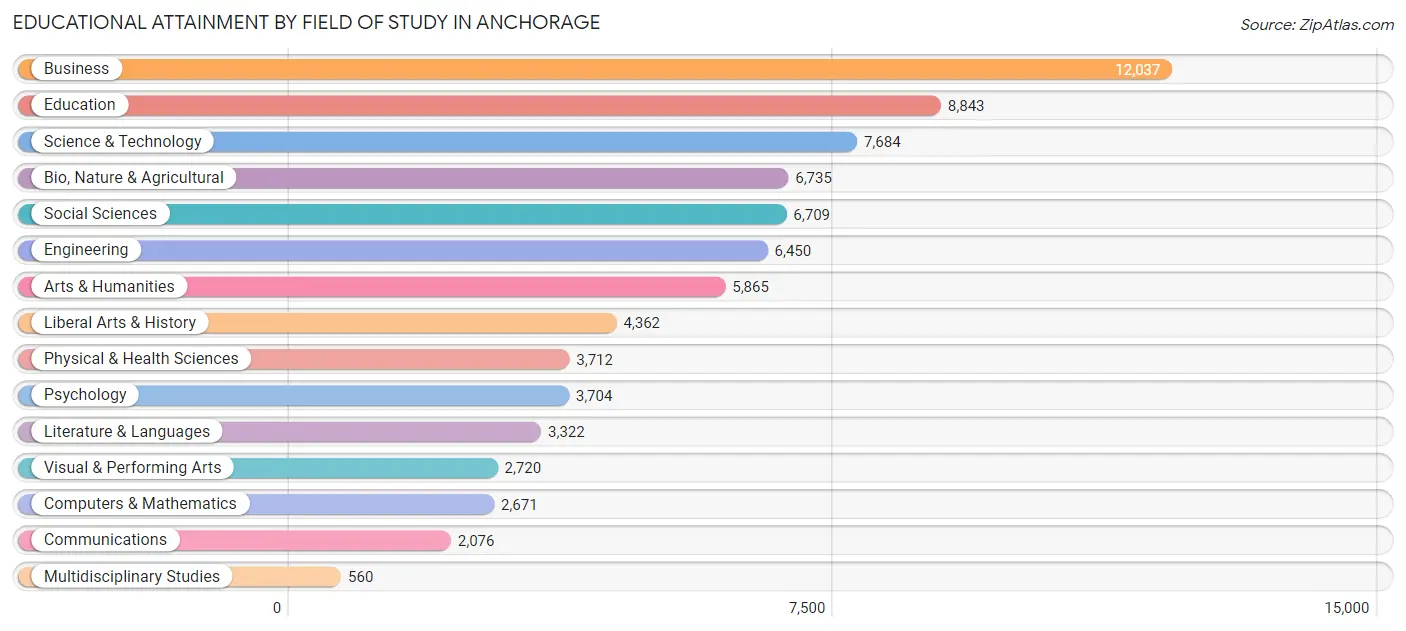
| Field of Study | # Graduates | % Graduates |
| Computers & Mathematics | 2,671 | 3.5% |
| Bio, Nature & Agricultural | 6,735 | 8.7% |
| Physical & Health Sciences | 3,712 | 4.8% |
| Psychology | 3,704 | 4.8% |
| Social Sciences | 6,709 | 8.7% |
| Engineering | 6,450 | 8.3% |
| Multidisciplinary Studies | 560 | 0.7% |
| Science & Technology | 7,684 | 9.9% |
| Business | 12,037 | 15.5% |
| Education | 8,843 | 11.4% |
| Literature & Languages | 3,322 | 4.3% |
| Liberal Arts & History | 4,362 | 5.6% |
| Visual & Performing Arts | 2,720 | 3.5% |
| Communications | 2,076 | 2.7% |
| Arts & Humanities | 5,865 | 7.6% |
| Total | 77,450 | 100.0% |
Transportation & Commute in Anchorage
Vehicle Availability by Sex in Anchorage
The most prevalent vehicle ownership categories in Anchorage are males with 2 vehicles (34,047, accounting for 43.7%) and females with 2 vehicles (27,586, making up 50.7%).
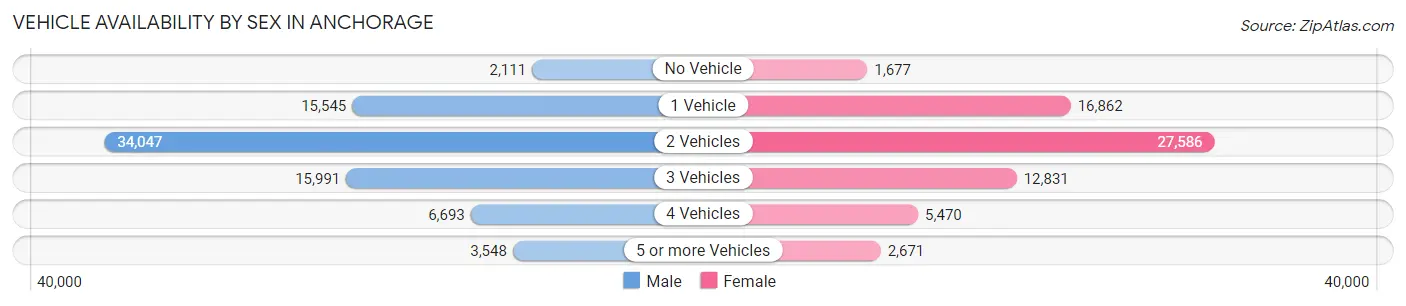
| Vehicles Available | Male | Female |
| No Vehicle | 2,111 (2.7%) | 1,677 (2.5%) |
| 1 Vehicle | 15,545 (20.0%) | 16,862 (25.1%) |
| 2 Vehicles | 34,047 (43.7%) | 27,586 (41.1%) |
| 3 Vehicles | 15,991 (20.5%) | 12,831 (19.1%) |
| 4 Vehicles | 6,693 (8.6%) | 5,470 (8.2%) |
| 5 or more Vehicles | 3,548 (4.5%) | 2,671 (4.0%) |
| Total | 77,935 (100.0%) | 67,097 (100.0%) |
Commute Time in Anchorage
The most frequently occuring commute durations in Anchorage are 15 to 19 minutes (33,160 commuters, 24.4%), 10 to 14 minutes (27,372 commuters, 20.2%), and 20 to 24 minutes (24,810 commuters, 18.3%).
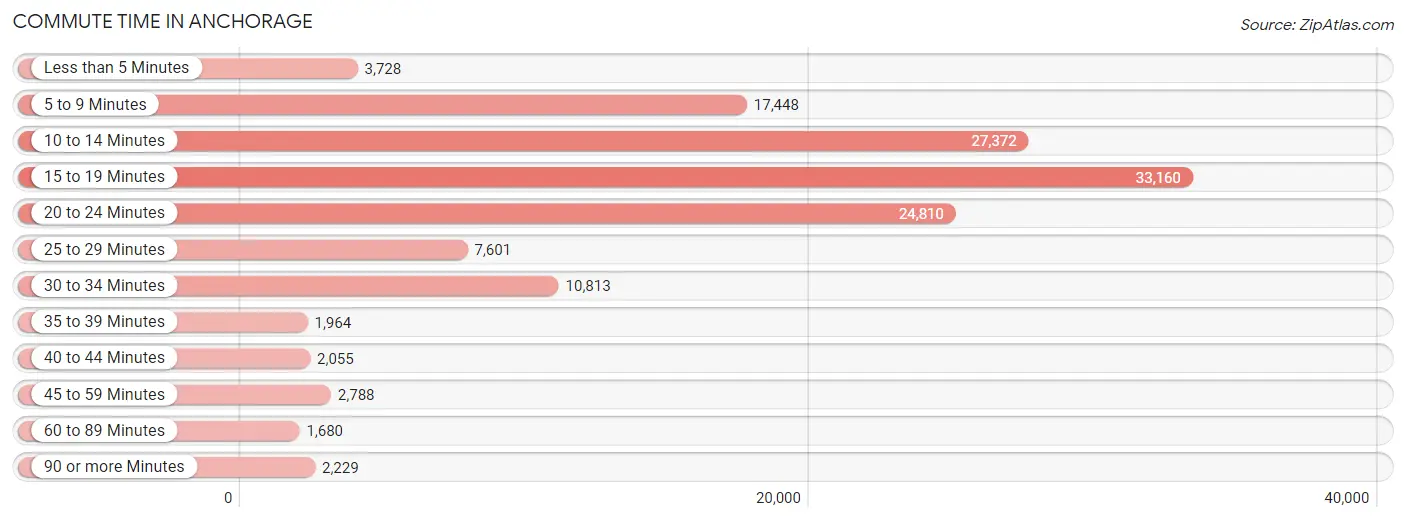
| Commute Time | # Commuters | % Commuters |
| Less than 5 Minutes | 3,728 | 2.8% |
| 5 to 9 Minutes | 17,448 | 12.9% |
| 10 to 14 Minutes | 27,372 | 20.2% |
| 15 to 19 Minutes | 33,160 | 24.4% |
| 20 to 24 Minutes | 24,810 | 18.3% |
| 25 to 29 Minutes | 7,601 | 5.6% |
| 30 to 34 Minutes | 10,813 | 8.0% |
| 35 to 39 Minutes | 1,964 | 1.5% |
| 40 to 44 Minutes | 2,055 | 1.5% |
| 45 to 59 Minutes | 2,788 | 2.1% |
| 60 to 89 Minutes | 1,680 | 1.2% |
| 90 or more Minutes | 2,229 | 1.6% |
Commute Time by Sex in Anchorage
The most common commute times in Anchorage are 15 to 19 minutes (18,110 commuters, 24.0%) for males and 15 to 19 minutes (15,050 commuters, 24.9%) for females.
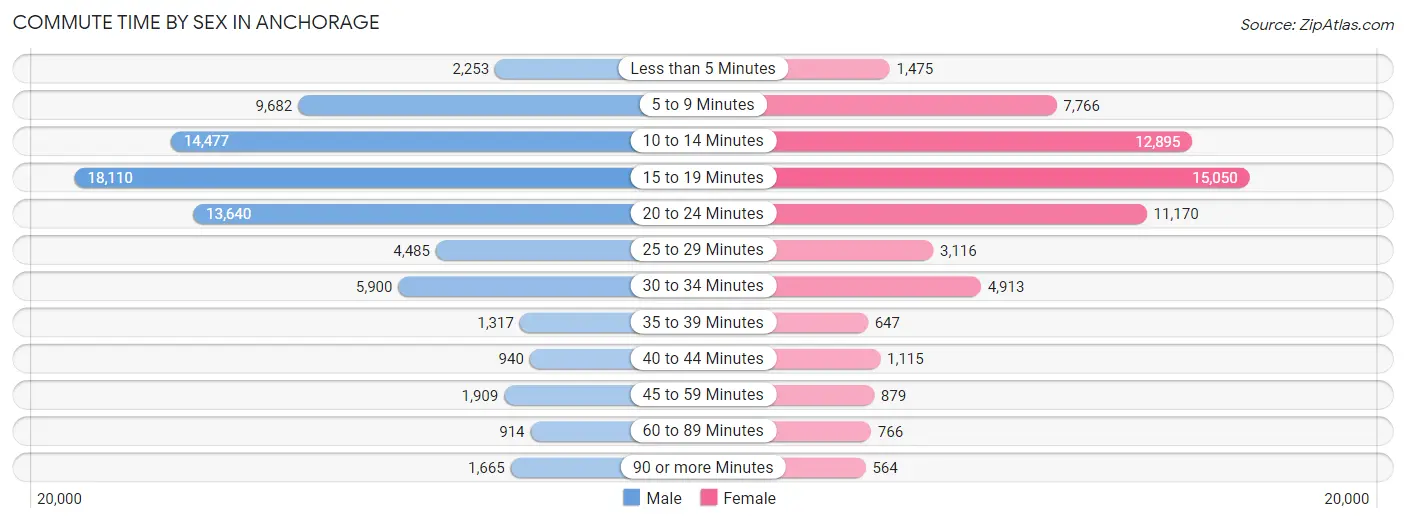
| Commute Time | Male | Female |
| Less than 5 Minutes | 2,253 (3.0%) | 1,475 (2.4%) |
| 5 to 9 Minutes | 9,682 (12.9%) | 7,766 (12.9%) |
| 10 to 14 Minutes | 14,477 (19.2%) | 12,895 (21.4%) |
| 15 to 19 Minutes | 18,110 (24.0%) | 15,050 (24.9%) |
| 20 to 24 Minutes | 13,640 (18.1%) | 11,170 (18.5%) |
| 25 to 29 Minutes | 4,485 (6.0%) | 3,116 (5.2%) |
| 30 to 34 Minutes | 5,900 (7.8%) | 4,913 (8.1%) |
| 35 to 39 Minutes | 1,317 (1.8%) | 647 (1.1%) |
| 40 to 44 Minutes | 940 (1.3%) | 1,115 (1.8%) |
| 45 to 59 Minutes | 1,909 (2.5%) | 879 (1.5%) |
| 60 to 89 Minutes | 914 (1.2%) | 766 (1.3%) |
| 90 or more Minutes | 1,665 (2.2%) | 564 (0.9%) |
Time of Departure to Work by Sex in Anchorage
The most frequent times of departure to work in Anchorage are 7:30 AM to 7:59 AM (10,452, 13.9%) for males and 7:30 AM to 7:59 AM (10,942, 18.1%) for females.
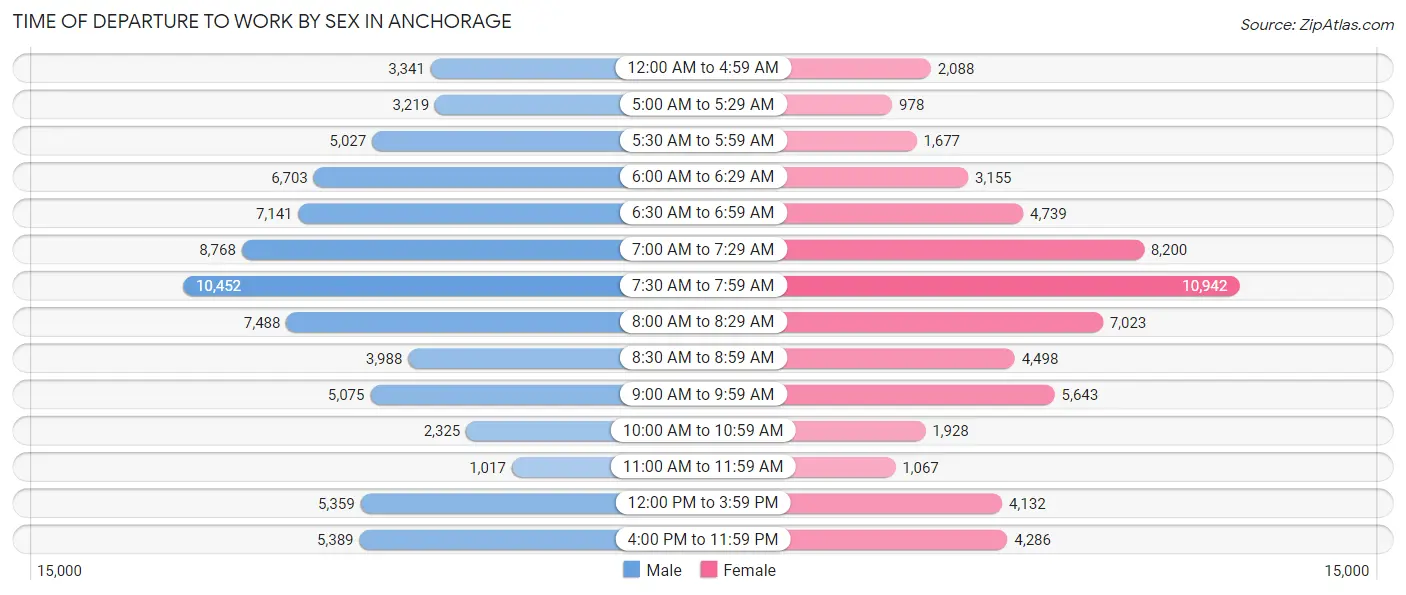
| Time of Departure | Male | Female |
| 12:00 AM to 4:59 AM | 3,341 (4.4%) | 2,088 (3.5%) |
| 5:00 AM to 5:29 AM | 3,219 (4.3%) | 978 (1.6%) |
| 5:30 AM to 5:59 AM | 5,027 (6.7%) | 1,677 (2.8%) |
| 6:00 AM to 6:29 AM | 6,703 (8.9%) | 3,155 (5.2%) |
| 6:30 AM to 6:59 AM | 7,141 (9.5%) | 4,739 (7.9%) |
| 7:00 AM to 7:29 AM | 8,768 (11.7%) | 8,200 (13.6%) |
| 7:30 AM to 7:59 AM | 10,452 (13.9%) | 10,942 (18.1%) |
| 8:00 AM to 8:29 AM | 7,488 (10.0%) | 7,023 (11.6%) |
| 8:30 AM to 8:59 AM | 3,988 (5.3%) | 4,498 (7.4%) |
| 9:00 AM to 9:59 AM | 5,075 (6.7%) | 5,643 (9.3%) |
| 10:00 AM to 10:59 AM | 2,325 (3.1%) | 1,928 (3.2%) |
| 11:00 AM to 11:59 AM | 1,017 (1.3%) | 1,067 (1.8%) |
| 12:00 PM to 3:59 PM | 5,359 (7.1%) | 4,132 (6.9%) |
| 4:00 PM to 11:59 PM | 5,389 (7.2%) | 4,286 (7.1%) |
| Total | 75,292 (100.0%) | 60,356 (100.0%) |
Housing Occupancy in Anchorage
Occupancy by Ownership in Anchorage
Of the total 107,134 dwellings in Anchorage, owner-occupied units account for 68,356 (63.8%), while renter-occupied units make up 38,778 (36.2%).
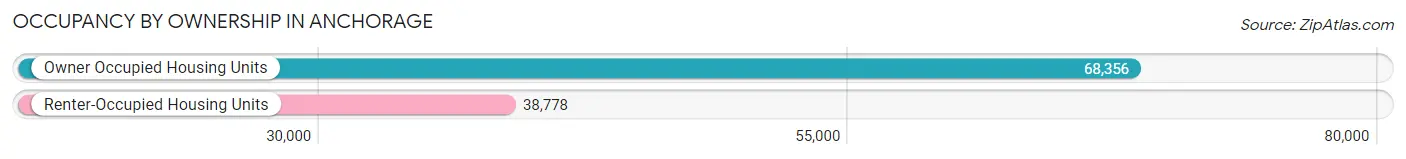
| Occupancy | # Housing Units | % Housing Units |
| Owner Occupied Housing Units | 68,356 | 63.8% |
| Renter-Occupied Housing Units | 38,778 | 36.2% |
| Total Occupied Housing Units | 107,134 | 100.0% |
Occupancy by Household Size in Anchorage
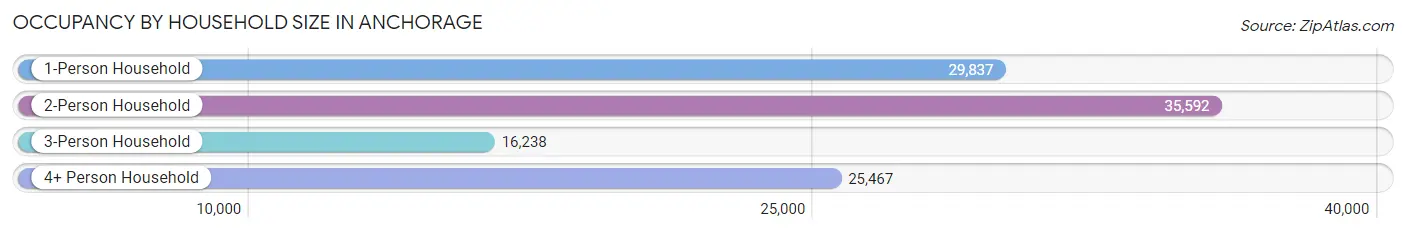
| Household Size | # Housing Units | % Housing Units |
| 1-Person Household | 29,837 | 27.9% |
| 2-Person Household | 35,592 | 33.2% |
| 3-Person Household | 16,238 | 15.2% |
| 4+ Person Household | 25,467 | 23.8% |
| Total Housing Units | 107,134 | 100.0% |
Occupancy by Ownership by Household Size in Anchorage
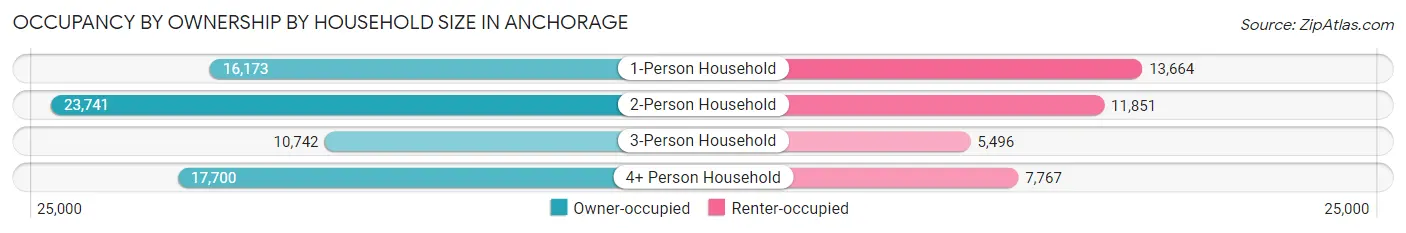
| Household Size | Owner-occupied | Renter-occupied |
| 1-Person Household | 16,173 (54.2%) | 13,664 (45.8%) |
| 2-Person Household | 23,741 (66.7%) | 11,851 (33.3%) |
| 3-Person Household | 10,742 (66.1%) | 5,496 (33.9%) |
| 4+ Person Household | 17,700 (69.5%) | 7,767 (30.5%) |
| Total Housing Units | 68,356 (63.8%) | 38,778 (36.2%) |
Occupancy by Educational Attainment in Anchorage
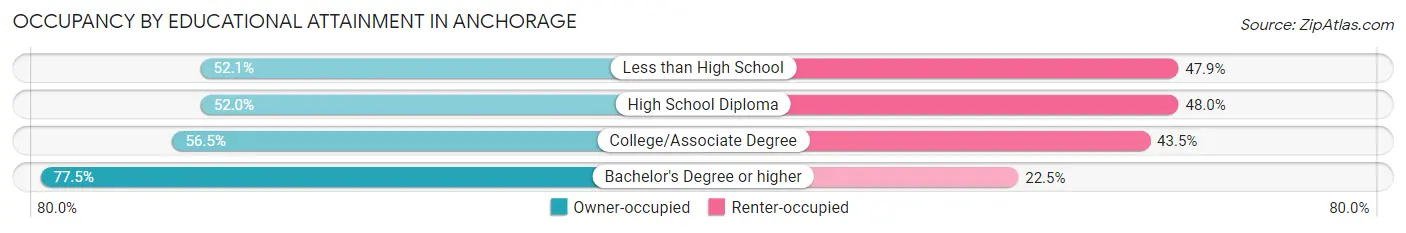
| Household Size | Owner-occupied | Renter-occupied |
| Less than High School | 2,419 (52.1%) | 2,226 (47.9%) |
| High School Diploma | 11,196 (52.0%) | 10,317 (48.0%) |
| College/Associate Degree | 21,579 (56.5%) | 16,587 (43.5%) |
| Bachelor's Degree or higher | 33,162 (77.5%) | 9,648 (22.5%) |
Occupancy by Age of Householder in Anchorage
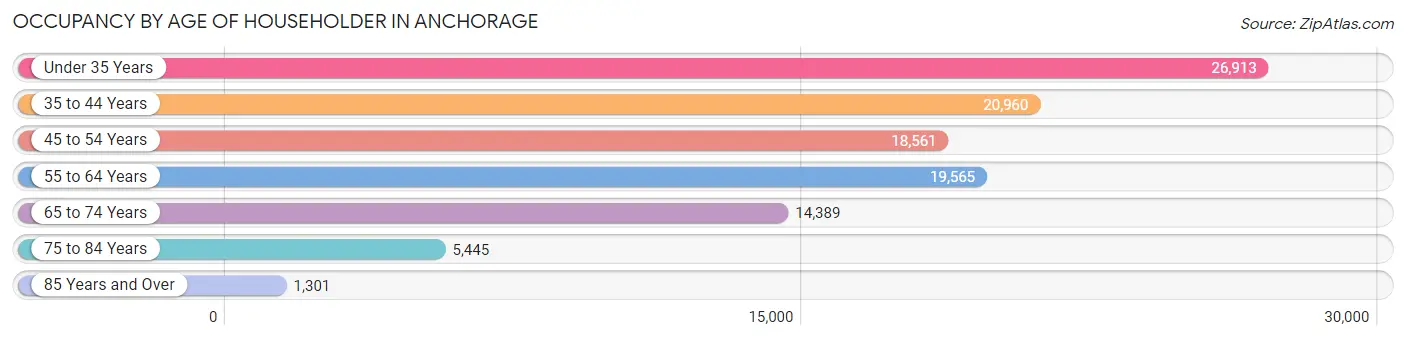
| Age Bracket | # Households | % Households |
| Under 35 Years | 26,913 | 25.1% |
| 35 to 44 Years | 20,960 | 19.6% |
| 45 to 54 Years | 18,561 | 17.3% |
| 55 to 64 Years | 19,565 | 18.3% |
| 65 to 74 Years | 14,389 | 13.4% |
| 75 to 84 Years | 5,445 | 5.1% |
| 85 Years and Over | 1,301 | 1.2% |
| Total | 107,134 | 100.0% |
Housing Finances in Anchorage
Median Income by Occupancy in Anchorage
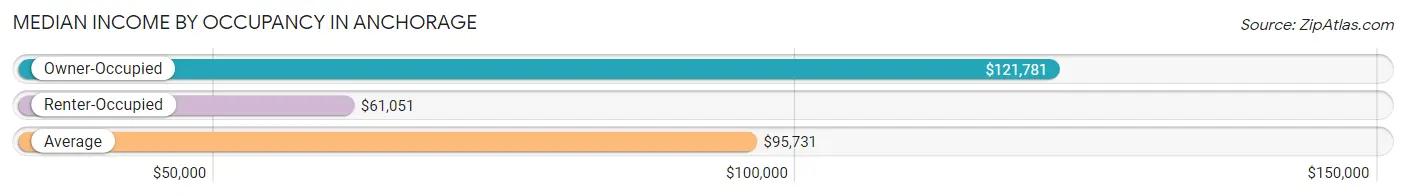
| Occupancy Type | # Households | Median Income |
| Owner-Occupied | 68,356 (63.8%) | $121,781 |
| Renter-Occupied | 38,778 (36.2%) | $61,051 |
| Average | 107,134 (100.0%) | $95,731 |
Occupancy by Householder Income Bracket in Anchorage
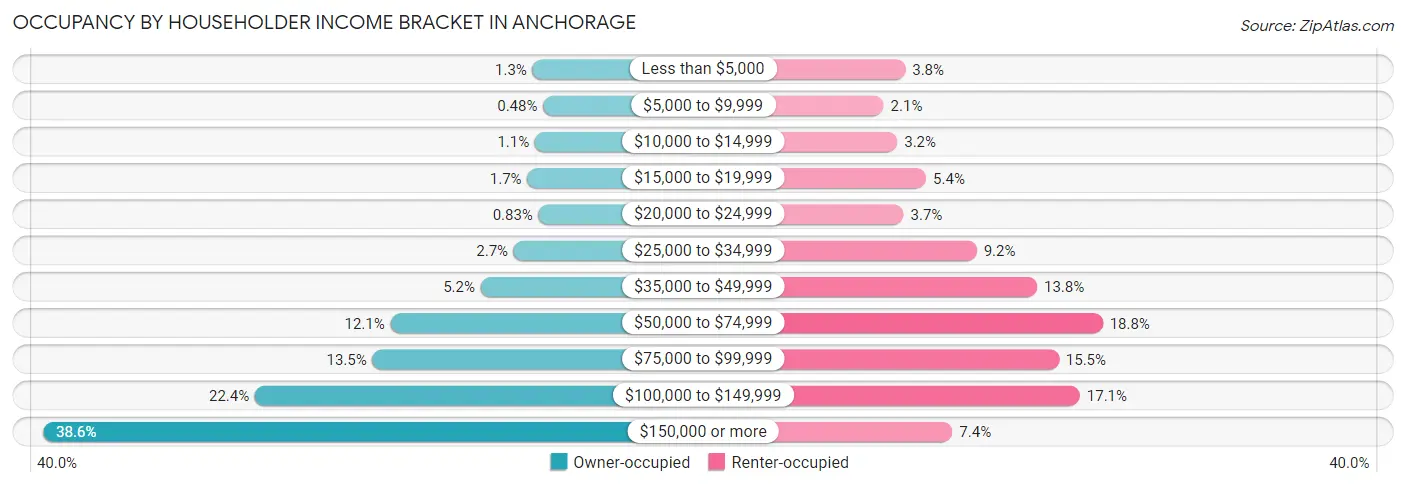
| Income Bracket | Owner-occupied | Renter-occupied |
| Less than $5,000 | 883 (1.3%) | 1,469 (3.8%) |
| $5,000 to $9,999 | 327 (0.5%) | 828 (2.1%) |
| $10,000 to $14,999 | 762 (1.1%) | 1,235 (3.2%) |
| $15,000 to $19,999 | 1,154 (1.7%) | 2,087 (5.4%) |
| $20,000 to $24,999 | 564 (0.8%) | 1,419 (3.7%) |
| $25,000 to $34,999 | 1,857 (2.7%) | 3,581 (9.2%) |
| $35,000 to $49,999 | 3,580 (5.2%) | 5,363 (13.8%) |
| $50,000 to $74,999 | 8,287 (12.1%) | 7,302 (18.8%) |
| $75,000 to $99,999 | 9,221 (13.5%) | 6,007 (15.5%) |
| $100,000 to $149,999 | 15,342 (22.4%) | 6,627 (17.1%) |
| $150,000 or more | 26,379 (38.6%) | 2,860 (7.4%) |
| Total | 68,356 (100.0%) | 38,778 (100.0%) |
Monthly Housing Cost Tiers in Anchorage
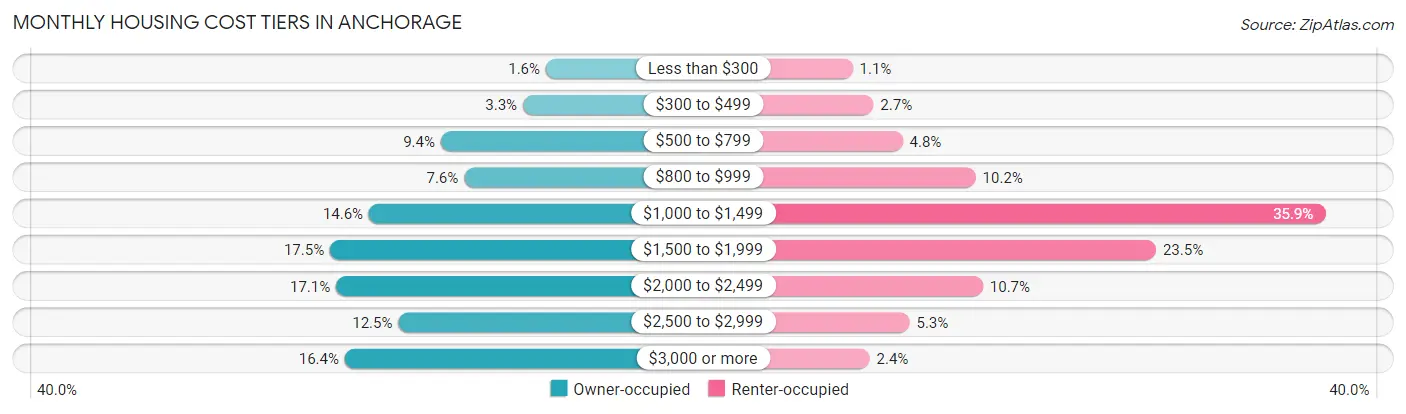
| Monthly Cost | Owner-occupied | Renter-occupied |
| Less than $300 | 1,098 (1.6%) | 436 (1.1%) |
| $300 to $499 | 2,257 (3.3%) | 1,028 (2.6%) |
| $500 to $799 | 6,390 (9.3%) | 1,863 (4.8%) |
| $800 to $999 | 5,218 (7.6%) | 3,948 (10.2%) |
| $1,000 to $1,499 | 10,008 (14.6%) | 13,930 (35.9%) |
| $1,500 to $1,999 | 11,969 (17.5%) | 9,098 (23.5%) |
| $2,000 to $2,499 | 11,663 (17.1%) | 4,154 (10.7%) |
| $2,500 to $2,999 | 8,529 (12.5%) | 2,058 (5.3%) |
| $3,000 or more | 11,224 (16.4%) | 918 (2.4%) |
| Total | 68,356 (100.0%) | 38,778 (100.0%) |
Physical Housing Characteristics in Anchorage
Housing Structures in Anchorage
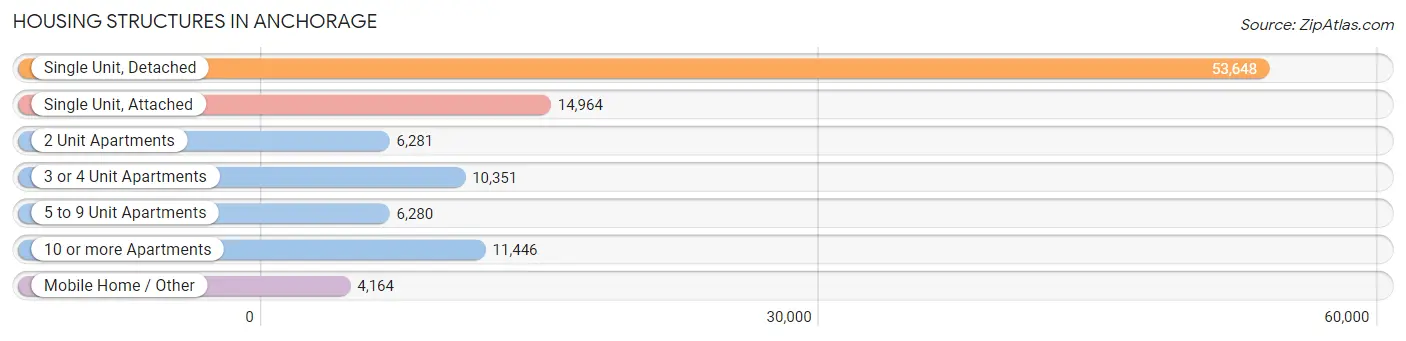
| Structure Type | # Housing Units | % Housing Units |
| Single Unit, Detached | 53,648 | 50.1% |
| Single Unit, Attached | 14,964 | 14.0% |
| 2 Unit Apartments | 6,281 | 5.9% |
| 3 or 4 Unit Apartments | 10,351 | 9.7% |
| 5 to 9 Unit Apartments | 6,280 | 5.9% |
| 10 or more Apartments | 11,446 | 10.7% |
| Mobile Home / Other | 4,164 | 3.9% |
| Total | 107,134 | 100.0% |
Housing Structures by Occupancy in Anchorage
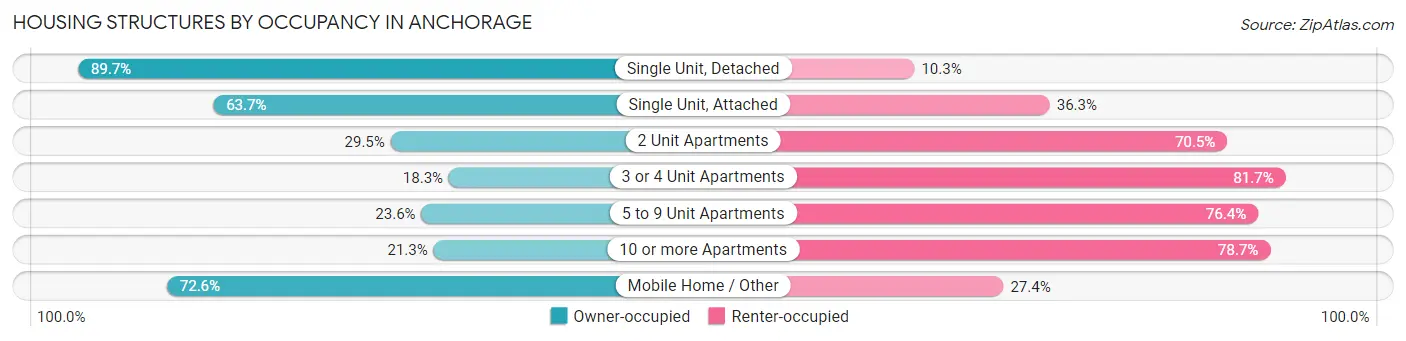
| Structure Type | Owner-occupied | Renter-occupied |
| Single Unit, Detached | 48,139 (89.7%) | 5,509 (10.3%) |
| Single Unit, Attached | 9,529 (63.7%) | 5,435 (36.3%) |
| 2 Unit Apartments | 1,855 (29.5%) | 4,426 (70.5%) |
| 3 or 4 Unit Apartments | 1,895 (18.3%) | 8,456 (81.7%) |
| 5 to 9 Unit Apartments | 1,482 (23.6%) | 4,798 (76.4%) |
| 10 or more Apartments | 2,433 (21.3%) | 9,013 (78.7%) |
| Mobile Home / Other | 3,023 (72.6%) | 1,141 (27.4%) |
| Total | 68,356 (63.8%) | 38,778 (36.2%) |
Housing Structures by Number of Rooms in Anchorage
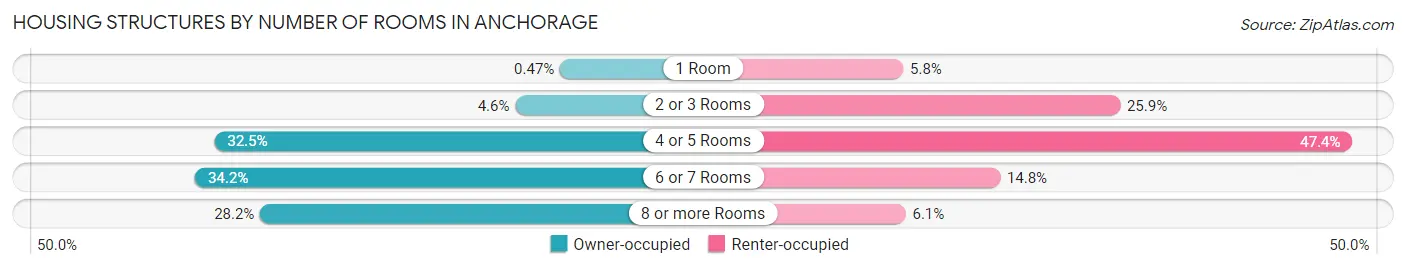
| Number of Rooms | Owner-occupied | Renter-occupied |
| 1 Room | 322 (0.5%) | 2,266 (5.8%) |
| 2 or 3 Rooms | 3,159 (4.6%) | 10,043 (25.9%) |
| 4 or 5 Rooms | 22,182 (32.5%) | 18,376 (47.4%) |
| 6 or 7 Rooms | 23,408 (34.2%) | 5,741 (14.8%) |
| 8 or more Rooms | 19,285 (28.2%) | 2,352 (6.1%) |
| Total | 68,356 (100.0%) | 38,778 (100.0%) |
Housing Structure by Heating Type in Anchorage
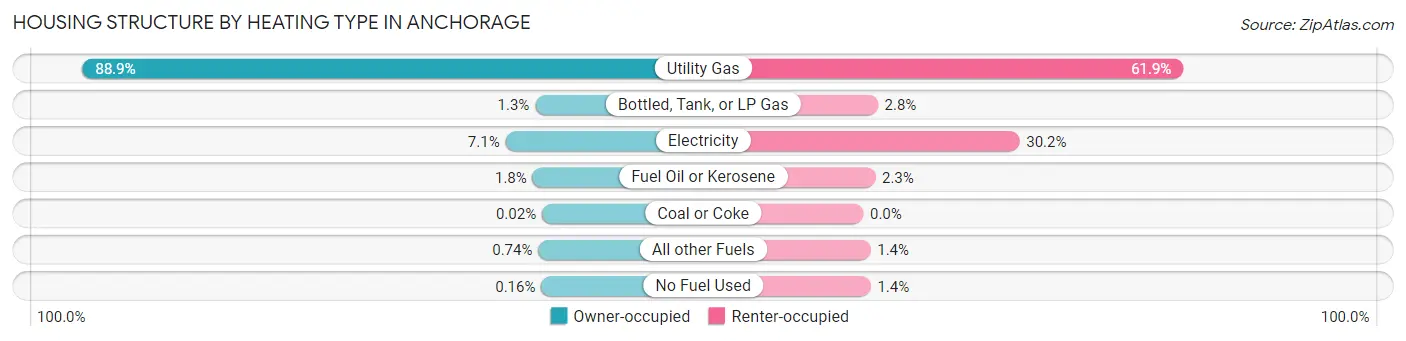
| Heating Type | Owner-occupied | Renter-occupied |
| Utility Gas | 60,736 (88.8%) | 23,988 (61.9%) |
| Bottled, Tank, or LP Gas | 911 (1.3%) | 1,090 (2.8%) |
| Electricity | 4,832 (7.1%) | 11,708 (30.2%) |
| Fuel Oil or Kerosene | 1,250 (1.8%) | 895 (2.3%) |
| Coal or Coke | 13 (0.0%) | 0 (0.0%) |
| All other Fuels | 506 (0.7%) | 541 (1.4%) |
| No Fuel Used | 108 (0.2%) | 556 (1.4%) |
| Total | 68,356 (100.0%) | 38,778 (100.0%) |
Household Vehicle Usage in Anchorage
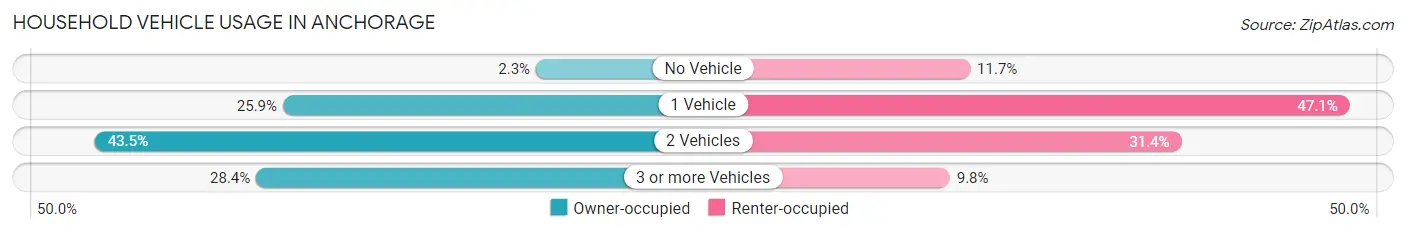
| Vehicles per Household | Owner-occupied | Renter-occupied |
| No Vehicle | 1,550 (2.3%) | 4,535 (11.7%) |
| 1 Vehicle | 17,698 (25.9%) | 18,269 (47.1%) |
| 2 Vehicles | 29,703 (43.4%) | 12,179 (31.4%) |
| 3 or more Vehicles | 19,405 (28.4%) | 3,795 (9.8%) |
| Total | 68,356 (100.0%) | 38,778 (100.0%) |
Real Estate & Mortgages in Anchorage
Real Estate and Mortgage Overview in Anchorage
| Characteristic | Without Mortgage | With Mortgage |
| Housing Units | 20,921 | 47,435 |
| Median Property Value | $350,400 | $368,100 |
| Median Household Income | $100,094 | $19,950 |
| Monthly Housing Costs | $838 | $11,155 |
| Real Estate Taxes | $4,239 | $1,792 |
Property Value by Mortgage Status in Anchorage
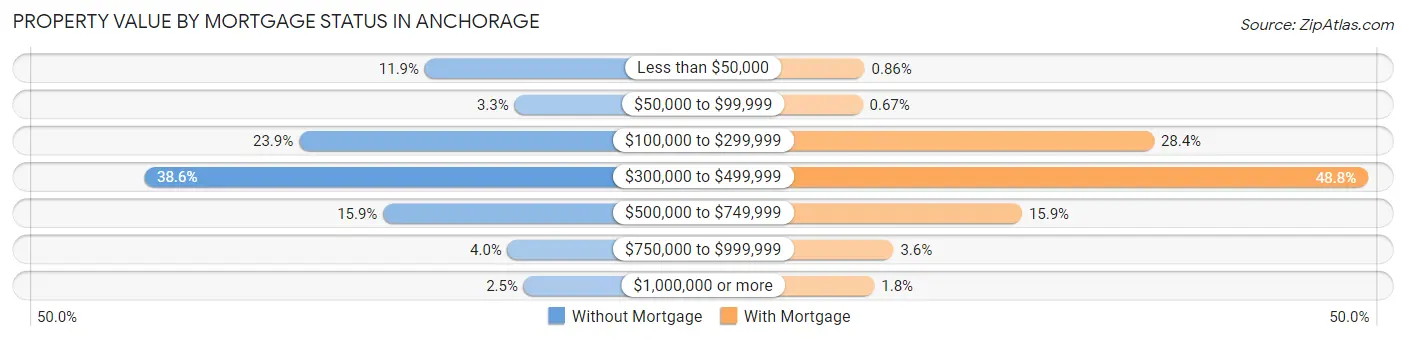
| Property Value | Without Mortgage | With Mortgage |
| Less than $50,000 | 2,485 (11.9%) | 407 (0.9%) |
| $50,000 to $99,999 | 698 (3.3%) | 320 (0.7%) |
| $100,000 to $299,999 | 4,992 (23.9%) | 13,479 (28.4%) |
| $300,000 to $499,999 | 8,080 (38.6%) | 23,150 (48.8%) |
| $500,000 to $749,999 | 3,317 (15.9%) | 7,519 (15.9%) |
| $750,000 to $999,999 | 834 (4.0%) | 1,712 (3.6%) |
| $1,000,000 or more | 515 (2.5%) | 848 (1.8%) |
| Total | 20,921 (100.0%) | 47,435 (100.0%) |
Household Income by Mortgage Status in Anchorage
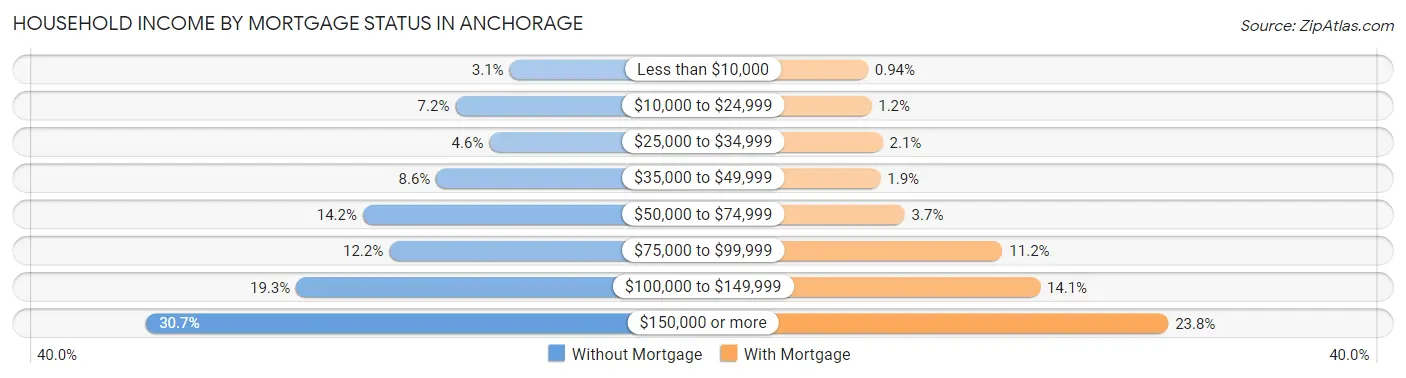
| Household Income | Without Mortgage | With Mortgage |
| Less than $10,000 | 641 (3.1%) | 447 (0.9%) |
| $10,000 to $24,999 | 1,505 (7.2%) | 569 (1.2%) |
| $25,000 to $34,999 | 962 (4.6%) | 975 (2.1%) |
| $35,000 to $49,999 | 1,807 (8.6%) | 895 (1.9%) |
| $50,000 to $74,999 | 2,977 (14.2%) | 1,773 (3.7%) |
| $75,000 to $99,999 | 2,558 (12.2%) | 5,310 (11.2%) |
| $100,000 to $149,999 | 4,042 (19.3%) | 6,663 (14.1%) |
| $150,000 or more | 6,429 (30.7%) | 11,300 (23.8%) |
| Total | 20,921 (100.0%) | 47,435 (100.0%) |
Property Value to Household Income Ratio in Anchorage
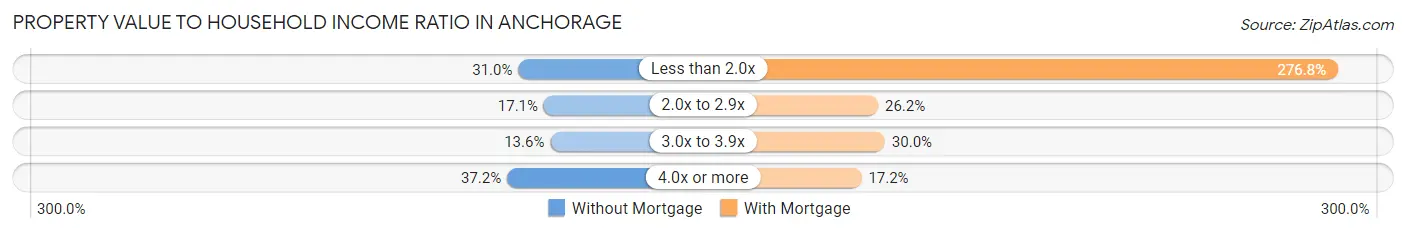
| Value-to-Income Ratio | Without Mortgage | With Mortgage |
| Less than 2.0x | 6,489 (31.0%) | 131,299 (276.8%) |
| 2.0x to 2.9x | 3,573 (17.1%) | 12,439 (26.2%) |
| 3.0x to 3.9x | 2,846 (13.6%) | 14,213 (30.0%) |
| 4.0x or more | 7,776 (37.2%) | 8,145 (17.2%) |
| Total | 20,921 (100.0%) | 47,435 (100.0%) |
Real Estate Taxes by Mortgage Status in Anchorage
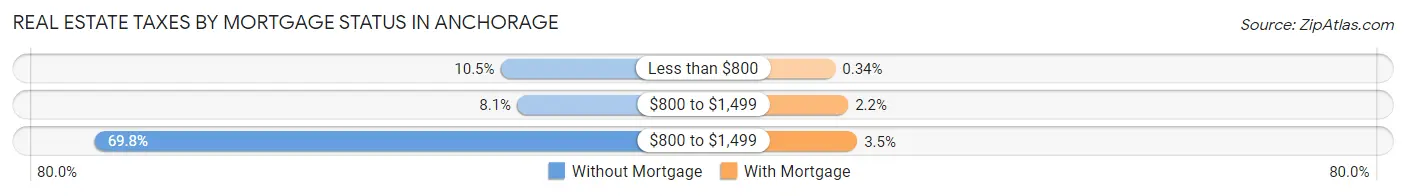
| Property Taxes | Without Mortgage | With Mortgage |
| Less than $800 | 2,192 (10.5%) | 163 (0.3%) |
| $800 to $1,499 | 1,687 (8.1%) | 1,055 (2.2%) |
| $800 to $1,499 | 14,593 (69.8%) | 1,673 (3.5%) |
| Total | 20,921 (100.0%) | 47,435 (100.0%) |
Health & Disability in Anchorage
Health Insurance Coverage by Age in Anchorage
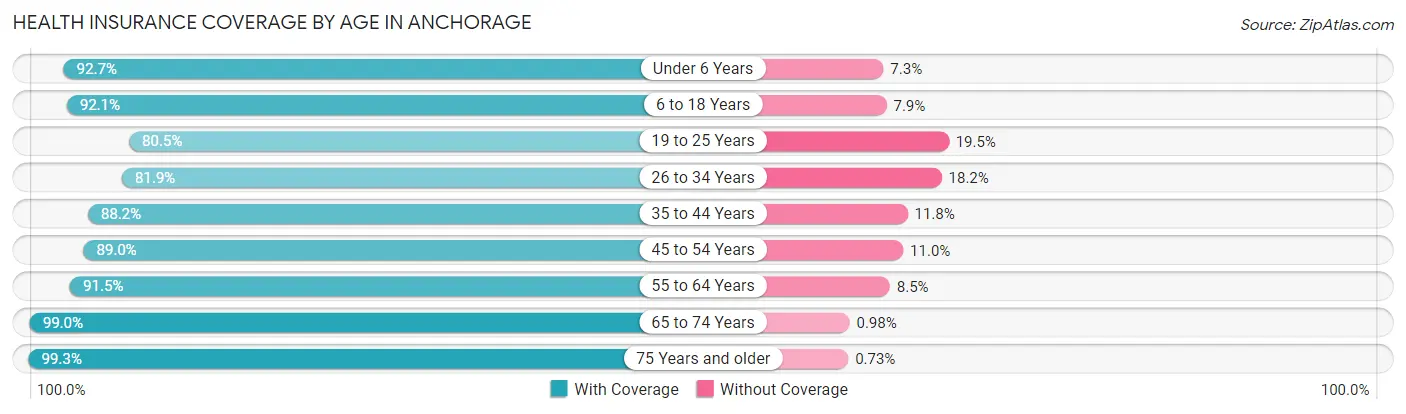
| Age Bracket | With Coverage | Without Coverage |
| Under 6 Years | 21,722 (92.7%) | 1,707 (7.3%) |
| 6 to 18 Years | 45,663 (92.1%) | 3,906 (7.9%) |
| 19 to 25 Years | 20,641 (80.5%) | 4,990 (19.5%) |
| 26 to 34 Years | 32,837 (81.9%) | 7,283 (18.1%) |
| 35 to 44 Years | 33,658 (88.2%) | 4,504 (11.8%) |
| 45 to 54 Years | 29,858 (89.0%) | 3,682 (11.0%) |
| 55 to 64 Years | 31,240 (91.5%) | 2,902 (8.5%) |
| 65 to 74 Years | 22,318 (99.0%) | 221 (1.0%) |
| 75 Years and older | 11,186 (99.3%) | 82 (0.7%) |
| Total | 249,123 (89.5%) | 29,277 (10.5%) |
Health Insurance Coverage by Citizenship Status in Anchorage
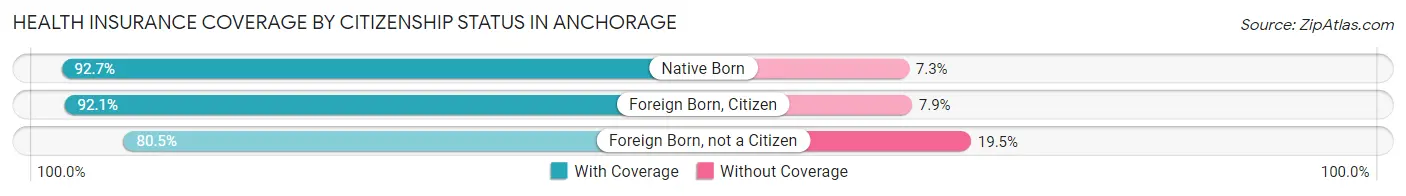
| Citizenship Status | With Coverage | Without Coverage |
| Native Born | 21,722 (92.7%) | 1,707 (7.3%) |
| Foreign Born, Citizen | 45,663 (92.1%) | 3,906 (7.9%) |
| Foreign Born, not a Citizen | 20,641 (80.5%) | 4,990 (19.5%) |
Health Insurance Coverage by Household Income in Anchorage
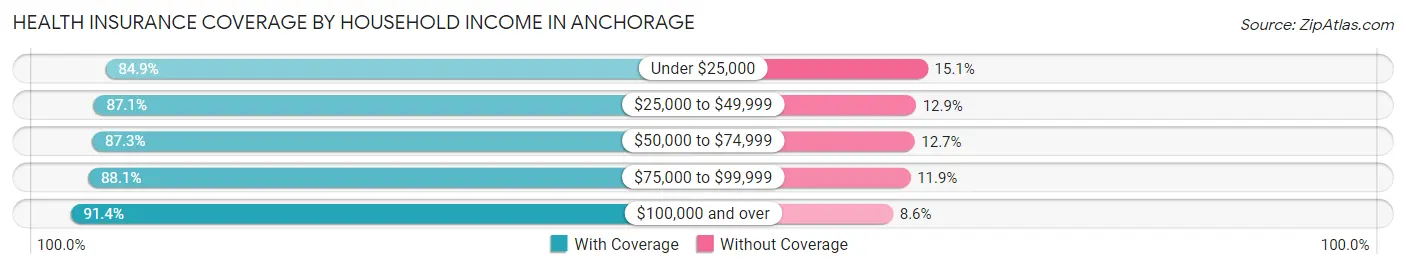
| Household Income | With Coverage | Without Coverage |
| Under $25,000 | 15,601 (84.9%) | 2,784 (15.1%) |
| $25,000 to $49,999 | 25,718 (87.1%) | 3,813 (12.9%) |
| $50,000 to $74,999 | 29,923 (87.3%) | 4,339 (12.7%) |
| $75,000 to $99,999 | 35,051 (88.1%) | 4,725 (11.9%) |
| $100,000 and over | 140,850 (91.4%) | 13,294 (8.6%) |
Public vs Private Health Insurance Coverage by Age in Anchorage
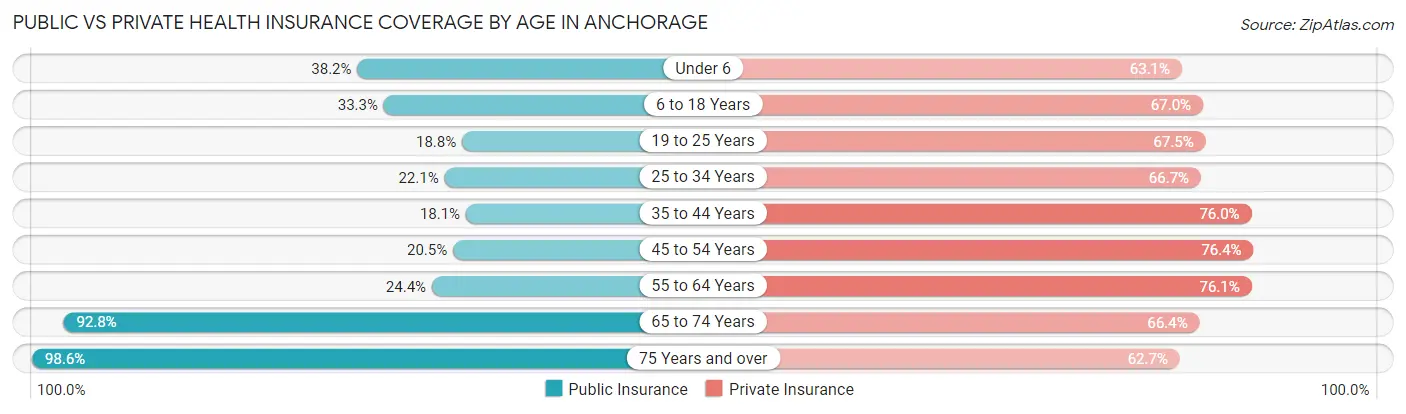
| Age Bracket | Public Insurance | Private Insurance |
| Under 6 | 8,957 (38.2%) | 14,787 (63.1%) |
| 6 to 18 Years | 16,520 (33.3%) | 33,220 (67.0%) |
| 19 to 25 Years | 4,821 (18.8%) | 17,307 (67.5%) |
| 25 to 34 Years | 8,851 (22.1%) | 26,740 (66.6%) |
| 35 to 44 Years | 6,899 (18.1%) | 29,014 (76.0%) |
| 45 to 54 Years | 6,870 (20.5%) | 25,623 (76.4%) |
| 55 to 64 Years | 8,331 (24.4%) | 25,969 (76.1%) |
| 65 to 74 Years | 20,911 (92.8%) | 14,963 (66.4%) |
| 75 Years and over | 11,115 (98.6%) | 7,067 (62.7%) |
| Total | 93,275 (33.5%) | 194,690 (69.9%) |
Disability Status by Sex by Age in Anchorage
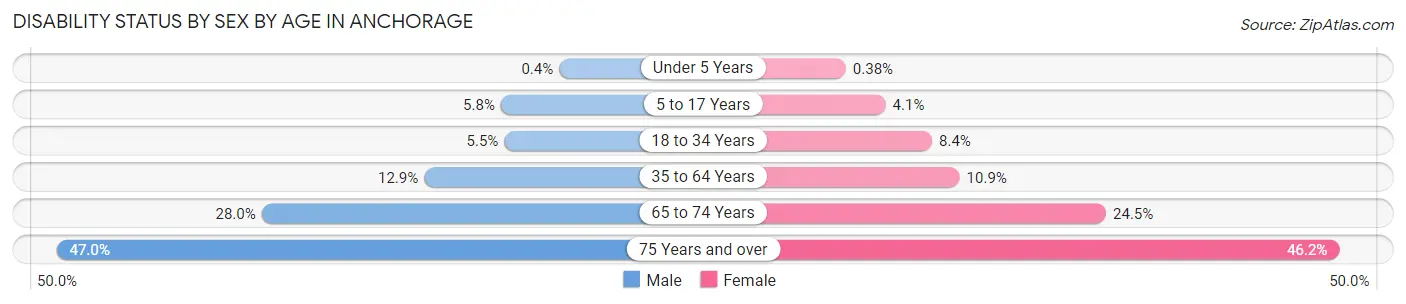
| Age Bracket | Male | Female |
| Under 5 Years | 39 (0.4%) | 36 (0.4%) |
| 5 to 17 Years | 1,481 (5.8%) | 989 (4.1%) |
| 18 to 34 Years | 1,916 (5.5%) | 2,903 (8.4%) |
| 35 to 64 Years | 6,860 (12.9%) | 5,773 (10.9%) |
| 65 to 74 Years | 3,126 (28.0%) | 2,791 (24.5%) |
| 75 Years and over | 2,356 (47.0%) | 2,889 (46.2%) |
Disability Class by Sex by Age in Anchorage
Disability Class: Hearing Difficulty
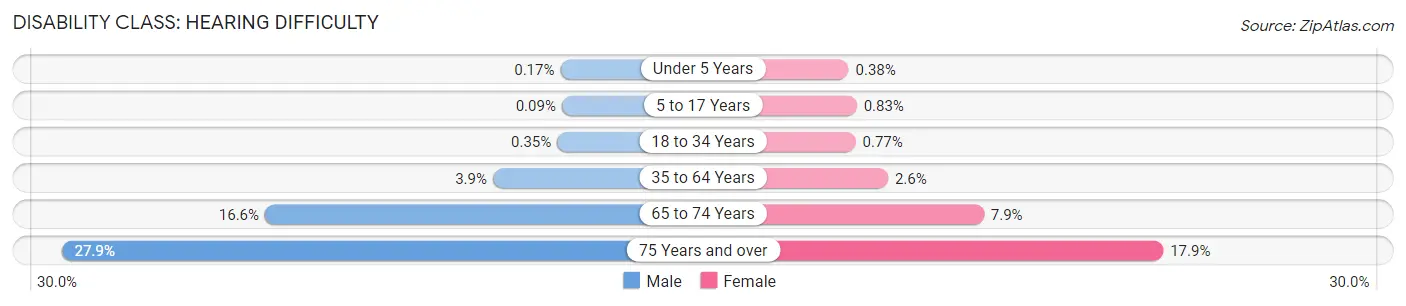
| Age Bracket | Male | Female |
| Under 5 Years | 17 (0.2%) | 36 (0.4%) |
| 5 to 17 Years | 23 (0.1%) | 202 (0.8%) |
| 18 to 34 Years | 121 (0.4%) | 266 (0.8%) |
| 35 to 64 Years | 2,086 (3.9%) | 1,354 (2.6%) |
| 65 to 74 Years | 1,855 (16.6%) | 900 (7.9%) |
| 75 Years and over | 1,400 (27.9%) | 1,120 (17.9%) |
Disability Class: Vision Difficulty
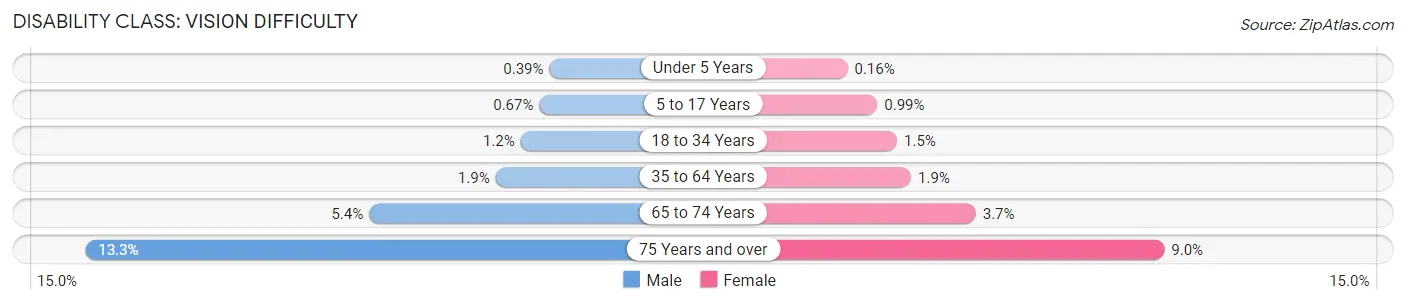
| Age Bracket | Male | Female |
| Under 5 Years | 38 (0.4%) | 15 (0.2%) |
| 5 to 17 Years | 171 (0.7%) | 242 (1.0%) |
| 18 to 34 Years | 416 (1.2%) | 534 (1.5%) |
| 35 to 64 Years | 1,003 (1.9%) | 1,020 (1.9%) |
| 65 to 74 Years | 604 (5.4%) | 424 (3.7%) |
| 75 Years and over | 667 (13.3%) | 562 (9.0%) |
Disability Class: Cognitive Difficulty
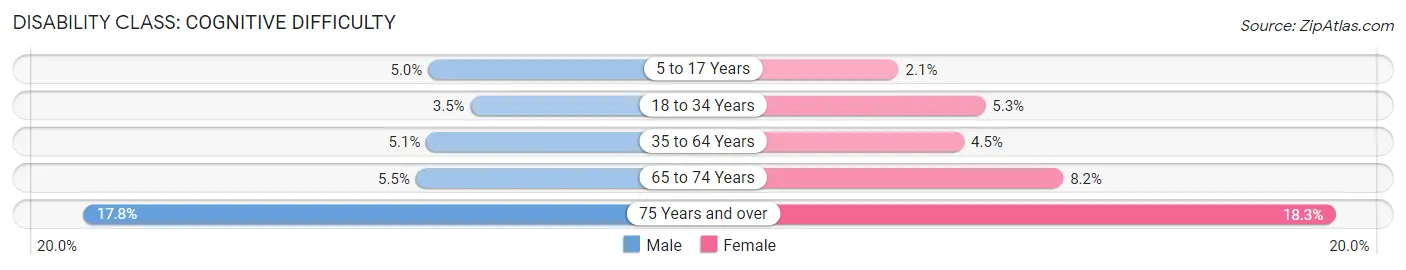
| Age Bracket | Male | Female |
| 5 to 17 Years | 1,279 (5.0%) | 513 (2.1%) |
| 18 to 34 Years | 1,204 (3.5%) | 1,847 (5.3%) |
| 35 to 64 Years | 2,698 (5.1%) | 2,395 (4.5%) |
| 65 to 74 Years | 612 (5.5%) | 936 (8.2%) |
| 75 Years and over | 892 (17.8%) | 1,146 (18.3%) |
Disability Class: Ambulatory Difficulty
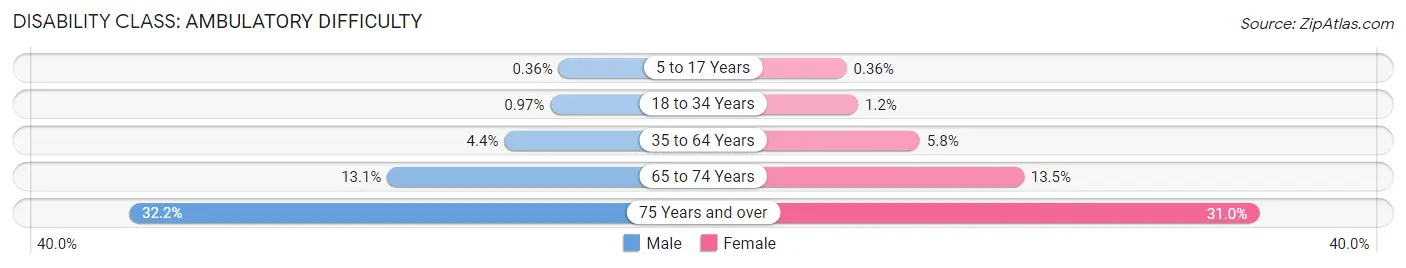
| Age Bracket | Male | Female |
| 5 to 17 Years | 91 (0.4%) | 87 (0.4%) |
| 18 to 34 Years | 338 (1.0%) | 420 (1.2%) |
| 35 to 64 Years | 2,327 (4.4%) | 3,060 (5.8%) |
| 65 to 74 Years | 1,460 (13.1%) | 1,538 (13.5%) |
| 75 Years and over | 1,615 (32.2%) | 1,939 (31.0%) |
Disability Class: Self-Care Difficulty
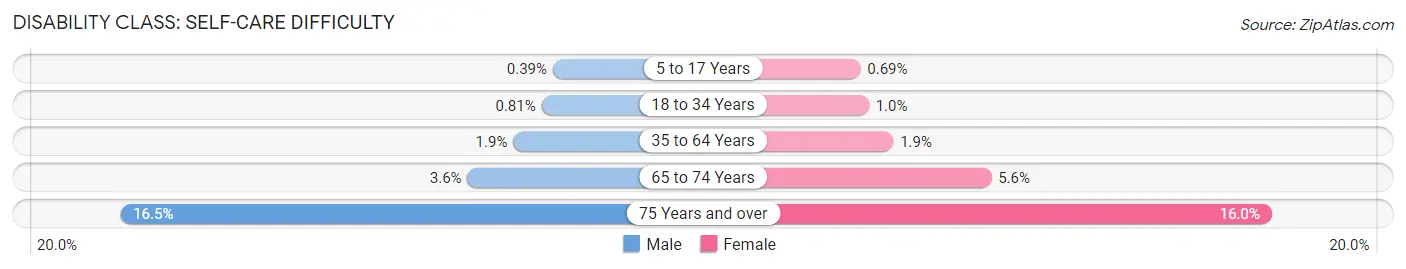
| Age Bracket | Male | Female |
| 5 to 17 Years | 99 (0.4%) | 167 (0.7%) |
| 18 to 34 Years | 282 (0.8%) | 348 (1.0%) |
| 35 to 64 Years | 989 (1.9%) | 1,007 (1.9%) |
| 65 to 74 Years | 397 (3.6%) | 632 (5.6%) |
| 75 Years and over | 824 (16.5%) | 999 (16.0%) |
Technology Access in Anchorage
Computing Device Access in Anchorage
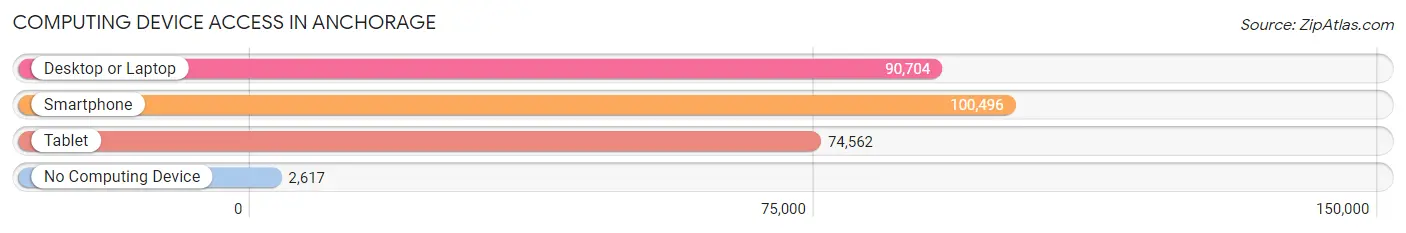
| Device Type | # Households | % Households |
| Desktop or Laptop | 90,704 | 84.7% |
| Smartphone | 100,496 | 93.8% |
| Tablet | 74,562 | 69.6% |
| No Computing Device | 2,617 | 2.4% |
| Total | 107,134 | 100.0% |
Internet Access in Anchorage
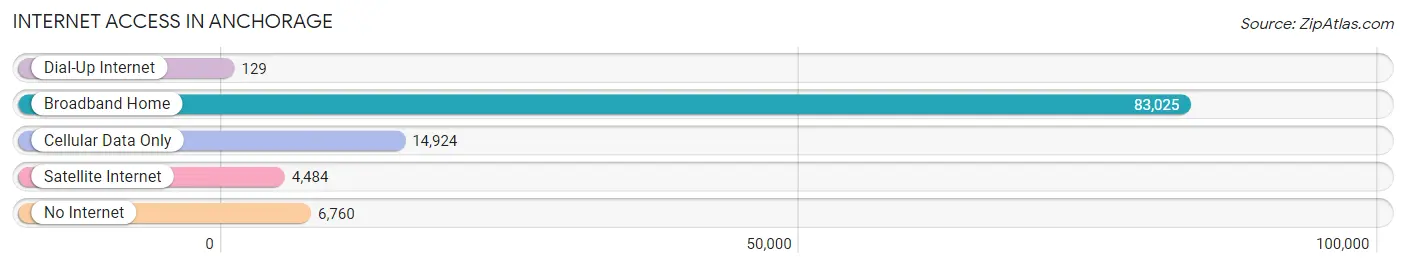
| Internet Type | # Households | % Households |
| Dial-Up Internet | 129 | 0.1% |
| Broadband Home | 83,025 | 77.5% |
| Cellular Data Only | 14,924 | 13.9% |
| Satellite Internet | 4,484 | 4.2% |
| No Internet | 6,760 | 6.3% |
| Total | 107,134 | 100.0% |
Anchorage Summary
Anchorage, Alaska is the largest city in the state and the most populous city in the United States north of the 60th parallel. It is located in the south-central portion of the state on the Cook Inlet, with the Chugach Mountains to the east and the Aleutian Range to the west. Anchorage is a major port and transportation hub for the state, and is home to the University of Alaska Anchorage and Alaska Pacific University.
History
The area that is now Anchorage was first inhabited by the Dena’ina Athabascan people, who have lived in the region for thousands of years. The first European contact with the area was in 1778, when Captain James Cook of the British Royal Navy sailed into the Cook Inlet. In the late 19th century, the area was explored by gold prospectors, and in 1915, the Alaska Railroad was completed, connecting Anchorage to the rest of the state.
In 1920, Anchorage was officially incorporated as a city, and in 1924, the first mayor was elected. During World War II, Anchorage was a major staging area for the U.S. military, and in 1964, the city was devastated by the Good Friday Earthquake, which caused extensive damage and killed 115 people.
Geography
Anchorage is located in south-central Alaska, on the Cook Inlet of the Gulf of Alaska. It is bordered by the Chugach Mountains to the east and the Aleutian Range to the west. The city is situated on a coastal plain, with the Knik and Turnagain Arms of the Cook Inlet to the north and south, respectively.
The city has a total area of 1,961.1 square miles, of which 1,927.2 square miles is land and 33.9 square miles is water. The climate is subarctic, with cold, dry winters and mild, wet summers.
Economy
Anchorage’s economy is largely based on the oil and gas industry, which accounts for about one-third of the city’s total economic output. Other major industries include tourism, transportation, and government services.
The Port of Anchorage is the largest port in Alaska and the second-largest port on the West Coast of the United States. It is a major hub for cargo and passenger ships, and is home to the Alaska Railroad.
Demographics
As of the 2010 census, Anchorage had a population of 291,826, making it the most populous city in Alaska and the 49th most populous city in the United States. The city is racially and ethnically diverse, with the largest racial/ethnic groups being White (63.2%), Native American (14.2%), Asian (7.2%), and African American (4.2%).
The median household income in Anchorage is $76,837, and the median home value is $310,000. The city has a poverty rate of 11.2%, and the unemployment rate is 5.2%.
Anchorage is served by the Anchorage School District, which includes more than 80 public schools. The city is also home to the University of Alaska Anchorage and Alaska Pacific University.
Common Questions
What is Per Capita Income in Anchorage?
Per Capita income in Anchorage is $46,554.
What is the Median Family Income in Anchorage?
Median Family Income in Anchorage is $115,272.
What is the Median Household income in Anchorage?
Median Household Income in Anchorage is $95,731.
What is Income or Wage Gap in Anchorage?
Income or Wage Gap in Anchorage is 20.9%.
Women in Anchorage earn 79.1 cents for every dollar earned by a man.
What is Family Income Deficit in Anchorage?
Family Income Deficit in Anchorage is $10,129.
Families that are below poverty line in Anchorage earn $10,129 less on average than the poverty threshold level.
What is Inequality or Gini Index in Anchorage?
Inequality or Gini Index in Anchorage is 0.43.
What is the Total Population of Anchorage?
Total Population of Anchorage is 290,674.
What is the Total Male Population of Anchorage?
Total Male Population of Anchorage is 149,144.
What is the Total Female Population of Anchorage?
Total Female Population of Anchorage is 141,530.
What is the Ratio of Males per 100 Females in Anchorage?
There are 105.38 Males per 100 Females in Anchorage.
What is the Ratio of Females per 100 Males in Anchorage?
There are 94.89 Females per 100 Males in Anchorage.
What is the Median Population Age in Anchorage?
Median Population Age in Anchorage is 34.5 Years.
What is the Average Family Size in Anchorage
Average Family Size in Anchorage is 3.3 People.
What is the Average Household Size in Anchorage
Average Household Size in Anchorage is 2.6 People.
How Large is the Labor Force in Anchorage?
There are 159,630 People in the Labor Forcein in Anchorage.
What is the Percentage of People in the Labor Force in Anchorage?
69.9% of People are in the Labor Force in Anchorage.
What is the Unemployment Rate in Anchorage?
Unemployment Rate in Anchorage is 5.2%.