Darien, IL Map & Demographics
Darien Map
Darien Overview
$55,911
PER CAPITA INCOME
$123,518
AVG FAMILY INCOME
$110,546
AVG HOUSEHOLD INCOME
35.0%
WAGE / INCOME GAP [ % ]
65.0¢/ $1
WAGE / INCOME GAP [ $ ]
0.42
INEQUALITY / GINI INDEX
21,953
TOTAL POPULATION
10,821
MALE POPULATION
11,132
FEMALE POPULATION
97.21
MALES / 100 FEMALES
102.87
FEMALES / 100 MALES
45.0
MEDIAN AGE
2.9
AVG FAMILY SIZE
2.5
AVG HOUSEHOLD SIZE
12,361
LABOR FORCE [ PEOPLE ]
67.0%
PERCENT IN LABOR FORCE
4.1%
UNEMPLOYMENT RATE
Darien Zip Codes
Darien Area Codes
Income in Darien
Income Overview in Darien
Per Capita Income in Darien is $55,911, while median incomes of families and households are $123,518 and $110,546 respectively.
| Characteristic | Number | Measure |
| Per Capita Income | 21,953 | $55,911 |
| Median Family Income | 6,353 | $123,518 |
| Mean Family Income | 6,353 | $158,142 |
| Median Household Income | 8,903 | $110,546 |
| Mean Household Income | 8,903 | $137,890 |
| Income Deficit | 6,353 | $0 |
| Wage / Income Gap (%) | 21,953 | 34.99% |
| Wage / Income Gap ($) | 21,953 | 65.01¢ per $1 |
| Gini / Inequality Index | 21,953 | 0.42 |
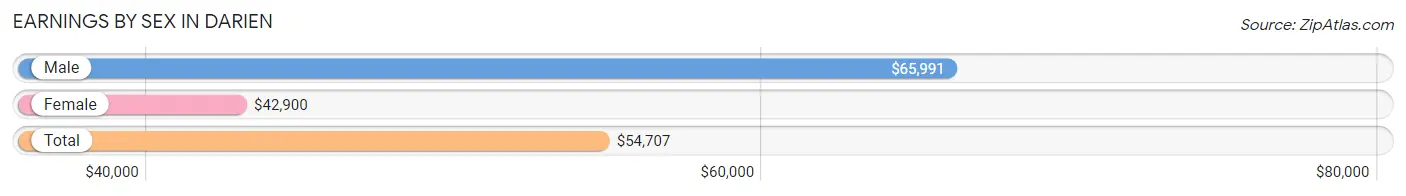
Earnings by Sex in Darien
Average Earnings in Darien are $54,707, $65,991 for men and $42,900 for women, a difference of 35.0%.
| Sex | Number | Average Earnings |
| Male | 6,830 (53.7%) | $65,991 |
| Female | 5,878 (46.3%) | $42,900 |
| Total | 12,708 (100.0%) | $54,707 |
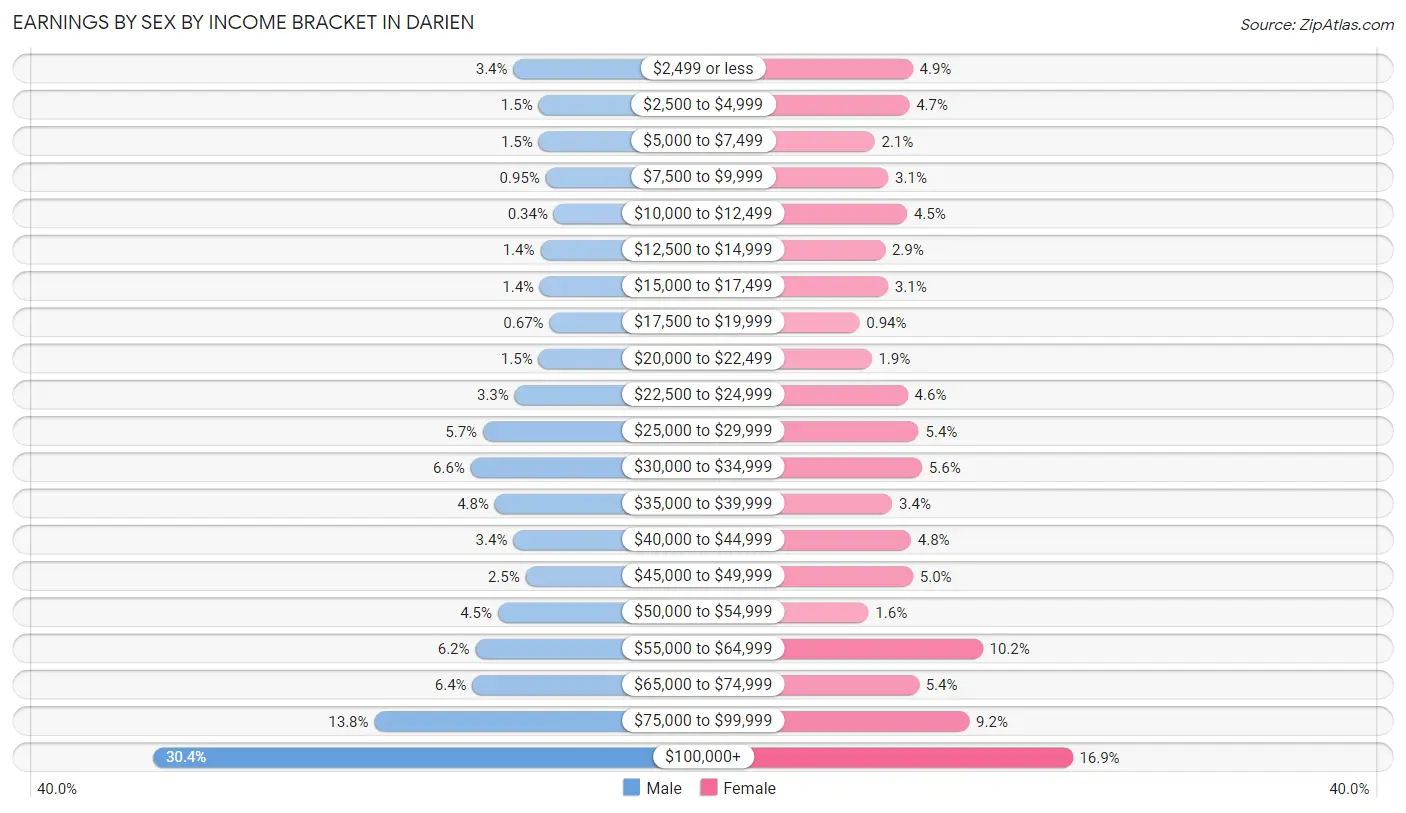
Earnings by Sex by Income Bracket in Darien
The most common earnings brackets in Darien are $100,000+ for men (2,075 | 30.4%) and $100,000+ for women (994 | 16.9%).
| Income | Male | Female |
| $2,499 or less | 230 (3.4%) | 290 (4.9%) |
| $2,500 to $4,999 | 102 (1.5%) | 275 (4.7%) |
| $5,000 to $7,499 | 101 (1.5%) | 122 (2.1%) |
| $7,500 to $9,999 | 65 (0.9%) | 182 (3.1%) |
| $10,000 to $12,499 | 23 (0.3%) | 265 (4.5%) |
| $12,500 to $14,999 | 92 (1.3%) | 168 (2.9%) |
| $15,000 to $17,499 | 94 (1.4%) | 181 (3.1%) |
| $17,500 to $19,999 | 46 (0.7%) | 55 (0.9%) |
| $20,000 to $22,499 | 102 (1.5%) | 109 (1.8%) |
| $22,500 to $24,999 | 224 (3.3%) | 268 (4.6%) |
| $25,000 to $29,999 | 386 (5.7%) | 316 (5.4%) |
| $30,000 to $34,999 | 449 (6.6%) | 331 (5.6%) |
| $35,000 to $39,999 | 325 (4.8%) | 200 (3.4%) |
| $40,000 to $44,999 | 231 (3.4%) | 282 (4.8%) |
| $45,000 to $49,999 | 168 (2.5%) | 291 (5.0%) |
| $50,000 to $54,999 | 310 (4.5%) | 95 (1.6%) |
| $55,000 to $64,999 | 425 (6.2%) | 598 (10.2%) |
| $65,000 to $74,999 | 440 (6.4%) | 317 (5.4%) |
| $75,000 to $99,999 | 942 (13.8%) | 539 (9.2%) |
| $100,000+ | 2,075 (30.4%) | 994 (16.9%) |
| Total | 6,830 (100.0%) | 5,878 (100.0%) |
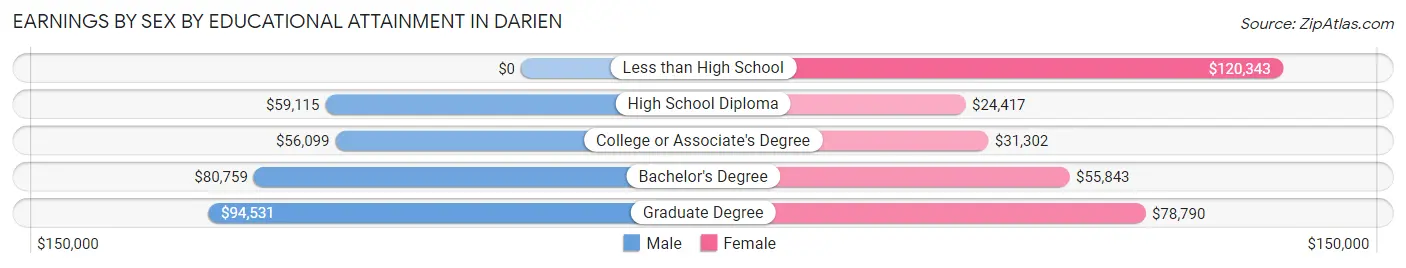
Earnings by Sex by Educational Attainment in Darien
Average earnings in Darien are $72,553 for men and $47,093 for women, a difference of 35.1%. Men with an educational attainment of graduate degree enjoy the highest average annual earnings of $94,531, while those with college or associate's degree education earn the least with $56,099. Women with an educational attainment of less than high school earn the most with the average annual earnings of $120,343, while those with high school diploma education have the smallest earnings of $24,417.
| Educational Attainment | Male Income | Female Income |
| Less than High School | - | - |
| High School Diploma | $59,115 | $24,417 |
| College or Associate's Degree | $56,099 | $31,302 |
| Bachelor's Degree | $80,759 | $55,843 |
| Graduate Degree | $94,531 | $78,790 |
| Total | $72,553 | $47,093 |
Family Income in Darien
Family Income Brackets in Darien
According to the Darien family income data, there are 1,601 families falling into the $200,000+ income range, which is the most common income bracket and makes up 25.2% of all families. Conversely, the $10,000 to $14,999 income bracket is the least frequent group with only 6 families (0.1%) belonging to this category.
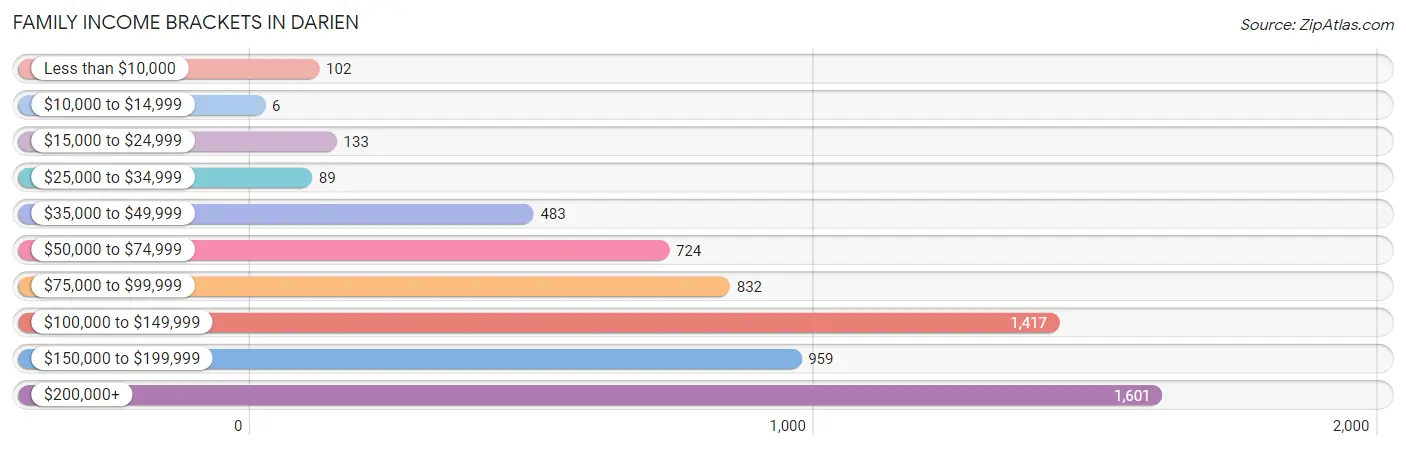
| Income Bracket | # Families | % Families |
| Less than $10,000 | 102 | 1.6% |
| $10,000 to $14,999 | 6 | 0.1% |
| $15,000 to $24,999 | 133 | 2.1% |
| $25,000 to $34,999 | 89 | 1.4% |
| $35,000 to $49,999 | 483 | 7.6% |
| $50,000 to $74,999 | 724 | 11.4% |
| $75,000 to $99,999 | 832 | 13.1% |
| $100,000 to $149,999 | 1,417 | 22.3% |
| $150,000 to $199,999 | 959 | 15.1% |
| $200,000+ | 1,601 | 25.2% |
Family Income by Famaliy Size in Darien
6-person families (111 | 1.8%) account for the highest median family income in Darien with $250,001 per family, while 2-person families (2,956 | 46.5%) have the highest median income of $51,418 per family member.
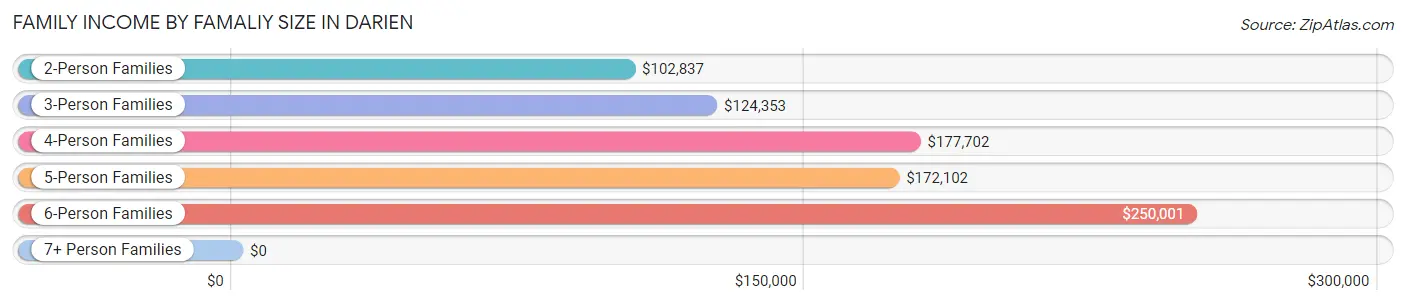
| Income Bracket | # Families | Median Income |
| 2-Person Families | 2,956 (46.5%) | $102,837 |
| 3-Person Families | 1,485 (23.4%) | $124,353 |
| 4-Person Families | 1,284 (20.2%) | $177,702 |
| 5-Person Families | 517 (8.1%) | $172,102 |
| 6-Person Families | 111 (1.8%) | $250,001 |
| 7+ Person Families | 0 (0.0%) | $0 |
| Total | 6,353 (100.0%) | $123,518 |
Family Income by Number of Earners in Darien
The median family income in Darien is $123,518, with families comprising 3+ earners (990) having the highest median family income of $216,776, while families with no earners (1,049) have the lowest median family income of $85,667, accounting for 15.6% and 16.5% of families, respectively.
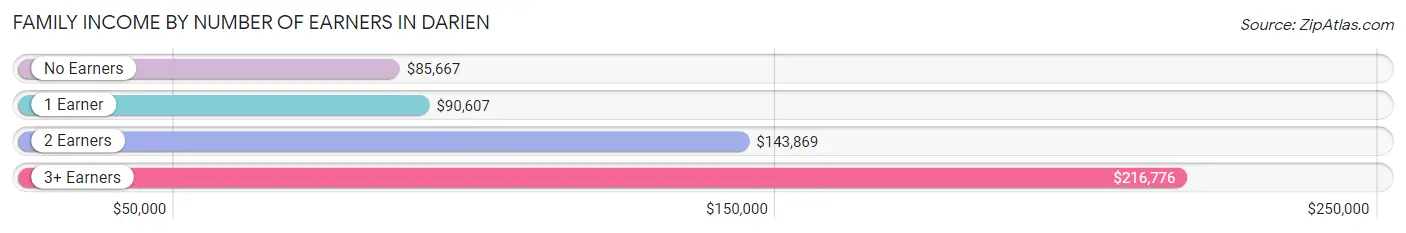
| Number of Earners | # Families | Median Income |
| No Earners | 1,049 (16.5%) | $85,667 |
| 1 Earner | 1,599 (25.2%) | $90,607 |
| 2 Earners | 2,715 (42.7%) | $143,869 |
| 3+ Earners | 990 (15.6%) | $216,776 |
| Total | 6,353 (100.0%) | $123,518 |
Household Income in Darien
Household Income Brackets in Darien
With 2,137 households falling in the category, the $100,000 to $149,999 income range is the most frequent in Darien, accounting for 24.0% of all households. In contrast, only 89 households (1.0%) fall into the $10,000 to $14,999 income bracket, making it the least populous group.
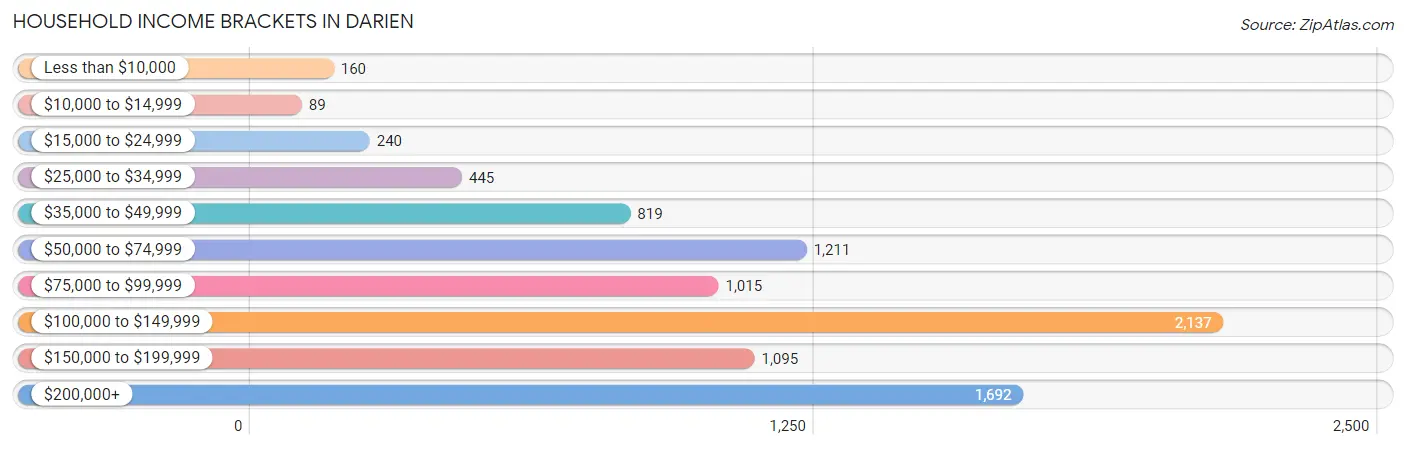
| Income Bracket | # Households | % Households |
| Less than $10,000 | 160 | 1.8% |
| $10,000 to $14,999 | 89 | 1.0% |
| $15,000 to $24,999 | 240 | 2.7% |
| $25,000 to $34,999 | 445 | 5.0% |
| $35,000 to $49,999 | 819 | 9.2% |
| $50,000 to $74,999 | 1,211 | 13.6% |
| $75,000 to $99,999 | 1,015 | 11.4% |
| $100,000 to $149,999 | 2,137 | 24.0% |
| $150,000 to $199,999 | 1,095 | 12.3% |
| $200,000+ | 1,692 | 19.0% |
Household Income by Householder Age in Darien
The median household income in Darien is $110,546, with the highest median household income of $120,383 found in the 25 to 44 years age bracket for the primary householder. A total of 2,163 households (24.3%) fall into this category. Meanwhile, the 65+ years age bracket for the primary householder has the lowest median household income of $88,182, with 3,280 households (36.8%) in this group.
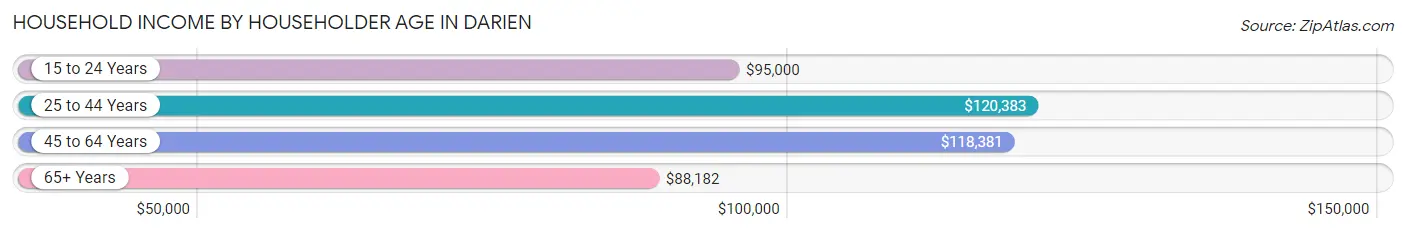
| Income Bracket | # Households | Median Income |
| 15 to 24 Years | 216 (2.4%) | $95,000 |
| 25 to 44 Years | 2,163 (24.3%) | $120,383 |
| 45 to 64 Years | 3,244 (36.4%) | $118,381 |
| 65+ Years | 3,280 (36.8%) | $88,182 |
| Total | 8,903 (100.0%) | $110,546 |
Poverty in Darien
Income Below Poverty by Sex and Age in Darien
With 3.2% poverty level for males and 3.7% for females among the residents of Darien, 6 to 11 year old males and 15 year old females are the most vulnerable to poverty, with 74 males (9.8%) and 17 females (14.3%) in their respective age groups living below the poverty level.
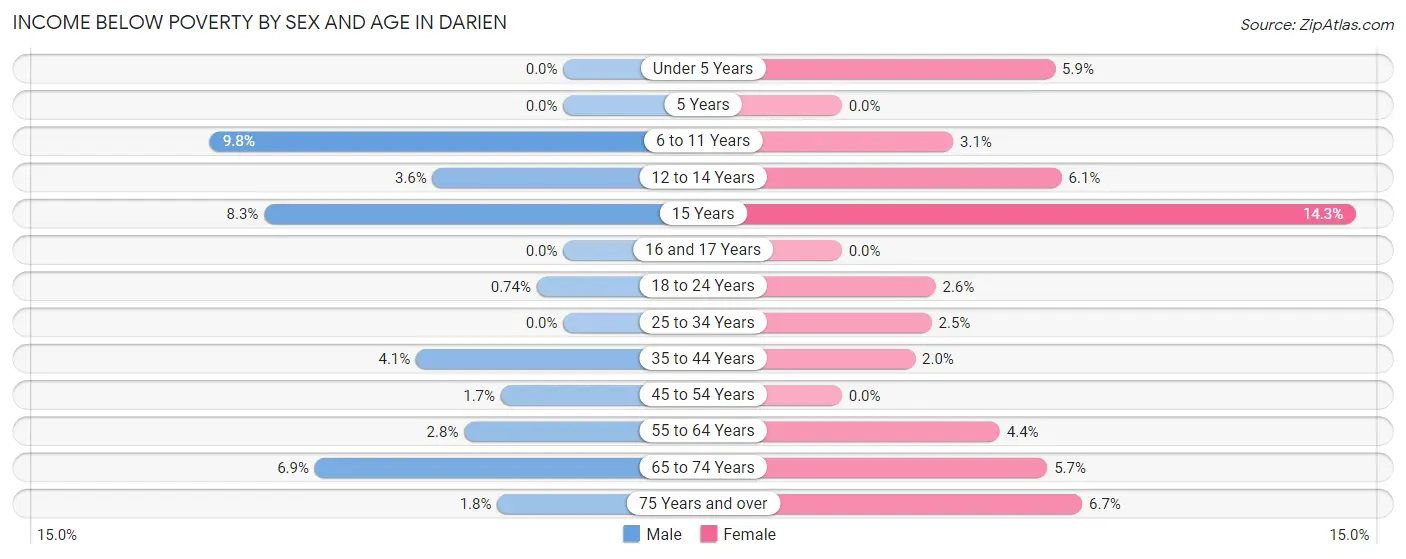
| Age Bracket | Male | Female |
| Under 5 Years | 0 (0.0%) | 32 (5.9%) |
| 5 Years | 0 (0.0%) | 0 (0.0%) |
| 6 to 11 Years | 74 (9.8%) | 21 (3.1%) |
| 12 to 14 Years | 10 (3.6%) | 23 (6.1%) |
| 15 Years | 10 (8.3%) | 17 (14.3%) |
| 16 and 17 Years | 0 (0.0%) | 0 (0.0%) |
| 18 to 24 Years | 6 (0.7%) | 20 (2.6%) |
| 25 to 34 Years | 0 (0.0%) | 31 (2.5%) |
| 35 to 44 Years | 58 (4.1%) | 28 (2.0%) |
| 45 to 54 Years | 22 (1.7%) | 0 (0.0%) |
| 55 to 64 Years | 45 (2.8%) | 72 (4.4%) |
| 65 to 74 Years | 97 (6.9%) | 98 (5.7%) |
| 75 Years and over | 19 (1.8%) | 68 (6.7%) |
| Total | 341 (3.2%) | 410 (3.7%) |
Income Above Poverty by Sex and Age in Darien
According to the poverty statistics in Darien, males aged under 5 years and females aged 5 years are the age groups that are most secure financially, with 100.0% of males and 100.0% of females in these age groups living above the poverty line.
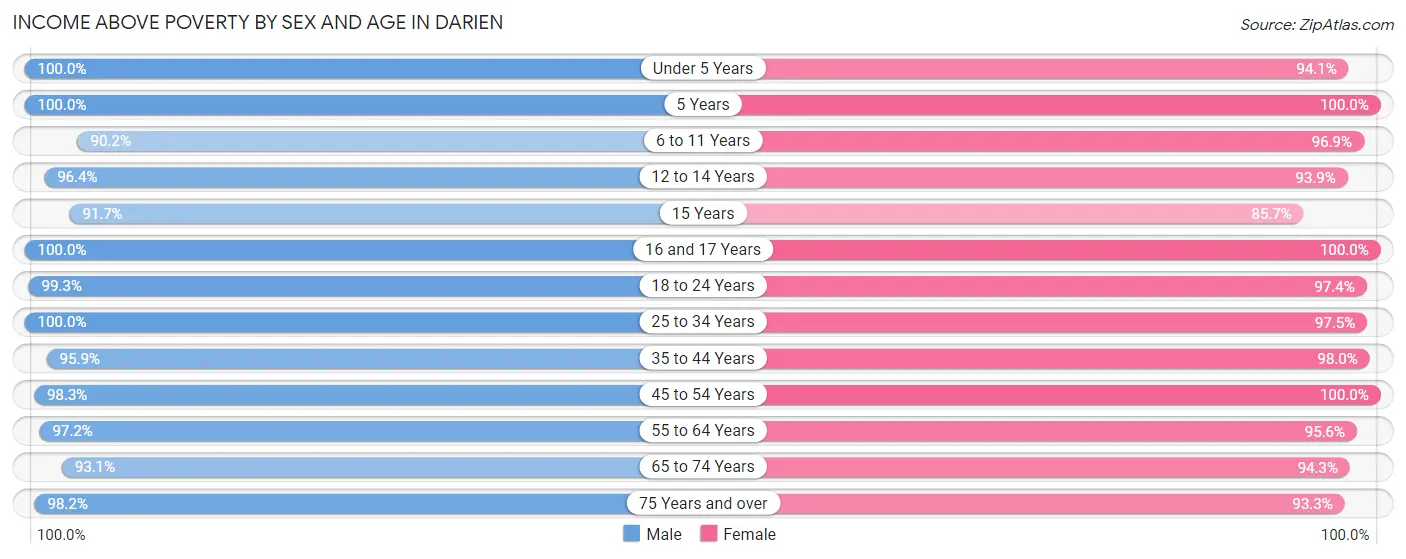
| Age Bracket | Male | Female |
| Under 5 Years | 295 (100.0%) | 507 (94.1%) |
| 5 Years | 111 (100.0%) | 193 (100.0%) |
| 6 to 11 Years | 678 (90.2%) | 657 (96.9%) |
| 12 to 14 Years | 265 (96.4%) | 353 (93.9%) |
| 15 Years | 110 (91.7%) | 102 (85.7%) |
| 16 and 17 Years | 166 (100.0%) | 211 (100.0%) |
| 18 to 24 Years | 808 (99.3%) | 747 (97.4%) |
| 25 to 34 Years | 1,499 (100.0%) | 1,209 (97.5%) |
| 35 to 44 Years | 1,358 (95.9%) | 1,343 (98.0%) |
| 45 to 54 Years | 1,241 (98.3%) | 1,272 (100.0%) |
| 55 to 64 Years | 1,587 (97.2%) | 1,564 (95.6%) |
| 65 to 74 Years | 1,304 (93.1%) | 1,616 (94.3%) |
| 75 Years and over | 1,012 (98.2%) | 948 (93.3%) |
| Total | 10,434 (96.8%) | 10,722 (96.3%) |
Income Below Poverty Among Married-Couple Families in Darien
The poverty statistics for married-couple families in Darien show that 1.9% or 95 of the total 4,989 families live below the poverty line. Families with no children have the highest poverty rate of 2.4%, comprising of 80 families. On the other hand, families with 3 or 4 children have the lowest poverty rate of 0.0%, which includes 0 families.
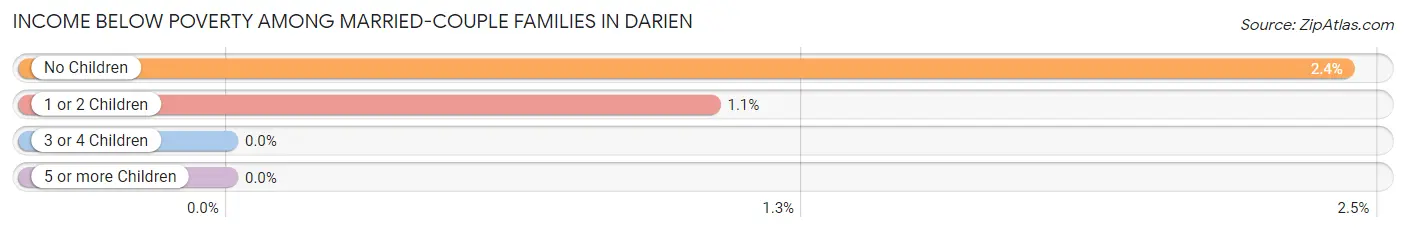
| Children | Above Poverty | Below Poverty |
| No Children | 3,207 (97.6%) | 80 (2.4%) |
| 1 or 2 Children | 1,414 (99.0%) | 15 (1.1%) |
| 3 or 4 Children | 273 (100.0%) | 0 (0.0%) |
| 5 or more Children | 0 (0.0%) | 0 (0.0%) |
| Total | 4,894 (98.1%) | 95 (1.9%) |
Income Below Poverty Among Single-Parent Households in Darien
According to the poverty data in Darien, 12.7% or 68 single-father households and 2.8% or 23 single-mother households are living below the poverty line. Among single-father households, those with 3 or 4 children have the highest poverty rate, with 29 households (72.5%) experiencing poverty. Likewise, among single-mother households, those with 1 or 2 children have the highest poverty rate, with 20 households (5.7%) falling below the poverty line.
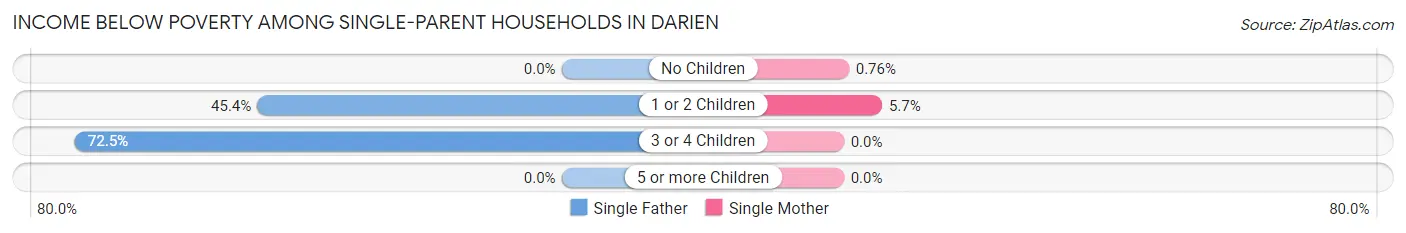
| Children | Single Father | Single Mother |
| No Children | 0 (0.0%) | 3 (0.8%) |
| 1 or 2 Children | 39 (45.4%) | 20 (5.7%) |
| 3 or 4 Children | 29 (72.5%) | 0 (0.0%) |
| 5 or more Children | 0 (0.0%) | 0 (0.0%) |
| Total | 68 (12.7%) | 23 (2.8%) |
Income Below Poverty Among Married-Couple vs Single-Parent Households in Darien
The poverty data for Darien shows that 95 of the married-couple family households (1.9%) and 91 of the single-parent households (6.7%) are living below the poverty level. Within the married-couple family households, those with no children have the highest poverty rate, with 80 households (2.4%) falling below the poverty line. Among the single-parent households, those with 3 or 4 children have the highest poverty rate, with 29 household (23.4%) living below poverty.
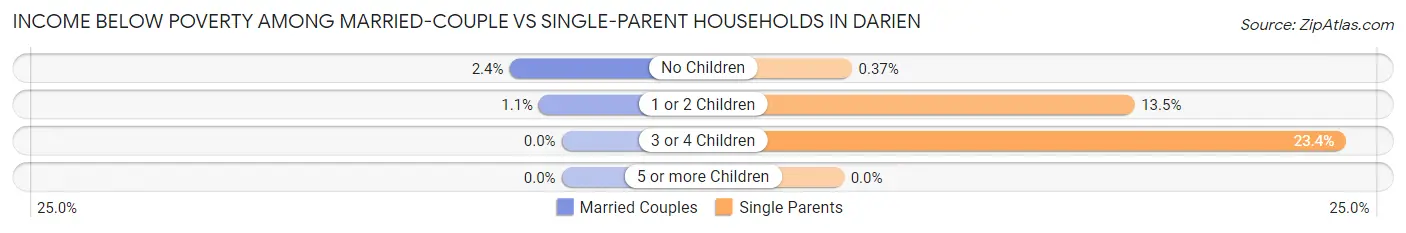
| Children | Married-Couple Families | Single-Parent Households |
| No Children | 80 (2.4%) | 3 (0.4%) |
| 1 or 2 Children | 15 (1.1%) | 59 (13.5%) |
| 3 or 4 Children | 0 (0.0%) | 29 (23.4%) |
| 5 or more Children | 0 (0.0%) | 0 (0.0%) |
| Total | 95 (1.9%) | 91 (6.7%) |
Race in Darien
The most populous races in Darien are White / Caucasian (16,980 | 77.3%), Asian (2,405 | 11.0%), and Hispanic or Latino (1,746 | 8.0%).
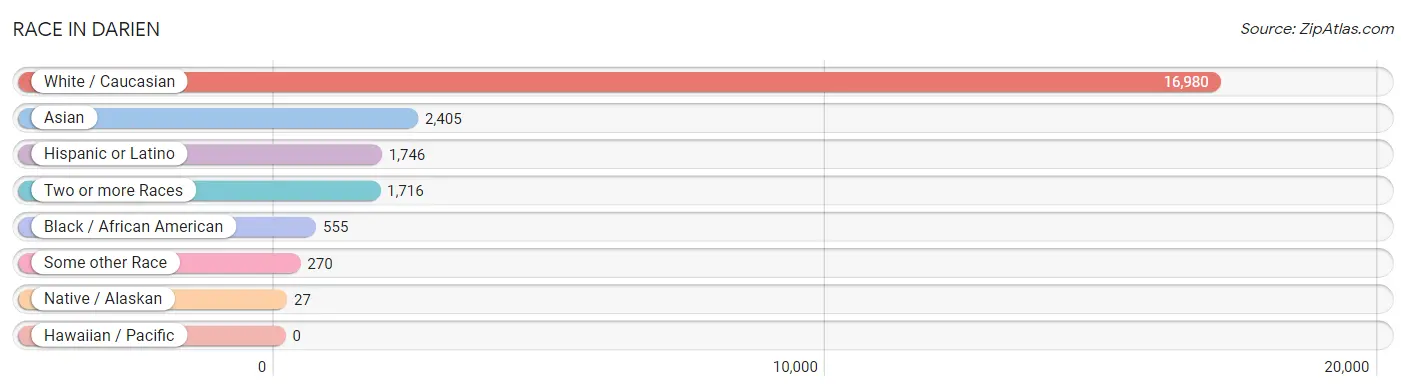
| Race | # Population | % Population |
| Asian | 2,405 | 11.0% |
| Black / African American | 555 | 2.5% |
| Hawaiian / Pacific | 0 | 0.0% |
| Hispanic or Latino | 1,746 | 8.0% |
| Native / Alaskan | 27 | 0.1% |
| White / Caucasian | 16,980 | 77.3% |
| Two or more Races | 1,716 | 7.8% |
| Some other Race | 270 | 1.2% |
| Total | 21,953 | 100.0% |
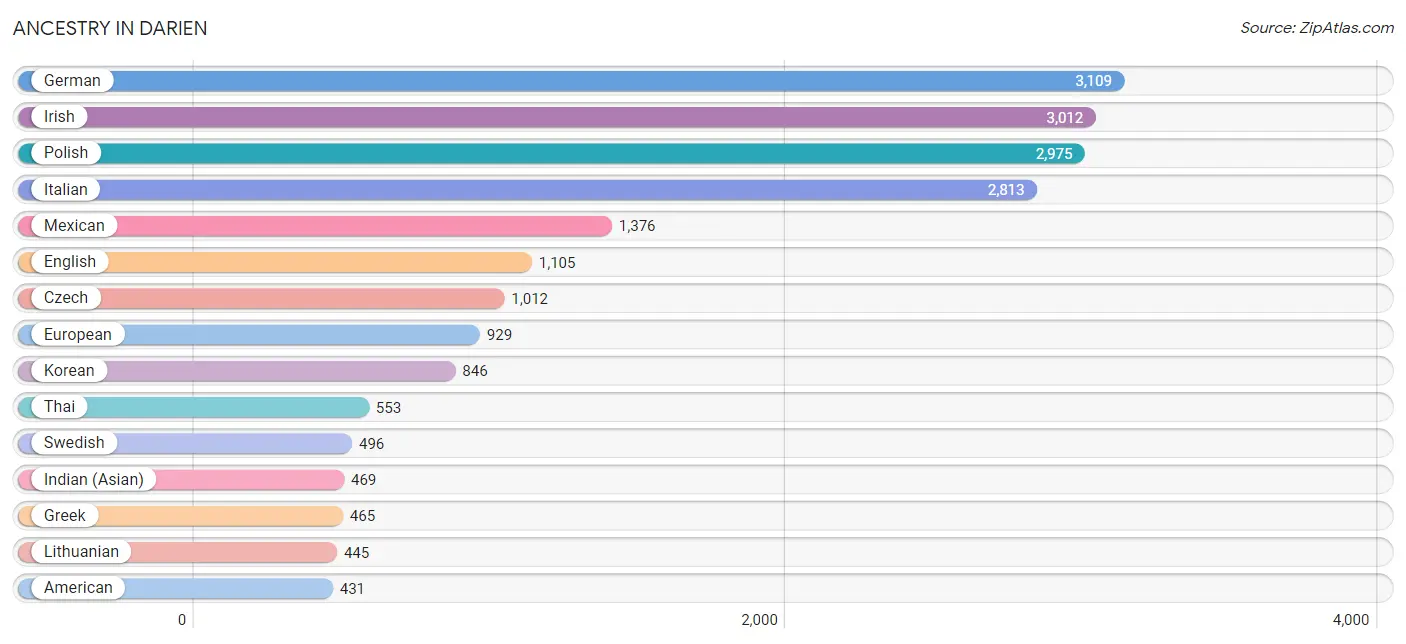
Ancestry in Darien
The most populous ancestries reported in Darien are German (3,109 | 14.2%), Irish (3,012 | 13.7%), Polish (2,975 | 13.6%), Italian (2,813 | 12.8%), and Mexican (1,376 | 6.3%), together accounting for 60.5% of all Darien residents.
| Ancestry | # Population | % Population |
| African | 43 | 0.2% |
| Albanian | 57 | 0.3% |
| American | 431 | 2.0% |
| Arab | 373 | 1.7% |
| Argentinean | 22 | 0.1% |
| Armenian | 20 | 0.1% |
| Austrian | 64 | 0.3% |
| Belgian | 8 | 0.0% |
| Bhutanese | 66 | 0.3% |
| Bolivian | 19 | 0.1% |
| British | 65 | 0.3% |
| Bulgarian | 94 | 0.4% |
| Burmese | 83 | 0.4% |
| Central American | 11 | 0.1% |
| Central American Indian | 27 | 0.1% |
| Cherokee | 17 | 0.1% |
| Colombian | 27 | 0.1% |
| Croatian | 155 | 0.7% |
| Cuban | 7 | 0.0% |
| Czech | 1,012 | 4.6% |
| Czechoslovakian | 42 | 0.2% |
| Danish | 149 | 0.7% |
| Dutch | 310 | 1.4% |
| Eastern European | 60 | 0.3% |
| Egyptian | 218 | 1.0% |
| English | 1,105 | 5.0% |
| European | 929 | 4.2% |
| Filipino | 48 | 0.2% |
| Finnish | 8 | 0.0% |
| French | 241 | 1.1% |
| French American Indian | 3 | 0.0% |
| French Canadian | 98 | 0.4% |
| German | 3,109 | 14.2% |
| Greek | 465 | 2.1% |
| Haitian | 1 | 0.0% |
| Hungarian | 123 | 0.6% |
| Indian (Asian) | 469 | 2.1% |
| Irish | 3,012 | 13.7% |
| Italian | 2,813 | 12.8% |
| Jordanian | 85 | 0.4% |
| Korean | 846 | 3.8% |
| Latvian | 7 | 0.0% |
| Lebanese | 30 | 0.1% |
| Lithuanian | 445 | 2.0% |
| Luxembourger | 23 | 0.1% |
| Macedonian | 196 | 0.9% |
| Malaysian | 7 | 0.0% |
| Mexican | 1,376 | 6.3% |
| Nicaraguan | 11 | 0.1% |
| Northern European | 31 | 0.1% |
| Norwegian | 280 | 1.3% |
| Osage | 4 | 0.0% |
| Pakistani | 76 | 0.4% |
| Polish | 2,975 | 13.6% |
| Portuguese | 7 | 0.0% |
| Puerto Rican | 114 | 0.5% |
| Romanian | 74 | 0.3% |
| Russian | 304 | 1.4% |
| Scandinavian | 15 | 0.1% |
| Scotch-Irish | 51 | 0.2% |
| Scottish | 98 | 0.4% |
| Serbian | 246 | 1.1% |
| Sioux | 42 | 0.2% |
| Slavic | 12 | 0.1% |
| Slovak | 315 | 1.4% |
| Slovene | 31 | 0.1% |
| South American | 68 | 0.3% |
| Spaniard | 156 | 0.7% |
| Spanish | 14 | 0.1% |
| Sri Lankan | 46 | 0.2% |
| Subsaharan African | 43 | 0.2% |
| Swedish | 496 | 2.3% |
| Swiss | 60 | 0.3% |
| Syrian | 59 | 0.3% |
| Thai | 553 | 2.5% |
| Ukrainian | 323 | 1.5% |
| Welsh | 168 | 0.8% |
| Yugoslavian | 35 | 0.2% | View All 78 Rows |
Immigrants in Darien
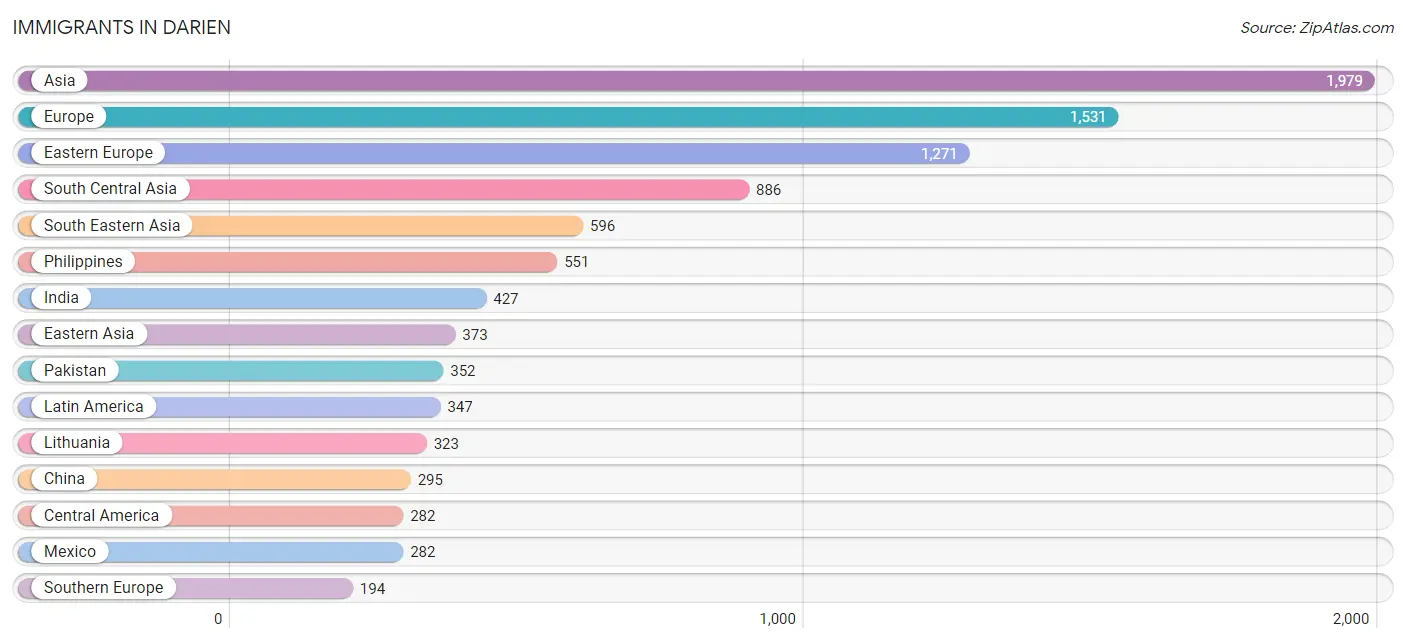
The most numerous immigrant groups reported in Darien came from Asia (1,979 | 9.0%), Europe (1,531 | 7.0%), Eastern Europe (1,271 | 5.8%), South Central Asia (886 | 4.0%), and South Eastern Asia (596 | 2.7%), together accounting for 28.5% of all Darien residents.
| Immigration Origin | # Population | % Population |
| Africa | 139 | 0.6% |
| Albania | 28 | 0.1% |
| Argentina | 8 | 0.0% |
| Asia | 1,979 | 9.0% |
| Australia | 7 | 0.0% |
| Belgium | 8 | 0.0% |
| Bolivia | 19 | 0.1% |
| Bosnia and Herzegovina | 42 | 0.2% |
| Bulgaria | 75 | 0.3% |
| Caribbean | 18 | 0.1% |
| Central America | 282 | 1.3% |
| China | 295 | 1.3% |
| Croatia | 49 | 0.2% |
| Cuba | 7 | 0.0% |
| Czechoslovakia | 135 | 0.6% |
| Eastern Africa | 25 | 0.1% |
| Eastern Asia | 373 | 1.7% |
| Eastern Europe | 1,271 | 5.8% |
| Ecuador | 20 | 0.1% |
| Egypt | 109 | 0.5% |
| England | 10 | 0.1% |
| Europe | 1,531 | 7.0% |
| France | 10 | 0.1% |
| Ghana | 5 | 0.0% |
| Greece | 173 | 0.8% |
| Haiti | 1 | 0.0% |
| Hungary | 7 | 0.0% |
| India | 427 | 1.9% |
| Iran | 20 | 0.1% |
| Iraq | 7 | 0.0% |
| Italy | 21 | 0.1% |
| Japan | 5 | 0.0% |
| Kazakhstan | 31 | 0.1% |
| Kenya | 12 | 0.1% |
| Korea | 73 | 0.3% |
| Latin America | 347 | 1.6% |
| Latvia | 7 | 0.0% |
| Lebanon | 8 | 0.0% |
| Lithuania | 323 | 1.5% |
| Mexico | 282 | 1.3% |
| Moldova | 14 | 0.1% |
| North Macedonia | 125 | 0.6% |
| Northern Africa | 109 | 0.5% |
| Northern Europe | 27 | 0.1% |
| Oceania | 7 | 0.0% |
| Pakistan | 352 | 1.6% |
| Philippines | 551 | 2.5% |
| Poland | 163 | 0.7% |
| Russia | 62 | 0.3% |
| Saudi Arabia | 21 | 0.1% |
| Serbia | 39 | 0.2% |
| South America | 47 | 0.2% |
| South Central Asia | 886 | 4.0% |
| South Eastern Asia | 596 | 2.7% |
| Southern Europe | 194 | 0.9% |
| Sri Lanka | 56 | 0.3% |
| St. Vincent and the Grenadines | 10 | 0.1% |
| Syria | 83 | 0.4% |
| Taiwan | 80 | 0.4% |
| Thailand | 40 | 0.2% |
| Ukraine | 186 | 0.9% |
| Vietnam | 5 | 0.0% |
| Western Africa | 5 | 0.0% |
| Western Asia | 124 | 0.6% |
| Western Europe | 18 | 0.1% | View All 65 Rows |
Sex and Age in Darien
Sex and Age in Darien
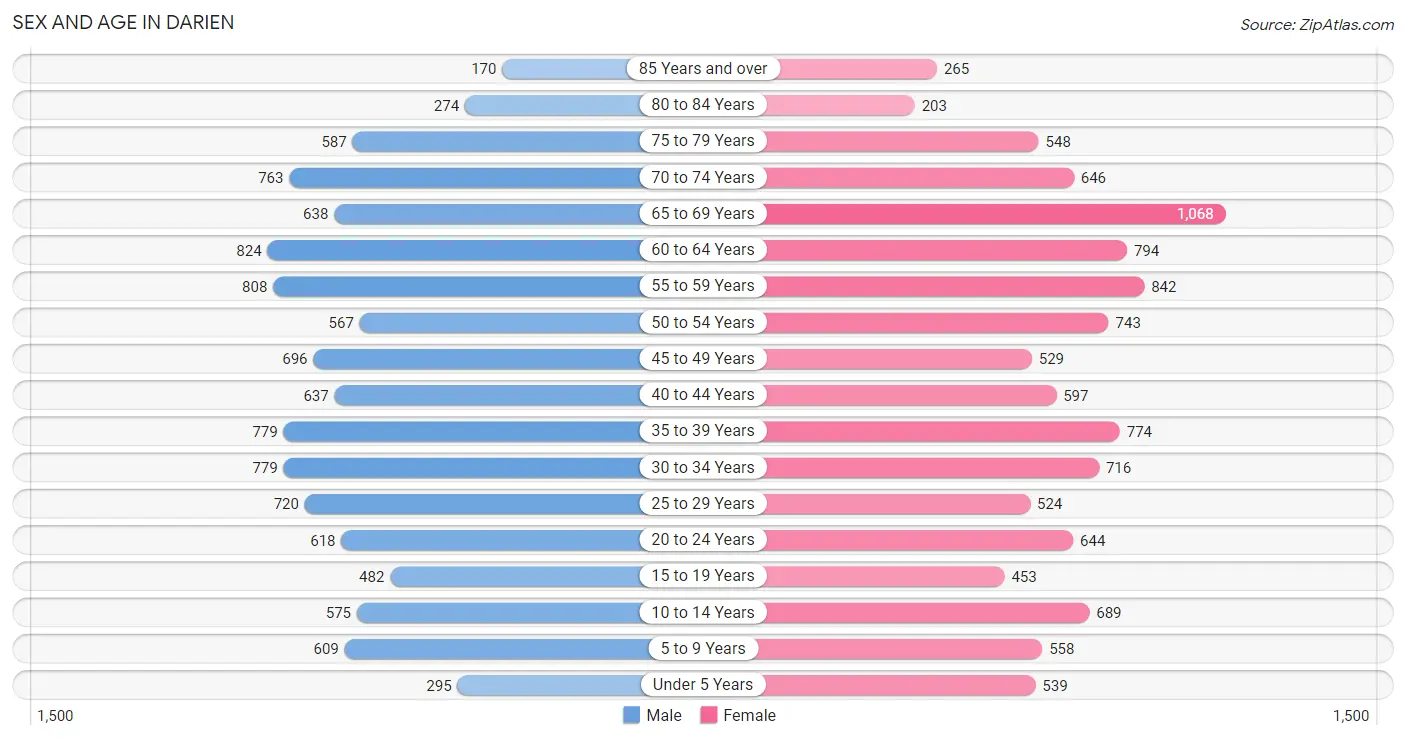
The most populous age groups in Darien are 60 to 64 Years (824 | 7.6%) for men and 65 to 69 Years (1,068 | 9.6%) for women.
| Age Bracket | Male | Female |
| Under 5 Years | 295 (2.7%) | 539 (4.8%) |
| 5 to 9 Years | 609 (5.6%) | 558 (5.0%) |
| 10 to 14 Years | 575 (5.3%) | 689 (6.2%) |
| 15 to 19 Years | 482 (4.4%) | 453 (4.1%) |
| 20 to 24 Years | 618 (5.7%) | 644 (5.8%) |
| 25 to 29 Years | 720 (6.7%) | 524 (4.7%) |
| 30 to 34 Years | 779 (7.2%) | 716 (6.4%) |
| 35 to 39 Years | 779 (7.2%) | 774 (7.0%) |
| 40 to 44 Years | 637 (5.9%) | 597 (5.4%) |
| 45 to 49 Years | 696 (6.4%) | 529 (4.8%) |
| 50 to 54 Years | 567 (5.2%) | 743 (6.7%) |
| 55 to 59 Years | 808 (7.5%) | 842 (7.6%) |
| 60 to 64 Years | 824 (7.6%) | 794 (7.1%) |
| 65 to 69 Years | 638 (5.9%) | 1,068 (9.6%) |
| 70 to 74 Years | 763 (7.0%) | 646 (5.8%) |
| 75 to 79 Years | 587 (5.4%) | 548 (4.9%) |
| 80 to 84 Years | 274 (2.5%) | 203 (1.8%) |
| 85 Years and over | 170 (1.6%) | 265 (2.4%) |
| Total | 10,821 (100.0%) | 11,132 (100.0%) |
Families and Households in Darien
Median Family Size in Darien
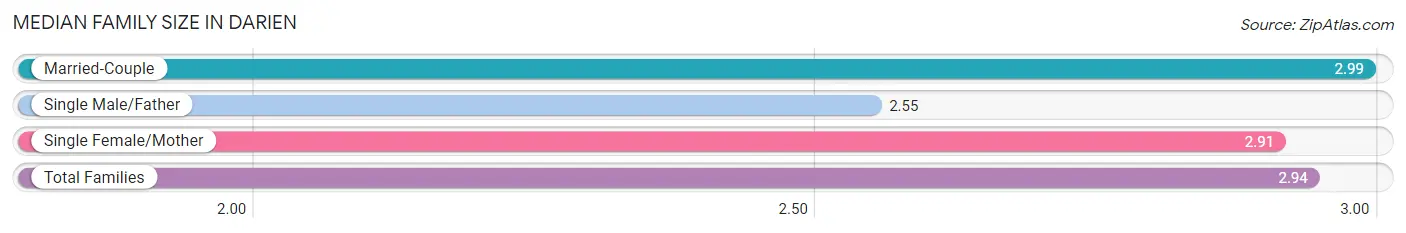
The median family size in Darien is 2.94 persons per family, with married-couple families (4,989 | 78.5%) accounting for the largest median family size of 2.99 persons per family. On the other hand, single male/father families (535 | 8.4%) represent the smallest median family size with 2.55 persons per family.
| Family Type | # Families | Family Size |
| Married-Couple | 4,989 (78.5%) | 2.99 |
| Single Male/Father | 535 (8.4%) | 2.55 |
| Single Female/Mother | 829 (13.1%) | 2.91 |
| Total Families | 6,353 (100.0%) | 2.94 |
Median Household Size in Darien
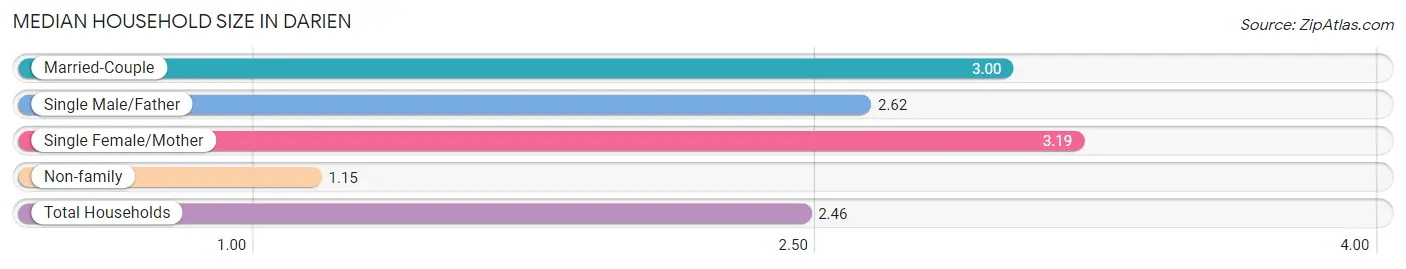
The median household size in Darien is 2.46 persons per household, with single female/mother households (829 | 9.3%) accounting for the largest median household size of 3.19 persons per household. non-family households (2,550 | 28.6%) represent the smallest median household size with 1.15 persons per household.
| Household Type | # Households | Household Size |
| Married-Couple | 4,989 (56.0%) | 3.00 |
| Single Male/Father | 535 (6.0%) | 2.62 |
| Single Female/Mother | 829 (9.3%) | 3.19 |
| Non-family | 2,550 (28.6%) | 1.15 |
| Total Households | 8,903 (100.0%) | 2.46 |
Household Size by Marriage Status in Darien
Out of a total of 8,903 households in Darien, 6,353 (71.4%) are family households, while 2,550 (28.6%) are nonfamily households. The most numerous type of family households are 2-person households, comprising 2,895, and the most common type of nonfamily households are 1-person households, comprising 2,185.
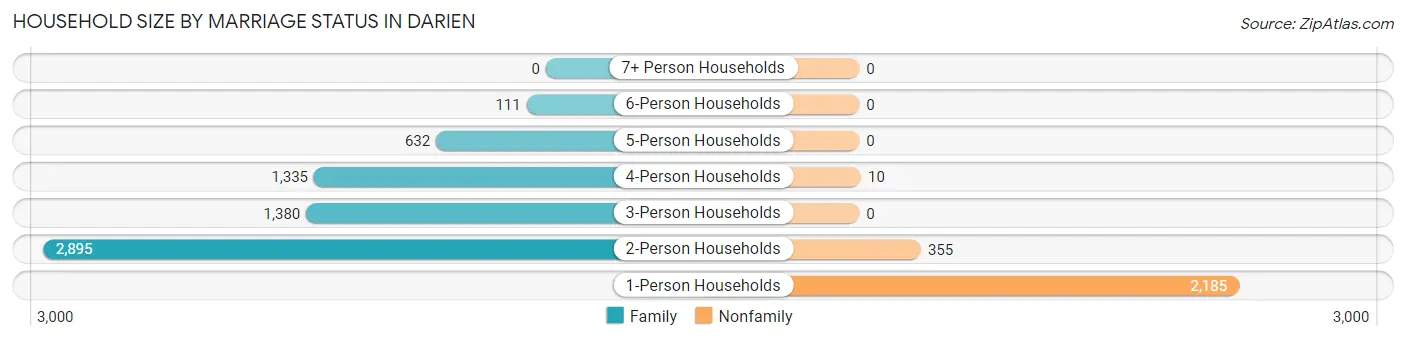
| Household Size | Family Households | Nonfamily Households |
| 1-Person Households | - | 2,185 (24.5%) |
| 2-Person Households | 2,895 (32.5%) | 355 (4.0%) |
| 3-Person Households | 1,380 (15.5%) | 0 (0.0%) |
| 4-Person Households | 1,335 (15.0%) | 10 (0.1%) |
| 5-Person Households | 632 (7.1%) | 0 (0.0%) |
| 6-Person Households | 111 (1.3%) | 0 (0.0%) |
| 7+ Person Households | 0 (0.0%) | 0 (0.0%) |
| Total | 6,353 (71.4%) | 2,550 (28.6%) |
Female Fertility in Darien
Fertility by Age in Darien
Average fertility rate in Darien is 40.0 births per 1,000 women. Women in the age bracket of 20 to 34 years have the highest fertility rate with 73.0 births per 1,000 women. Women in the age bracket of 20 to 34 years acount for 77.1% of all women with births.
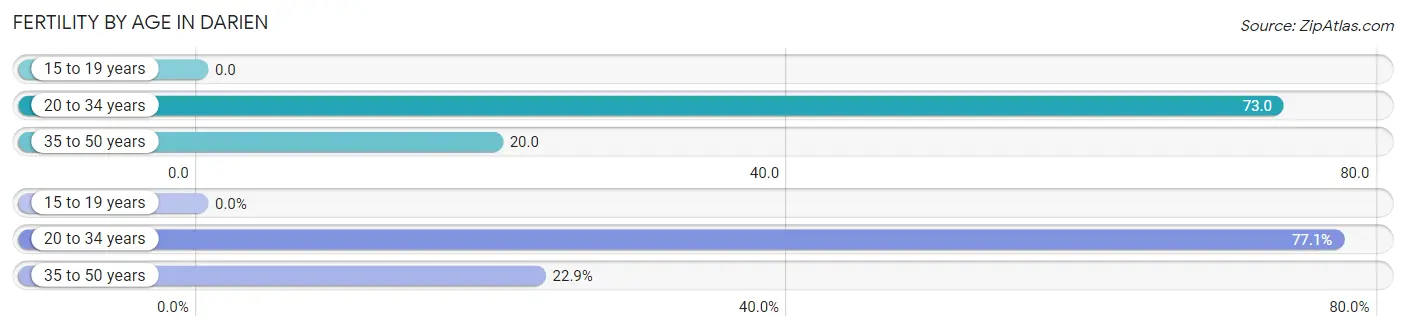
| Age Bracket | Women with Births | Births / 1,000 Women |
| 15 to 19 years | 0 (0.0%) | 0.0 |
| 20 to 34 years | 138 (77.1%) | 73.0 |
| 35 to 50 years | 41 (22.9%) | 20.0 |
| Total | 179 (100.0%) | 40.0 |
Fertility by Age by Marriage Status in Darien
59.2% of women with births (179) in Darien are married. The highest percentage of unmarried women with births falls into 20 to 34 years age bracket with 47.1% of them unmarried at the time of birth, while the lowest percentage of unmarried women with births belong to 35 to 50 years age bracket with 19.5% of them unmarried.
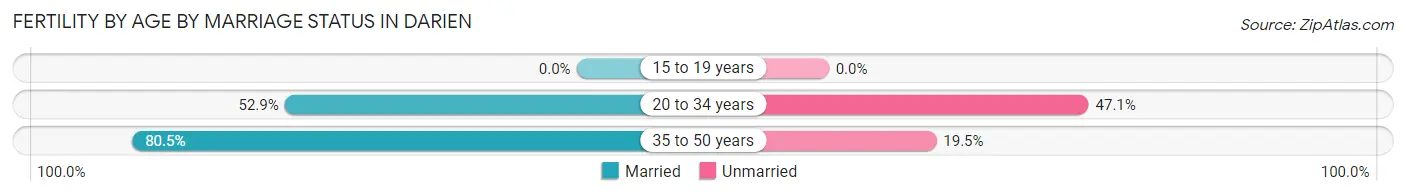
| Age Bracket | Married | Unmarried |
| 15 to 19 years | 0 (0.0%) | 0 (0.0%) |
| 20 to 34 years | 73 (52.9%) | 65 (47.1%) |
| 35 to 50 years | 33 (80.5%) | 8 (19.5%) |
| Total | 106 (59.2%) | 73 (40.8%) |
Fertility by Education in Darien
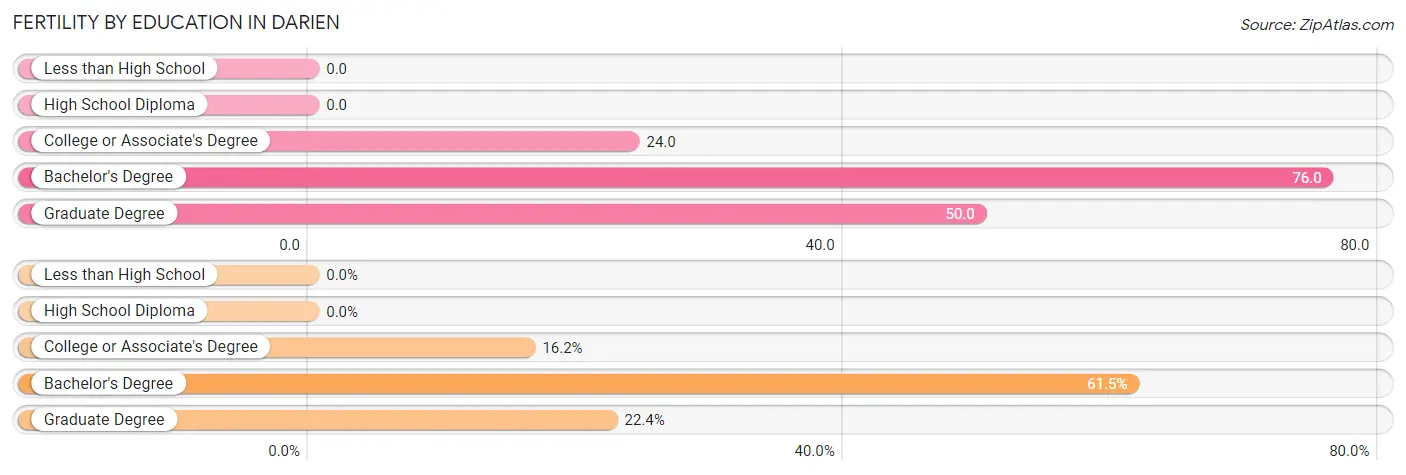
| Educational Attainment | Women with Births | Births / 1,000 Women |
| Less than High School | 0 (0.0%) | 0.0 |
| High School Diploma | 0 (0.0%) | 0.0 |
| College or Associate's Degree | 29 (16.2%) | 24.0 |
| Bachelor's Degree | 110 (61.5%) | 76.0 |
| Graduate Degree | 40 (22.4%) | 50.0 |
| Total | 179 (100.0%) | 40.0 |
Fertility by Education by Marriage Status in Darien
40.8% of women with births in Darien are unmarried. Women with the educational attainment of college or associate's degree are most likely to be married with 100.0% of them married at childbirth, while women with the educational attainment of bachelor's degree are least likely to be married with 66.4% of them unmarried at childbirth.
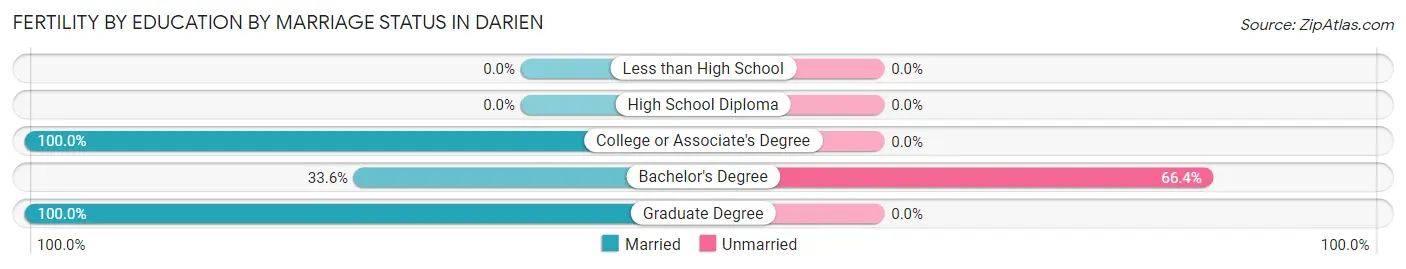
| Educational Attainment | Married | Unmarried |
| Less than High School | 0 (0.0%) | 0 (0.0%) |
| High School Diploma | 0 (0.0%) | 0 (0.0%) |
| College or Associate's Degree | 29 (100.0%) | 0 (0.0%) |
| Bachelor's Degree | 37 (33.6%) | 73 (66.4%) |
| Graduate Degree | 40 (100.0%) | 0 (0.0%) |
| Total | 106 (59.2%) | 73 (40.8%) |
Employment Characteristics in Darien
Employment by Class of Employer in Darien
Among the 11,587 employed individuals in Darien, private company employees (7,779 | 67.1%), self-employed (incorporated) (901 | 7.8%), and not-for-profit organizations (871 | 7.5%) make up the most common classes of employment.
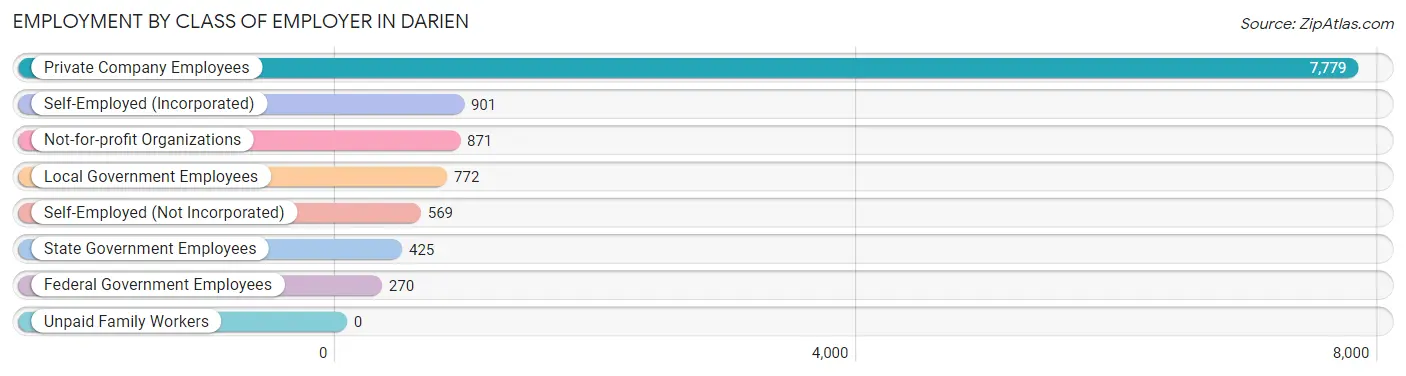
| Employer Class | # Employees | % Employees |
| Private Company Employees | 7,779 | 67.1% |
| Self-Employed (Incorporated) | 901 | 7.8% |
| Self-Employed (Not Incorporated) | 569 | 4.9% |
| Not-for-profit Organizations | 871 | 7.5% |
| Local Government Employees | 772 | 6.7% |
| State Government Employees | 425 | 3.7% |
| Federal Government Employees | 270 | 2.3% |
| Unpaid Family Workers | 0 | 0.0% |
| Total | 11,587 | 100.0% |
Employment Status by Age in Darien
According to the labor force statistics for Darien, out of the total population over 16 years of age (18,449), 67.0% or 12,361 individuals are in the labor force, with 4.1% or 507 of them unemployed. The age group with the highest labor force participation rate is 25 to 29 years, with 93.3% or 1,161 individuals in the labor force. Within the labor force, the 60 to 64 years age range has the highest percentage of unemployed individuals, with 10.1% or 133 of them being unemployed.
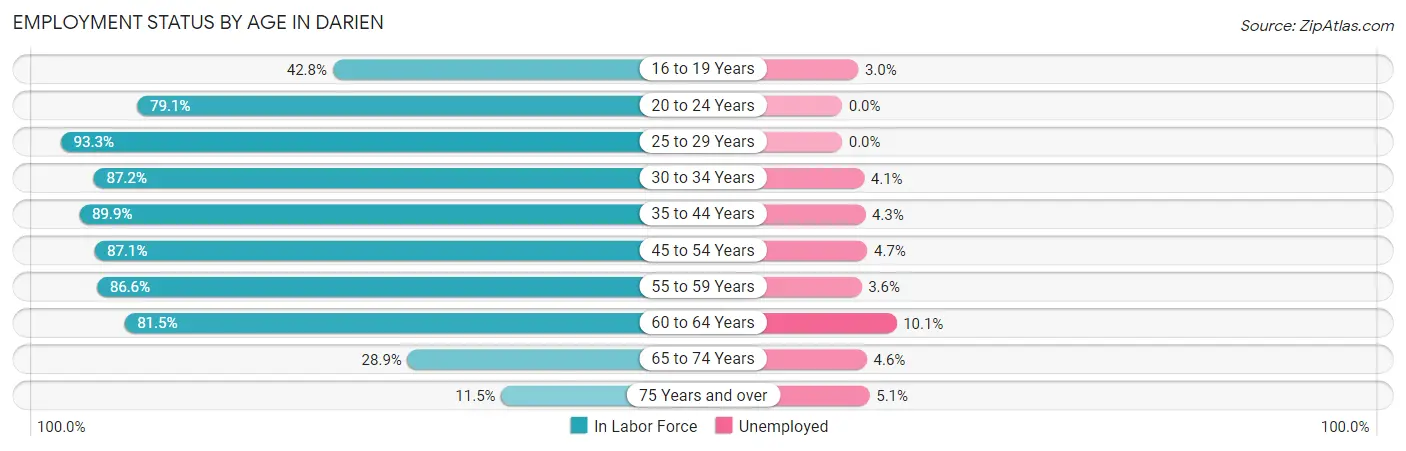
| Age Bracket | In Labor Force | Unemployed |
| 16 to 19 Years | 298 (42.8%) | 9 (3.0%) |
| 20 to 24 Years | 998 (79.1%) | 0 (0.0%) |
| 25 to 29 Years | 1,161 (93.3%) | 0 (0.0%) |
| 30 to 34 Years | 1,304 (87.2%) | 53 (4.1%) |
| 35 to 44 Years | 2,506 (89.9%) | 108 (4.3%) |
| 45 to 54 Years | 2,208 (87.1%) | 104 (4.7%) |
| 55 to 59 Years | 1,429 (86.6%) | 51 (3.6%) |
| 60 to 64 Years | 1,319 (81.5%) | 133 (10.1%) |
| 65 to 74 Years | 900 (28.9%) | 41 (4.6%) |
| 75 Years and over | 235 (11.5%) | 12 (5.1%) |
| Total | 12,361 (67.0%) | 507 (4.1%) |
Employment Status by Educational Attainment in Darien
According to labor force statistics for Darien, 87.6% of individuals (9,924) out of the total population between 25 and 64 years of age (11,329) are in the labor force, with 4.5% or 447 of them being unemployed. The group with the highest labor force participation rate are those with the educational attainment of bachelor's degree or higher, with 89.6% or 5,510 individuals in the labor force. Within the labor force, individuals with college / associate degree education have the highest percentage of unemployment, with 8.6% or 220 of them being unemployed.
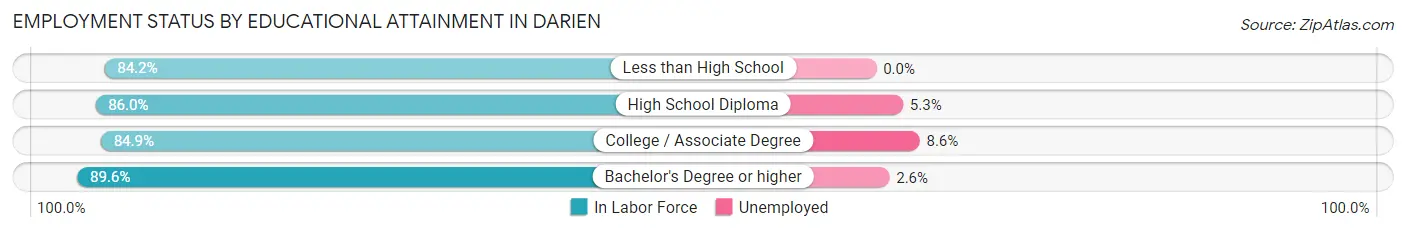
| Educational Attainment | In Labor Force | Unemployed |
| Less than High School | 282 (84.2%) | 0 (0.0%) |
| High School Diploma | 1,570 (86.0%) | 97 (5.3%) |
| College / Associate Degree | 2,563 (84.9%) | 260 (8.6%) |
| Bachelor's Degree or higher | 5,510 (89.6%) | 160 (2.6%) |
| Total | 9,924 (87.6%) | 510 (4.5%) |
Employment Occupations by Sex in Darien
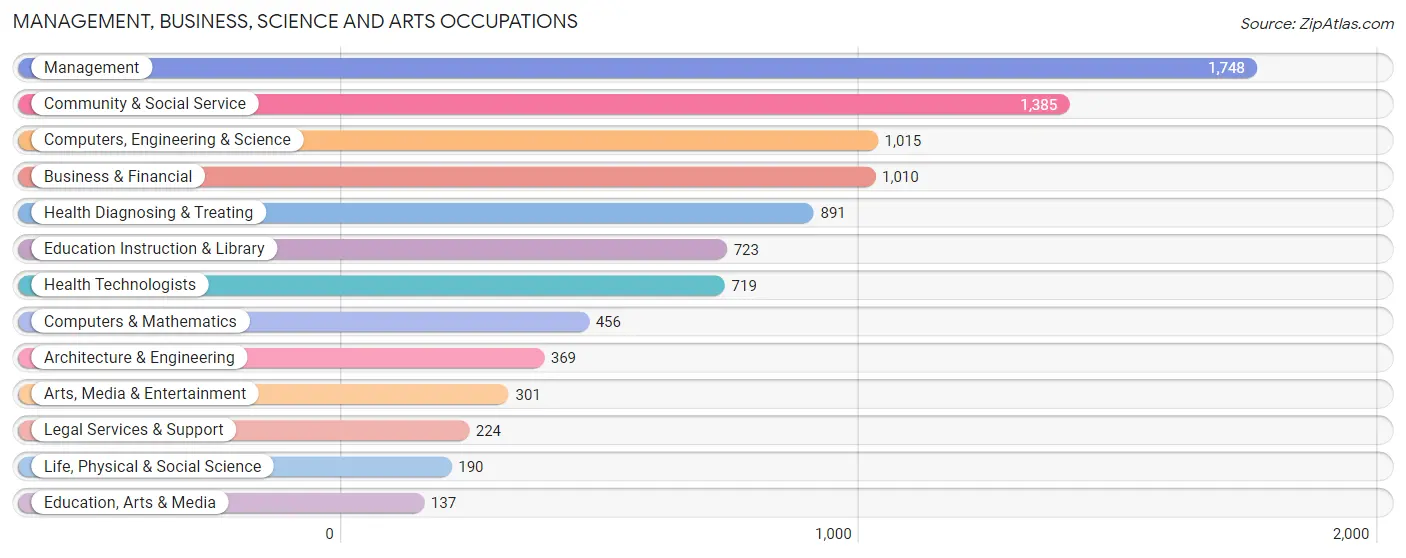
Management, Business, Science and Arts Occupations
The most common Management, Business, Science and Arts occupations in Darien are Management (1,748 | 14.8%), Community & Social Service (1,385 | 11.7%), Computers, Engineering & Science (1,015 | 8.6%), Business & Financial (1,010 | 8.5%), and Health Diagnosing & Treating (891 | 7.5%).
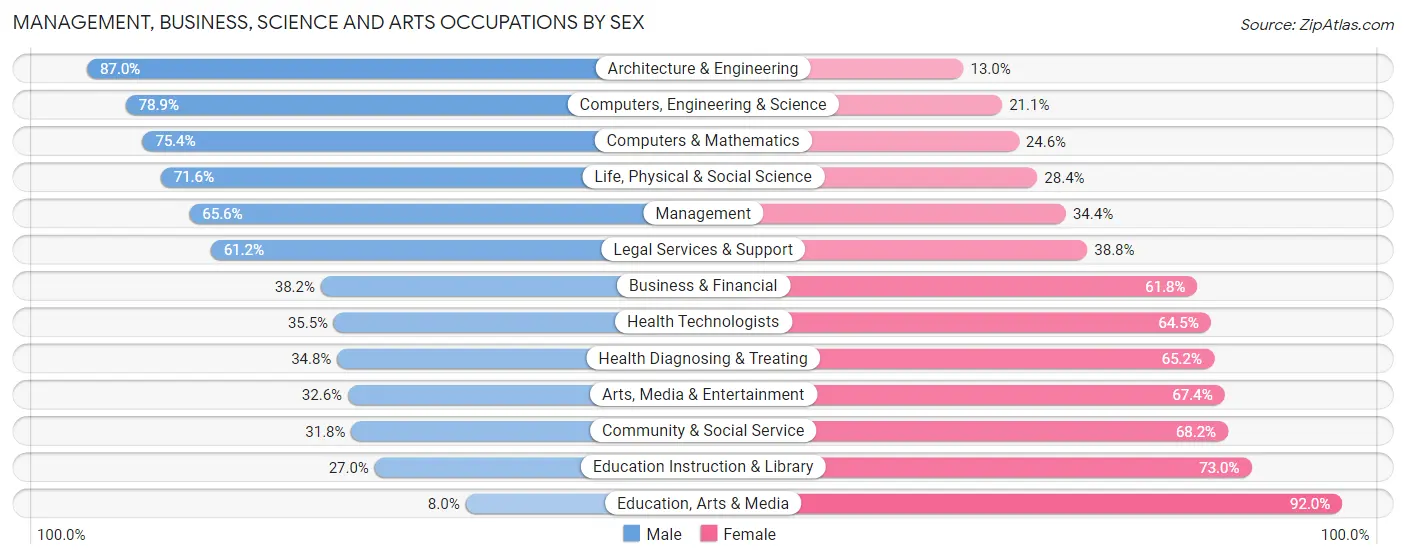
Management, Business, Science and Arts Occupations by Sex
Within the Management, Business, Science and Arts occupations in Darien, the most male-oriented occupations are Architecture & Engineering (87.0%), Computers, Engineering & Science (78.9%), and Computers & Mathematics (75.4%), while the most female-oriented occupations are Education, Arts & Media (92.0%), Education Instruction & Library (73.0%), and Community & Social Service (68.2%).
| Occupation | Male | Female |
| Management | 1,147 (65.6%) | 601 (34.4%) |
| Business & Financial | 386 (38.2%) | 624 (61.8%) |
| Computers, Engineering & Science | 801 (78.9%) | 214 (21.1%) |
| Computers & Mathematics | 344 (75.4%) | 112 (24.6%) |
| Architecture & Engineering | 321 (87.0%) | 48 (13.0%) |
| Life, Physical & Social Science | 136 (71.6%) | 54 (28.4%) |
| Community & Social Service | 441 (31.8%) | 944 (68.2%) |
| Education, Arts & Media | 11 (8.0%) | 126 (92.0%) |
| Legal Services & Support | 137 (61.2%) | 87 (38.8%) |
| Education Instruction & Library | 195 (27.0%) | 528 (73.0%) |
| Arts, Media & Entertainment | 98 (32.6%) | 203 (67.4%) |
| Health Diagnosing & Treating | 310 (34.8%) | 581 (65.2%) |
| Health Technologists | 255 (35.5%) | 464 (64.5%) |
| Total (Category) | 3,085 (51.0%) | 2,964 (49.0%) |
| Total (Overall) | 6,448 (54.4%) | 5,398 (45.6%) |
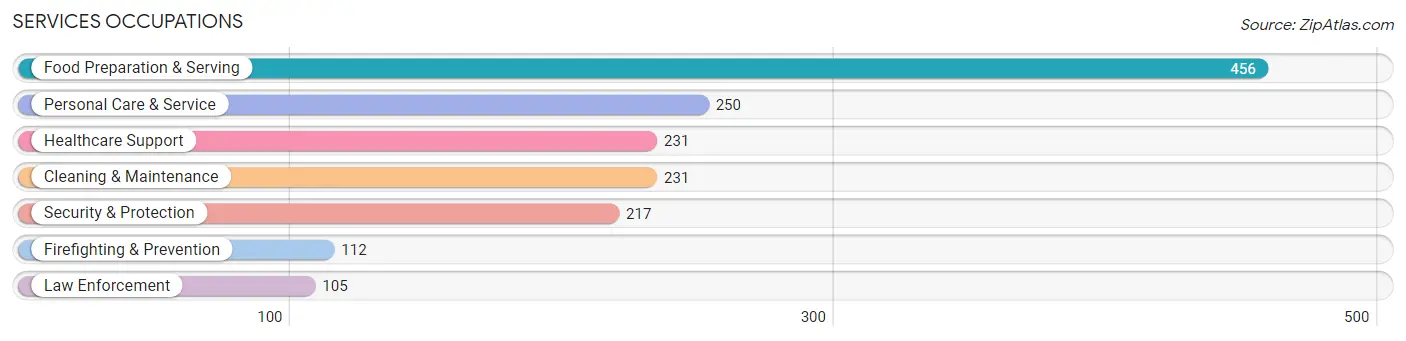
Services Occupations
The most common Services occupations in Darien are Food Preparation & Serving (456 | 3.8%), Personal Care & Service (250 | 2.1%), Healthcare Support (231 | 1.9%), Cleaning & Maintenance (231 | 1.9%), and Security & Protection (217 | 1.8%).
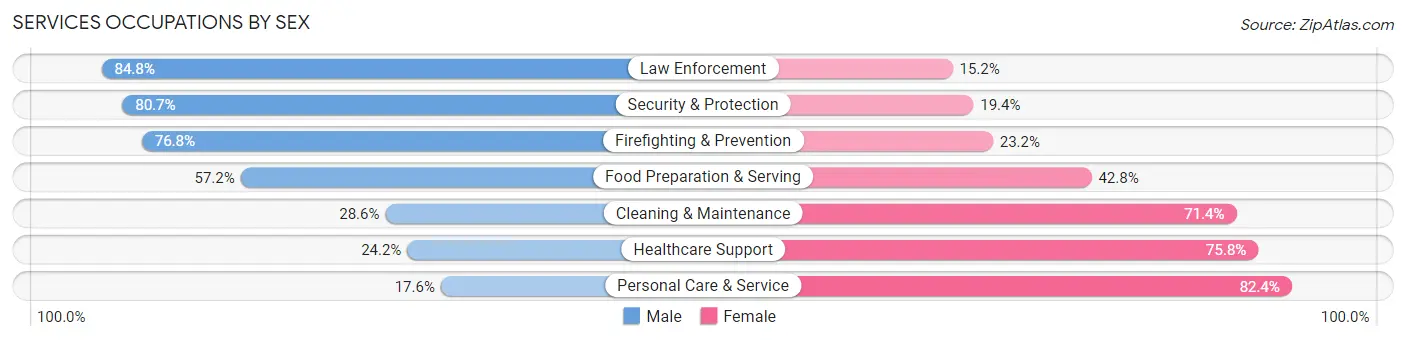
Services Occupations by Sex
Within the Services occupations in Darien, the most male-oriented occupations are Law Enforcement (84.8%), Security & Protection (80.6%), and Firefighting & Prevention (76.8%), while the most female-oriented occupations are Personal Care & Service (82.4%), Healthcare Support (75.8%), and Cleaning & Maintenance (71.4%).
| Occupation | Male | Female |
| Healthcare Support | 56 (24.2%) | 175 (75.8%) |
| Security & Protection | 175 (80.6%) | 42 (19.4%) |
| Firefighting & Prevention | 86 (76.8%) | 26 (23.2%) |
| Law Enforcement | 89 (84.8%) | 16 (15.2%) |
| Food Preparation & Serving | 261 (57.2%) | 195 (42.8%) |
| Cleaning & Maintenance | 66 (28.6%) | 165 (71.4%) |
| Personal Care & Service | 44 (17.6%) | 206 (82.4%) |
| Total (Category) | 602 (43.5%) | 783 (56.5%) |
| Total (Overall) | 6,448 (54.4%) | 5,398 (45.6%) |
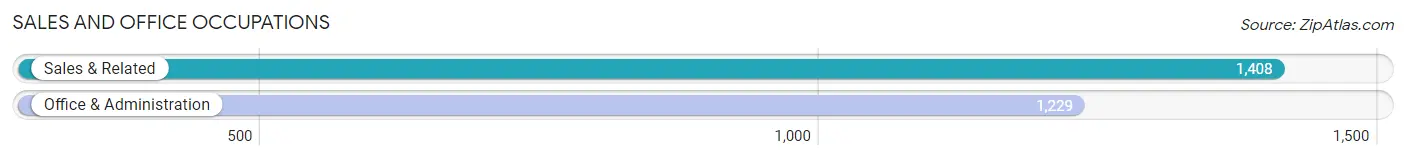
Sales and Office Occupations
The most common Sales and Office occupations in Darien are Sales & Related (1,408 | 11.9%), and Office & Administration (1,229 | 10.4%).
Sales and Office Occupations by Sex
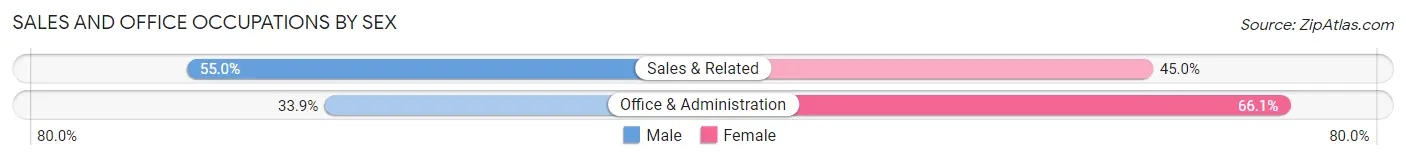
| Occupation | Male | Female |
| Sales & Related | 775 (55.0%) | 633 (45.0%) |
| Office & Administration | 417 (33.9%) | 812 (66.1%) |
| Total (Category) | 1,192 (45.2%) | 1,445 (54.8%) |
| Total (Overall) | 6,448 (54.4%) | 5,398 (45.6%) |
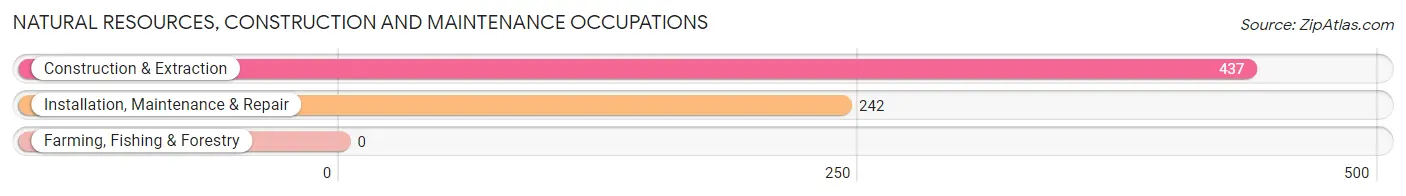
Natural Resources, Construction and Maintenance Occupations
The most common Natural Resources, Construction and Maintenance occupations in Darien are Construction & Extraction (437 | 3.7%), and Installation, Maintenance & Repair (242 | 2.0%).
Natural Resources, Construction and Maintenance Occupations by Sex
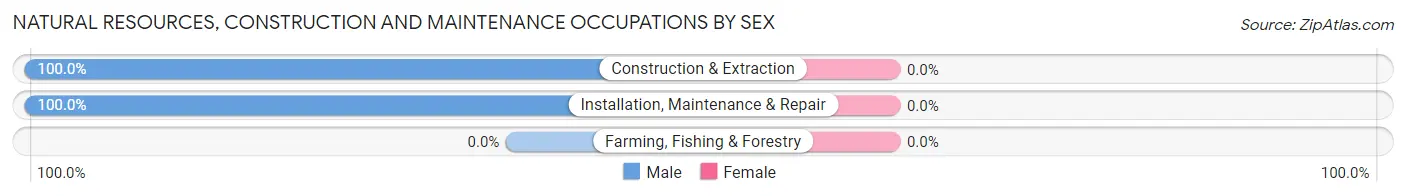
| Occupation | Male | Female |
| Farming, Fishing & Forestry | 0 (0.0%) | 0 (0.0%) |
| Construction & Extraction | 437 (100.0%) | 0 (0.0%) |
| Installation, Maintenance & Repair | 242 (100.0%) | 0 (0.0%) |
| Total (Category) | 679 (100.0%) | 0 (0.0%) |
| Total (Overall) | 6,448 (54.4%) | 5,398 (45.6%) |
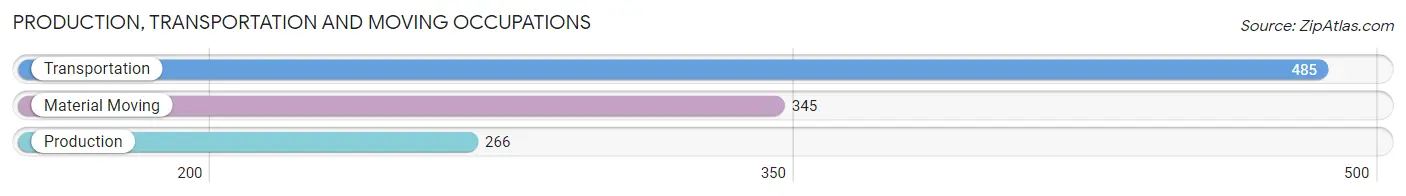
Production, Transportation and Moving Occupations
The most common Production, Transportation and Moving occupations in Darien are Transportation (485 | 4.1%), Material Moving (345 | 2.9%), and Production (266 | 2.2%).
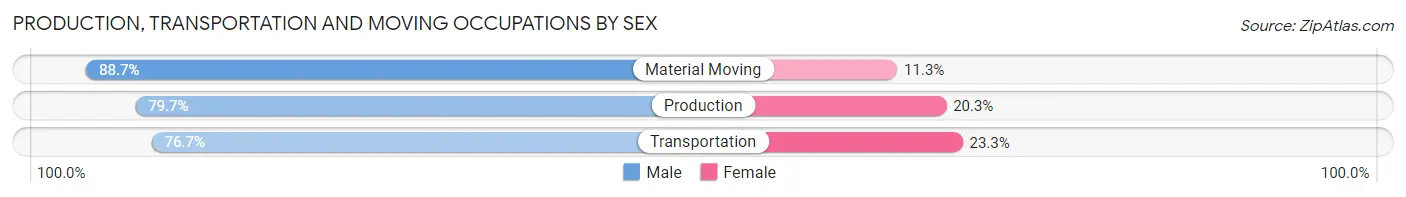
Production, Transportation and Moving Occupations by Sex
| Occupation | Male | Female |
| Production | 212 (79.7%) | 54 (20.3%) |
| Transportation | 372 (76.7%) | 113 (23.3%) |
| Material Moving | 306 (88.7%) | 39 (11.3%) |
| Total (Category) | 890 (81.2%) | 206 (18.8%) |
| Total (Overall) | 6,448 (54.4%) | 5,398 (45.6%) |
Employment Industries by Sex in Darien
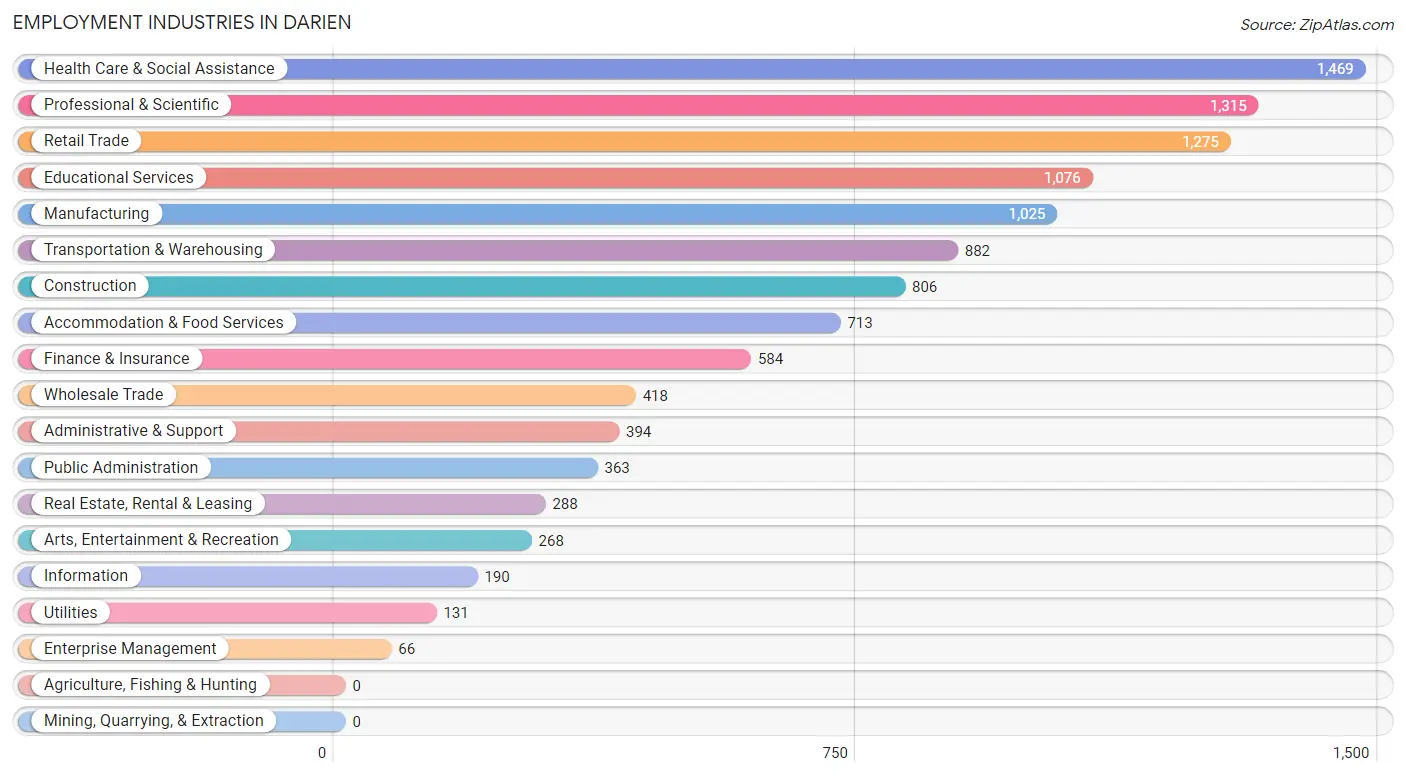
Employment Industries in Darien
The major employment industries in Darien include Health Care & Social Assistance (1,469 | 12.4%), Professional & Scientific (1,315 | 11.1%), Retail Trade (1,275 | 10.8%), Educational Services (1,076 | 9.1%), and Manufacturing (1,025 | 8.6%).
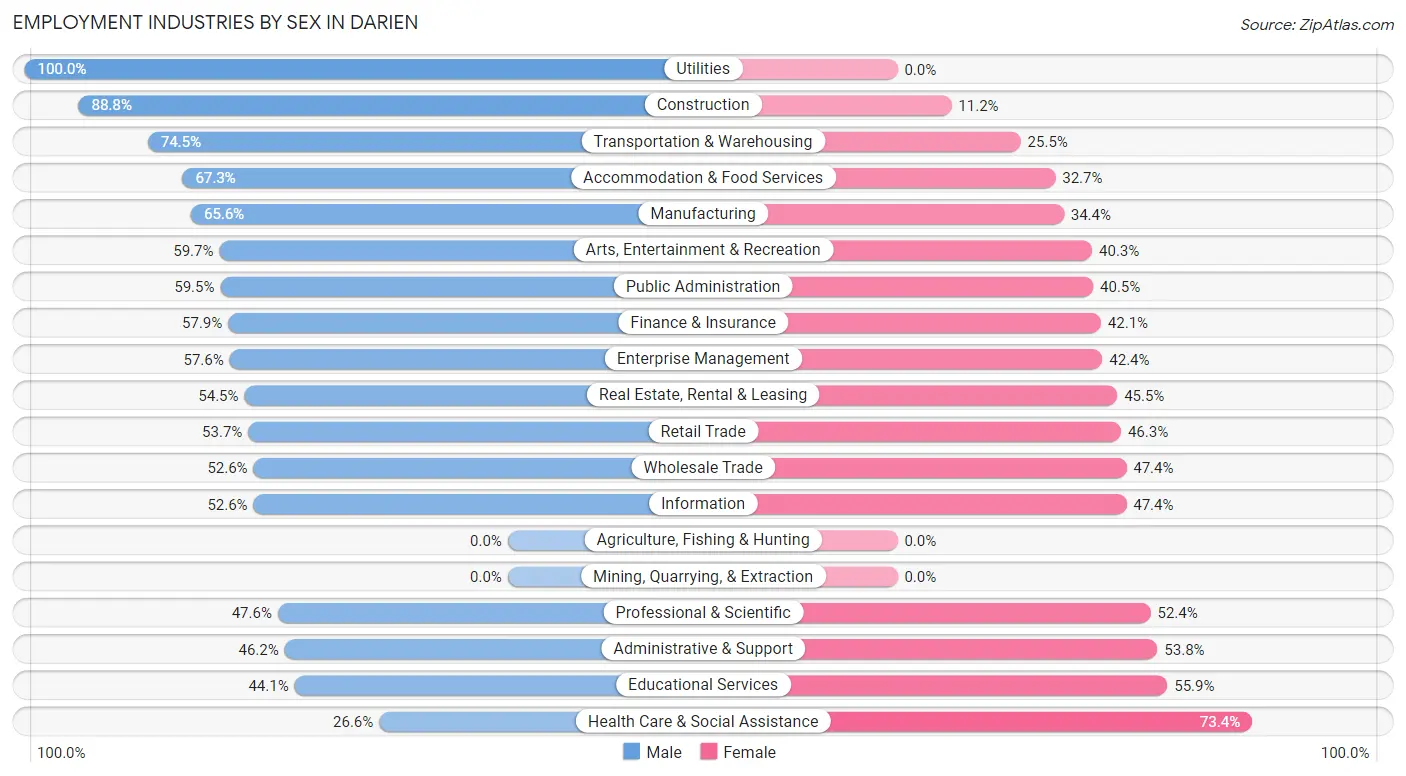
Employment Industries by Sex in Darien
The Darien industries that see more men than women are Utilities (100.0%), Construction (88.8%), and Transportation & Warehousing (74.5%), whereas the industries that tend to have a higher number of women are Health Care & Social Assistance (73.4%), Educational Services (55.9%), and Administrative & Support (53.8%).
| Industry | Male | Female |
| Agriculture, Fishing & Hunting | 0 (0.0%) | 0 (0.0%) |
| Mining, Quarrying, & Extraction | 0 (0.0%) | 0 (0.0%) |
| Construction | 716 (88.8%) | 90 (11.2%) |
| Manufacturing | 672 (65.6%) | 353 (34.4%) |
| Wholesale Trade | 220 (52.6%) | 198 (47.4%) |
| Retail Trade | 685 (53.7%) | 590 (46.3%) |
| Transportation & Warehousing | 657 (74.5%) | 225 (25.5%) |
| Utilities | 131 (100.0%) | 0 (0.0%) |
| Information | 100 (52.6%) | 90 (47.4%) |
| Finance & Insurance | 338 (57.9%) | 246 (42.1%) |
| Real Estate, Rental & Leasing | 157 (54.5%) | 131 (45.5%) |
| Professional & Scientific | 626 (47.6%) | 689 (52.4%) |
| Enterprise Management | 38 (57.6%) | 28 (42.4%) |
| Administrative & Support | 182 (46.2%) | 212 (53.8%) |
| Educational Services | 475 (44.1%) | 601 (55.9%) |
| Health Care & Social Assistance | 391 (26.6%) | 1,078 (73.4%) |
| Arts, Entertainment & Recreation | 160 (59.7%) | 108 (40.3%) |
| Accommodation & Food Services | 480 (67.3%) | 233 (32.7%) |
| Public Administration | 216 (59.5%) | 147 (40.5%) |
| Total | 6,448 (54.4%) | 5,398 (45.6%) |
Education in Darien
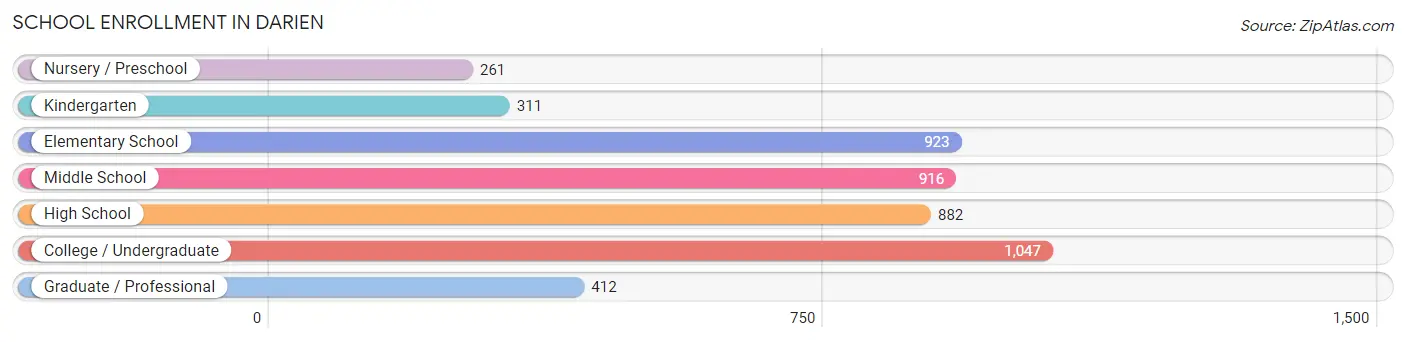
School Enrollment in Darien
The most common levels of schooling among the 4,752 students in Darien are college / undergraduate (1,047 | 22.0%), elementary school (923 | 19.4%), and middle school (916 | 19.3%).
| School Level | # Students | % Students |
| Nursery / Preschool | 261 | 5.5% |
| Kindergarten | 311 | 6.5% |
| Elementary School | 923 | 19.4% |
| Middle School | 916 | 19.3% |
| High School | 882 | 18.6% |
| College / Undergraduate | 1,047 | 22.0% |
| Graduate / Professional | 412 | 8.7% |
| Total | 4,752 | 100.0% |
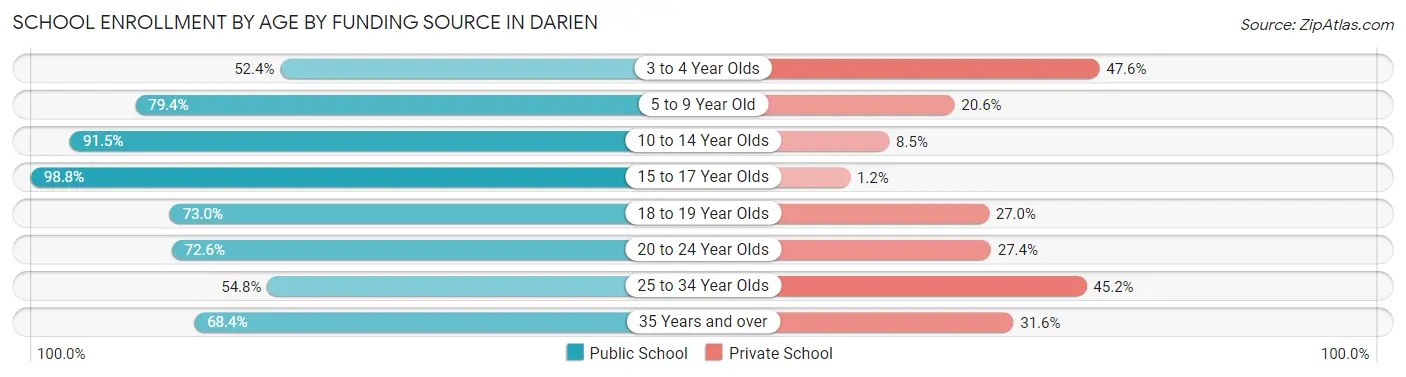
School Enrollment by Age by Funding Source in Darien
Out of a total of 4,752 students who are enrolled in schools in Darien, 941 (19.8%) attend a private institution, while the remaining 3,811 (80.2%) are enrolled in public schools. The age group of 3 to 4 year olds has the highest likelihood of being enrolled in private schools, with 80 (47.6% in the age bracket) enrolled. Conversely, the age group of 15 to 17 year olds has the lowest likelihood of being enrolled in a private school, with 589 (98.8% in the age bracket) attending a public institution.
| Age Bracket | Public School | Private School |
| 3 to 4 Year Olds | 88 (52.4%) | 80 (47.6%) |
| 5 to 9 Year Old | 904 (79.4%) | 235 (20.6%) |
| 10 to 14 Year Olds | 1,157 (91.5%) | 107 (8.5%) |
| 15 to 17 Year Olds | 589 (98.8%) | 7 (1.2%) |
| 18 to 19 Year Olds | 189 (73.0%) | 70 (27.0%) |
| 20 to 24 Year Olds | 453 (72.6%) | 171 (27.4%) |
| 25 to 34 Year Olds | 206 (54.8%) | 170 (45.2%) |
| 35 Years and over | 223 (68.4%) | 103 (31.6%) |
| Total | 3,811 (80.2%) | 941 (19.8%) |
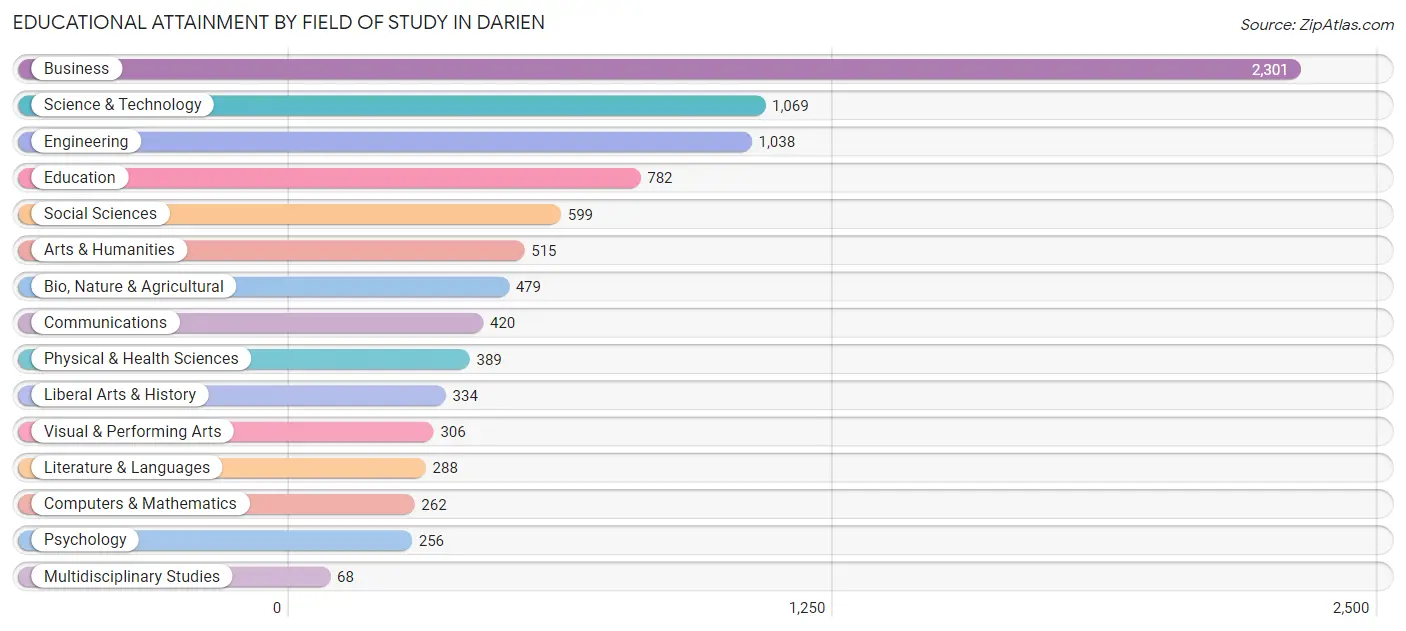
Educational Attainment by Field of Study in Darien
Business (2,301 | 25.3%), science & technology (1,069 | 11.7%), engineering (1,038 | 11.4%), education (782 | 8.6%), and social sciences (599 | 6.6%) are the most common fields of study among 9,106 individuals in Darien who have obtained a bachelor's degree or higher.
| Field of Study | # Graduates | % Graduates |
| Computers & Mathematics | 262 | 2.9% |
| Bio, Nature & Agricultural | 479 | 5.3% |
| Physical & Health Sciences | 389 | 4.3% |
| Psychology | 256 | 2.8% |
| Social Sciences | 599 | 6.6% |
| Engineering | 1,038 | 11.4% |
| Multidisciplinary Studies | 68 | 0.7% |
| Science & Technology | 1,069 | 11.7% |
| Business | 2,301 | 25.3% |
| Education | 782 | 8.6% |
| Literature & Languages | 288 | 3.2% |
| Liberal Arts & History | 334 | 3.7% |
| Visual & Performing Arts | 306 | 3.4% |
| Communications | 420 | 4.6% |
| Arts & Humanities | 515 | 5.7% |
| Total | 9,106 | 100.0% |
Transportation & Commute in Darien
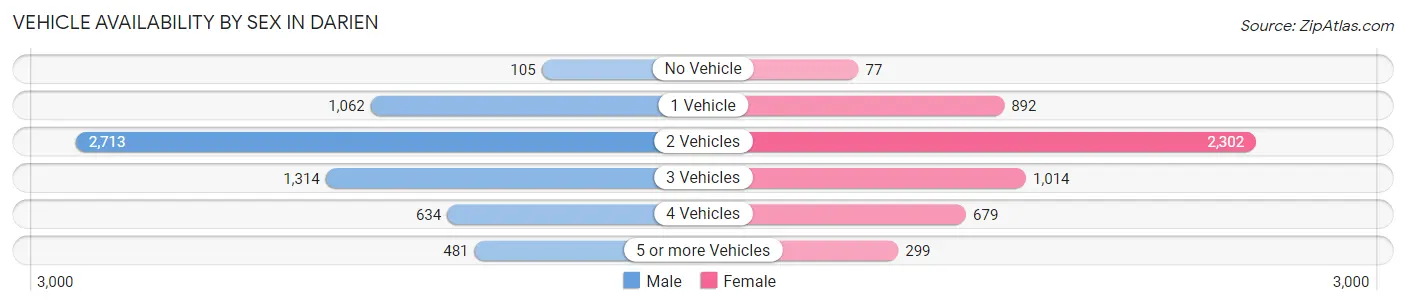
Vehicle Availability by Sex in Darien
The most prevalent vehicle ownership categories in Darien are males with 2 vehicles (2,713, accounting for 43.0%) and females with 2 vehicles (2,302, making up 51.5%).
| Vehicles Available | Male | Female |
| No Vehicle | 105 (1.7%) | 77 (1.5%) |
| 1 Vehicle | 1,062 (16.8%) | 892 (17.0%) |
| 2 Vehicles | 2,713 (43.0%) | 2,302 (43.7%) |
| 3 Vehicles | 1,314 (20.8%) | 1,014 (19.3%) |
| 4 Vehicles | 634 (10.1%) | 679 (12.9%) |
| 5 or more Vehicles | 481 (7.6%) | 299 (5.7%) |
| Total | 6,309 (100.0%) | 5,263 (100.0%) |
Commute Time in Darien
The most frequently occuring commute durations in Darien are 15 to 19 minutes (1,666 commuters, 17.4%), 30 to 34 minutes (1,603 commuters, 16.7%), and 20 to 24 minutes (1,069 commuters, 11.1%).
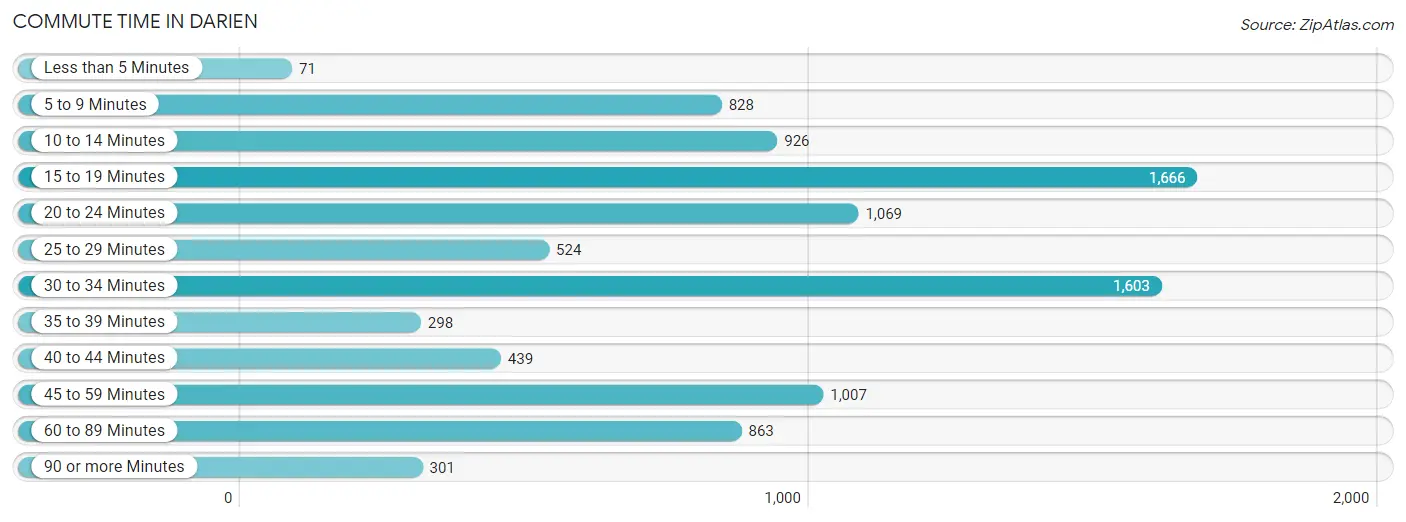
| Commute Time | # Commuters | % Commuters |
| Less than 5 Minutes | 71 | 0.7% |
| 5 to 9 Minutes | 828 | 8.6% |
| 10 to 14 Minutes | 926 | 9.7% |
| 15 to 19 Minutes | 1,666 | 17.4% |
| 20 to 24 Minutes | 1,069 | 11.1% |
| 25 to 29 Minutes | 524 | 5.5% |
| 30 to 34 Minutes | 1,603 | 16.7% |
| 35 to 39 Minutes | 298 | 3.1% |
| 40 to 44 Minutes | 439 | 4.6% |
| 45 to 59 Minutes | 1,007 | 10.5% |
| 60 to 89 Minutes | 863 | 9.0% |
| 90 or more Minutes | 301 | 3.1% |
Commute Time by Sex in Darien
The most common commute times in Darien are 30 to 34 minutes (970 commuters, 18.1%) for males and 15 to 19 minutes (761 commuters, 17.9%) for females.
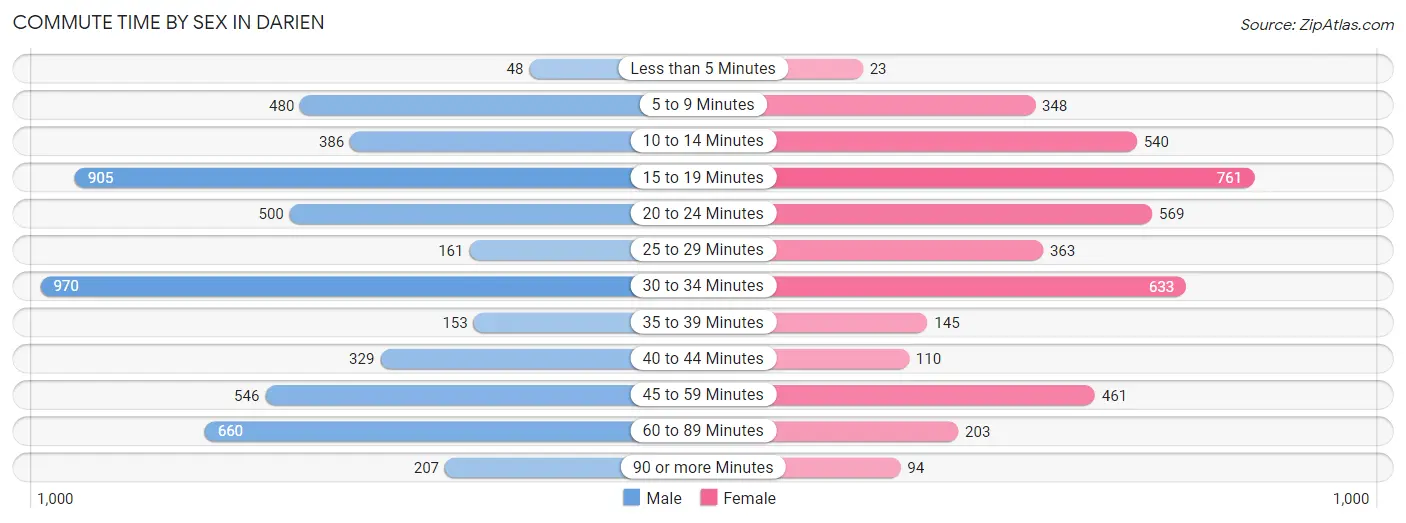
| Commute Time | Male | Female |
| Less than 5 Minutes | 48 (0.9%) | 23 (0.5%) |
| 5 to 9 Minutes | 480 (9.0%) | 348 (8.2%) |
| 10 to 14 Minutes | 386 (7.2%) | 540 (12.7%) |
| 15 to 19 Minutes | 905 (16.9%) | 761 (17.9%) |
| 20 to 24 Minutes | 500 (9.3%) | 569 (13.4%) |
| 25 to 29 Minutes | 161 (3.0%) | 363 (8.5%) |
| 30 to 34 Minutes | 970 (18.1%) | 633 (14.9%) |
| 35 to 39 Minutes | 153 (2.9%) | 145 (3.4%) |
| 40 to 44 Minutes | 329 (6.2%) | 110 (2.6%) |
| 45 to 59 Minutes | 546 (10.2%) | 461 (10.8%) |
| 60 to 89 Minutes | 660 (12.3%) | 203 (4.8%) |
| 90 or more Minutes | 207 (3.9%) | 94 (2.2%) |
Time of Departure to Work by Sex in Darien
The most frequent times of departure to work in Darien are 6:30 AM to 6:59 AM (981, 18.3%) for males and 8:00 AM to 8:29 AM (631, 14.8%) for females.
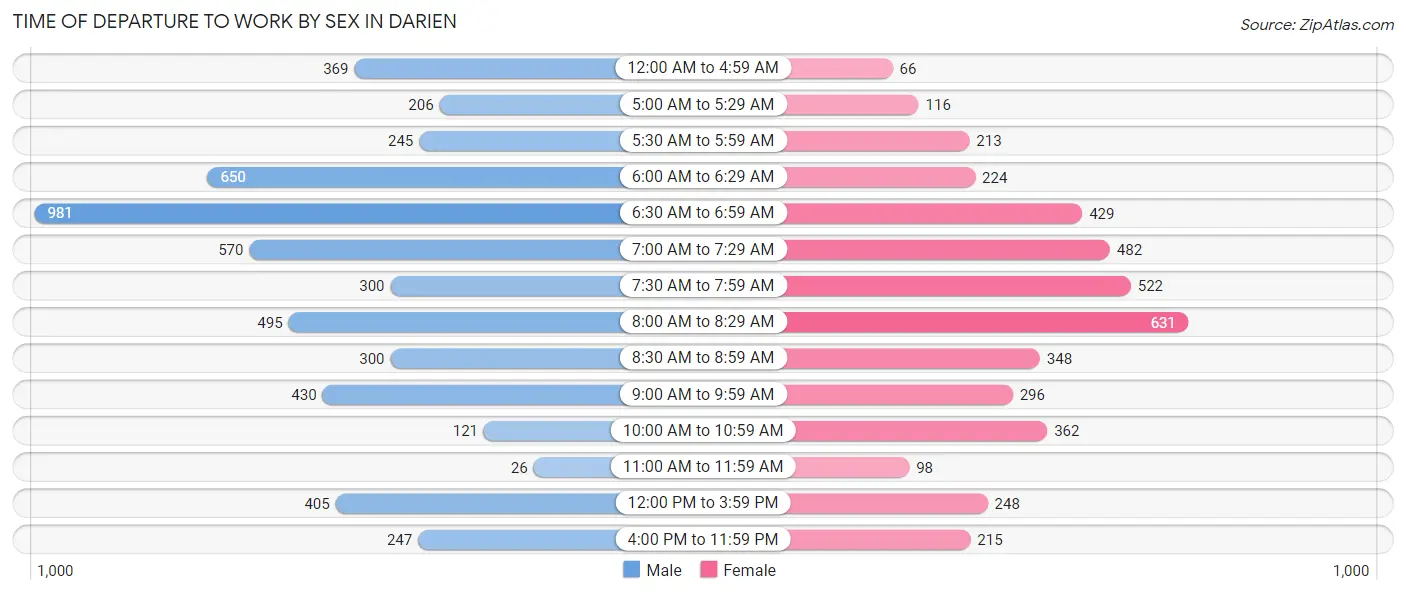
| Time of Departure | Male | Female |
| 12:00 AM to 4:59 AM | 369 (6.9%) | 66 (1.5%) |
| 5:00 AM to 5:29 AM | 206 (3.8%) | 116 (2.7%) |
| 5:30 AM to 5:59 AM | 245 (4.6%) | 213 (5.0%) |
| 6:00 AM to 6:29 AM | 650 (12.2%) | 224 (5.3%) |
| 6:30 AM to 6:59 AM | 981 (18.3%) | 429 (10.1%) |
| 7:00 AM to 7:29 AM | 570 (10.7%) | 482 (11.3%) |
| 7:30 AM to 7:59 AM | 300 (5.6%) | 522 (12.3%) |
| 8:00 AM to 8:29 AM | 495 (9.3%) | 631 (14.8%) |
| 8:30 AM to 8:59 AM | 300 (5.6%) | 348 (8.2%) |
| 9:00 AM to 9:59 AM | 430 (8.0%) | 296 (7.0%) |
| 10:00 AM to 10:59 AM | 121 (2.3%) | 362 (8.5%) |
| 11:00 AM to 11:59 AM | 26 (0.5%) | 98 (2.3%) |
| 12:00 PM to 3:59 PM | 405 (7.6%) | 248 (5.8%) |
| 4:00 PM to 11:59 PM | 247 (4.6%) | 215 (5.1%) |
| Total | 5,345 (100.0%) | 4,250 (100.0%) |
Housing Occupancy in Darien
Occupancy by Ownership in Darien
Of the total 8,903 dwellings in Darien, owner-occupied units account for 7,117 (79.9%), while renter-occupied units make up 1,786 (20.1%).
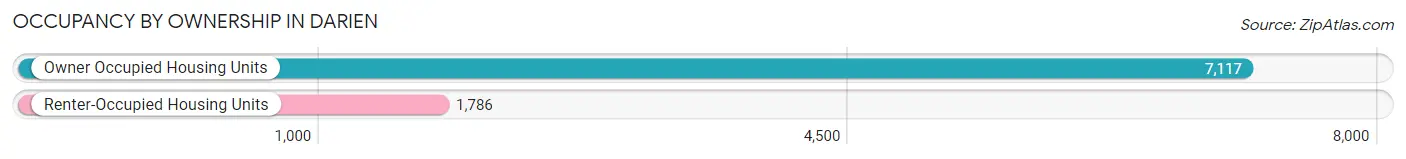
| Occupancy | # Housing Units | % Housing Units |
| Owner Occupied Housing Units | 7,117 | 79.9% |
| Renter-Occupied Housing Units | 1,786 | 20.1% |
| Total Occupied Housing Units | 8,903 | 100.0% |
Occupancy by Household Size in Darien
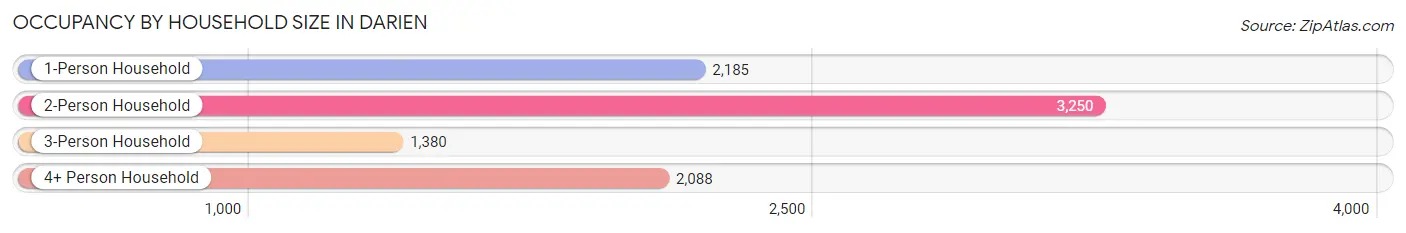
| Household Size | # Housing Units | % Housing Units |
| 1-Person Household | 2,185 | 24.5% |
| 2-Person Household | 3,250 | 36.5% |
| 3-Person Household | 1,380 | 15.5% |
| 4+ Person Household | 2,088 | 23.4% |
| Total Housing Units | 8,903 | 100.0% |
Occupancy by Ownership by Household Size in Darien
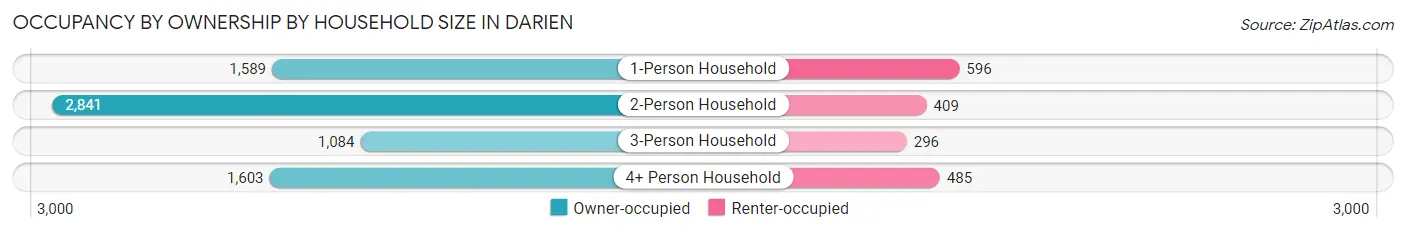
| Household Size | Owner-occupied | Renter-occupied |
| 1-Person Household | 1,589 (72.7%) | 596 (27.3%) |
| 2-Person Household | 2,841 (87.4%) | 409 (12.6%) |
| 3-Person Household | 1,084 (78.5%) | 296 (21.4%) |
| 4+ Person Household | 1,603 (76.8%) | 485 (23.2%) |
| Total Housing Units | 7,117 (79.9%) | 1,786 (20.1%) |
Occupancy by Educational Attainment in Darien
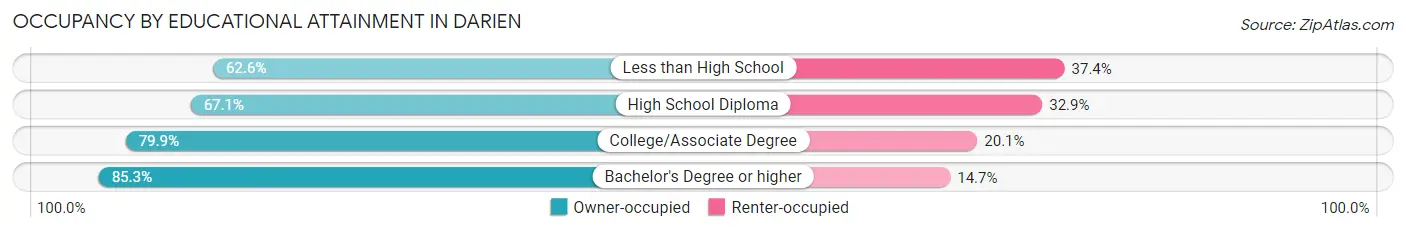
| Household Size | Owner-occupied | Renter-occupied |
| Less than High School | 280 (62.6%) | 167 (37.4%) |
| High School Diploma | 853 (67.1%) | 419 (32.9%) |
| College/Associate Degree | 2,144 (79.9%) | 538 (20.1%) |
| Bachelor's Degree or higher | 3,840 (85.3%) | 662 (14.7%) |
Occupancy by Age of Householder in Darien
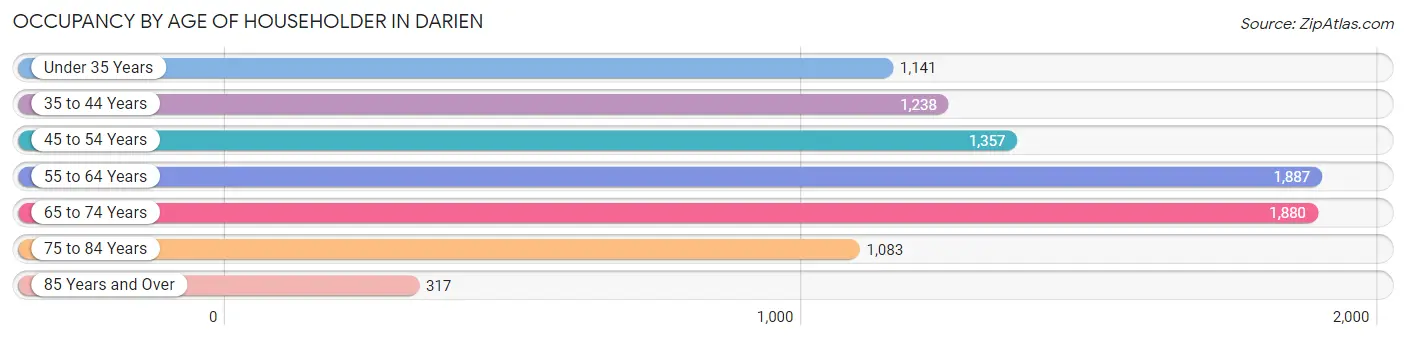
| Age Bracket | # Households | % Households |
| Under 35 Years | 1,141 | 12.8% |
| 35 to 44 Years | 1,238 | 13.9% |
| 45 to 54 Years | 1,357 | 15.2% |
| 55 to 64 Years | 1,887 | 21.2% |
| 65 to 74 Years | 1,880 | 21.1% |
| 75 to 84 Years | 1,083 | 12.2% |
| 85 Years and Over | 317 | 3.6% |
| Total | 8,903 | 100.0% |
Housing Finances in Darien
Median Income by Occupancy in Darien
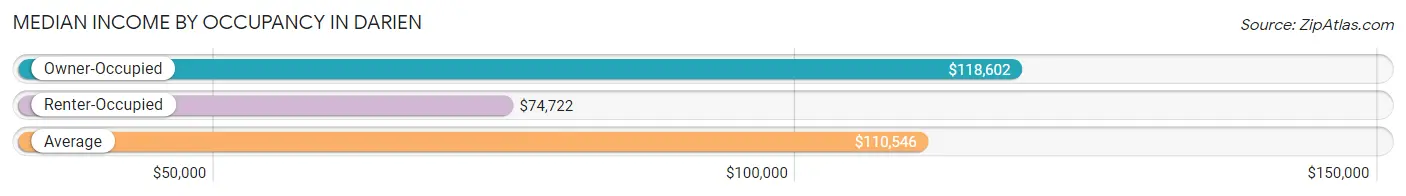
| Occupancy Type | # Households | Median Income |
| Owner-Occupied | 7,117 (79.9%) | $118,602 |
| Renter-Occupied | 1,786 (20.1%) | $74,722 |
| Average | 8,903 (100.0%) | $110,546 |
Occupancy by Householder Income Bracket in Darien
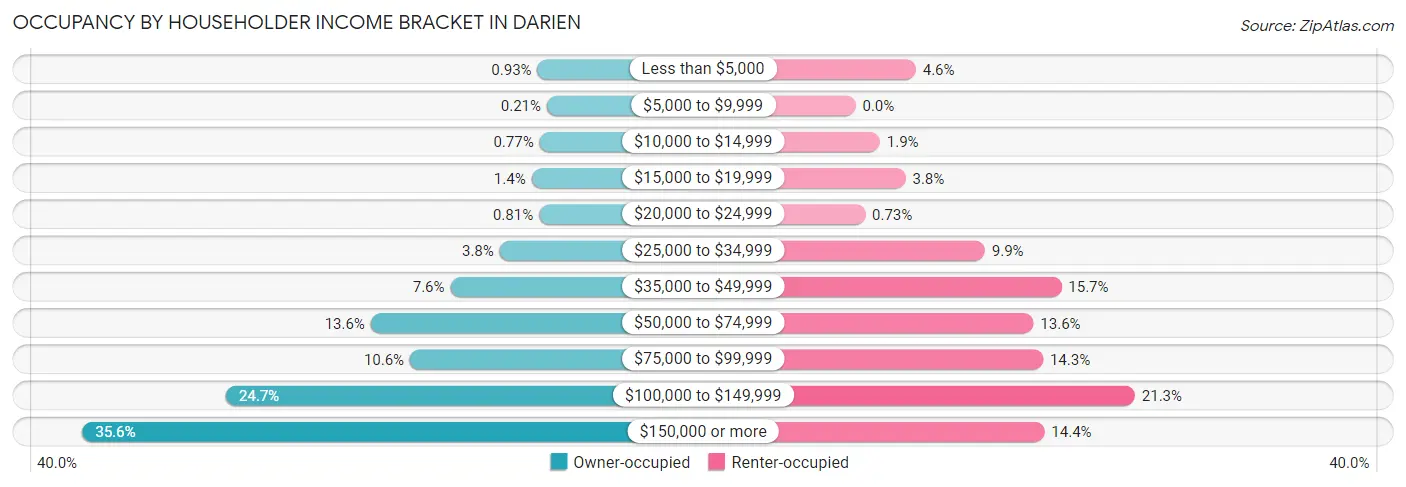
| Income Bracket | Owner-occupied | Renter-occupied |
| Less than $5,000 | 66 (0.9%) | 82 (4.6%) |
| $5,000 to $9,999 | 15 (0.2%) | 0 (0.0%) |
| $10,000 to $14,999 | 55 (0.8%) | 33 (1.8%) |
| $15,000 to $19,999 | 98 (1.4%) | 68 (3.8%) |
| $20,000 to $24,999 | 58 (0.8%) | 13 (0.7%) |
| $25,000 to $34,999 | 271 (3.8%) | 176 (9.9%) |
| $35,000 to $49,999 | 538 (7.6%) | 280 (15.7%) |
| $50,000 to $74,999 | 970 (13.6%) | 242 (13.6%) |
| $75,000 to $99,999 | 757 (10.6%) | 255 (14.3%) |
| $100,000 to $149,999 | 1,755 (24.7%) | 380 (21.3%) |
| $150,000 or more | 2,534 (35.6%) | 257 (14.4%) |
| Total | 7,117 (100.0%) | 1,786 (100.0%) |
Monthly Housing Cost Tiers in Darien
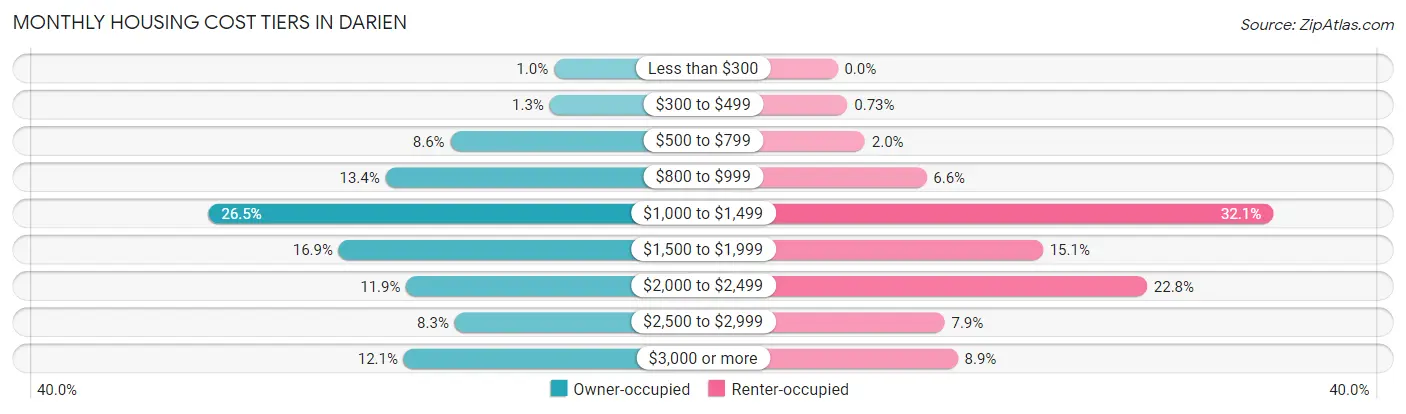
| Monthly Cost | Owner-occupied | Renter-occupied |
| Less than $300 | 72 (1.0%) | 0 (0.0%) |
| $300 to $499 | 95 (1.3%) | 13 (0.7%) |
| $500 to $799 | 615 (8.6%) | 36 (2.0%) |
| $800 to $999 | 955 (13.4%) | 117 (6.6%) |
| $1,000 to $1,499 | 1,883 (26.5%) | 573 (32.1%) |
| $1,500 to $1,999 | 1,200 (16.9%) | 270 (15.1%) |
| $2,000 to $2,499 | 846 (11.9%) | 407 (22.8%) |
| $2,500 to $2,999 | 592 (8.3%) | 141 (7.9%) |
| $3,000 or more | 859 (12.1%) | 158 (8.8%) |
| Total | 7,117 (100.0%) | 1,786 (100.0%) |
Physical Housing Characteristics in Darien
Housing Structures in Darien
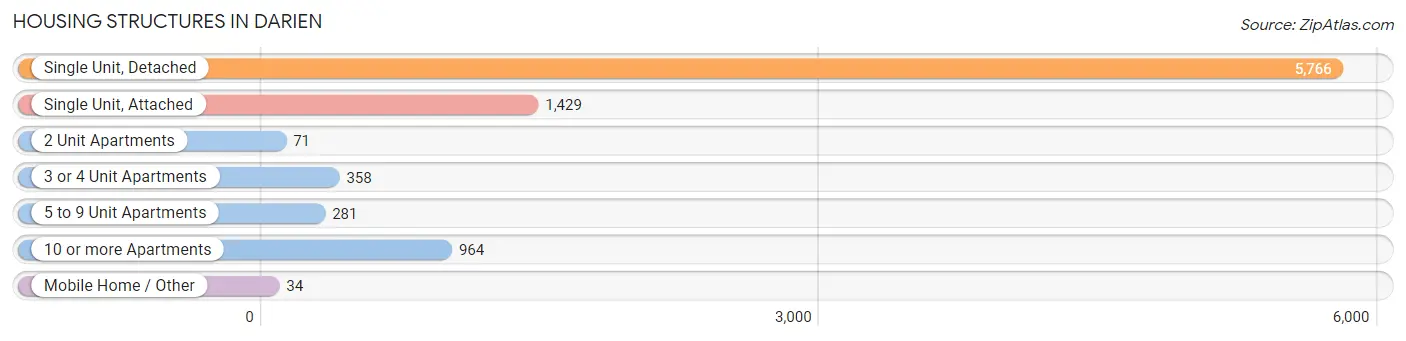
| Structure Type | # Housing Units | % Housing Units |
| Single Unit, Detached | 5,766 | 64.8% |
| Single Unit, Attached | 1,429 | 16.1% |
| 2 Unit Apartments | 71 | 0.8% |
| 3 or 4 Unit Apartments | 358 | 4.0% |
| 5 to 9 Unit Apartments | 281 | 3.2% |
| 10 or more Apartments | 964 | 10.8% |
| Mobile Home / Other | 34 | 0.4% |
| Total | 8,903 | 100.0% |
Housing Structures by Occupancy in Darien
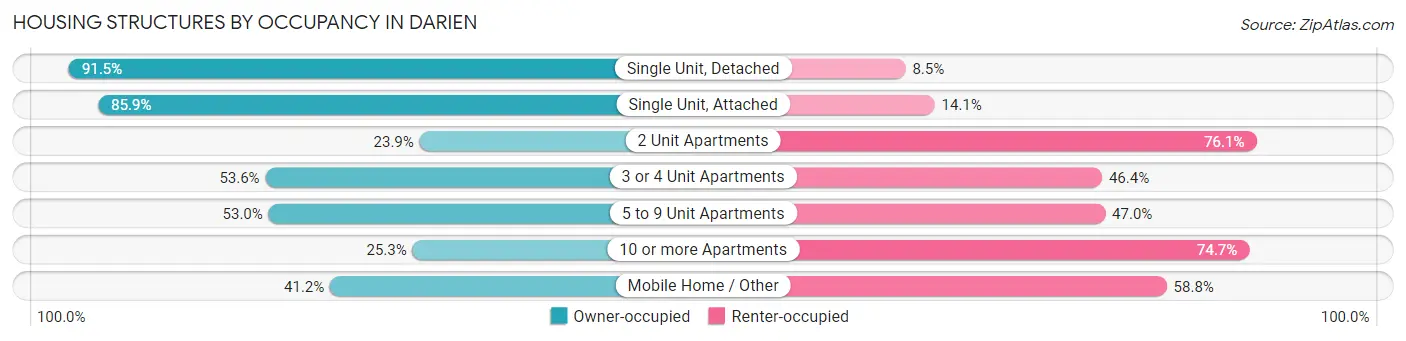
| Structure Type | Owner-occupied | Renter-occupied |
| Single Unit, Detached | 5,274 (91.5%) | 492 (8.5%) |
| Single Unit, Attached | 1,227 (85.9%) | 202 (14.1%) |
| 2 Unit Apartments | 17 (23.9%) | 54 (76.1%) |
| 3 or 4 Unit Apartments | 192 (53.6%) | 166 (46.4%) |
| 5 to 9 Unit Apartments | 149 (53.0%) | 132 (47.0%) |
| 10 or more Apartments | 244 (25.3%) | 720 (74.7%) |
| Mobile Home / Other | 14 (41.2%) | 20 (58.8%) |
| Total | 7,117 (79.9%) | 1,786 (20.1%) |
Housing Structures by Number of Rooms in Darien
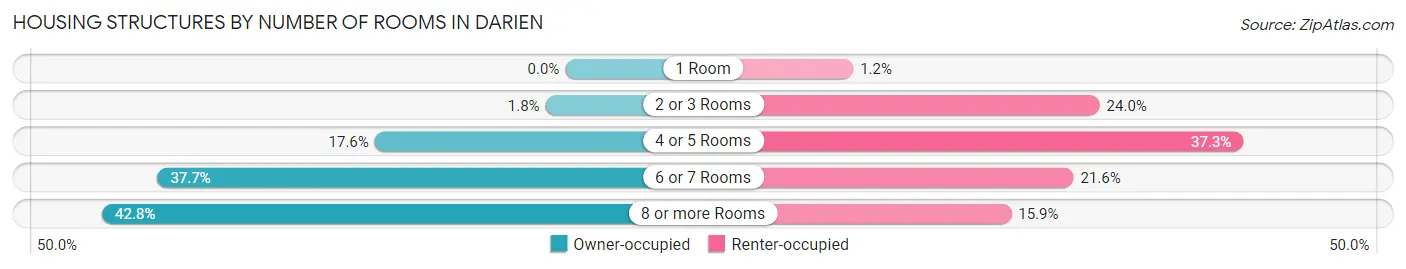
| Number of Rooms | Owner-occupied | Renter-occupied |
| 1 Room | 0 (0.0%) | 22 (1.2%) |
| 2 or 3 Rooms | 130 (1.8%) | 429 (24.0%) |
| 4 or 5 Rooms | 1,255 (17.6%) | 666 (37.3%) |
| 6 or 7 Rooms | 2,684 (37.7%) | 386 (21.6%) |
| 8 or more Rooms | 3,048 (42.8%) | 283 (15.9%) |
| Total | 7,117 (100.0%) | 1,786 (100.0%) |
Housing Structure by Heating Type in Darien
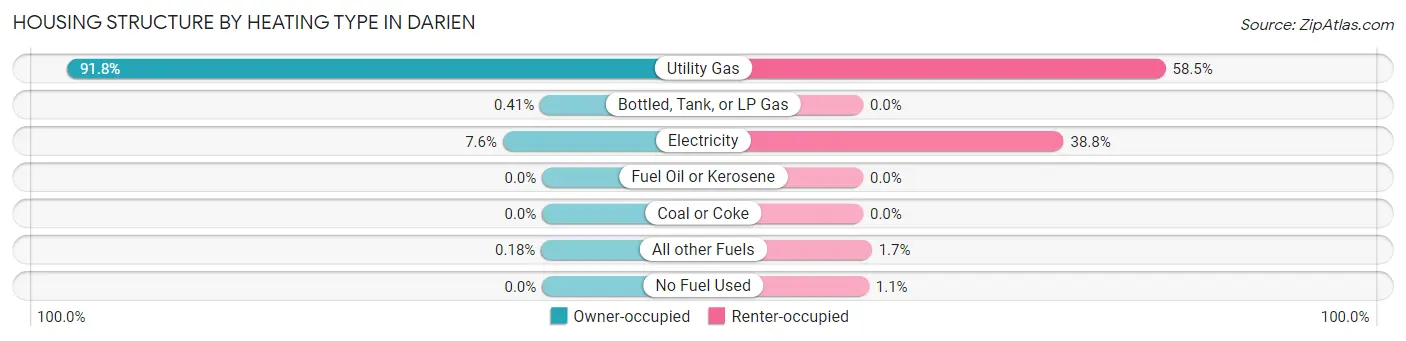
| Heating Type | Owner-occupied | Renter-occupied |
| Utility Gas | 6,534 (91.8%) | 1,044 (58.5%) |
| Bottled, Tank, or LP Gas | 29 (0.4%) | 0 (0.0%) |
| Electricity | 541 (7.6%) | 692 (38.8%) |
| Fuel Oil or Kerosene | 0 (0.0%) | 0 (0.0%) |
| Coal or Coke | 0 (0.0%) | 0 (0.0%) |
| All other Fuels | 13 (0.2%) | 30 (1.7%) |
| No Fuel Used | 0 (0.0%) | 20 (1.1%) |
| Total | 7,117 (100.0%) | 1,786 (100.0%) |
Household Vehicle Usage in Darien
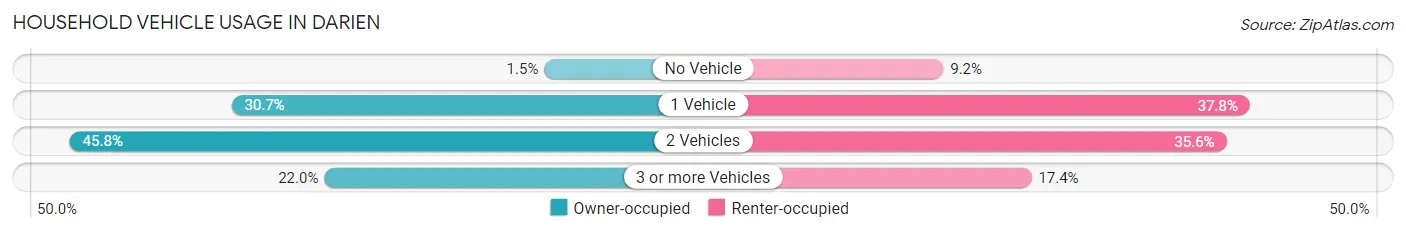
| Vehicles per Household | Owner-occupied | Renter-occupied |
| No Vehicle | 106 (1.5%) | 164 (9.2%) |
| 1 Vehicle | 2,184 (30.7%) | 675 (37.8%) |
| 2 Vehicles | 3,259 (45.8%) | 636 (35.6%) |
| 3 or more Vehicles | 1,568 (22.0%) | 311 (17.4%) |
| Total | 7,117 (100.0%) | 1,786 (100.0%) |
Real Estate & Mortgages in Darien
Real Estate and Mortgage Overview in Darien
| Characteristic | Without Mortgage | With Mortgage |
| Housing Units | 3,238 | 3,879 |
| Median Property Value | $367,900 | $390,900 |
| Median Household Income | $93,466 | $1,673 |
| Monthly Housing Costs | $984 | $859 |
| Real Estate Taxes | $6,816 | $31 |
Property Value by Mortgage Status in Darien
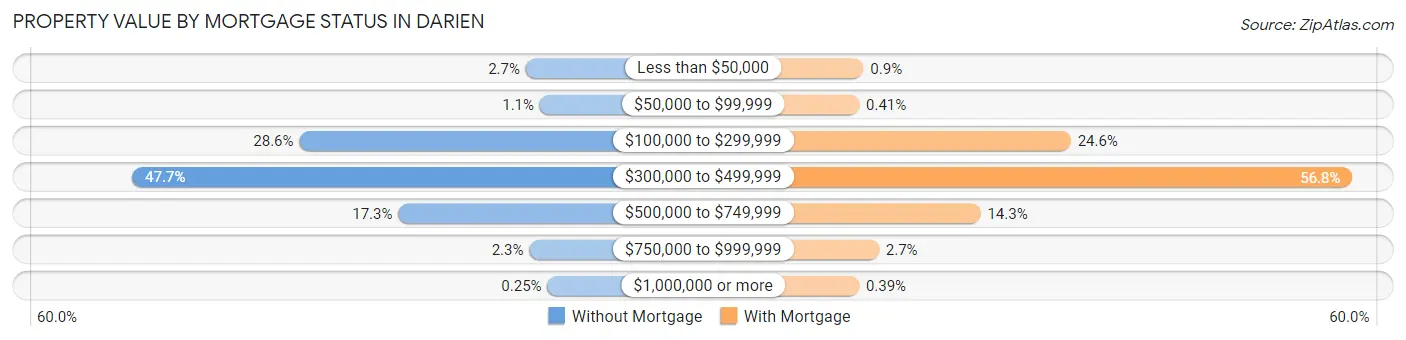
| Property Value | Without Mortgage | With Mortgage |
| Less than $50,000 | 88 (2.7%) | 35 (0.9%) |
| $50,000 to $99,999 | 36 (1.1%) | 16 (0.4%) |
| $100,000 to $299,999 | 926 (28.6%) | 954 (24.6%) |
| $300,000 to $499,999 | 1,545 (47.7%) | 2,202 (56.8%) |
| $500,000 to $749,999 | 560 (17.3%) | 554 (14.3%) |
| $750,000 to $999,999 | 75 (2.3%) | 103 (2.7%) |
| $1,000,000 or more | 8 (0.3%) | 15 (0.4%) |
| Total | 3,238 (100.0%) | 3,879 (100.0%) |
Household Income by Mortgage Status in Darien
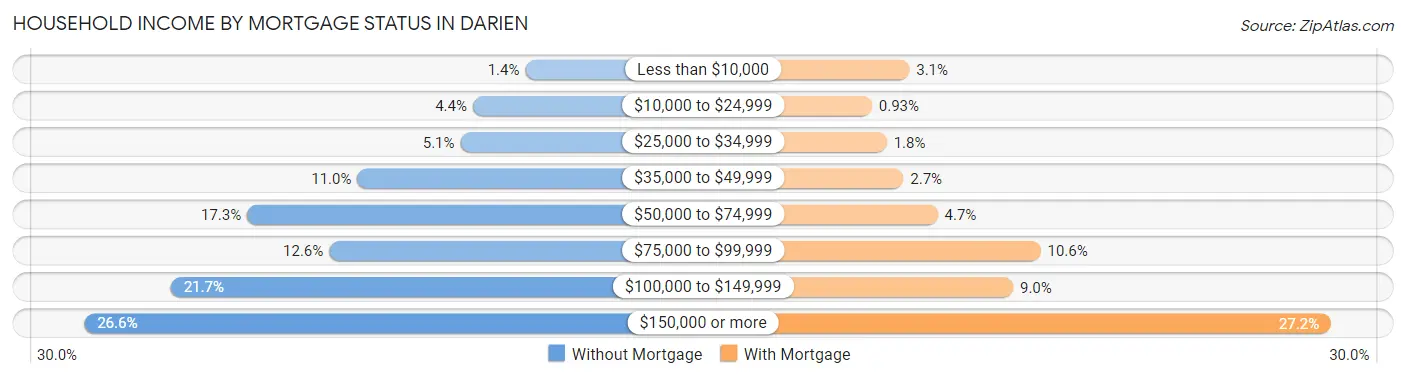
| Household Income | Without Mortgage | With Mortgage |
| Less than $10,000 | 45 (1.4%) | 119 (3.1%) |
| $10,000 to $24,999 | 142 (4.4%) | 36 (0.9%) |
| $25,000 to $34,999 | 165 (5.1%) | 69 (1.8%) |
| $35,000 to $49,999 | 356 (11.0%) | 106 (2.7%) |
| $50,000 to $74,999 | 560 (17.3%) | 182 (4.7%) |
| $75,000 to $99,999 | 408 (12.6%) | 410 (10.6%) |
| $100,000 to $149,999 | 701 (21.6%) | 349 (9.0%) |
| $150,000 or more | 861 (26.6%) | 1,054 (27.2%) |
| Total | 3,238 (100.0%) | 3,879 (100.0%) |
Property Value to Household Income Ratio in Darien
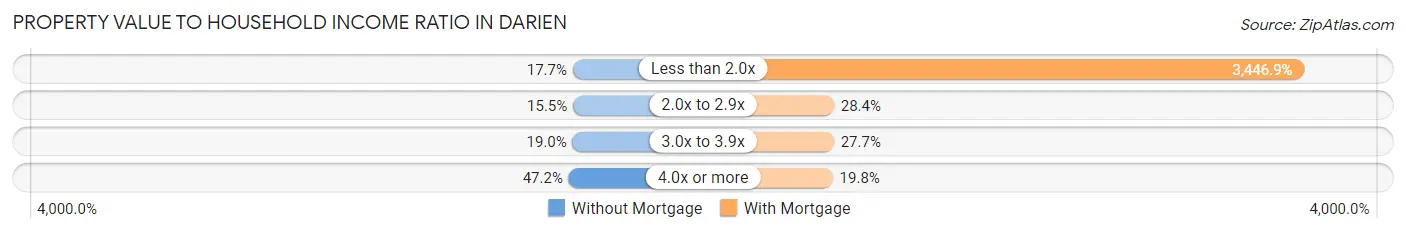
| Value-to-Income Ratio | Without Mortgage | With Mortgage |
| Less than 2.0x | 573 (17.7%) | 133,705 (3,446.9%) |
| 2.0x to 2.9x | 502 (15.5%) | 1,100 (28.4%) |
| 3.0x to 3.9x | 615 (19.0%) | 1,073 (27.7%) |
| 4.0x or more | 1,528 (47.2%) | 766 (19.8%) |
| Total | 3,238 (100.0%) | 3,879 (100.0%) |
Real Estate Taxes by Mortgage Status in Darien
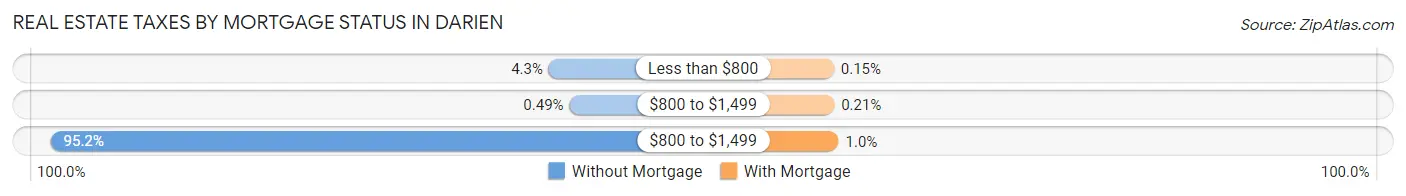
| Property Taxes | Without Mortgage | With Mortgage |
| Less than $800 | 138 (4.3%) | 6 (0.2%) |
| $800 to $1,499 | 16 (0.5%) | 8 (0.2%) |
| $800 to $1,499 | 3,084 (95.2%) | 39 (1.0%) |
| Total | 3,238 (100.0%) | 3,879 (100.0%) |
Health & Disability in Darien
Health Insurance Coverage by Age in Darien
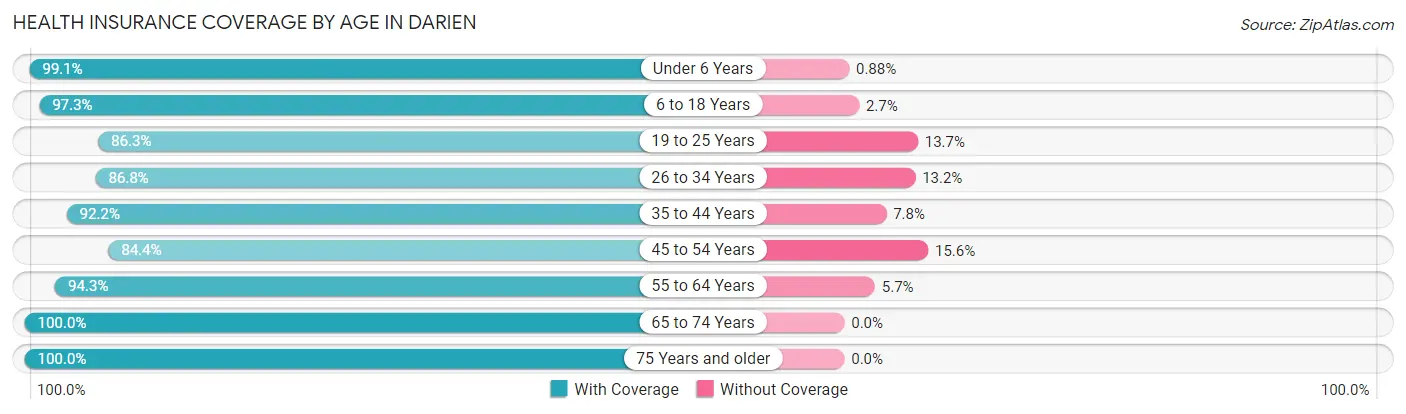
| Age Bracket | With Coverage | Without Coverage |
| Under 6 Years | 1,128 (99.1%) | 10 (0.9%) |
| 6 to 18 Years | 2,810 (97.3%) | 79 (2.7%) |
| 19 to 25 Years | 1,480 (86.3%) | 235 (13.7%) |
| 26 to 34 Years | 2,134 (86.8%) | 325 (13.2%) |
| 35 to 44 Years | 2,569 (92.2%) | 218 (7.8%) |
| 45 to 54 Years | 2,139 (84.4%) | 396 (15.6%) |
| 55 to 64 Years | 3,082 (94.3%) | 186 (5.7%) |
| 65 to 74 Years | 3,115 (100.0%) | 0 (0.0%) |
| 75 Years and older | 2,047 (100.0%) | 0 (0.0%) |
| Total | 20,504 (93.4%) | 1,449 (6.6%) |
Health Insurance Coverage by Citizenship Status in Darien
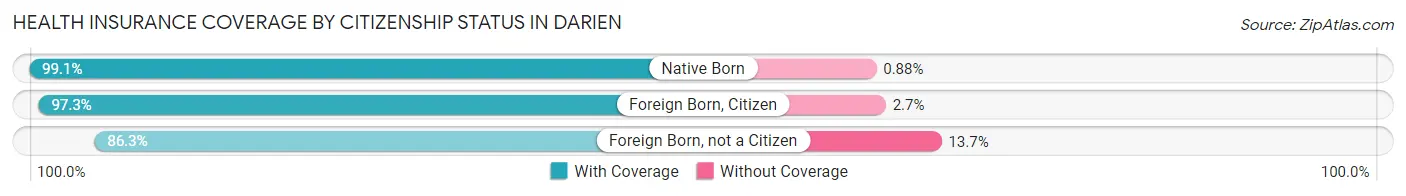
| Citizenship Status | With Coverage | Without Coverage |
| Native Born | 1,128 (99.1%) | 10 (0.9%) |
| Foreign Born, Citizen | 2,810 (97.3%) | 79 (2.7%) |
| Foreign Born, not a Citizen | 1,480 (86.3%) | 235 (13.7%) |
Health Insurance Coverage by Household Income in Darien
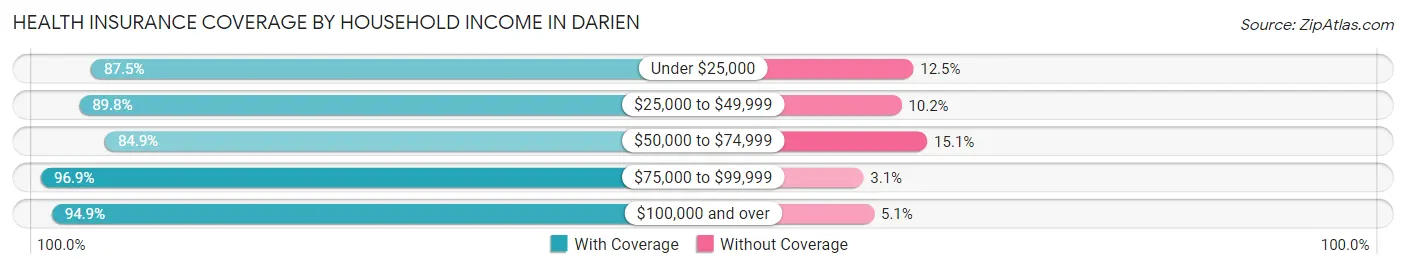
| Household Income | With Coverage | Without Coverage |
| Under $25,000 | 583 (87.5%) | 83 (12.5%) |
| $25,000 to $49,999 | 2,165 (89.8%) | 247 (10.2%) |
| $50,000 to $74,999 | 1,771 (84.9%) | 314 (15.1%) |
| $75,000 to $99,999 | 2,439 (96.9%) | 78 (3.1%) |
| $100,000 and over | 13,526 (94.9%) | 727 (5.1%) |
Public vs Private Health Insurance Coverage by Age in Darien
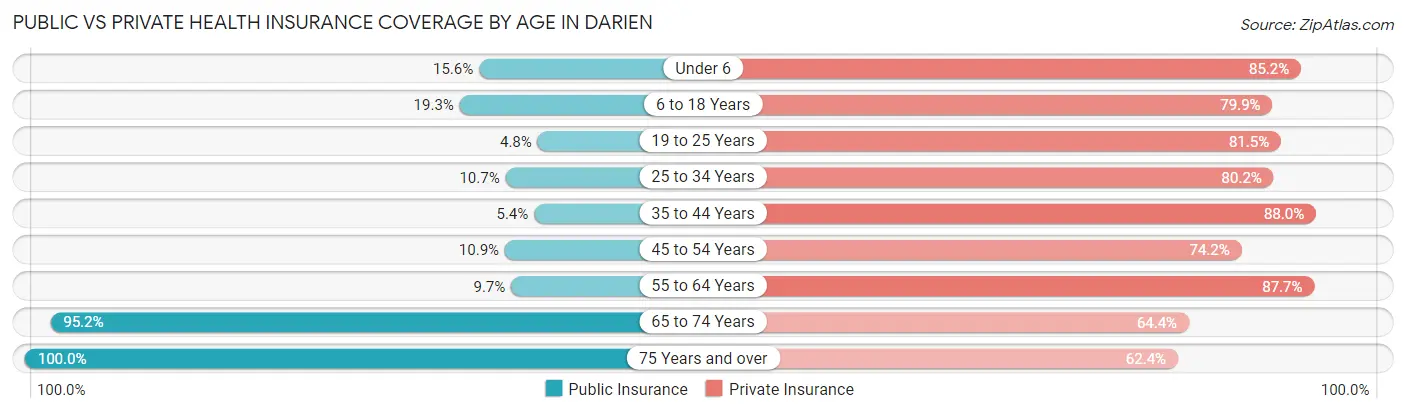
| Age Bracket | Public Insurance | Private Insurance |
| Under 6 | 178 (15.6%) | 970 (85.2%) |
| 6 to 18 Years | 556 (19.3%) | 2,309 (79.9%) |
| 19 to 25 Years | 82 (4.8%) | 1,398 (81.5%) |
| 25 to 34 Years | 264 (10.7%) | 1,971 (80.1%) |
| 35 to 44 Years | 151 (5.4%) | 2,453 (88.0%) |
| 45 to 54 Years | 275 (10.8%) | 1,881 (74.2%) |
| 55 to 64 Years | 317 (9.7%) | 2,866 (87.7%) |
| 65 to 74 Years | 2,966 (95.2%) | 2,007 (64.4%) |
| 75 Years and over | 2,046 (100.0%) | 1,277 (62.4%) |
| Total | 6,835 (31.1%) | 17,132 (78.0%) |
Disability Status by Sex by Age in Darien
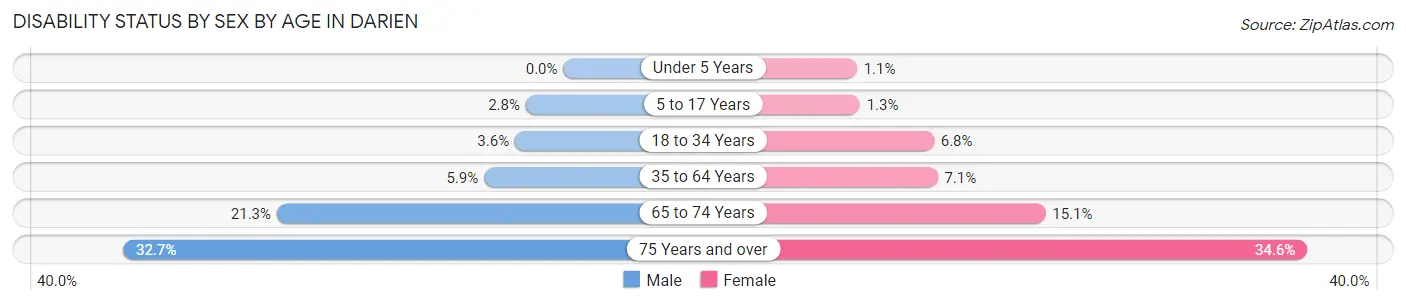
| Age Bracket | Male | Female |
| Under 5 Years | 0 (0.0%) | 6 (1.1%) |
| 5 to 17 Years | 41 (2.8%) | 21 (1.3%) |
| 18 to 34 Years | 83 (3.6%) | 137 (6.8%) |
| 35 to 64 Years | 254 (5.9%) | 304 (7.1%) |
| 65 to 74 Years | 298 (21.3%) | 259 (15.1%) |
| 75 Years and over | 337 (32.7%) | 351 (34.5%) |
Disability Class by Sex by Age in Darien
Disability Class: Hearing Difficulty
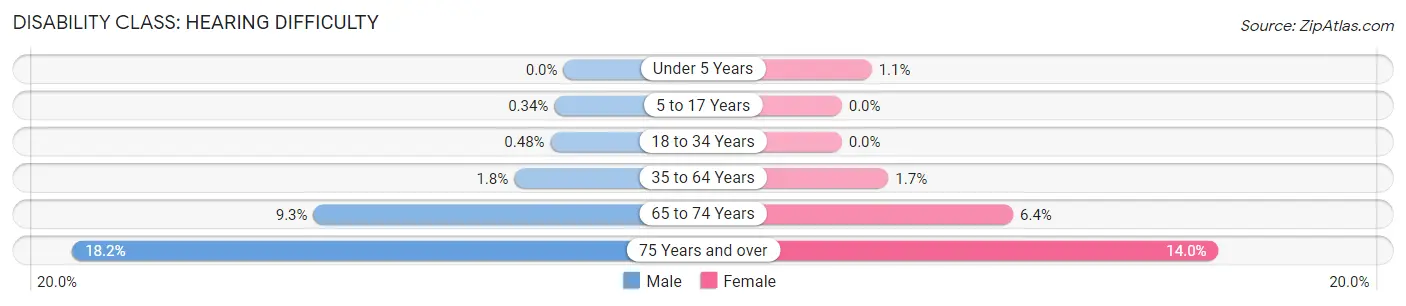
| Age Bracket | Male | Female |
| Under 5 Years | 0 (0.0%) | 6 (1.1%) |
| 5 to 17 Years | 5 (0.3%) | 0 (0.0%) |
| 18 to 34 Years | 11 (0.5%) | 0 (0.0%) |
| 35 to 64 Years | 79 (1.8%) | 74 (1.7%) |
| 65 to 74 Years | 130 (9.3%) | 109 (6.4%) |
| 75 Years and over | 188 (18.2%) | 142 (14.0%) |
Disability Class: Vision Difficulty
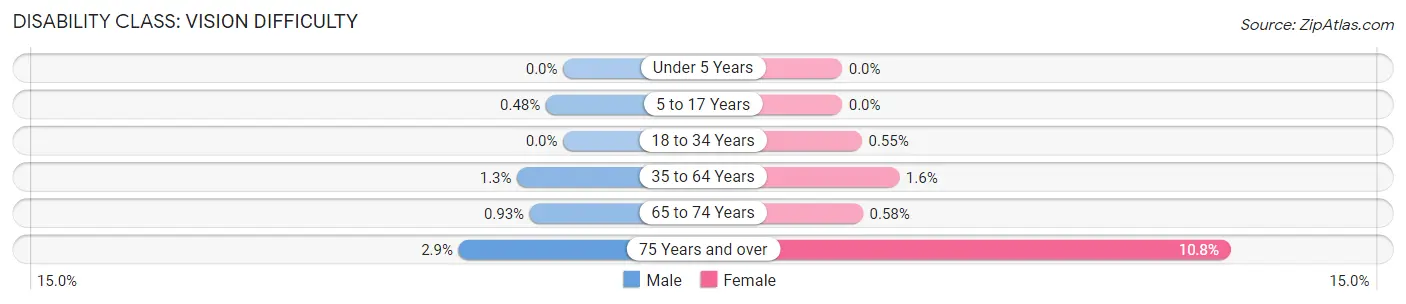
| Age Bracket | Male | Female |
| Under 5 Years | 0 (0.0%) | 0 (0.0%) |
| 5 to 17 Years | 7 (0.5%) | 0 (0.0%) |
| 18 to 34 Years | 0 (0.0%) | 11 (0.5%) |
| 35 to 64 Years | 55 (1.3%) | 68 (1.6%) |
| 65 to 74 Years | 13 (0.9%) | 10 (0.6%) |
| 75 Years and over | 30 (2.9%) | 110 (10.8%) |
Disability Class: Cognitive Difficulty
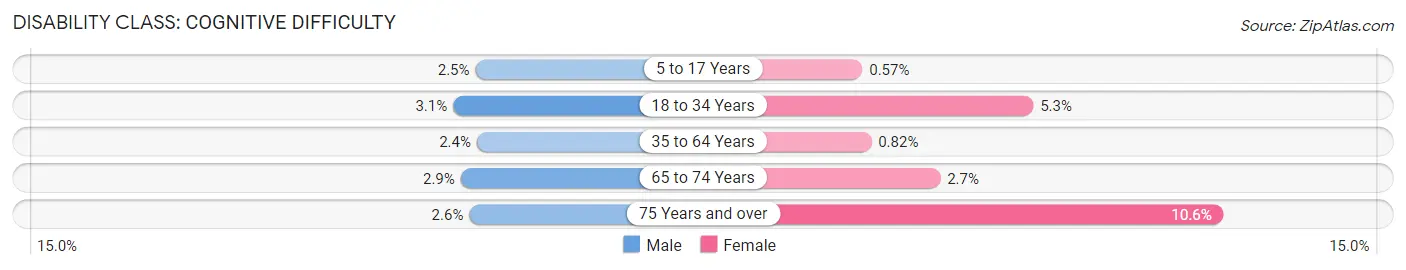
| Age Bracket | Male | Female |
| 5 to 17 Years | 36 (2.5%) | 9 (0.6%) |
| 18 to 34 Years | 71 (3.1%) | 107 (5.3%) |
| 35 to 64 Years | 104 (2.4%) | 35 (0.8%) |
| 65 to 74 Years | 40 (2.9%) | 47 (2.7%) |
| 75 Years and over | 27 (2.6%) | 108 (10.6%) |
Disability Class: Ambulatory Difficulty
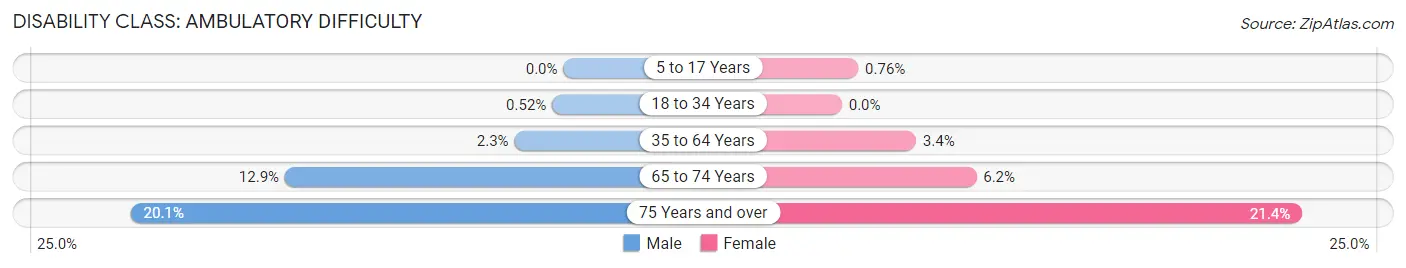
| Age Bracket | Male | Female |
| 5 to 17 Years | 0 (0.0%) | 12 (0.8%) |
| 18 to 34 Years | 12 (0.5%) | 0 (0.0%) |
| 35 to 64 Years | 98 (2.3%) | 147 (3.4%) |
| 65 to 74 Years | 181 (12.9%) | 107 (6.2%) |
| 75 Years and over | 207 (20.1%) | 217 (21.4%) |
Disability Class: Self-Care Difficulty
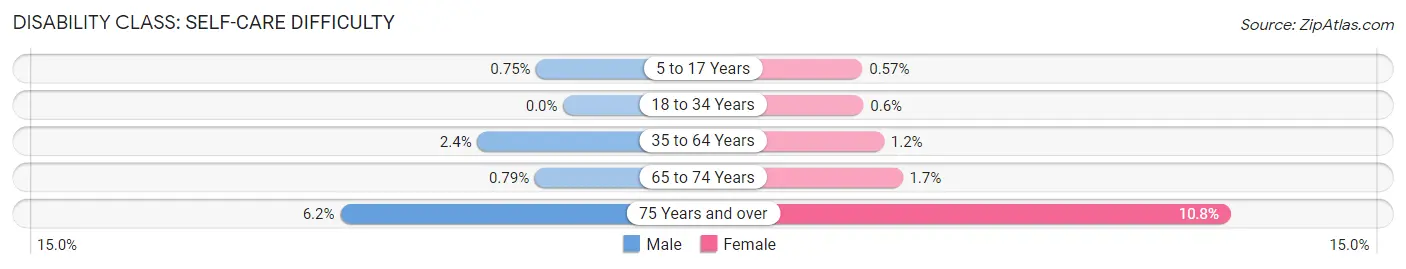
| Age Bracket | Male | Female |
| 5 to 17 Years | 11 (0.7%) | 9 (0.6%) |
| 18 to 34 Years | 0 (0.0%) | 12 (0.6%) |
| 35 to 64 Years | 103 (2.4%) | 50 (1.2%) |
| 65 to 74 Years | 11 (0.8%) | 29 (1.7%) |
| 75 Years and over | 64 (6.2%) | 110 (10.8%) |
Technology Access in Darien
Computing Device Access in Darien
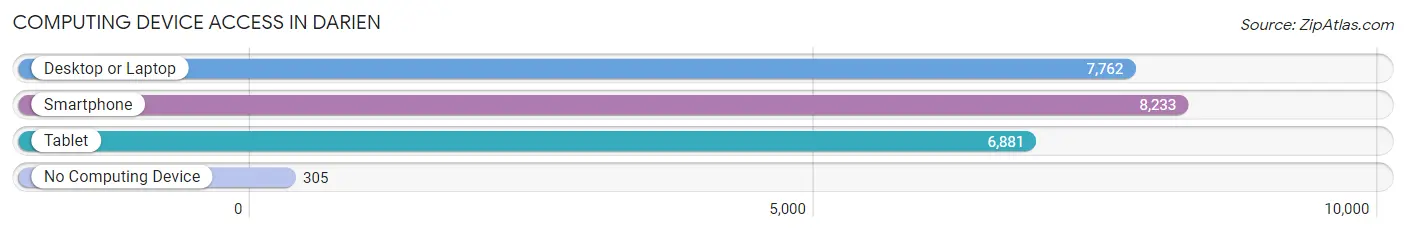
| Device Type | # Households | % Households |
| Desktop or Laptop | 7,762 | 87.2% |
| Smartphone | 8,233 | 92.5% |
| Tablet | 6,881 | 77.3% |
| No Computing Device | 305 | 3.4% |
| Total | 8,903 | 100.0% |
Internet Access in Darien
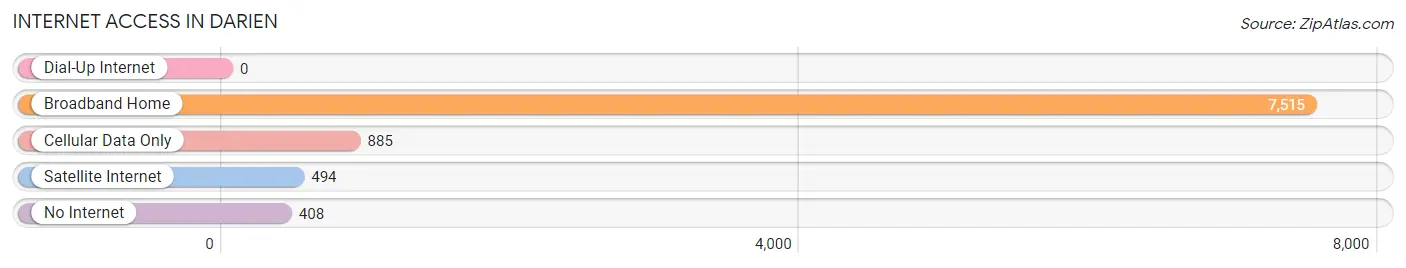
| Internet Type | # Households | % Households |
| Dial-Up Internet | 0 | 0.0% |
| Broadband Home | 7,515 | 84.4% |
| Cellular Data Only | 885 | 9.9% |
| Satellite Internet | 494 | 5.6% |
| No Internet | 408 | 4.6% |
| Total | 8,903 | 100.0% |
Darien Summary
Darien, Illinois is a city located in DuPage County, Illinois, United States. It is a suburb of Chicago, located approximately 25 miles southwest of the city. As of the 2010 census, the population of Darien was 22,086.
History
The area that is now Darien was first settled in the 1830s by a group of German immigrants. The town was originally known as Lace, after the lace factory that was built there in 1837. The name was changed to Darien in 1881, after the city of Darien, Connecticut.
The city was incorporated in 1871, and the first mayor was elected in 1872. The city grew rapidly in the late 19th and early 20th centuries, and by the 1950s, it had become a popular suburb of Chicago.
Geography
Darien is located in northeastern Illinois, in DuPage County. It is bordered by the cities of Downers Grove to the north, Woodridge to the east, Willowbrook to the south, and Burr Ridge to the west. The city covers an area of 8.3 square miles, and is located approximately 25 miles southwest of downtown Chicago.
The city is situated on the Des Plaines River, and is home to several parks and recreational areas, including the Darien Sportsplex, the Darien Park District, and the Darien Nature Center.
Economy
The economy of Darien is largely based on the service industry, with many residents employed in retail, healthcare, and education. The city is also home to several corporate headquarters, including the headquarters of the American Academy of Pediatrics, the American College of Radiology, and the American Society of Anesthesiologists.
Demographics
As of the 2010 census, the population of Darien was 22,086. The racial makeup of the city was 87.2% White, 4.2% Asian, 3.2% African American, and 2.3% Hispanic or Latino. The median household income was $90,945, and the median family income was $103,945.
The city is home to a large number of families, with nearly half of all households having children under the age of 18. The city also has a large number of college-educated adults, with nearly 40% of the population having a bachelor's degree or higher.
Conclusion
Darien, Illinois is a city located in DuPage County, Illinois, United States. It is a suburb of Chicago, located approximately 25 miles southwest of the city. As of the 2010 census, the population of Darien was 22,086. The city has a long history, dating back to the 1830s, and has grown rapidly in the late 19th and early 20th centuries. The economy of Darien is largely based on the service industry, with many residents employed in retail, healthcare, and education. The racial makeup of the city is 87.2% White, 4.2% Asian, 3.2% African American, and 2.3% Hispanic or Latino. The median household income was $90,945, and the median family income was $103,945. Darien is home to a large number of families, with nearly half of all households having children under the age of 18. The city also has a large number of college-educated adults, with nearly 40% of the population having a bachelor's degree or higher.
Common Questions
What is Per Capita Income in Darien?
Per Capita income in Darien is $55,911.
What is the Median Family Income in Darien?
Median Family Income in Darien is $123,518.
What is the Median Household income in Darien?
Median Household Income in Darien is $110,546.
What is Income or Wage Gap in Darien?
Income or Wage Gap in Darien is 35.0%.
Women in Darien earn 65.0 cents for every dollar earned by a man.
What is Inequality or Gini Index in Darien?
Inequality or Gini Index in Darien is 0.42.
What is the Total Population of Darien?
Total Population of Darien is 21,953.
What is the Total Male Population of Darien?
Total Male Population of Darien is 10,821.
What is the Total Female Population of Darien?
Total Female Population of Darien is 11,132.
What is the Ratio of Males per 100 Females in Darien?
There are 97.21 Males per 100 Females in Darien.
What is the Ratio of Females per 100 Males in Darien?
There are 102.87 Females per 100 Males in Darien.
What is the Median Population Age in Darien?
Median Population Age in Darien is 45.0 Years.
What is the Average Family Size in Darien
Average Family Size in Darien is 2.9 People.
What is the Average Household Size in Darien
Average Household Size in Darien is 2.5 People.
How Large is the Labor Force in Darien?
There are 12,361 People in the Labor Forcein in Darien.
What is the Percentage of People in the Labor Force in Darien?
67.0% of People are in the Labor Force in Darien.
What is the Unemployment Rate in Darien?
Unemployment Rate in Darien is 4.1%.