Salt Lake City, UT Map & Demographics
Salt Lake City Map
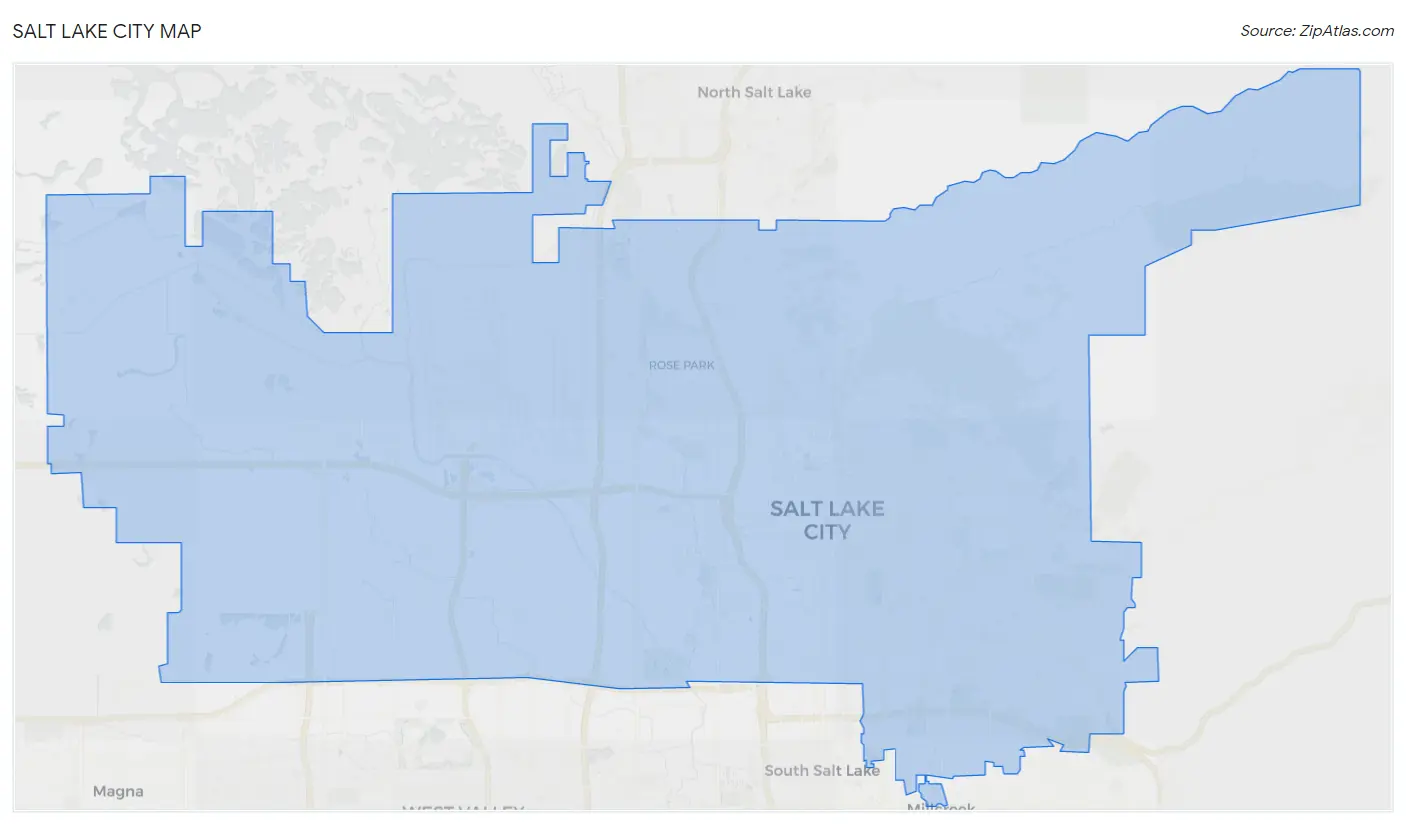
Salt Lake City Overview
$46,972
PER CAPITA INCOME
$101,026
AVG FAMILY INCOME
$72,357
AVG HOUSEHOLD INCOME
24.5%
WAGE / INCOME GAP [ % ]
75.5¢/ $1
WAGE / INCOME GAP [ $ ]
$11,423
FAMILY INCOME DEFICIT
0.50
INEQUALITY / GINI INDEX
201,269
TOTAL POPULATION
103,899
MALE POPULATION
97,370
FEMALE POPULATION
106.71
MALES / 100 FEMALES
93.72
FEMALES / 100 MALES
32.5
MEDIAN AGE
3.1
AVG FAMILY SIZE
2.3
AVG HOUSEHOLD SIZE
123,323
LABOR FORCE [ PEOPLE ]
73.0%
PERCENT IN LABOR FORCE
3.6%
UNEMPLOYMENT RATE
Salt Lake City Zip Codes
Income in Salt Lake City
Income Overview in Salt Lake City
Per Capita Income in Salt Lake City is $46,972, while median incomes of families and households are $101,026 and $72,357 respectively.
| Characteristic | Number | Measure |
| Per Capita Income | 201,269 | $46,972 |
| Median Family Income | 39,611 | $101,026 |
| Mean Family Income | 39,611 | $145,874 |
| Median Household Income | 85,435 | $72,357 |
| Mean Household Income | 85,435 | $107,280 |
| Income Deficit | 39,611 | $11,423 |
| Wage / Income Gap (%) | 201,269 | 24.53% |
| Wage / Income Gap ($) | 201,269 | 75.47¢ per $1 |
| Gini / Inequality Index | 201,269 | 0.50 |
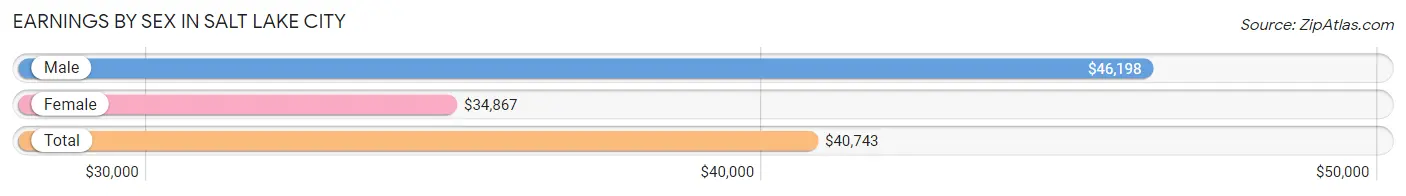
Earnings by Sex in Salt Lake City
Average Earnings in Salt Lake City are $40,743, $46,198 for men and $34,867 for women, a difference of 24.5%.
| Sex | Number | Average Earnings |
| Male | 70,782 (54.7%) | $46,198 |
| Female | 58,578 (45.3%) | $34,867 |
| Total | 129,360 (100.0%) | $40,743 |
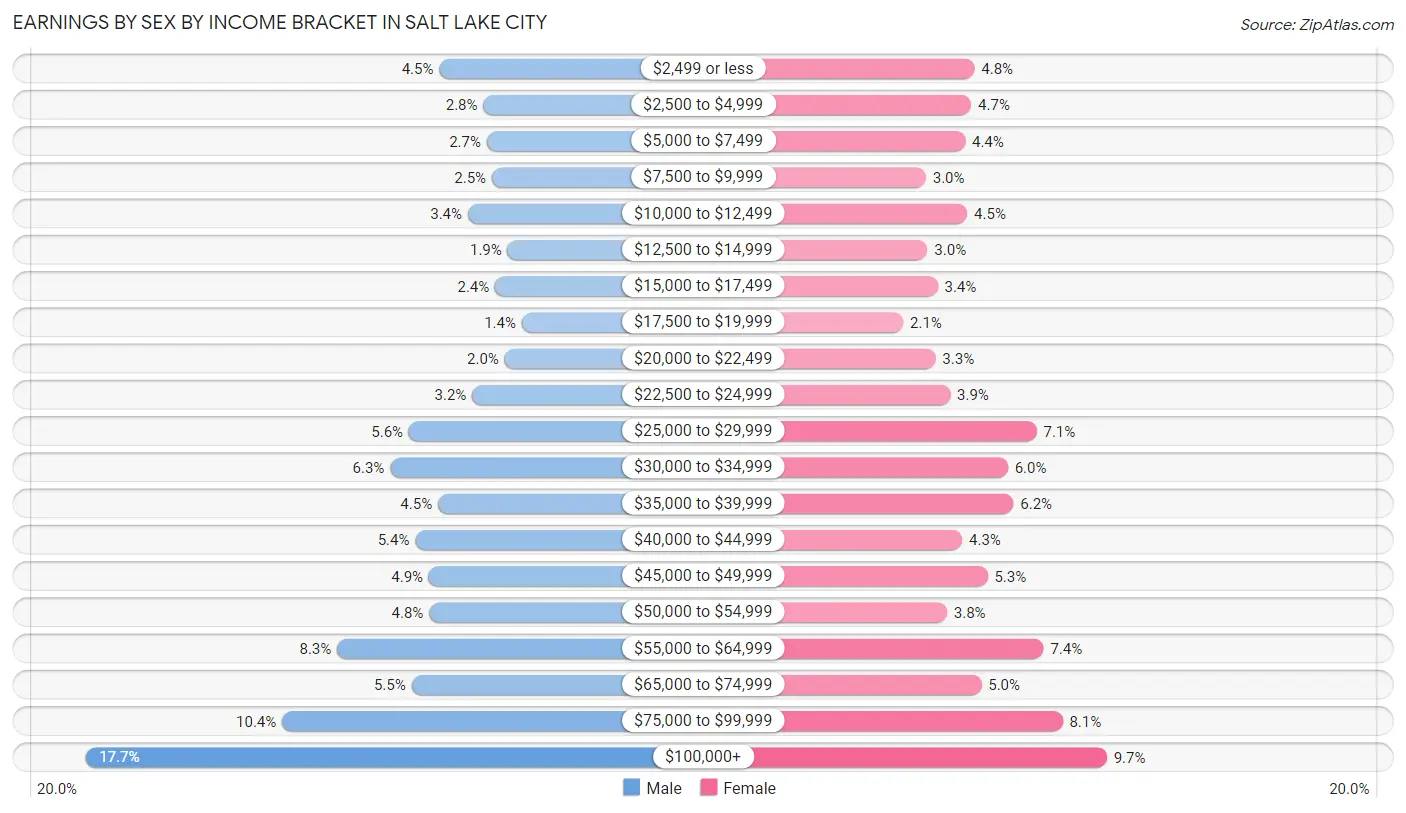
Earnings by Sex by Income Bracket in Salt Lake City
The most common earnings brackets in Salt Lake City are $100,000+ for men (12,519 | 17.7%) and $100,000+ for women (5,706 | 9.7%).
| Income | Male | Female |
| $2,499 or less | 3,159 (4.5%) | 2,799 (4.8%) |
| $2,500 to $4,999 | 1,988 (2.8%) | 2,730 (4.7%) |
| $5,000 to $7,499 | 1,894 (2.7%) | 2,596 (4.4%) |
| $7,500 to $9,999 | 1,761 (2.5%) | 1,736 (3.0%) |
| $10,000 to $12,499 | 2,397 (3.4%) | 2,640 (4.5%) |
| $12,500 to $14,999 | 1,347 (1.9%) | 1,768 (3.0%) |
| $15,000 to $17,499 | 1,681 (2.4%) | 1,991 (3.4%) |
| $17,500 to $19,999 | 970 (1.4%) | 1,234 (2.1%) |
| $20,000 to $22,499 | 1,424 (2.0%) | 1,944 (3.3%) |
| $22,500 to $24,999 | 2,285 (3.2%) | 2,267 (3.9%) |
| $25,000 to $29,999 | 3,966 (5.6%) | 4,163 (7.1%) |
| $30,000 to $34,999 | 4,459 (6.3%) | 3,533 (6.0%) |
| $35,000 to $39,999 | 3,194 (4.5%) | 3,654 (6.2%) |
| $40,000 to $44,999 | 3,793 (5.4%) | 2,530 (4.3%) |
| $45,000 to $49,999 | 3,431 (4.9%) | 3,087 (5.3%) |
| $50,000 to $54,999 | 3,425 (4.8%) | 2,195 (3.7%) |
| $55,000 to $64,999 | 5,867 (8.3%) | 4,319 (7.4%) |
| $65,000 to $74,999 | 3,895 (5.5%) | 2,955 (5.0%) |
| $75,000 to $99,999 | 7,327 (10.3%) | 4,731 (8.1%) |
| $100,000+ | 12,519 (17.7%) | 5,706 (9.7%) |
| Total | 70,782 (100.0%) | 58,578 (100.0%) |
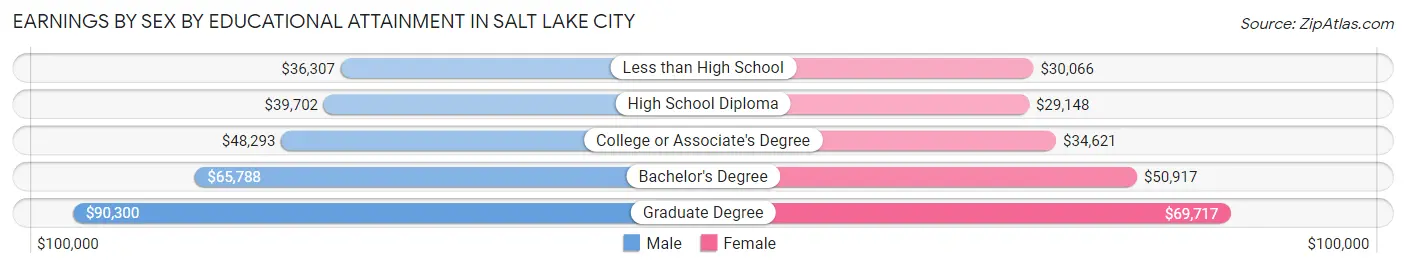
Earnings by Sex by Educational Attainment in Salt Lake City
Average earnings in Salt Lake City are $54,942 for men and $43,737 for women, a difference of 20.4%. Men with an educational attainment of graduate degree enjoy the highest average annual earnings of $90,300, while those with less than high school education earn the least with $36,307. Women with an educational attainment of graduate degree earn the most with the average annual earnings of $69,717, while those with high school diploma education have the smallest earnings of $29,148.
| Educational Attainment | Male Income | Female Income |
| Less than High School | $36,307 | $30,066 |
| High School Diploma | $39,702 | $29,148 |
| College or Associate's Degree | $48,293 | $34,621 |
| Bachelor's Degree | $65,788 | $50,917 |
| Graduate Degree | $90,300 | $69,717 |
| Total | $54,942 | $43,737 |
Family Income in Salt Lake City
Family Income Brackets in Salt Lake City
According to the Salt Lake City family income data, there are 8,120 families falling into the $100,000 to $149,999 income range, which is the most common income bracket and makes up 20.5% of all families. Conversely, the $10,000 to $14,999 income bracket is the least frequent group with only 673 families (1.7%) belonging to this category.
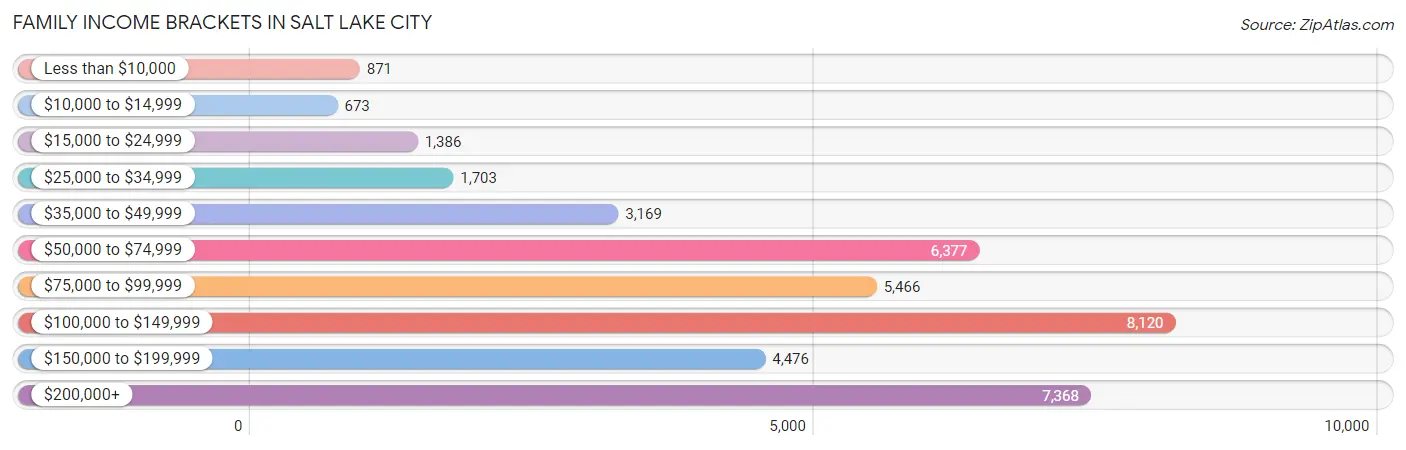
| Income Bracket | # Families | % Families |
| Less than $10,000 | 871 | 2.2% |
| $10,000 to $14,999 | 673 | 1.7% |
| $15,000 to $24,999 | 1,386 | 3.5% |
| $25,000 to $34,999 | 1,703 | 4.3% |
| $35,000 to $49,999 | 3,169 | 8.0% |
| $50,000 to $74,999 | 6,377 | 16.1% |
| $75,000 to $99,999 | 5,466 | 13.8% |
| $100,000 to $149,999 | 8,120 | 20.5% |
| $150,000 to $199,999 | 4,476 | 11.3% |
| $200,000+ | 7,368 | 18.6% |
Family Income by Famaliy Size in Salt Lake City
4-person families (6,661 | 16.8%) account for the highest median family income in Salt Lake City with $117,263 per family, while 2-person families (20,567 | 51.9%) have the highest median income of $45,562 per family member.
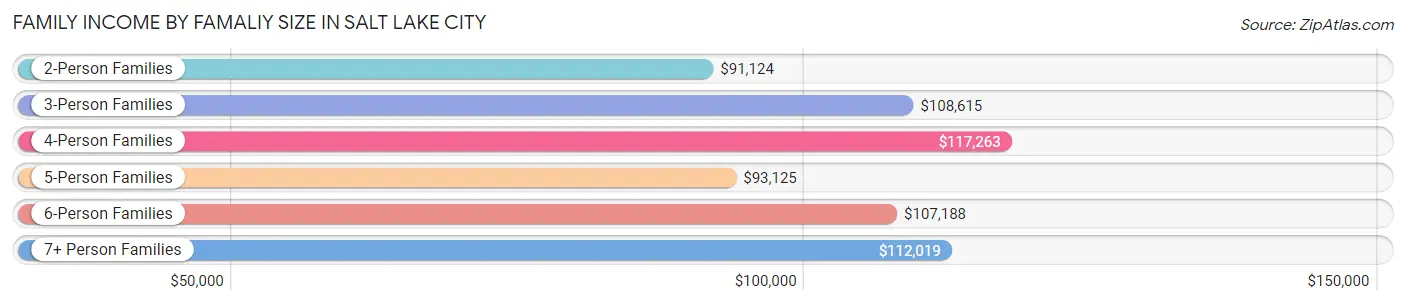
| Income Bracket | # Families | Median Income |
| 2-Person Families | 20,567 (51.9%) | $91,124 |
| 3-Person Families | 7,104 (17.9%) | $108,615 |
| 4-Person Families | 6,661 (16.8%) | $117,263 |
| 5-Person Families | 2,716 (6.9%) | $93,125 |
| 6-Person Families | 1,350 (3.4%) | $107,188 |
| 7+ Person Families | 1,213 (3.1%) | $112,019 |
| Total | 39,611 (100.0%) | $101,026 |
Family Income by Number of Earners in Salt Lake City
The median family income in Salt Lake City is $101,026, with families comprising 3+ earners (4,819) having the highest median family income of $134,511, while families with no earners (3,874) have the lowest median family income of $58,864, accounting for 12.2% and 9.8% of families, respectively.
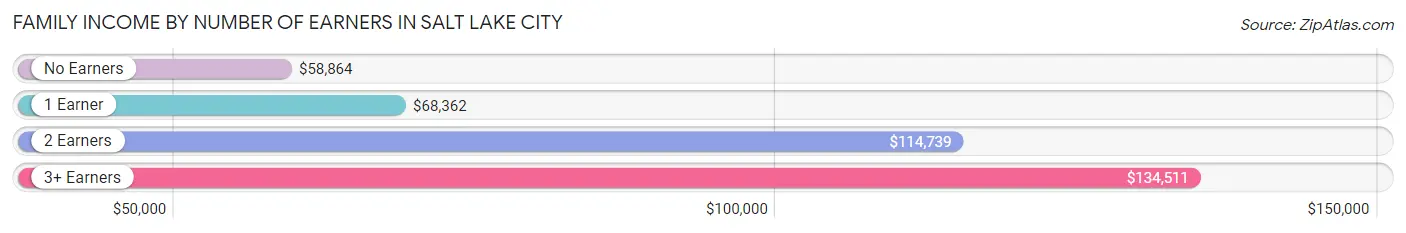
| Number of Earners | # Families | Median Income |
| No Earners | 3,874 (9.8%) | $58,864 |
| 1 Earner | 10,799 (27.3%) | $68,362 |
| 2 Earners | 20,119 (50.8%) | $114,739 |
| 3+ Earners | 4,819 (12.2%) | $134,511 |
| Total | 39,611 (100.0%) | $101,026 |
Household Income in Salt Lake City
Household Income Brackets in Salt Lake City
With 14,780 households falling in the category, the $50,000 to $74,999 income range is the most frequent in Salt Lake City, accounting for 17.3% of all households. In contrast, only 3,930 households (4.6%) fall into the $10,000 to $14,999 income bracket, making it the least populous group.
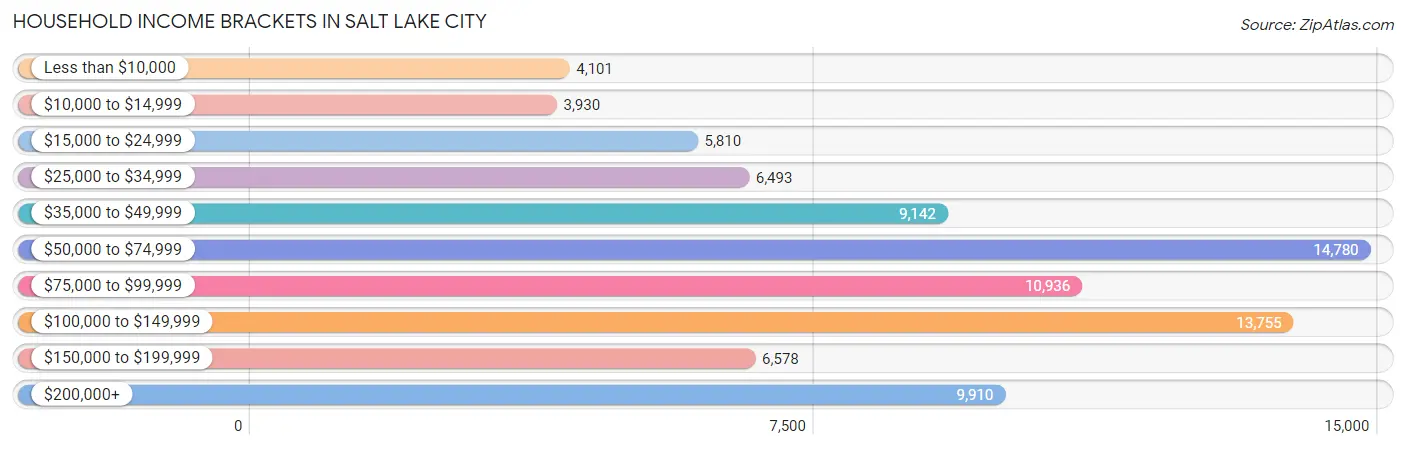
| Income Bracket | # Households | % Households |
| Less than $10,000 | 4,101 | 4.8% |
| $10,000 to $14,999 | 3,930 | 4.6% |
| $15,000 to $24,999 | 5,810 | 6.8% |
| $25,000 to $34,999 | 6,493 | 7.6% |
| $35,000 to $49,999 | 9,142 | 10.7% |
| $50,000 to $74,999 | 14,780 | 17.3% |
| $75,000 to $99,999 | 10,936 | 12.8% |
| $100,000 to $149,999 | 13,755 | 16.1% |
| $150,000 to $199,999 | 6,578 | 7.7% |
| $200,000+ | 9,910 | 11.6% |
Household Income by Householder Age in Salt Lake City
The median household income in Salt Lake City is $72,357, with the highest median household income of $83,000 found in the 25 to 44 years age bracket for the primary householder. A total of 36,795 households (43.1%) fall into this category. Meanwhile, the 15 to 24 years age bracket for the primary householder has the lowest median household income of $41,275, with 8,682 households (10.2%) in this group.
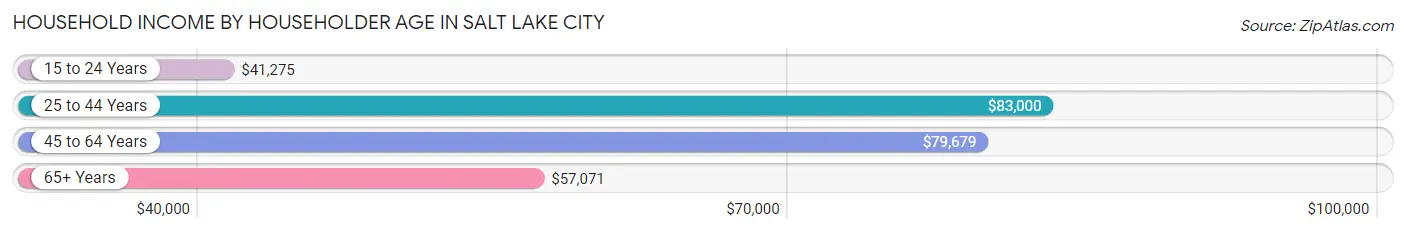
| Income Bracket | # Households | Median Income |
| 15 to 24 Years | 8,682 (10.2%) | $41,275 |
| 25 to 44 Years | 36,795 (43.1%) | $83,000 |
| 45 to 64 Years | 24,163 (28.3%) | $79,679 |
| 65+ Years | 15,795 (18.5%) | $57,071 |
| Total | 85,435 (100.0%) | $72,357 |
Poverty in Salt Lake City
Income Below Poverty by Sex and Age in Salt Lake City
With 13.4% poverty level for males and 14.8% for females among the residents of Salt Lake City, 18 to 24 year old males and 18 to 24 year old females are the most vulnerable to poverty, with 4,030 males (30.8%) and 4,696 females (35.2%) in their respective age groups living below the poverty level.
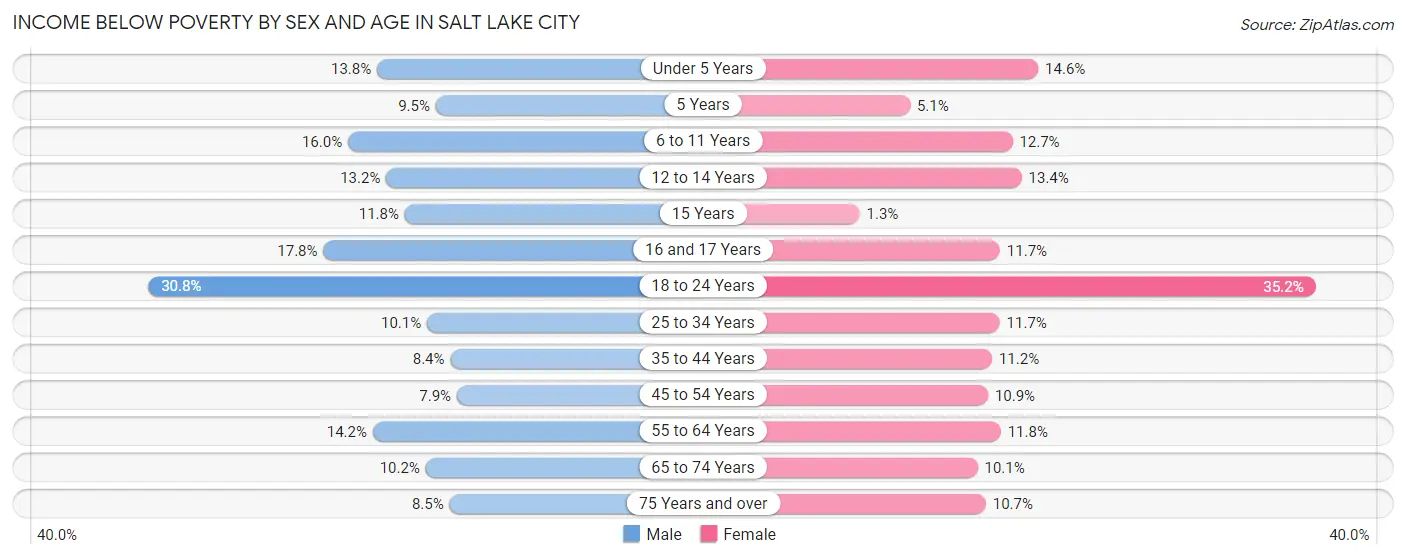
| Age Bracket | Male | Female |
| Under 5 Years | 730 (13.8%) | 729 (14.6%) |
| 5 Years | 101 (9.5%) | 58 (5.1%) |
| 6 to 11 Years | 975 (16.0%) | 732 (12.7%) |
| 12 to 14 Years | 368 (13.2%) | 416 (13.4%) |
| 15 Years | 117 (11.8%) | 10 (1.3%) |
| 16 and 17 Years | 383 (17.8%) | 185 (11.7%) |
| 18 to 24 Years | 4,030 (30.8%) | 4,696 (35.2%) |
| 25 to 34 Years | 2,216 (10.1%) | 2,299 (11.7%) |
| 35 to 44 Years | 1,275 (8.4%) | 1,385 (11.2%) |
| 45 to 54 Years | 893 (7.9%) | 1,083 (10.8%) |
| 55 to 64 Years | 1,388 (14.1%) | 1,099 (11.8%) |
| 65 to 74 Years | 748 (10.2%) | 706 (10.1%) |
| 75 Years and over | 315 (8.5%) | 534 (10.7%) |
| Total | 13,539 (13.4%) | 13,932 (14.8%) |
Income Above Poverty by Sex and Age in Salt Lake City
According to the poverty statistics in Salt Lake City, males aged 45 to 54 years and females aged 15 years are the age groups that are most secure financially, with 92.1% of males and 98.7% of females in these age groups living above the poverty line.
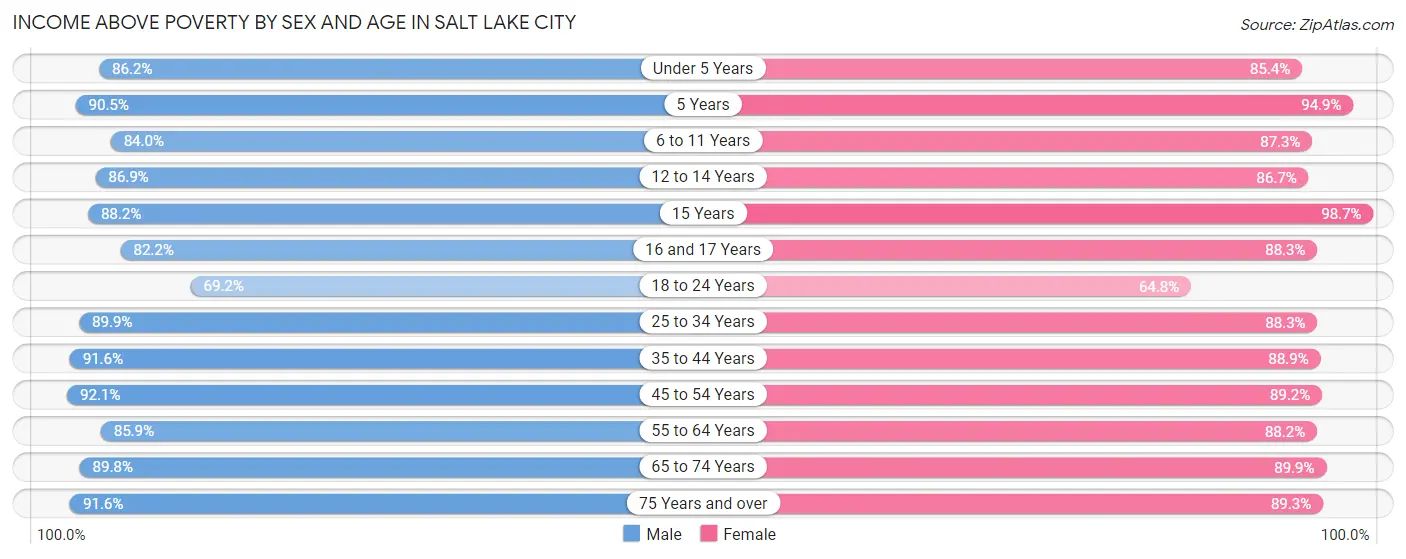
| Age Bracket | Male | Female |
| Under 5 Years | 4,548 (86.2%) | 4,270 (85.4%) |
| 5 Years | 966 (90.5%) | 1,089 (94.9%) |
| 6 to 11 Years | 5,121 (84.0%) | 5,046 (87.3%) |
| 12 to 14 Years | 2,431 (86.9%) | 2,701 (86.7%) |
| 15 Years | 877 (88.2%) | 746 (98.7%) |
| 16 and 17 Years | 1,766 (82.2%) | 1,391 (88.3%) |
| 18 to 24 Years | 9,045 (69.2%) | 8,658 (64.8%) |
| 25 to 34 Years | 19,687 (89.9%) | 17,322 (88.3%) |
| 35 to 44 Years | 13,921 (91.6%) | 11,040 (88.8%) |
| 45 to 54 Years | 10,405 (92.1%) | 8,899 (89.1%) |
| 55 to 64 Years | 8,419 (85.9%) | 8,213 (88.2%) |
| 65 to 74 Years | 6,568 (89.8%) | 6,301 (89.9%) |
| 75 Years and over | 3,415 (91.5%) | 4,460 (89.3%) |
| Total | 87,169 (86.6%) | 80,136 (85.2%) |
Income Below Poverty Among Married-Couple Families in Salt Lake City
The poverty statistics for married-couple families in Salt Lake City show that 4.8% or 1,447 of the total 29,890 families live below the poverty line. Families with 5 or more children have the highest poverty rate of 14.0%, comprising of 58 families. On the other hand, families with 1 or 2 children have the lowest poverty rate of 4.0%, which includes 377 families.
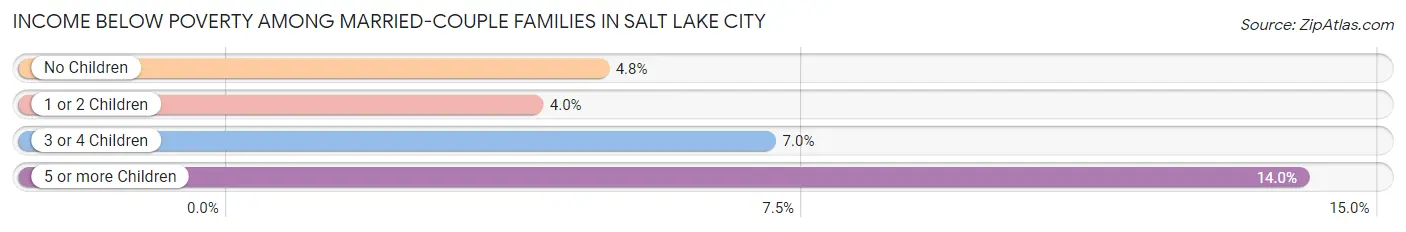
| Children | Above Poverty | Below Poverty |
| No Children | 17,122 (95.2%) | 871 (4.8%) |
| 1 or 2 Children | 9,096 (96.0%) | 377 (4.0%) |
| 3 or 4 Children | 1,868 (93.0%) | 141 (7.0%) |
| 5 or more Children | 357 (86.0%) | 58 (14.0%) |
| Total | 28,443 (95.2%) | 1,447 (4.8%) |
Income Below Poverty Among Single-Parent Households in Salt Lake City
According to the poverty data in Salt Lake City, 9.5% or 342 single-father households and 16.7% or 1,023 single-mother households are living below the poverty line. Among single-father households, those with 3 or 4 children have the highest poverty rate, with 56 households (15.1%) experiencing poverty. Likewise, among single-mother households, those with 5 or more children have the highest poverty rate, with 188 households (78.7%) falling below the poverty line.
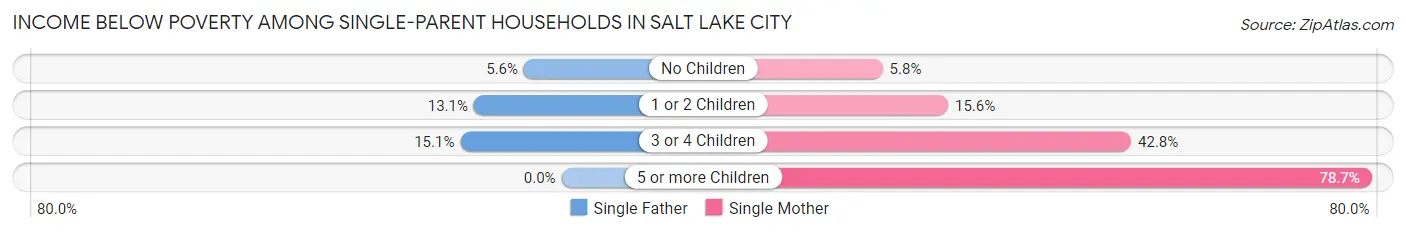
| Children | Single Father | Single Mother |
| No Children | 98 (5.6%) | 134 (5.8%) |
| 1 or 2 Children | 188 (13.1%) | 471 (15.5%) |
| 3 or 4 Children | 56 (15.1%) | 230 (42.8%) |
| 5 or more Children | 0 (0.0%) | 188 (78.7%) |
| Total | 342 (9.5%) | 1,023 (16.7%) |
Income Below Poverty Among Married-Couple vs Single-Parent Households in Salt Lake City
The poverty data for Salt Lake City shows that 1,447 of the married-couple family households (4.8%) and 1,365 of the single-parent households (14.0%) are living below the poverty level. Within the married-couple family households, those with 5 or more children have the highest poverty rate, with 58 households (14.0%) falling below the poverty line. Among the single-parent households, those with 5 or more children have the highest poverty rate, with 188 household (65.0%) living below poverty.
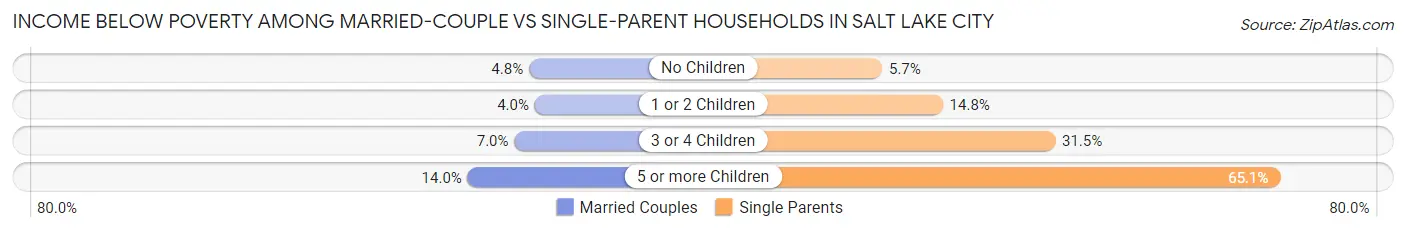
| Children | Married-Couple Families | Single-Parent Households |
| No Children | 871 (4.8%) | 232 (5.7%) |
| 1 or 2 Children | 377 (4.0%) | 659 (14.7%) |
| 3 or 4 Children | 141 (7.0%) | 286 (31.5%) |
| 5 or more Children | 58 (14.0%) | 188 (65.0%) |
| Total | 1,447 (4.8%) | 1,365 (14.0%) |
Race in Salt Lake City
The most populous races in Salt Lake City are White / Caucasian (143,588 | 71.3%), Hispanic or Latino (39,988 | 19.9%), and Some other Race (18,675 | 9.3%).
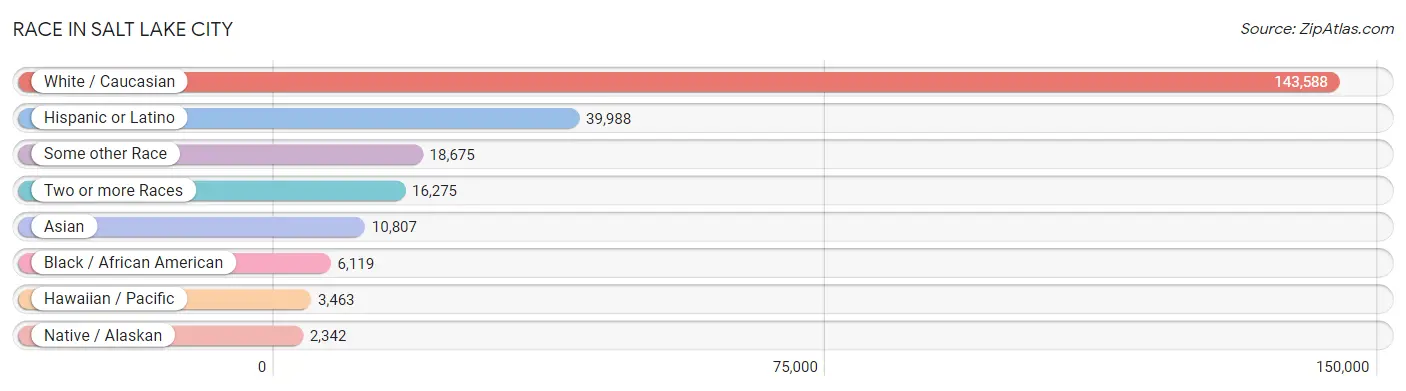
| Race | # Population | % Population |
| Asian | 10,807 | 5.4% |
| Black / African American | 6,119 | 3.0% |
| Hawaiian / Pacific | 3,463 | 1.7% |
| Hispanic or Latino | 39,988 | 19.9% |
| Native / Alaskan | 2,342 | 1.2% |
| White / Caucasian | 143,588 | 71.3% |
| Two or more Races | 16,275 | 8.1% |
| Some other Race | 18,675 | 9.3% |
| Total | 201,269 | 100.0% |
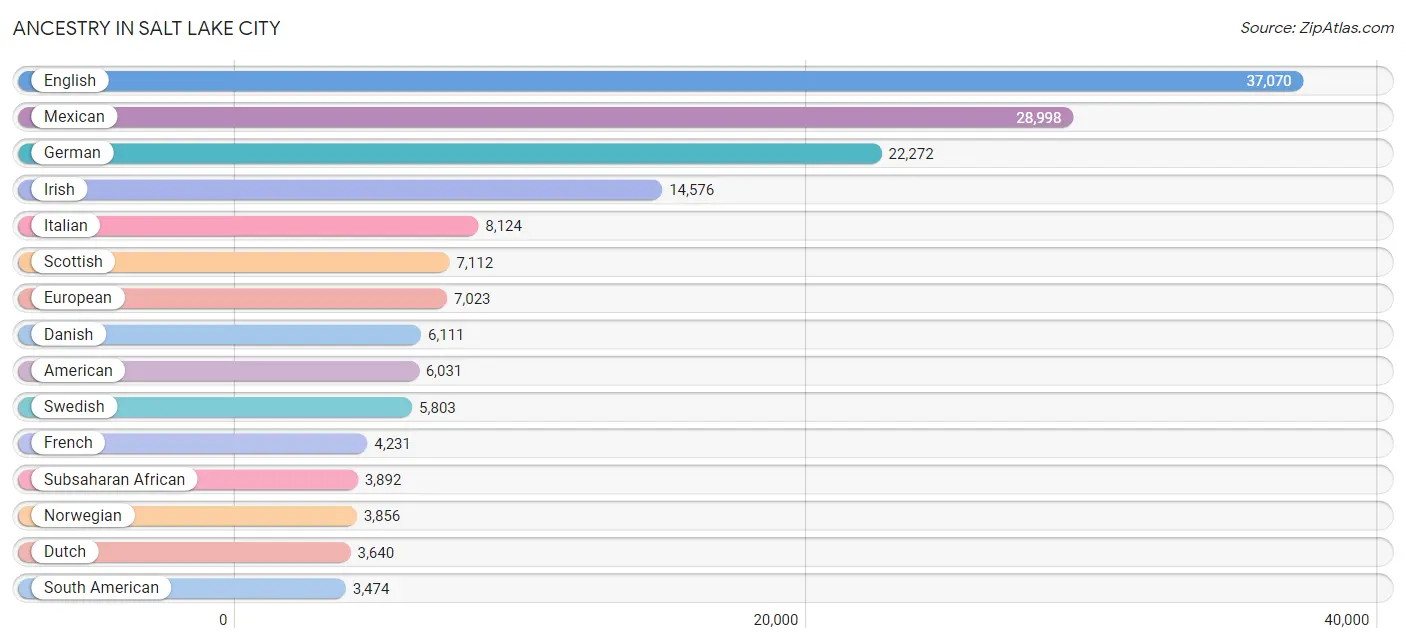
Ancestry in Salt Lake City
The most populous ancestries reported in Salt Lake City are English (37,070 | 18.4%), Mexican (28,998 | 14.4%), German (22,272 | 11.1%), Irish (14,576 | 7.2%), and Italian (8,124 | 4.0%), together accounting for 55.2% of all Salt Lake City residents.
| Ancestry | # Population | % Population |
| Afghan | 195 | 0.1% |
| African | 599 | 0.3% |
| Alaskan Athabascan | 38 | 0.0% |
| Albanian | 49 | 0.0% |
| American | 6,031 | 3.0% |
| Apache | 89 | 0.0% |
| Arab | 977 | 0.5% |
| Arapaho | 70 | 0.0% |
| Argentinean | 184 | 0.1% |
| Armenian | 162 | 0.1% |
| Assyrian / Chaldean / Syriac | 8 | 0.0% |
| Australian | 74 | 0.0% |
| Austrian | 463 | 0.2% |
| Bangladeshi | 78 | 0.0% |
| Basque | 109 | 0.1% |
| Belgian | 234 | 0.1% |
| Bhutanese | 1,932 | 1.0% |
| Blackfeet | 345 | 0.2% |
| Bolivian | 81 | 0.0% |
| Brazilian | 592 | 0.3% |
| British | 3,344 | 1.7% |
| Bulgarian | 45 | 0.0% |
| Burmese | 833 | 0.4% |
| Cajun | 65 | 0.0% |
| Cambodian | 13 | 0.0% |
| Canadian | 449 | 0.2% |
| Celtic | 15 | 0.0% |
| Central American | 2,529 | 1.3% |
| Central American Indian | 236 | 0.1% |
| Cherokee | 429 | 0.2% |
| Cheyenne | 58 | 0.0% |
| Chilean | 549 | 0.3% |
| Chippewa | 14 | 0.0% |
| Choctaw | 151 | 0.1% |
| Colombian | 630 | 0.3% |
| Comanche | 7 | 0.0% |
| Costa Rican | 194 | 0.1% |
| Cree | 25 | 0.0% |
| Creek | 5 | 0.0% |
| Croatian | 305 | 0.2% |
| Crow | 63 | 0.0% |
| Cuban | 636 | 0.3% |
| Czech | 695 | 0.4% |
| Czechoslovakian | 85 | 0.0% |
| Danish | 6,111 | 3.0% |
| Dominican | 243 | 0.1% |
| Dutch | 3,640 | 1.8% |
| Eastern European | 716 | 0.4% |
| Ecuadorian | 118 | 0.1% |
| Egyptian | 203 | 0.1% |
| English | 37,070 | 18.4% |
| Estonian | 35 | 0.0% |
| Ethiopian | 331 | 0.2% |
| European | 7,023 | 3.5% |
| Filipino | 160 | 0.1% |
| Finnish | 280 | 0.1% |
| French | 4,231 | 2.1% |
| French American Indian | 51 | 0.0% |
| French Canadian | 578 | 0.3% |
| German | 22,272 | 11.1% |
| Ghanaian | 153 | 0.1% |
| Greek | 1,611 | 0.8% |
| Guamanian / Chamorro | 185 | 0.1% |
| Guatemalan | 992 | 0.5% |
| Guyanese | 32 | 0.0% |
| Haitian | 77 | 0.0% |
| Honduran | 378 | 0.2% |
| Hopi | 10 | 0.0% |
| Hungarian | 472 | 0.2% |
| Icelander | 127 | 0.1% |
| Indian (Asian) | 2,639 | 1.3% |
| Indonesian | 1,543 | 0.8% |
| Inupiat | 11 | 0.0% |
| Iranian | 492 | 0.2% |
| Iraqi | 57 | 0.0% |
| Irish | 14,576 | 7.2% |
| Iroquois | 9 | 0.0% |
| Israeli | 17 | 0.0% |
| Italian | 8,124 | 4.0% |
| Jamaican | 22 | 0.0% |
| Japanese | 64 | 0.0% |
| Jordanian | 48 | 0.0% |
| Kenyan | 307 | 0.2% |
| Korean | 1,718 | 0.9% |
| Laotian | 51 | 0.0% |
| Latvian | 69 | 0.0% |
| Lebanese | 361 | 0.2% |
| Lithuanian | 256 | 0.1% |
| Macedonian | 7 | 0.0% |
| Malaysian | 278 | 0.1% |
| Maltese | 82 | 0.0% |
| Mexican | 28,998 | 14.4% |
| Mexican American Indian | 579 | 0.3% |
| Mongolian | 110 | 0.1% |
| Moroccan | 32 | 0.0% |
| Native Hawaiian | 566 | 0.3% |
| Navajo | 1,116 | 0.5% |
| New Zealander | 40 | 0.0% |
| Nicaraguan | 38 | 0.0% |
| Nigerian | 348 | 0.2% |
| Northern European | 869 | 0.4% |
| Norwegian | 3,856 | 1.9% |
| Okinawan | 12 | 0.0% |
| Osage | 20 | 0.0% |
| Paiute | 49 | 0.0% |
| Pakistani | 333 | 0.2% |
| Palestinian | 37 | 0.0% |
| Panamanian | 137 | 0.1% |
| Peruvian | 1,427 | 0.7% |
| Polish | 2,890 | 1.4% |
| Portuguese | 434 | 0.2% |
| Potawatomi | 56 | 0.0% |
| Pueblo | 261 | 0.1% |
| Puerto Rican | 950 | 0.5% |
| Puget Sound Salish | 10 | 0.0% |
| Romanian | 296 | 0.2% |
| Russian | 1,383 | 0.7% |
| Salvadoran | 649 | 0.3% |
| Samoan | 1,556 | 0.8% |
| Scandinavian | 1,998 | 1.0% |
| Scotch-Irish | 1,784 | 0.9% |
| Scottish | 7,112 | 3.5% |
| Serbian | 268 | 0.1% |
| Shoshone | 19 | 0.0% |
| Sioux | 221 | 0.1% |
| Slavic | 82 | 0.0% |
| Slovak | 131 | 0.1% |
| Slovene | 153 | 0.1% |
| Somali | 587 | 0.3% |
| South African | 105 | 0.1% |
| South American | 3,474 | 1.7% |
| South American Indian | 44 | 0.0% |
| Spaniard | 909 | 0.4% |
| Spanish | 790 | 0.4% |
| Spanish American Indian | 14 | 0.0% |
| Sri Lankan | 1,489 | 0.7% |
| Subsaharan African | 3,892 | 1.9% |
| Sudanese | 841 | 0.4% |
| Swedish | 5,803 | 2.9% |
| Swiss | 1,736 | 0.9% |
| Syrian | 17 | 0.0% |
| Thai | 2,430 | 1.2% |
| Tlingit-Haida | 19 | 0.0% |
| Tohono O'Odham | 8 | 0.0% |
| Tongan | 2,100 | 1.0% |
| Trinidadian and Tobagonian | 17 | 0.0% |
| Turkish | 111 | 0.1% |
| Ugandan | 142 | 0.1% |
| Ukrainian | 546 | 0.3% |
| Uruguayan | 10 | 0.0% |
| Ute | 84 | 0.0% |
| Venezuelan | 475 | 0.2% |
| Vietnamese | 28 | 0.0% |
| Welsh | 3,036 | 1.5% |
| West Indian | 30 | 0.0% |
| Yaqui | 54 | 0.0% |
| Yugoslavian | 664 | 0.3% |
| Zimbabwean | 46 | 0.0% | View All 158 Rows |
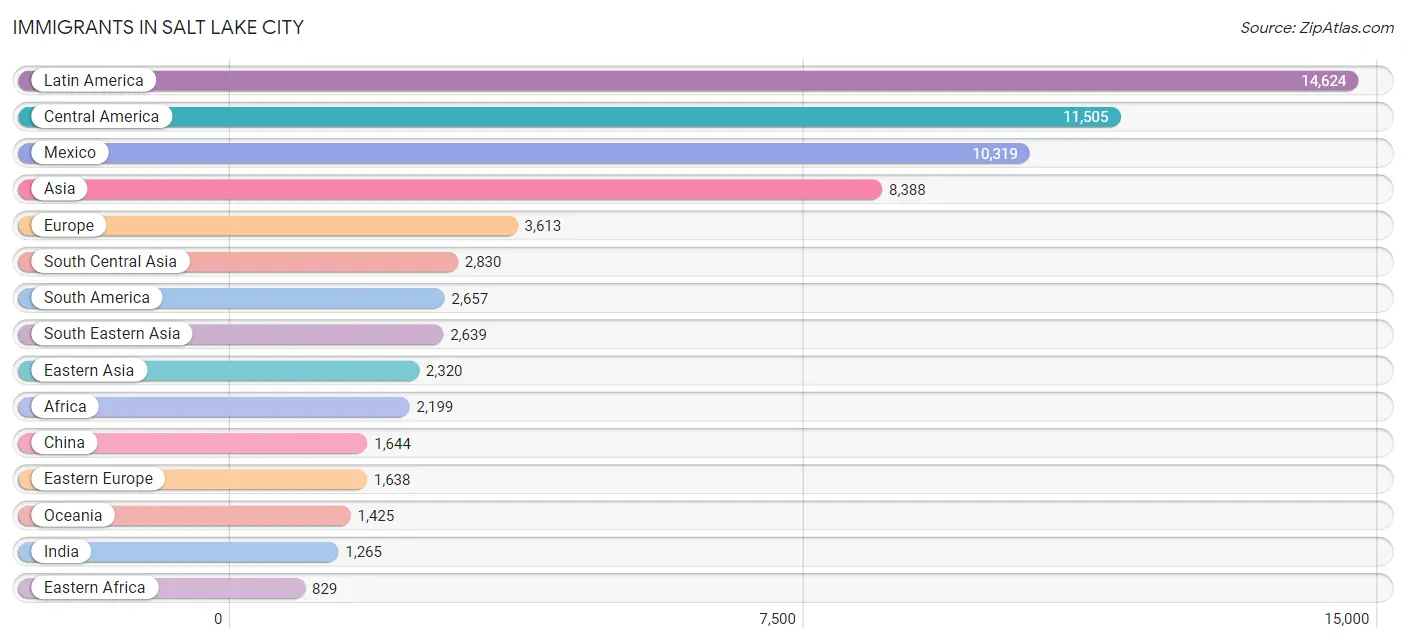
Immigrants in Salt Lake City
The most numerous immigrant groups reported in Salt Lake City came from Latin America (14,624 | 7.3%), Central America (11,505 | 5.7%), Mexico (10,319 | 5.1%), Asia (8,388 | 4.2%), and Europe (3,613 | 1.8%), together accounting for 24.1% of all Salt Lake City residents.
| Immigration Origin | # Population | % Population |
| Afghanistan | 236 | 0.1% |
| Africa | 2,199 | 1.1% |
| Argentina | 151 | 0.1% |
| Armenia | 53 | 0.0% |
| Asia | 8,388 | 4.2% |
| Australia | 112 | 0.1% |
| Austria | 19 | 0.0% |
| Bangladesh | 55 | 0.0% |
| Barbados | 18 | 0.0% |
| Belarus | 13 | 0.0% |
| Belgium | 33 | 0.0% |
| Bolivia | 37 | 0.0% |
| Bosnia and Herzegovina | 476 | 0.2% |
| Brazil | 591 | 0.3% |
| Bulgaria | 26 | 0.0% |
| Cambodia | 27 | 0.0% |
| Canada | 699 | 0.4% |
| Caribbean | 462 | 0.2% |
| Central America | 11,505 | 5.7% |
| Chile | 279 | 0.1% |
| China | 1,644 | 0.8% |
| Colombia | 535 | 0.3% |
| Congo | 318 | 0.2% |
| Costa Rica | 82 | 0.0% |
| Croatia | 76 | 0.0% |
| Cuba | 244 | 0.1% |
| Czechoslovakia | 120 | 0.1% |
| Denmark | 58 | 0.0% |
| Dominican Republic | 88 | 0.0% |
| Eastern Africa | 829 | 0.4% |
| Eastern Asia | 2,320 | 1.1% |
| Eastern Europe | 1,638 | 0.8% |
| Ecuador | 98 | 0.1% |
| Egypt | 207 | 0.1% |
| El Salvador | 384 | 0.2% |
| England | 230 | 0.1% |
| Eritrea | 73 | 0.0% |
| Ethiopia | 234 | 0.1% |
| Europe | 3,613 | 1.8% |
| France | 48 | 0.0% |
| Germany | 562 | 0.3% |
| Ghana | 43 | 0.0% |
| Greece | 142 | 0.1% |
| Guatemala | 541 | 0.3% |
| Guyana | 32 | 0.0% |
| Haiti | 79 | 0.0% |
| Honduras | 158 | 0.1% |
| Hong Kong | 75 | 0.0% |
| India | 1,265 | 0.6% |
| Indonesia | 30 | 0.0% |
| Iran | 370 | 0.2% |
| Iraq | 57 | 0.0% |
| Ireland | 54 | 0.0% |
| Israel | 20 | 0.0% |
| Italy | 95 | 0.1% |
| Jamaica | 33 | 0.0% |
| Japan | 359 | 0.2% |
| Jordan | 11 | 0.0% |
| Kazakhstan | 28 | 0.0% |
| Kenya | 44 | 0.0% |
| Korea | 312 | 0.2% |
| Kuwait | 57 | 0.0% |
| Laos | 130 | 0.1% |
| Latin America | 14,624 | 7.3% |
| Lebanon | 42 | 0.0% |
| Liberia | 22 | 0.0% |
| Malaysia | 82 | 0.0% |
| Mexico | 10,319 | 5.1% |
| Middle Africa | 403 | 0.2% |
| Moldova | 40 | 0.0% |
| Morocco | 21 | 0.0% |
| Nepal | 300 | 0.2% |
| Netherlands | 67 | 0.0% |
| Nigeria | 46 | 0.0% |
| Northern Africa | 747 | 0.4% |
| Northern Europe | 778 | 0.4% |
| Norway | 19 | 0.0% |
| Oceania | 1,425 | 0.7% |
| Pakistan | 536 | 0.3% |
| Peru | 630 | 0.3% |
| Philippines | 378 | 0.2% |
| Poland | 164 | 0.1% |
| Portugal | 24 | 0.0% |
| Romania | 104 | 0.1% |
| Russia | 235 | 0.1% |
| Saudi Arabia | 65 | 0.0% |
| Scotland | 35 | 0.0% |
| Serbia | 53 | 0.0% |
| Singapore | 20 | 0.0% |
| Somalia | 106 | 0.1% |
| South Africa | 33 | 0.0% |
| South America | 2,657 | 1.3% |
| South Central Asia | 2,830 | 1.4% |
| South Eastern Asia | 2,639 | 1.3% |
| Southern Europe | 381 | 0.2% |
| Spain | 104 | 0.1% |
| Sri Lanka | 35 | 0.0% |
| Sudan | 511 | 0.3% |
| Sweden | 40 | 0.0% |
| Switzerland | 87 | 0.0% |
| Syria | 35 | 0.0% |
| Taiwan | 80 | 0.0% |
| Thailand | 696 | 0.4% |
| Turkey | 199 | 0.1% |
| Uganda | 60 | 0.0% |
| Ukraine | 221 | 0.1% |
| Venezuela | 304 | 0.2% |
| Vietnam | 693 | 0.3% |
| Western Africa | 184 | 0.1% |
| Western Asia | 599 | 0.3% |
| Western Europe | 816 | 0.4% |
| Zaire | 64 | 0.0% |
| Zimbabwe | 98 | 0.1% | View All 113 Rows |
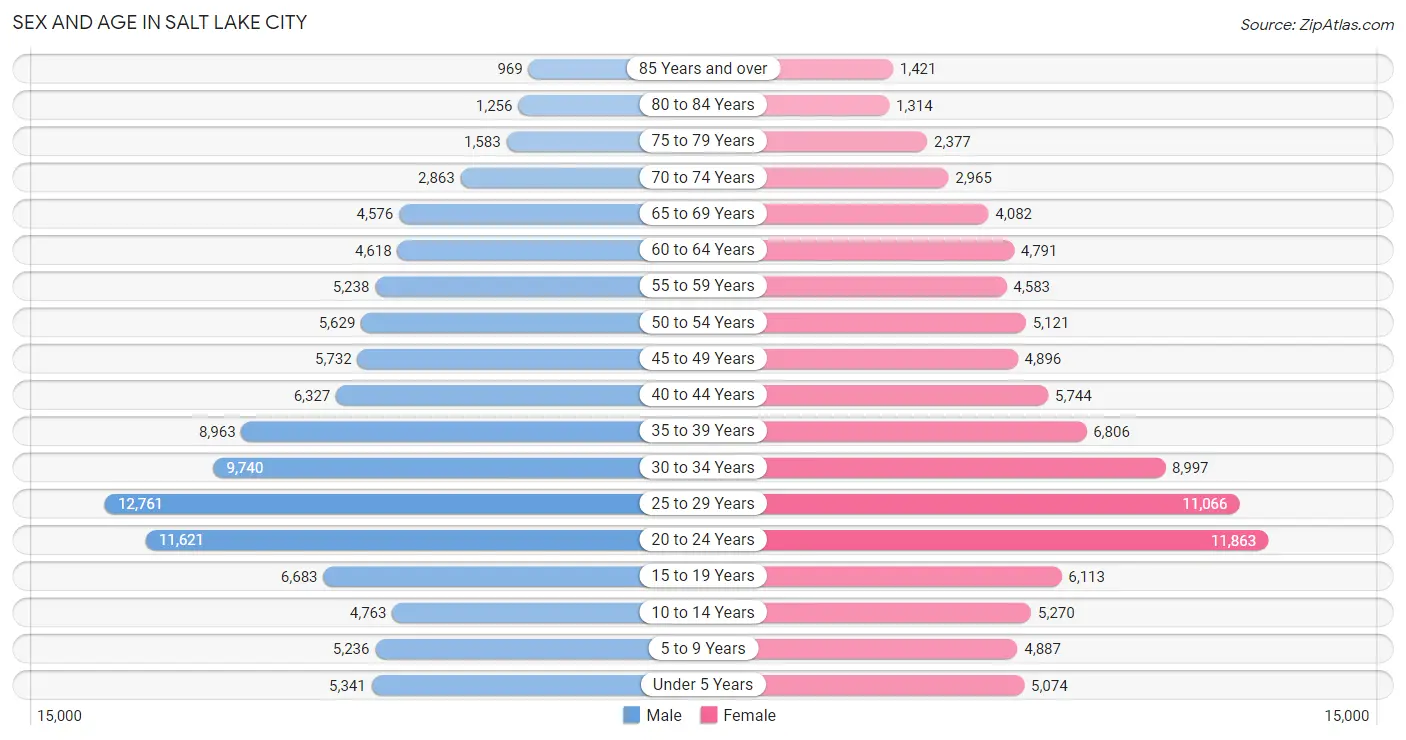
Sex and Age in Salt Lake City
Sex and Age in Salt Lake City
The most populous age groups in Salt Lake City are 25 to 29 Years (12,761 | 12.3%) for men and 20 to 24 Years (11,863 | 12.2%) for women.
| Age Bracket | Male | Female |
| Under 5 Years | 5,341 (5.1%) | 5,074 (5.2%) |
| 5 to 9 Years | 5,236 (5.0%) | 4,887 (5.0%) |
| 10 to 14 Years | 4,763 (4.6%) | 5,270 (5.4%) |
| 15 to 19 Years | 6,683 (6.4%) | 6,113 (6.3%) |
| 20 to 24 Years | 11,621 (11.2%) | 11,863 (12.2%) |
| 25 to 29 Years | 12,761 (12.3%) | 11,066 (11.4%) |
| 30 to 34 Years | 9,740 (9.4%) | 8,997 (9.2%) |
| 35 to 39 Years | 8,963 (8.6%) | 6,806 (7.0%) |
| 40 to 44 Years | 6,327 (6.1%) | 5,744 (5.9%) |
| 45 to 49 Years | 5,732 (5.5%) | 4,896 (5.0%) |
| 50 to 54 Years | 5,629 (5.4%) | 5,121 (5.3%) |
| 55 to 59 Years | 5,238 (5.0%) | 4,583 (4.7%) |
| 60 to 64 Years | 4,618 (4.4%) | 4,791 (4.9%) |
| 65 to 69 Years | 4,576 (4.4%) | 4,082 (4.2%) |
| 70 to 74 Years | 2,863 (2.8%) | 2,965 (3.0%) |
| 75 to 79 Years | 1,583 (1.5%) | 2,377 (2.4%) |
| 80 to 84 Years | 1,256 (1.2%) | 1,314 (1.3%) |
| 85 Years and over | 969 (0.9%) | 1,421 (1.5%) |
| Total | 103,899 (100.0%) | 97,370 (100.0%) |
Families and Households in Salt Lake City
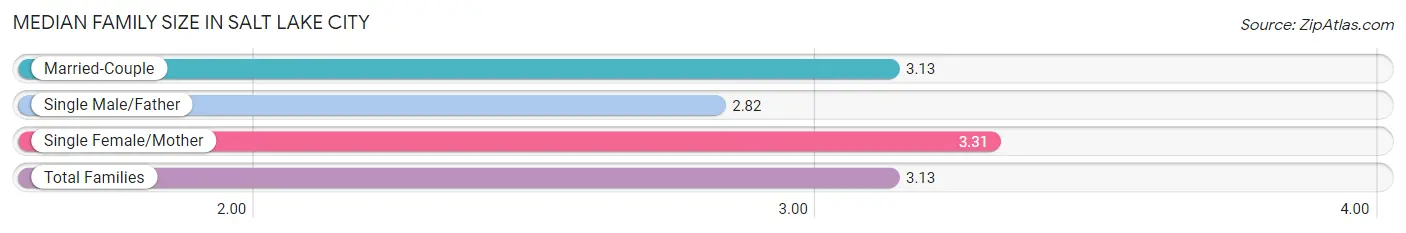
Median Family Size in Salt Lake City
The median family size in Salt Lake City is 3.13 persons per family, with single female/mother families (6,113 | 15.4%) accounting for the largest median family size of 3.31 persons per family. On the other hand, single male/father families (3,608 | 9.1%) represent the smallest median family size with 2.82 persons per family.
| Family Type | # Families | Family Size |
| Married-Couple | 29,890 (75.5%) | 3.13 |
| Single Male/Father | 3,608 (9.1%) | 2.82 |
| Single Female/Mother | 6,113 (15.4%) | 3.31 |
| Total Families | 39,611 (100.0%) | 3.13 |
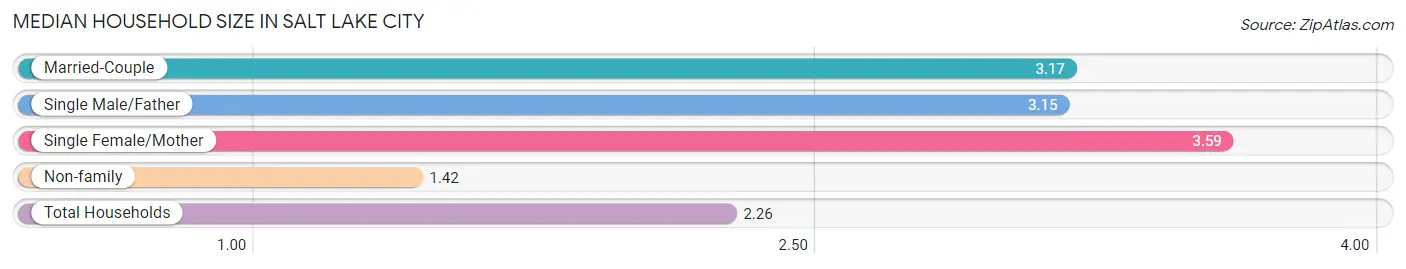
Median Household Size in Salt Lake City
The median household size in Salt Lake City is 2.26 persons per household, with single female/mother households (6,113 | 7.2%) accounting for the largest median household size of 3.59 persons per household. non-family households (45,824 | 53.6%) represent the smallest median household size with 1.42 persons per household.
| Household Type | # Households | Household Size |
| Married-Couple | 29,890 (35.0%) | 3.17 |
| Single Male/Father | 3,608 (4.2%) | 3.15 |
| Single Female/Mother | 6,113 (7.2%) | 3.59 |
| Non-family | 45,824 (53.6%) | 1.42 |
| Total Households | 85,435 (100.0%) | 2.26 |
Household Size by Marriage Status in Salt Lake City
Out of a total of 85,435 households in Salt Lake City, 39,611 (46.4%) are family households, while 45,824 (53.6%) are nonfamily households. The most numerous type of family households are 2-person households, comprising 18,787, and the most common type of nonfamily households are 1-person households, comprising 33,153.
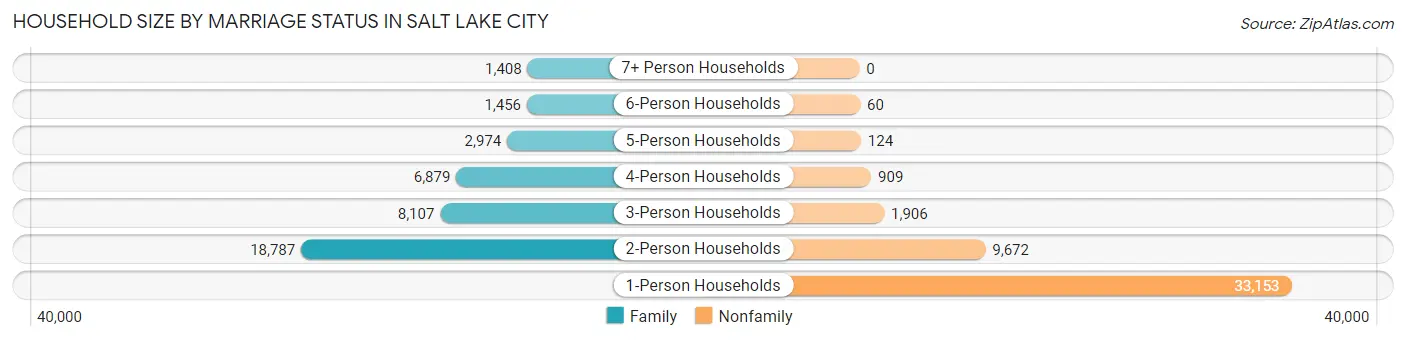
| Household Size | Family Households | Nonfamily Households |
| 1-Person Households | - | 33,153 (38.8%) |
| 2-Person Households | 18,787 (22.0%) | 9,672 (11.3%) |
| 3-Person Households | 8,107 (9.5%) | 1,906 (2.2%) |
| 4-Person Households | 6,879 (8.1%) | 909 (1.1%) |
| 5-Person Households | 2,974 (3.5%) | 124 (0.2%) |
| 6-Person Households | 1,456 (1.7%) | 60 (0.1%) |
| 7+ Person Households | 1,408 (1.7%) | 0 (0.0%) |
| Total | 39,611 (46.4%) | 45,824 (53.6%) |
Female Fertility in Salt Lake City
Fertility by Age in Salt Lake City
Average fertility rate in Salt Lake City is 43.0 births per 1,000 women. Women in the age bracket of 20 to 34 years have the highest fertility rate with 56.0 births per 1,000 women. Women in the age bracket of 20 to 34 years acount for 73.2% of all women with births.
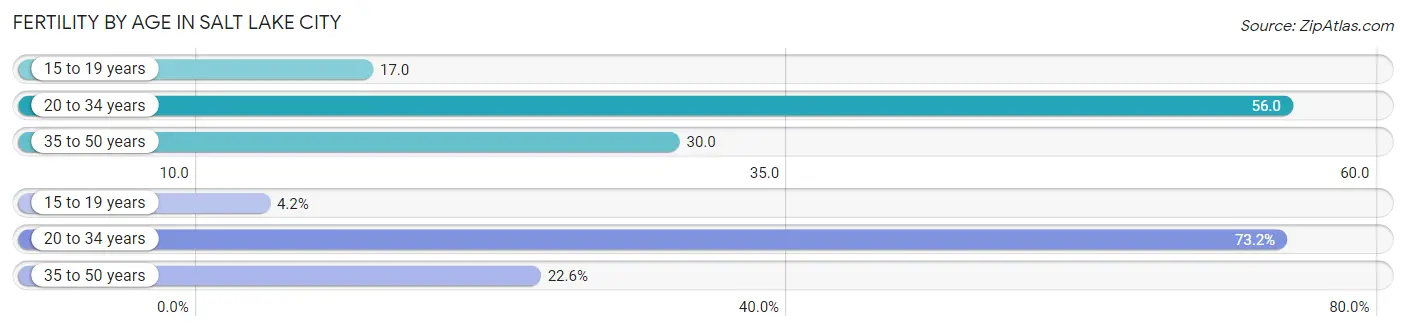
| Age Bracket | Women with Births | Births / 1,000 Women |
| 15 to 19 years | 102 (4.2%) | 17.0 |
| 20 to 34 years | 1,780 (73.2%) | 56.0 |
| 35 to 50 years | 549 (22.6%) | 30.0 |
| Total | 2,431 (100.0%) | 43.0 |
Fertility by Age by Marriage Status in Salt Lake City
74.7% of women with births (2,431) in Salt Lake City are married. The highest percentage of unmarried women with births falls into 15 to 19 years age bracket with 63.7% of them unmarried at the time of birth, while the lowest percentage of unmarried women with births belong to 35 to 50 years age bracket with 14.6% of them unmarried.
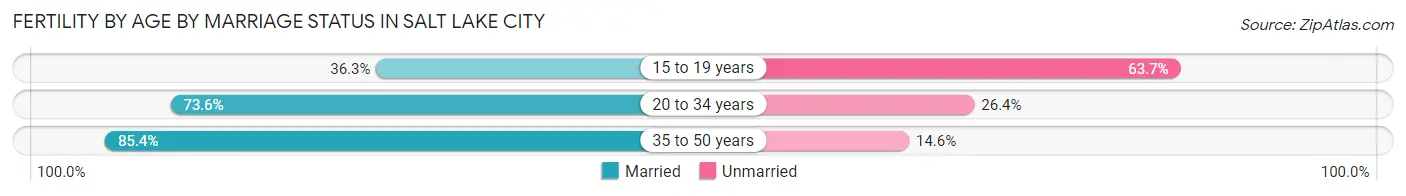
| Age Bracket | Married | Unmarried |
| 15 to 19 years | 37 (36.3%) | 65 (63.7%) |
| 20 to 34 years | 1,310 (73.6%) | 470 (26.4%) |
| 35 to 50 years | 469 (85.4%) | 80 (14.6%) |
| Total | 1,816 (74.7%) | 615 (25.3%) |
Fertility by Education in Salt Lake City
Average fertility rate in Salt Lake City is 43.0 births per 1,000 women. Women with the education attainment of high school diploma have the highest fertility rate of 66.0 births per 1,000 women, while women with the education attainment of college or associate's degree have the lowest fertility at 28.0 births per 1,000 women. Women with the education attainment of high school diploma represent 25.0% of all women with births.
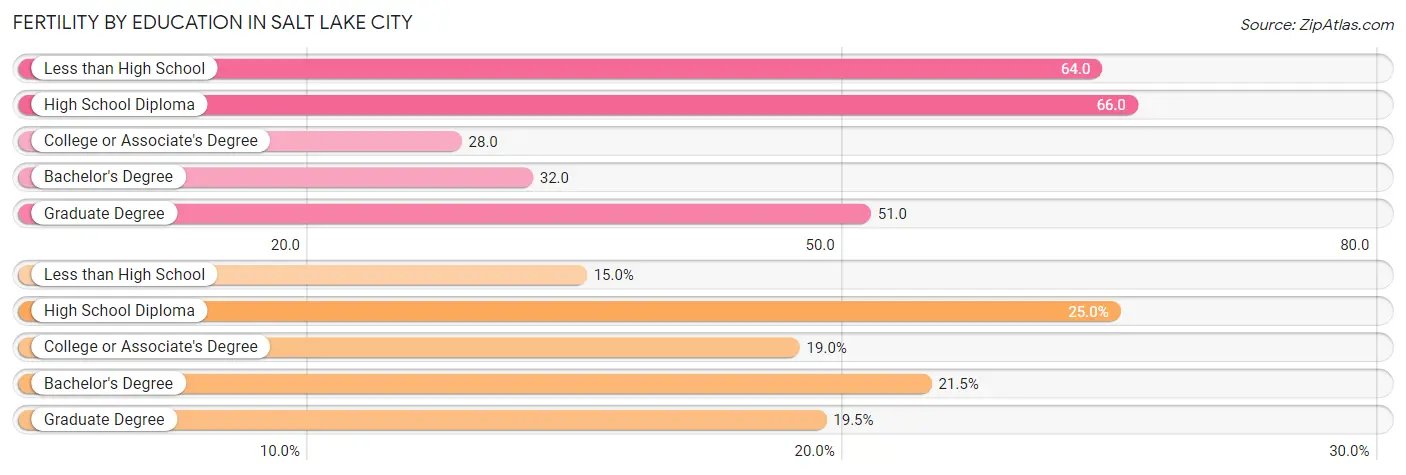
| Educational Attainment | Women with Births | Births / 1,000 Women |
| Less than High School | 365 (15.0%) | 64.0 |
| High School Diploma | 608 (25.0%) | 66.0 |
| College or Associate's Degree | 462 (19.0%) | 28.0 |
| Bachelor's Degree | 522 (21.5%) | 32.0 |
| Graduate Degree | 474 (19.5%) | 51.0 |
| Total | 2,431 (100.0%) | 43.0 |
Fertility by Education by Marriage Status in Salt Lake City
25.3% of women with births in Salt Lake City are unmarried. Women with the educational attainment of graduate degree are most likely to be married with 96.8% of them married at childbirth, while women with the educational attainment of high school diploma are least likely to be married with 61.4% of them unmarried at childbirth.
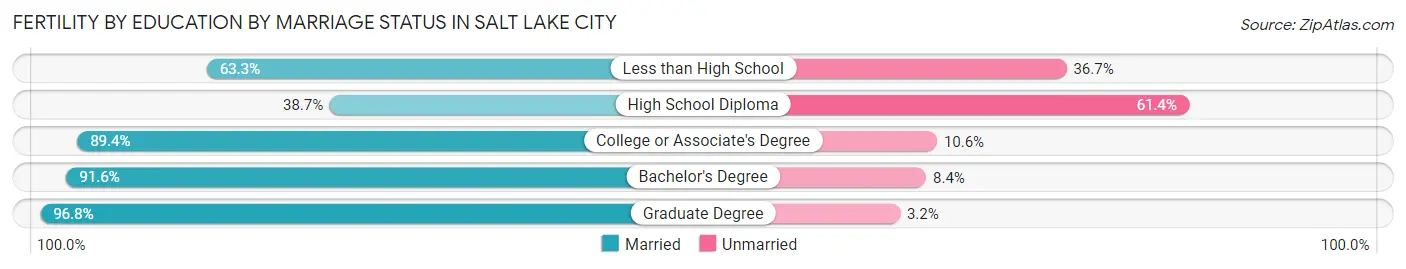
| Educational Attainment | Married | Unmarried |
| Less than High School | 231 (63.3%) | 134 (36.7%) |
| High School Diploma | 235 (38.7%) | 373 (61.4%) |
| College or Associate's Degree | 413 (89.4%) | 49 (10.6%) |
| Bachelor's Degree | 478 (91.6%) | 44 (8.4%) |
| Graduate Degree | 459 (96.8%) | 15 (3.2%) |
| Total | 1,816 (74.7%) | 615 (25.3%) |
Employment Characteristics in Salt Lake City
Employment by Class of Employer in Salt Lake City
Among the 116,396 employed individuals in Salt Lake City, private company employees (75,039 | 64.5%), not-for-profit organizations (11,675 | 10.0%), and state government employees (11,637 | 10.0%) make up the most common classes of employment.
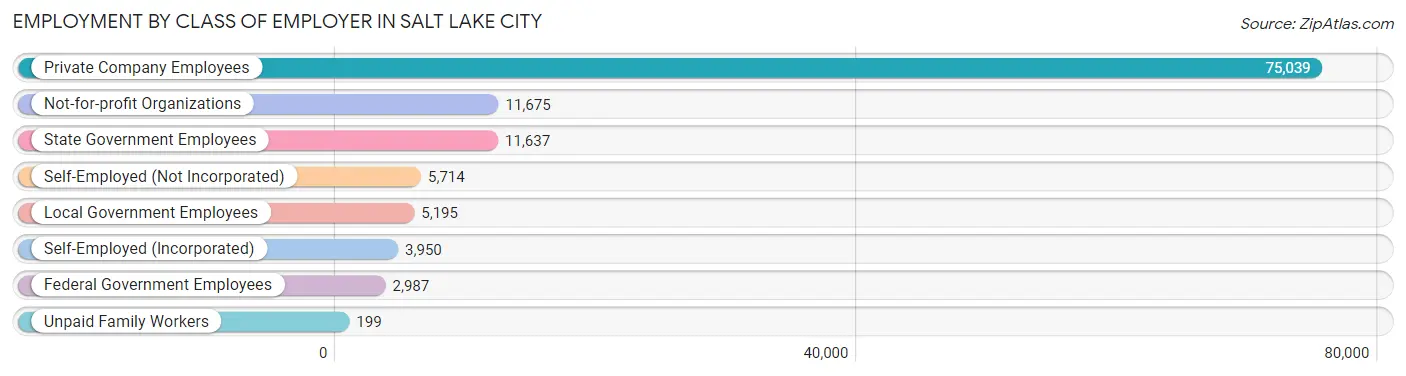
| Employer Class | # Employees | % Employees |
| Private Company Employees | 75,039 | 64.5% |
| Self-Employed (Incorporated) | 3,950 | 3.4% |
| Self-Employed (Not Incorporated) | 5,714 | 4.9% |
| Not-for-profit Organizations | 11,675 | 10.0% |
| Local Government Employees | 5,195 | 4.5% |
| State Government Employees | 11,637 | 10.0% |
| Federal Government Employees | 2,987 | 2.6% |
| Unpaid Family Workers | 199 | 0.2% |
| Total | 116,396 | 100.0% |
Employment Status by Age in Salt Lake City
According to the labor force statistics for Salt Lake City, out of the total population over 16 years of age (168,935), 73.0% or 123,323 individuals are in the labor force, with 3.6% or 4,440 of them unemployed. The age group with the highest labor force participation rate is 25 to 29 years, with 89.5% or 21,325 individuals in the labor force. Within the labor force, the 16 to 19 years age range has the highest percentage of unemployed individuals, with 10.1% or 536 of them being unemployed.
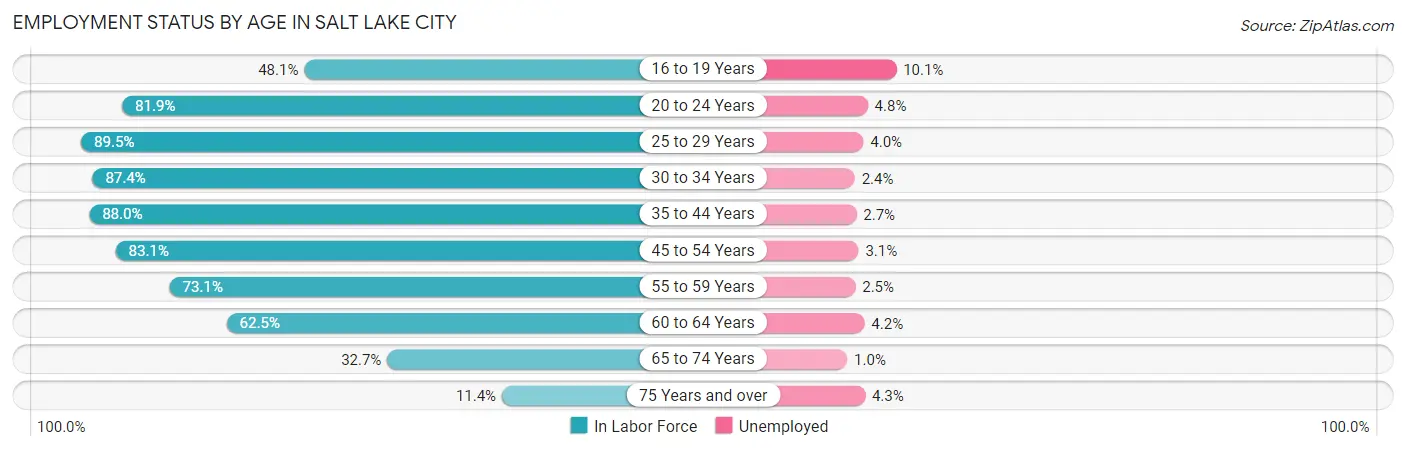
| Age Bracket | In Labor Force | Unemployed |
| 16 to 19 Years | 5,307 (48.1%) | 536 (10.1%) |
| 20 to 24 Years | 19,233 (81.9%) | 923 (4.8%) |
| 25 to 29 Years | 21,325 (89.5%) | 853 (4.0%) |
| 30 to 34 Years | 16,376 (87.4%) | 393 (2.4%) |
| 35 to 44 Years | 24,499 (88.0%) | 661 (2.7%) |
| 45 to 54 Years | 17,765 (83.1%) | 551 (3.1%) |
| 55 to 59 Years | 7,179 (73.1%) | 179 (2.5%) |
| 60 to 64 Years | 5,881 (62.5%) | 247 (4.2%) |
| 65 to 74 Years | 4,737 (32.7%) | 47 (1.0%) |
| 75 Years and over | 1,017 (11.4%) | 44 (4.3%) |
| Total | 123,323 (73.0%) | 4,440 (3.6%) |
Employment Status by Educational Attainment in Salt Lake City
According to labor force statistics for Salt Lake City, 83.8% of individuals (93,028) out of the total population between 25 and 64 years of age (111,012) are in the labor force, with 3.1% or 2,884 of them being unemployed. The group with the highest labor force participation rate are those with the educational attainment of bachelor's degree or higher, with 89.0% or 50,461 individuals in the labor force. Within the labor force, individuals with high school diploma education have the highest percentage of unemployment, with 5.7% or 793 of them being unemployed.
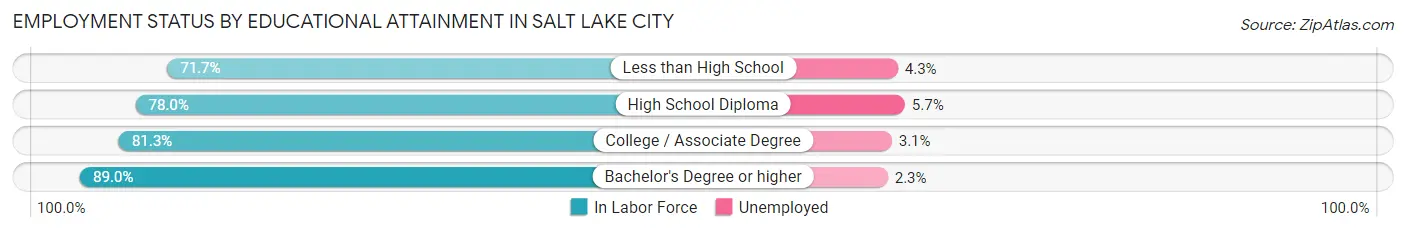
| Educational Attainment | In Labor Force | Unemployed |
| Less than High School | 7,274 (71.7%) | 436 (4.3%) |
| High School Diploma | 13,917 (78.0%) | 1,017 (5.7%) |
| College / Associate Degree | 21,404 (81.3%) | 816 (3.1%) |
| Bachelor's Degree or higher | 50,461 (89.0%) | 1,304 (2.3%) |
| Total | 93,028 (83.8%) | 3,441 (3.1%) |
Employment Occupations by Sex in Salt Lake City
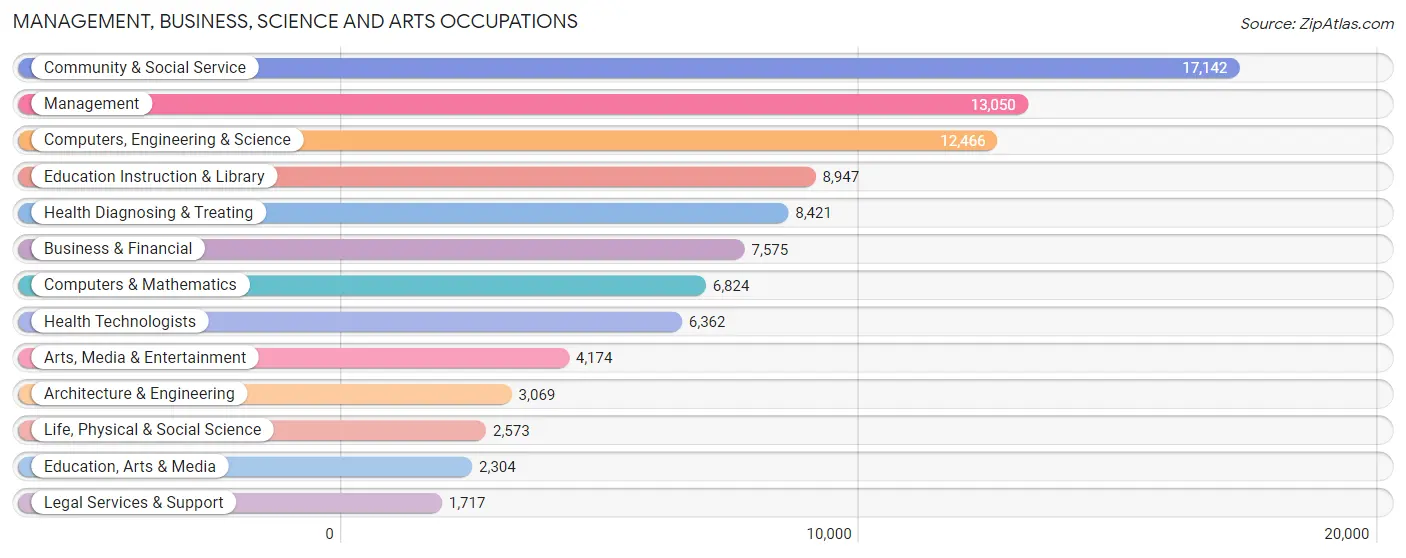
Management, Business, Science and Arts Occupations
The most common Management, Business, Science and Arts occupations in Salt Lake City are Community & Social Service (17,142 | 14.4%), Management (13,050 | 11.0%), Computers, Engineering & Science (12,466 | 10.5%), Education Instruction & Library (8,947 | 7.5%), and Health Diagnosing & Treating (8,421 | 7.1%).
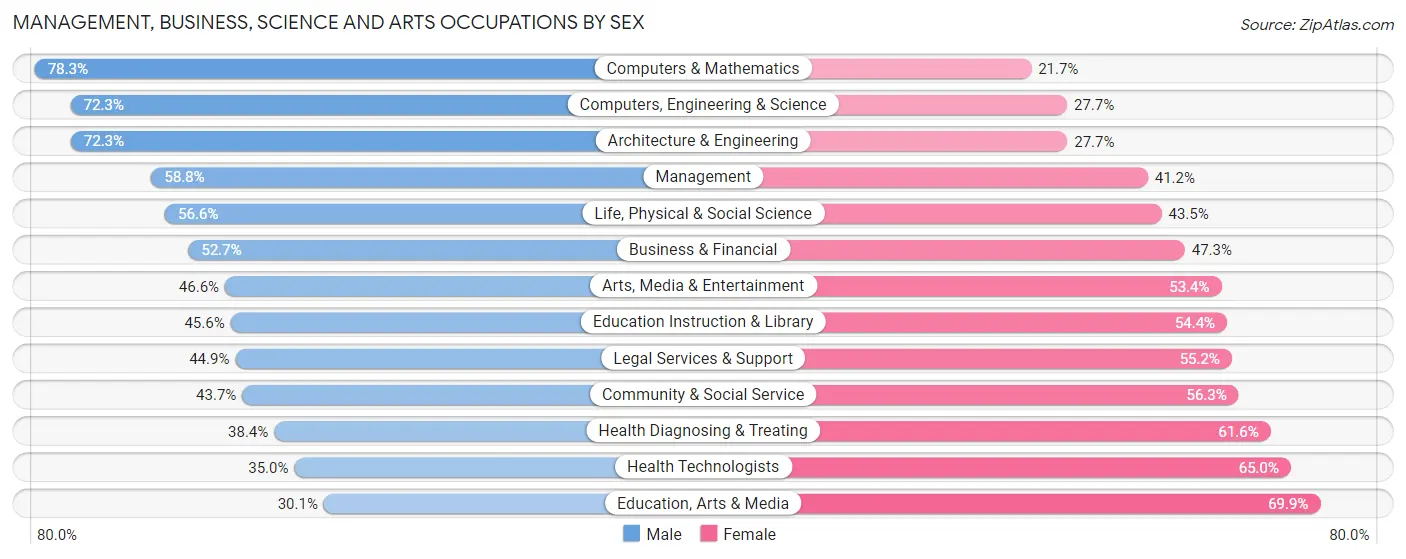
Management, Business, Science and Arts Occupations by Sex
Within the Management, Business, Science and Arts occupations in Salt Lake City, the most male-oriented occupations are Computers & Mathematics (78.3%), Computers, Engineering & Science (72.3%), and Architecture & Engineering (72.3%), while the most female-oriented occupations are Education, Arts & Media (69.9%), Health Technologists (65.0%), and Health Diagnosing & Treating (61.6%).
| Occupation | Male | Female |
| Management | 7,678 (58.8%) | 5,372 (41.2%) |
| Business & Financial | 3,990 (52.7%) | 3,585 (47.3%) |
| Computers, Engineering & Science | 9,016 (72.3%) | 3,450 (27.7%) |
| Computers & Mathematics | 5,343 (78.3%) | 1,481 (21.7%) |
| Architecture & Engineering | 2,218 (72.3%) | 851 (27.7%) |
| Life, Physical & Social Science | 1,455 (56.6%) | 1,118 (43.4%) |
| Community & Social Service | 7,490 (43.7%) | 9,652 (56.3%) |
| Education, Arts & Media | 693 (30.1%) | 1,611 (69.9%) |
| Legal Services & Support | 770 (44.9%) | 947 (55.1%) |
| Education Instruction & Library | 4,083 (45.6%) | 4,864 (54.4%) |
| Arts, Media & Entertainment | 1,944 (46.6%) | 2,230 (53.4%) |
| Health Diagnosing & Treating | 3,230 (38.4%) | 5,191 (61.6%) |
| Health Technologists | 2,226 (35.0%) | 4,136 (65.0%) |
| Total (Category) | 31,404 (53.5%) | 27,250 (46.5%) |
| Total (Overall) | 65,495 (55.1%) | 53,321 (44.9%) |
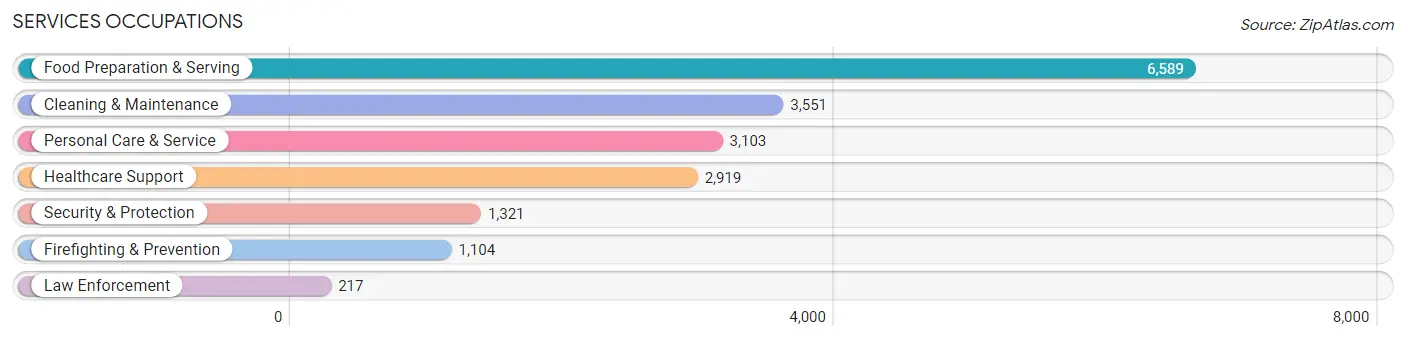
Services Occupations
The most common Services occupations in Salt Lake City are Food Preparation & Serving (6,589 | 5.6%), Cleaning & Maintenance (3,551 | 3.0%), Personal Care & Service (3,103 | 2.6%), Healthcare Support (2,919 | 2.5%), and Security & Protection (1,321 | 1.1%).
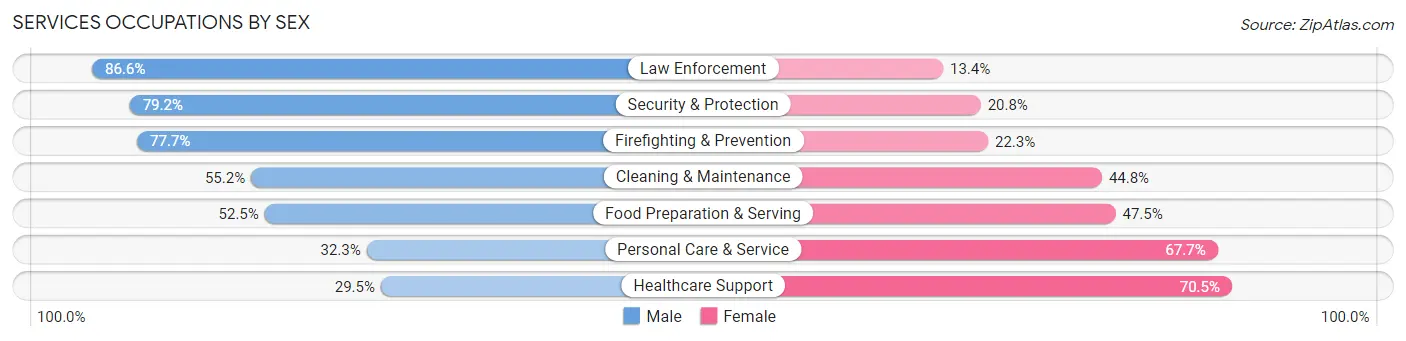
Services Occupations by Sex
Within the Services occupations in Salt Lake City, the most male-oriented occupations are Law Enforcement (86.6%), Security & Protection (79.2%), and Firefighting & Prevention (77.7%), while the most female-oriented occupations are Healthcare Support (70.5%), Personal Care & Service (67.7%), and Food Preparation & Serving (47.5%).
| Occupation | Male | Female |
| Healthcare Support | 860 (29.5%) | 2,059 (70.5%) |
| Security & Protection | 1,046 (79.2%) | 275 (20.8%) |
| Firefighting & Prevention | 858 (77.7%) | 246 (22.3%) |
| Law Enforcement | 188 (86.6%) | 29 (13.4%) |
| Food Preparation & Serving | 3,457 (52.5%) | 3,132 (47.5%) |
| Cleaning & Maintenance | 1,959 (55.2%) | 1,592 (44.8%) |
| Personal Care & Service | 1,002 (32.3%) | 2,101 (67.7%) |
| Total (Category) | 8,324 (47.6%) | 9,159 (52.4%) |
| Total (Overall) | 65,495 (55.1%) | 53,321 (44.9%) |
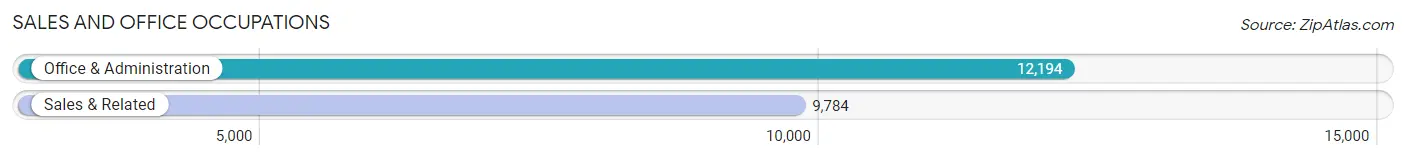
Sales and Office Occupations
The most common Sales and Office occupations in Salt Lake City are Office & Administration (12,194 | 10.3%), and Sales & Related (9,784 | 8.2%).
Sales and Office Occupations by Sex
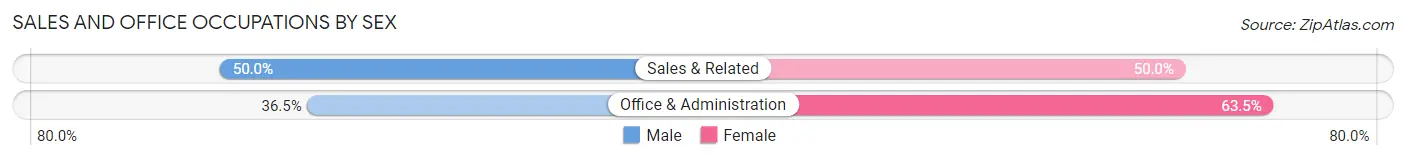
| Occupation | Male | Female |
| Sales & Related | 4,888 (50.0%) | 4,896 (50.0%) |
| Office & Administration | 4,447 (36.5%) | 7,747 (63.5%) |
| Total (Category) | 9,335 (42.5%) | 12,643 (57.5%) |
| Total (Overall) | 65,495 (55.1%) | 53,321 (44.9%) |
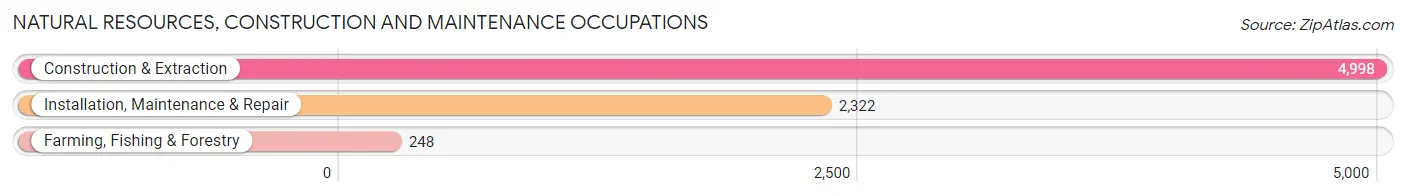
Natural Resources, Construction and Maintenance Occupations
The most common Natural Resources, Construction and Maintenance occupations in Salt Lake City are Construction & Extraction (4,998 | 4.2%), Installation, Maintenance & Repair (2,322 | 1.9%), and Farming, Fishing & Forestry (248 | 0.2%).
Natural Resources, Construction and Maintenance Occupations by Sex
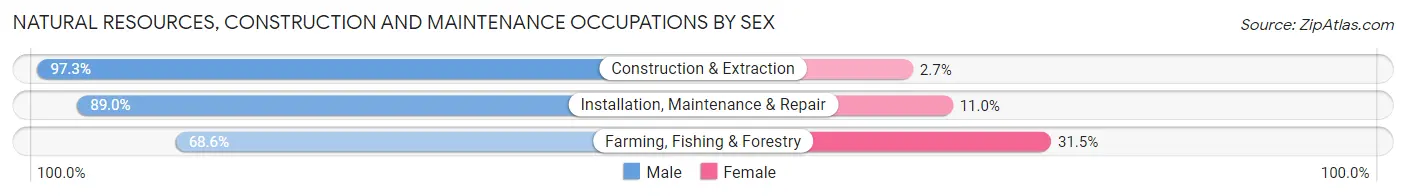
| Occupation | Male | Female |
| Farming, Fishing & Forestry | 170 (68.5%) | 78 (31.5%) |
| Construction & Extraction | 4,863 (97.3%) | 135 (2.7%) |
| Installation, Maintenance & Repair | 2,067 (89.0%) | 255 (11.0%) |
| Total (Category) | 7,100 (93.8%) | 468 (6.2%) |
| Total (Overall) | 65,495 (55.1%) | 53,321 (44.9%) |
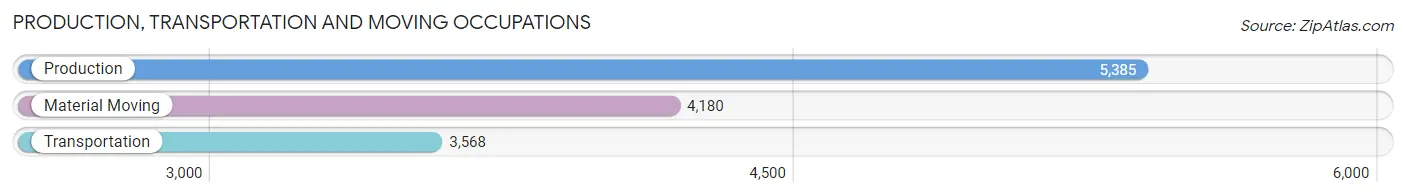
Production, Transportation and Moving Occupations
The most common Production, Transportation and Moving occupations in Salt Lake City are Production (5,385 | 4.5%), Material Moving (4,180 | 3.5%), and Transportation (3,568 | 3.0%).
Production, Transportation and Moving Occupations by Sex
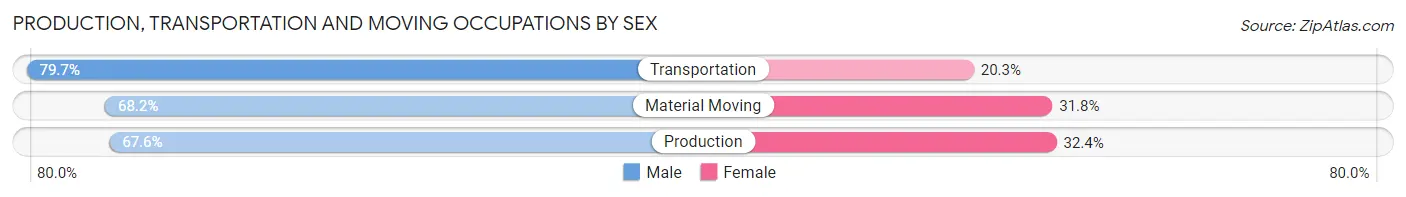
| Occupation | Male | Female |
| Production | 3,638 (67.6%) | 1,747 (32.4%) |
| Transportation | 2,844 (79.7%) | 724 (20.3%) |
| Material Moving | 2,850 (68.2%) | 1,330 (31.8%) |
| Total (Category) | 9,332 (71.1%) | 3,801 (28.9%) |
| Total (Overall) | 65,495 (55.1%) | 53,321 (44.9%) |
Employment Industries by Sex in Salt Lake City
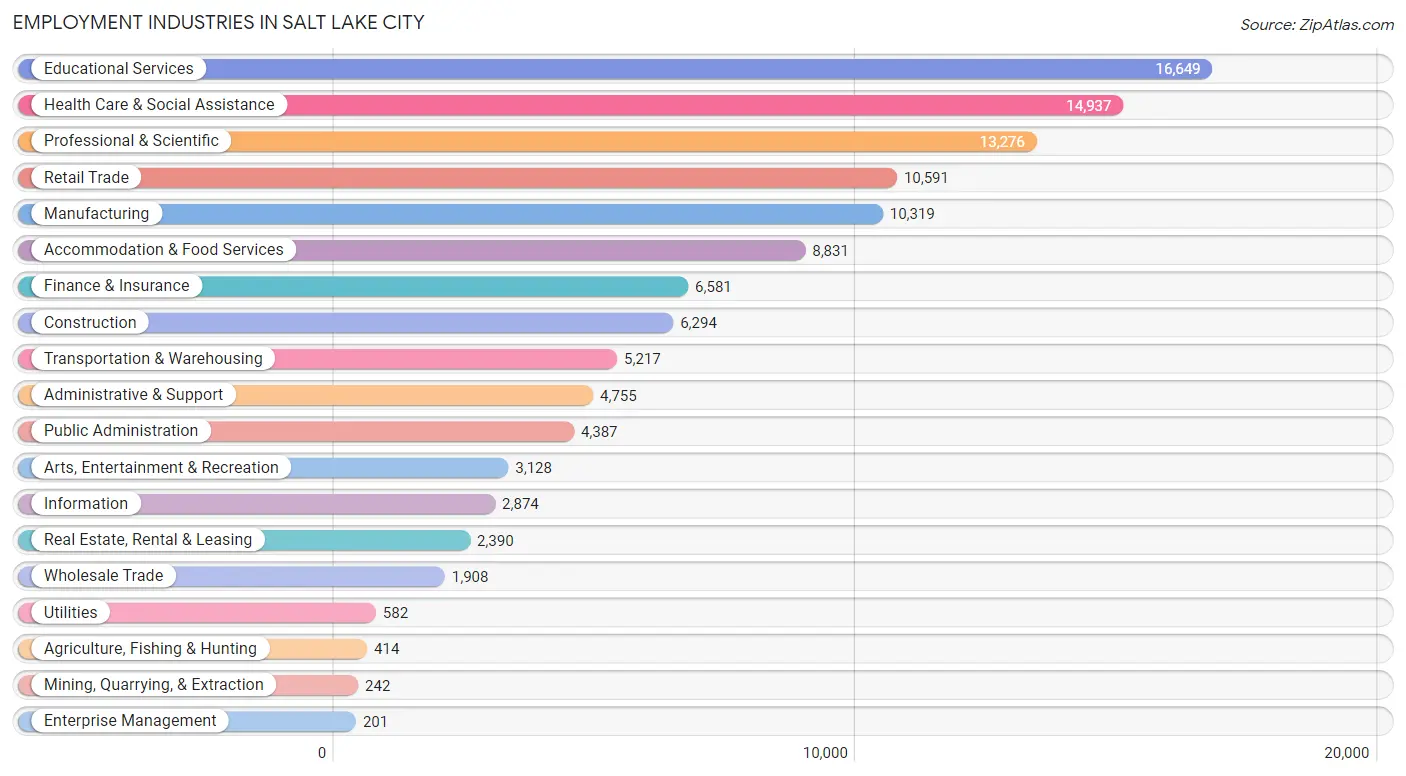
Employment Industries in Salt Lake City
The major employment industries in Salt Lake City include Educational Services (16,649 | 14.0%), Health Care & Social Assistance (14,937 | 12.6%), Professional & Scientific (13,276 | 11.2%), Retail Trade (10,591 | 8.9%), and Manufacturing (10,319 | 8.7%).
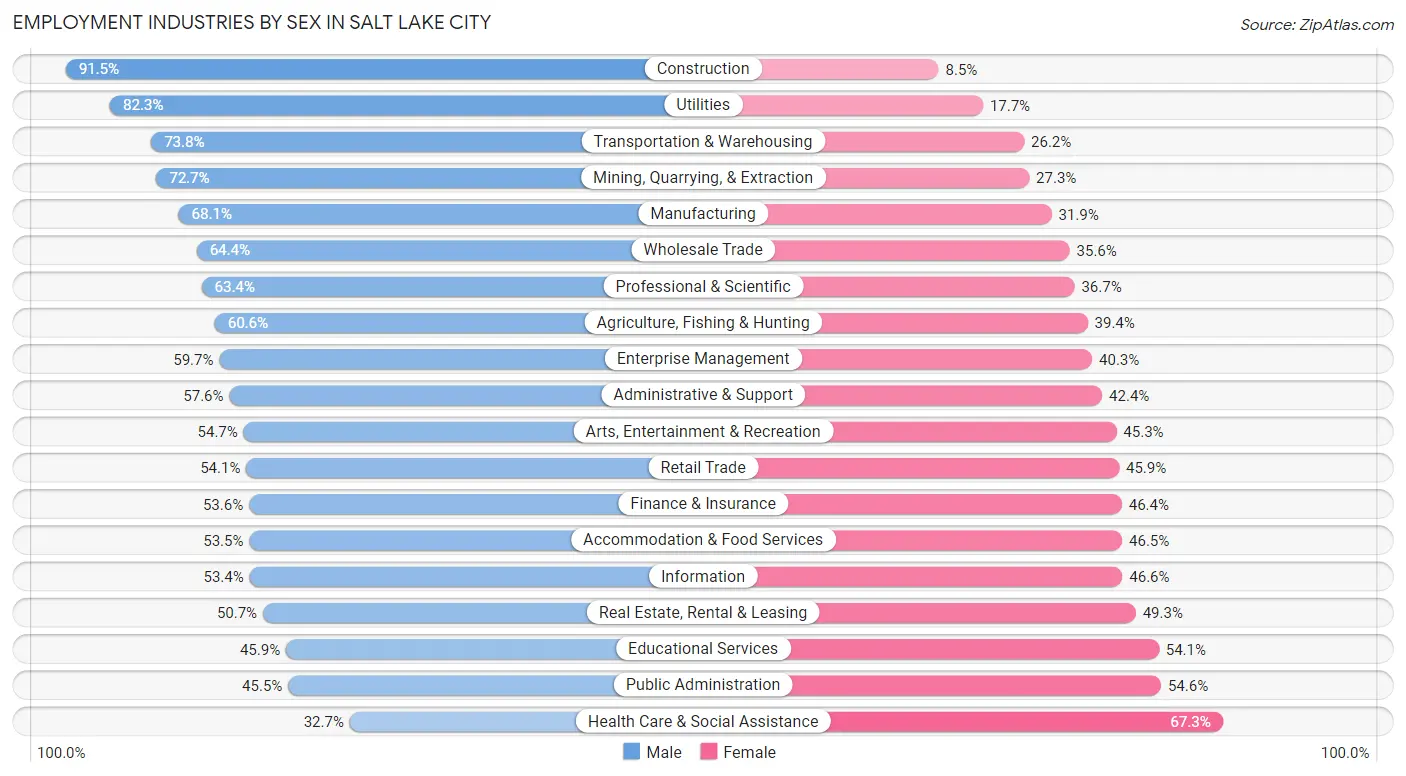
Employment Industries by Sex in Salt Lake City
The Salt Lake City industries that see more men than women are Construction (91.5%), Utilities (82.3%), and Transportation & Warehousing (73.8%), whereas the industries that tend to have a higher number of women are Health Care & Social Assistance (67.3%), Public Administration (54.5%), and Educational Services (54.1%).
| Industry | Male | Female |
| Agriculture, Fishing & Hunting | 251 (60.6%) | 163 (39.4%) |
| Mining, Quarrying, & Extraction | 176 (72.7%) | 66 (27.3%) |
| Construction | 5,757 (91.5%) | 537 (8.5%) |
| Manufacturing | 7,027 (68.1%) | 3,292 (31.9%) |
| Wholesale Trade | 1,228 (64.4%) | 680 (35.6%) |
| Retail Trade | 5,732 (54.1%) | 4,859 (45.9%) |
| Transportation & Warehousing | 3,849 (73.8%) | 1,368 (26.2%) |
| Utilities | 479 (82.3%) | 103 (17.7%) |
| Information | 1,536 (53.4%) | 1,338 (46.6%) |
| Finance & Insurance | 3,525 (53.6%) | 3,056 (46.4%) |
| Real Estate, Rental & Leasing | 1,211 (50.7%) | 1,179 (49.3%) |
| Professional & Scientific | 8,410 (63.3%) | 4,866 (36.6%) |
| Enterprise Management | 120 (59.7%) | 81 (40.3%) |
| Administrative & Support | 2,740 (57.6%) | 2,015 (42.4%) |
| Educational Services | 7,642 (45.9%) | 9,007 (54.1%) |
| Health Care & Social Assistance | 4,885 (32.7%) | 10,052 (67.3%) |
| Arts, Entertainment & Recreation | 1,710 (54.7%) | 1,418 (45.3%) |
| Accommodation & Food Services | 4,724 (53.5%) | 4,107 (46.5%) |
| Public Administration | 1,994 (45.5%) | 2,393 (54.5%) |
| Total | 65,495 (55.1%) | 53,321 (44.9%) |
Education in Salt Lake City
School Enrollment in Salt Lake City
The most common levels of schooling among the 55,071 students in Salt Lake City are college / undergraduate (20,733 | 37.7%), high school (7,934 | 14.4%), and elementary school (7,932 | 14.4%).
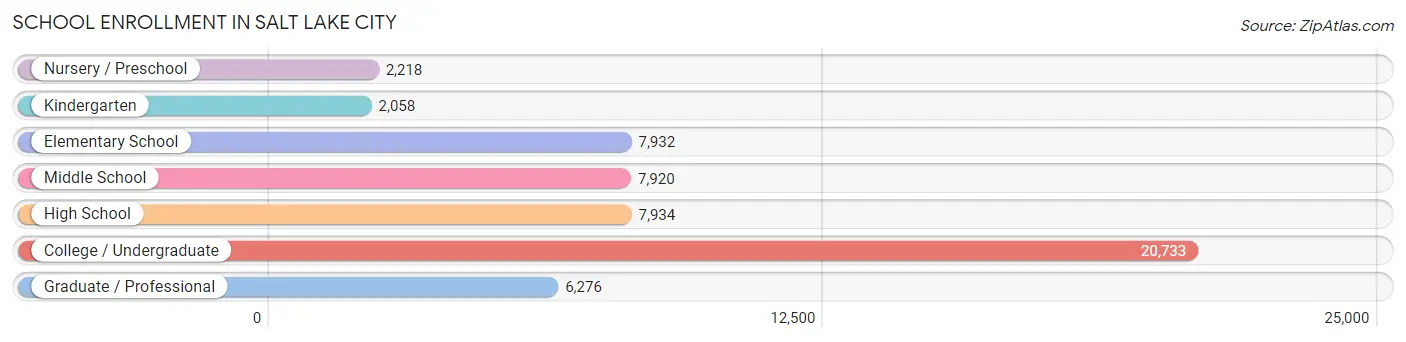
| School Level | # Students | % Students |
| Nursery / Preschool | 2,218 | 4.0% |
| Kindergarten | 2,058 | 3.7% |
| Elementary School | 7,932 | 14.4% |
| Middle School | 7,920 | 14.4% |
| High School | 7,934 | 14.4% |
| College / Undergraduate | 20,733 | 37.7% |
| Graduate / Professional | 6,276 | 11.4% |
| Total | 55,071 | 100.0% |
School Enrollment by Age by Funding Source in Salt Lake City
Out of a total of 55,071 students who are enrolled in schools in Salt Lake City, 9,472 (17.2%) attend a private institution, while the remaining 45,599 (82.8%) are enrolled in public schools. The age group of 3 to 4 year olds has the highest likelihood of being enrolled in private schools, with 987 (53.7% in the age bracket) enrolled. Conversely, the age group of 15 to 17 year olds has the lowest likelihood of being enrolled in a private school, with 5,005 (92.1% in the age bracket) attending a public institution.
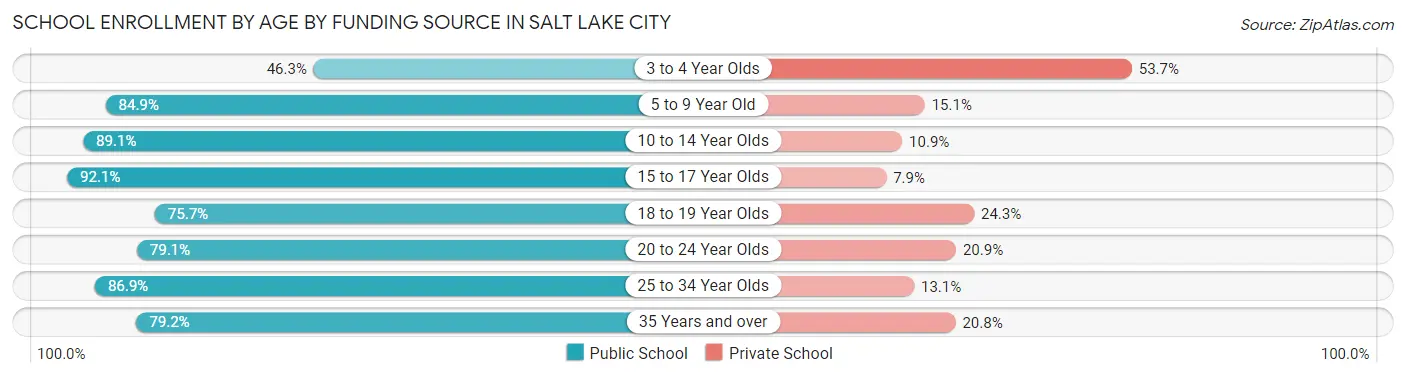
| Age Bracket | Public School | Private School |
| 3 to 4 Year Olds | 852 (46.3%) | 987 (53.7%) |
| 5 to 9 Year Old | 8,116 (84.9%) | 1,443 (15.1%) |
| 10 to 14 Year Olds | 8,698 (89.1%) | 1,063 (10.9%) |
| 15 to 17 Year Olds | 5,005 (92.1%) | 431 (7.9%) |
| 18 to 19 Year Olds | 4,207 (75.7%) | 1,349 (24.3%) |
| 20 to 24 Year Olds | 9,935 (79.1%) | 2,629 (20.9%) |
| 25 to 34 Year Olds | 6,600 (86.9%) | 996 (13.1%) |
| 35 Years and over | 2,185 (79.2%) | 575 (20.8%) |
| Total | 45,599 (82.8%) | 9,472 (17.2%) |
Educational Attainment by Field of Study in Salt Lake City
Business (10,710 | 14.4%), science & technology (7,619 | 10.2%), social sciences (7,429 | 10.0%), bio, nature & agricultural (6,703 | 9.0%), and engineering (5,058 | 6.8%) are the most common fields of study among 74,591 individuals in Salt Lake City who have obtained a bachelor's degree or higher.
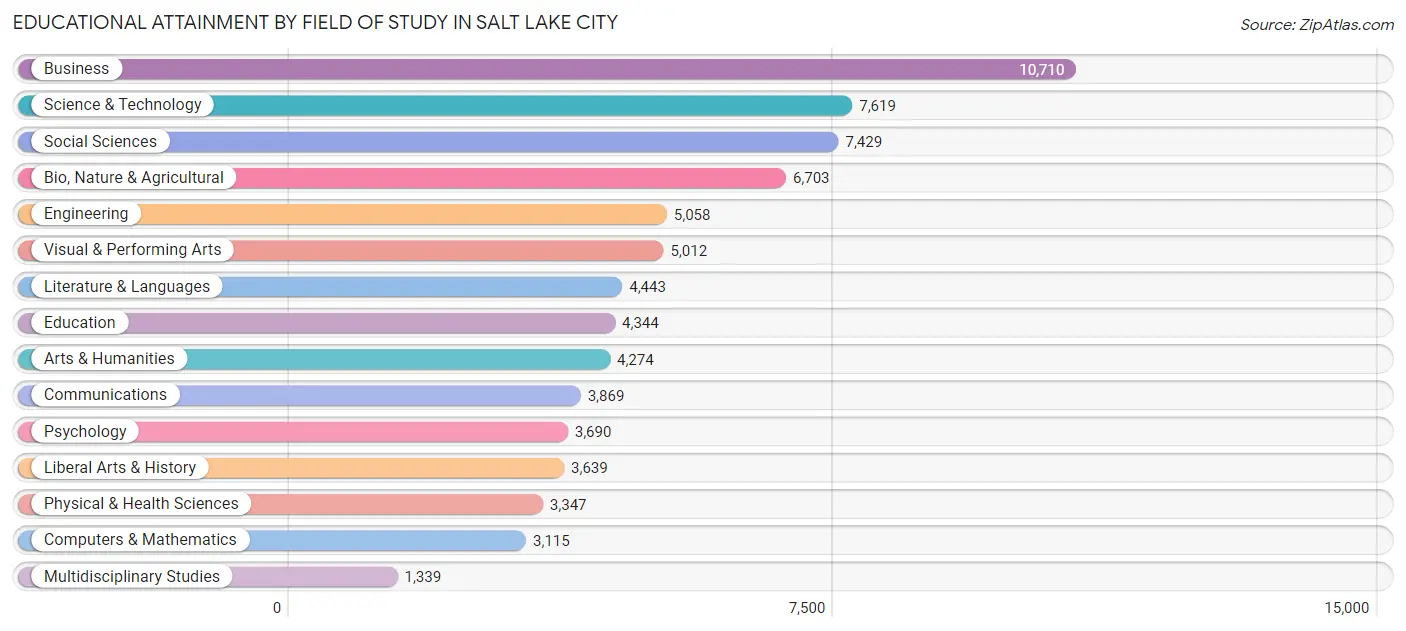
| Field of Study | # Graduates | % Graduates |
| Computers & Mathematics | 3,115 | 4.2% |
| Bio, Nature & Agricultural | 6,703 | 9.0% |
| Physical & Health Sciences | 3,347 | 4.5% |
| Psychology | 3,690 | 5.0% |
| Social Sciences | 7,429 | 10.0% |
| Engineering | 5,058 | 6.8% |
| Multidisciplinary Studies | 1,339 | 1.8% |
| Science & Technology | 7,619 | 10.2% |
| Business | 10,710 | 14.4% |
| Education | 4,344 | 5.8% |
| Literature & Languages | 4,443 | 6.0% |
| Liberal Arts & History | 3,639 | 4.9% |
| Visual & Performing Arts | 5,012 | 6.7% |
| Communications | 3,869 | 5.2% |
| Arts & Humanities | 4,274 | 5.7% |
| Total | 74,591 | 100.0% |
Transportation & Commute in Salt Lake City
Vehicle Availability by Sex in Salt Lake City
The most prevalent vehicle ownership categories in Salt Lake City are males with 2 vehicles (24,937, accounting for 39.8%) and females with 2 vehicles (19,642, making up 49.6%).
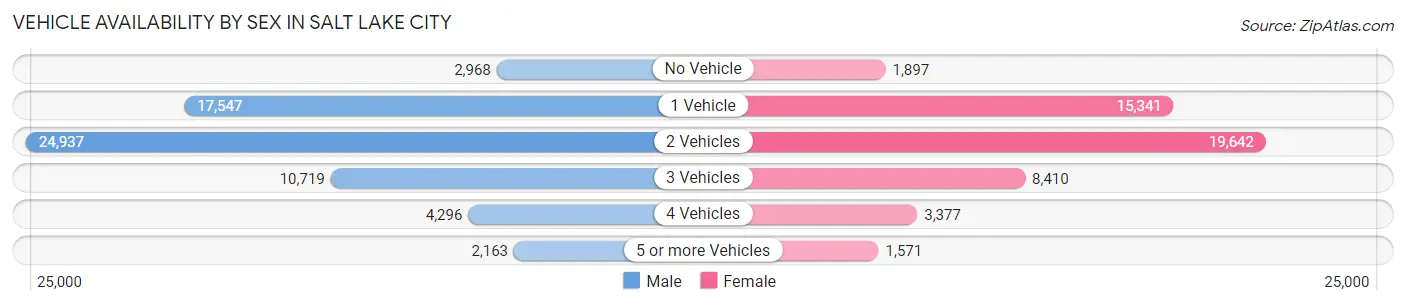
| Vehicles Available | Male | Female |
| No Vehicle | 2,968 (4.7%) | 1,897 (3.8%) |
| 1 Vehicle | 17,547 (28.0%) | 15,341 (30.5%) |
| 2 Vehicles | 24,937 (39.8%) | 19,642 (39.1%) |
| 3 Vehicles | 10,719 (17.1%) | 8,410 (16.7%) |
| 4 Vehicles | 4,296 (6.9%) | 3,377 (6.7%) |
| 5 or more Vehicles | 2,163 (3.5%) | 1,571 (3.1%) |
| Total | 62,630 (100.0%) | 50,238 (100.0%) |
Commute Time in Salt Lake City
The most frequently occuring commute durations in Salt Lake City are 15 to 19 minutes (22,847 commuters, 23.4%), 10 to 14 minutes (21,143 commuters, 21.6%), and 20 to 24 minutes (15,920 commuters, 16.3%).
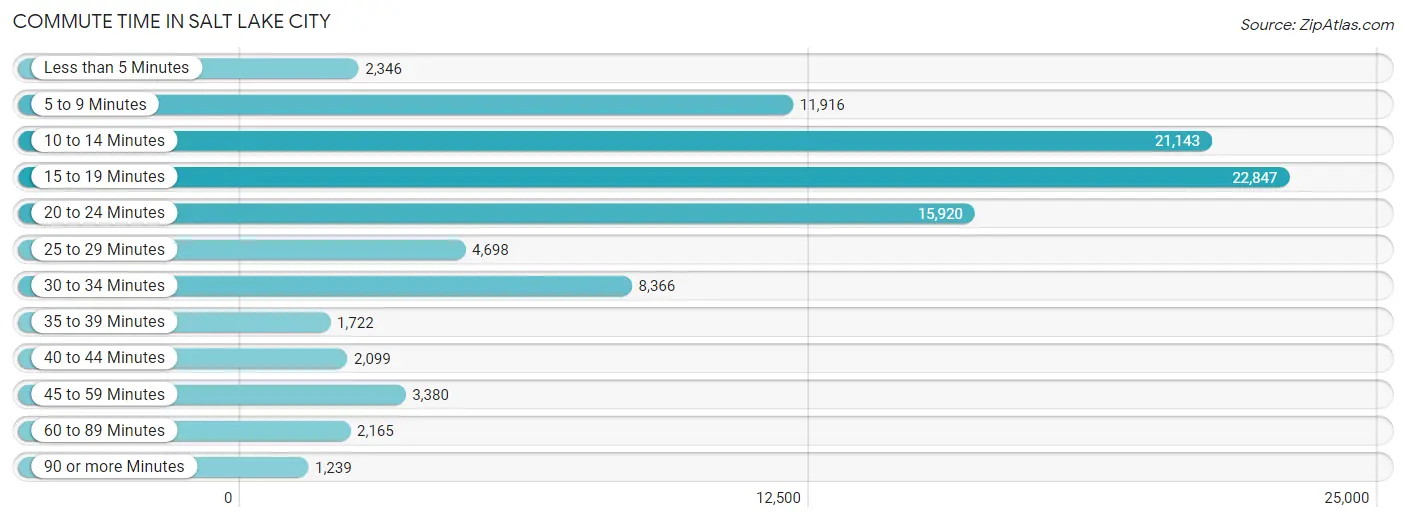
| Commute Time | # Commuters | % Commuters |
| Less than 5 Minutes | 2,346 | 2.4% |
| 5 to 9 Minutes | 11,916 | 12.2% |
| 10 to 14 Minutes | 21,143 | 21.6% |
| 15 to 19 Minutes | 22,847 | 23.4% |
| 20 to 24 Minutes | 15,920 | 16.3% |
| 25 to 29 Minutes | 4,698 | 4.8% |
| 30 to 34 Minutes | 8,366 | 8.6% |
| 35 to 39 Minutes | 1,722 | 1.8% |
| 40 to 44 Minutes | 2,099 | 2.1% |
| 45 to 59 Minutes | 3,380 | 3.5% |
| 60 to 89 Minutes | 2,165 | 2.2% |
| 90 or more Minutes | 1,239 | 1.3% |
Commute Time by Sex in Salt Lake City
The most common commute times in Salt Lake City are 15 to 19 minutes (12,963 commuters, 23.5%) for males and 15 to 19 minutes (9,884 commuters, 23.1%) for females.
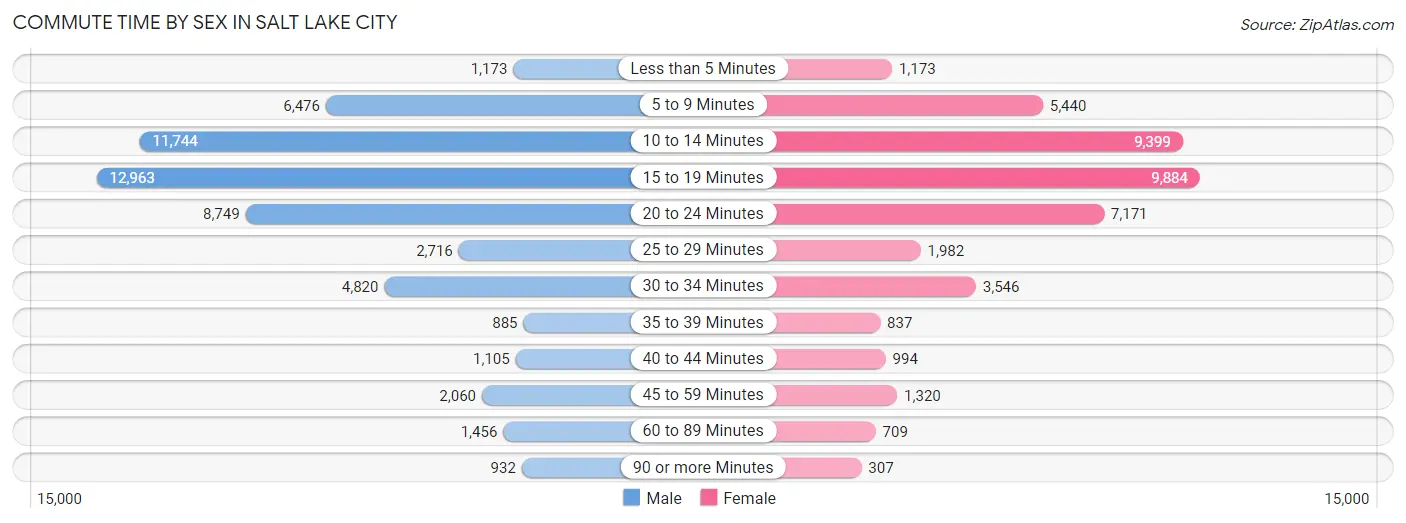
| Commute Time | Male | Female |
| Less than 5 Minutes | 1,173 (2.1%) | 1,173 (2.7%) |
| 5 to 9 Minutes | 6,476 (11.8%) | 5,440 (12.7%) |
| 10 to 14 Minutes | 11,744 (21.3%) | 9,399 (22.0%) |
| 15 to 19 Minutes | 12,963 (23.5%) | 9,884 (23.1%) |
| 20 to 24 Minutes | 8,749 (15.9%) | 7,171 (16.8%) |
| 25 to 29 Minutes | 2,716 (4.9%) | 1,982 (4.6%) |
| 30 to 34 Minutes | 4,820 (8.7%) | 3,546 (8.3%) |
| 35 to 39 Minutes | 885 (1.6%) | 837 (2.0%) |
| 40 to 44 Minutes | 1,105 (2.0%) | 994 (2.3%) |
| 45 to 59 Minutes | 2,060 (3.7%) | 1,320 (3.1%) |
| 60 to 89 Minutes | 1,456 (2.6%) | 709 (1.7%) |
| 90 or more Minutes | 932 (1.7%) | 307 (0.7%) |
Time of Departure to Work by Sex in Salt Lake City
The most frequent times of departure to work in Salt Lake City are 8:00 AM to 8:29 AM (7,341, 13.3%) for males and 8:00 AM to 8:29 AM (6,163, 14.4%) for females.
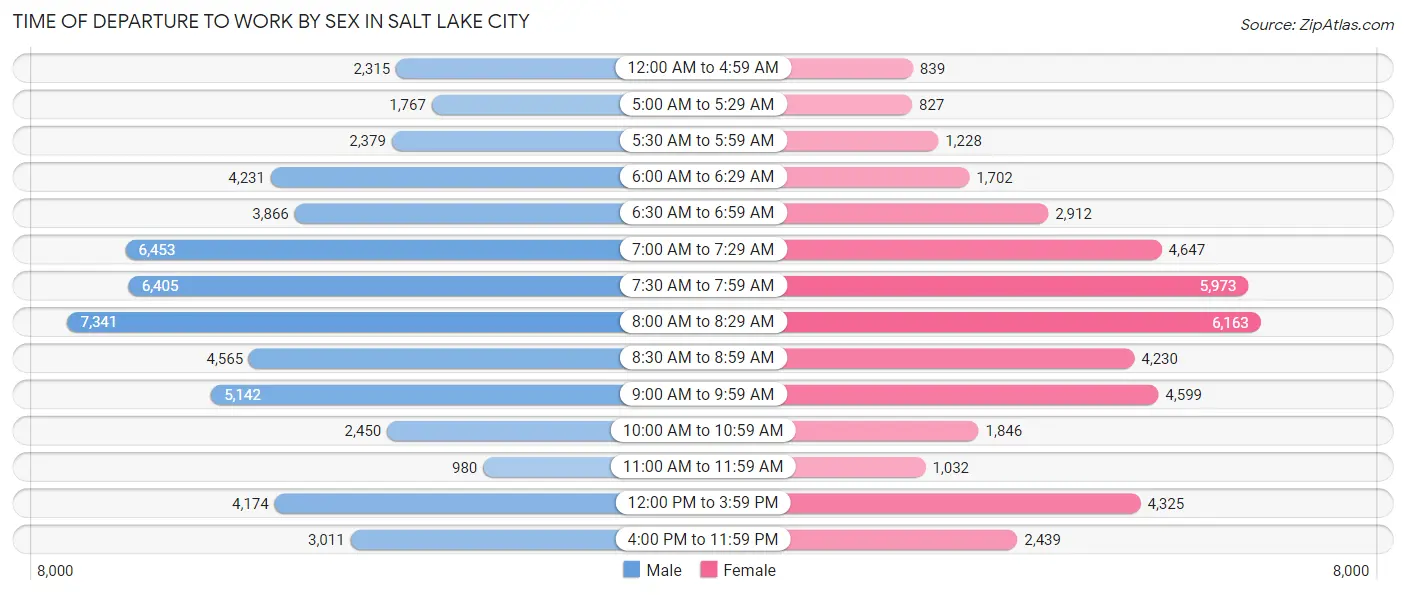
| Time of Departure | Male | Female |
| 12:00 AM to 4:59 AM | 2,315 (4.2%) | 839 (2.0%) |
| 5:00 AM to 5:29 AM | 1,767 (3.2%) | 827 (1.9%) |
| 5:30 AM to 5:59 AM | 2,379 (4.3%) | 1,228 (2.9%) |
| 6:00 AM to 6:29 AM | 4,231 (7.7%) | 1,702 (4.0%) |
| 6:30 AM to 6:59 AM | 3,866 (7.0%) | 2,912 (6.8%) |
| 7:00 AM to 7:29 AM | 6,453 (11.7%) | 4,647 (10.9%) |
| 7:30 AM to 7:59 AM | 6,405 (11.6%) | 5,973 (14.0%) |
| 8:00 AM to 8:29 AM | 7,341 (13.3%) | 6,163 (14.4%) |
| 8:30 AM to 8:59 AM | 4,565 (8.3%) | 4,230 (9.9%) |
| 9:00 AM to 9:59 AM | 5,142 (9.3%) | 4,599 (10.7%) |
| 10:00 AM to 10:59 AM | 2,450 (4.4%) | 1,846 (4.3%) |
| 11:00 AM to 11:59 AM | 980 (1.8%) | 1,032 (2.4%) |
| 12:00 PM to 3:59 PM | 4,174 (7.6%) | 4,325 (10.1%) |
| 4:00 PM to 11:59 PM | 3,011 (5.5%) | 2,439 (5.7%) |
| Total | 55,079 (100.0%) | 42,762 (100.0%) |
Housing Occupancy in Salt Lake City
Occupancy by Ownership in Salt Lake City
Of the total 85,435 dwellings in Salt Lake City, owner-occupied units account for 40,132 (47.0%), while renter-occupied units make up 45,303 (53.0%).
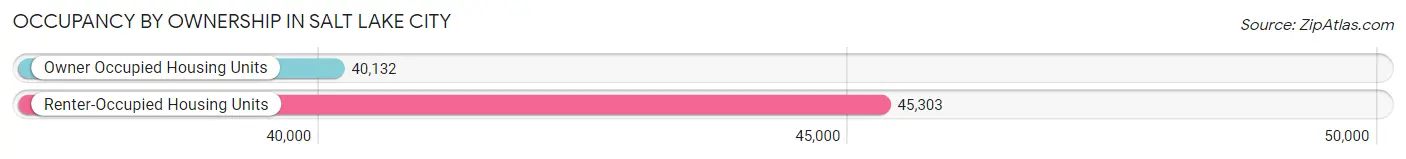
| Occupancy | # Housing Units | % Housing Units |
| Owner Occupied Housing Units | 40,132 | 47.0% |
| Renter-Occupied Housing Units | 45,303 | 53.0% |
| Total Occupied Housing Units | 85,435 | 100.0% |
Occupancy by Household Size in Salt Lake City
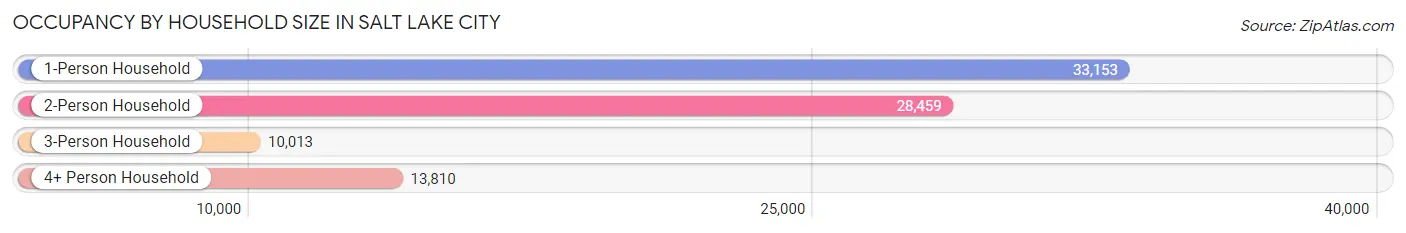
| Household Size | # Housing Units | % Housing Units |
| 1-Person Household | 33,153 | 38.8% |
| 2-Person Household | 28,459 | 33.3% |
| 3-Person Household | 10,013 | 11.7% |
| 4+ Person Household | 13,810 | 16.2% |
| Total Housing Units | 85,435 | 100.0% |
Occupancy by Ownership by Household Size in Salt Lake City
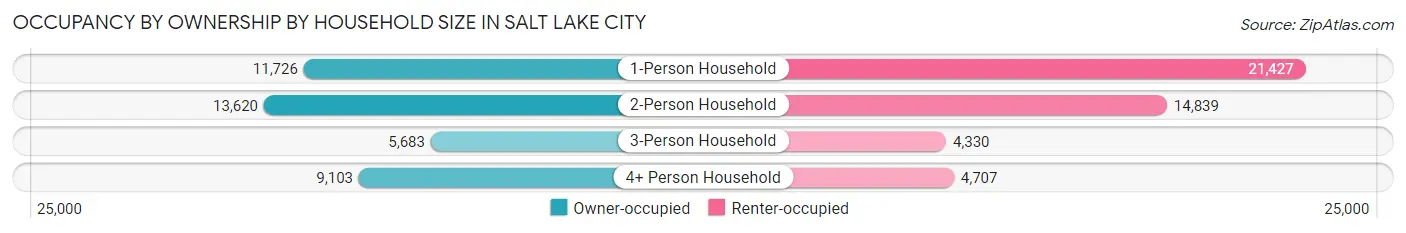
| Household Size | Owner-occupied | Renter-occupied |
| 1-Person Household | 11,726 (35.4%) | 21,427 (64.6%) |
| 2-Person Household | 13,620 (47.9%) | 14,839 (52.1%) |
| 3-Person Household | 5,683 (56.8%) | 4,330 (43.2%) |
| 4+ Person Household | 9,103 (65.9%) | 4,707 (34.1%) |
| Total Housing Units | 40,132 (47.0%) | 45,303 (53.0%) |
Occupancy by Educational Attainment in Salt Lake City
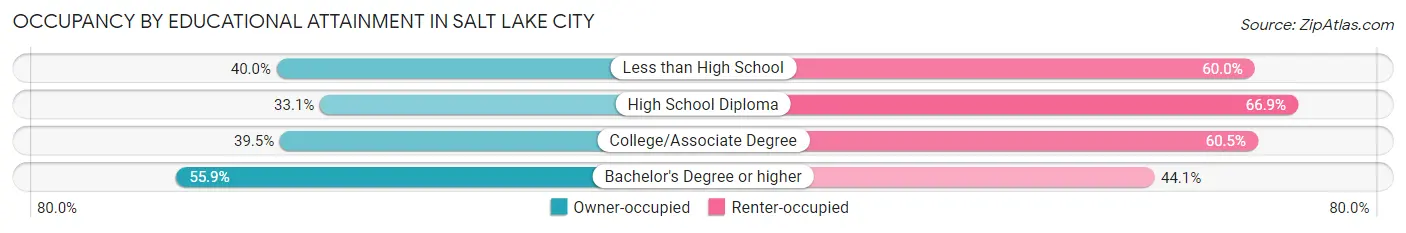
| Household Size | Owner-occupied | Renter-occupied |
| Less than High School | 2,191 (40.0%) | 3,287 (60.0%) |
| High School Diploma | 4,399 (33.1%) | 8,881 (66.9%) |
| College/Associate Degree | 9,002 (39.5%) | 13,799 (60.5%) |
| Bachelor's Degree or higher | 24,540 (55.9%) | 19,336 (44.1%) |
Occupancy by Age of Householder in Salt Lake City
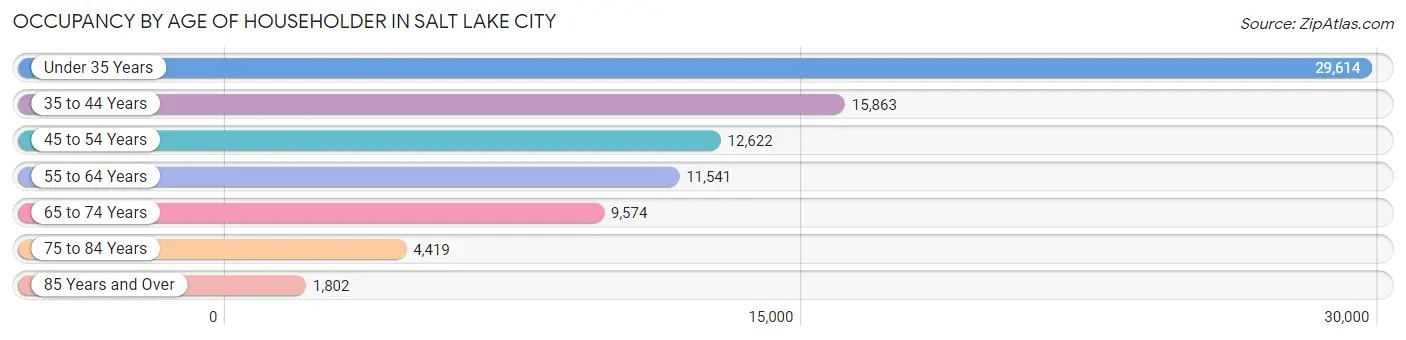
| Age Bracket | # Households | % Households |
| Under 35 Years | 29,614 | 34.7% |
| 35 to 44 Years | 15,863 | 18.6% |
| 45 to 54 Years | 12,622 | 14.8% |
| 55 to 64 Years | 11,541 | 13.5% |
| 65 to 74 Years | 9,574 | 11.2% |
| 75 to 84 Years | 4,419 | 5.2% |
| 85 Years and Over | 1,802 | 2.1% |
| Total | 85,435 | 100.0% |
Housing Finances in Salt Lake City
Median Income by Occupancy in Salt Lake City
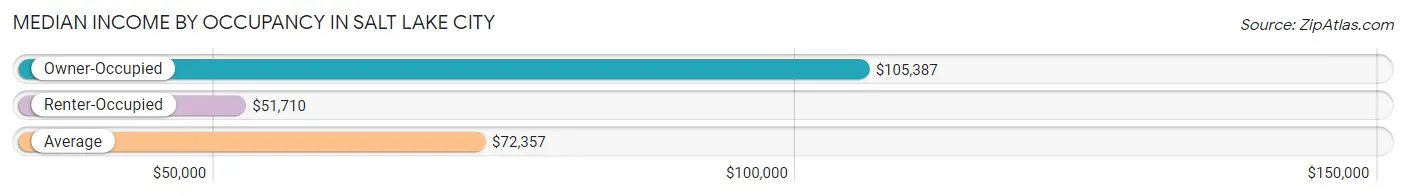
| Occupancy Type | # Households | Median Income |
| Owner-Occupied | 40,132 (47.0%) | $105,387 |
| Renter-Occupied | 45,303 (53.0%) | $51,710 |
| Average | 85,435 (100.0%) | $72,357 |
Occupancy by Householder Income Bracket in Salt Lake City
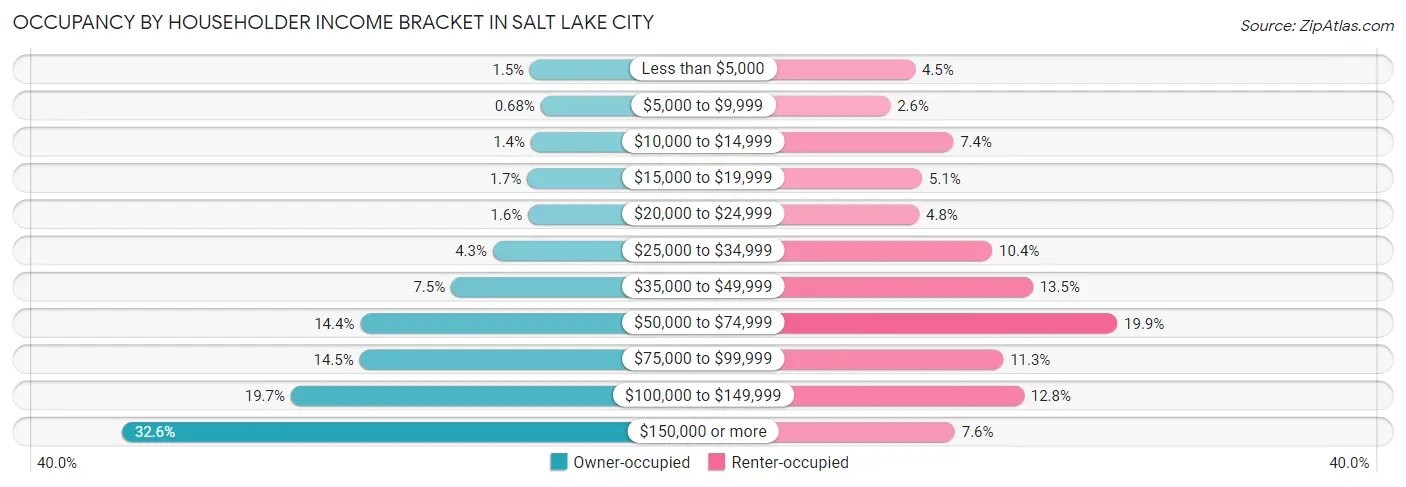
| Income Bracket | Owner-occupied | Renter-occupied |
| Less than $5,000 | 601 (1.5%) | 2,053 (4.5%) |
| $5,000 to $9,999 | 274 (0.7%) | 1,197 (2.6%) |
| $10,000 to $14,999 | 574 (1.4%) | 3,371 (7.4%) |
| $15,000 to $19,999 | 681 (1.7%) | 2,295 (5.1%) |
| $20,000 to $24,999 | 657 (1.6%) | 2,194 (4.8%) |
| $25,000 to $34,999 | 1,737 (4.3%) | 4,718 (10.4%) |
| $35,000 to $49,999 | 3,015 (7.5%) | 6,114 (13.5%) |
| $50,000 to $74,999 | 5,791 (14.4%) | 9,029 (19.9%) |
| $75,000 to $99,999 | 5,810 (14.5%) | 5,098 (11.3%) |
| $100,000 to $149,999 | 7,913 (19.7%) | 5,808 (12.8%) |
| $150,000 or more | 13,079 (32.6%) | 3,426 (7.6%) |
| Total | 40,132 (100.0%) | 45,303 (100.0%) |
Monthly Housing Cost Tiers in Salt Lake City
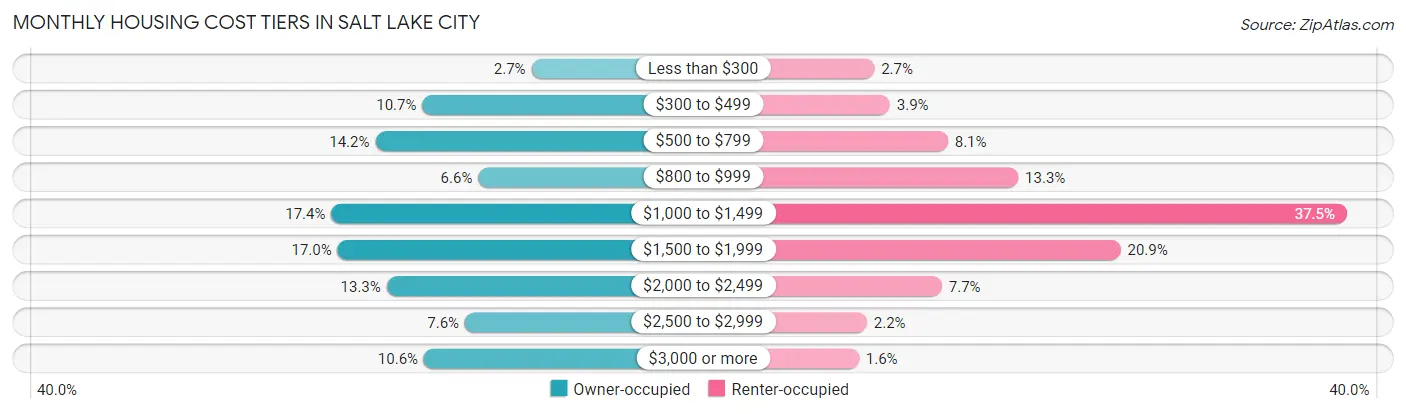
| Monthly Cost | Owner-occupied | Renter-occupied |
| Less than $300 | 1,072 (2.7%) | 1,226 (2.7%) |
| $300 to $499 | 4,300 (10.7%) | 1,748 (3.9%) |
| $500 to $799 | 5,687 (14.2%) | 3,681 (8.1%) |
| $800 to $999 | 2,644 (6.6%) | 6,028 (13.3%) |
| $1,000 to $1,499 | 6,986 (17.4%) | 16,995 (37.5%) |
| $1,500 to $1,999 | 6,802 (17.0%) | 9,444 (20.8%) |
| $2,000 to $2,499 | 5,353 (13.3%) | 3,482 (7.7%) |
| $2,500 to $2,999 | 3,039 (7.6%) | 981 (2.2%) |
| $3,000 or more | 4,249 (10.6%) | 718 (1.6%) |
| Total | 40,132 (100.0%) | 45,303 (100.0%) |
Physical Housing Characteristics in Salt Lake City
Housing Structures in Salt Lake City
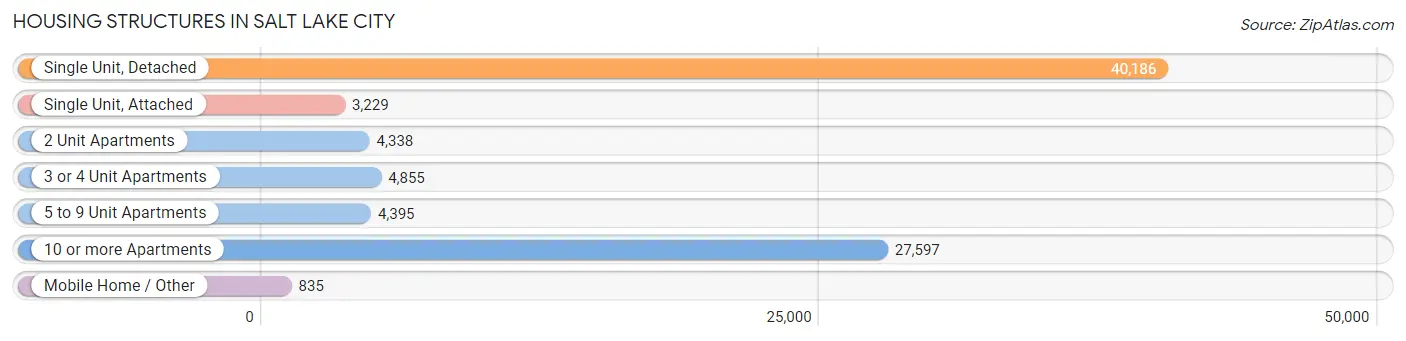
| Structure Type | # Housing Units | % Housing Units |
| Single Unit, Detached | 40,186 | 47.0% |
| Single Unit, Attached | 3,229 | 3.8% |
| 2 Unit Apartments | 4,338 | 5.1% |
| 3 or 4 Unit Apartments | 4,855 | 5.7% |
| 5 to 9 Unit Apartments | 4,395 | 5.1% |
| 10 or more Apartments | 27,597 | 32.3% |
| Mobile Home / Other | 835 | 1.0% |
| Total | 85,435 | 100.0% |
Housing Structures by Occupancy in Salt Lake City
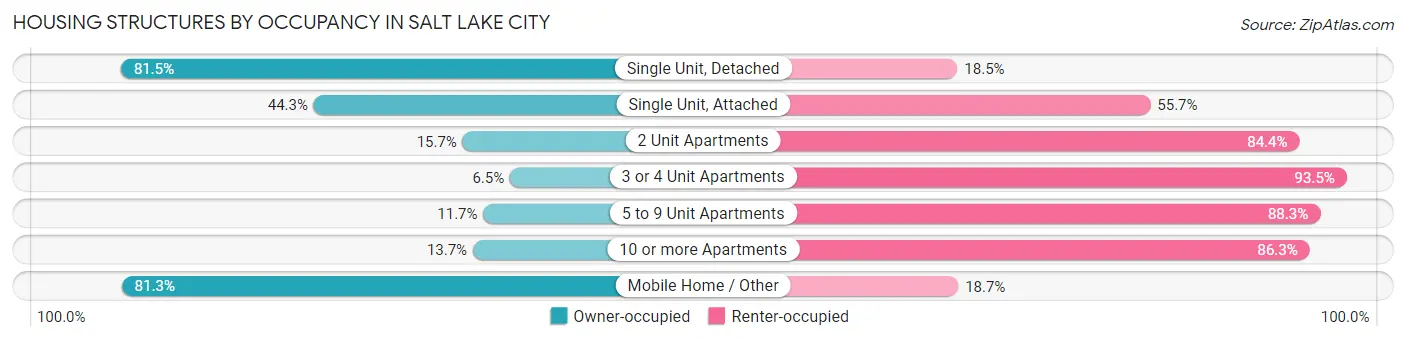
| Structure Type | Owner-occupied | Renter-occupied |
| Single Unit, Detached | 32,739 (81.5%) | 7,447 (18.5%) |
| Single Unit, Attached | 1,431 (44.3%) | 1,798 (55.7%) |
| 2 Unit Apartments | 679 (15.7%) | 3,659 (84.4%) |
| 3 or 4 Unit Apartments | 317 (6.5%) | 4,538 (93.5%) |
| 5 to 9 Unit Apartments | 513 (11.7%) | 3,882 (88.3%) |
| 10 or more Apartments | 3,774 (13.7%) | 23,823 (86.3%) |
| Mobile Home / Other | 679 (81.3%) | 156 (18.7%) |
| Total | 40,132 (47.0%) | 45,303 (53.0%) |
Housing Structures by Number of Rooms in Salt Lake City
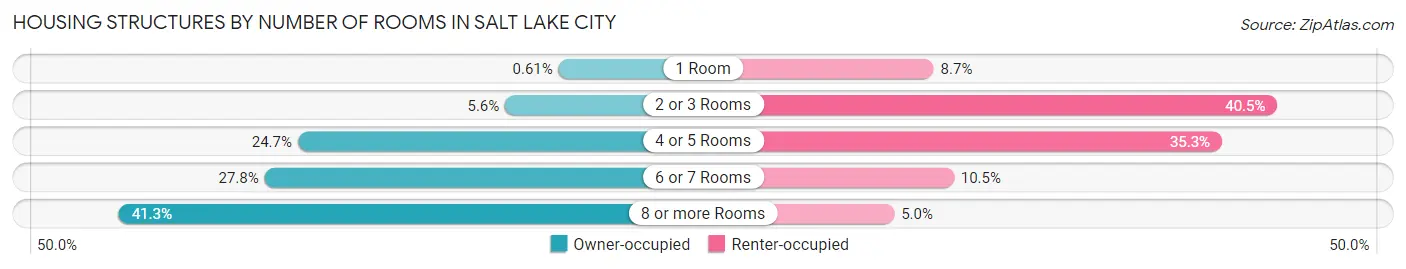
| Number of Rooms | Owner-occupied | Renter-occupied |
| 1 Room | 246 (0.6%) | 3,927 (8.7%) |
| 2 or 3 Rooms | 2,231 (5.6%) | 18,325 (40.5%) |
| 4 or 5 Rooms | 9,923 (24.7%) | 16,005 (35.3%) |
| 6 or 7 Rooms | 11,161 (27.8%) | 4,771 (10.5%) |
| 8 or more Rooms | 16,571 (41.3%) | 2,275 (5.0%) |
| Total | 40,132 (100.0%) | 45,303 (100.0%) |
Housing Structure by Heating Type in Salt Lake City
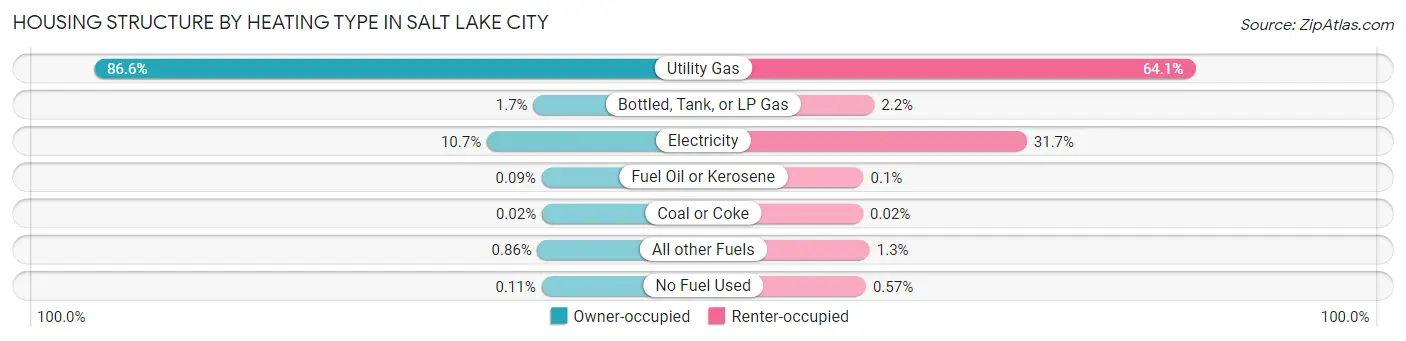
| Heating Type | Owner-occupied | Renter-occupied |
| Utility Gas | 34,752 (86.6%) | 29,058 (64.1%) |
| Bottled, Tank, or LP Gas | 671 (1.7%) | 986 (2.2%) |
| Electricity | 4,275 (10.6%) | 14,345 (31.7%) |
| Fuel Oil or Kerosene | 36 (0.1%) | 45 (0.1%) |
| Coal or Coke | 8 (0.0%) | 11 (0.0%) |
| All other Fuels | 344 (0.9%) | 598 (1.3%) |
| No Fuel Used | 46 (0.1%) | 260 (0.6%) |
| Total | 40,132 (100.0%) | 45,303 (100.0%) |
Household Vehicle Usage in Salt Lake City
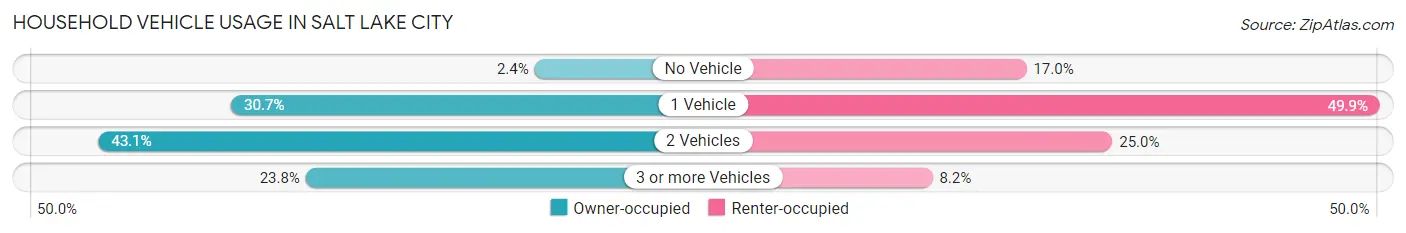
| Vehicles per Household | Owner-occupied | Renter-occupied |
| No Vehicle | 965 (2.4%) | 7,678 (17.0%) |
| 1 Vehicle | 12,328 (30.7%) | 22,618 (49.9%) |
| 2 Vehicles | 17,305 (43.1%) | 11,308 (25.0%) |
| 3 or more Vehicles | 9,534 (23.8%) | 3,699 (8.2%) |
| Total | 40,132 (100.0%) | 45,303 (100.0%) |
Real Estate & Mortgages in Salt Lake City
Real Estate and Mortgage Overview in Salt Lake City
| Characteristic | Without Mortgage | With Mortgage |
| Housing Units | 13,347 | 26,785 |
| Median Property Value | $463,300 | $456,500 |
| Median Household Income | $80,519 | $9,754 |
| Monthly Housing Costs | $564 | $4,043 |
| Real Estate Taxes | $2,724 | $724 |
Property Value by Mortgage Status in Salt Lake City
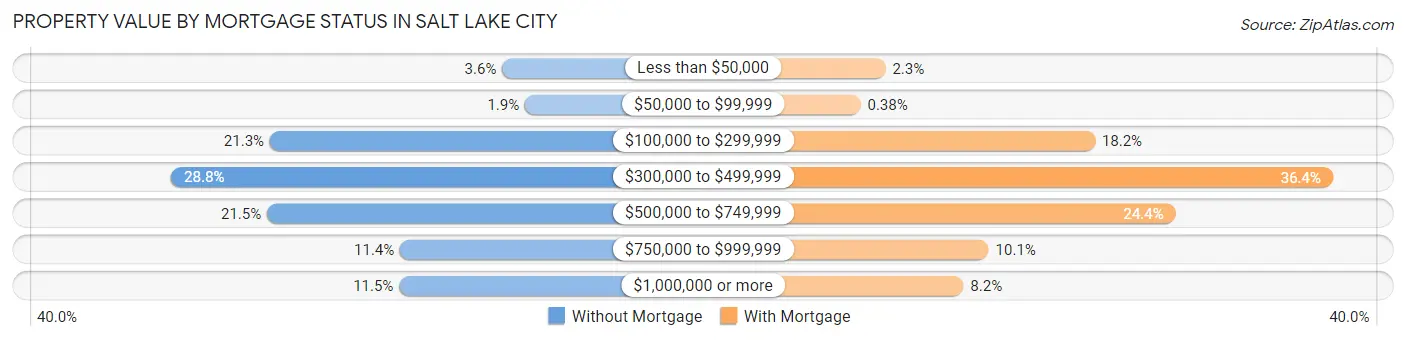
| Property Value | Without Mortgage | With Mortgage |
| Less than $50,000 | 482 (3.6%) | 612 (2.3%) |
| $50,000 to $99,999 | 250 (1.9%) | 102 (0.4%) |
| $100,000 to $299,999 | 2,844 (21.3%) | 4,885 (18.2%) |
| $300,000 to $499,999 | 3,848 (28.8%) | 9,739 (36.4%) |
| $500,000 to $749,999 | 2,873 (21.5%) | 6,531 (24.4%) |
| $750,000 to $999,999 | 1,520 (11.4%) | 2,715 (10.1%) |
| $1,000,000 or more | 1,530 (11.5%) | 2,201 (8.2%) |
| Total | 13,347 (100.0%) | 26,785 (100.0%) |
Household Income by Mortgage Status in Salt Lake City
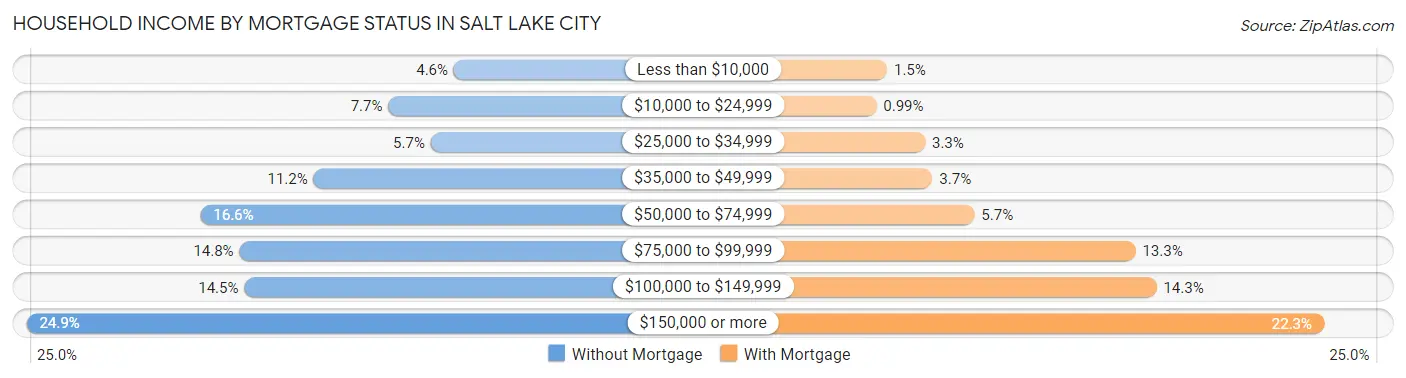
| Household Income | Without Mortgage | With Mortgage |
| Less than $10,000 | 609 (4.6%) | 401 (1.5%) |
| $10,000 to $24,999 | 1,025 (7.7%) | 266 (1.0%) |
| $25,000 to $34,999 | 756 (5.7%) | 887 (3.3%) |
| $35,000 to $49,999 | 1,500 (11.2%) | 981 (3.7%) |
| $50,000 to $74,999 | 2,220 (16.6%) | 1,515 (5.7%) |
| $75,000 to $99,999 | 1,972 (14.8%) | 3,571 (13.3%) |
| $100,000 to $149,999 | 1,940 (14.5%) | 3,838 (14.3%) |
| $150,000 or more | 3,325 (24.9%) | 5,973 (22.3%) |
| Total | 13,347 (100.0%) | 26,785 (100.0%) |
Property Value to Household Income Ratio in Salt Lake City
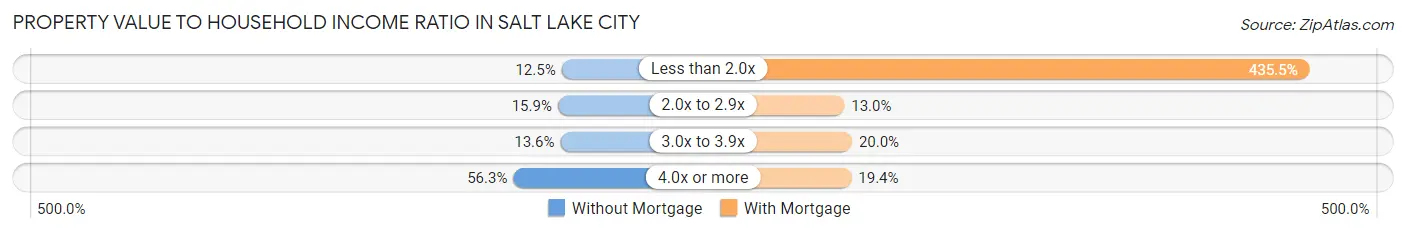
| Value-to-Income Ratio | Without Mortgage | With Mortgage |
| Less than 2.0x | 1,663 (12.5%) | 116,652 (435.5%) |
| 2.0x to 2.9x | 2,117 (15.9%) | 3,487 (13.0%) |
| 3.0x to 3.9x | 1,810 (13.6%) | 5,354 (20.0%) |
| 4.0x or more | 7,516 (56.3%) | 5,207 (19.4%) |
| Total | 13,347 (100.0%) | 26,785 (100.0%) |
Real Estate Taxes by Mortgage Status in Salt Lake City
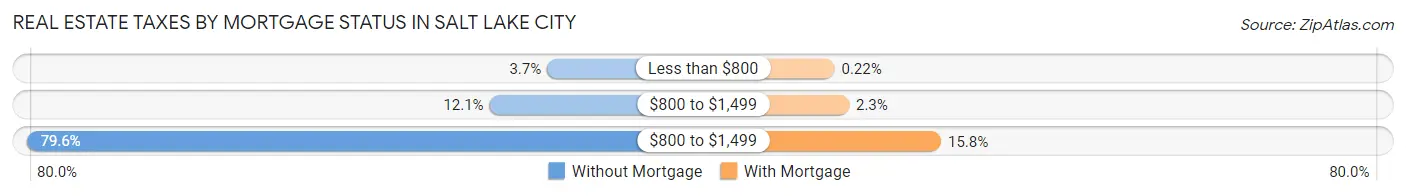
| Property Taxes | Without Mortgage | With Mortgage |
| Less than $800 | 488 (3.7%) | 58 (0.2%) |
| $800 to $1,499 | 1,612 (12.1%) | 626 (2.3%) |
| $800 to $1,499 | 10,622 (79.6%) | 4,228 (15.8%) |
| Total | 13,347 (100.0%) | 26,785 (100.0%) |
Health & Disability in Salt Lake City
Health Insurance Coverage by Age in Salt Lake City
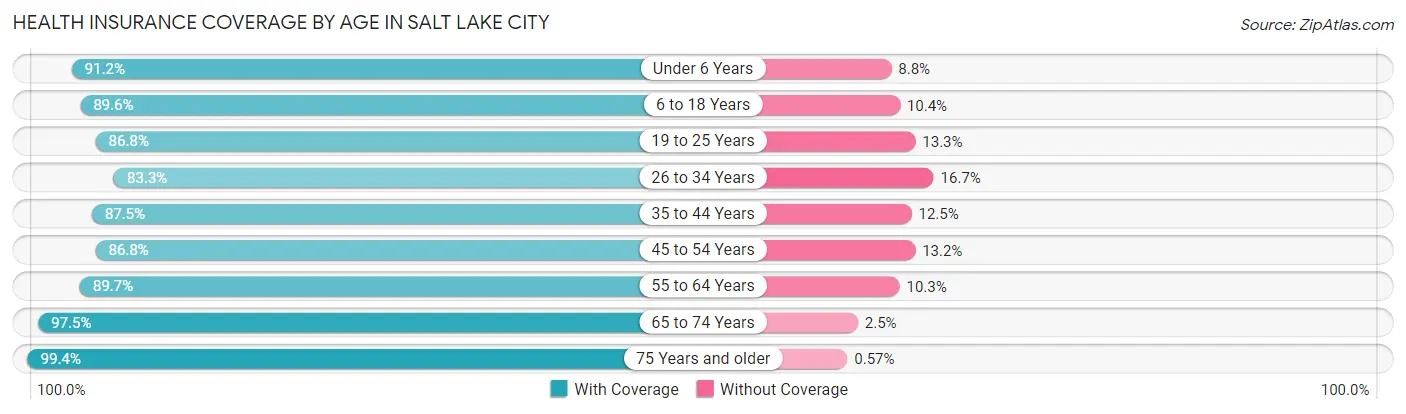
| Age Bracket | With Coverage | Without Coverage |
| Under 6 Years | 11,521 (91.2%) | 1,108 (8.8%) |
| 6 to 18 Years | 23,850 (89.6%) | 2,762 (10.4%) |
| 19 to 25 Years | 27,968 (86.8%) | 4,271 (13.3%) |
| 26 to 34 Years | 31,491 (83.3%) | 6,295 (16.7%) |
| 35 to 44 Years | 24,272 (87.5%) | 3,480 (12.5%) |
| 45 to 54 Years | 18,469 (86.8%) | 2,813 (13.2%) |
| 55 to 64 Years | 17,156 (89.7%) | 1,969 (10.3%) |
| 65 to 74 Years | 13,969 (97.5%) | 363 (2.5%) |
| 75 Years and older | 8,674 (99.4%) | 50 (0.6%) |
| Total | 177,370 (88.5%) | 23,111 (11.5%) |
Health Insurance Coverage by Citizenship Status in Salt Lake City
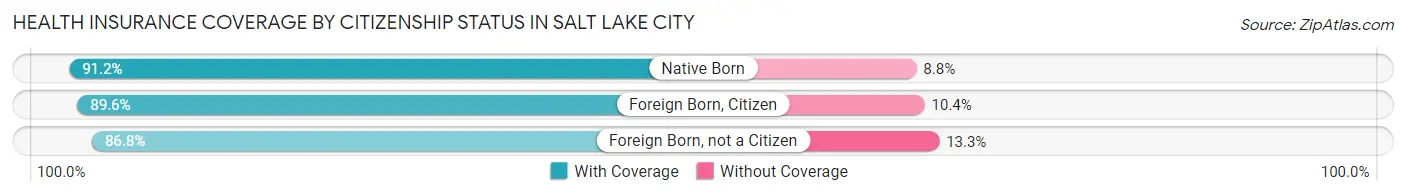
| Citizenship Status | With Coverage | Without Coverage |
| Native Born | 11,521 (91.2%) | 1,108 (8.8%) |
| Foreign Born, Citizen | 23,850 (89.6%) | 2,762 (10.4%) |
| Foreign Born, not a Citizen | 27,968 (86.8%) | 4,271 (13.3%) |
Health Insurance Coverage by Household Income in Salt Lake City
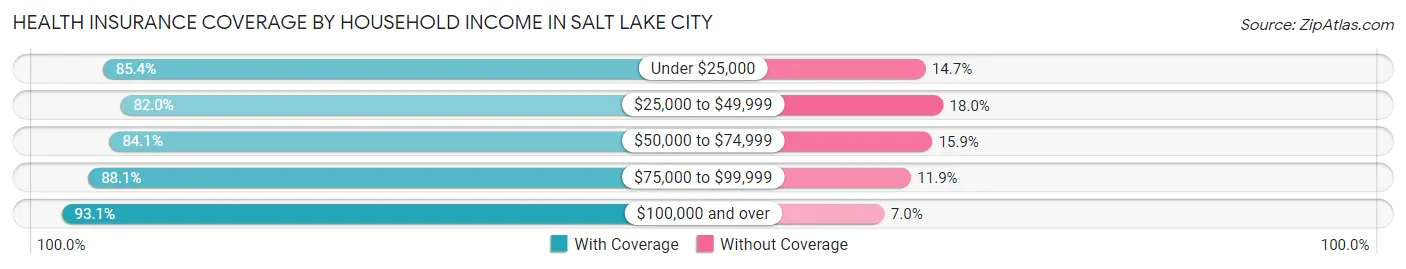
| Household Income | With Coverage | Without Coverage |
| Under $25,000 | 17,879 (85.4%) | 3,069 (14.6%) |
| $25,000 to $49,999 | 23,909 (82.0%) | 5,234 (18.0%) |
| $50,000 to $74,999 | 26,277 (84.1%) | 4,971 (15.9%) |
| $75,000 to $99,999 | 22,658 (88.1%) | 3,065 (11.9%) |
| $100,000 and over | 80,054 (93.0%) | 5,980 (7.0%) |
Public vs Private Health Insurance Coverage by Age in Salt Lake City
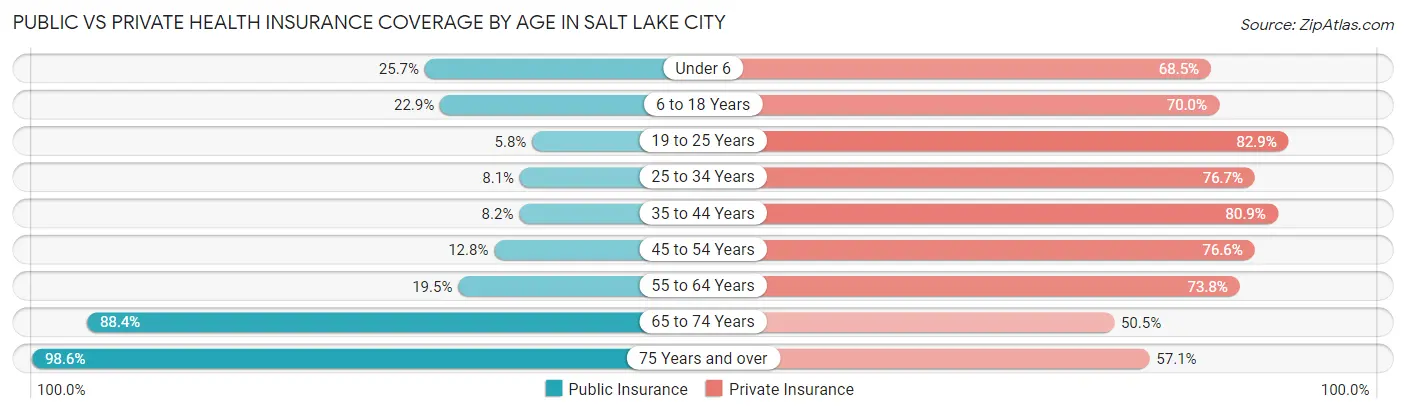
| Age Bracket | Public Insurance | Private Insurance |
| Under 6 | 3,246 (25.7%) | 8,652 (68.5%) |
| 6 to 18 Years | 6,090 (22.9%) | 18,624 (70.0%) |
| 19 to 25 Years | 1,863 (5.8%) | 26,733 (82.9%) |
| 25 to 34 Years | 3,045 (8.1%) | 28,965 (76.7%) |
| 35 to 44 Years | 2,274 (8.2%) | 22,448 (80.9%) |
| 45 to 54 Years | 2,730 (12.8%) | 16,307 (76.6%) |
| 55 to 64 Years | 3,731 (19.5%) | 14,122 (73.8%) |
| 65 to 74 Years | 12,673 (88.4%) | 7,240 (50.5%) |
| 75 Years and over | 8,604 (98.6%) | 4,981 (57.1%) |
| Total | 44,256 (22.1%) | 148,072 (73.9%) |
Disability Status by Sex by Age in Salt Lake City
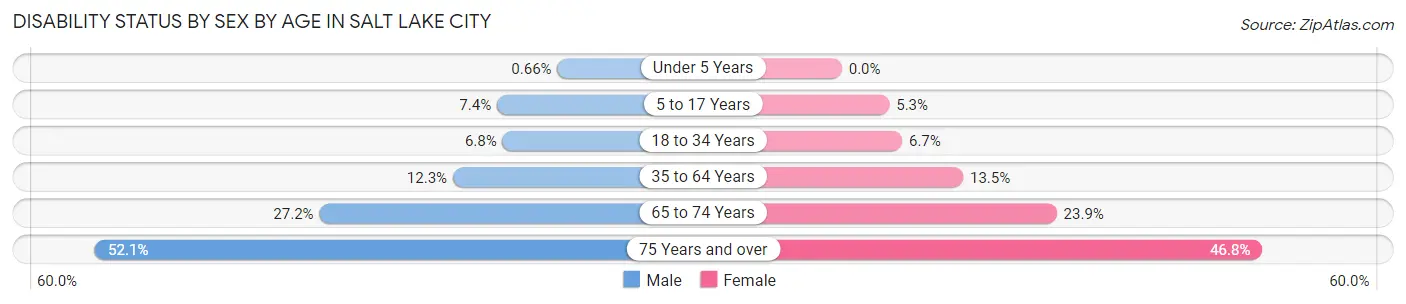
| Age Bracket | Male | Female |
| Under 5 Years | 35 (0.7%) | 0 (0.0%) |
| 5 to 17 Years | 974 (7.4%) | 662 (5.3%) |
| 18 to 34 Years | 2,543 (6.8%) | 2,390 (6.7%) |
| 35 to 64 Years | 4,471 (12.3%) | 4,295 (13.5%) |
| 65 to 74 Years | 1,990 (27.2%) | 1,677 (23.9%) |
| 75 Years and over | 1,945 (52.1%) | 2,338 (46.8%) |
Disability Class by Sex by Age in Salt Lake City
Disability Class: Hearing Difficulty
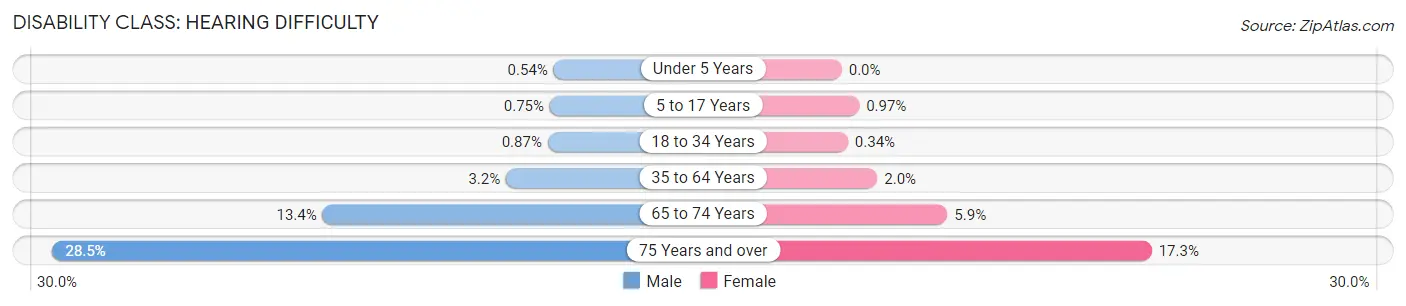
| Age Bracket | Male | Female |
| Under 5 Years | 29 (0.5%) | 0 (0.0%) |
| 5 to 17 Years | 99 (0.7%) | 122 (1.0%) |
| 18 to 34 Years | 326 (0.9%) | 120 (0.3%) |
| 35 to 64 Years | 1,160 (3.2%) | 630 (2.0%) |
| 65 to 74 Years | 982 (13.4%) | 412 (5.9%) |
| 75 Years and over | 1,061 (28.4%) | 862 (17.3%) |
Disability Class: Vision Difficulty
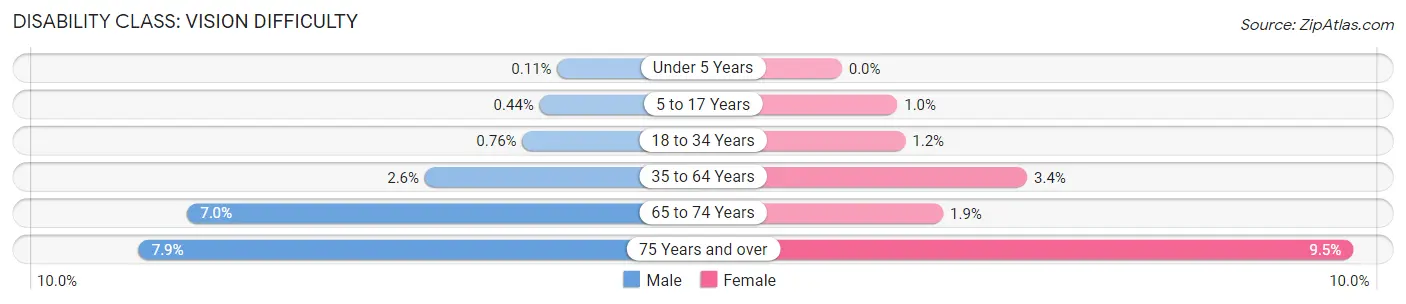
| Age Bracket | Male | Female |
| Under 5 Years | 6 (0.1%) | 0 (0.0%) |
| 5 to 17 Years | 58 (0.4%) | 129 (1.0%) |
| 18 to 34 Years | 284 (0.8%) | 420 (1.2%) |
| 35 to 64 Years | 935 (2.6%) | 1,095 (3.4%) |
| 65 to 74 Years | 511 (7.0%) | 132 (1.9%) |
| 75 Years and over | 294 (7.9%) | 474 (9.5%) |
Disability Class: Cognitive Difficulty
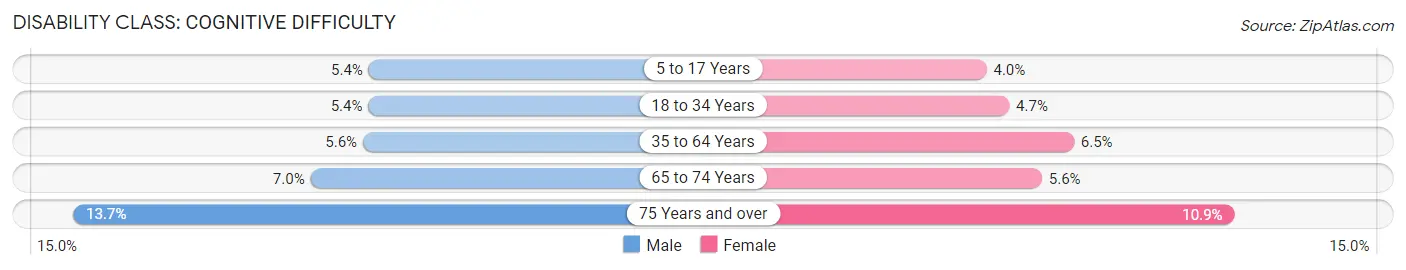
| Age Bracket | Male | Female |
| 5 to 17 Years | 715 (5.4%) | 504 (4.0%) |
| 18 to 34 Years | 2,040 (5.4%) | 1,661 (4.7%) |
| 35 to 64 Years | 2,028 (5.6%) | 2,057 (6.5%) |
| 65 to 74 Years | 516 (7.0%) | 390 (5.6%) |
| 75 Years and over | 509 (13.7%) | 546 (10.9%) |
Disability Class: Ambulatory Difficulty
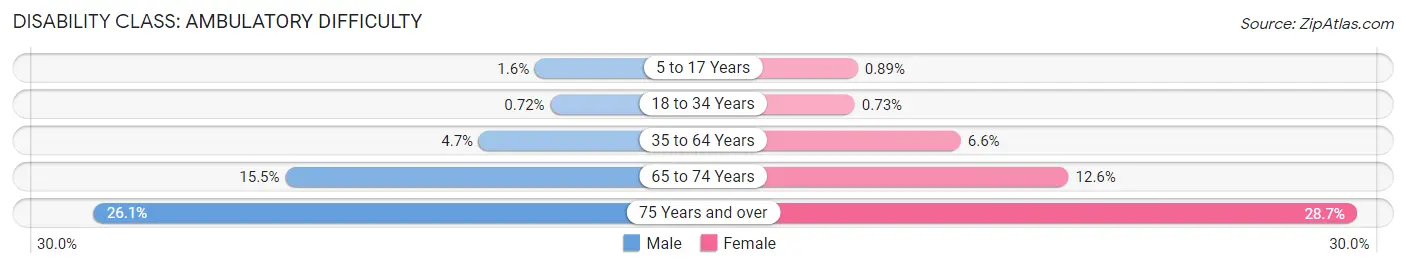
| Age Bracket | Male | Female |
| 5 to 17 Years | 208 (1.6%) | 111 (0.9%) |
| 18 to 34 Years | 270 (0.7%) | 261 (0.7%) |
| 35 to 64 Years | 1,709 (4.7%) | 2,110 (6.6%) |
| 65 to 74 Years | 1,134 (15.5%) | 885 (12.6%) |
| 75 Years and over | 975 (26.1%) | 1,432 (28.7%) |
Disability Class: Self-Care Difficulty
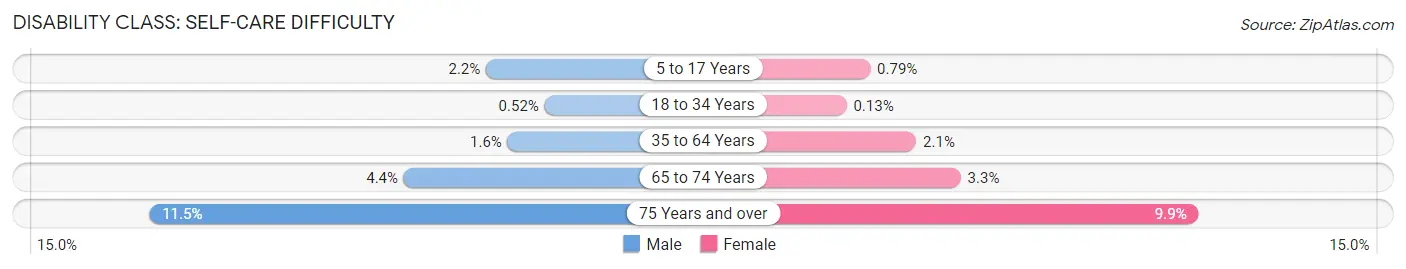
| Age Bracket | Male | Female |
| 5 to 17 Years | 283 (2.1%) | 99 (0.8%) |
| 18 to 34 Years | 194 (0.5%) | 47 (0.1%) |
| 35 to 64 Years | 563 (1.5%) | 660 (2.1%) |
| 65 to 74 Years | 325 (4.4%) | 232 (3.3%) |
| 75 Years and over | 430 (11.5%) | 496 (9.9%) |
Technology Access in Salt Lake City
Computing Device Access in Salt Lake City
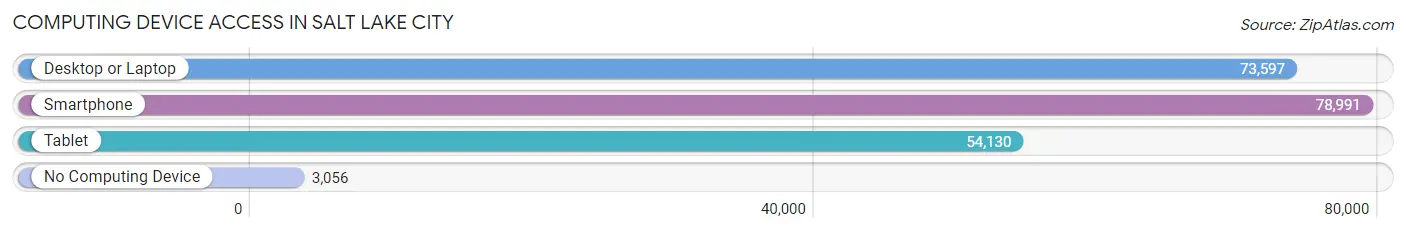
| Device Type | # Households | % Households |
| Desktop or Laptop | 73,597 | 86.1% |
| Smartphone | 78,991 | 92.5% |
| Tablet | 54,130 | 63.4% |
| No Computing Device | 3,056 | 3.6% |
| Total | 85,435 | 100.0% |
Internet Access in Salt Lake City
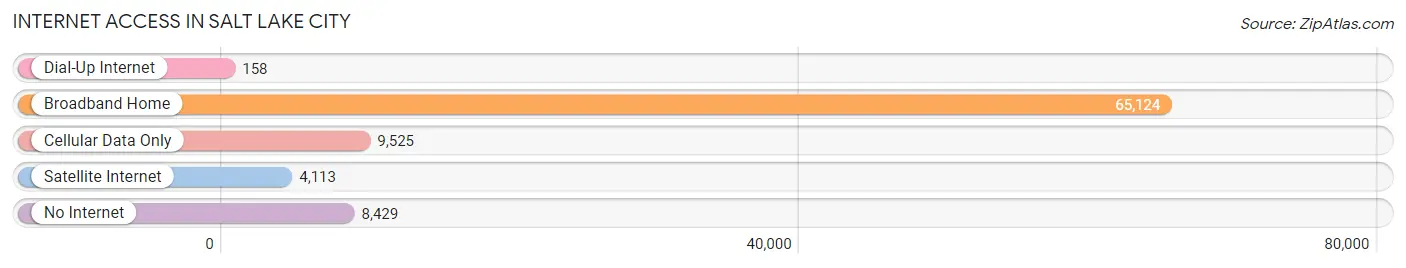
| Internet Type | # Households | % Households |
| Dial-Up Internet | 158 | 0.2% |
| Broadband Home | 65,124 | 76.2% |
| Cellular Data Only | 9,525 | 11.2% |
| Satellite Internet | 4,113 | 4.8% |
| No Internet | 8,429 | 9.9% |
| Total | 85,435 | 100.0% |
Salt Lake City Summary
Salt Lake City, UT is the capital and most populous city of the U.S. state of Utah. Located in the northern part of the state, it is the core of the Salt Lake City metropolitan area, which has a population of 1,153,340 (as of 2018). The city is situated in the Salt Lake Valley, at the base of the Wasatch Mountains, and is bordered by the Great Salt Lake to the west.
History
Salt Lake City was founded in 1847 by a group of Mormon pioneers led by Brigham Young. The pioneers had been sent by the Church of Jesus Christ of Latter-day Saints (LDS Church) to establish a new settlement in the Salt Lake Valley. The city was named after the nearby Great Salt Lake, which was a major source of salt for the pioneers.
The city quickly grew and became an important center for the LDS Church. In 1849, the city was designated as the territorial capital of the Utah Territory. In 1896, the city hosted the first-ever Olympic Games in the United States.
Geography
Salt Lake City is located in the northern part of Utah, in the Salt Lake Valley. The city is situated at an elevation of 4,327 feet (1,319 m) above sea level. The city is surrounded by the Wasatch Mountains to the east and the Oquirrh Mountains to the west. The Great Salt Lake lies to the west of the city.
The city covers an area of 110.4 square miles (286.3 km2). The climate of Salt Lake City is classified as a humid continental climate, with cold, snowy winters and hot, dry summers.
Economy
Salt Lake City is the economic and financial center of Utah. The city is home to several major corporations, including Zions Bank, Questar Corporation, and the Church of Jesus Christ of Latter-day Saints. The city is also a major center for tourism, with several ski resorts located in the nearby Wasatch Mountains.
The city's economy is also supported by a strong manufacturing sector, which includes the production of electronics, chemicals, and food products. The city is also home to several universities, including the University of Utah, Westminster College, and Salt Lake Community College.
Demographics
As of the 2018 U.S. Census, Salt Lake City had a population of 200,567. The city has a population density of 1,822 people per square mile (704/km2). The racial makeup of the city is 73.2% White, 2.3% African American, 1.2% Native American, 5.2% Asian, 0.2% Pacific Islander, and 17.1% from other races.
The median household income in Salt Lake City is $50,936, and the median family income is $62,945. The city has a poverty rate of 13.3%. The city's population is highly educated, with 37.2% of residents having a bachelor's degree or higher.
Salt Lake City is a major cultural center in Utah, with several museums, theaters, and other attractions. The city is also home to several professional sports teams, including the Utah Jazz of the NBA and Real Salt Lake of Major League Soccer.
Common Questions
What is Per Capita Income in Salt Lake City?
Per Capita income in Salt Lake City is $46,972.
What is the Median Family Income in Salt Lake City?
Median Family Income in Salt Lake City is $101,026.
What is the Median Household income in Salt Lake City?
Median Household Income in Salt Lake City is $72,357.
What is Income or Wage Gap in Salt Lake City?
Income or Wage Gap in Salt Lake City is 24.5%.
Women in Salt Lake City earn 75.5 cents for every dollar earned by a man.
What is Family Income Deficit in Salt Lake City?
Family Income Deficit in Salt Lake City is $11,423.
Families that are below poverty line in Salt Lake City earn $11,423 less on average than the poverty threshold level.
What is Inequality or Gini Index in Salt Lake City?
Inequality or Gini Index in Salt Lake City is 0.50.
What is the Total Population of Salt Lake City?
Total Population of Salt Lake City is 201,269.
What is the Total Male Population of Salt Lake City?
Total Male Population of Salt Lake City is 103,899.
What is the Total Female Population of Salt Lake City?
Total Female Population of Salt Lake City is 97,370.
What is the Ratio of Males per 100 Females in Salt Lake City?
There are 106.71 Males per 100 Females in Salt Lake City.
What is the Ratio of Females per 100 Males in Salt Lake City?
There are 93.72 Females per 100 Males in Salt Lake City.
What is the Median Population Age in Salt Lake City?
Median Population Age in Salt Lake City is 32.5 Years.
What is the Average Family Size in Salt Lake City
Average Family Size in Salt Lake City is 3.1 People.
What is the Average Household Size in Salt Lake City
Average Household Size in Salt Lake City is 2.3 People.
How Large is the Labor Force in Salt Lake City?
There are 123,323 People in the Labor Forcein in Salt Lake City.
What is the Percentage of People in the Labor Force in Salt Lake City?
73.0% of People are in the Labor Force in Salt Lake City.
What is the Unemployment Rate in Salt Lake City?
Unemployment Rate in Salt Lake City is 3.6%.