Bridgeport, CT Map & Demographics
Bridgeport Map
Bridgeport Overview
$29,506
PER CAPITA INCOME
$66,944
AVG FAMILY INCOME
$54,440
AVG HOUSEHOLD INCOME
25.2%
WAGE / INCOME GAP [ % ]
74.8¢/ $1
WAGE / INCOME GAP [ $ ]
$10,970
FAMILY INCOME DEFICIT
0.48
INEQUALITY / GINI INDEX
148,470
TOTAL POPULATION
72,315
MALE POPULATION
76,155
FEMALE POPULATION
94.96
MALES / 100 FEMALES
105.31
FEMALES / 100 MALES
37.5
MEDIAN AGE
3.4
AVG FAMILY SIZE
2.6
AVG HOUSEHOLD SIZE
79,813
LABOR FORCE [ PEOPLE ]
65.9%
PERCENT IN LABOR FORCE
9.5%
UNEMPLOYMENT RATE
Income in Bridgeport
Income Overview in Bridgeport
Per Capita Income in Bridgeport is $29,506, while median incomes of families and households are $66,944 and $54,440 respectively.
| Characteristic | Number | Measure |
| Per Capita Income | 148,470 | $29,506 |
| Median Family Income | 32,314 | $66,944 |
| Mean Family Income | 32,314 | $88,083 |
| Median Household Income | 55,550 | $54,440 |
| Mean Household Income | 55,550 | $73,831 |
| Income Deficit | 32,314 | $10,970 |
| Wage / Income Gap (%) | 148,470 | 25.19% |
| Wage / Income Gap ($) | 148,470 | 74.81¢ per $1 |
| Gini / Inequality Index | 148,470 | 0.48 |
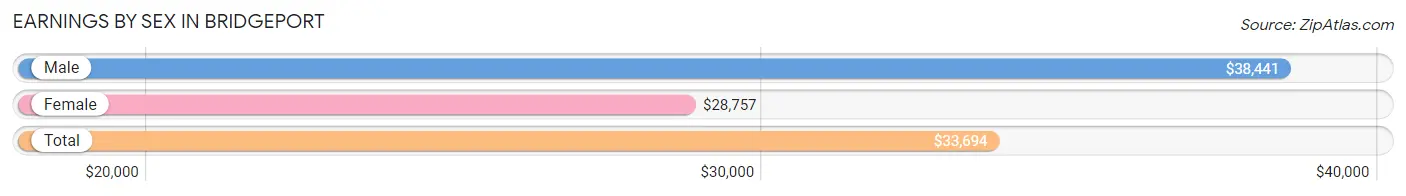
Earnings by Sex in Bridgeport
Average Earnings in Bridgeport are $33,694, $38,441 for men and $28,757 for women, a difference of 25.2%.
| Sex | Number | Average Earnings |
| Male | 41,439 (51.2%) | $38,441 |
| Female | 39,466 (48.8%) | $28,757 |
| Total | 80,905 (100.0%) | $33,694 |
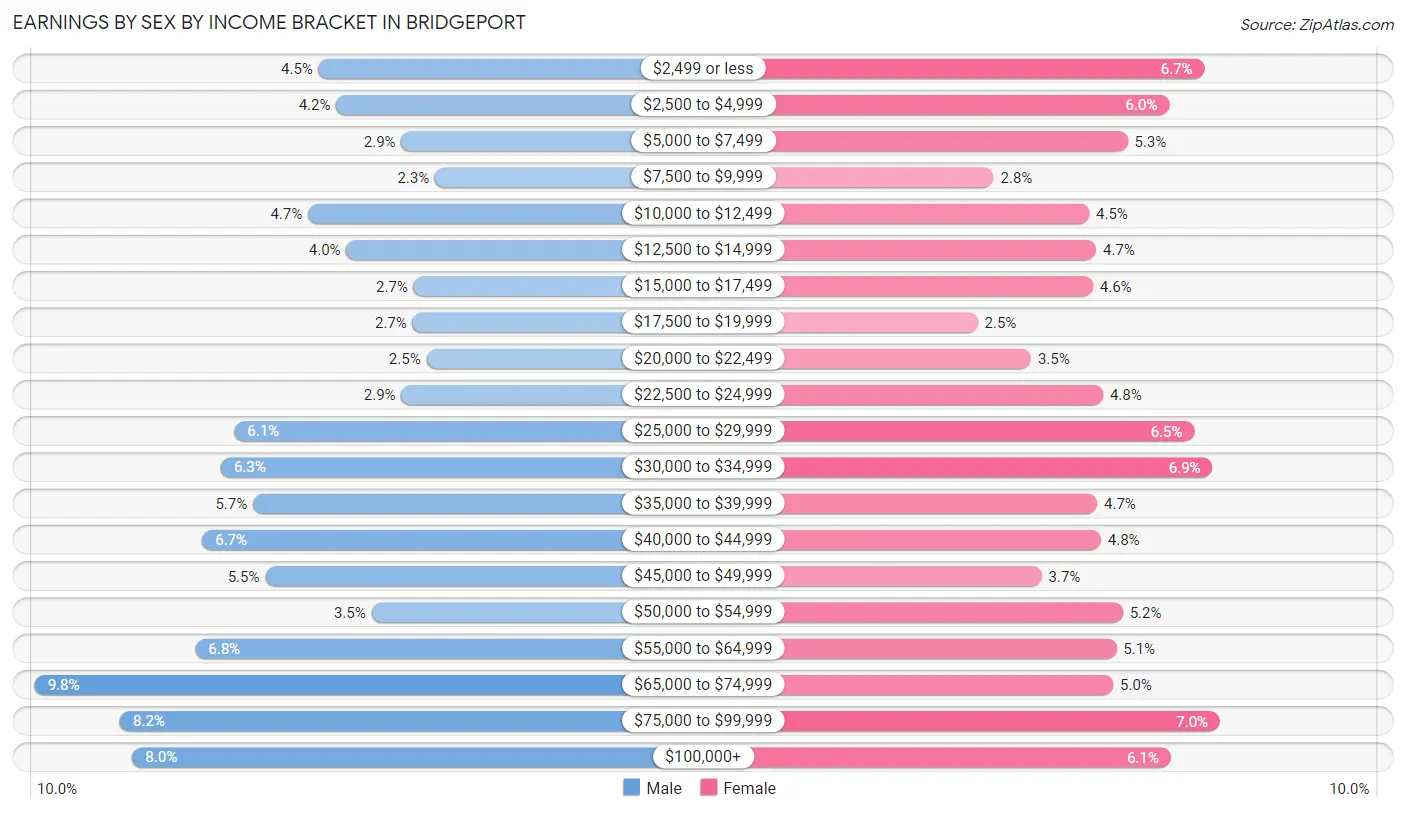
Earnings by Sex by Income Bracket in Bridgeport
The most common earnings brackets in Bridgeport are $65,000 to $74,999 for men (4,067 | 9.8%) and $75,000 to $99,999 for women (2,759 | 7.0%).
| Income | Male | Female |
| $2,499 or less | 1,861 (4.5%) | 2,645 (6.7%) |
| $2,500 to $4,999 | 1,725 (4.2%) | 2,383 (6.0%) |
| $5,000 to $7,499 | 1,220 (2.9%) | 2,076 (5.3%) |
| $7,500 to $9,999 | 958 (2.3%) | 1,087 (2.8%) |
| $10,000 to $12,499 | 1,942 (4.7%) | 1,791 (4.5%) |
| $12,500 to $14,999 | 1,645 (4.0%) | 1,842 (4.7%) |
| $15,000 to $17,499 | 1,124 (2.7%) | 1,820 (4.6%) |
| $17,500 to $19,999 | 1,132 (2.7%) | 968 (2.5%) |
| $20,000 to $22,499 | 1,024 (2.5%) | 1,361 (3.5%) |
| $22,500 to $24,999 | 1,220 (2.9%) | 1,894 (4.8%) |
| $25,000 to $29,999 | 2,515 (6.1%) | 2,569 (6.5%) |
| $30,000 to $34,999 | 2,617 (6.3%) | 2,702 (6.9%) |
| $35,000 to $39,999 | 2,370 (5.7%) | 1,851 (4.7%) |
| $40,000 to $44,999 | 2,764 (6.7%) | 1,877 (4.8%) |
| $45,000 to $49,999 | 2,277 (5.5%) | 1,441 (3.6%) |
| $50,000 to $54,999 | 1,450 (3.5%) | 2,041 (5.2%) |
| $55,000 to $64,999 | 2,819 (6.8%) | 1,994 (5.1%) |
| $65,000 to $74,999 | 4,067 (9.8%) | 1,968 (5.0%) |
| $75,000 to $99,999 | 3,402 (8.2%) | 2,759 (7.0%) |
| $100,000+ | 3,307 (8.0%) | 2,397 (6.1%) |
| Total | 41,439 (100.0%) | 39,466 (100.0%) |
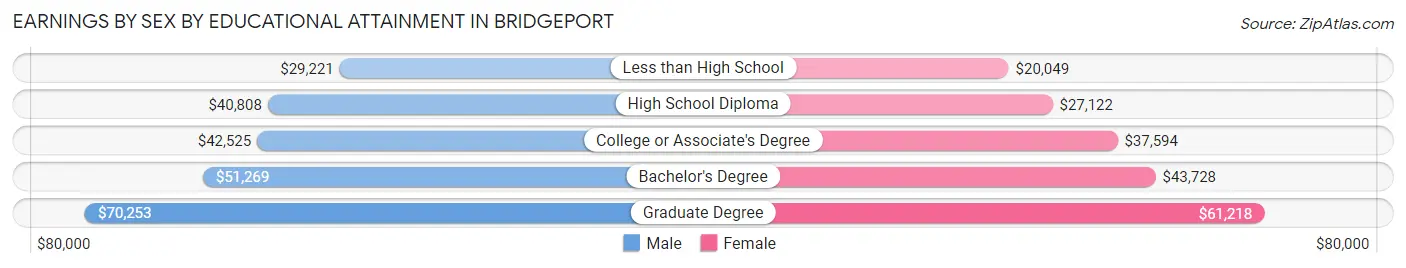
Earnings by Sex by Educational Attainment in Bridgeport
Average earnings in Bridgeport are $43,054 for men and $34,401 for women, a difference of 20.1%. Men with an educational attainment of graduate degree enjoy the highest average annual earnings of $70,253, while those with less than high school education earn the least with $29,221. Women with an educational attainment of graduate degree earn the most with the average annual earnings of $61,218, while those with less than high school education have the smallest earnings of $20,049.
| Educational Attainment | Male Income | Female Income |
| Less than High School | $29,221 | $20,049 |
| High School Diploma | $40,808 | $27,122 |
| College or Associate's Degree | $42,525 | $37,594 |
| Bachelor's Degree | $51,269 | $43,728 |
| Graduate Degree | $70,253 | $61,218 |
| Total | $43,054 | $34,401 |
Family Income in Bridgeport
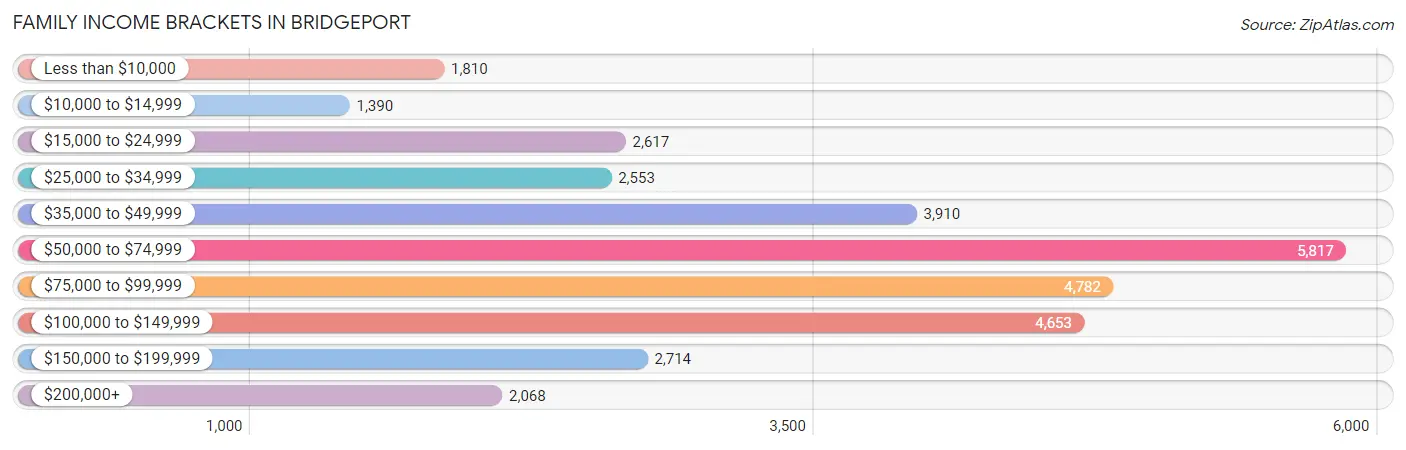
Family Income Brackets in Bridgeport
According to the Bridgeport family income data, there are 5,817 families falling into the $50,000 to $74,999 income range, which is the most common income bracket and makes up 18.0% of all families. Conversely, the $10,000 to $14,999 income bracket is the least frequent group with only 1,390 families (4.3%) belonging to this category.
| Income Bracket | # Families | % Families |
| Less than $10,000 | 1,810 | 5.6% |
| $10,000 to $14,999 | 1,390 | 4.3% |
| $15,000 to $24,999 | 2,617 | 8.1% |
| $25,000 to $34,999 | 2,553 | 7.9% |
| $35,000 to $49,999 | 3,910 | 12.1% |
| $50,000 to $74,999 | 5,817 | 18.0% |
| $75,000 to $99,999 | 4,782 | 14.8% |
| $100,000 to $149,999 | 4,653 | 14.4% |
| $150,000 to $199,999 | 2,714 | 8.4% |
| $200,000+ | 2,068 | 6.4% |
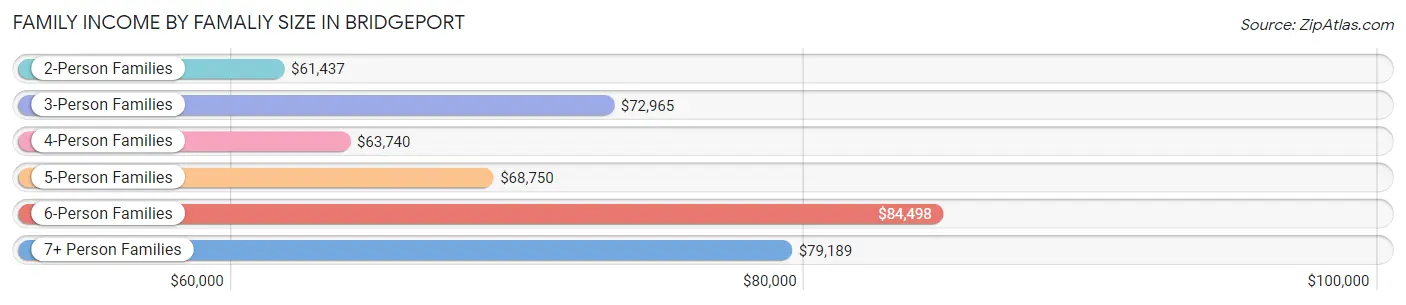
Family Income by Famaliy Size in Bridgeport
6-person families (1,207 | 3.7%) account for the highest median family income in Bridgeport with $84,498 per family, while 2-person families (13,042 | 40.4%) have the highest median income of $30,718 per family member.
| Income Bracket | # Families | Median Income |
| 2-Person Families | 13,042 (40.4%) | $61,437 |
| 3-Person Families | 8,604 (26.6%) | $72,965 |
| 4-Person Families | 5,653 (17.5%) | $63,740 |
| 5-Person Families | 3,168 (9.8%) | $68,750 |
| 6-Person Families | 1,207 (3.7%) | $84,498 |
| 7+ Person Families | 640 (2.0%) | $79,189 |
| Total | 32,314 (100.0%) | $66,944 |
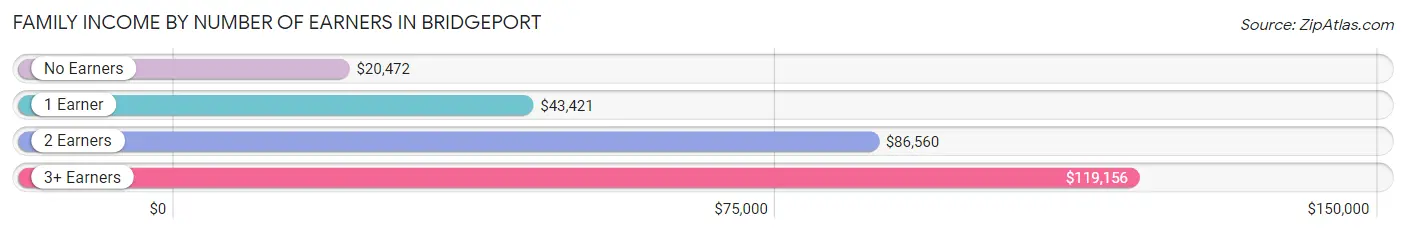
Family Income by Number of Earners in Bridgeport
The median family income in Bridgeport is $66,944, with families comprising 3+ earners (4,979) having the highest median family income of $119,156, while families with no earners (3,727) have the lowest median family income of $20,472, accounting for 15.4% and 11.5% of families, respectively.
| Number of Earners | # Families | Median Income |
| No Earners | 3,727 (11.5%) | $20,472 |
| 1 Earner | 10,729 (33.2%) | $43,421 |
| 2 Earners | 12,879 (39.9%) | $86,560 |
| 3+ Earners | 4,979 (15.4%) | $119,156 |
| Total | 32,314 (100.0%) | $66,944 |
Household Income in Bridgeport
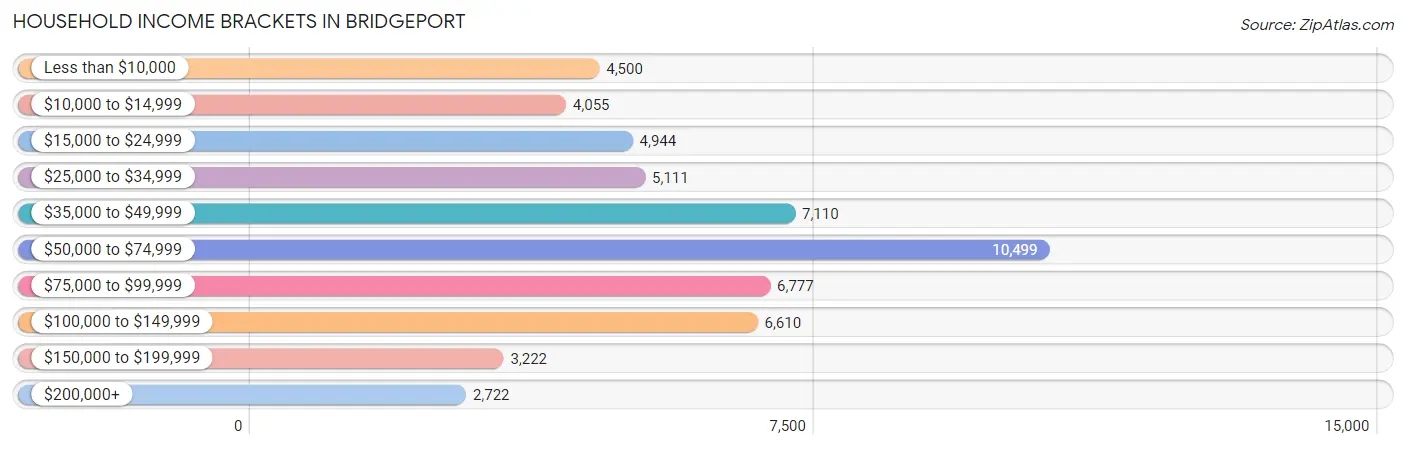
Household Income Brackets in Bridgeport
With 10,499 households falling in the category, the $50,000 to $74,999 income range is the most frequent in Bridgeport, accounting for 18.9% of all households. In contrast, only 2,722 households (4.9%) fall into the $200,000+ income bracket, making it the least populous group.
| Income Bracket | # Households | % Households |
| Less than $10,000 | 4,500 | 8.1% |
| $10,000 to $14,999 | 4,055 | 7.3% |
| $15,000 to $24,999 | 4,944 | 8.9% |
| $25,000 to $34,999 | 5,111 | 9.2% |
| $35,000 to $49,999 | 7,110 | 12.8% |
| $50,000 to $74,999 | 10,499 | 18.9% |
| $75,000 to $99,999 | 6,777 | 12.2% |
| $100,000 to $149,999 | 6,610 | 11.9% |
| $150,000 to $199,999 | 3,222 | 5.8% |
| $200,000+ | 2,722 | 4.9% |
Household Income by Householder Age in Bridgeport
The median household income in Bridgeport is $54,440, with the highest median household income of $61,411 found in the 45 to 64 years age bracket for the primary householder. A total of 21,743 households (39.1%) fall into this category. Meanwhile, the 15 to 24 years age bracket for the primary householder has the lowest median household income of $33,494, with 1,796 households (3.2%) in this group.
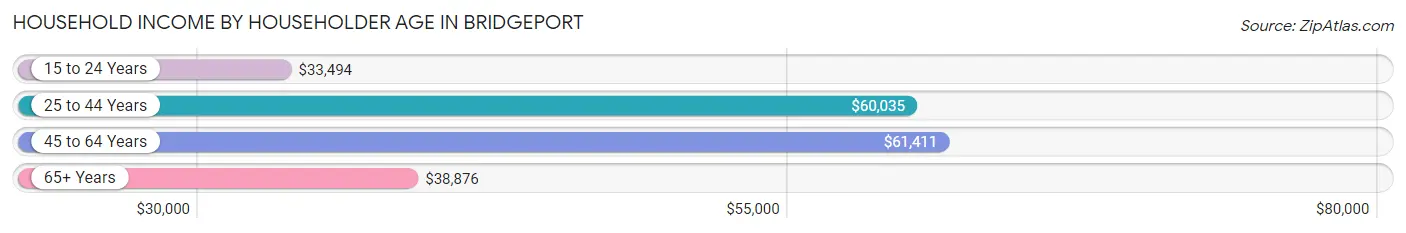
| Income Bracket | # Households | Median Income |
| 15 to 24 Years | 1,796 (3.2%) | $33,494 |
| 25 to 44 Years | 18,679 (33.6%) | $60,035 |
| 45 to 64 Years | 21,743 (39.1%) | $61,411 |
| 65+ Years | 13,332 (24.0%) | $38,876 |
| Total | 55,550 (100.0%) | $54,440 |
Poverty in Bridgeport
Income Below Poverty by Sex and Age in Bridgeport
With 20.4% poverty level for males and 25.2% for females among the residents of Bridgeport, 5 year old males and 18 to 24 year old females are the most vulnerable to poverty, with 490 males (56.6%) and 2,949 females (39.8%) in their respective age groups living below the poverty level.
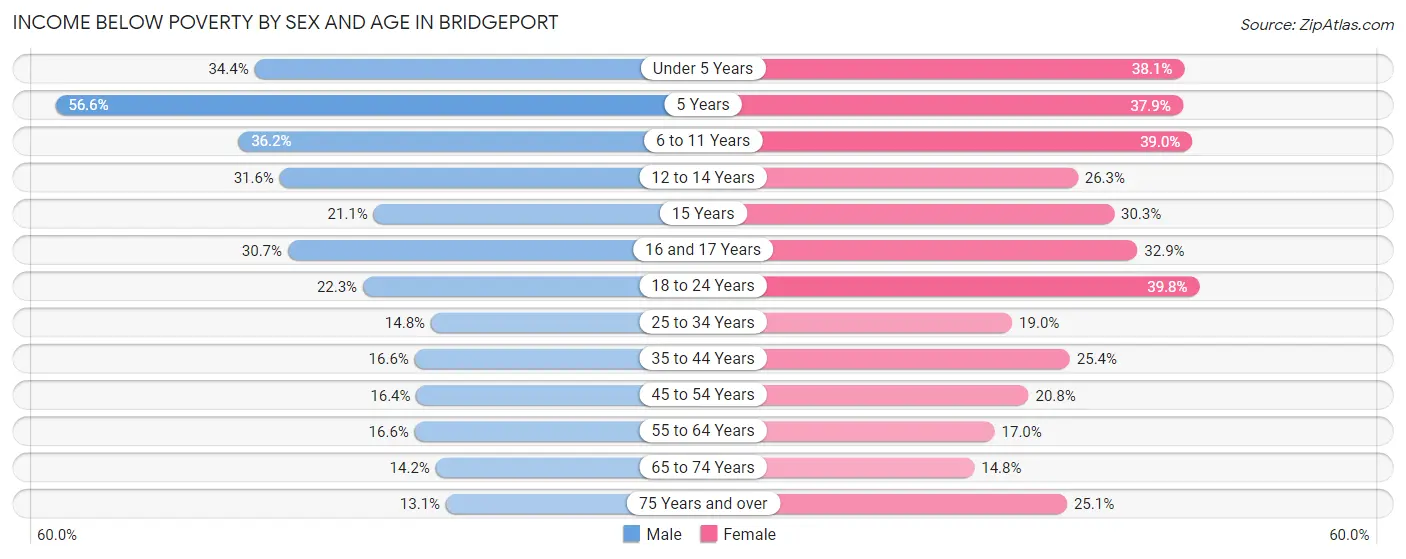
| Age Bracket | Male | Female |
| Under 5 Years | 1,388 (34.4%) | 1,615 (38.1%) |
| 5 Years | 490 (56.6%) | 236 (37.9%) |
| 6 to 11 Years | 1,810 (36.2%) | 1,928 (39.0%) |
| 12 to 14 Years | 857 (31.6%) | 740 (26.3%) |
| 15 Years | 191 (21.1%) | 299 (30.3%) |
| 16 and 17 Years | 583 (30.7%) | 500 (32.9%) |
| 18 to 24 Years | 1,563 (22.3%) | 2,949 (39.8%) |
| 25 to 34 Years | 1,538 (14.7%) | 2,109 (19.0%) |
| 35 to 44 Years | 1,726 (16.6%) | 2,565 (25.4%) |
| 45 to 54 Years | 1,515 (16.4%) | 1,952 (20.8%) |
| 55 to 64 Years | 1,529 (16.6%) | 1,728 (17.0%) |
| 65 to 74 Years | 768 (14.2%) | 902 (14.8%) |
| 75 Years and over | 417 (13.1%) | 1,237 (25.1%) |
| Total | 14,375 (20.4%) | 18,760 (25.2%) |
Income Above Poverty by Sex and Age in Bridgeport
According to the poverty statistics in Bridgeport, males aged 75 years and over and females aged 65 to 74 years are the age groups that are most secure financially, with 86.9% of males and 85.2% of females in these age groups living above the poverty line.
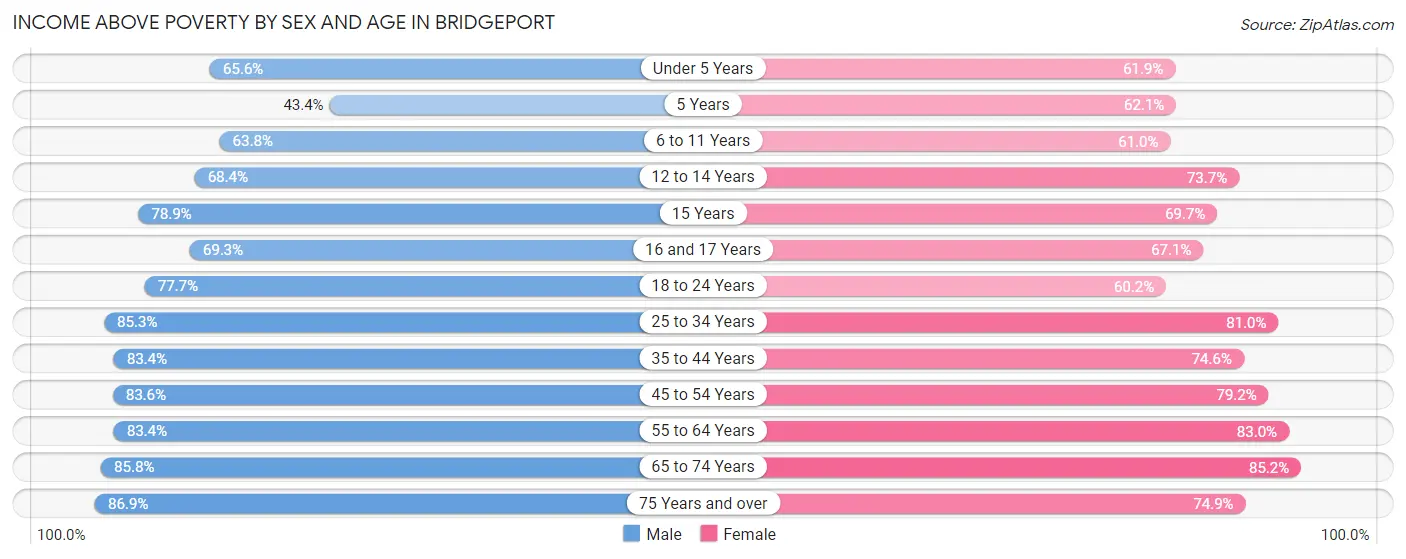
| Age Bracket | Male | Female |
| Under 5 Years | 2,647 (65.6%) | 2,622 (61.9%) |
| 5 Years | 376 (43.4%) | 386 (62.1%) |
| 6 to 11 Years | 3,188 (63.8%) | 3,013 (61.0%) |
| 12 to 14 Years | 1,856 (68.4%) | 2,076 (73.7%) |
| 15 Years | 713 (78.9%) | 687 (69.7%) |
| 16 and 17 Years | 1,317 (69.3%) | 1,019 (67.1%) |
| 18 to 24 Years | 5,439 (77.7%) | 4,457 (60.2%) |
| 25 to 34 Years | 8,892 (85.3%) | 9,009 (81.0%) |
| 35 to 44 Years | 8,699 (83.4%) | 7,534 (74.6%) |
| 45 to 54 Years | 7,737 (83.6%) | 7,434 (79.2%) |
| 55 to 64 Years | 7,702 (83.4%) | 8,423 (83.0%) |
| 65 to 74 Years | 4,634 (85.8%) | 5,211 (85.2%) |
| 75 Years and over | 2,772 (86.9%) | 3,695 (74.9%) |
| Total | 55,972 (79.6%) | 55,566 (74.8%) |
Income Below Poverty Among Married-Couple Families in Bridgeport
The poverty statistics for married-couple families in Bridgeport show that 9.5% or 1,772 of the total 18,636 families live below the poverty line. Families with 5 or more children have the highest poverty rate of 67.4%, comprising of 64 families. On the other hand, families with no children have the lowest poverty rate of 6.5%, which includes 687 families.
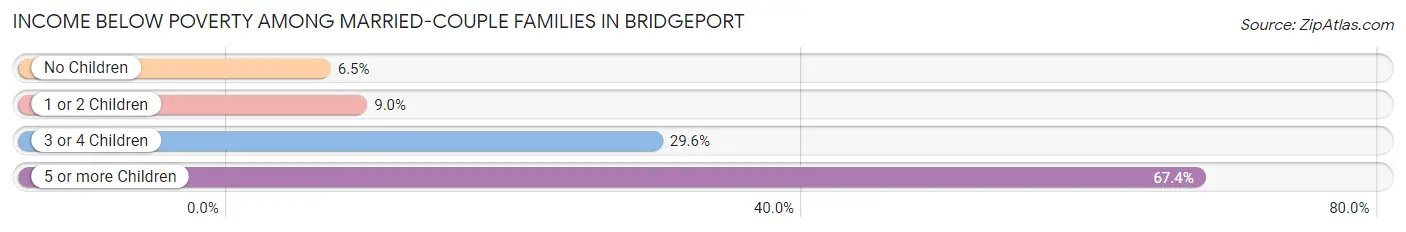
| Children | Above Poverty | Below Poverty |
| No Children | 9,941 (93.5%) | 687 (6.5%) |
| 1 or 2 Children | 5,835 (91.0%) | 577 (9.0%) |
| 3 or 4 Children | 1,057 (70.4%) | 444 (29.6%) |
| 5 or more Children | 31 (32.6%) | 64 (67.4%) |
| Total | 16,864 (90.5%) | 1,772 (9.5%) |
Income Below Poverty Among Single-Parent Households in Bridgeport
According to the poverty data in Bridgeport, 22.2% or 907 single-father households and 34.4% or 3,303 single-mother households are living below the poverty line. Among single-father households, those with 3 or 4 children have the highest poverty rate, with 196 households (43.8%) experiencing poverty. Likewise, among single-mother households, those with 5 or more children have the highest poverty rate, with 58 households (86.6%) falling below the poverty line.
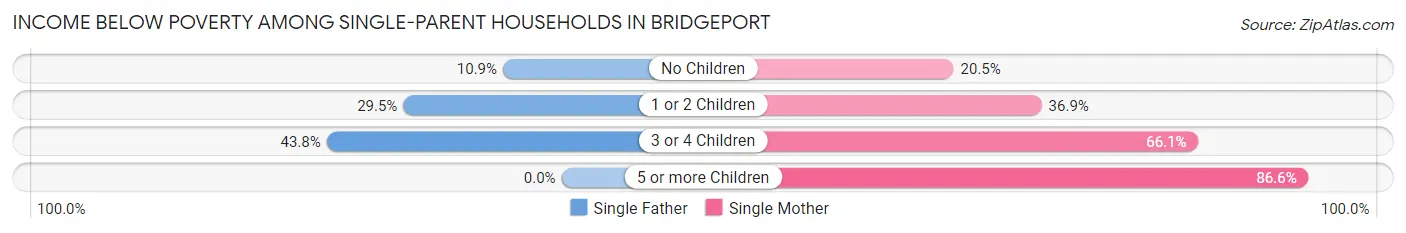
| Children | Single Father | Single Mother |
| No Children | 213 (10.9%) | 781 (20.5%) |
| 1 or 2 Children | 498 (29.5%) | 1,652 (36.9%) |
| 3 or 4 Children | 196 (43.8%) | 812 (66.1%) |
| 5 or more Children | 0 (0.0%) | 58 (86.6%) |
| Total | 907 (22.2%) | 3,303 (34.4%) |
Income Below Poverty Among Married-Couple vs Single-Parent Households in Bridgeport
The poverty data for Bridgeport shows that 1,772 of the married-couple family households (9.5%) and 4,210 of the single-parent households (30.8%) are living below the poverty level. Within the married-couple family households, those with 5 or more children have the highest poverty rate, with 64 households (67.4%) falling below the poverty line. Among the single-parent households, those with 5 or more children have the highest poverty rate, with 58 household (86.6%) living below poverty.
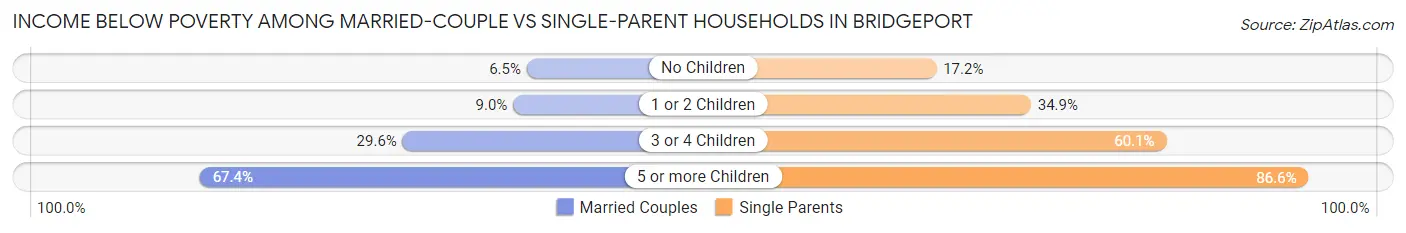
| Children | Married-Couple Families | Single-Parent Households |
| No Children | 687 (6.5%) | 994 (17.2%) |
| 1 or 2 Children | 577 (9.0%) | 2,150 (34.8%) |
| 3 or 4 Children | 444 (29.6%) | 1,008 (60.1%) |
| 5 or more Children | 64 (67.4%) | 58 (86.6%) |
| Total | 1,772 (9.5%) | 4,210 (30.8%) |
Race in Bridgeport
The most populous races in Bridgeport are White / Caucasian (64,121 | 43.2%), Hispanic or Latino (53,790 | 36.2%), and Black / African American (32,196 | 21.7%).
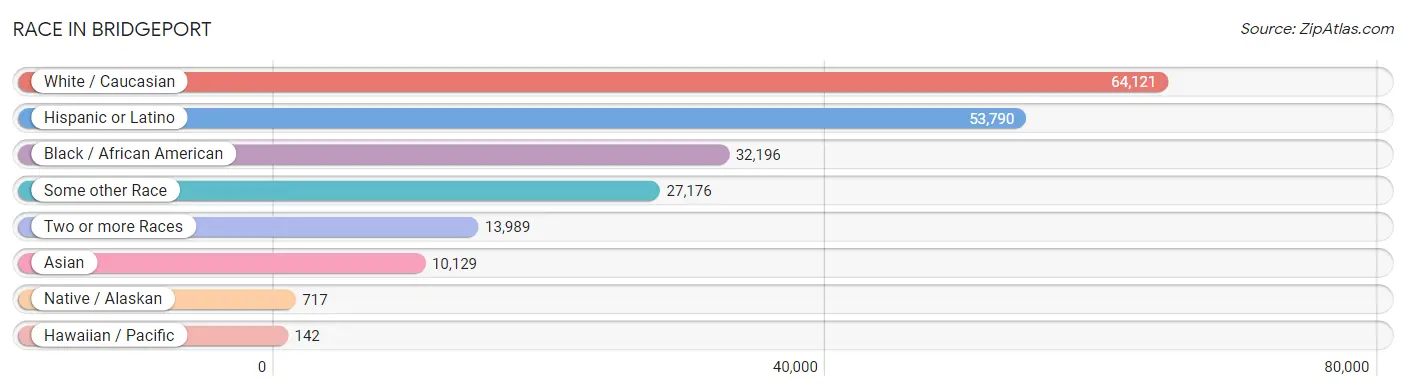
| Race | # Population | % Population |
| Asian | 10,129 | 6.8% |
| Black / African American | 32,196 | 21.7% |
| Hawaiian / Pacific | 142 | 0.1% |
| Hispanic or Latino | 53,790 | 36.2% |
| Native / Alaskan | 717 | 0.5% |
| White / Caucasian | 64,121 | 43.2% |
| Two or more Races | 13,989 | 9.4% |
| Some other Race | 27,176 | 18.3% |
| Total | 148,470 | 100.0% |
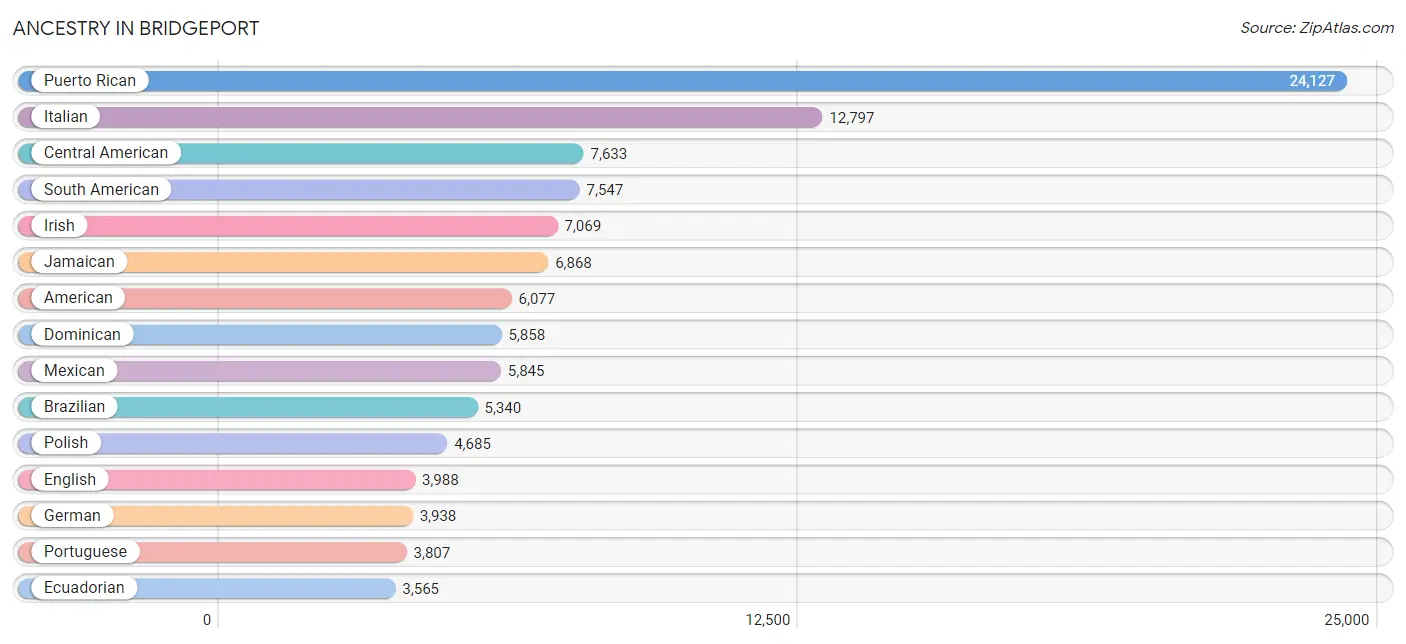
Ancestry in Bridgeport
The most populous ancestries reported in Bridgeport are Puerto Rican (24,127 | 16.3%), Italian (12,797 | 8.6%), Central American (7,633 | 5.1%), South American (7,547 | 5.1%), and Irish (7,069 | 4.8%), together accounting for 39.9% of all Bridgeport residents.
| Ancestry | # Population | % Population |
| Afghan | 197 | 0.1% |
| African | 885 | 0.6% |
| Albanian | 130 | 0.1% |
| American | 6,077 | 4.1% |
| Apache | 15 | 0.0% |
| Arab | 1,182 | 0.8% |
| Argentinean | 62 | 0.0% |
| Armenian | 107 | 0.1% |
| Austrian | 239 | 0.2% |
| Bahamian | 101 | 0.1% |
| Barbadian | 148 | 0.1% |
| Basque | 22 | 0.0% |
| Belgian | 41 | 0.0% |
| Belizean | 182 | 0.1% |
| Bermudan | 1 | 0.0% |
| Bhutanese | 117 | 0.1% |
| Blackfeet | 23 | 0.0% |
| Brazilian | 5,340 | 3.6% |
| British | 315 | 0.2% |
| British West Indian | 283 | 0.2% |
| Burmese | 89 | 0.1% |
| Cambodian | 115 | 0.1% |
| Canadian | 108 | 0.1% |
| Cape Verdean | 506 | 0.3% |
| Central American | 7,633 | 5.1% |
| Central American Indian | 154 | 0.1% |
| Cherokee | 170 | 0.1% |
| Chilean | 212 | 0.1% |
| Choctaw | 6 | 0.0% |
| Colombian | 2,234 | 1.5% |
| Costa Rican | 559 | 0.4% |
| Creek | 6 | 0.0% |
| Croatian | 133 | 0.1% |
| Cuban | 1,400 | 0.9% |
| Czech | 216 | 0.2% |
| Czechoslovakian | 141 | 0.1% |
| Danish | 158 | 0.1% |
| Dominican | 5,858 | 4.0% |
| Dutch | 420 | 0.3% |
| Eastern European | 393 | 0.3% |
| Ecuadorian | 3,565 | 2.4% |
| Egyptian | 32 | 0.0% |
| English | 3,988 | 2.7% |
| Ethiopian | 32 | 0.0% |
| European | 767 | 0.5% |
| French | 1,422 | 1.0% |
| French Canadian | 775 | 0.5% |
| German | 3,938 | 2.6% |
| Ghanaian | 234 | 0.2% |
| Greek | 1,748 | 1.2% |
| Guamanian / Chamorro | 7 | 0.0% |
| Guatemalan | 1,956 | 1.3% |
| Guyanese | 162 | 0.1% |
| Haitian | 2,649 | 1.8% |
| Honduran | 1,733 | 1.2% |
| Hungarian | 1,173 | 0.8% |
| Indian (Asian) | 1,281 | 0.9% |
| Irish | 7,069 | 4.8% |
| Israeli | 24 | 0.0% |
| Italian | 12,797 | 8.6% |
| Jamaican | 6,868 | 4.6% |
| Japanese | 932 | 0.6% |
| Jordanian | 17 | 0.0% |
| Kenyan | 34 | 0.0% |
| Korean | 1,366 | 0.9% |
| Laotian | 116 | 0.1% |
| Latvian | 45 | 0.0% |
| Lebanese | 371 | 0.3% |
| Liberian | 44 | 0.0% |
| Lithuanian | 374 | 0.3% |
| Macedonian | 1 | 0.0% |
| Malaysian | 981 | 0.7% |
| Maltese | 29 | 0.0% |
| Mexican | 5,845 | 3.9% |
| Mexican American Indian | 276 | 0.2% |
| Mongolian | 76 | 0.1% |
| Moroccan | 37 | 0.0% |
| Native Hawaiian | 65 | 0.0% |
| Navajo | 52 | 0.0% |
| Nicaraguan | 679 | 0.5% |
| Nigerian | 228 | 0.2% |
| Northern European | 46 | 0.0% |
| Norwegian | 316 | 0.2% |
| Pakistani | 118 | 0.1% |
| Palestinian | 8 | 0.0% |
| Panamanian | 214 | 0.1% |
| Paraguayan | 7 | 0.0% |
| Peruvian | 1,130 | 0.8% |
| Polish | 4,685 | 3.2% |
| Portuguese | 3,807 | 2.6% |
| Puerto Rican | 24,127 | 16.3% |
| Romanian | 340 | 0.2% |
| Russian | 1,217 | 0.8% |
| Salvadoran | 2,345 | 1.6% |
| Samoan | 117 | 0.1% |
| Scotch-Irish | 87 | 0.1% |
| Scottish | 520 | 0.4% |
| Serbian | 28 | 0.0% |
| Sierra Leonean | 9 | 0.0% |
| Slavic | 104 | 0.1% |
| Slovak | 936 | 0.6% |
| Slovene | 6 | 0.0% |
| South American | 7,547 | 5.1% |
| South American Indian | 106 | 0.1% |
| Spaniard | 263 | 0.2% |
| Spanish | 249 | 0.2% |
| Sri Lankan | 1,597 | 1.1% |
| Subsaharan African | 2,493 | 1.7% |
| Swedish | 592 | 0.4% |
| Swiss | 37 | 0.0% |
| Syrian | 128 | 0.1% |
| Thai | 1,862 | 1.3% |
| Trinidadian and Tobagonian | 146 | 0.1% |
| Turkish | 120 | 0.1% |
| U.S. Virgin Islander | 69 | 0.1% |
| Ukrainian | 800 | 0.5% |
| Uruguayan | 139 | 0.1% |
| Venezuelan | 140 | 0.1% |
| Vietnamese | 465 | 0.3% |
| Welsh | 167 | 0.1% |
| West Indian | 398 | 0.3% |
| Yugoslavian | 68 | 0.1% |
| Zimbabwean | 52 | 0.0% | View All 123 Rows |
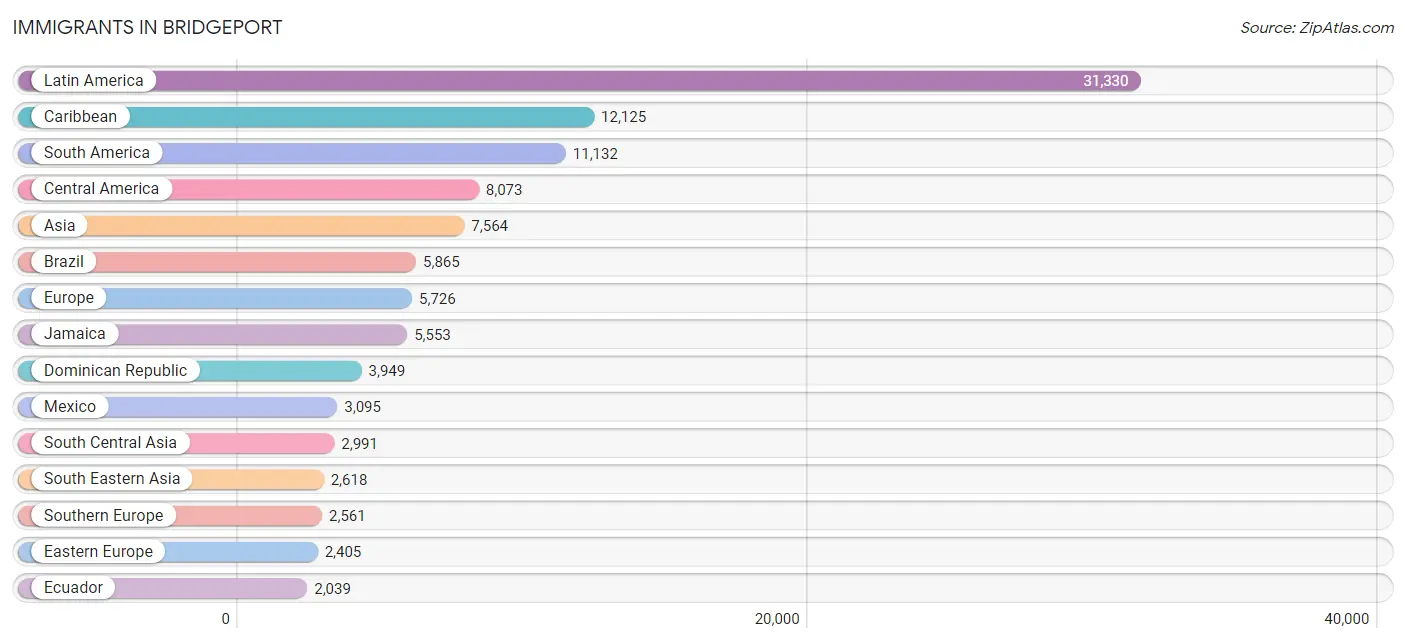
Immigrants in Bridgeport
The most numerous immigrant groups reported in Bridgeport came from Latin America (31,330 | 21.1%), Caribbean (12,125 | 8.2%), South America (11,132 | 7.5%), Central America (8,073 | 5.4%), and Asia (7,564 | 5.1%), together accounting for 47.3% of all Bridgeport residents.
| Immigration Origin | # Population | % Population |
| Afghanistan | 154 | 0.1% |
| Africa | 1,864 | 1.3% |
| Albania | 95 | 0.1% |
| Argentina | 100 | 0.1% |
| Asia | 7,564 | 5.1% |
| Austria | 39 | 0.0% |
| Bahamas | 61 | 0.0% |
| Bangladesh | 693 | 0.5% |
| Barbados | 99 | 0.1% |
| Belize | 92 | 0.1% |
| Brazil | 5,865 | 4.0% |
| Cabo Verde | 350 | 0.2% |
| Cambodia | 27 | 0.0% |
| Cameroon | 53 | 0.0% |
| Canada | 178 | 0.1% |
| Caribbean | 12,125 | 8.2% |
| Central America | 8,073 | 5.4% |
| Chile | 195 | 0.1% |
| China | 842 | 0.6% |
| Colombia | 1,671 | 1.1% |
| Congo | 10 | 0.0% |
| Costa Rica | 524 | 0.4% |
| Croatia | 29 | 0.0% |
| Cuba | 310 | 0.2% |
| Czechoslovakia | 266 | 0.2% |
| Denmark | 57 | 0.0% |
| Dominica | 79 | 0.1% |
| Dominican Republic | 3,949 | 2.7% |
| Eastern Africa | 189 | 0.1% |
| Eastern Asia | 1,112 | 0.7% |
| Eastern Europe | 2,405 | 1.6% |
| Ecuador | 2,039 | 1.4% |
| Egypt | 44 | 0.0% |
| El Salvador | 1,368 | 0.9% |
| England | 170 | 0.1% |
| Ethiopia | 29 | 0.0% |
| Europe | 5,726 | 3.9% |
| France | 59 | 0.0% |
| Germany | 270 | 0.2% |
| Ghana | 182 | 0.1% |
| Greece | 573 | 0.4% |
| Grenada | 25 | 0.0% |
| Guatemala | 1,136 | 0.8% |
| Guyana | 163 | 0.1% |
| Haiti | 1,707 | 1.1% |
| Honduras | 1,145 | 0.8% |
| Hungary | 44 | 0.0% |
| India | 1,014 | 0.7% |
| Indonesia | 115 | 0.1% |
| Iraq | 13 | 0.0% |
| Italy | 541 | 0.4% |
| Jamaica | 5,553 | 3.7% |
| Japan | 19 | 0.0% |
| Jordan | 90 | 0.1% |
| Kenya | 34 | 0.0% |
| Korea | 136 | 0.1% |
| Laos | 369 | 0.3% |
| Latin America | 31,330 | 21.1% |
| Latvia | 91 | 0.1% |
| Lebanon | 182 | 0.1% |
| Liberia | 86 | 0.1% |
| Lithuania | 278 | 0.2% |
| Malaysia | 16 | 0.0% |
| Mexico | 3,095 | 2.1% |
| Middle Africa | 403 | 0.3% |
| Morocco | 57 | 0.0% |
| Nepal | 171 | 0.1% |
| Netherlands | 59 | 0.0% |
| Nicaragua | 618 | 0.4% |
| Nigeria | 186 | 0.1% |
| Northern Africa | 153 | 0.1% |
| Northern Europe | 333 | 0.2% |
| Pakistan | 959 | 0.6% |
| Panama | 63 | 0.0% |
| Peru | 838 | 0.6% |
| Philippines | 714 | 0.5% |
| Poland | 634 | 0.4% |
| Portugal | 1,374 | 0.9% |
| Romania | 240 | 0.2% |
| Russia | 481 | 0.3% |
| Saudi Arabia | 75 | 0.1% |
| Senegal | 4 | 0.0% |
| Sierra Leone | 22 | 0.0% |
| South America | 11,132 | 7.5% |
| South Central Asia | 2,991 | 2.0% |
| South Eastern Asia | 2,618 | 1.8% |
| Southern Europe | 2,561 | 1.7% |
| Spain | 73 | 0.1% |
| St. Vincent and the Grenadines | 17 | 0.0% |
| Sweden | 13 | 0.0% |
| Syria | 358 | 0.2% |
| Thailand | 202 | 0.1% |
| Trinidad and Tobago | 219 | 0.2% |
| Turkey | 75 | 0.1% |
| Uganda | 92 | 0.1% |
| Ukraine | 223 | 0.2% |
| Uruguay | 79 | 0.1% |
| Venezuela | 175 | 0.1% |
| Vietnam | 1,175 | 0.8% |
| West Indies | 9 | 0.0% |
| Western Africa | 880 | 0.6% |
| Western Asia | 843 | 0.6% |
| Western Europe | 427 | 0.3% |
| Zaire | 306 | 0.2% |
| Zimbabwe | 34 | 0.0% | View All 105 Rows |
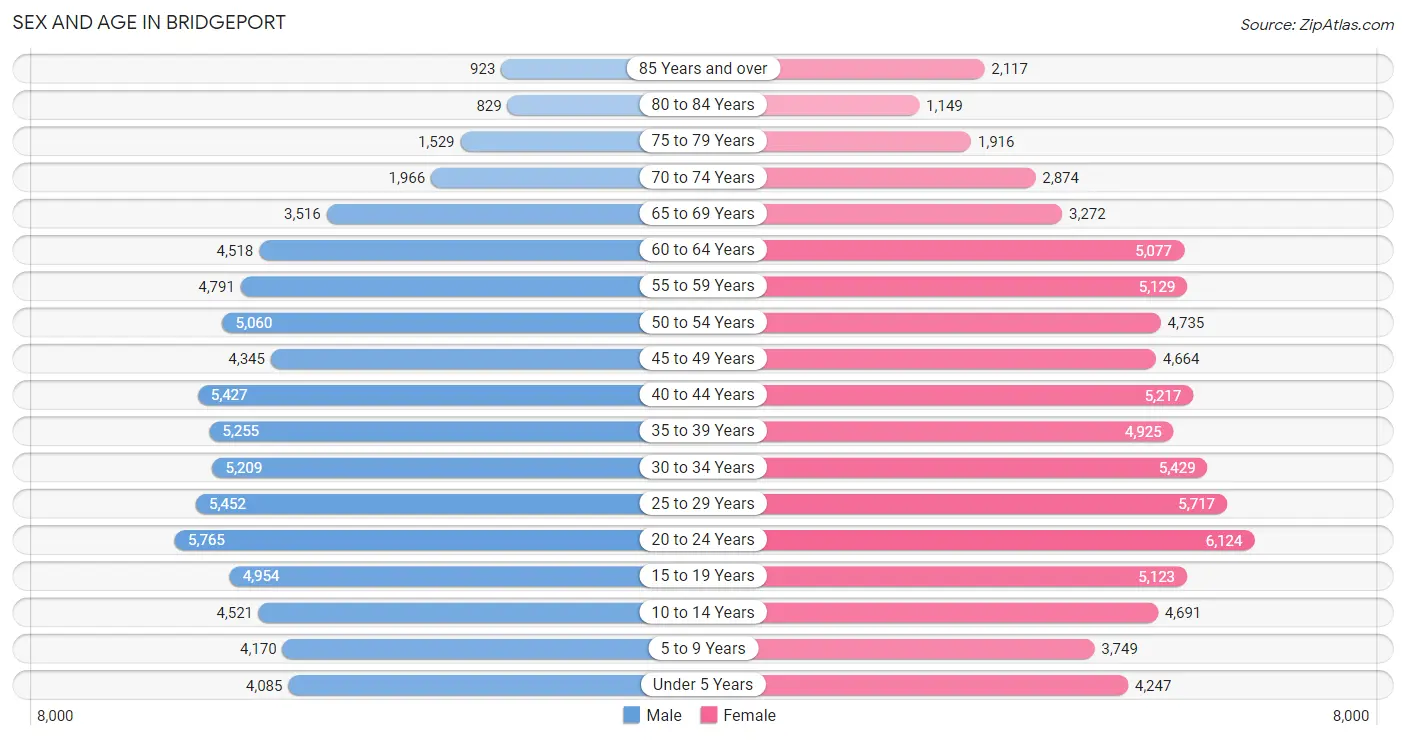
Sex and Age in Bridgeport
Sex and Age in Bridgeport
The most populous age groups in Bridgeport are 20 to 24 Years (5,765 | 8.0%) for men and 20 to 24 Years (6,124 | 8.0%) for women.
| Age Bracket | Male | Female |
| Under 5 Years | 4,085 (5.7%) | 4,247 (5.6%) |
| 5 to 9 Years | 4,170 (5.8%) | 3,749 (4.9%) |
| 10 to 14 Years | 4,521 (6.2%) | 4,691 (6.2%) |
| 15 to 19 Years | 4,954 (6.9%) | 5,123 (6.7%) |
| 20 to 24 Years | 5,765 (8.0%) | 6,124 (8.0%) |
| 25 to 29 Years | 5,452 (7.5%) | 5,717 (7.5%) |
| 30 to 34 Years | 5,209 (7.2%) | 5,429 (7.1%) |
| 35 to 39 Years | 5,255 (7.3%) | 4,925 (6.5%) |
| 40 to 44 Years | 5,427 (7.5%) | 5,217 (6.9%) |
| 45 to 49 Years | 4,345 (6.0%) | 4,664 (6.1%) |
| 50 to 54 Years | 5,060 (7.0%) | 4,735 (6.2%) |
| 55 to 59 Years | 4,791 (6.6%) | 5,129 (6.7%) |
| 60 to 64 Years | 4,518 (6.2%) | 5,077 (6.7%) |
| 65 to 69 Years | 3,516 (4.9%) | 3,272 (4.3%) |
| 70 to 74 Years | 1,966 (2.7%) | 2,874 (3.8%) |
| 75 to 79 Years | 1,529 (2.1%) | 1,916 (2.5%) |
| 80 to 84 Years | 829 (1.1%) | 1,149 (1.5%) |
| 85 Years and over | 923 (1.3%) | 2,117 (2.8%) |
| Total | 72,315 (100.0%) | 76,155 (100.0%) |
Families and Households in Bridgeport
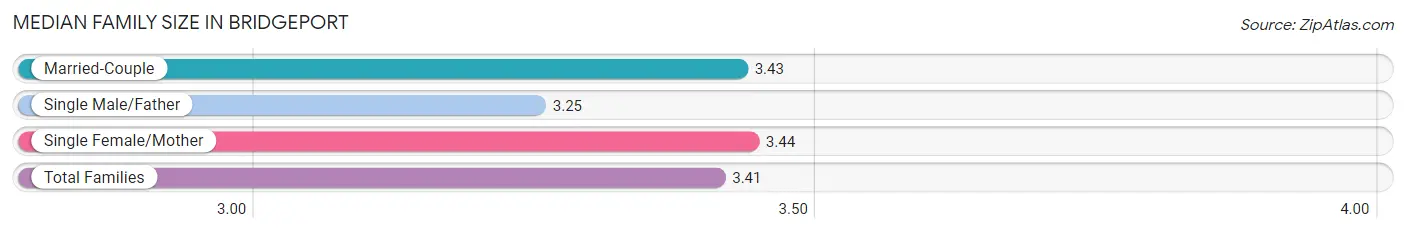
Median Family Size in Bridgeport
The median family size in Bridgeport is 3.41 persons per family, with single female/mother families (9,590 | 29.7%) accounting for the largest median family size of 3.44 persons per family. On the other hand, single male/father families (4,088 | 12.7%) represent the smallest median family size with 3.25 persons per family.
| Family Type | # Families | Family Size |
| Married-Couple | 18,636 (57.7%) | 3.43 |
| Single Male/Father | 4,088 (12.7%) | 3.25 |
| Single Female/Mother | 9,590 (29.7%) | 3.44 |
| Total Families | 32,314 (100.0%) | 3.41 |
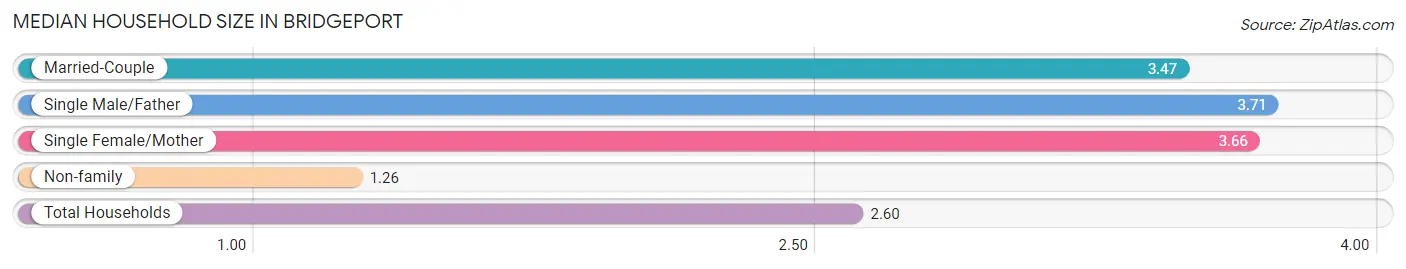
Median Household Size in Bridgeport
The median household size in Bridgeport is 2.60 persons per household, with single male/father households (4,088 | 7.4%) accounting for the largest median household size of 3.71 persons per household. non-family households (23,236 | 41.8%) represent the smallest median household size with 1.26 persons per household.
| Household Type | # Households | Household Size |
| Married-Couple | 18,636 (33.6%) | 3.47 |
| Single Male/Father | 4,088 (7.4%) | 3.71 |
| Single Female/Mother | 9,590 (17.3%) | 3.66 |
| Non-family | 23,236 (41.8%) | 1.26 |
| Total Households | 55,550 (100.0%) | 2.60 |
Household Size by Marriage Status in Bridgeport
Out of a total of 55,550 households in Bridgeport, 32,314 (58.2%) are family households, while 23,236 (41.8%) are nonfamily households. The most numerous type of family households are 2-person households, comprising 12,102, and the most common type of nonfamily households are 1-person households, comprising 19,740.
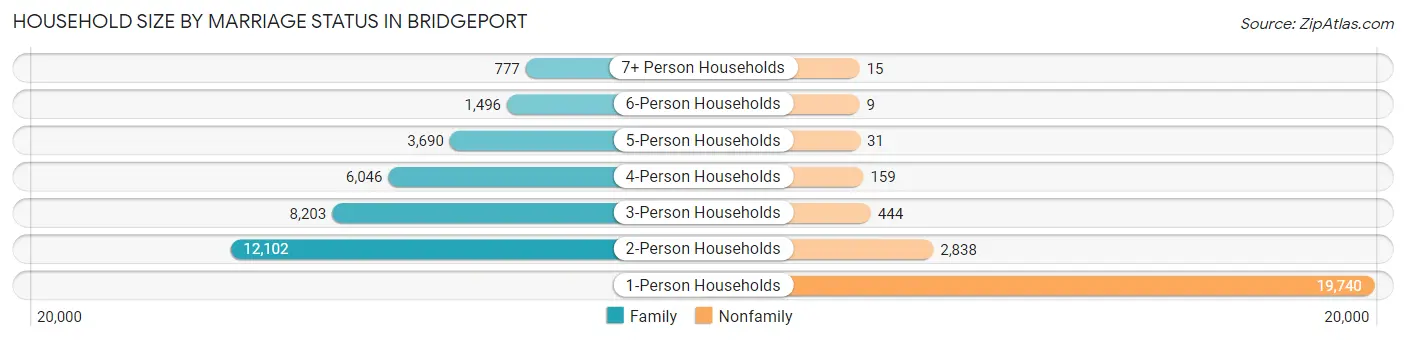
| Household Size | Family Households | Nonfamily Households |
| 1-Person Households | - | 19,740 (35.5%) |
| 2-Person Households | 12,102 (21.8%) | 2,838 (5.1%) |
| 3-Person Households | 8,203 (14.8%) | 444 (0.8%) |
| 4-Person Households | 6,046 (10.9%) | 159 (0.3%) |
| 5-Person Households | 3,690 (6.6%) | 31 (0.1%) |
| 6-Person Households | 1,496 (2.7%) | 9 (0.0%) |
| 7+ Person Households | 777 (1.4%) | 15 (0.0%) |
| Total | 32,314 (58.2%) | 23,236 (41.8%) |
Female Fertility in Bridgeport
Fertility by Age in Bridgeport
Average fertility rate in Bridgeport is 51.0 births per 1,000 women. Women in the age bracket of 20 to 34 years have the highest fertility rate with 80.0 births per 1,000 women. Women in the age bracket of 20 to 34 years acount for 70.4% of all women with births.
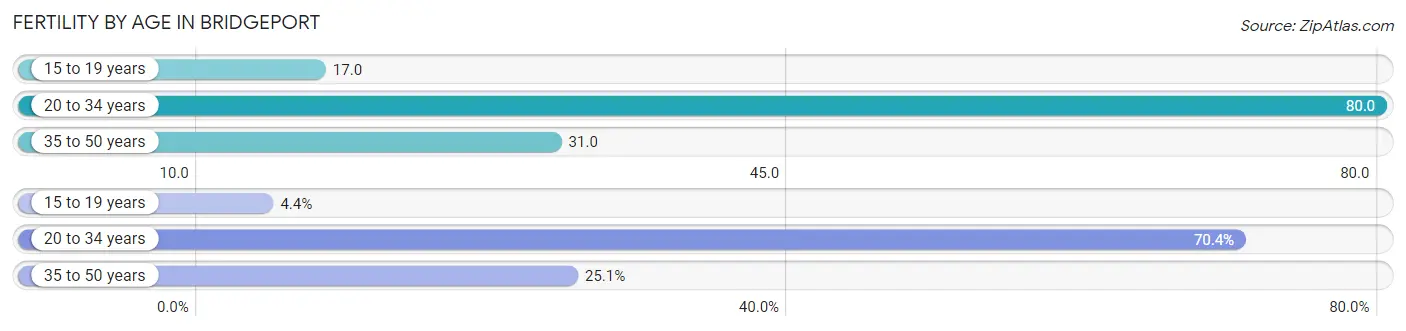
| Age Bracket | Women with Births | Births / 1,000 Women |
| 15 to 19 years | 87 (4.4%) | 17.0 |
| 20 to 34 years | 1,380 (70.4%) | 80.0 |
| 35 to 50 years | 492 (25.1%) | 31.0 |
| Total | 1,959 (100.0%) | 51.0 |
Fertility by Age by Marriage Status in Bridgeport
57.5% of women with births (1,959) in Bridgeport are married. The highest percentage of unmarried women with births falls into 15 to 19 years age bracket with 100.0% of them unmarried at the time of birth, while the lowest percentage of unmarried women with births belong to 35 to 50 years age bracket with 35.0% of them unmarried.
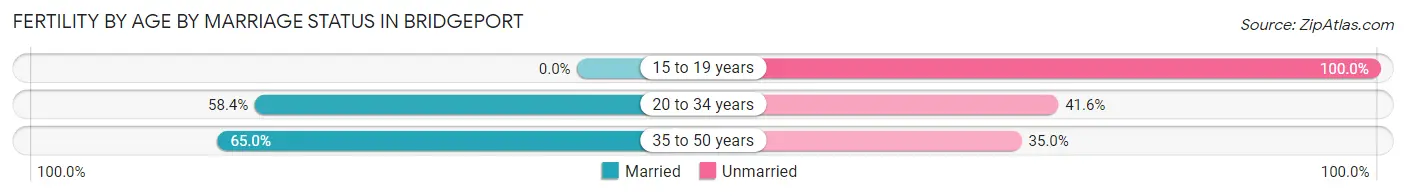
| Age Bracket | Married | Unmarried |
| 15 to 19 years | 0 (0.0%) | 87 (100.0%) |
| 20 to 34 years | 806 (58.4%) | 574 (41.6%) |
| 35 to 50 years | 320 (65.0%) | 172 (35.0%) |
| Total | 1,126 (57.5%) | 833 (42.5%) |
Fertility by Education in Bridgeport
Average fertility rate in Bridgeport is 51.0 births per 1,000 women. Women with the education attainment of bachelor's degree have the highest fertility rate of 84.0 births per 1,000 women, while women with the education attainment of high school diploma have the lowest fertility at 38.0 births per 1,000 women. Women with the education attainment of bachelor's degree represent 29.3% of all women with births.
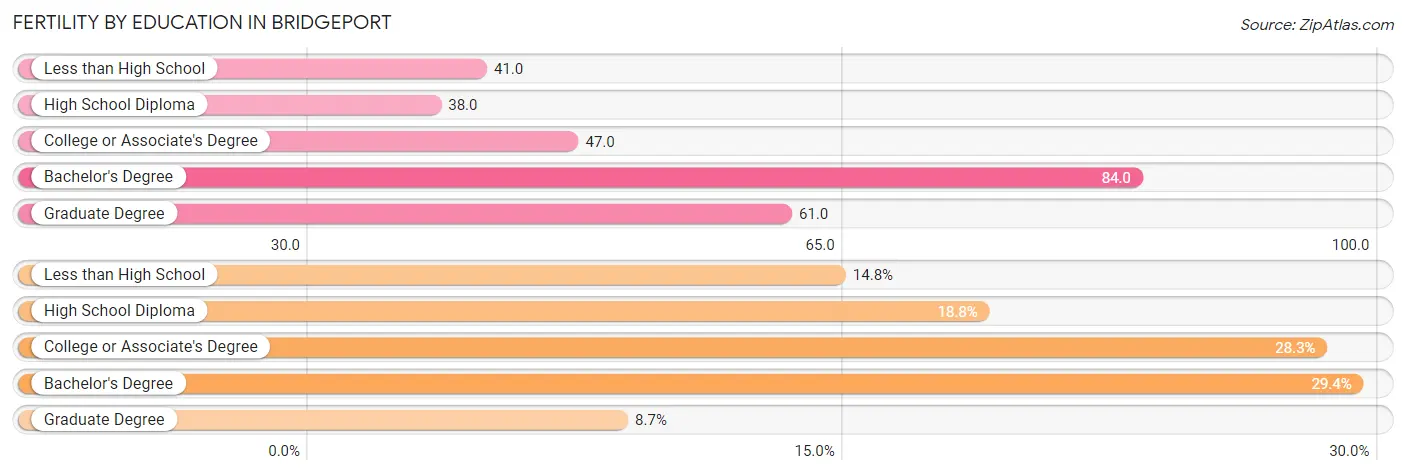
| Educational Attainment | Women with Births | Births / 1,000 Women |
| Less than High School | 290 (14.8%) | 41.0 |
| High School Diploma | 369 (18.8%) | 38.0 |
| College or Associate's Degree | 555 (28.3%) | 47.0 |
| Bachelor's Degree | 575 (29.3%) | 84.0 |
| Graduate Degree | 170 (8.7%) | 61.0 |
| Total | 1,959 (100.0%) | 51.0 |
Fertility by Education by Marriage Status in Bridgeport
42.5% of women with births in Bridgeport are unmarried. Women with the educational attainment of bachelor's degree are most likely to be married with 88.2% of them married at childbirth, while women with the educational attainment of high school diploma are least likely to be married with 70.7% of them unmarried at childbirth.
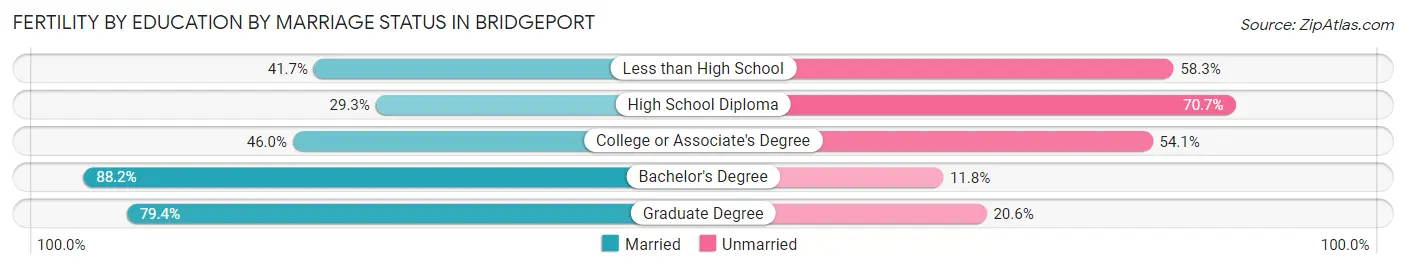
| Educational Attainment | Married | Unmarried |
| Less than High School | 121 (41.7%) | 169 (58.3%) |
| High School Diploma | 108 (29.3%) | 261 (70.7%) |
| College or Associate's Degree | 255 (46.0%) | 300 (54.0%) |
| Bachelor's Degree | 507 (88.2%) | 68 (11.8%) |
| Graduate Degree | 135 (79.4%) | 35 (20.6%) |
| Total | 1,126 (57.5%) | 833 (42.5%) |
Employment Characteristics in Bridgeport
Employment by Class of Employer in Bridgeport
Among the 70,303 employed individuals in Bridgeport, private company employees (49,174 | 70.0%), not-for-profit organizations (7,145 | 10.2%), and self-employed (not incorporated) (5,892 | 8.4%) make up the most common classes of employment.
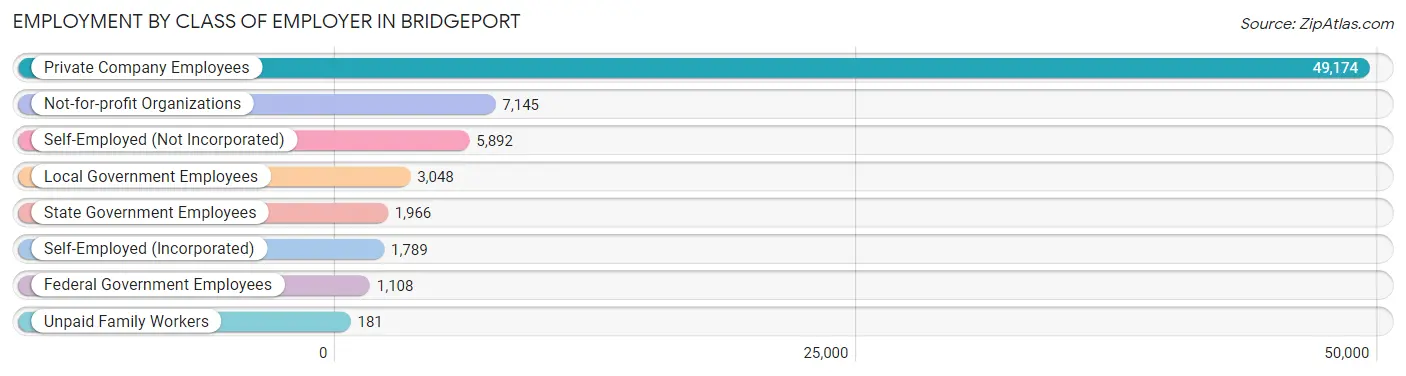
| Employer Class | # Employees | % Employees |
| Private Company Employees | 49,174 | 70.0% |
| Self-Employed (Incorporated) | 1,789 | 2.5% |
| Self-Employed (Not Incorporated) | 5,892 | 8.4% |
| Not-for-profit Organizations | 7,145 | 10.2% |
| Local Government Employees | 3,048 | 4.3% |
| State Government Employees | 1,966 | 2.8% |
| Federal Government Employees | 1,108 | 1.6% |
| Unpaid Family Workers | 181 | 0.3% |
| Total | 70,303 | 100.0% |
Employment Status by Age in Bridgeport
According to the labor force statistics for Bridgeport, out of the total population over 16 years of age (121,112), 65.9% or 79,813 individuals are in the labor force, with 9.5% or 7,582 of them unemployed. The age group with the highest labor force participation rate is 30 to 34 years, with 87.4% or 9,298 individuals in the labor force. Within the labor force, the 20 to 24 years age range has the highest percentage of unemployed individuals, with 14.3% or 1,239 of them being unemployed.
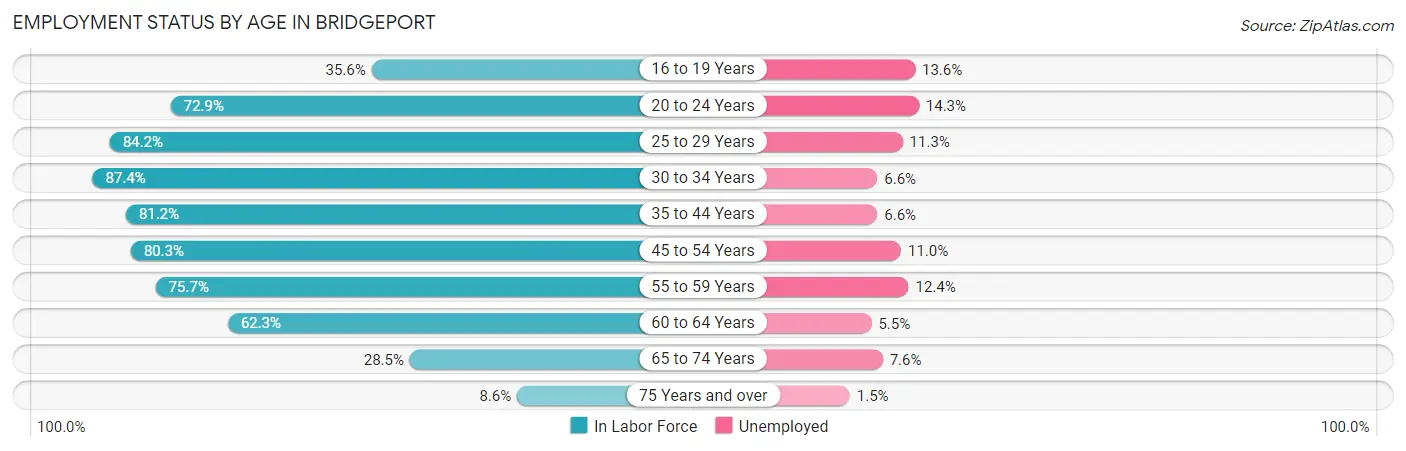
| Age Bracket | In Labor Force | Unemployed |
| 16 to 19 Years | 2,913 (35.6%) | 396 (13.6%) |
| 20 to 24 Years | 8,667 (72.9%) | 1,239 (14.3%) |
| 25 to 29 Years | 9,404 (84.2%) | 1,063 (11.3%) |
| 30 to 34 Years | 9,298 (87.4%) | 614 (6.6%) |
| 35 to 44 Years | 16,909 (81.2%) | 1,116 (6.6%) |
| 45 to 54 Years | 15,100 (80.3%) | 1,661 (11.0%) |
| 55 to 59 Years | 7,509 (75.7%) | 931 (12.4%) |
| 60 to 64 Years | 5,978 (62.3%) | 329 (5.5%) |
| 65 to 74 Years | 3,314 (28.5%) | 252 (7.6%) |
| 75 Years and over | 728 (8.6%) | 11 (1.5%) |
| Total | 79,813 (65.9%) | 7,582 (9.5%) |
Employment Status by Educational Attainment in Bridgeport
According to labor force statistics for Bridgeport, 79.3% of individuals (64,193) out of the total population between 25 and 64 years of age (80,950) are in the labor force, with 8.9% or 5,713 of them being unemployed. The group with the highest labor force participation rate are those with the educational attainment of bachelor's degree or higher, with 90.9% or 18,738 individuals in the labor force. Within the labor force, individuals with less than high school education have the highest percentage of unemployment, with 13.0% or 1,252 of them being unemployed.
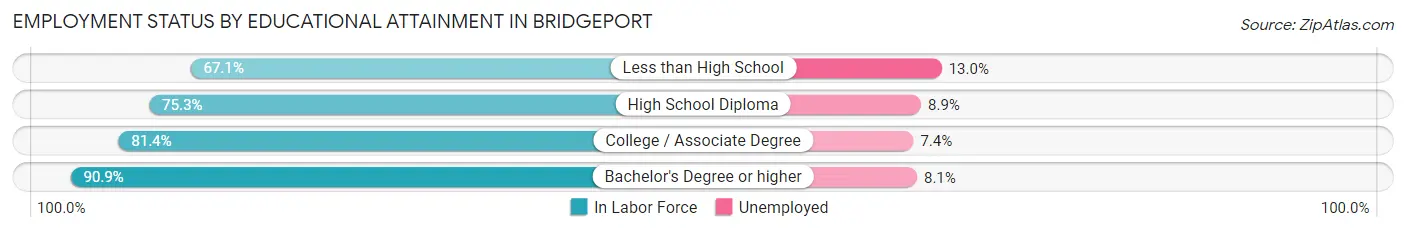
| Educational Attainment | In Labor Force | Unemployed |
| Less than High School | 9,630 (67.1%) | 1,866 (13.0%) |
| High School Diploma | 19,683 (75.3%) | 2,326 (8.9%) |
| College / Associate Degree | 16,154 (81.4%) | 1,469 (7.4%) |
| Bachelor's Degree or higher | 18,738 (90.9%) | 1,670 (8.1%) |
| Total | 64,193 (79.3%) | 7,205 (8.9%) |
Employment Occupations by Sex in Bridgeport
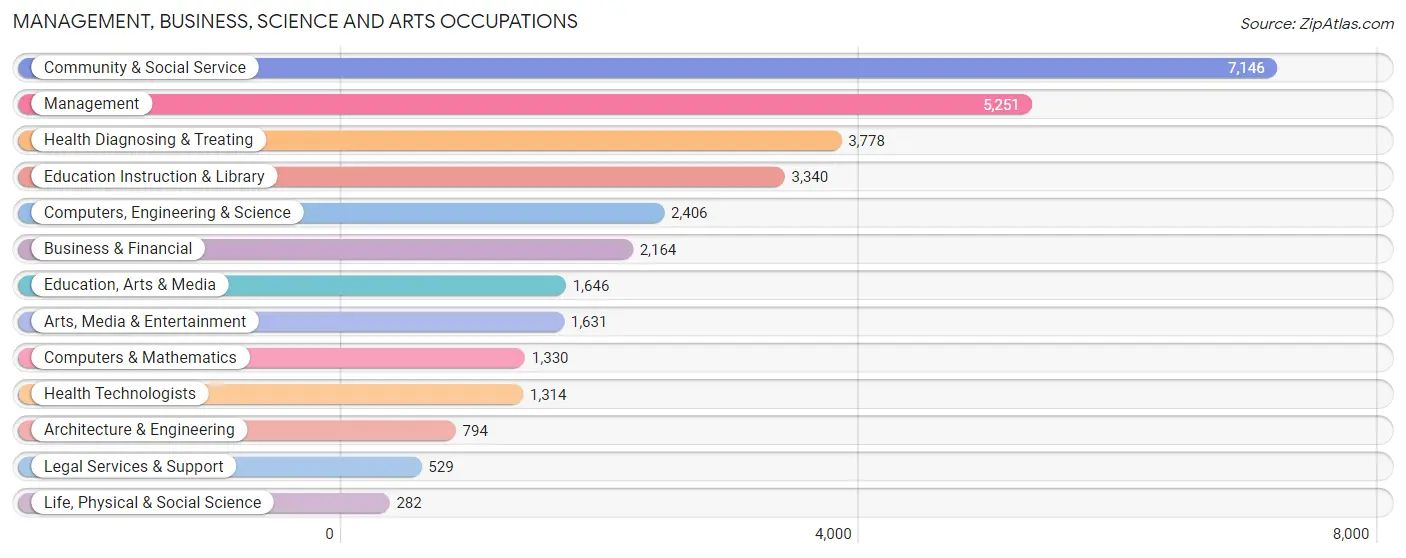
Management, Business, Science and Arts Occupations
The most common Management, Business, Science and Arts occupations in Bridgeport are Community & Social Service (7,146 | 9.9%), Management (5,251 | 7.3%), Health Diagnosing & Treating (3,778 | 5.2%), Education Instruction & Library (3,340 | 4.6%), and Computers, Engineering & Science (2,406 | 3.3%).
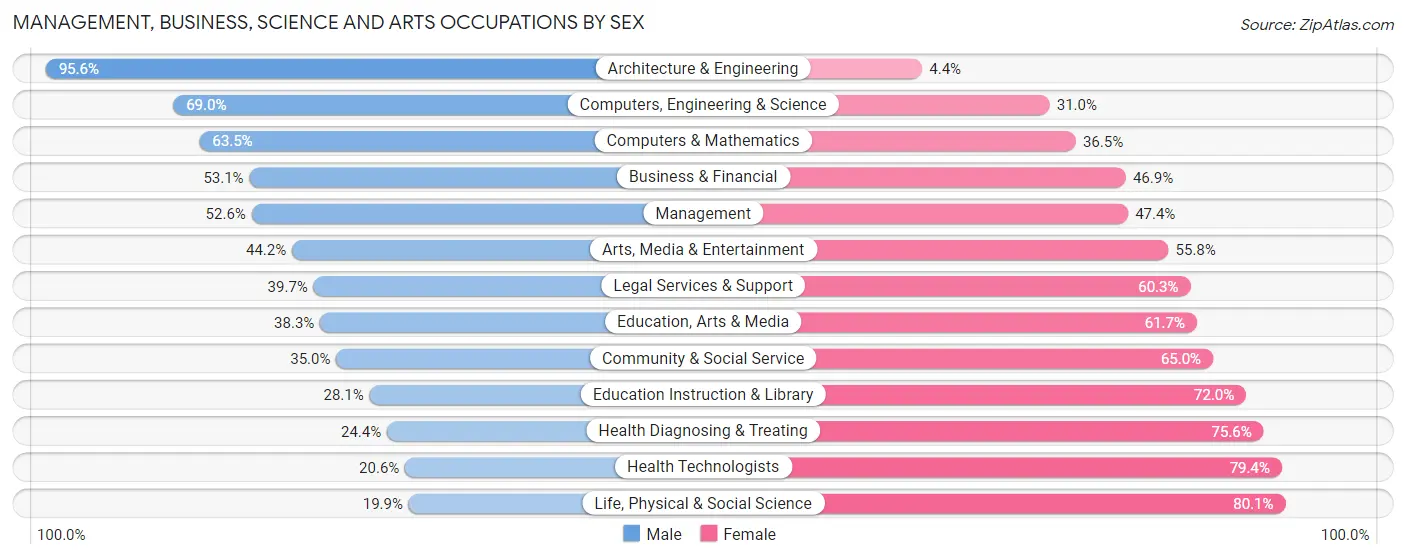
Management, Business, Science and Arts Occupations by Sex
Within the Management, Business, Science and Arts occupations in Bridgeport, the most male-oriented occupations are Architecture & Engineering (95.6%), Computers, Engineering & Science (69.0%), and Computers & Mathematics (63.5%), while the most female-oriented occupations are Life, Physical & Social Science (80.1%), Health Technologists (79.4%), and Health Diagnosing & Treating (75.6%).
| Occupation | Male | Female |
| Management | 2,764 (52.6%) | 2,487 (47.4%) |
| Business & Financial | 1,149 (53.1%) | 1,015 (46.9%) |
| Computers, Engineering & Science | 1,660 (69.0%) | 746 (31.0%) |
| Computers & Mathematics | 845 (63.5%) | 485 (36.5%) |
| Architecture & Engineering | 759 (95.6%) | 35 (4.4%) |
| Life, Physical & Social Science | 56 (19.9%) | 226 (80.1%) |
| Community & Social Service | 2,499 (35.0%) | 4,647 (65.0%) |
| Education, Arts & Media | 631 (38.3%) | 1,015 (61.7%) |
| Legal Services & Support | 210 (39.7%) | 319 (60.3%) |
| Education Instruction & Library | 937 (28.1%) | 2,403 (72.0%) |
| Arts, Media & Entertainment | 721 (44.2%) | 910 (55.8%) |
| Health Diagnosing & Treating | 922 (24.4%) | 2,856 (75.6%) |
| Health Technologists | 271 (20.6%) | 1,043 (79.4%) |
| Total (Category) | 8,994 (43.4%) | 11,751 (56.6%) |
| Total (Overall) | 36,867 (51.1%) | 35,277 (48.9%) |
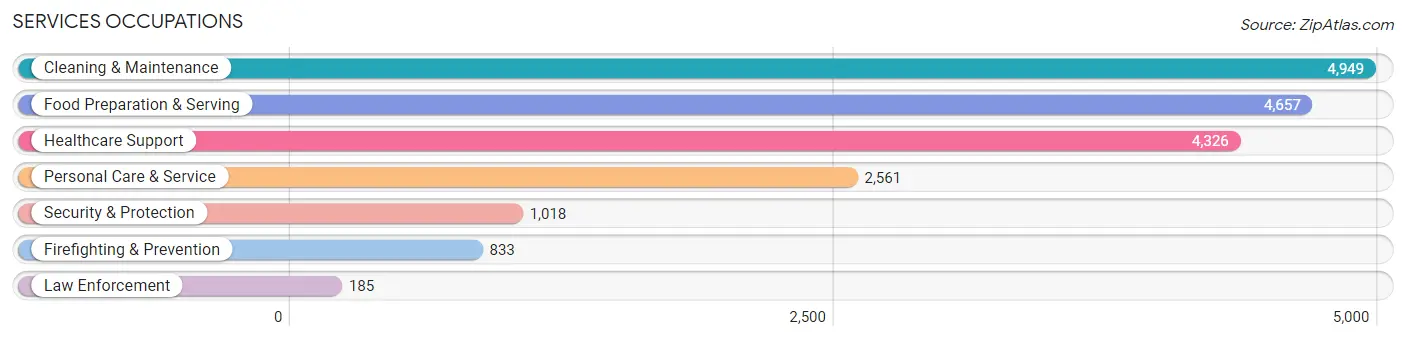
Services Occupations
The most common Services occupations in Bridgeport are Cleaning & Maintenance (4,949 | 6.9%), Food Preparation & Serving (4,657 | 6.5%), Healthcare Support (4,326 | 6.0%), Personal Care & Service (2,561 | 3.5%), and Security & Protection (1,018 | 1.4%).
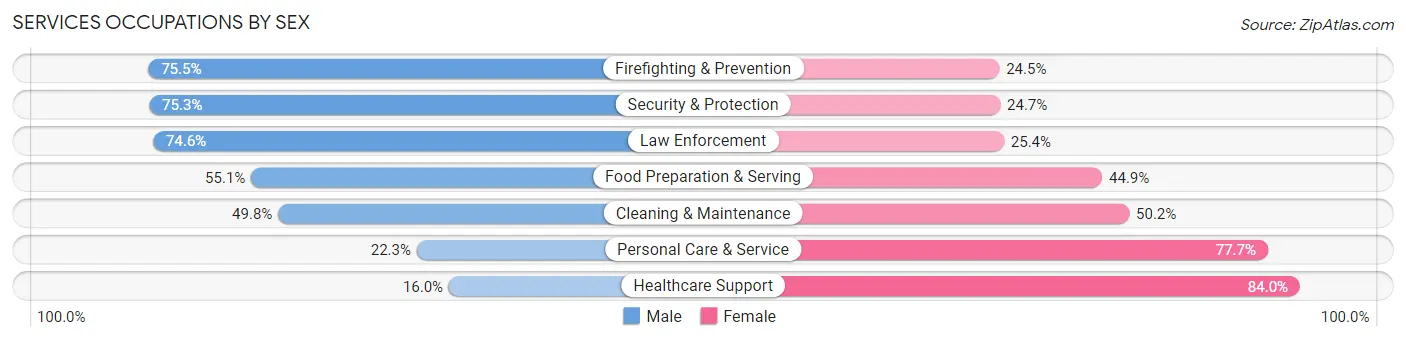
Services Occupations by Sex
Within the Services occupations in Bridgeport, the most male-oriented occupations are Firefighting & Prevention (75.5%), Security & Protection (75.3%), and Law Enforcement (74.6%), while the most female-oriented occupations are Healthcare Support (84.0%), Personal Care & Service (77.7%), and Cleaning & Maintenance (50.2%).
| Occupation | Male | Female |
| Healthcare Support | 691 (16.0%) | 3,635 (84.0%) |
| Security & Protection | 767 (75.3%) | 251 (24.7%) |
| Firefighting & Prevention | 629 (75.5%) | 204 (24.5%) |
| Law Enforcement | 138 (74.6%) | 47 (25.4%) |
| Food Preparation & Serving | 2,568 (55.1%) | 2,089 (44.9%) |
| Cleaning & Maintenance | 2,464 (49.8%) | 2,485 (50.2%) |
| Personal Care & Service | 572 (22.3%) | 1,989 (77.7%) |
| Total (Category) | 7,062 (40.3%) | 10,449 (59.7%) |
| Total (Overall) | 36,867 (51.1%) | 35,277 (48.9%) |
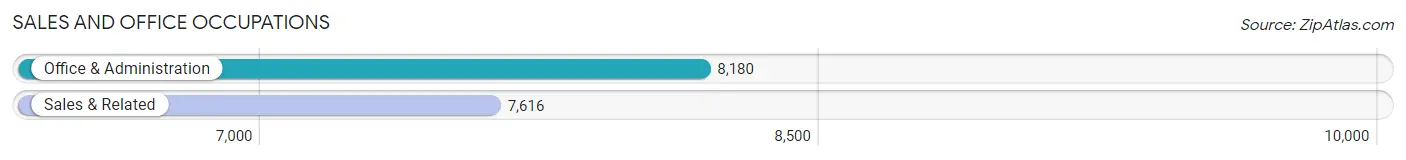
Sales and Office Occupations
The most common Sales and Office occupations in Bridgeport are Office & Administration (8,180 | 11.3%), and Sales & Related (7,616 | 10.6%).
Sales and Office Occupations by Sex
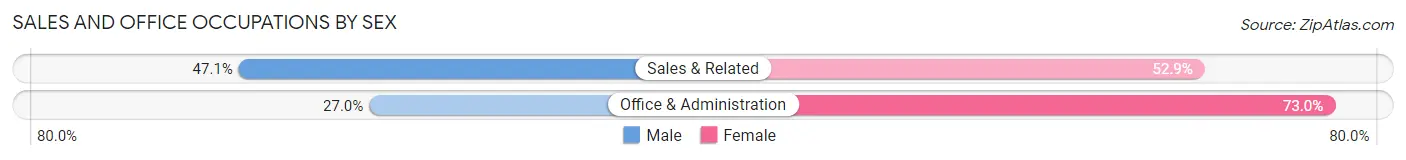
| Occupation | Male | Female |
| Sales & Related | 3,585 (47.1%) | 4,031 (52.9%) |
| Office & Administration | 2,209 (27.0%) | 5,971 (73.0%) |
| Total (Category) | 5,794 (36.7%) | 10,002 (63.3%) |
| Total (Overall) | 36,867 (51.1%) | 35,277 (48.9%) |
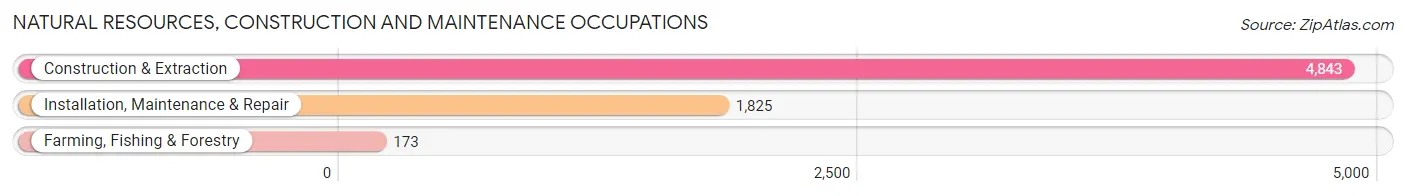
Natural Resources, Construction and Maintenance Occupations
The most common Natural Resources, Construction and Maintenance occupations in Bridgeport are Construction & Extraction (4,843 | 6.7%), Installation, Maintenance & Repair (1,825 | 2.5%), and Farming, Fishing & Forestry (173 | 0.2%).
Natural Resources, Construction and Maintenance Occupations by Sex
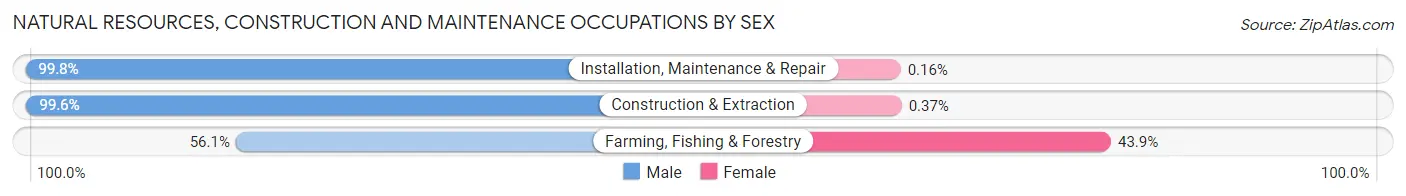
| Occupation | Male | Female |
| Farming, Fishing & Forestry | 97 (56.1%) | 76 (43.9%) |
| Construction & Extraction | 4,825 (99.6%) | 18 (0.4%) |
| Installation, Maintenance & Repair | 1,822 (99.8%) | 3 (0.2%) |
| Total (Category) | 6,744 (98.6%) | 97 (1.4%) |
| Total (Overall) | 36,867 (51.1%) | 35,277 (48.9%) |
Production, Transportation and Moving Occupations
The most common Production, Transportation and Moving occupations in Bridgeport are Production (4,863 | 6.7%), Transportation (3,249 | 4.5%), and Material Moving (3,139 | 4.3%).
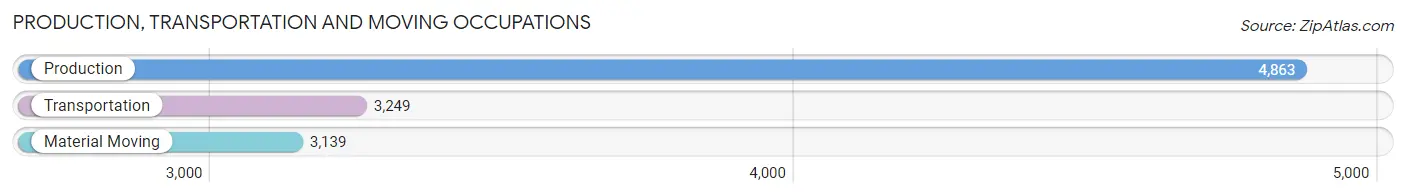
Production, Transportation and Moving Occupations by Sex

| Occupation | Male | Female |
| Production | 3,255 (66.9%) | 1,608 (33.1%) |
| Transportation | 2,809 (86.5%) | 440 (13.5%) |
| Material Moving | 2,209 (70.4%) | 930 (29.6%) |
| Total (Category) | 8,273 (73.5%) | 2,978 (26.5%) |
| Total (Overall) | 36,867 (51.1%) | 35,277 (48.9%) |
Employment Industries by Sex in Bridgeport
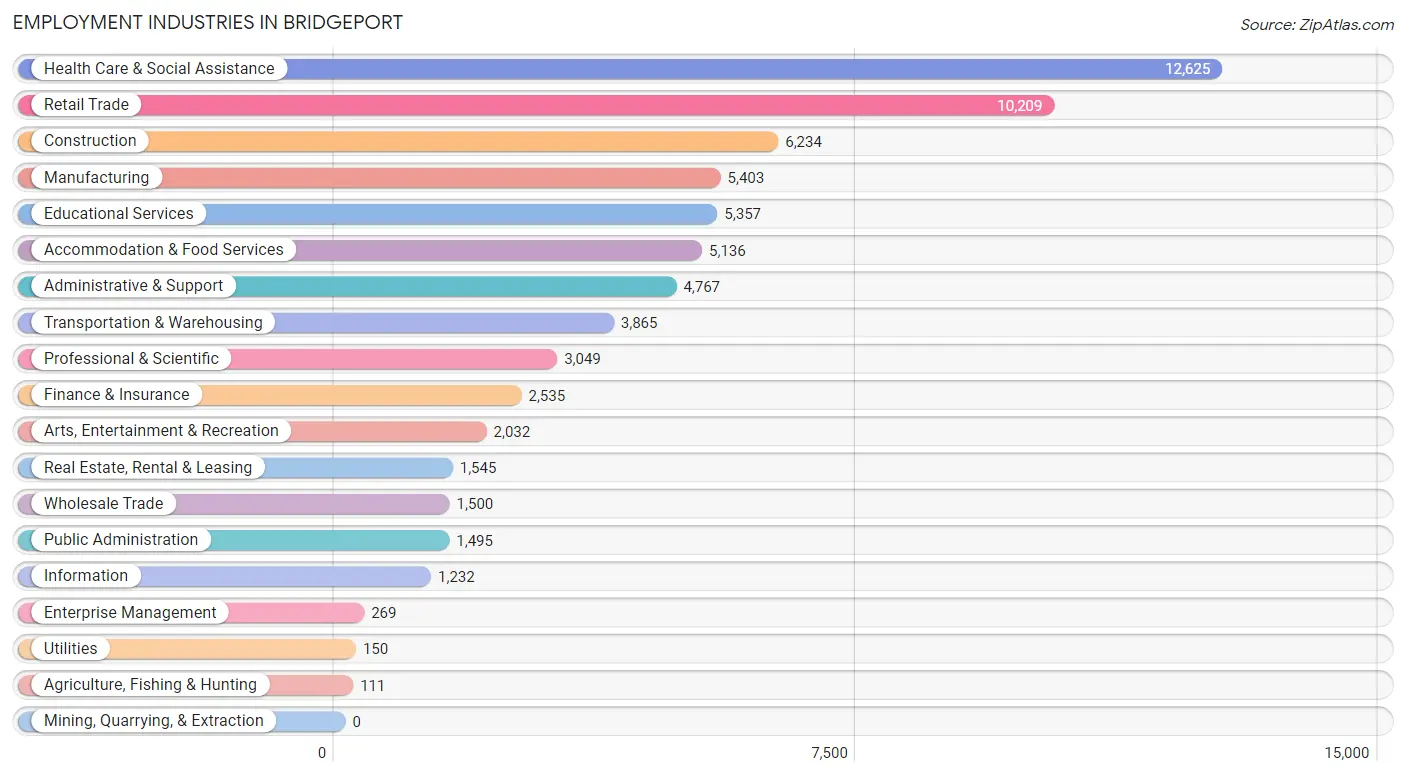
Employment Industries in Bridgeport
The major employment industries in Bridgeport include Health Care & Social Assistance (12,625 | 17.5%), Retail Trade (10,209 | 14.1%), Construction (6,234 | 8.6%), Manufacturing (5,403 | 7.5%), and Educational Services (5,357 | 7.4%).
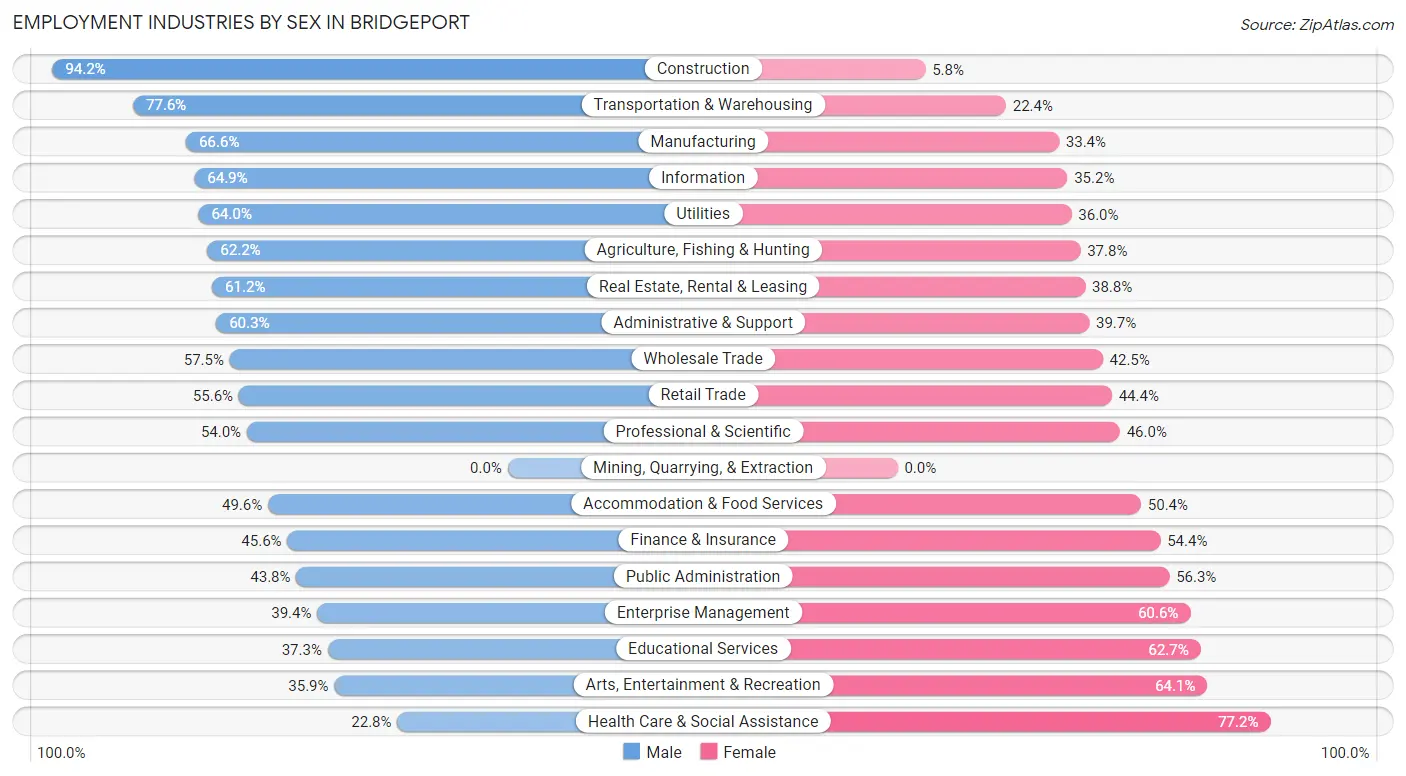
Employment Industries by Sex in Bridgeport
The Bridgeport industries that see more men than women are Construction (94.2%), Transportation & Warehousing (77.6%), and Manufacturing (66.6%), whereas the industries that tend to have a higher number of women are Health Care & Social Assistance (77.2%), Arts, Entertainment & Recreation (64.1%), and Educational Services (62.7%).
| Industry | Male | Female |
| Agriculture, Fishing & Hunting | 69 (62.2%) | 42 (37.8%) |
| Mining, Quarrying, & Extraction | 0 (0.0%) | 0 (0.0%) |
| Construction | 5,875 (94.2%) | 359 (5.8%) |
| Manufacturing | 3,598 (66.6%) | 1,805 (33.4%) |
| Wholesale Trade | 863 (57.5%) | 637 (42.5%) |
| Retail Trade | 5,680 (55.6%) | 4,529 (44.4%) |
| Transportation & Warehousing | 2,998 (77.6%) | 867 (22.4%) |
| Utilities | 96 (64.0%) | 54 (36.0%) |
| Information | 799 (64.8%) | 433 (35.1%) |
| Finance & Insurance | 1,156 (45.6%) | 1,379 (54.4%) |
| Real Estate, Rental & Leasing | 945 (61.2%) | 600 (38.8%) |
| Professional & Scientific | 1,646 (54.0%) | 1,403 (46.0%) |
| Enterprise Management | 106 (39.4%) | 163 (60.6%) |
| Administrative & Support | 2,876 (60.3%) | 1,891 (39.7%) |
| Educational Services | 1,996 (37.3%) | 3,361 (62.7%) |
| Health Care & Social Assistance | 2,884 (22.8%) | 9,741 (77.2%) |
| Arts, Entertainment & Recreation | 729 (35.9%) | 1,303 (64.1%) |
| Accommodation & Food Services | 2,548 (49.6%) | 2,588 (50.4%) |
| Public Administration | 654 (43.8%) | 841 (56.2%) |
| Total | 36,867 (51.1%) | 35,277 (48.9%) |
Education in Bridgeport
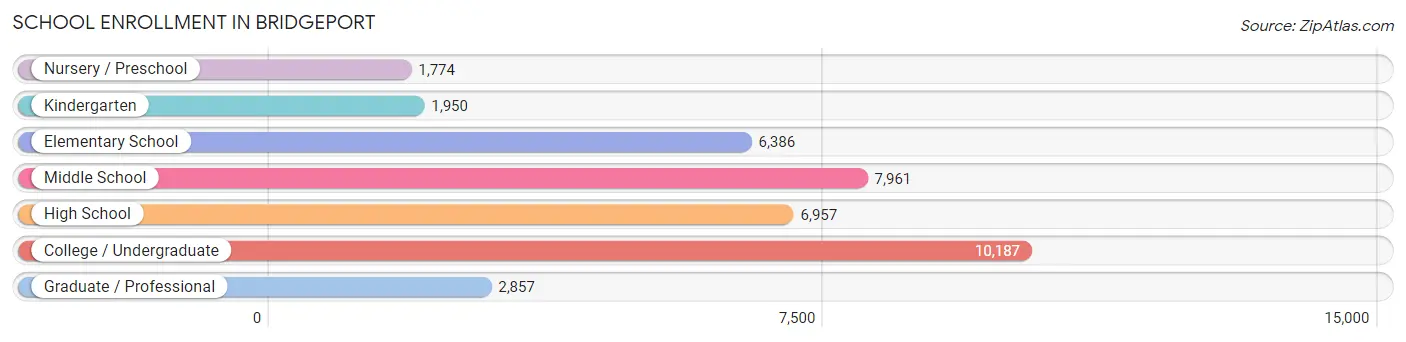
School Enrollment in Bridgeport
The most common levels of schooling among the 38,072 students in Bridgeport are college / undergraduate (10,187 | 26.8%), middle school (7,961 | 20.9%), and high school (6,957 | 18.3%).
| School Level | # Students | % Students |
| Nursery / Preschool | 1,774 | 4.7% |
| Kindergarten | 1,950 | 5.1% |
| Elementary School | 6,386 | 16.8% |
| Middle School | 7,961 | 20.9% |
| High School | 6,957 | 18.3% |
| College / Undergraduate | 10,187 | 26.8% |
| Graduate / Professional | 2,857 | 7.5% |
| Total | 38,072 | 100.0% |
School Enrollment by Age by Funding Source in Bridgeport
Out of a total of 38,072 students who are enrolled in schools in Bridgeport, 10,203 (26.8%) attend a private institution, while the remaining 27,869 (73.2%) are enrolled in public schools. The age group of 18 to 19 year olds has the highest likelihood of being enrolled in private schools, with 1,882 (50.9% in the age bracket) enrolled. Conversely, the age group of 5 to 9 year old has the lowest likelihood of being enrolled in a private school, with 7,040 (91.0% in the age bracket) attending a public institution.
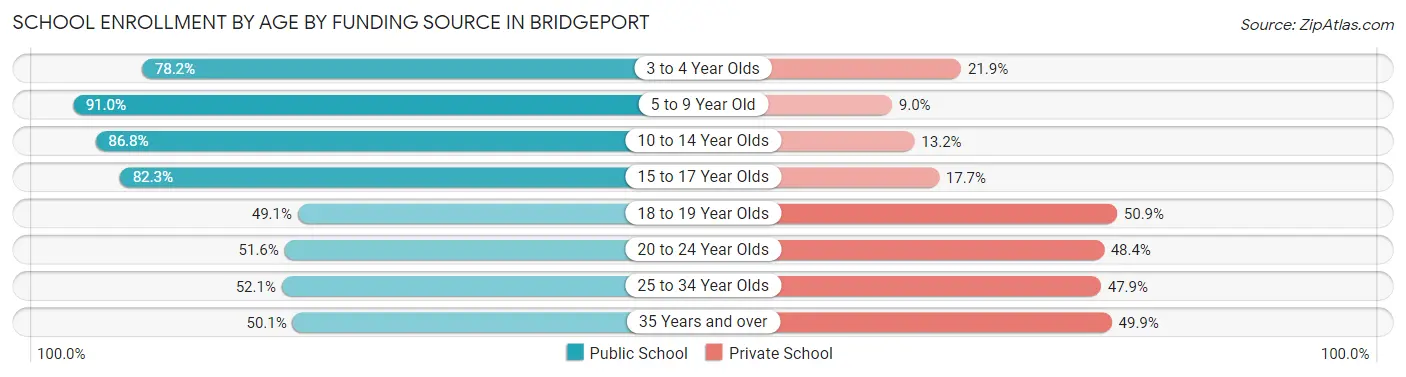
| Age Bracket | Public School | Private School |
| 3 to 4 Year Olds | 1,563 (78.1%) | 437 (21.8%) |
| 5 to 9 Year Old | 7,040 (91.0%) | 694 (9.0%) |
| 10 to 14 Year Olds | 7,902 (86.8%) | 1,200 (13.2%) |
| 15 to 17 Year Olds | 4,158 (82.3%) | 896 (17.7%) |
| 18 to 19 Year Olds | 1,816 (49.1%) | 1,882 (50.9%) |
| 20 to 24 Year Olds | 2,644 (51.6%) | 2,483 (48.4%) |
| 25 to 34 Year Olds | 1,620 (52.1%) | 1,489 (47.9%) |
| 35 Years and over | 1,126 (50.1%) | 1,122 (49.9%) |
| Total | 27,869 (73.2%) | 10,203 (26.8%) |
Educational Attainment by Field of Study in Bridgeport
Business (5,216 | 19.0%), social sciences (2,886 | 10.5%), education (2,423 | 8.8%), liberal arts & history (2,283 | 8.3%), and literature & languages (2,102 | 7.7%) are the most common fields of study among 27,411 individuals in Bridgeport who have obtained a bachelor's degree or higher.
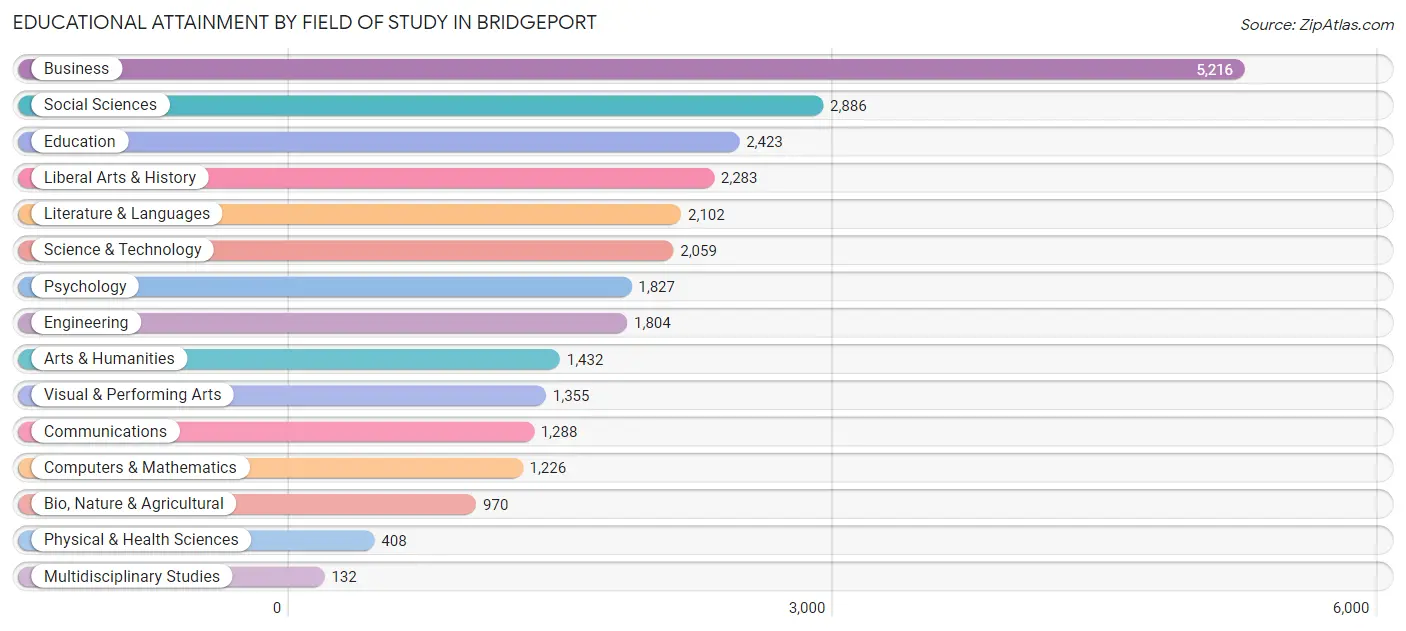
| Field of Study | # Graduates | % Graduates |
| Computers & Mathematics | 1,226 | 4.5% |
| Bio, Nature & Agricultural | 970 | 3.5% |
| Physical & Health Sciences | 408 | 1.5% |
| Psychology | 1,827 | 6.7% |
| Social Sciences | 2,886 | 10.5% |
| Engineering | 1,804 | 6.6% |
| Multidisciplinary Studies | 132 | 0.5% |
| Science & Technology | 2,059 | 7.5% |
| Business | 5,216 | 19.0% |
| Education | 2,423 | 8.8% |
| Literature & Languages | 2,102 | 7.7% |
| Liberal Arts & History | 2,283 | 8.3% |
| Visual & Performing Arts | 1,355 | 4.9% |
| Communications | 1,288 | 4.7% |
| Arts & Humanities | 1,432 | 5.2% |
| Total | 27,411 | 100.0% |
Transportation & Commute in Bridgeport
Vehicle Availability by Sex in Bridgeport
The most prevalent vehicle ownership categories in Bridgeport are males with 2 vehicles (14,264, accounting for 40.0%) and females with 2 vehicles (12,294, making up 42.3%).
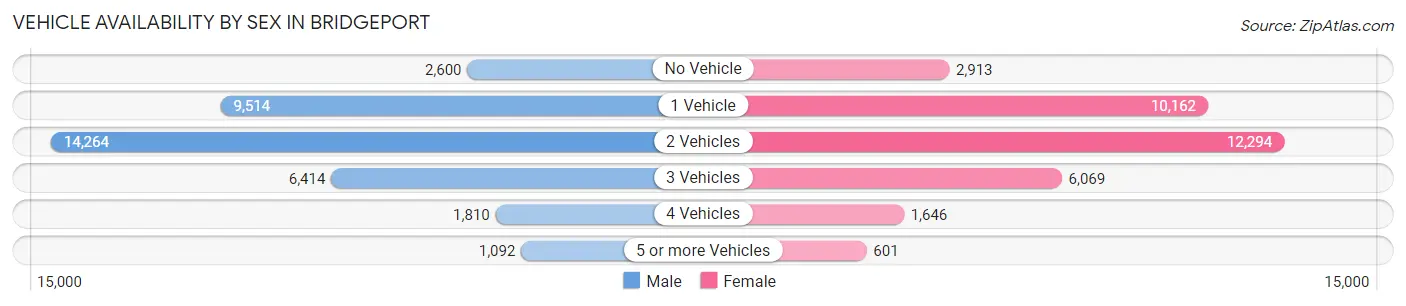
| Vehicles Available | Male | Female |
| No Vehicle | 2,600 (7.3%) | 2,913 (8.6%) |
| 1 Vehicle | 9,514 (26.7%) | 10,162 (30.2%) |
| 2 Vehicles | 14,264 (40.0%) | 12,294 (36.5%) |
| 3 Vehicles | 6,414 (18.0%) | 6,069 (18.0%) |
| 4 Vehicles | 1,810 (5.1%) | 1,646 (4.9%) |
| 5 or more Vehicles | 1,092 (3.1%) | 601 (1.8%) |
| Total | 35,694 (100.0%) | 33,685 (100.0%) |
Commute Time in Bridgeport
The most frequently occuring commute durations in Bridgeport are 10 to 14 minutes (10,676 commuters, 16.2%), 20 to 24 minutes (9,507 commuters, 14.4%), and 15 to 19 minutes (9,485 commuters, 14.3%).
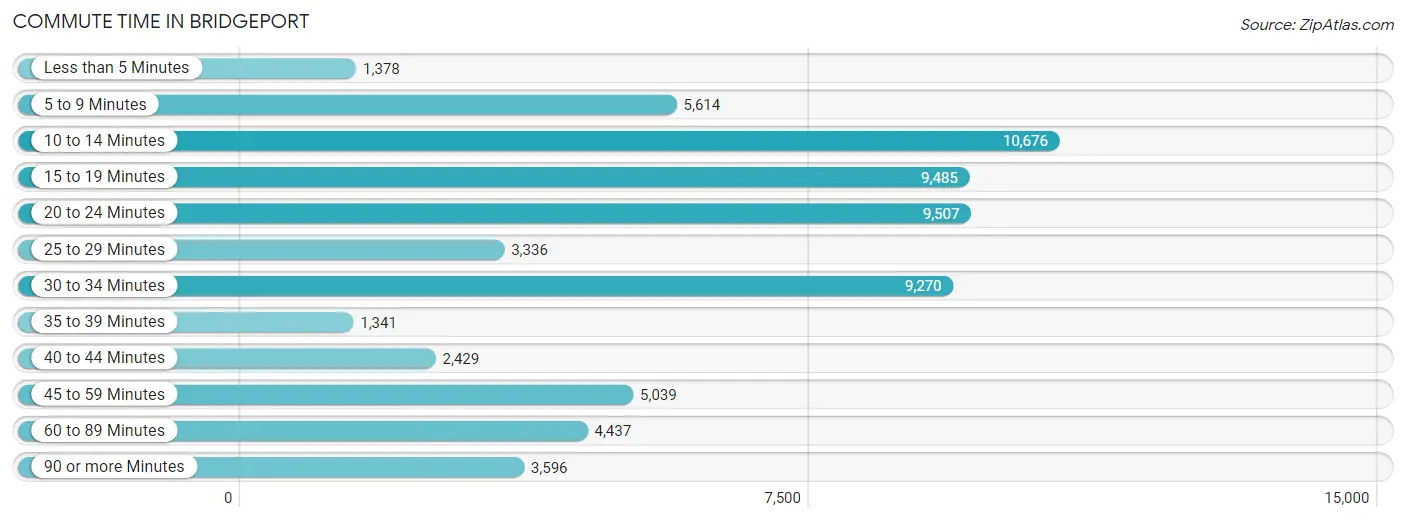
| Commute Time | # Commuters | % Commuters |
| Less than 5 Minutes | 1,378 | 2.1% |
| 5 to 9 Minutes | 5,614 | 8.5% |
| 10 to 14 Minutes | 10,676 | 16.2% |
| 15 to 19 Minutes | 9,485 | 14.3% |
| 20 to 24 Minutes | 9,507 | 14.4% |
| 25 to 29 Minutes | 3,336 | 5.1% |
| 30 to 34 Minutes | 9,270 | 14.0% |
| 35 to 39 Minutes | 1,341 | 2.0% |
| 40 to 44 Minutes | 2,429 | 3.7% |
| 45 to 59 Minutes | 5,039 | 7.6% |
| 60 to 89 Minutes | 4,437 | 6.7% |
| 90 or more Minutes | 3,596 | 5.4% |
Commute Time by Sex in Bridgeport
The most common commute times in Bridgeport are 10 to 14 minutes (5,607 commuters, 16.5%) for males and 10 to 14 minutes (5,069 commuters, 15.8%) for females.
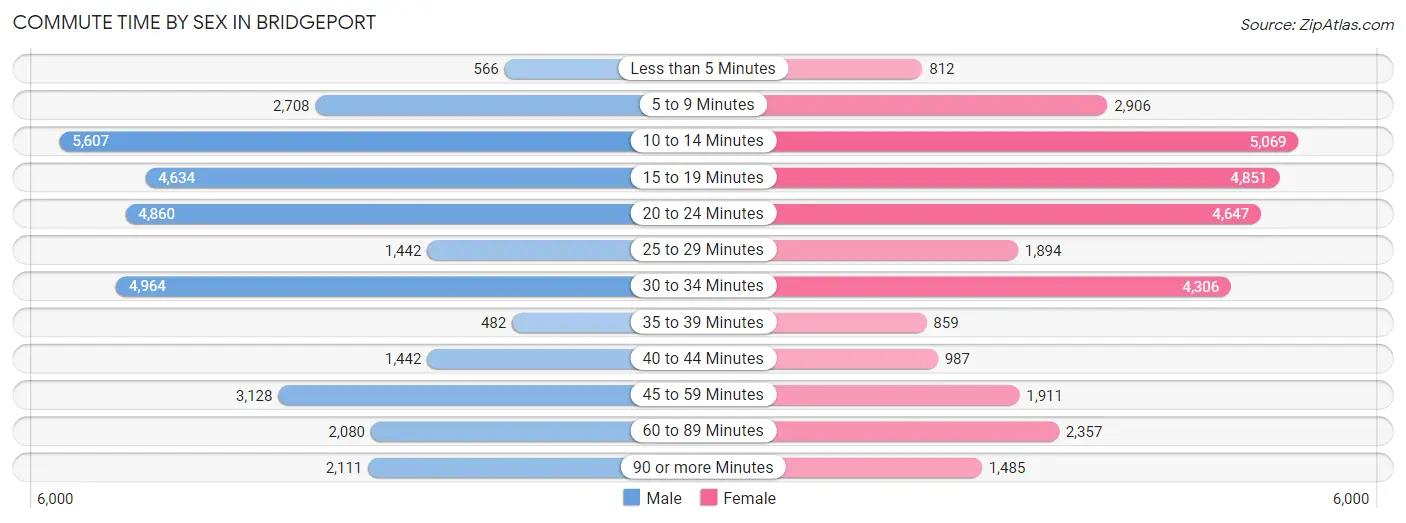
| Commute Time | Male | Female |
| Less than 5 Minutes | 566 (1.7%) | 812 (2.5%) |
| 5 to 9 Minutes | 2,708 (8.0%) | 2,906 (9.1%) |
| 10 to 14 Minutes | 5,607 (16.5%) | 5,069 (15.8%) |
| 15 to 19 Minutes | 4,634 (13.6%) | 4,851 (15.1%) |
| 20 to 24 Minutes | 4,860 (14.3%) | 4,647 (14.5%) |
| 25 to 29 Minutes | 1,442 (4.2%) | 1,894 (5.9%) |
| 30 to 34 Minutes | 4,964 (14.6%) | 4,306 (13.4%) |
| 35 to 39 Minutes | 482 (1.4%) | 859 (2.7%) |
| 40 to 44 Minutes | 1,442 (4.2%) | 987 (3.1%) |
| 45 to 59 Minutes | 3,128 (9.2%) | 1,911 (6.0%) |
| 60 to 89 Minutes | 2,080 (6.1%) | 2,357 (7.3%) |
| 90 or more Minutes | 2,111 (6.2%) | 1,485 (4.6%) |
Time of Departure to Work by Sex in Bridgeport
The most frequent times of departure to work in Bridgeport are 7:00 AM to 7:29 AM (5,103, 15.0%) for males and 8:00 AM to 8:29 AM (4,271, 13.3%) for females.
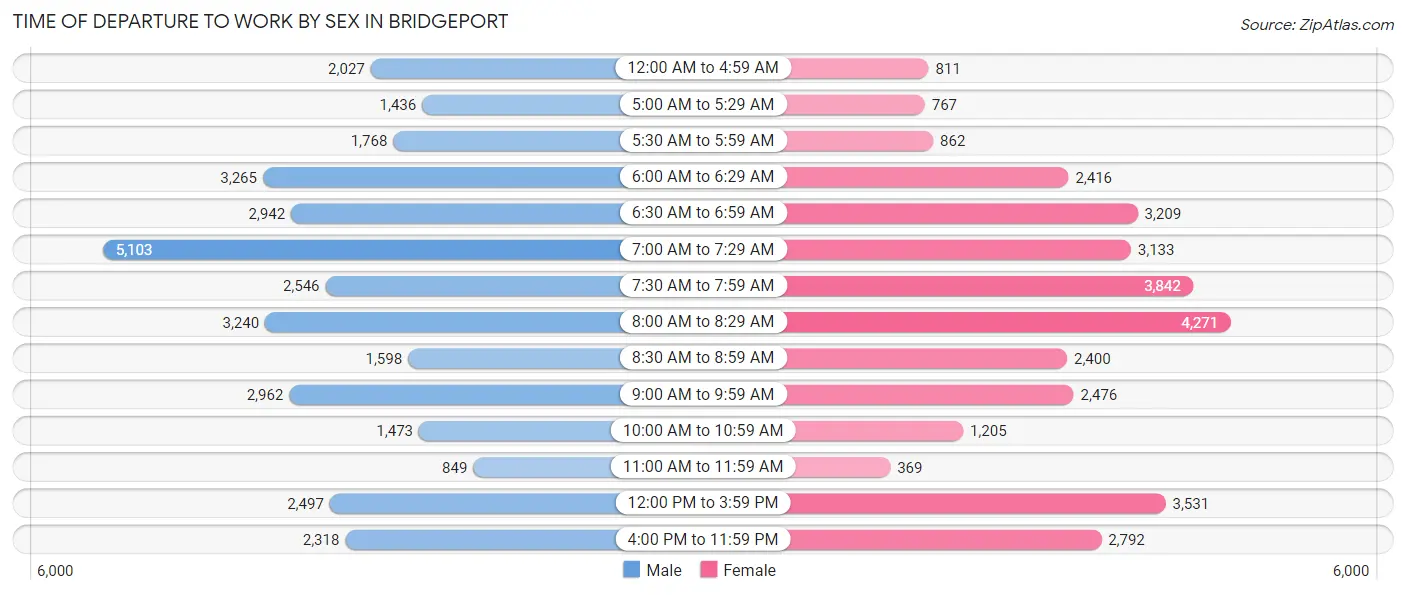
| Time of Departure | Male | Female |
| 12:00 AM to 4:59 AM | 2,027 (6.0%) | 811 (2.5%) |
| 5:00 AM to 5:29 AM | 1,436 (4.2%) | 767 (2.4%) |
| 5:30 AM to 5:59 AM | 1,768 (5.2%) | 862 (2.7%) |
| 6:00 AM to 6:29 AM | 3,265 (9.6%) | 2,416 (7.5%) |
| 6:30 AM to 6:59 AM | 2,942 (8.6%) | 3,209 (10.0%) |
| 7:00 AM to 7:29 AM | 5,103 (15.0%) | 3,133 (9.8%) |
| 7:30 AM to 7:59 AM | 2,546 (7.5%) | 3,842 (12.0%) |
| 8:00 AM to 8:29 AM | 3,240 (9.5%) | 4,271 (13.3%) |
| 8:30 AM to 8:59 AM | 1,598 (4.7%) | 2,400 (7.5%) |
| 9:00 AM to 9:59 AM | 2,962 (8.7%) | 2,476 (7.7%) |
| 10:00 AM to 10:59 AM | 1,473 (4.3%) | 1,205 (3.8%) |
| 11:00 AM to 11:59 AM | 849 (2.5%) | 369 (1.1%) |
| 12:00 PM to 3:59 PM | 2,497 (7.3%) | 3,531 (11.0%) |
| 4:00 PM to 11:59 PM | 2,318 (6.8%) | 2,792 (8.7%) |
| Total | 34,024 (100.0%) | 32,084 (100.0%) |
Housing Occupancy in Bridgeport
Occupancy by Ownership in Bridgeport
Of the total 55,550 dwellings in Bridgeport, owner-occupied units account for 25,118 (45.2%), while renter-occupied units make up 30,432 (54.8%).
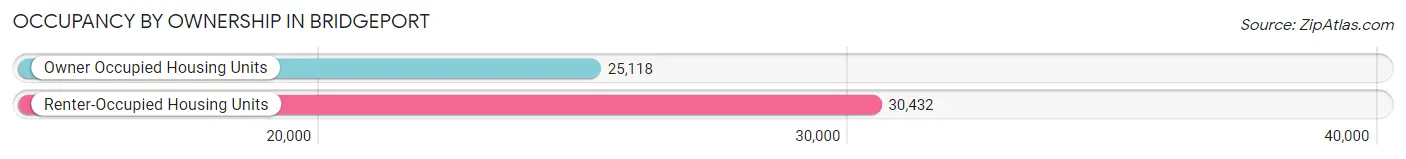
| Occupancy | # Housing Units | % Housing Units |
| Owner Occupied Housing Units | 25,118 | 45.2% |
| Renter-Occupied Housing Units | 30,432 | 54.8% |
| Total Occupied Housing Units | 55,550 | 100.0% |
Occupancy by Household Size in Bridgeport
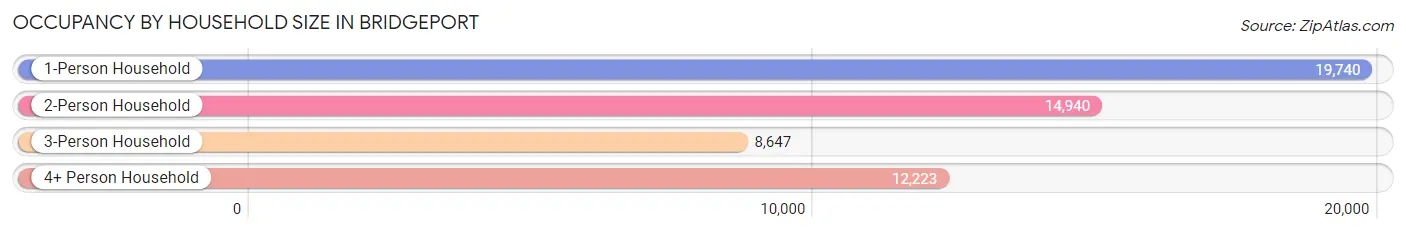
| Household Size | # Housing Units | % Housing Units |
| 1-Person Household | 19,740 | 35.5% |
| 2-Person Household | 14,940 | 26.9% |
| 3-Person Household | 8,647 | 15.6% |
| 4+ Person Household | 12,223 | 22.0% |
| Total Housing Units | 55,550 | 100.0% |
Occupancy by Ownership by Household Size in Bridgeport
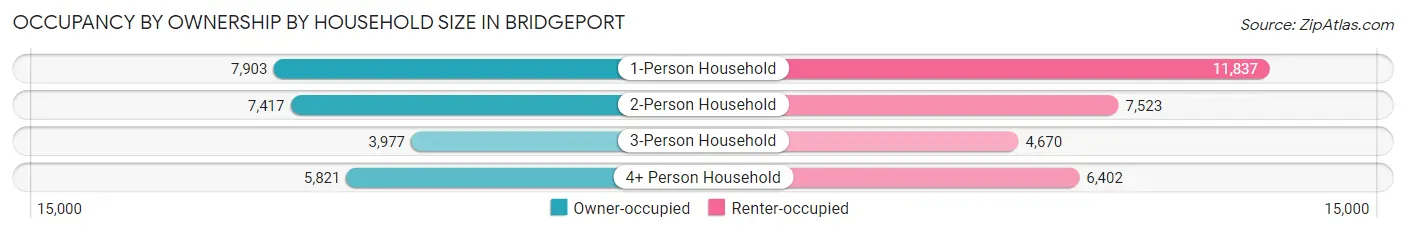
| Household Size | Owner-occupied | Renter-occupied |
| 1-Person Household | 7,903 (40.0%) | 11,837 (60.0%) |
| 2-Person Household | 7,417 (49.6%) | 7,523 (50.3%) |
| 3-Person Household | 3,977 (46.0%) | 4,670 (54.0%) |
| 4+ Person Household | 5,821 (47.6%) | 6,402 (52.4%) |
| Total Housing Units | 25,118 (45.2%) | 30,432 (54.8%) |
Occupancy by Educational Attainment in Bridgeport
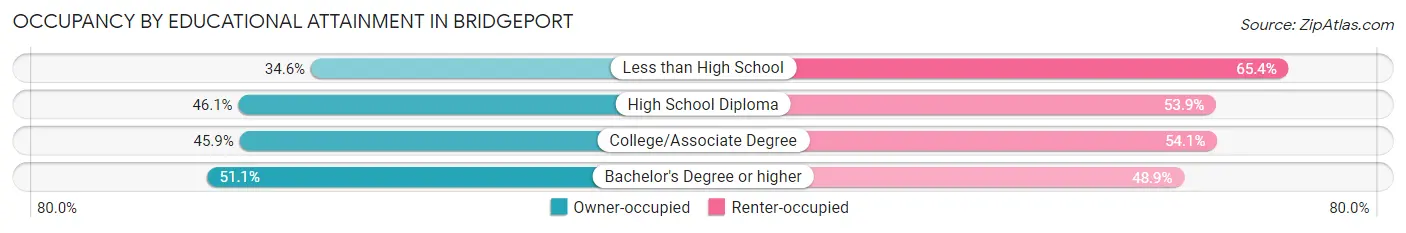
| Household Size | Owner-occupied | Renter-occupied |
| Less than High School | 3,544 (34.6%) | 6,703 (65.4%) |
| High School Diploma | 7,424 (46.1%) | 8,686 (53.9%) |
| College/Associate Degree | 6,817 (45.9%) | 8,033 (54.1%) |
| Bachelor's Degree or higher | 7,333 (51.1%) | 7,010 (48.9%) |
Occupancy by Age of Householder in Bridgeport
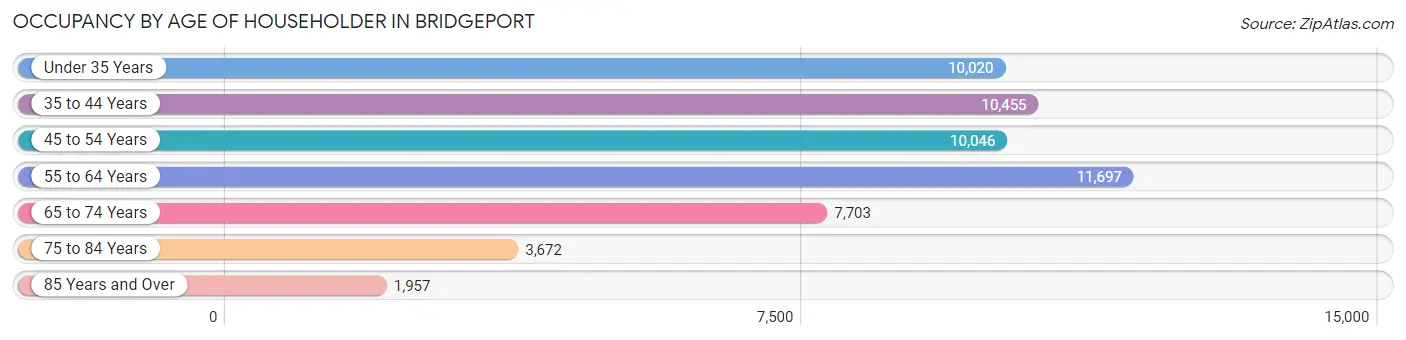
| Age Bracket | # Households | % Households |
| Under 35 Years | 10,020 | 18.0% |
| 35 to 44 Years | 10,455 | 18.8% |
| 45 to 54 Years | 10,046 | 18.1% |
| 55 to 64 Years | 11,697 | 21.1% |
| 65 to 74 Years | 7,703 | 13.9% |
| 75 to 84 Years | 3,672 | 6.6% |
| 85 Years and Over | 1,957 | 3.5% |
| Total | 55,550 | 100.0% |
Housing Finances in Bridgeport
Median Income by Occupancy in Bridgeport
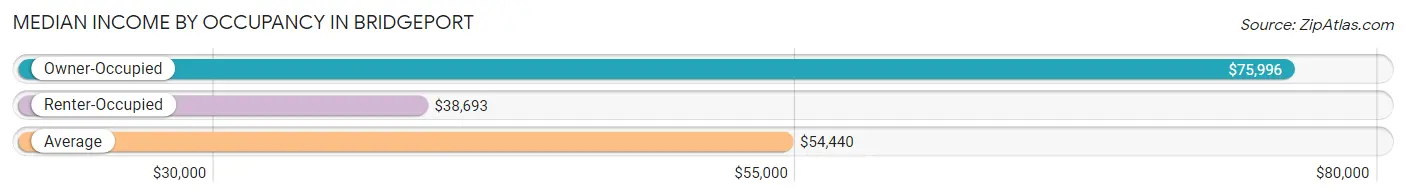
| Occupancy Type | # Households | Median Income |
| Owner-Occupied | 25,118 (45.2%) | $75,996 |
| Renter-Occupied | 30,432 (54.8%) | $38,693 |
| Average | 55,550 (100.0%) | $54,440 |
Occupancy by Householder Income Bracket in Bridgeport
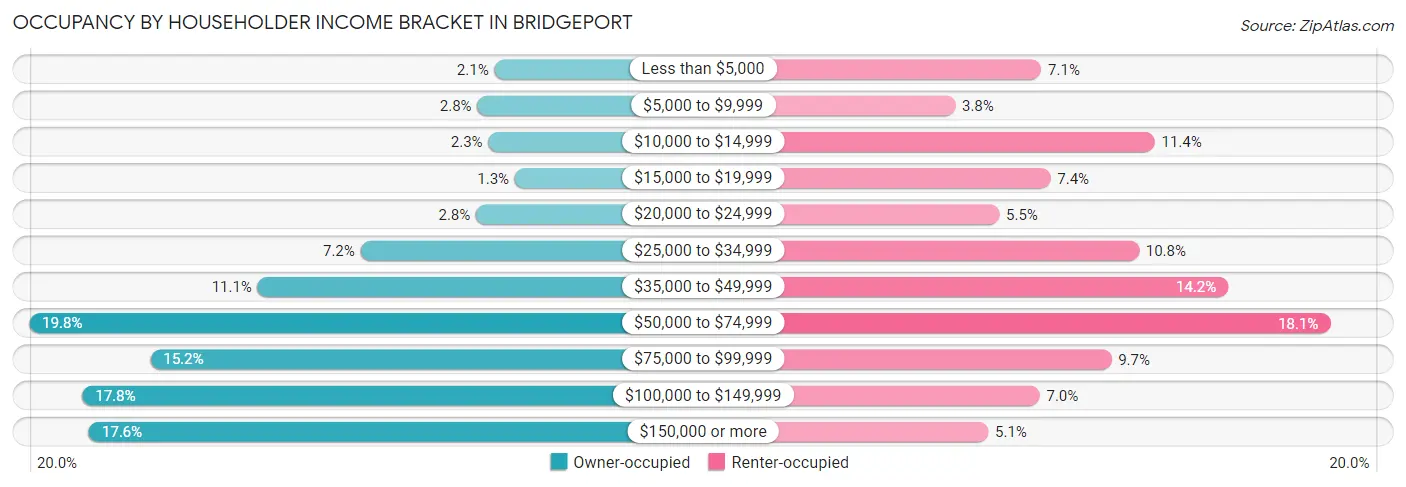
| Income Bracket | Owner-occupied | Renter-occupied |
| Less than $5,000 | 527 (2.1%) | 2,152 (7.1%) |
| $5,000 to $9,999 | 691 (2.8%) | 1,153 (3.8%) |
| $10,000 to $14,999 | 586 (2.3%) | 3,466 (11.4%) |
| $15,000 to $19,999 | 332 (1.3%) | 2,257 (7.4%) |
| $20,000 to $24,999 | 703 (2.8%) | 1,665 (5.5%) |
| $25,000 to $34,999 | 1,808 (7.2%) | 3,285 (10.8%) |
| $35,000 to $49,999 | 2,792 (11.1%) | 4,319 (14.2%) |
| $50,000 to $74,999 | 4,981 (19.8%) | 5,501 (18.1%) |
| $75,000 to $99,999 | 3,820 (15.2%) | 2,963 (9.7%) |
| $100,000 to $149,999 | 4,471 (17.8%) | 2,133 (7.0%) |
| $150,000 or more | 4,407 (17.5%) | 1,538 (5.1%) |
| Total | 25,118 (100.0%) | 30,432 (100.0%) |
Monthly Housing Cost Tiers in Bridgeport
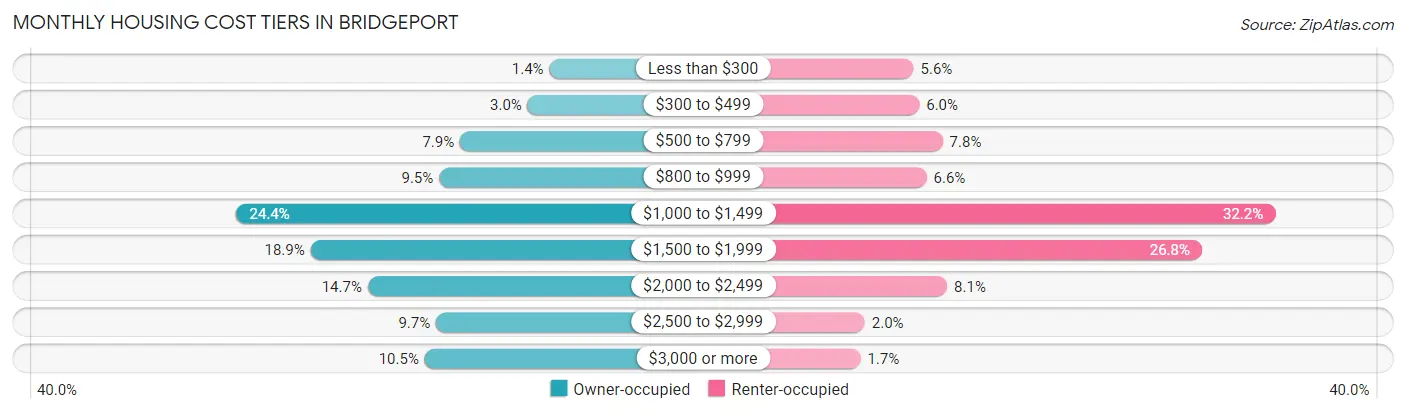
| Monthly Cost | Owner-occupied | Renter-occupied |
| Less than $300 | 338 (1.3%) | 1,706 (5.6%) |
| $300 to $499 | 741 (2.9%) | 1,834 (6.0%) |
| $500 to $799 | 1,991 (7.9%) | 2,358 (7.7%) |
| $800 to $999 | 2,379 (9.5%) | 1,998 (6.6%) |
| $1,000 to $1,499 | 6,130 (24.4%) | 9,808 (32.2%) |
| $1,500 to $1,999 | 4,757 (18.9%) | 8,164 (26.8%) |
| $2,000 to $2,499 | 3,700 (14.7%) | 2,459 (8.1%) |
| $2,500 to $2,999 | 2,436 (9.7%) | 615 (2.0%) |
| $3,000 or more | 2,646 (10.5%) | 518 (1.7%) |
| Total | 25,118 (100.0%) | 30,432 (100.0%) |
Physical Housing Characteristics in Bridgeport
Housing Structures in Bridgeport
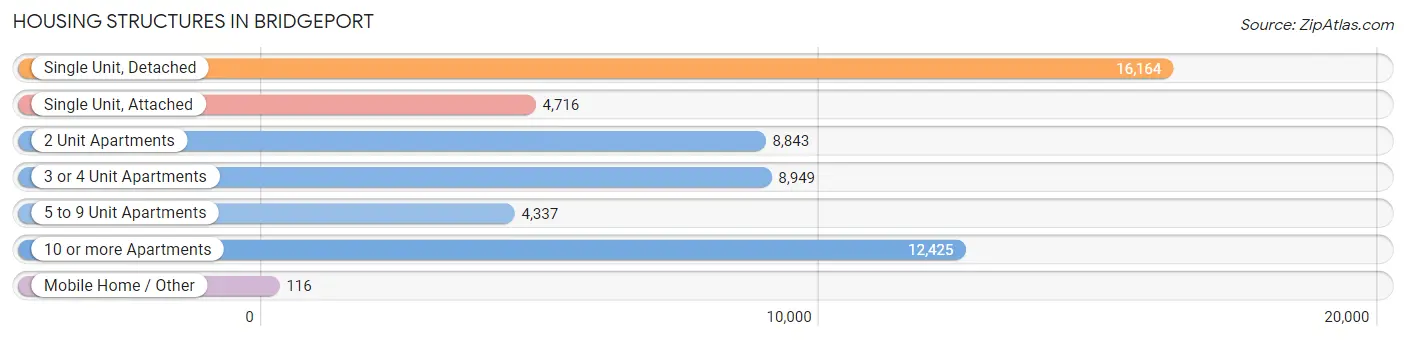
| Structure Type | # Housing Units | % Housing Units |
| Single Unit, Detached | 16,164 | 29.1% |
| Single Unit, Attached | 4,716 | 8.5% |
| 2 Unit Apartments | 8,843 | 15.9% |
| 3 or 4 Unit Apartments | 8,949 | 16.1% |
| 5 to 9 Unit Apartments | 4,337 | 7.8% |
| 10 or more Apartments | 12,425 | 22.4% |
| Mobile Home / Other | 116 | 0.2% |
| Total | 55,550 | 100.0% |
Housing Structures by Occupancy in Bridgeport
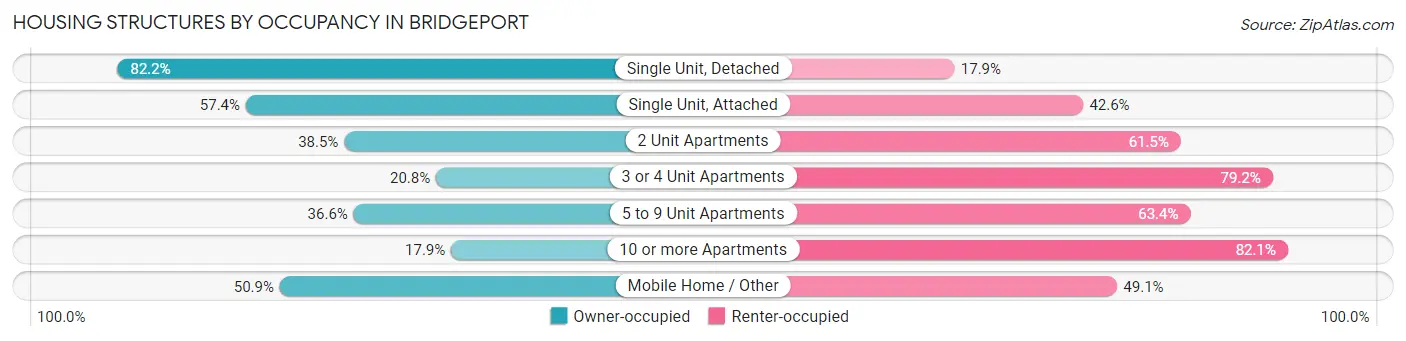
| Structure Type | Owner-occupied | Renter-occupied |
| Single Unit, Detached | 13,279 (82.2%) | 2,885 (17.8%) |
| Single Unit, Attached | 2,707 (57.4%) | 2,009 (42.6%) |
| 2 Unit Apartments | 3,402 (38.5%) | 5,441 (61.5%) |
| 3 or 4 Unit Apartments | 1,860 (20.8%) | 7,089 (79.2%) |
| 5 to 9 Unit Apartments | 1,589 (36.6%) | 2,748 (63.4%) |
| 10 or more Apartments | 2,222 (17.9%) | 10,203 (82.1%) |
| Mobile Home / Other | 59 (50.9%) | 57 (49.1%) |
| Total | 25,118 (45.2%) | 30,432 (54.8%) |
Housing Structures by Number of Rooms in Bridgeport
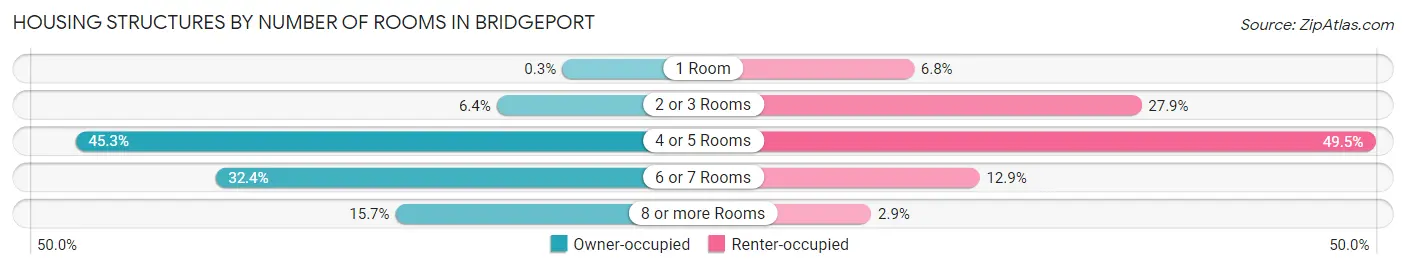
| Number of Rooms | Owner-occupied | Renter-occupied |
| 1 Room | 75 (0.3%) | 2,082 (6.8%) |
| 2 or 3 Rooms | 1,595 (6.4%) | 8,485 (27.9%) |
| 4 or 5 Rooms | 11,375 (45.3%) | 15,059 (49.5%) |
| 6 or 7 Rooms | 8,127 (32.4%) | 3,929 (12.9%) |
| 8 or more Rooms | 3,946 (15.7%) | 877 (2.9%) |
| Total | 25,118 (100.0%) | 30,432 (100.0%) |
Housing Structure by Heating Type in Bridgeport
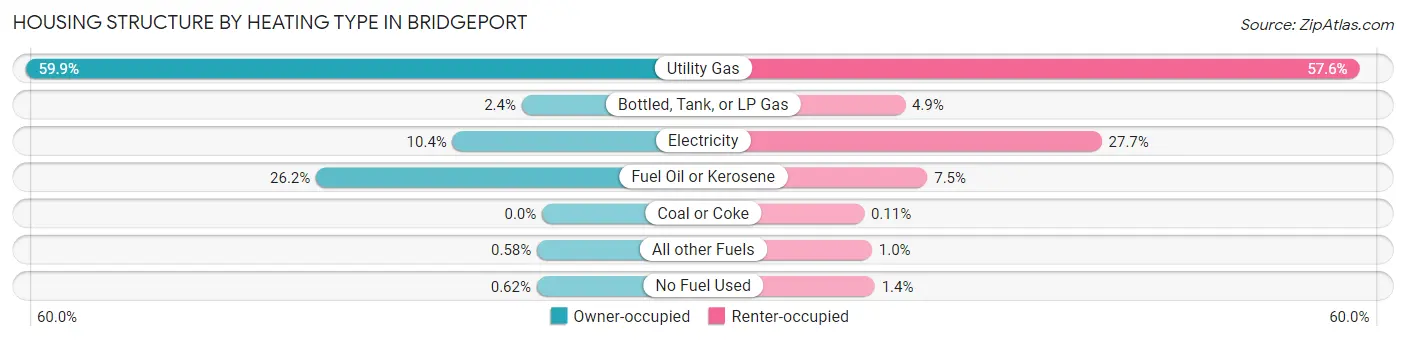
| Heating Type | Owner-occupied | Renter-occupied |
| Utility Gas | 15,041 (59.9%) | 17,514 (57.6%) |
| Bottled, Tank, or LP Gas | 591 (2.4%) | 1,478 (4.9%) |
| Electricity | 2,605 (10.4%) | 8,419 (27.7%) |
| Fuel Oil or Kerosene | 6,580 (26.2%) | 2,266 (7.4%) |
| Coal or Coke | 0 (0.0%) | 33 (0.1%) |
| All other Fuels | 146 (0.6%) | 311 (1.0%) |
| No Fuel Used | 155 (0.6%) | 411 (1.3%) |
| Total | 25,118 (100.0%) | 30,432 (100.0%) |
Household Vehicle Usage in Bridgeport
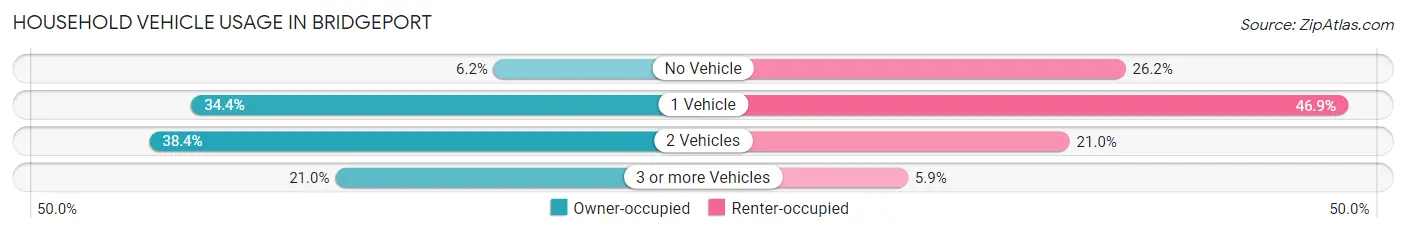
| Vehicles per Household | Owner-occupied | Renter-occupied |
| No Vehicle | 1,559 (6.2%) | 7,972 (26.2%) |
| 1 Vehicle | 8,649 (34.4%) | 14,284 (46.9%) |
| 2 Vehicles | 9,634 (38.4%) | 6,386 (21.0%) |
| 3 or more Vehicles | 5,276 (21.0%) | 1,790 (5.9%) |
| Total | 25,118 (100.0%) | 30,432 (100.0%) |
Real Estate & Mortgages in Bridgeport
Real Estate and Mortgage Overview in Bridgeport
| Characteristic | Without Mortgage | With Mortgage |
| Housing Units | 9,074 | 16,044 |
| Median Property Value | $204,100 | $234,600 |
| Median Household Income | $57,686 | $3,593 |
| Monthly Housing Costs | $997 | $2,594 |
| Real Estate Taxes | $5,750 | $586 |
Property Value by Mortgage Status in Bridgeport
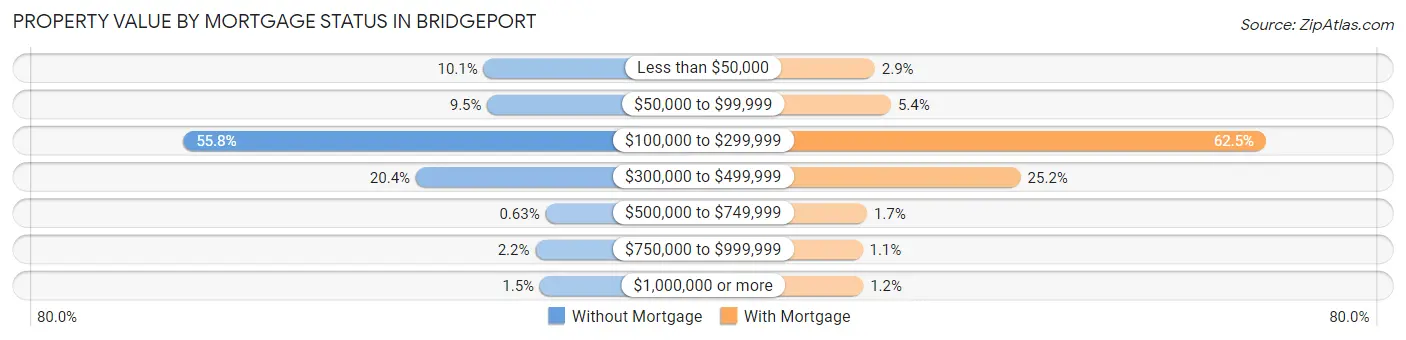
| Property Value | Without Mortgage | With Mortgage |
| Less than $50,000 | 913 (10.1%) | 472 (2.9%) |
| $50,000 to $99,999 | 860 (9.5%) | 866 (5.4%) |
| $100,000 to $299,999 | 5,065 (55.8%) | 10,032 (62.5%) |
| $300,000 to $499,999 | 1,848 (20.4%) | 4,037 (25.2%) |
| $500,000 to $749,999 | 57 (0.6%) | 279 (1.7%) |
| $750,000 to $999,999 | 198 (2.2%) | 170 (1.1%) |
| $1,000,000 or more | 133 (1.5%) | 188 (1.2%) |
| Total | 9,074 (100.0%) | 16,044 (100.0%) |
Household Income by Mortgage Status in Bridgeport
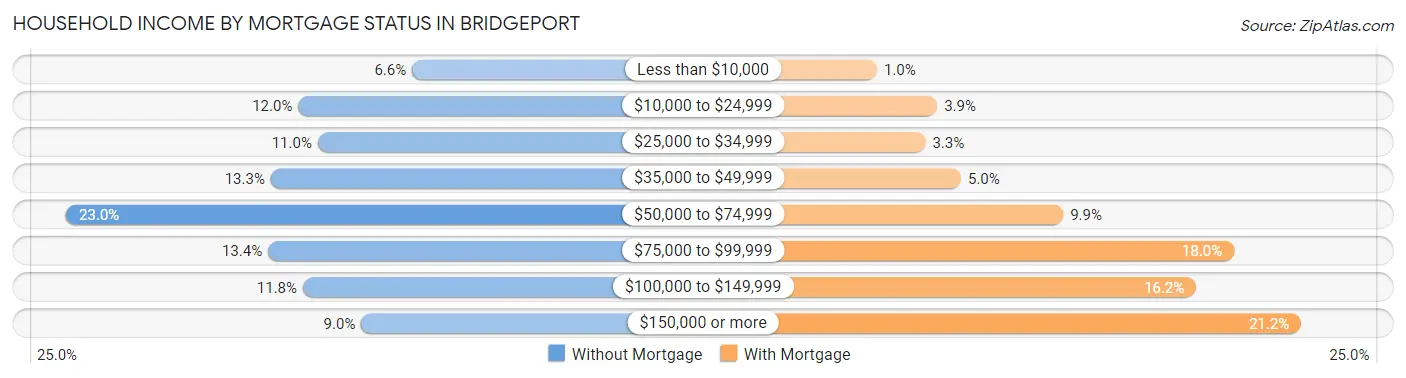
| Household Income | Without Mortgage | With Mortgage |
| Less than $10,000 | 594 (6.6%) | 164 (1.0%) |
| $10,000 to $24,999 | 1,086 (12.0%) | 624 (3.9%) |
| $25,000 to $34,999 | 1,002 (11.0%) | 535 (3.3%) |
| $35,000 to $49,999 | 1,205 (13.3%) | 806 (5.0%) |
| $50,000 to $74,999 | 2,090 (23.0%) | 1,587 (9.9%) |
| $75,000 to $99,999 | 1,217 (13.4%) | 2,891 (18.0%) |
| $100,000 to $149,999 | 1,066 (11.7%) | 2,603 (16.2%) |
| $150,000 or more | 814 (9.0%) | 3,405 (21.2%) |
| Total | 9,074 (100.0%) | 16,044 (100.0%) |
Property Value to Household Income Ratio in Bridgeport
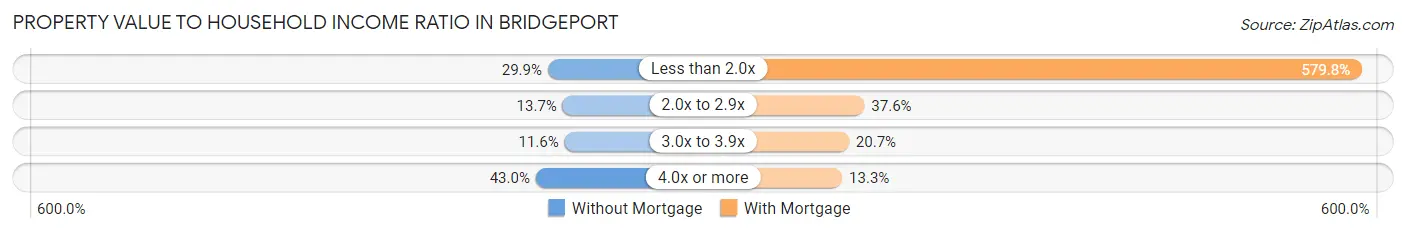
| Value-to-Income Ratio | Without Mortgage | With Mortgage |
| Less than 2.0x | 2,710 (29.9%) | 93,018 (579.8%) |
| 2.0x to 2.9x | 1,245 (13.7%) | 6,028 (37.6%) |
| 3.0x to 3.9x | 1,056 (11.6%) | 3,316 (20.7%) |
| 4.0x or more | 3,904 (43.0%) | 2,136 (13.3%) |
| Total | 9,074 (100.0%) | 16,044 (100.0%) |
Real Estate Taxes by Mortgage Status in Bridgeport
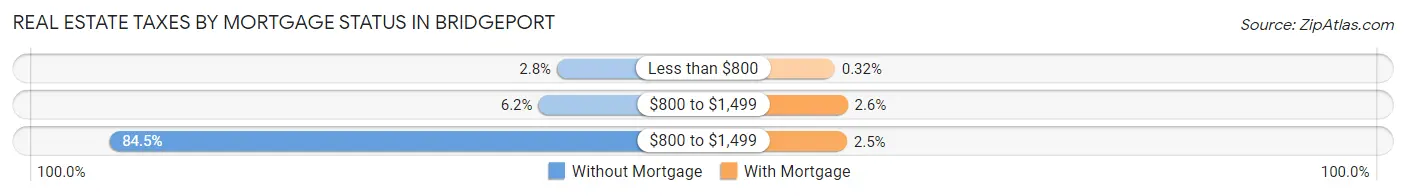
| Property Taxes | Without Mortgage | With Mortgage |
| Less than $800 | 251 (2.8%) | 51 (0.3%) |
| $800 to $1,499 | 559 (6.2%) | 424 (2.6%) |
| $800 to $1,499 | 7,671 (84.5%) | 404 (2.5%) |
| Total | 9,074 (100.0%) | 16,044 (100.0%) |
Health & Disability in Bridgeport
Health Insurance Coverage by Age in Bridgeport
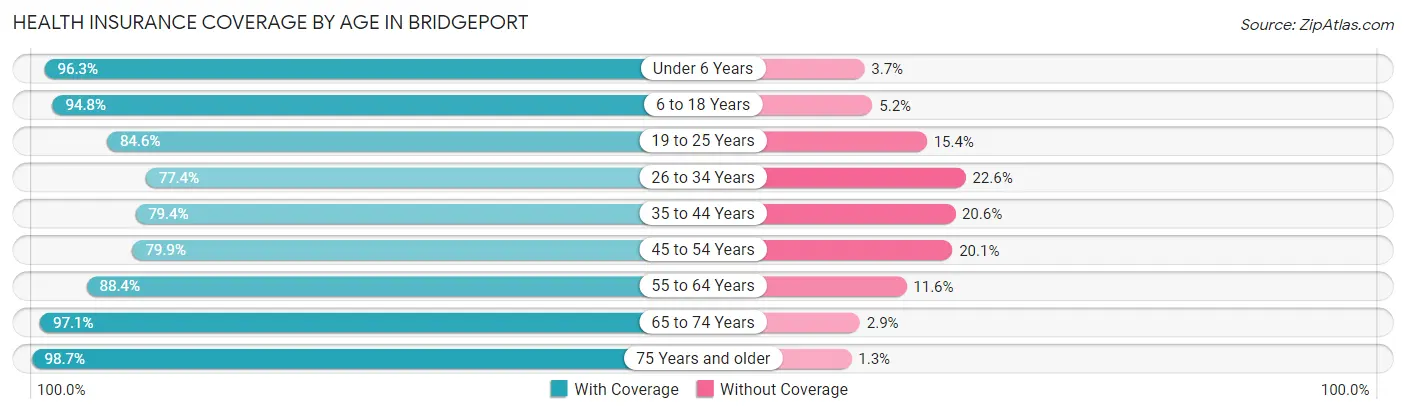
| Age Bracket | With Coverage | Without Coverage |
| Under 6 Years | 9,453 (96.3%) | 367 (3.7%) |
| 6 to 18 Years | 21,850 (94.8%) | 1,207 (5.2%) |
| 19 to 25 Years | 14,230 (84.6%) | 2,585 (15.4%) |
| 26 to 34 Years | 14,782 (77.4%) | 4,315 (22.6%) |
| 35 to 44 Years | 16,314 (79.4%) | 4,242 (20.6%) |
| 45 to 54 Years | 14,887 (79.9%) | 3,751 (20.1%) |
| 55 to 64 Years | 17,133 (88.4%) | 2,241 (11.6%) |
| 65 to 74 Years | 11,181 (97.1%) | 334 (2.9%) |
| 75 Years and older | 8,015 (98.7%) | 106 (1.3%) |
| Total | 127,845 (87.0%) | 19,148 (13.0%) |
Health Insurance Coverage by Citizenship Status in Bridgeport
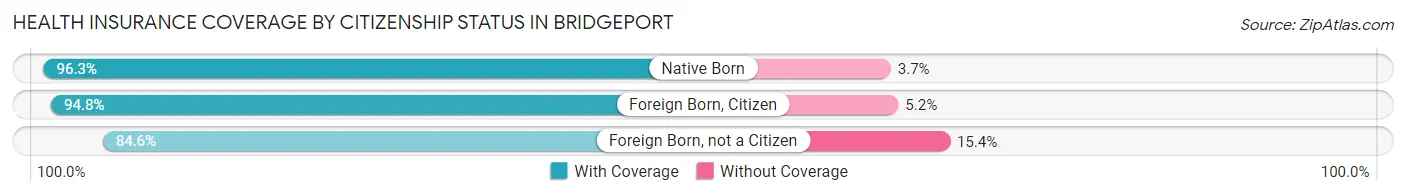
| Citizenship Status | With Coverage | Without Coverage |
| Native Born | 9,453 (96.3%) | 367 (3.7%) |
| Foreign Born, Citizen | 21,850 (94.8%) | 1,207 (5.2%) |
| Foreign Born, not a Citizen | 14,230 (84.6%) | 2,585 (15.4%) |
Health Insurance Coverage by Household Income in Bridgeport
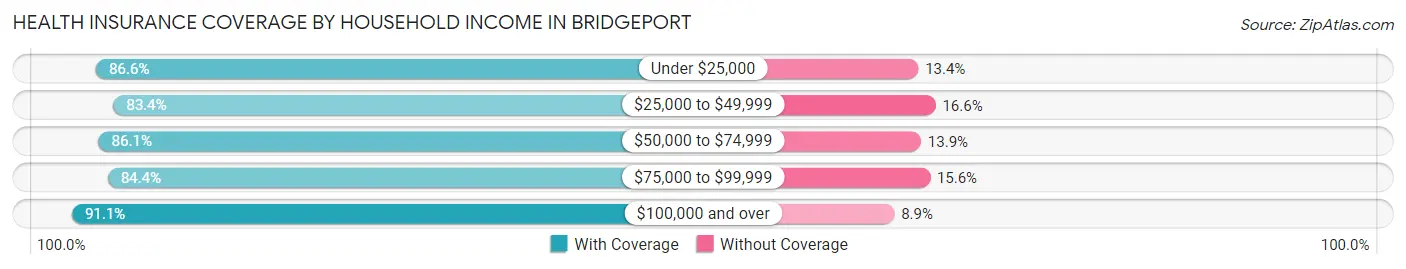
| Household Income | With Coverage | Without Coverage |
| Under $25,000 | 22,581 (86.6%) | 3,487 (13.4%) |
| $25,000 to $49,999 | 24,425 (83.4%) | 4,867 (16.6%) |
| $50,000 to $74,999 | 22,446 (86.1%) | 3,618 (13.9%) |
| $75,000 to $99,999 | 16,939 (84.4%) | 3,127 (15.6%) |
| $100,000 and over | 38,847 (91.1%) | 3,787 (8.9%) |
Public vs Private Health Insurance Coverage by Age in Bridgeport
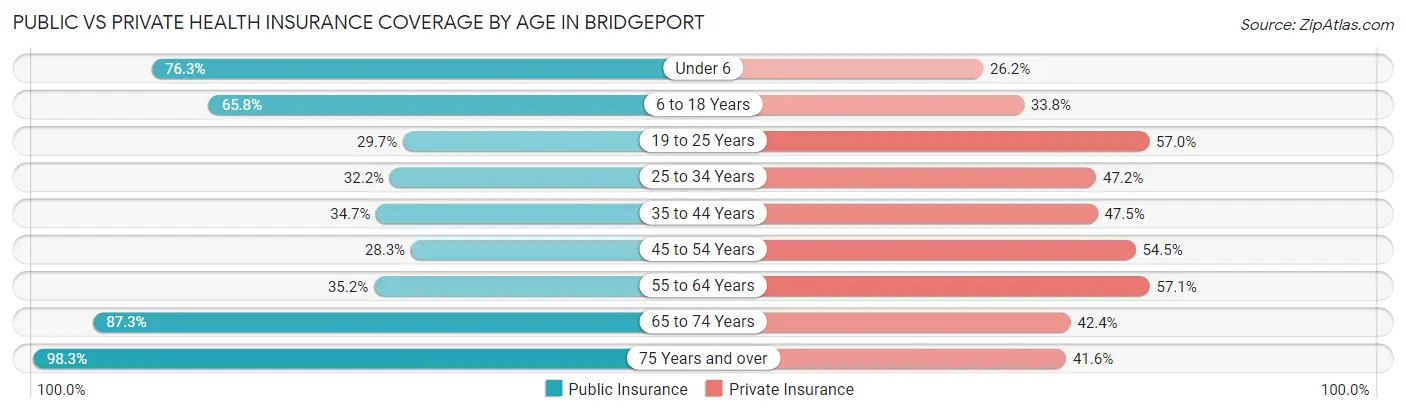
| Age Bracket | Public Insurance | Private Insurance |
| Under 6 | 7,497 (76.3%) | 2,575 (26.2%) |
| 6 to 18 Years | 15,171 (65.8%) | 7,791 (33.8%) |
| 19 to 25 Years | 5,001 (29.7%) | 9,592 (57.0%) |
| 25 to 34 Years | 6,147 (32.2%) | 9,013 (47.2%) |
| 35 to 44 Years | 7,137 (34.7%) | 9,756 (47.5%) |
| 45 to 54 Years | 5,273 (28.3%) | 10,160 (54.5%) |
| 55 to 64 Years | 6,810 (35.1%) | 11,069 (57.1%) |
| 65 to 74 Years | 10,047 (87.3%) | 4,887 (42.4%) |
| 75 Years and over | 7,982 (98.3%) | 3,379 (41.6%) |
| Total | 71,065 (48.3%) | 68,222 (46.4%) |
Disability Status by Sex by Age in Bridgeport
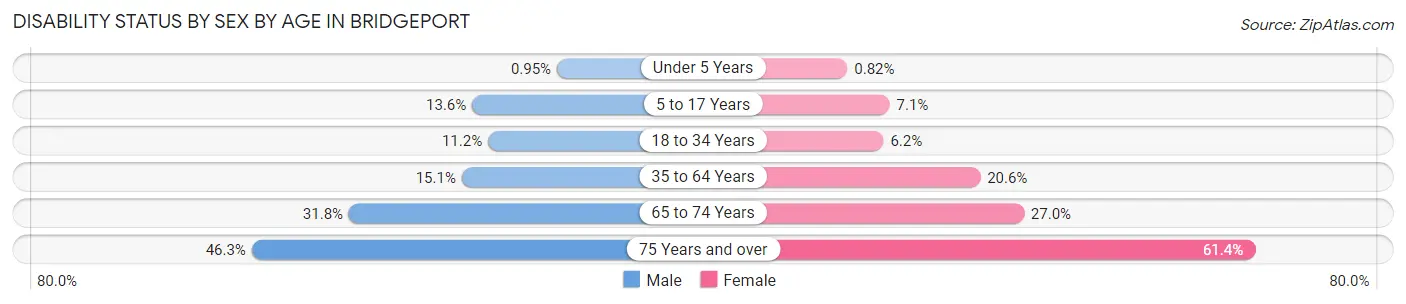
| Age Bracket | Male | Female |
| Under 5 Years | 39 (0.9%) | 35 (0.8%) |
| 5 to 17 Years | 1,557 (13.6%) | 778 (7.1%) |
| 18 to 34 Years | 2,031 (11.2%) | 1,229 (6.2%) |
| 35 to 64 Years | 4,361 (15.1%) | 6,097 (20.5%) |
| 65 to 74 Years | 1,720 (31.8%) | 1,653 (27.0%) |
| 75 Years and over | 1,476 (46.3%) | 3,026 (61.4%) |
Disability Class by Sex by Age in Bridgeport
Disability Class: Hearing Difficulty
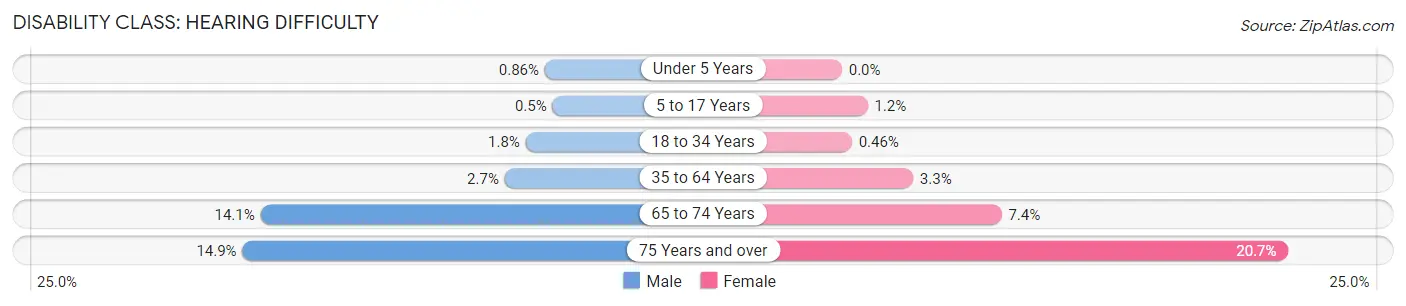
| Age Bracket | Male | Female |
| Under 5 Years | 35 (0.9%) | 0 (0.0%) |
| 5 to 17 Years | 57 (0.5%) | 130 (1.2%) |
| 18 to 34 Years | 318 (1.8%) | 92 (0.5%) |
| 35 to 64 Years | 787 (2.7%) | 978 (3.3%) |
| 65 to 74 Years | 759 (14.1%) | 453 (7.4%) |
| 75 Years and over | 475 (14.9%) | 1,022 (20.7%) |
Disability Class: Vision Difficulty
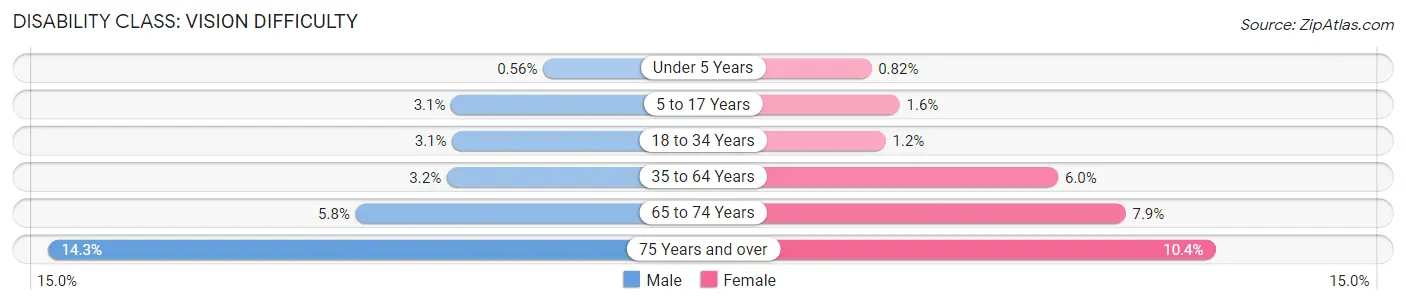
| Age Bracket | Male | Female |
| Under 5 Years | 23 (0.6%) | 35 (0.8%) |
| 5 to 17 Years | 359 (3.1%) | 176 (1.6%) |
| 18 to 34 Years | 561 (3.1%) | 242 (1.2%) |
| 35 to 64 Years | 935 (3.2%) | 1,785 (6.0%) |
| 65 to 74 Years | 312 (5.8%) | 483 (7.9%) |
| 75 Years and over | 457 (14.3%) | 513 (10.4%) |
Disability Class: Cognitive Difficulty
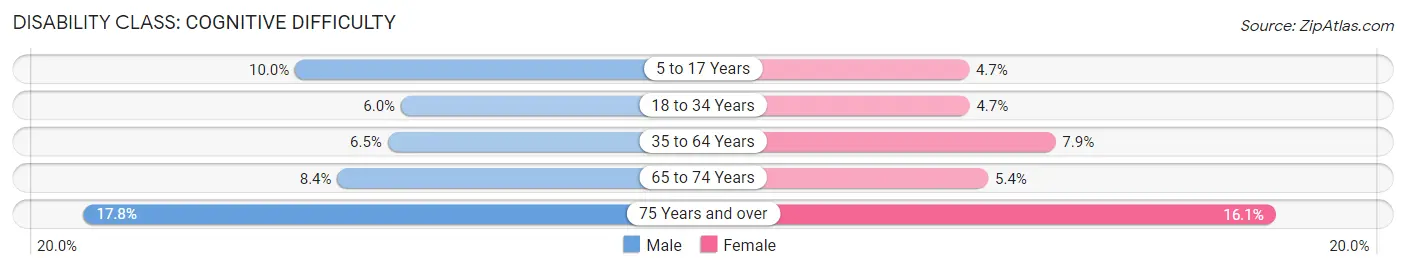
| Age Bracket | Male | Female |
| 5 to 17 Years | 1,145 (10.0%) | 518 (4.7%) |
| 18 to 34 Years | 1,094 (6.0%) | 941 (4.7%) |
| 35 to 64 Years | 1,884 (6.5%) | 2,353 (7.9%) |
| 65 to 74 Years | 453 (8.4%) | 332 (5.4%) |
| 75 Years and over | 568 (17.8%) | 794 (16.1%) |
Disability Class: Ambulatory Difficulty
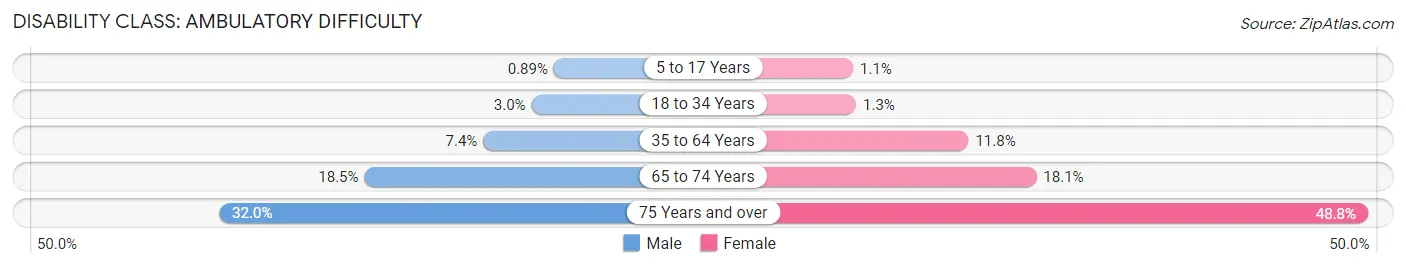
| Age Bracket | Male | Female |
| 5 to 17 Years | 102 (0.9%) | 115 (1.1%) |
| 18 to 34 Years | 538 (3.0%) | 265 (1.3%) |
| 35 to 64 Years | 2,151 (7.4%) | 3,490 (11.8%) |
| 65 to 74 Years | 998 (18.5%) | 1,104 (18.1%) |
| 75 Years and over | 1,019 (32.0%) | 2,408 (48.8%) |
Disability Class: Self-Care Difficulty
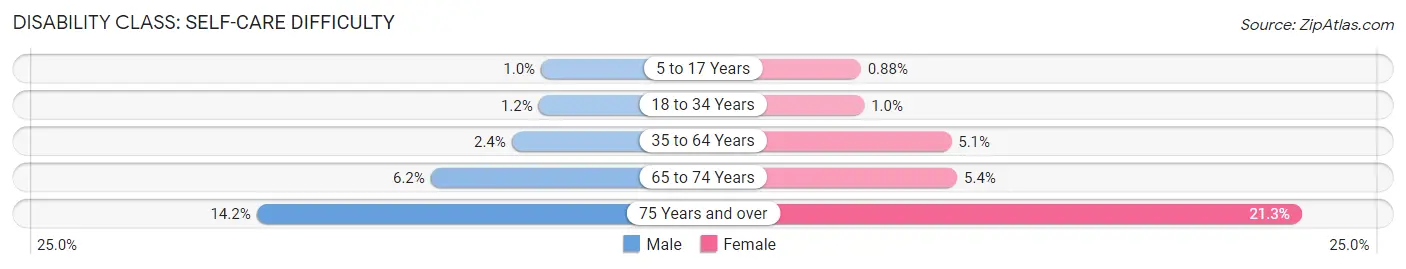
| Age Bracket | Male | Female |
| 5 to 17 Years | 119 (1.0%) | 96 (0.9%) |
| 18 to 34 Years | 209 (1.1%) | 207 (1.0%) |
| 35 to 64 Years | 695 (2.4%) | 1,508 (5.1%) |
| 65 to 74 Years | 333 (6.2%) | 327 (5.3%) |
| 75 Years and over | 454 (14.2%) | 1,052 (21.3%) |
Technology Access in Bridgeport
Computing Device Access in Bridgeport
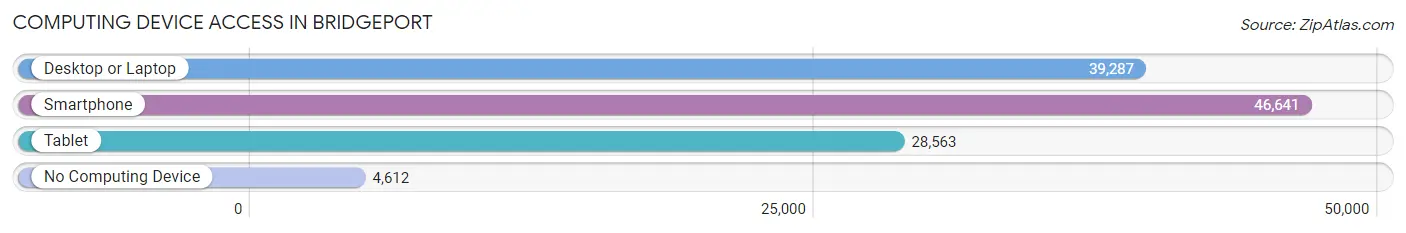
| Device Type | # Households | % Households |
| Desktop or Laptop | 39,287 | 70.7% |
| Smartphone | 46,641 | 84.0% |
| Tablet | 28,563 | 51.4% |
| No Computing Device | 4,612 | 8.3% |
| Total | 55,550 | 100.0% |
Internet Access in Bridgeport
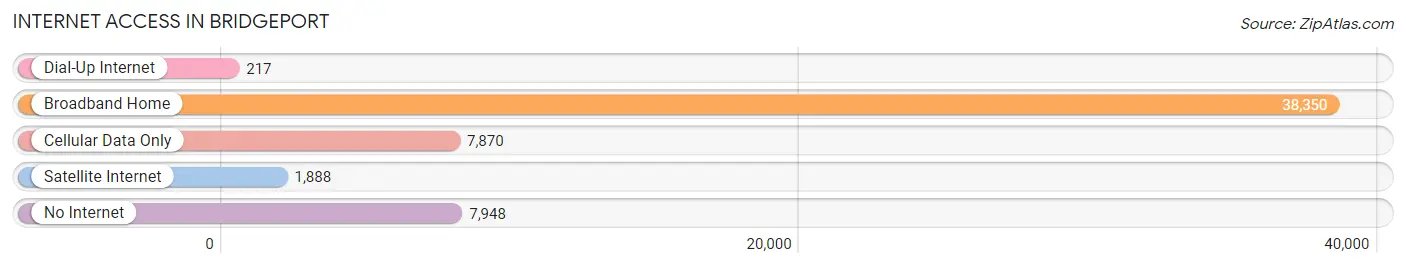
| Internet Type | # Households | % Households |
| Dial-Up Internet | 217 | 0.4% |
| Broadband Home | 38,350 | 69.0% |
| Cellular Data Only | 7,870 | 14.2% |
| Satellite Internet | 1,888 | 3.4% |
| No Internet | 7,948 | 14.3% |
| Total | 55,550 | 100.0% |
Bridgeport Summary
Bridgeport, Connecticut is a city located in Fairfield County, Connecticut. It is the largest city in the state and the fifth-largest city in New England. The city is situated on the Long Island Sound and is part of the Greater Bridgeport metropolitan area. As of the 2010 census, the city had a population of 144,229, making it the largest city in Connecticut.
History
The area that is now Bridgeport was originally inhabited by the Paugussett Native American tribe. The first European settlers arrived in the area in 1639, and the area was officially incorporated as the Town of Bridgeport in 1821. The city was named after the first bridge built over the Pequonnock River in 1798.
In the 19th century, Bridgeport became an important industrial center, with a number of factories and shipyards. The city was also a major port, with ships carrying goods to and from Europe and the Caribbean. The city's economy was further bolstered by the opening of the Bridgeport and Port Jefferson Steamboat Company in 1883, which provided regular ferry service to Long Island.
In the early 20th century, Bridgeport was a major center of the American manufacturing industry, with companies such as Remington Arms, Sikorsky Aircraft, and General Electric all having factories in the city. The city was also home to the first ever radio broadcast, which was made by inventor Lee de Forest in 1916.
Geography
Bridgeport is located in Fairfield County, Connecticut, at the mouth of the Pequonnock River. The city is situated on the Long Island Sound, and is part of the Greater Bridgeport metropolitan area. The city covers an area of 19.4 square miles, with a population density of 7,400 people per square mile.
The city is divided into several neighborhoods, including the East Side, West Side, North End, South End, and Downtown. The city is also home to several parks, including Beardsley Park, Seaside Park, and St. Mary's by the Sea.
Economy
Bridgeport's economy is largely based on manufacturing, with a number of factories and shipyards located in the city. The city is also home to several corporate headquarters, including People's United Bank, Webster Bank, and the United Illuminating Company.
The city is also home to several educational institutions, including the University of Bridgeport, Housatonic Community College, and the Bridgeport Hospital School of Nursing.
Demographics
As of the 2010 census, the city had a population of 144,229, with a population density of 7,400 people per square mile. The racial makeup of the city was 57.2% White, 28.2% African American, 0.5% Native American, 3.2% Asian, 0.1% Pacific Islander, 8.3% from other races, and 2.5% from two or more races. Hispanic or Latino of any race were 22.2% of the population.
The median income for a household in the city was $37,817, and the median income for a family was $45,859. The per capita income for the city was $20,845. About 17.2% of families and 20.7% of the population were below the poverty line, including 28.9% of those under age 18 and 13.2% of those age 65 or over.
Common Questions
What is Per Capita Income in Bridgeport?
Per Capita income in Bridgeport is $29,506.
What is the Median Family Income in Bridgeport?
Median Family Income in Bridgeport is $66,944.
What is the Median Household income in Bridgeport?
Median Household Income in Bridgeport is $54,440.
What is Income or Wage Gap in Bridgeport?
Income or Wage Gap in Bridgeport is 25.2%.
Women in Bridgeport earn 74.8 cents for every dollar earned by a man.
What is Family Income Deficit in Bridgeport?
Family Income Deficit in Bridgeport is $10,970.
Families that are below poverty line in Bridgeport earn $10,970 less on average than the poverty threshold level.
What is Inequality or Gini Index in Bridgeport?
Inequality or Gini Index in Bridgeport is 0.48.
What is the Total Population of Bridgeport?
Total Population of Bridgeport is 148,470.
What is the Total Male Population of Bridgeport?
Total Male Population of Bridgeport is 72,315.
What is the Total Female Population of Bridgeport?
Total Female Population of Bridgeport is 76,155.
What is the Ratio of Males per 100 Females in Bridgeport?
There are 94.96 Males per 100 Females in Bridgeport.
What is the Ratio of Females per 100 Males in Bridgeport?
There are 105.31 Females per 100 Males in Bridgeport.
What is the Median Population Age in Bridgeport?
Median Population Age in Bridgeport is 37.5 Years.
What is the Average Family Size in Bridgeport
Average Family Size in Bridgeport is 3.4 People.
What is the Average Household Size in Bridgeport
Average Household Size in Bridgeport is 2.6 People.
How Large is the Labor Force in Bridgeport?
There are 79,813 People in the Labor Forcein in Bridgeport.
What is the Percentage of People in the Labor Force in Bridgeport?
65.9% of People are in the Labor Force in Bridgeport.
What is the Unemployment Rate in Bridgeport?
Unemployment Rate in Bridgeport is 9.5%.