Lake Oswego, OR Map & Demographics
Lake Oswego Map
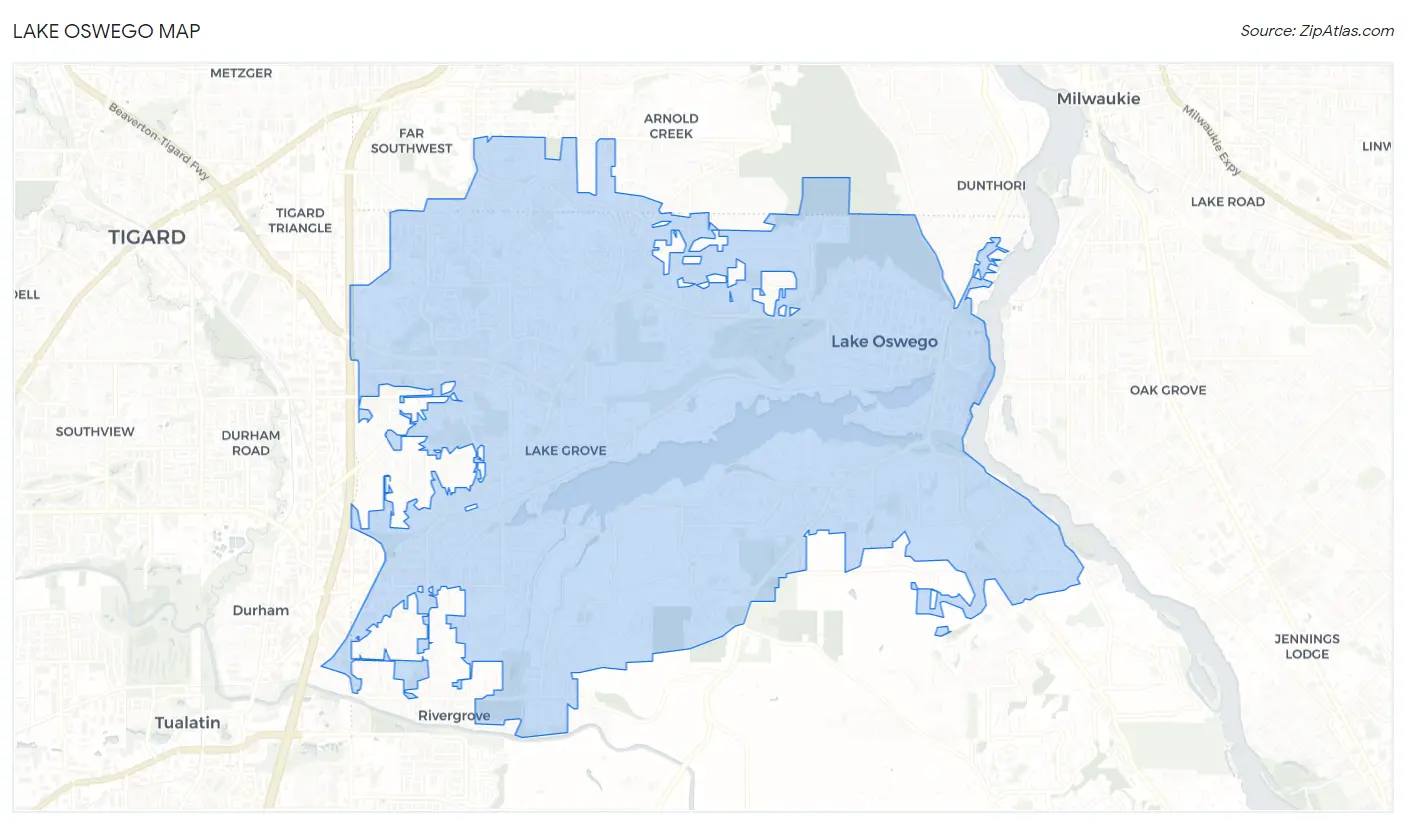
Lake Oswego Overview
$82,157
PER CAPITA INCOME
$166,154
AVG FAMILY INCOME
$127,252
AVG HOUSEHOLD INCOME
35.2%
WAGE / INCOME GAP [ % ]
64.8¢/ $1
WAGE / INCOME GAP [ $ ]
0.50
INEQUALITY / GINI INDEX
40,457
TOTAL POPULATION
20,695
MALE POPULATION
19,762
FEMALE POPULATION
104.72
MALES / 100 FEMALES
95.49
FEMALES / 100 MALES
45.8
MEDIAN AGE
2.9
AVG FAMILY SIZE
2.4
AVG HOUSEHOLD SIZE
19,927
LABOR FORCE [ PEOPLE ]
61.2%
PERCENT IN LABOR FORCE
4.6%
UNEMPLOYMENT RATE
Lake Oswego Area Codes
Income in Lake Oswego
Income Overview in Lake Oswego
Per Capita Income in Lake Oswego is $82,157, while median incomes of families and households are $166,154 and $127,252 respectively.
| Characteristic | Number | Measure |
| Per Capita Income | 40,457 | $82,157 |
| Median Family Income | 11,272 | $166,154 |
| Mean Family Income | 11,272 | $238,864 |
| Median Household Income | 16,649 | $127,252 |
| Mean Household Income | 16,649 | $195,728 |
| Income Deficit | 11,272 | $0 |
| Wage / Income Gap (%) | 40,457 | 35.15% |
| Wage / Income Gap ($) | 40,457 | 64.85¢ per $1 |
| Gini / Inequality Index | 40,457 | 0.50 |
Earnings by Sex in Lake Oswego
Average Earnings in Lake Oswego are $68,805, $86,159 for men and $55,872 for women, a difference of 35.1%.
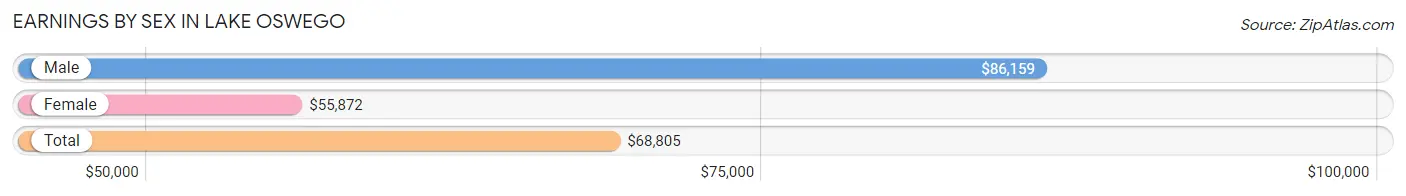
| Sex | Number | Average Earnings |
| Male | 11,766 (56.2%) | $86,159 |
| Female | 9,169 (43.8%) | $55,872 |
| Total | 20,935 (100.0%) | $68,805 |
Earnings by Sex by Income Bracket in Lake Oswego
The most common earnings brackets in Lake Oswego are $100,000+ for men (5,498 | 46.7%) and $100,000+ for women (2,325 | 25.4%).
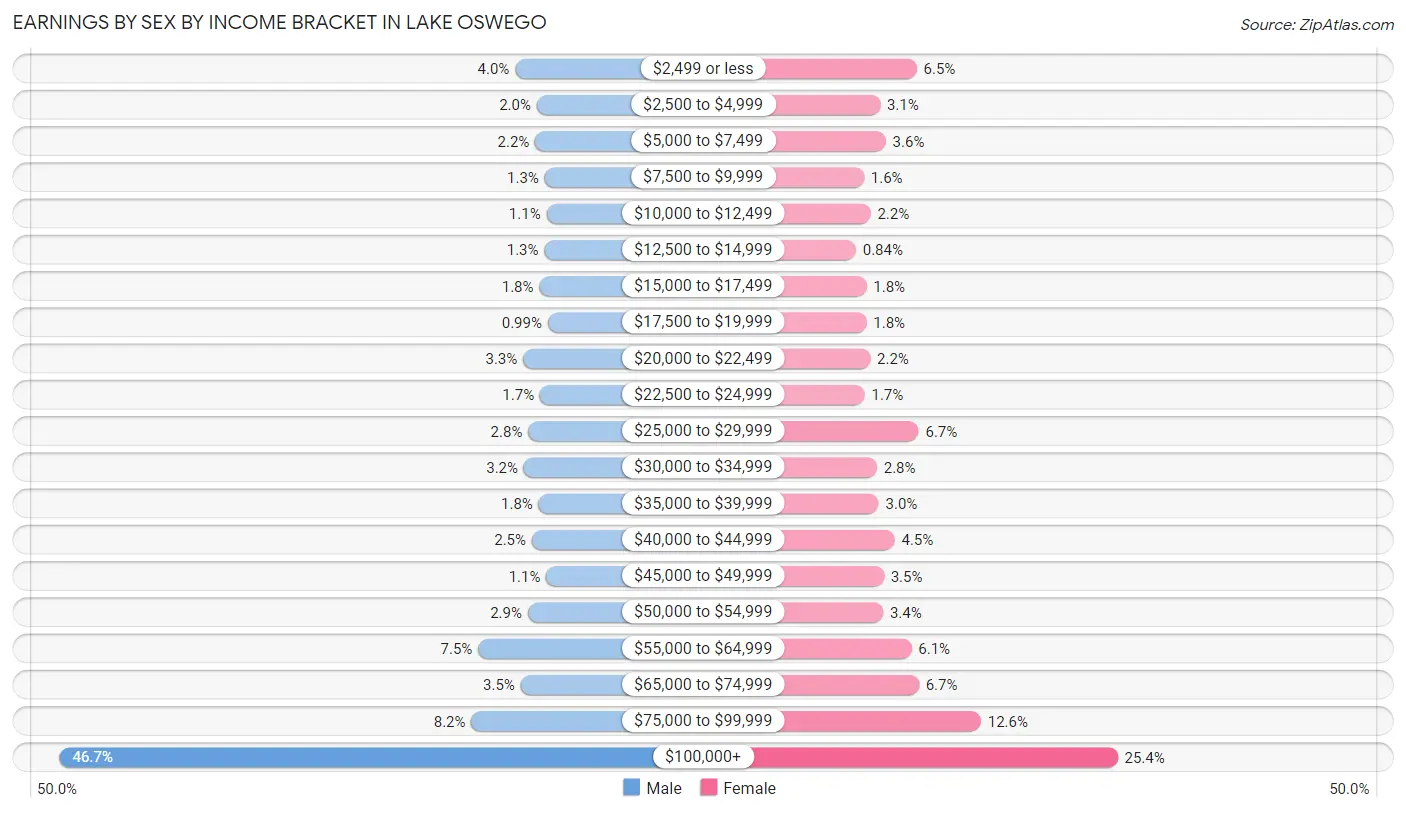
| Income | Male | Female |
| $2,499 or less | 475 (4.0%) | 600 (6.5%) |
| $2,500 to $4,999 | 238 (2.0%) | 285 (3.1%) |
| $5,000 to $7,499 | 255 (2.2%) | 334 (3.6%) |
| $7,500 to $9,999 | 151 (1.3%) | 147 (1.6%) |
| $10,000 to $12,499 | 131 (1.1%) | 204 (2.2%) |
| $12,500 to $14,999 | 154 (1.3%) | 77 (0.8%) |
| $15,000 to $17,499 | 209 (1.8%) | 168 (1.8%) |
| $17,500 to $19,999 | 117 (1.0%) | 168 (1.8%) |
| $20,000 to $22,499 | 388 (3.3%) | 200 (2.2%) |
| $22,500 to $24,999 | 202 (1.7%) | 152 (1.7%) |
| $25,000 to $29,999 | 332 (2.8%) | 616 (6.7%) |
| $30,000 to $34,999 | 380 (3.2%) | 258 (2.8%) |
| $35,000 to $39,999 | 217 (1.8%) | 273 (3.0%) |
| $40,000 to $44,999 | 292 (2.5%) | 410 (4.5%) |
| $45,000 to $49,999 | 133 (1.1%) | 317 (3.5%) |
| $50,000 to $54,999 | 336 (2.9%) | 311 (3.4%) |
| $55,000 to $64,999 | 884 (7.5%) | 555 (6.0%) |
| $65,000 to $74,999 | 415 (3.5%) | 618 (6.7%) |
| $75,000 to $99,999 | 959 (8.2%) | 1,151 (12.6%) |
| $100,000+ | 5,498 (46.7%) | 2,325 (25.4%) |
| Total | 11,766 (100.0%) | 9,169 (100.0%) |
Earnings by Sex by Educational Attainment in Lake Oswego
Average earnings in Lake Oswego are $102,549 for men and $60,220 for women, a difference of 41.3%. Men with an educational attainment of graduate degree enjoy the highest average annual earnings of $155,870, while those with high school diploma education earn the least with $37,232. Women with an educational attainment of graduate degree earn the most with the average annual earnings of $84,654, while those with less than high school education have the smallest earnings of $2,499.
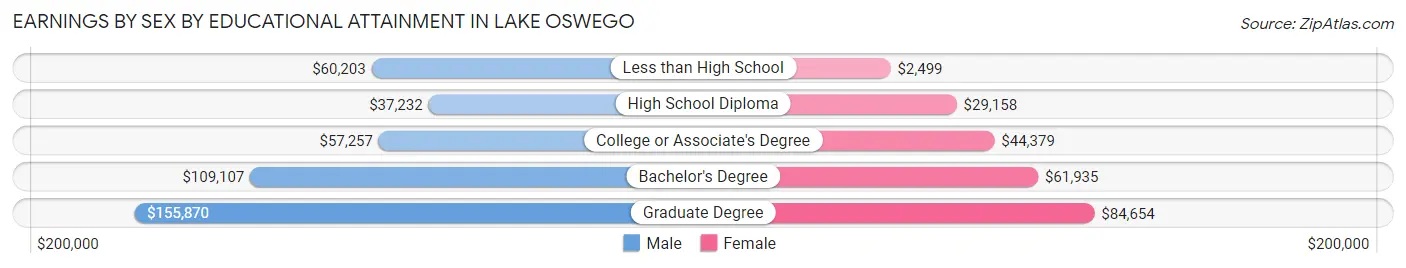
| Educational Attainment | Male Income | Female Income |
| Less than High School | $60,203 | $2,499 |
| High School Diploma | $37,232 | $29,158 |
| College or Associate's Degree | $57,257 | $44,379 |
| Bachelor's Degree | $109,107 | $61,935 |
| Graduate Degree | $155,870 | $84,654 |
| Total | $102,549 | $60,220 |
Family Income in Lake Oswego
Family Income Brackets in Lake Oswego
According to the Lake Oswego family income data, there are 4,633 families falling into the $200,000+ income range, which is the most common income bracket and makes up 41.1% of all families. Conversely, the $10,000 to $14,999 income bracket is the least frequent group with only 79 families (0.7%) belonging to this category.
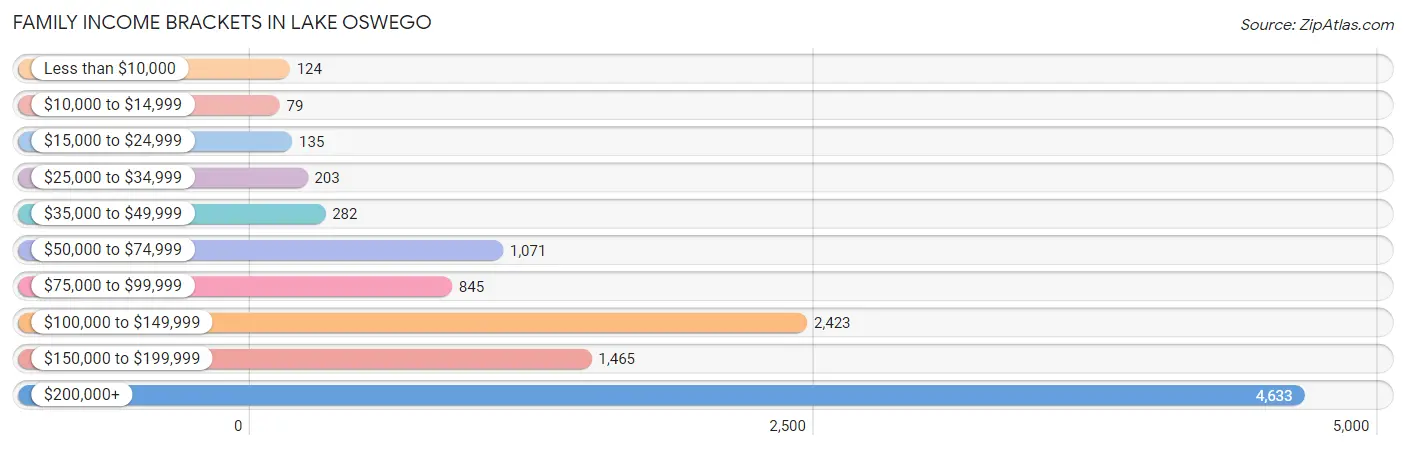
| Income Bracket | # Families | % Families |
| Less than $10,000 | 124 | 1.1% |
| $10,000 to $14,999 | 79 | 0.7% |
| $15,000 to $24,999 | 135 | 1.2% |
| $25,000 to $34,999 | 203 | 1.8% |
| $35,000 to $49,999 | 282 | 2.5% |
| $50,000 to $74,999 | 1,071 | 9.5% |
| $75,000 to $99,999 | 845 | 7.5% |
| $100,000 to $149,999 | 2,423 | 21.5% |
| $150,000 to $199,999 | 1,465 | 13.0% |
| $200,000+ | 4,633 | 41.1% |
Family Income by Famaliy Size in Lake Oswego
6-person families (201 | 1.8%) account for the highest median family income in Lake Oswego with $250,001 per family, while 2-person families (5,569 | 49.4%) have the highest median income of $66,710 per family member.
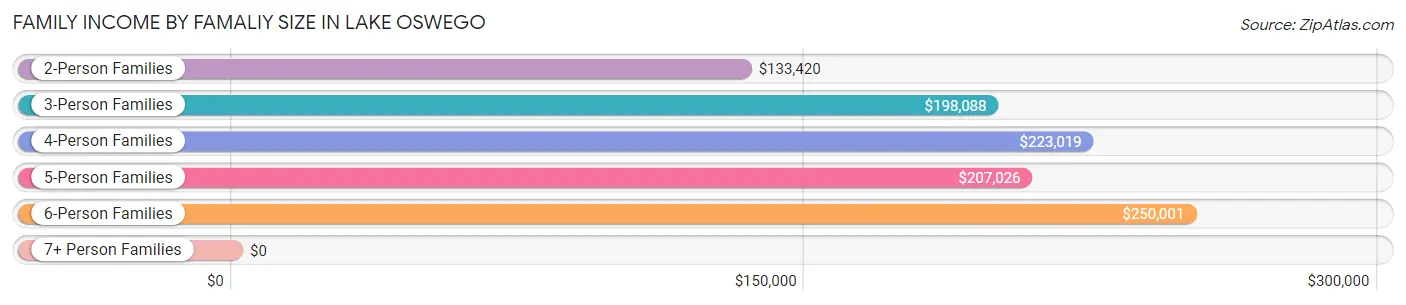
| Income Bracket | # Families | Median Income |
| 2-Person Families | 5,569 (49.4%) | $133,420 |
| 3-Person Families | 2,406 (21.3%) | $198,088 |
| 4-Person Families | 2,579 (22.9%) | $223,019 |
| 5-Person Families | 517 (4.6%) | $207,026 |
| 6-Person Families | 201 (1.8%) | $250,001 |
| 7+ Person Families | 0 (0.0%) | $0 |
| Total | 11,272 (100.0%) | $166,154 |
Family Income by Number of Earners in Lake Oswego
The median family income in Lake Oswego is $166,154, with families comprising 3+ earners (730) having the highest median family income of $233,750, while families with no earners (1,814) have the lowest median family income of $95,179, accounting for 6.5% and 16.1% of families, respectively.
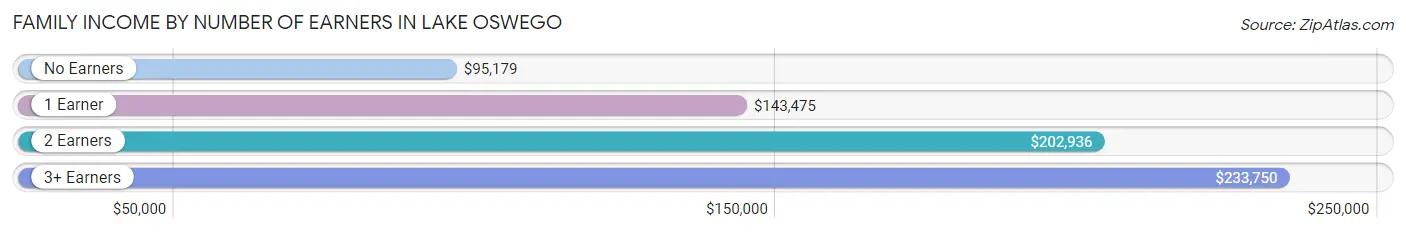
| Number of Earners | # Families | Median Income |
| No Earners | 1,814 (16.1%) | $95,179 |
| 1 Earner | 3,699 (32.8%) | $143,475 |
| 2 Earners | 5,029 (44.6%) | $202,936 |
| 3+ Earners | 730 (6.5%) | $233,750 |
| Total | 11,272 (100.0%) | $166,154 |
Household Income in Lake Oswego
Household Income Brackets in Lake Oswego
With 5,211 households falling in the category, the $200,000+ income range is the most frequent in Lake Oswego, accounting for 31.3% of all households. In contrast, only 250 households (1.5%) fall into the $10,000 to $14,999 income bracket, making it the least populous group.
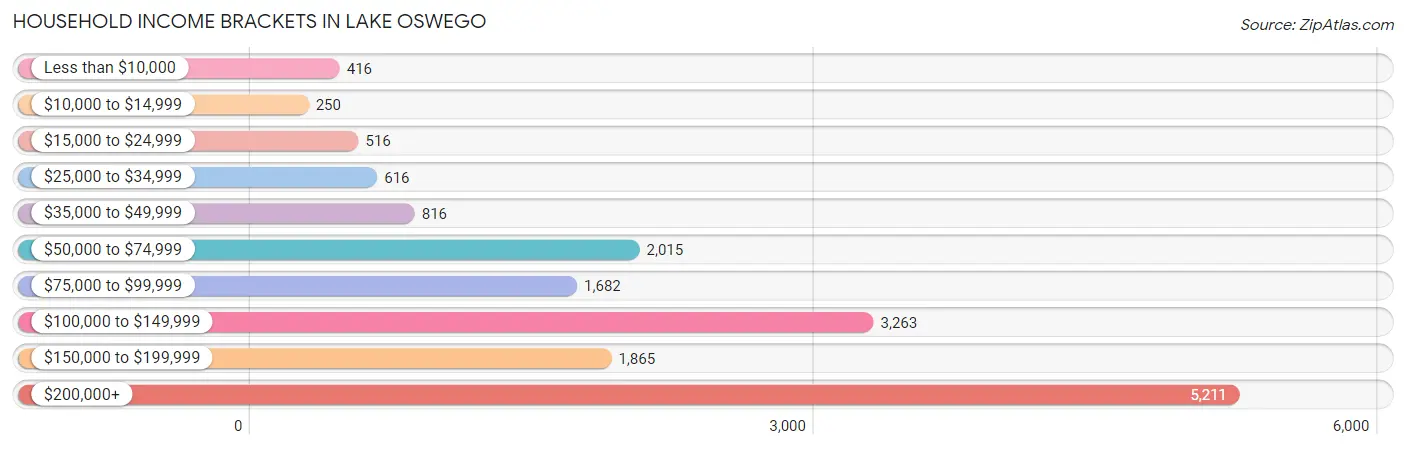
| Income Bracket | # Households | % Households |
| Less than $10,000 | 416 | 2.5% |
| $10,000 to $14,999 | 250 | 1.5% |
| $15,000 to $24,999 | 516 | 3.1% |
| $25,000 to $34,999 | 616 | 3.7% |
| $35,000 to $49,999 | 816 | 4.9% |
| $50,000 to $74,999 | 2,015 | 12.1% |
| $75,000 to $99,999 | 1,682 | 10.1% |
| $100,000 to $149,999 | 3,263 | 19.6% |
| $150,000 to $199,999 | 1,865 | 11.2% |
| $200,000+ | 5,211 | 31.3% |
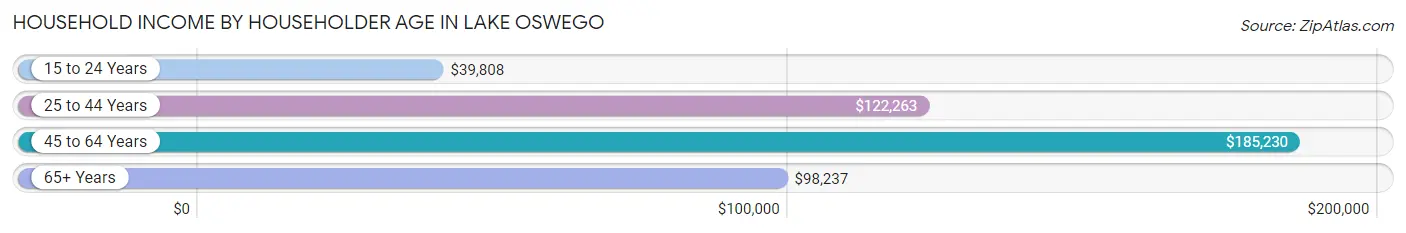
Household Income by Householder Age in Lake Oswego
The median household income in Lake Oswego is $127,252, with the highest median household income of $185,230 found in the 45 to 64 years age bracket for the primary householder. A total of 6,597 households (39.6%) fall into this category. Meanwhile, the 15 to 24 years age bracket for the primary householder has the lowest median household income of $39,808, with 202 households (1.2%) in this group.
| Income Bracket | # Households | Median Income |
| 15 to 24 Years | 202 (1.2%) | $39,808 |
| 25 to 44 Years | 4,085 (24.5%) | $122,263 |
| 45 to 64 Years | 6,597 (39.6%) | $185,230 |
| 65+ Years | 5,765 (34.6%) | $98,237 |
| Total | 16,649 (100.0%) | $127,252 |
Poverty in Lake Oswego
Income Below Poverty by Sex and Age in Lake Oswego
With 3.3% poverty level for males and 4.6% for females among the residents of Lake Oswego, 16 and 17 year old males and 5 year old females are the most vulnerable to poverty, with 80 males (10.4%) and 32 females (15.2%) in their respective age groups living below the poverty level.
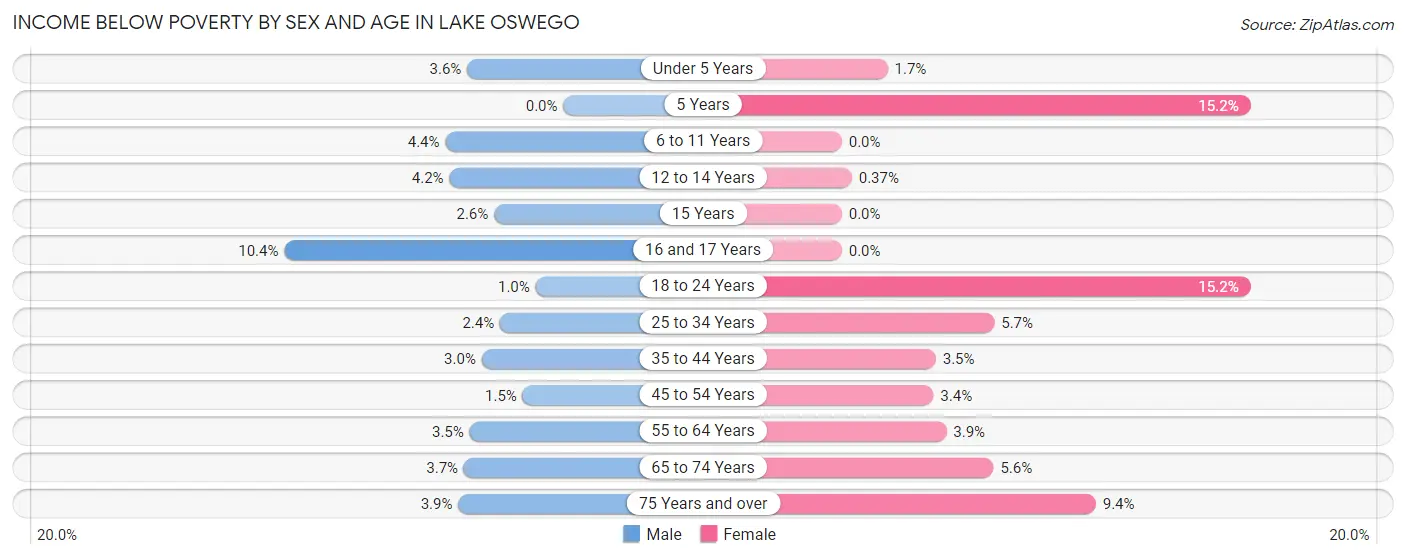
| Age Bracket | Male | Female |
| Under 5 Years | 38 (3.6%) | 16 (1.7%) |
| 5 Years | 0 (0.0%) | 32 (15.2%) |
| 6 to 11 Years | 71 (4.4%) | 0 (0.0%) |
| 12 to 14 Years | 44 (4.2%) | 4 (0.4%) |
| 15 Years | 10 (2.6%) | 0 (0.0%) |
| 16 and 17 Years | 80 (10.4%) | 0 (0.0%) |
| 18 to 24 Years | 11 (1.0%) | 110 (15.2%) |
| 25 to 34 Years | 50 (2.4%) | 93 (5.7%) |
| 35 to 44 Years | 75 (3.0%) | 92 (3.5%) |
| 45 to 54 Years | 46 (1.5%) | 103 (3.4%) |
| 55 to 64 Years | 95 (3.5%) | 110 (3.9%) |
| 65 to 74 Years | 94 (3.7%) | 166 (5.6%) |
| 75 Years and over | 56 (3.9%) | 178 (9.4%) |
| Total | 670 (3.3%) | 904 (4.6%) |
Income Above Poverty by Sex and Age in Lake Oswego
According to the poverty statistics in Lake Oswego, males aged 5 years and females aged 6 to 11 years are the age groups that are most secure financially, with 100.0% of males and 100.0% of females in these age groups living above the poverty line.
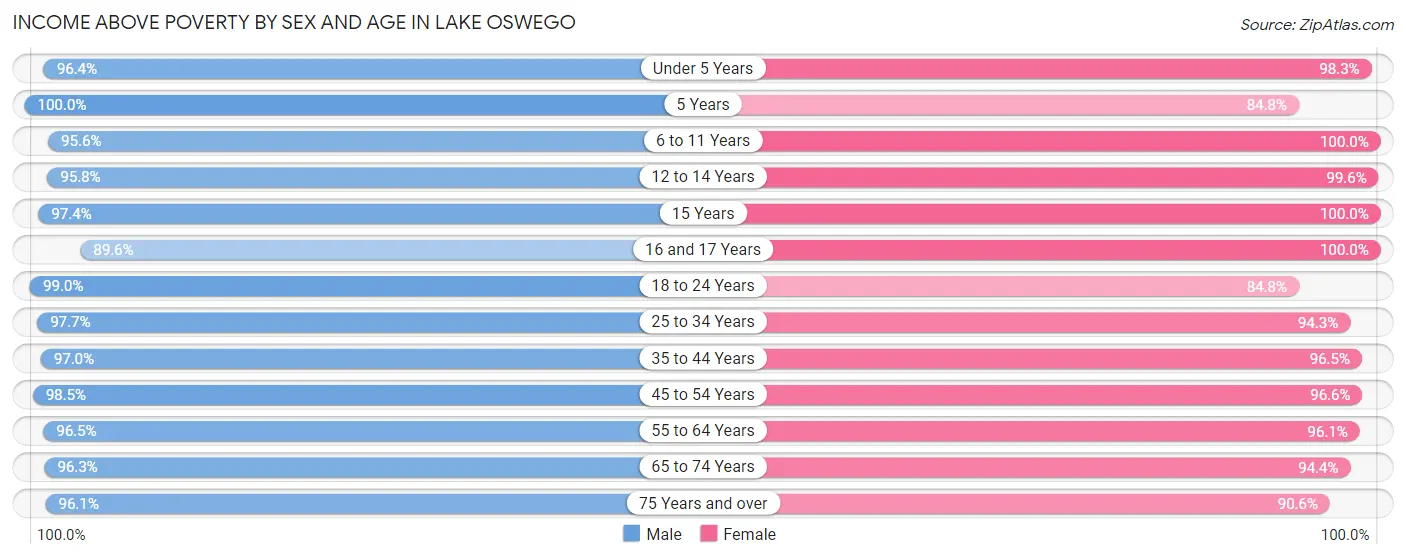
| Age Bracket | Male | Female |
| Under 5 Years | 1,027 (96.4%) | 926 (98.3%) |
| 5 Years | 274 (100.0%) | 179 (84.8%) |
| 6 to 11 Years | 1,550 (95.6%) | 930 (100.0%) |
| 12 to 14 Years | 997 (95.8%) | 1,084 (99.6%) |
| 15 Years | 379 (97.4%) | 313 (100.0%) |
| 16 and 17 Years | 692 (89.6%) | 510 (100.0%) |
| 18 to 24 Years | 1,055 (99.0%) | 615 (84.8%) |
| 25 to 34 Years | 2,080 (97.7%) | 1,550 (94.3%) |
| 35 to 44 Years | 2,400 (97.0%) | 2,547 (96.5%) |
| 45 to 54 Years | 3,008 (98.5%) | 2,926 (96.6%) |
| 55 to 64 Years | 2,633 (96.5%) | 2,723 (96.1%) |
| 65 to 74 Years | 2,456 (96.3%) | 2,781 (94.4%) |
| 75 Years and over | 1,381 (96.1%) | 1,710 (90.6%) |
| Total | 19,932 (96.8%) | 18,794 (95.4%) |
Income Below Poverty Among Married-Couple Families in Lake Oswego
The poverty statistics for married-couple families in Lake Oswego show that 2.4% or 235 of the total 9,769 families live below the poverty line. Families with 1 or 2 children have the highest poverty rate of 2.8%, comprising of 103 families. On the other hand, families with 3 or 4 children have the lowest poverty rate of 0.0%, which includes 0 families.
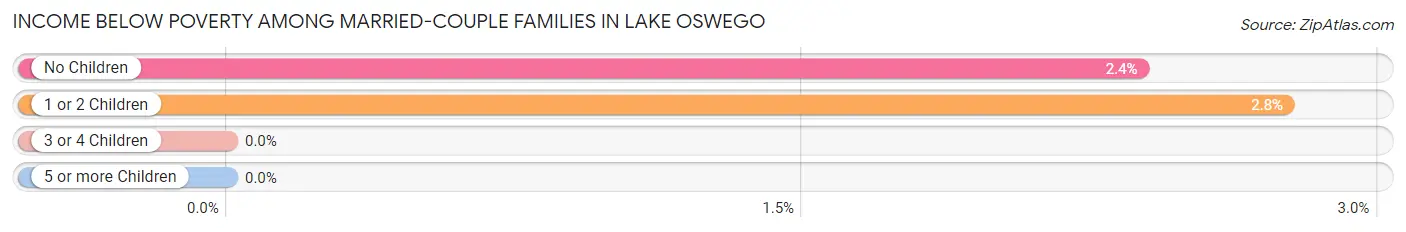
| Children | Above Poverty | Below Poverty |
| No Children | 5,414 (97.6%) | 132 (2.4%) |
| 1 or 2 Children | 3,630 (97.2%) | 103 (2.8%) |
| 3 or 4 Children | 490 (100.0%) | 0 (0.0%) |
| 5 or more Children | 0 (0.0%) | 0 (0.0%) |
| Total | 9,534 (97.6%) | 235 (2.4%) |
Income Below Poverty Among Single-Parent Households in Lake Oswego
According to the poverty data in Lake Oswego, 1.7% or 8 single-father households and 4.0% or 41 single-mother households are living below the poverty line. Among single-father households, those with no children have the highest poverty rate, with 8 households (7.3%) experiencing poverty. Likewise, among single-mother households, those with 1 or 2 children have the highest poverty rate, with 41 households (6.2%) falling below the poverty line.
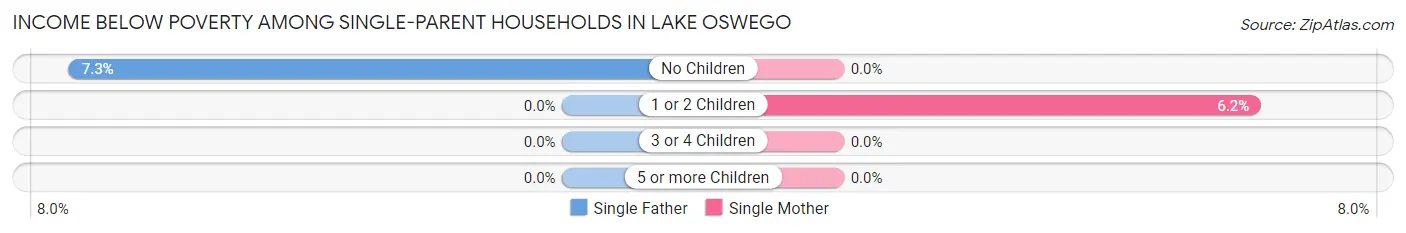
| Children | Single Father | Single Mother |
| No Children | 8 (7.3%) | 0 (0.0%) |
| 1 or 2 Children | 0 (0.0%) | 41 (6.2%) |
| 3 or 4 Children | 0 (0.0%) | 0 (0.0%) |
| 5 or more Children | 0 (0.0%) | 0 (0.0%) |
| Total | 8 (1.7%) | 41 (4.0%) |
Income Below Poverty Among Married-Couple vs Single-Parent Households in Lake Oswego
The poverty data for Lake Oswego shows that 235 of the married-couple family households (2.4%) and 49 of the single-parent households (3.3%) are living below the poverty level. Within the married-couple family households, those with 1 or 2 children have the highest poverty rate, with 103 households (2.8%) falling below the poverty line. Among the single-parent households, those with 1 or 2 children have the highest poverty rate, with 41 household (4.0%) living below poverty.
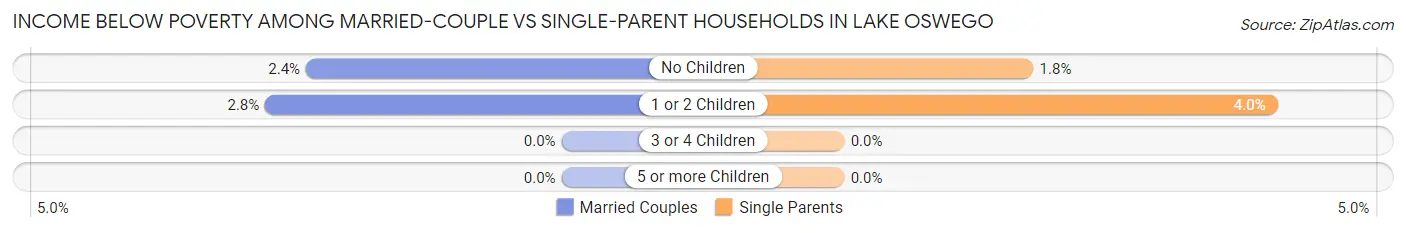
| Children | Married-Couple Families | Single-Parent Households |
| No Children | 132 (2.4%) | 8 (1.8%) |
| 1 or 2 Children | 103 (2.8%) | 41 (4.0%) |
| 3 or 4 Children | 0 (0.0%) | 0 (0.0%) |
| 5 or more Children | 0 (0.0%) | 0 (0.0%) |
| Total | 235 (2.4%) | 49 (3.3%) |
Race in Lake Oswego
The most populous races in Lake Oswego are White / Caucasian (32,262 | 79.7%), Two or more Races (3,543 | 8.8%), and Asian (3,446 | 8.5%).
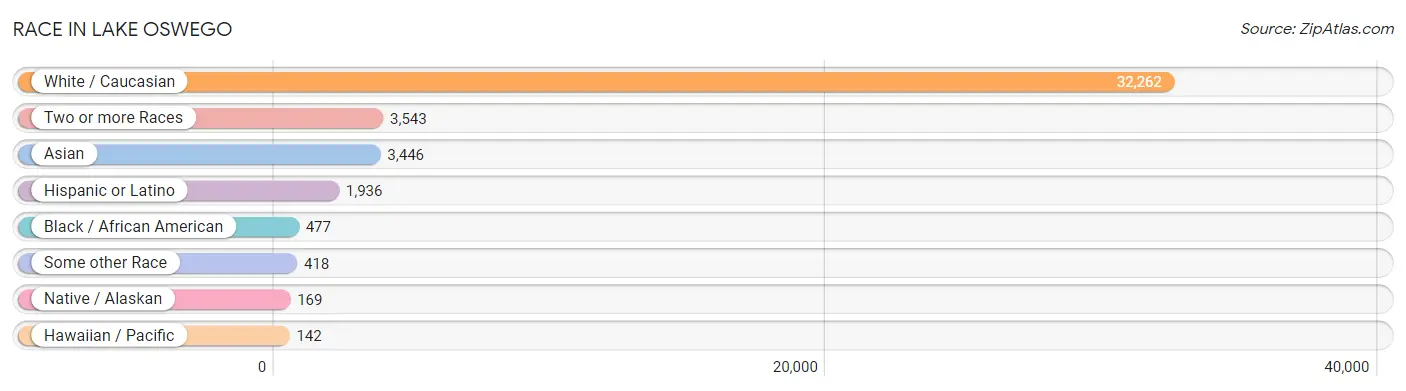
| Race | # Population | % Population |
| Asian | 3,446 | 8.5% |
| Black / African American | 477 | 1.2% |
| Hawaiian / Pacific | 142 | 0.4% |
| Hispanic or Latino | 1,936 | 4.8% |
| Native / Alaskan | 169 | 0.4% |
| White / Caucasian | 32,262 | 79.7% |
| Two or more Races | 3,543 | 8.8% |
| Some other Race | 418 | 1.0% |
| Total | 40,457 | 100.0% |
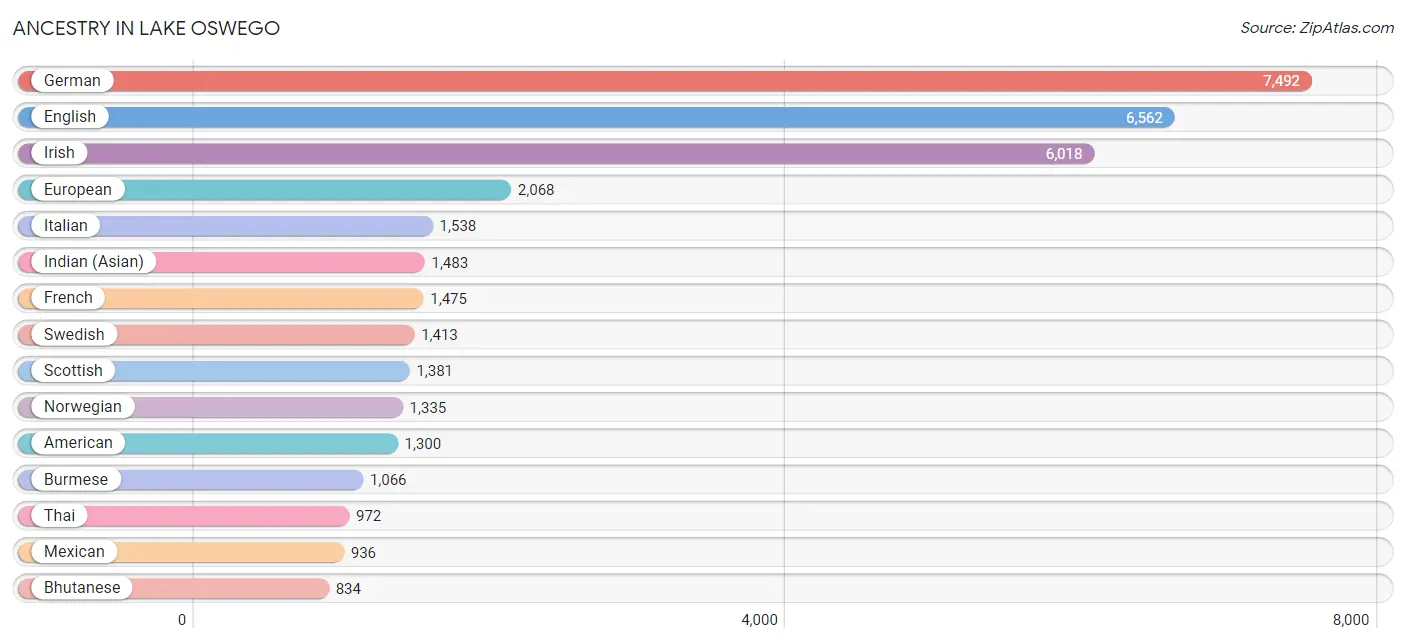
Ancestry in Lake Oswego
The most populous ancestries reported in Lake Oswego are German (7,492 | 18.5%), English (6,562 | 16.2%), Irish (6,018 | 14.9%), European (2,068 | 5.1%), and Italian (1,538 | 3.8%), together accounting for 58.5% of all Lake Oswego residents.
| Ancestry | # Population | % Population |
| Afghan | 125 | 0.3% |
| African | 35 | 0.1% |
| American | 1,300 | 3.2% |
| Arab | 139 | 0.3% |
| Armenian | 167 | 0.4% |
| Assyrian / Chaldean / Syriac | 18 | 0.0% |
| Australian | 64 | 0.2% |
| Austrian | 298 | 0.7% |
| Basque | 19 | 0.1% |
| Belgian | 115 | 0.3% |
| Bhutanese | 834 | 2.1% |
| Bolivian | 21 | 0.1% |
| Brazilian | 13 | 0.0% |
| British | 775 | 1.9% |
| Burmese | 1,066 | 2.6% |
| Cajun | 23 | 0.1% |
| Canadian | 140 | 0.4% |
| Central American | 404 | 1.0% |
| Central American Indian | 25 | 0.1% |
| Cherokee | 53 | 0.1% |
| Chilean | 2 | 0.0% |
| Colombian | 58 | 0.1% |
| Colville | 42 | 0.1% |
| Creek | 31 | 0.1% |
| Croatian | 299 | 0.7% |
| Cuban | 52 | 0.1% |
| Czech | 241 | 0.6% |
| Czechoslovakian | 23 | 0.1% |
| Danish | 604 | 1.5% |
| Dutch | 653 | 1.6% |
| Eastern European | 365 | 0.9% |
| English | 6,562 | 16.2% |
| Ethiopian | 51 | 0.1% |
| European | 2,068 | 5.1% |
| Filipino | 123 | 0.3% |
| Finnish | 287 | 0.7% |
| French | 1,475 | 3.6% |
| French Canadian | 243 | 0.6% |
| German | 7,492 | 18.5% |
| Greek | 281 | 0.7% |
| Guamanian / Chamorro | 7 | 0.0% |
| Guatemalan | 56 | 0.1% |
| Honduran | 38 | 0.1% |
| Hungarian | 219 | 0.5% |
| Indian (Asian) | 1,483 | 3.7% |
| Indonesian | 56 | 0.1% |
| Iranian | 360 | 0.9% |
| Irish | 6,018 | 14.9% |
| Italian | 1,538 | 3.8% |
| Jamaican | 20 | 0.1% |
| Korean | 344 | 0.9% |
| Laotian | 32 | 0.1% |
| Latvian | 37 | 0.1% |
| Lebanese | 19 | 0.1% |
| Lithuanian | 42 | 0.1% |
| Malaysian | 70 | 0.2% |
| Mexican | 936 | 2.3% |
| Mexican American Indian | 145 | 0.4% |
| Mongolian | 51 | 0.1% |
| Native Hawaiian | 158 | 0.4% |
| New Zealander | 131 | 0.3% |
| Nicaraguan | 114 | 0.3% |
| Northern European | 399 | 1.0% |
| Norwegian | 1,335 | 3.3% |
| Pakistani | 11 | 0.0% |
| Palestinian | 13 | 0.0% |
| Panamanian | 68 | 0.2% |
| Pennsylvania German | 7 | 0.0% |
| Peruvian | 168 | 0.4% |
| Polish | 829 | 2.1% |
| Portuguese | 114 | 0.3% |
| Puerto Rican | 40 | 0.1% |
| Romanian | 13 | 0.0% |
| Russian | 365 | 0.9% |
| Salvadoran | 128 | 0.3% |
| Samoan | 20 | 0.1% |
| Scandinavian | 541 | 1.3% |
| Scotch-Irish | 472 | 1.2% |
| Scottish | 1,381 | 3.4% |
| Sioux | 19 | 0.1% |
| Slovak | 100 | 0.3% |
| South African | 48 | 0.1% |
| South American | 249 | 0.6% |
| Spaniard | 102 | 0.3% |
| Spanish | 51 | 0.1% |
| Sri Lankan | 93 | 0.2% |
| Subsaharan African | 202 | 0.5% |
| Sudanese | 68 | 0.2% |
| Swedish | 1,413 | 3.5% |
| Swiss | 273 | 0.7% |
| Syrian | 83 | 0.2% |
| Thai | 972 | 2.4% |
| Turkish | 75 | 0.2% |
| Ukrainian | 315 | 0.8% |
| Welsh | 197 | 0.5% |
| West Indian | 10 | 0.0% |
| Yakama | 68 | 0.2% |
| Yugoslavian | 16 | 0.0% | View All 98 Rows |
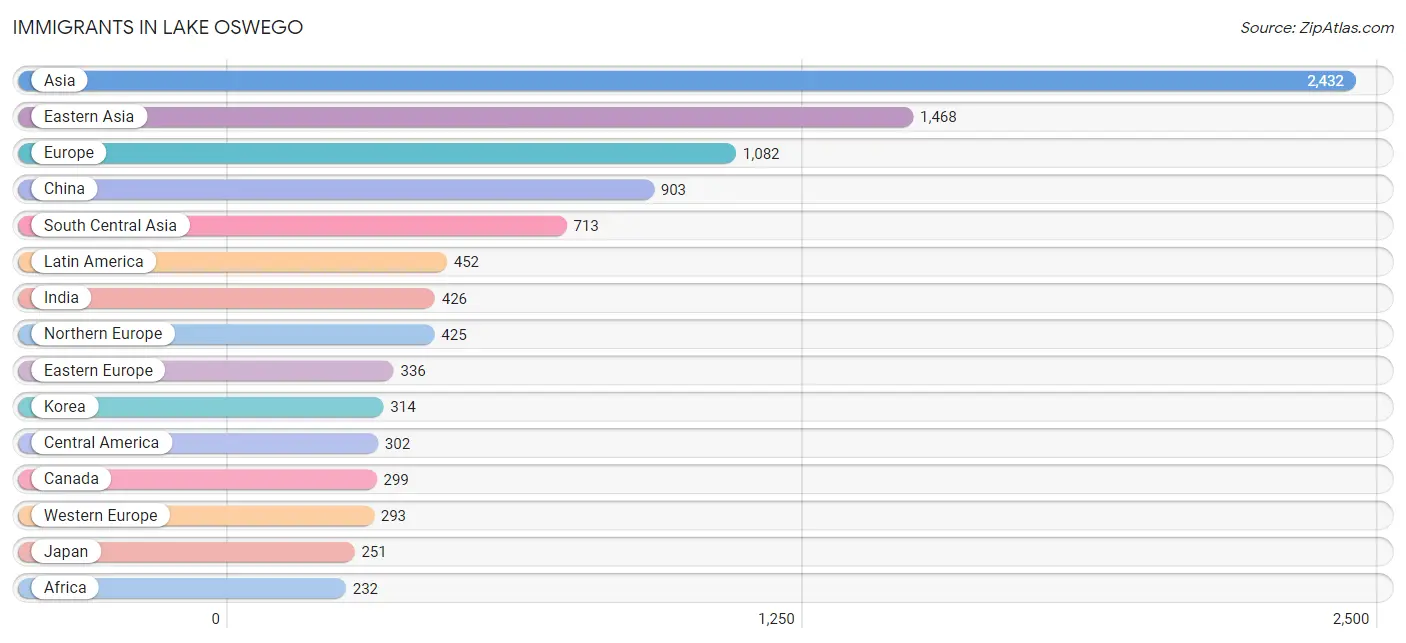
Immigrants in Lake Oswego
The most numerous immigrant groups reported in Lake Oswego came from Asia (2,432 | 6.0%), Eastern Asia (1,468 | 3.6%), Europe (1,082 | 2.7%), China (903 | 2.2%), and South Central Asia (713 | 1.8%), together accounting for 16.3% of all Lake Oswego residents.
| Immigration Origin | # Population | % Population |
| Afghanistan | 65 | 0.2% |
| Africa | 232 | 0.6% |
| Asia | 2,432 | 6.0% |
| Australia | 51 | 0.1% |
| Belgium | 46 | 0.1% |
| Bolivia | 13 | 0.0% |
| Canada | 299 | 0.7% |
| Caribbean | 88 | 0.2% |
| Central America | 302 | 0.7% |
| China | 903 | 2.2% |
| Colombia | 26 | 0.1% |
| Cuba | 52 | 0.1% |
| Czechoslovakia | 96 | 0.2% |
| Denmark | 10 | 0.0% |
| Eastern Africa | 94 | 0.2% |
| Eastern Asia | 1,468 | 3.6% |
| Eastern Europe | 336 | 0.8% |
| Egypt | 3 | 0.0% |
| El Salvador | 13 | 0.0% |
| England | 155 | 0.4% |
| Ethiopia | 17 | 0.0% |
| Europe | 1,082 | 2.7% |
| France | 47 | 0.1% |
| Germany | 168 | 0.4% |
| Grenada | 16 | 0.0% |
| Guatemala | 56 | 0.1% |
| Honduras | 12 | 0.0% |
| Hong Kong | 77 | 0.2% |
| Hungary | 96 | 0.2% |
| India | 426 | 1.1% |
| Indonesia | 23 | 0.1% |
| Iran | 172 | 0.4% |
| Iraq | 39 | 0.1% |
| Ireland | 12 | 0.0% |
| Israel | 18 | 0.0% |
| Jamaica | 20 | 0.1% |
| Japan | 251 | 0.6% |
| Kenya | 77 | 0.2% |
| Korea | 314 | 0.8% |
| Latin America | 452 | 1.1% |
| Mexico | 137 | 0.3% |
| Netherlands | 13 | 0.0% |
| Nicaragua | 27 | 0.1% |
| Northern Africa | 89 | 0.2% |
| Northern Europe | 425 | 1.1% |
| Norway | 16 | 0.0% |
| Oceania | 81 | 0.2% |
| Pakistan | 29 | 0.1% |
| Panama | 57 | 0.1% |
| Peru | 12 | 0.0% |
| Philippines | 93 | 0.2% |
| Russia | 25 | 0.1% |
| Scotland | 54 | 0.1% |
| South Africa | 49 | 0.1% |
| South America | 62 | 0.2% |
| South Central Asia | 713 | 1.8% |
| South Eastern Asia | 158 | 0.4% |
| Southern Europe | 28 | 0.1% |
| Spain | 28 | 0.1% |
| Sri Lanka | 21 | 0.1% |
| Sweden | 20 | 0.1% |
| Switzerland | 19 | 0.1% |
| Syria | 18 | 0.0% |
| Taiwan | 159 | 0.4% |
| Thailand | 11 | 0.0% |
| Turkey | 4 | 0.0% |
| Ukraine | 119 | 0.3% |
| Venezuela | 11 | 0.0% |
| Vietnam | 31 | 0.1% |
| Western Asia | 93 | 0.2% |
| Western Europe | 293 | 0.7% | View All 71 Rows |
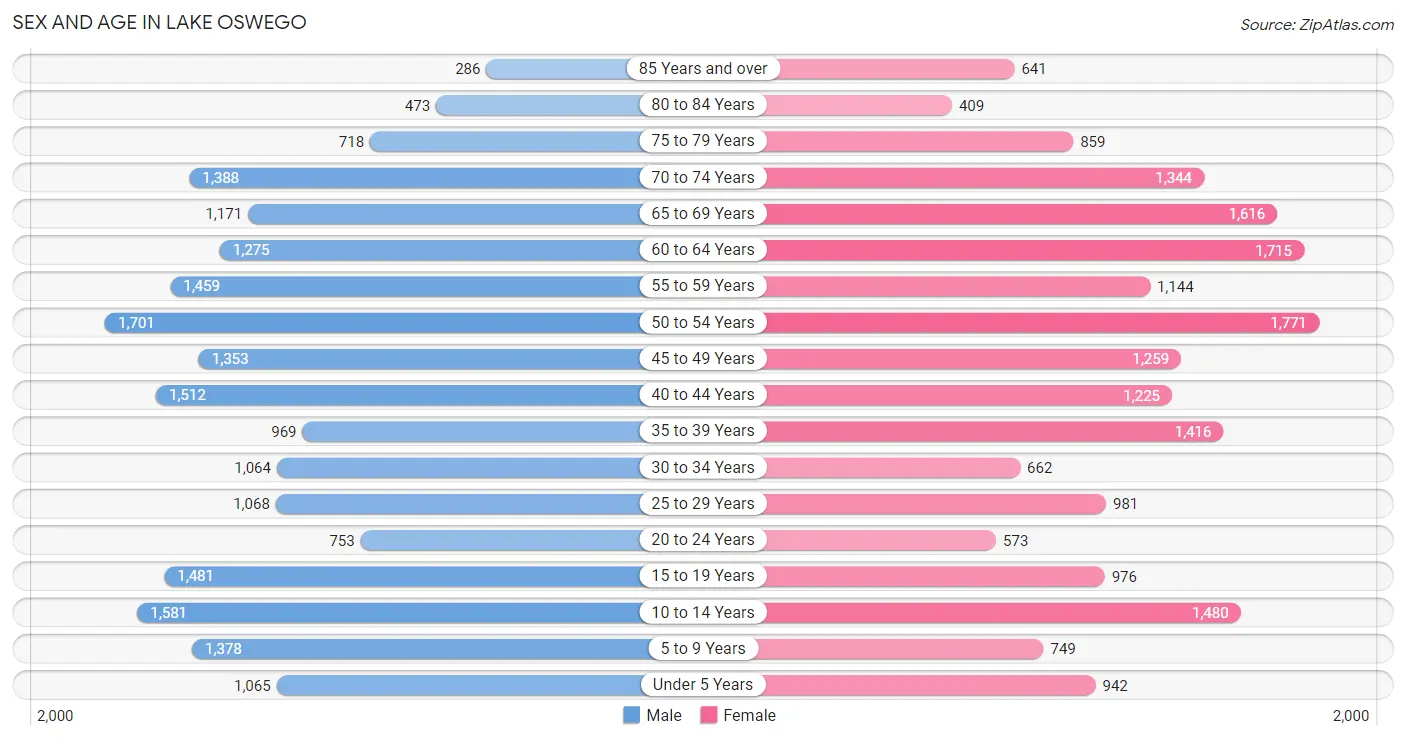
Sex and Age in Lake Oswego
Sex and Age in Lake Oswego
The most populous age groups in Lake Oswego are 50 to 54 Years (1,701 | 8.2%) for men and 50 to 54 Years (1,771 | 9.0%) for women.
| Age Bracket | Male | Female |
| Under 5 Years | 1,065 (5.1%) | 942 (4.8%) |
| 5 to 9 Years | 1,378 (6.7%) | 749 (3.8%) |
| 10 to 14 Years | 1,581 (7.6%) | 1,480 (7.5%) |
| 15 to 19 Years | 1,481 (7.2%) | 976 (4.9%) |
| 20 to 24 Years | 753 (3.6%) | 573 (2.9%) |
| 25 to 29 Years | 1,068 (5.2%) | 981 (5.0%) |
| 30 to 34 Years | 1,064 (5.1%) | 662 (3.4%) |
| 35 to 39 Years | 969 (4.7%) | 1,416 (7.2%) |
| 40 to 44 Years | 1,512 (7.3%) | 1,225 (6.2%) |
| 45 to 49 Years | 1,353 (6.5%) | 1,259 (6.4%) |
| 50 to 54 Years | 1,701 (8.2%) | 1,771 (9.0%) |
| 55 to 59 Years | 1,459 (7.0%) | 1,144 (5.8%) |
| 60 to 64 Years | 1,275 (6.2%) | 1,715 (8.7%) |
| 65 to 69 Years | 1,171 (5.7%) | 1,616 (8.2%) |
| 70 to 74 Years | 1,388 (6.7%) | 1,344 (6.8%) |
| 75 to 79 Years | 718 (3.5%) | 859 (4.3%) |
| 80 to 84 Years | 473 (2.3%) | 409 (2.1%) |
| 85 Years and over | 286 (1.4%) | 641 (3.2%) |
| Total | 20,695 (100.0%) | 19,762 (100.0%) |
Families and Households in Lake Oswego
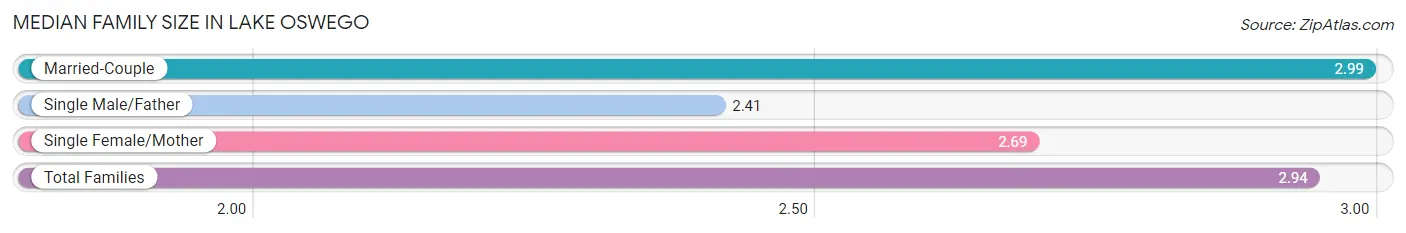
Median Family Size in Lake Oswego
The median family size in Lake Oswego is 2.94 persons per family, with married-couple families (9,769 | 86.7%) accounting for the largest median family size of 2.99 persons per family. On the other hand, single male/father families (465 | 4.1%) represent the smallest median family size with 2.41 persons per family.
| Family Type | # Families | Family Size |
| Married-Couple | 9,769 (86.7%) | 2.99 |
| Single Male/Father | 465 (4.1%) | 2.41 |
| Single Female/Mother | 1,038 (9.2%) | 2.69 |
| Total Families | 11,272 (100.0%) | 2.94 |
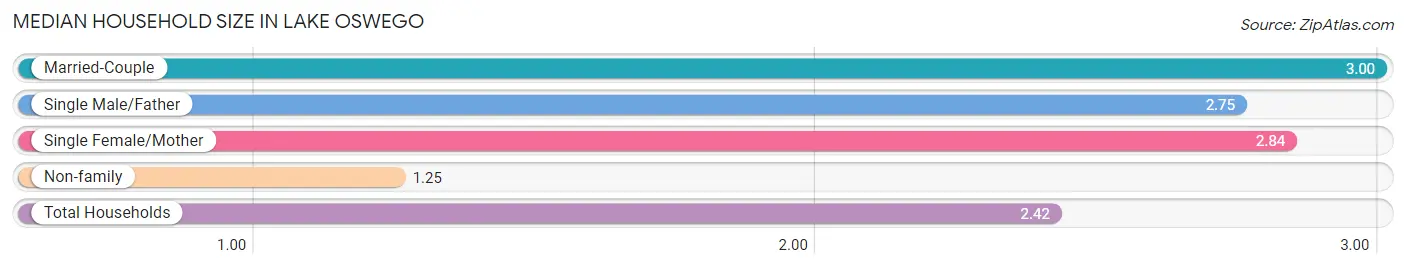
Median Household Size in Lake Oswego
The median household size in Lake Oswego is 2.42 persons per household, with married-couple households (9,769 | 58.7%) accounting for the largest median household size of 3 persons per household. non-family households (5,377 | 32.3%) represent the smallest median household size with 1.25 persons per household.
| Household Type | # Households | Household Size |
| Married-Couple | 9,769 (58.7%) | 3.00 |
| Single Male/Father | 465 (2.8%) | 2.75 |
| Single Female/Mother | 1,038 (6.2%) | 2.84 |
| Non-family | 5,377 (32.3%) | 1.25 |
| Total Households | 16,649 (100.0%) | 2.42 |
Household Size by Marriage Status in Lake Oswego
Out of a total of 16,649 households in Lake Oswego, 11,272 (67.7%) are family households, while 5,377 (32.3%) are nonfamily households. The most numerous type of family households are 2-person households, comprising 5,372, and the most common type of nonfamily households are 1-person households, comprising 4,496.
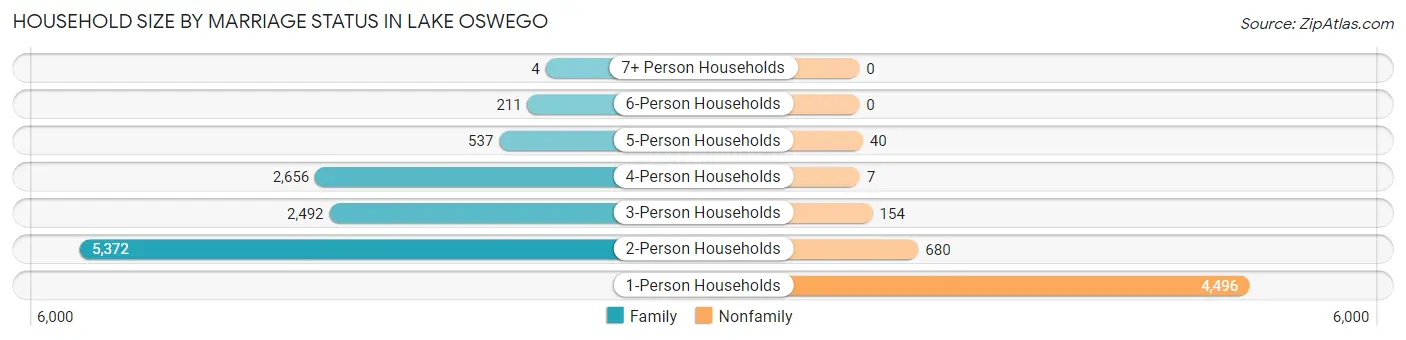
| Household Size | Family Households | Nonfamily Households |
| 1-Person Households | - | 4,496 (27.0%) |
| 2-Person Households | 5,372 (32.3%) | 680 (4.1%) |
| 3-Person Households | 2,492 (15.0%) | 154 (0.9%) |
| 4-Person Households | 2,656 (16.0%) | 7 (0.0%) |
| 5-Person Households | 537 (3.2%) | 40 (0.2%) |
| 6-Person Households | 211 (1.3%) | 0 (0.0%) |
| 7+ Person Households | 4 (0.0%) | 0 (0.0%) |
| Total | 11,272 (67.7%) | 5,377 (32.3%) |
Female Fertility in Lake Oswego
Fertility by Age in Lake Oswego
Average fertility rate in Lake Oswego is 73.0 births per 1,000 women. Women in the age bracket of 20 to 34 years have the highest fertility rate with 102.0 births per 1,000 women. Women in the age bracket of 35 to 50 years acount for 58.8% of all women with births.
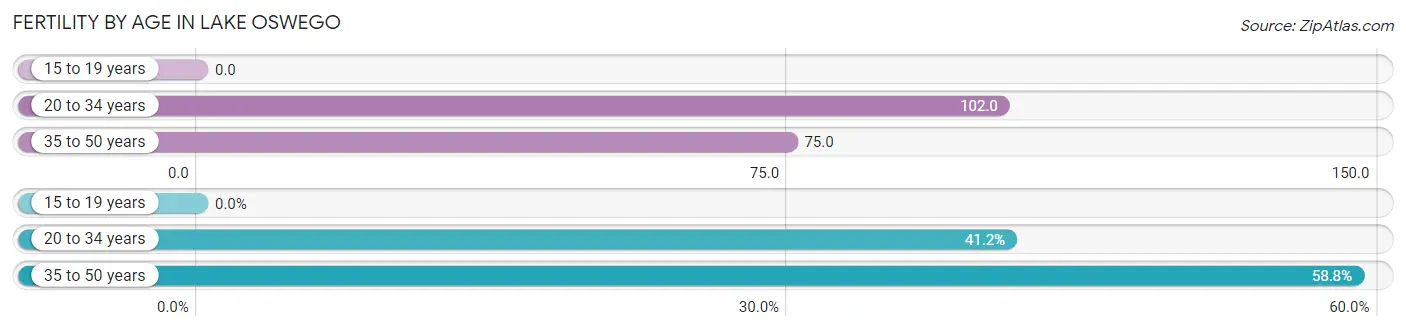
| Age Bracket | Women with Births | Births / 1,000 Women |
| 15 to 19 years | 0 (0.0%) | 0.0 |
| 20 to 34 years | 226 (41.2%) | 102.0 |
| 35 to 50 years | 323 (58.8%) | 75.0 |
| Total | 549 (100.0%) | 73.0 |
Fertility by Age by Marriage Status in Lake Oswego
98.4% of women with births (549) in Lake Oswego are married. The highest percentage of unmarried women with births falls into 35 to 50 years age bracket with 2.8% of them unmarried at the time of birth, while the lowest percentage of unmarried women with births belong to 20 to 34 years age bracket with 0.0% of them unmarried.
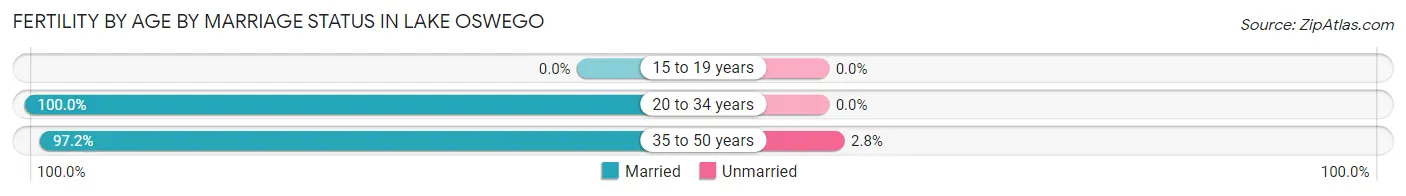
| Age Bracket | Married | Unmarried |
| 15 to 19 years | 0 (0.0%) | 0 (0.0%) |
| 20 to 34 years | 226 (100.0%) | 0 (0.0%) |
| 35 to 50 years | 314 (97.2%) | 9 (2.8%) |
| Total | 540 (98.4%) | 9 (1.6%) |
Fertility by Education in Lake Oswego
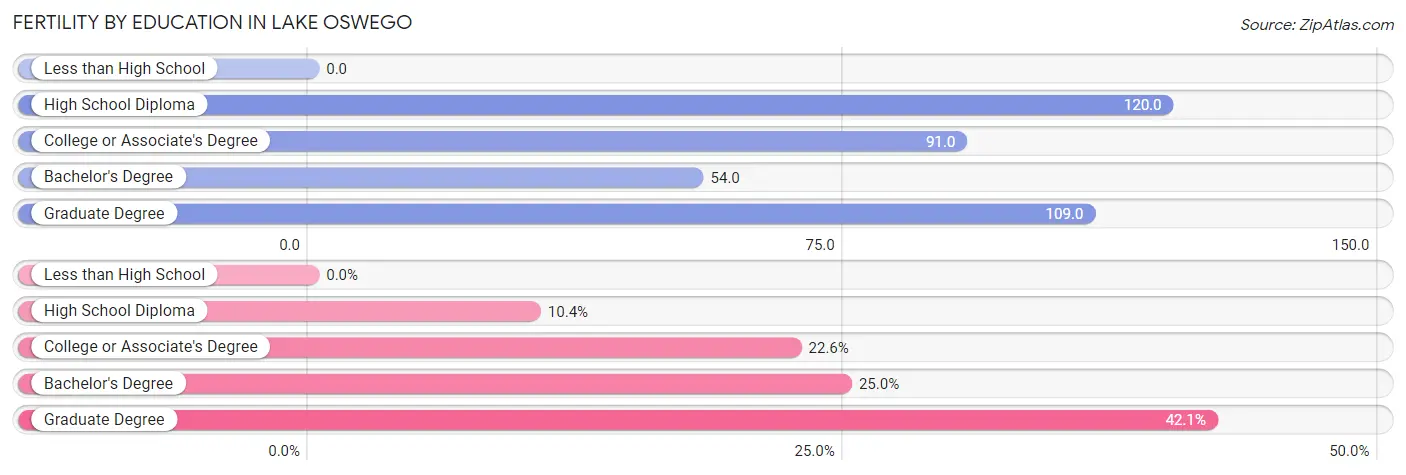
| Educational Attainment | Women with Births | Births / 1,000 Women |
| Less than High School | 0 (0.0%) | 0.0 |
| High School Diploma | 57 (10.4%) | 120.0 |
| College or Associate's Degree | 124 (22.6%) | 91.0 |
| Bachelor's Degree | 137 (24.9%) | 54.0 |
| Graduate Degree | 231 (42.1%) | 109.0 |
| Total | 549 (100.0%) | 73.0 |
Fertility by Education by Marriage Status in Lake Oswego
1.6% of women with births in Lake Oswego are unmarried. Women with the educational attainment of high school diploma are most likely to be married with 100.0% of them married at childbirth, while women with the educational attainment of bachelor's degree are least likely to be married with 6.6% of them unmarried at childbirth.
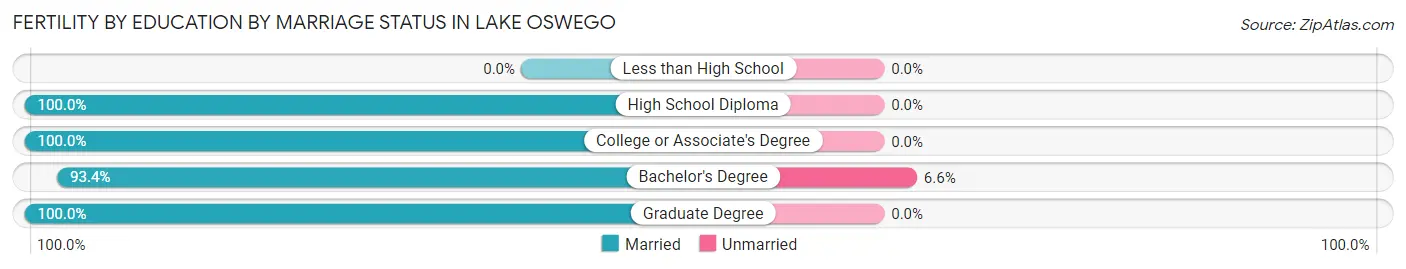
| Educational Attainment | Married | Unmarried |
| Less than High School | 0 (0.0%) | 0 (0.0%) |
| High School Diploma | 57 (100.0%) | 0 (0.0%) |
| College or Associate's Degree | 124 (100.0%) | 0 (0.0%) |
| Bachelor's Degree | 128 (93.4%) | 9 (6.6%) |
| Graduate Degree | 231 (100.0%) | 0 (0.0%) |
| Total | 540 (98.4%) | 9 (1.6%) |
Employment Characteristics in Lake Oswego
Employment by Class of Employer in Lake Oswego
Among the 18,775 employed individuals in Lake Oswego, private company employees (11,127 | 59.3%), not-for-profit organizations (2,130 | 11.3%), and self-employed (not incorporated) (1,593 | 8.5%) make up the most common classes of employment.
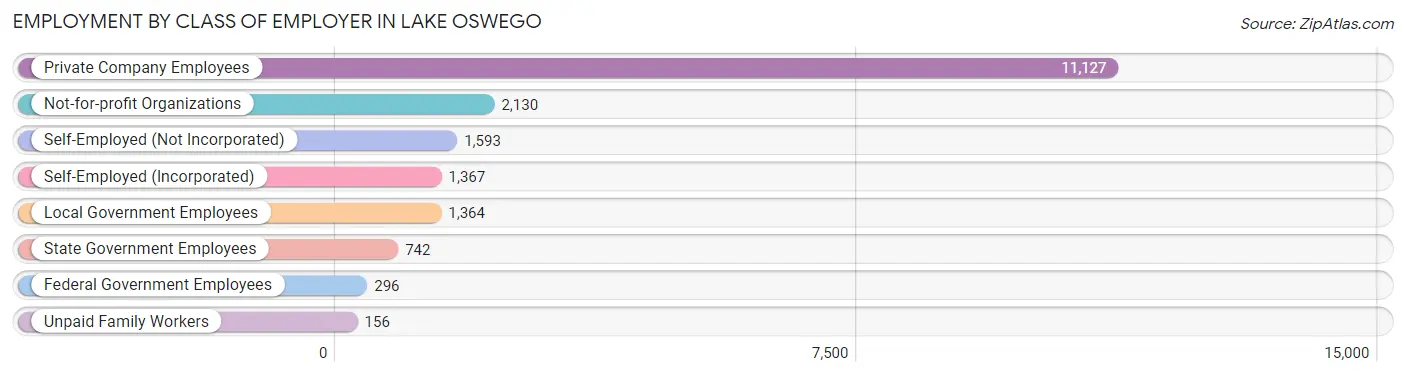
| Employer Class | # Employees | % Employees |
| Private Company Employees | 11,127 | 59.3% |
| Self-Employed (Incorporated) | 1,367 | 7.3% |
| Self-Employed (Not Incorporated) | 1,593 | 8.5% |
| Not-for-profit Organizations | 2,130 | 11.3% |
| Local Government Employees | 1,364 | 7.3% |
| State Government Employees | 742 | 4.0% |
| Federal Government Employees | 296 | 1.6% |
| Unpaid Family Workers | 156 | 0.8% |
| Total | 18,775 | 100.0% |
Employment Status by Age in Lake Oswego
According to the labor force statistics for Lake Oswego, out of the total population over 16 years of age (32,560), 61.2% or 19,927 individuals are in the labor force, with 4.6% or 917 of them unemployed. The age group with the highest labor force participation rate is 25 to 29 years, with 87.6% or 1,795 individuals in the labor force. Within the labor force, the 20 to 24 years age range has the highest percentage of unemployed individuals, with 16.8% or 133 of them being unemployed.
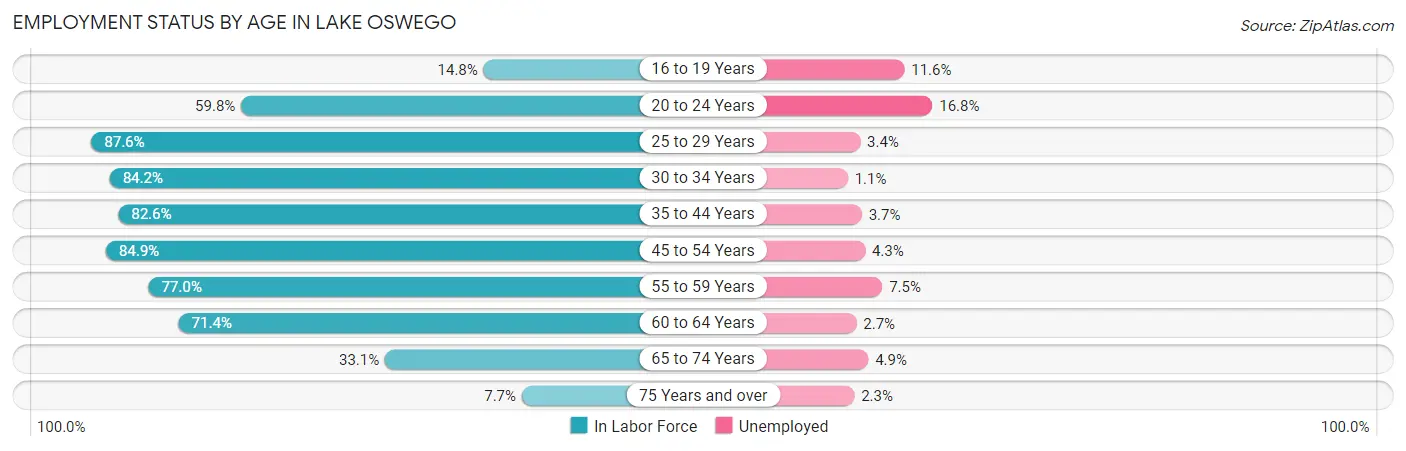
| Age Bracket | In Labor Force | Unemployed |
| 16 to 19 Years | 260 (14.8%) | 30 (11.6%) |
| 20 to 24 Years | 793 (59.8%) | 133 (16.8%) |
| 25 to 29 Years | 1,795 (87.6%) | 61 (3.4%) |
| 30 to 34 Years | 1,453 (84.2%) | 16 (1.1%) |
| 35 to 44 Years | 4,231 (82.6%) | 157 (3.7%) |
| 45 to 54 Years | 5,165 (84.9%) | 222 (4.3%) |
| 55 to 59 Years | 2,004 (77.0%) | 150 (7.5%) |
| 60 to 64 Years | 2,135 (71.4%) | 58 (2.7%) |
| 65 to 74 Years | 1,827 (33.1%) | 90 (4.9%) |
| 75 Years and over | 261 (7.7%) | 6 (2.3%) |
| Total | 19,927 (61.2%) | 917 (4.6%) |
Employment Status by Educational Attainment in Lake Oswego
According to labor force statistics for Lake Oswego, 81.6% of individuals (16,788) out of the total population between 25 and 64 years of age (20,574) are in the labor force, with 4.0% or 672 of them being unemployed. The group with the highest labor force participation rate are those with the educational attainment of bachelor's degree or higher, with 82.7% or 12,824 individuals in the labor force. Within the labor force, individuals with college / associate degree education have the highest percentage of unemployment, with 8.7% or 253 of them being unemployed.
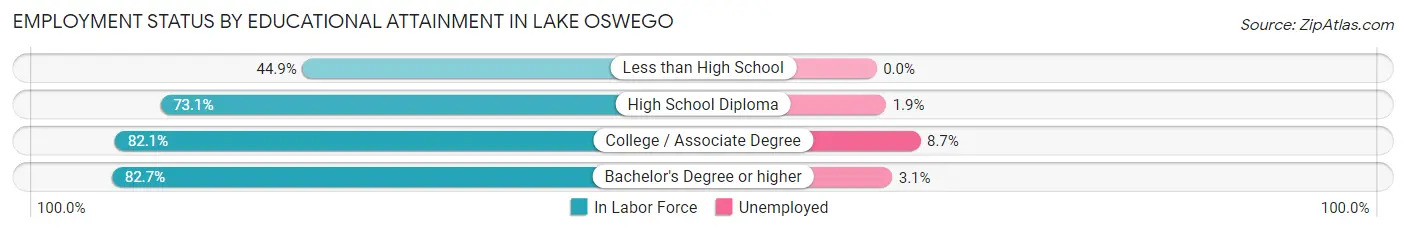
| Educational Attainment | In Labor Force | Unemployed |
| Less than High School | 89 (44.9%) | 0 (0.0%) |
| High School Diploma | 969 (73.1%) | 25 (1.9%) |
| College / Associate Degree | 2,910 (82.1%) | 308 (8.7%) |
| Bachelor's Degree or higher | 12,824 (82.7%) | 481 (3.1%) |
| Total | 16,788 (81.6%) | 823 (4.0%) |
Employment Occupations by Sex in Lake Oswego
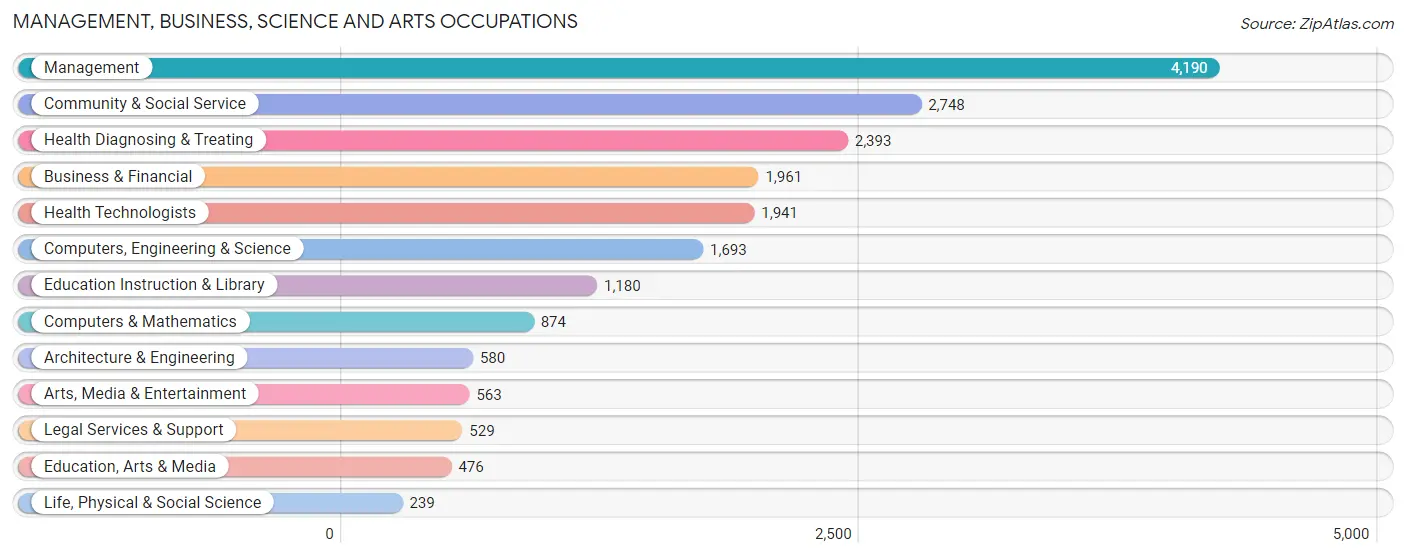
Management, Business, Science and Arts Occupations
The most common Management, Business, Science and Arts occupations in Lake Oswego are Management (4,190 | 22.1%), Community & Social Service (2,748 | 14.5%), Health Diagnosing & Treating (2,393 | 12.6%), Business & Financial (1,961 | 10.3%), and Health Technologists (1,941 | 10.2%).
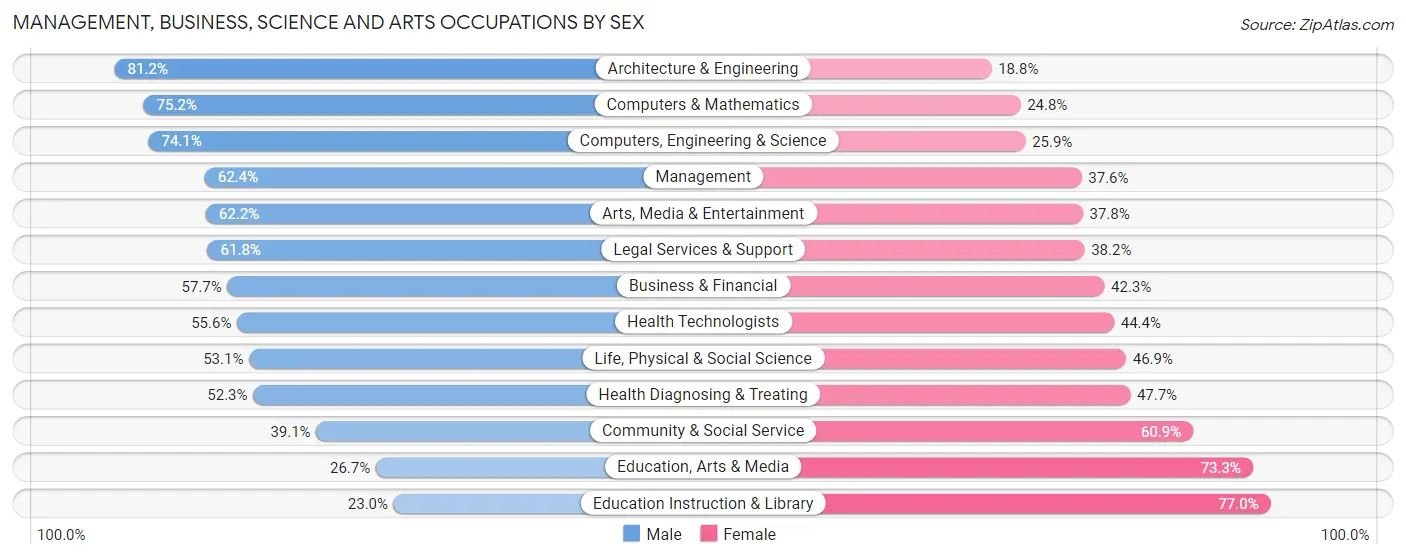
Management, Business, Science and Arts Occupations by Sex
Within the Management, Business, Science and Arts occupations in Lake Oswego, the most male-oriented occupations are Architecture & Engineering (81.2%), Computers & Mathematics (75.2%), and Computers, Engineering & Science (74.1%), while the most female-oriented occupations are Education Instruction & Library (77.0%), Education, Arts & Media (73.3%), and Community & Social Service (60.9%).
| Occupation | Male | Female |
| Management | 2,615 (62.4%) | 1,575 (37.6%) |
| Business & Financial | 1,131 (57.7%) | 830 (42.3%) |
| Computers, Engineering & Science | 1,255 (74.1%) | 438 (25.9%) |
| Computers & Mathematics | 657 (75.2%) | 217 (24.8%) |
| Architecture & Engineering | 471 (81.2%) | 109 (18.8%) |
| Life, Physical & Social Science | 127 (53.1%) | 112 (46.9%) |
| Community & Social Service | 1,075 (39.1%) | 1,673 (60.9%) |
| Education, Arts & Media | 127 (26.7%) | 349 (73.3%) |
| Legal Services & Support | 327 (61.8%) | 202 (38.2%) |
| Education Instruction & Library | 271 (23.0%) | 909 (77.0%) |
| Arts, Media & Entertainment | 350 (62.2%) | 213 (37.8%) |
| Health Diagnosing & Treating | 1,251 (52.3%) | 1,142 (47.7%) |
| Health Technologists | 1,080 (55.6%) | 861 (44.4%) |
| Total (Category) | 7,327 (56.4%) | 5,658 (43.6%) |
| Total (Overall) | 10,819 (56.9%) | 8,183 (43.1%) |
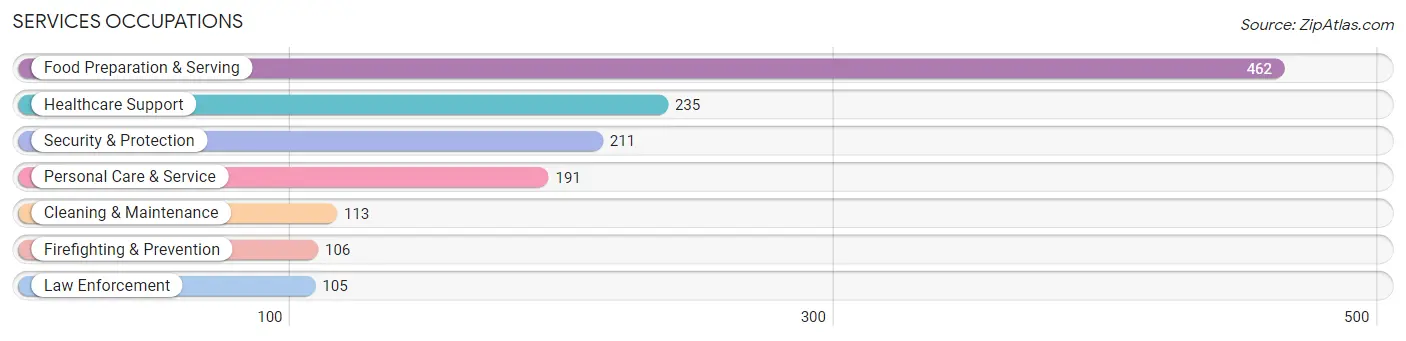
Services Occupations
The most common Services occupations in Lake Oswego are Food Preparation & Serving (462 | 2.4%), Healthcare Support (235 | 1.2%), Security & Protection (211 | 1.1%), Personal Care & Service (191 | 1.0%), and Cleaning & Maintenance (113 | 0.6%).
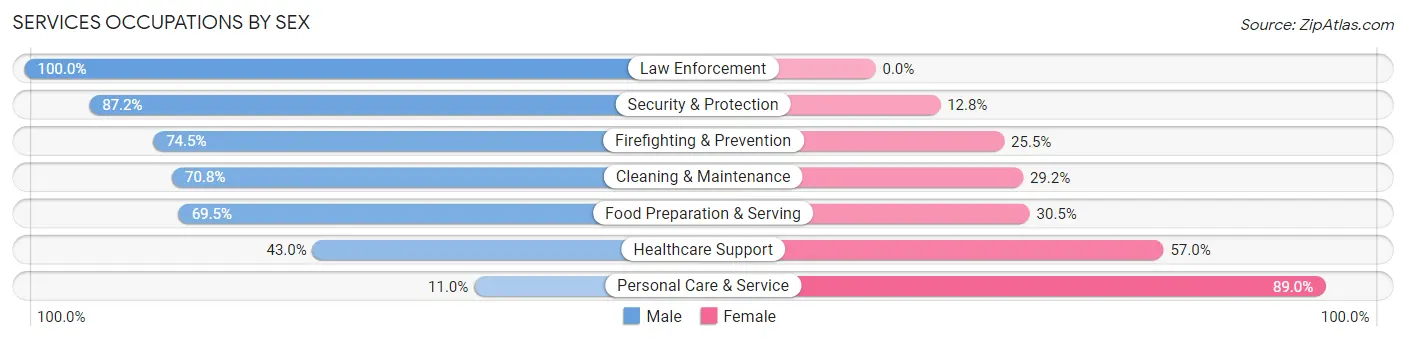
Services Occupations by Sex
Within the Services occupations in Lake Oswego, the most male-oriented occupations are Law Enforcement (100.0%), Security & Protection (87.2%), and Firefighting & Prevention (74.5%), while the most female-oriented occupations are Personal Care & Service (89.0%), Healthcare Support (57.0%), and Food Preparation & Serving (30.5%).
| Occupation | Male | Female |
| Healthcare Support | 101 (43.0%) | 134 (57.0%) |
| Security & Protection | 184 (87.2%) | 27 (12.8%) |
| Firefighting & Prevention | 79 (74.5%) | 27 (25.5%) |
| Law Enforcement | 105 (100.0%) | 0 (0.0%) |
| Food Preparation & Serving | 321 (69.5%) | 141 (30.5%) |
| Cleaning & Maintenance | 80 (70.8%) | 33 (29.2%) |
| Personal Care & Service | 21 (11.0%) | 170 (89.0%) |
| Total (Category) | 707 (58.3%) | 505 (41.7%) |
| Total (Overall) | 10,819 (56.9%) | 8,183 (43.1%) |
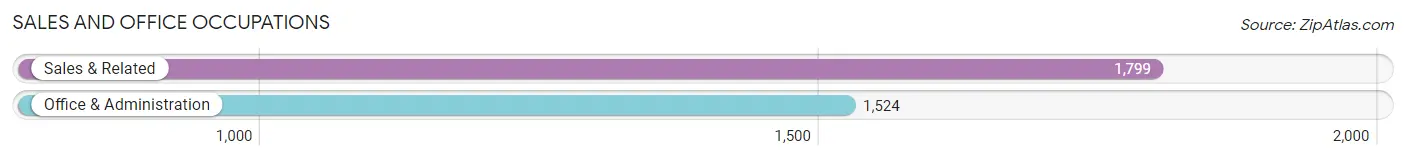
Sales and Office Occupations
The most common Sales and Office occupations in Lake Oswego are Sales & Related (1,799 | 9.5%), and Office & Administration (1,524 | 8.0%).
Sales and Office Occupations by Sex
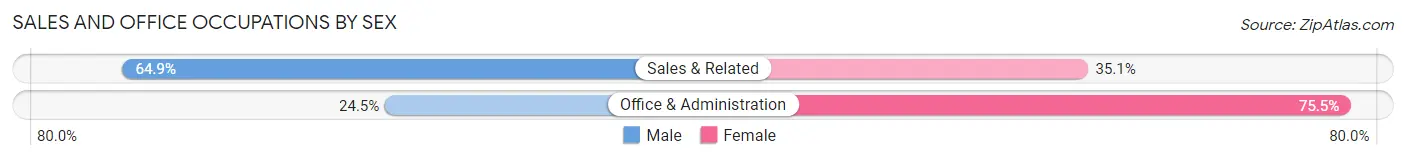
| Occupation | Male | Female |
| Sales & Related | 1,168 (64.9%) | 631 (35.1%) |
| Office & Administration | 374 (24.5%) | 1,150 (75.5%) |
| Total (Category) | 1,542 (46.4%) | 1,781 (53.6%) |
| Total (Overall) | 10,819 (56.9%) | 8,183 (43.1%) |
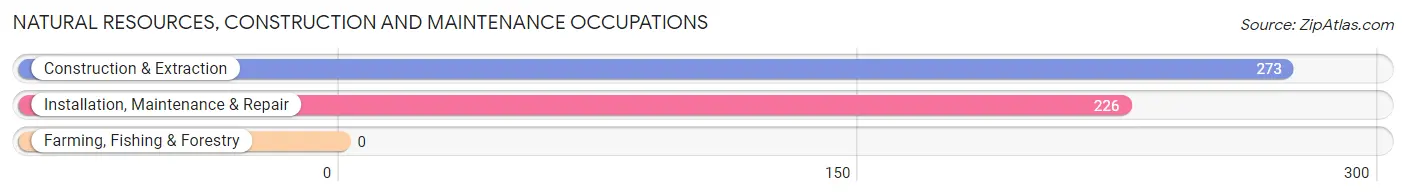
Natural Resources, Construction and Maintenance Occupations
The most common Natural Resources, Construction and Maintenance occupations in Lake Oswego are Construction & Extraction (273 | 1.4%), and Installation, Maintenance & Repair (226 | 1.2%).
Natural Resources, Construction and Maintenance Occupations by Sex
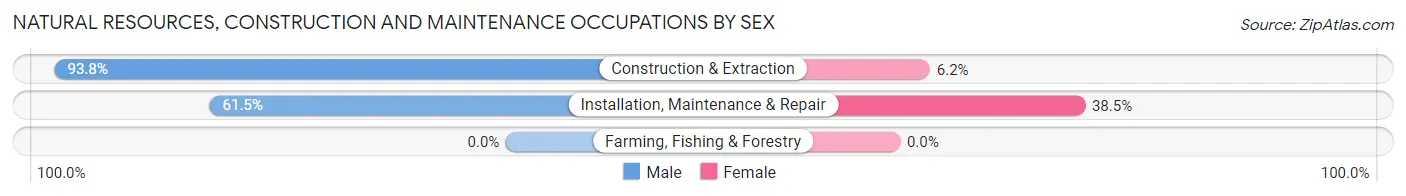
| Occupation | Male | Female |
| Farming, Fishing & Forestry | 0 (0.0%) | 0 (0.0%) |
| Construction & Extraction | 256 (93.8%) | 17 (6.2%) |
| Installation, Maintenance & Repair | 139 (61.5%) | 87 (38.5%) |
| Total (Category) | 395 (79.2%) | 104 (20.8%) |
| Total (Overall) | 10,819 (56.9%) | 8,183 (43.1%) |
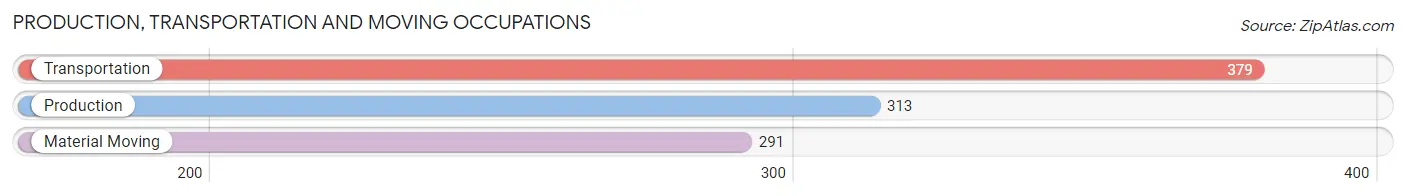
Production, Transportation and Moving Occupations
The most common Production, Transportation and Moving occupations in Lake Oswego are Transportation (379 | 2.0%), Production (313 | 1.7%), and Material Moving (291 | 1.5%).
Production, Transportation and Moving Occupations by Sex
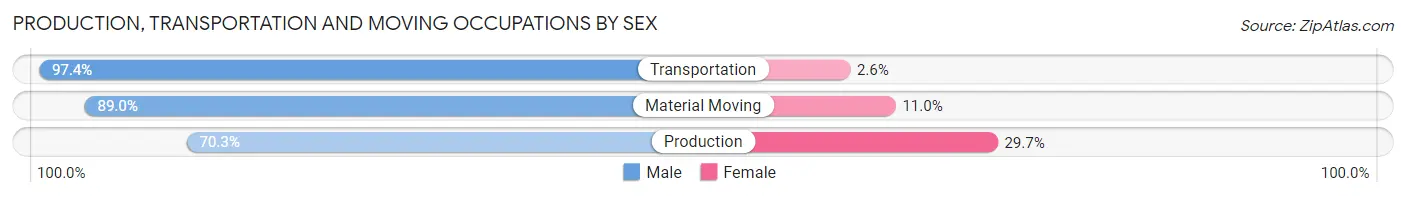
| Occupation | Male | Female |
| Production | 220 (70.3%) | 93 (29.7%) |
| Transportation | 369 (97.4%) | 10 (2.6%) |
| Material Moving | 259 (89.0%) | 32 (11.0%) |
| Total (Category) | 848 (86.3%) | 135 (13.7%) |
| Total (Overall) | 10,819 (56.9%) | 8,183 (43.1%) |
Employment Industries by Sex in Lake Oswego
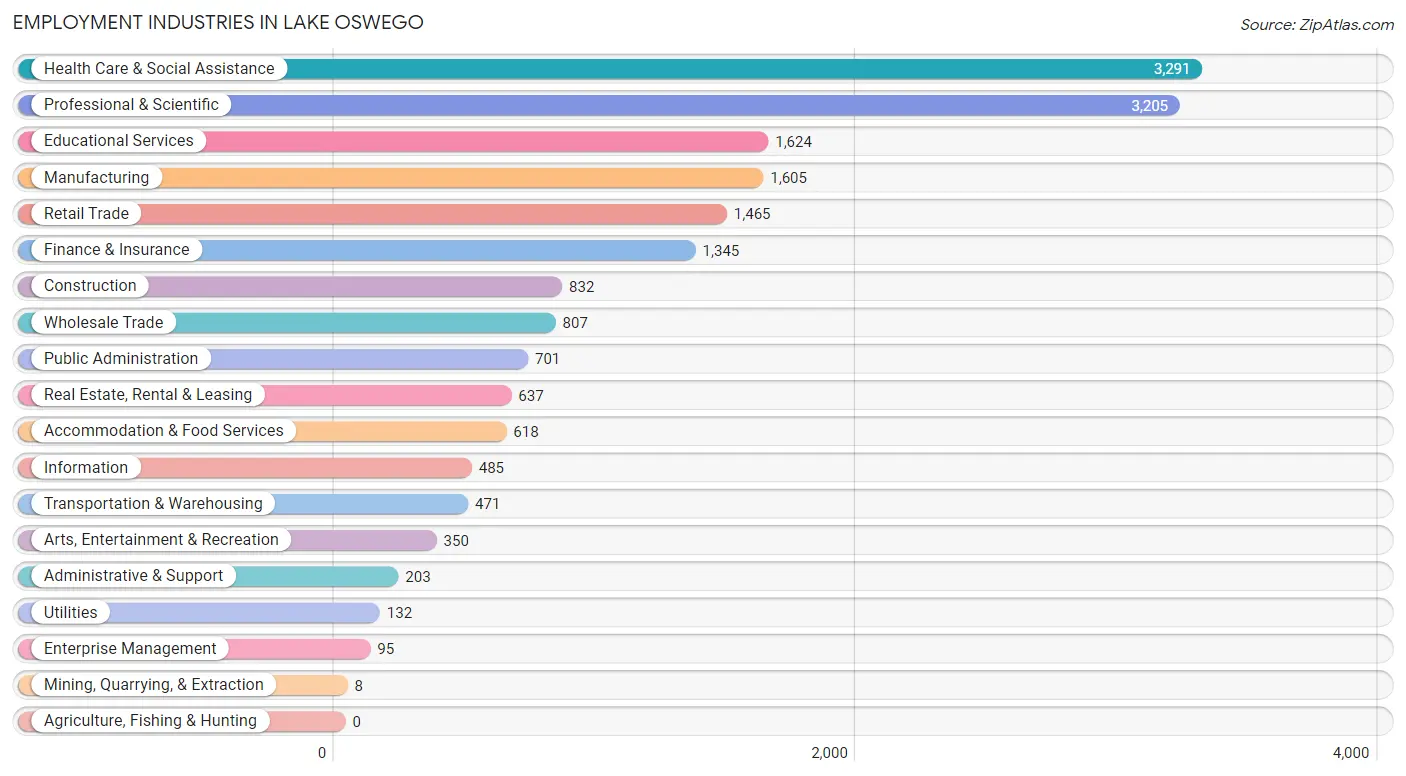
Employment Industries in Lake Oswego
The major employment industries in Lake Oswego include Health Care & Social Assistance (3,291 | 17.3%), Professional & Scientific (3,205 | 16.9%), Educational Services (1,624 | 8.6%), Manufacturing (1,605 | 8.5%), and Retail Trade (1,465 | 7.7%).
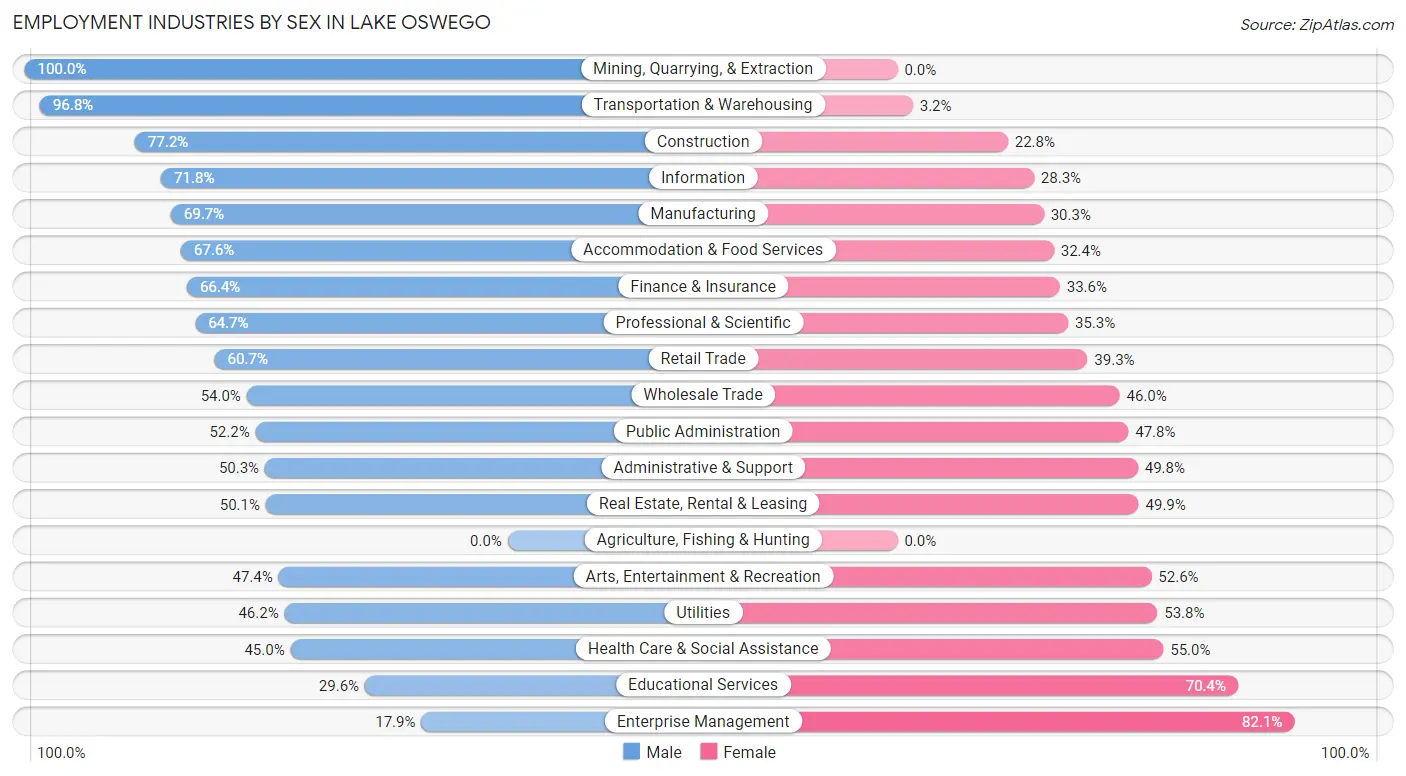
Employment Industries by Sex in Lake Oswego
The Lake Oswego industries that see more men than women are Mining, Quarrying, & Extraction (100.0%), Transportation & Warehousing (96.8%), and Construction (77.2%), whereas the industries that tend to have a higher number of women are Enterprise Management (82.1%), Educational Services (70.4%), and Health Care & Social Assistance (55.0%).
| Industry | Male | Female |
| Agriculture, Fishing & Hunting | 0 (0.0%) | 0 (0.0%) |
| Mining, Quarrying, & Extraction | 8 (100.0%) | 0 (0.0%) |
| Construction | 642 (77.2%) | 190 (22.8%) |
| Manufacturing | 1,119 (69.7%) | 486 (30.3%) |
| Wholesale Trade | 436 (54.0%) | 371 (46.0%) |
| Retail Trade | 889 (60.7%) | 576 (39.3%) |
| Transportation & Warehousing | 456 (96.8%) | 15 (3.2%) |
| Utilities | 61 (46.2%) | 71 (53.8%) |
| Information | 348 (71.8%) | 137 (28.2%) |
| Finance & Insurance | 893 (66.4%) | 452 (33.6%) |
| Real Estate, Rental & Leasing | 319 (50.1%) | 318 (49.9%) |
| Professional & Scientific | 2,073 (64.7%) | 1,132 (35.3%) |
| Enterprise Management | 17 (17.9%) | 78 (82.1%) |
| Administrative & Support | 102 (50.2%) | 101 (49.7%) |
| Educational Services | 480 (29.6%) | 1,144 (70.4%) |
| Health Care & Social Assistance | 1,480 (45.0%) | 1,811 (55.0%) |
| Arts, Entertainment & Recreation | 166 (47.4%) | 184 (52.6%) |
| Accommodation & Food Services | 418 (67.6%) | 200 (32.4%) |
| Public Administration | 366 (52.2%) | 335 (47.8%) |
| Total | 10,819 (56.9%) | 8,183 (43.1%) |
Education in Lake Oswego
School Enrollment in Lake Oswego
The most common levels of schooling among the 9,743 students in Lake Oswego are high school (2,534 | 26.0%), middle school (2,478 | 25.4%), and elementary school (1,689 | 17.3%).
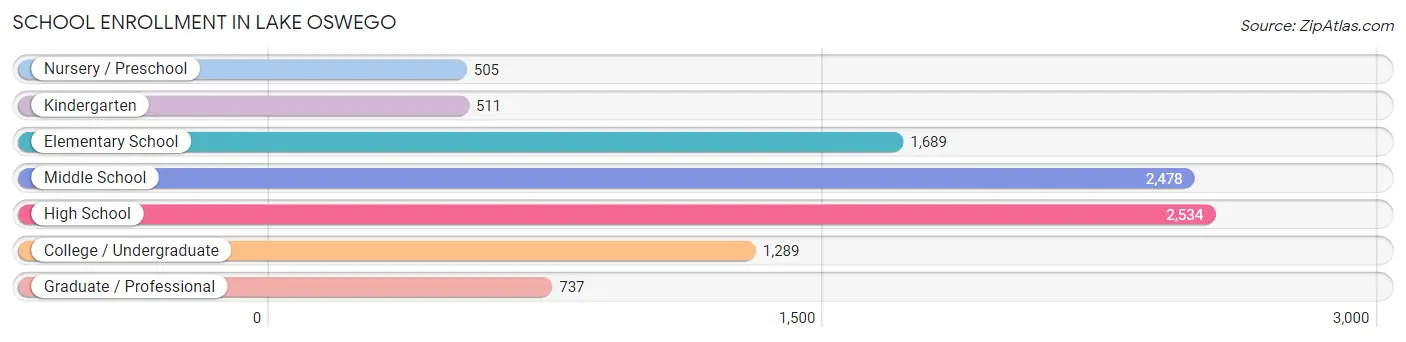
| School Level | # Students | % Students |
| Nursery / Preschool | 505 | 5.2% |
| Kindergarten | 511 | 5.2% |
| Elementary School | 1,689 | 17.3% |
| Middle School | 2,478 | 25.4% |
| High School | 2,534 | 26.0% |
| College / Undergraduate | 1,289 | 13.2% |
| Graduate / Professional | 737 | 7.6% |
| Total | 9,743 | 100.0% |
School Enrollment by Age by Funding Source in Lake Oswego
Out of a total of 9,743 students who are enrolled in schools in Lake Oswego, 1,988 (20.4%) attend a private institution, while the remaining 7,755 (79.6%) are enrolled in public schools. The age group of 3 to 4 year olds has the highest likelihood of being enrolled in private schools, with 329 (77.4% in the age bracket) enrolled. Conversely, the age group of 20 to 24 year olds has the lowest likelihood of being enrolled in a private school, with 751 (91.6% in the age bracket) attending a public institution.
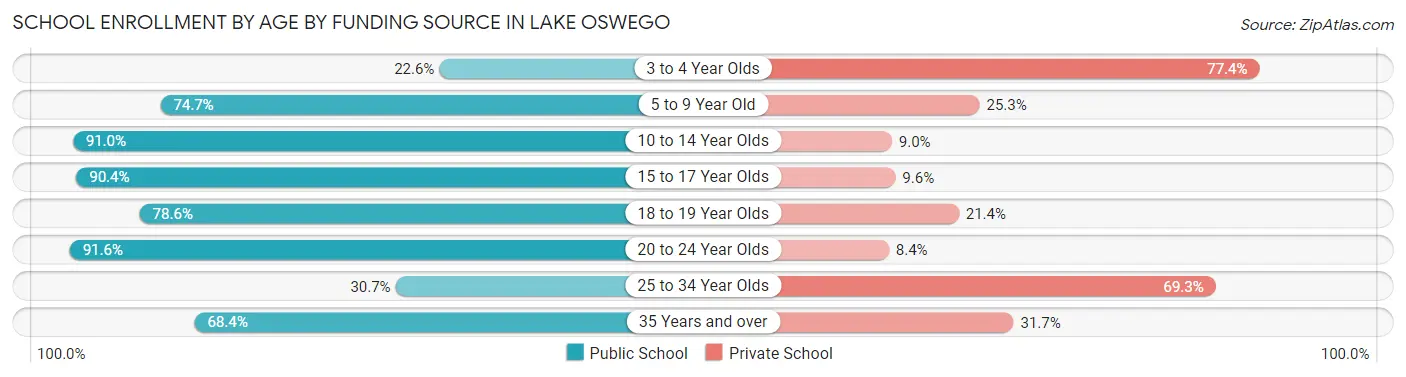
| Age Bracket | Public School | Private School |
| 3 to 4 Year Olds | 96 (22.6%) | 329 (77.4%) |
| 5 to 9 Year Old | 1,529 (74.7%) | 518 (25.3%) |
| 10 to 14 Year Olds | 2,758 (91.0%) | 272 (9.0%) |
| 15 to 17 Year Olds | 1,791 (90.4%) | 191 (9.6%) |
| 18 to 19 Year Olds | 359 (78.6%) | 98 (21.4%) |
| 20 to 24 Year Olds | 751 (91.6%) | 69 (8.4%) |
| 25 to 34 Year Olds | 162 (30.7%) | 365 (69.3%) |
| 35 Years and over | 311 (68.3%) | 144 (31.7%) |
| Total | 7,755 (79.6%) | 1,988 (20.4%) |
Educational Attainment by Field of Study in Lake Oswego
Business (4,739 | 20.3%), social sciences (2,555 | 10.9%), bio, nature & agricultural (2,317 | 9.9%), science & technology (1,791 | 7.7%), and engineering (1,640 | 7.0%) are the most common fields of study among 23,378 individuals in Lake Oswego who have obtained a bachelor's degree or higher.
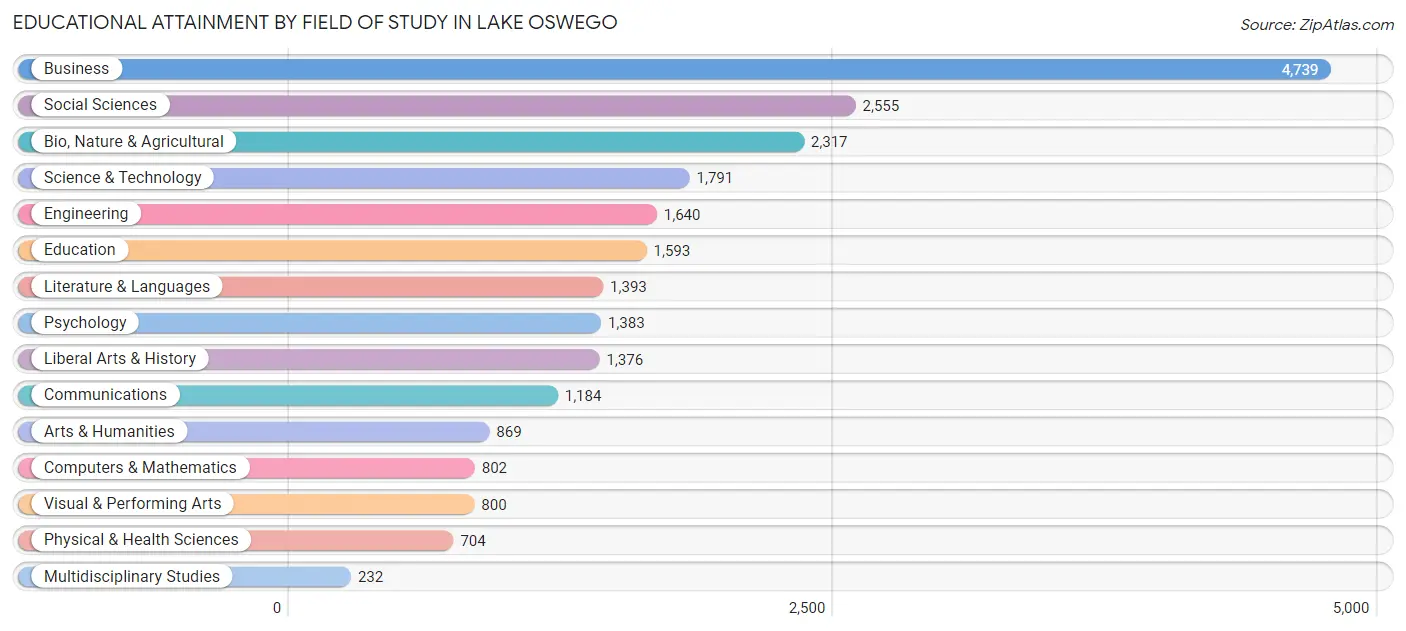
| Field of Study | # Graduates | % Graduates |
| Computers & Mathematics | 802 | 3.4% |
| Bio, Nature & Agricultural | 2,317 | 9.9% |
| Physical & Health Sciences | 704 | 3.0% |
| Psychology | 1,383 | 5.9% |
| Social Sciences | 2,555 | 10.9% |
| Engineering | 1,640 | 7.0% |
| Multidisciplinary Studies | 232 | 1.0% |
| Science & Technology | 1,791 | 7.7% |
| Business | 4,739 | 20.3% |
| Education | 1,593 | 6.8% |
| Literature & Languages | 1,393 | 6.0% |
| Liberal Arts & History | 1,376 | 5.9% |
| Visual & Performing Arts | 800 | 3.4% |
| Communications | 1,184 | 5.1% |
| Arts & Humanities | 869 | 3.7% |
| Total | 23,378 | 100.0% |
Transportation & Commute in Lake Oswego
Vehicle Availability by Sex in Lake Oswego
The most prevalent vehicle ownership categories in Lake Oswego are males with 2 vehicles (5,626, accounting for 52.5%) and females with 2 vehicles (3,897, making up 69.8%).
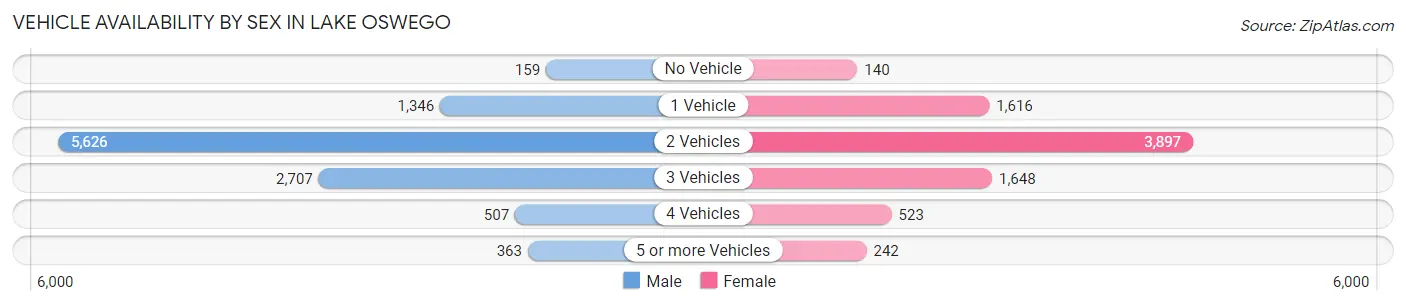
| Vehicles Available | Male | Female |
| No Vehicle | 159 (1.5%) | 140 (1.7%) |
| 1 Vehicle | 1,346 (12.6%) | 1,616 (20.0%) |
| 2 Vehicles | 5,626 (52.5%) | 3,897 (48.3%) |
| 3 Vehicles | 2,707 (25.3%) | 1,648 (20.4%) |
| 4 Vehicles | 507 (4.7%) | 523 (6.5%) |
| 5 or more Vehicles | 363 (3.4%) | 242 (3.0%) |
| Total | 10,708 (100.0%) | 8,066 (100.0%) |
Commute Time in Lake Oswego
The most frequently occuring commute durations in Lake Oswego are 15 to 19 minutes (2,571 commuters, 18.1%), 20 to 24 minutes (2,465 commuters, 17.4%), and 30 to 34 minutes (2,258 commuters, 15.9%).
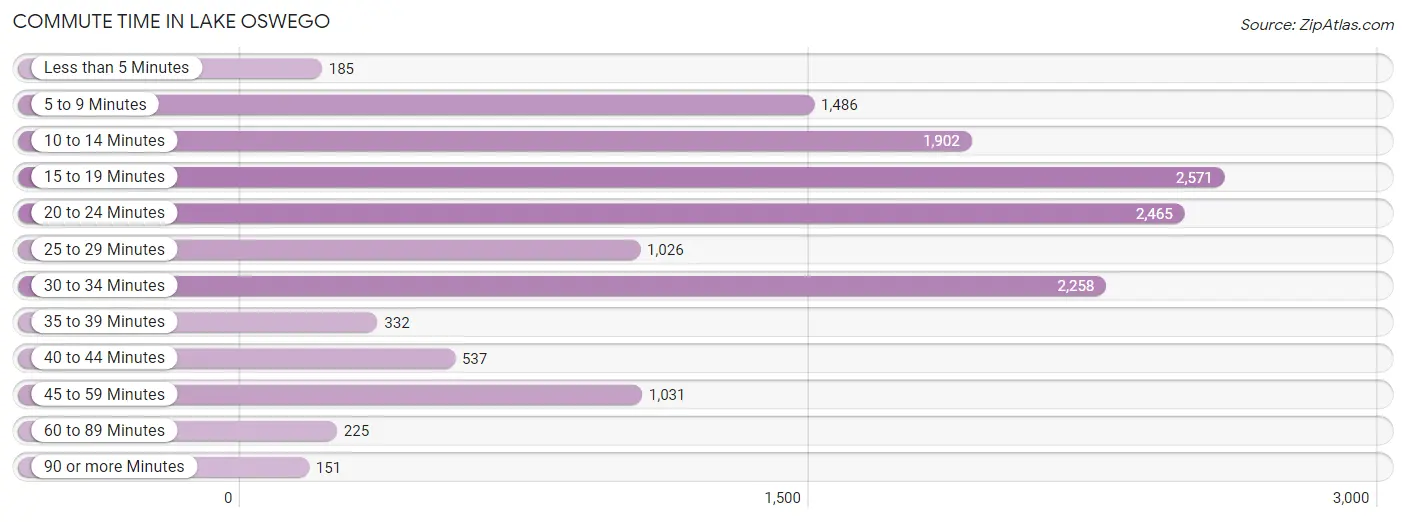
| Commute Time | # Commuters | % Commuters |
| Less than 5 Minutes | 185 | 1.3% |
| 5 to 9 Minutes | 1,486 | 10.5% |
| 10 to 14 Minutes | 1,902 | 13.4% |
| 15 to 19 Minutes | 2,571 | 18.1% |
| 20 to 24 Minutes | 2,465 | 17.4% |
| 25 to 29 Minutes | 1,026 | 7.2% |
| 30 to 34 Minutes | 2,258 | 15.9% |
| 35 to 39 Minutes | 332 | 2.3% |
| 40 to 44 Minutes | 537 | 3.8% |
| 45 to 59 Minutes | 1,031 | 7.3% |
| 60 to 89 Minutes | 225 | 1.6% |
| 90 or more Minutes | 151 | 1.1% |
Commute Time by Sex in Lake Oswego
The most common commute times in Lake Oswego are 15 to 19 minutes (1,621 commuters, 19.9%) for males and 30 to 34 minutes (972 commuters, 16.2%) for females.
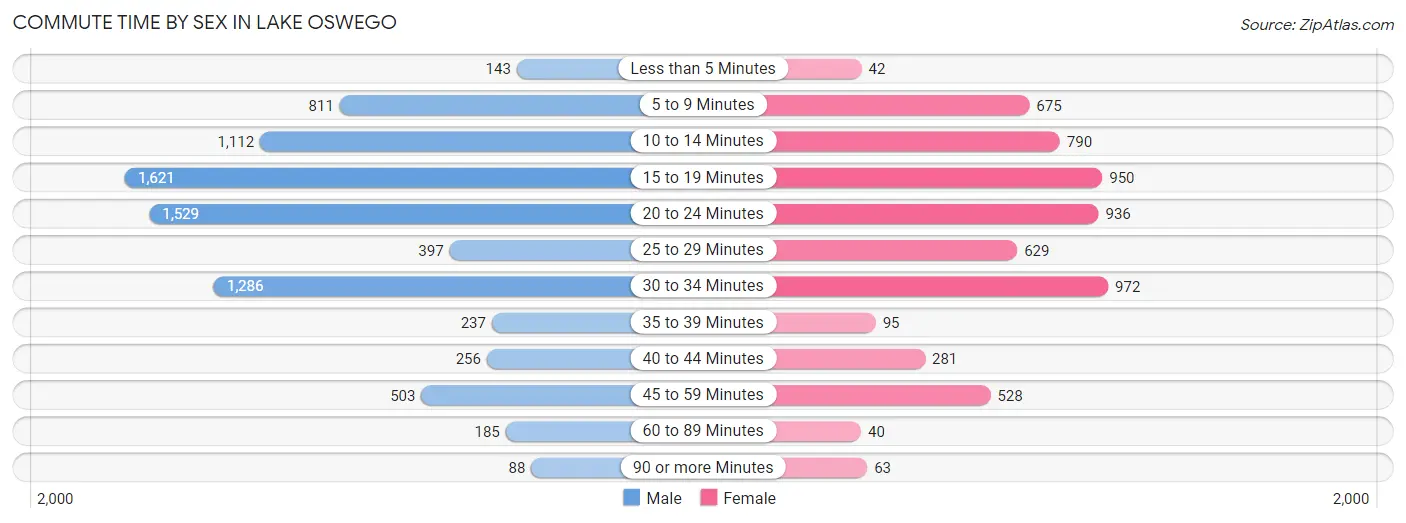
| Commute Time | Male | Female |
| Less than 5 Minutes | 143 (1.8%) | 42 (0.7%) |
| 5 to 9 Minutes | 811 (9.9%) | 675 (11.3%) |
| 10 to 14 Minutes | 1,112 (13.6%) | 790 (13.2%) |
| 15 to 19 Minutes | 1,621 (19.9%) | 950 (15.8%) |
| 20 to 24 Minutes | 1,529 (18.7%) | 936 (15.6%) |
| 25 to 29 Minutes | 397 (4.9%) | 629 (10.5%) |
| 30 to 34 Minutes | 1,286 (15.7%) | 972 (16.2%) |
| 35 to 39 Minutes | 237 (2.9%) | 95 (1.6%) |
| 40 to 44 Minutes | 256 (3.1%) | 281 (4.7%) |
| 45 to 59 Minutes | 503 (6.2%) | 528 (8.8%) |
| 60 to 89 Minutes | 185 (2.3%) | 40 (0.7%) |
| 90 or more Minutes | 88 (1.1%) | 63 (1.1%) |
Time of Departure to Work by Sex in Lake Oswego
The most frequent times of departure to work in Lake Oswego are 7:00 AM to 7:29 AM (1,638, 20.1%) for males and 7:00 AM to 7:29 AM (1,158, 19.3%) for females.
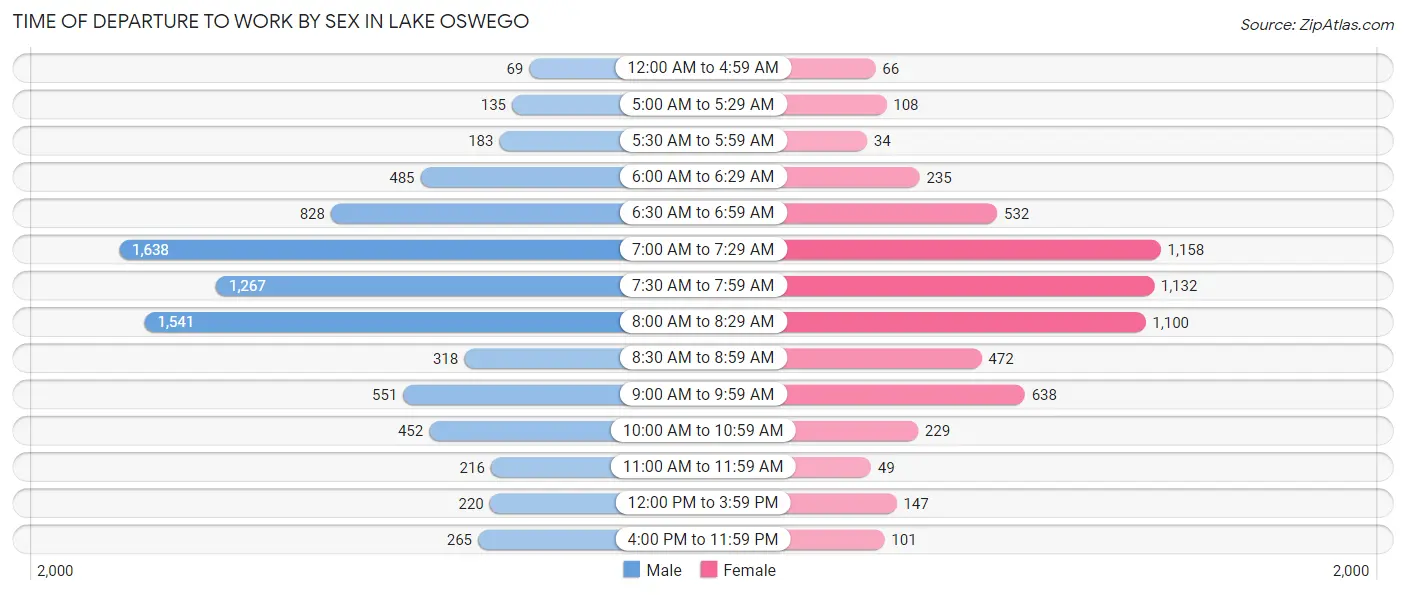
| Time of Departure | Male | Female |
| 12:00 AM to 4:59 AM | 69 (0.8%) | 66 (1.1%) |
| 5:00 AM to 5:29 AM | 135 (1.7%) | 108 (1.8%) |
| 5:30 AM to 5:59 AM | 183 (2.2%) | 34 (0.6%) |
| 6:00 AM to 6:29 AM | 485 (5.9%) | 235 (3.9%) |
| 6:30 AM to 6:59 AM | 828 (10.1%) | 532 (8.9%) |
| 7:00 AM to 7:29 AM | 1,638 (20.1%) | 1,158 (19.3%) |
| 7:30 AM to 7:59 AM | 1,267 (15.5%) | 1,132 (18.9%) |
| 8:00 AM to 8:29 AM | 1,541 (18.9%) | 1,100 (18.3%) |
| 8:30 AM to 8:59 AM | 318 (3.9%) | 472 (7.9%) |
| 9:00 AM to 9:59 AM | 551 (6.8%) | 638 (10.6%) |
| 10:00 AM to 10:59 AM | 452 (5.5%) | 229 (3.8%) |
| 11:00 AM to 11:59 AM | 216 (2.6%) | 49 (0.8%) |
| 12:00 PM to 3:59 PM | 220 (2.7%) | 147 (2.5%) |
| 4:00 PM to 11:59 PM | 265 (3.2%) | 101 (1.7%) |
| Total | 8,168 (100.0%) | 6,001 (100.0%) |
Housing Occupancy in Lake Oswego
Occupancy by Ownership in Lake Oswego
Of the total 16,649 dwellings in Lake Oswego, owner-occupied units account for 11,672 (70.1%), while renter-occupied units make up 4,977 (29.9%).
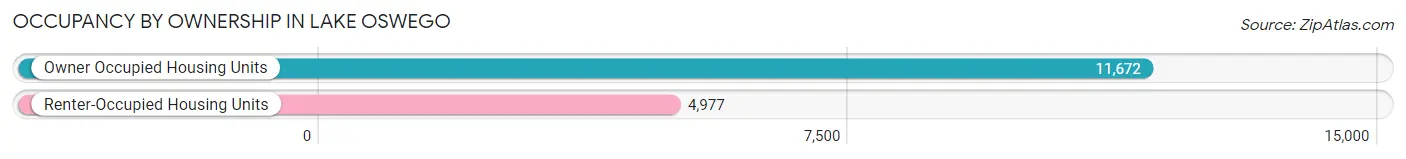
| Occupancy | # Housing Units | % Housing Units |
| Owner Occupied Housing Units | 11,672 | 70.1% |
| Renter-Occupied Housing Units | 4,977 | 29.9% |
| Total Occupied Housing Units | 16,649 | 100.0% |
Occupancy by Household Size in Lake Oswego
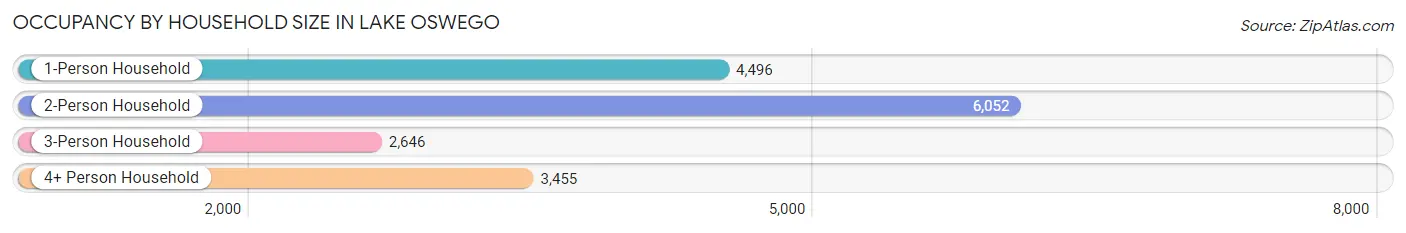
| Household Size | # Housing Units | % Housing Units |
| 1-Person Household | 4,496 | 27.0% |
| 2-Person Household | 6,052 | 36.3% |
| 3-Person Household | 2,646 | 15.9% |
| 4+ Person Household | 3,455 | 20.7% |
| Total Housing Units | 16,649 | 100.0% |
Occupancy by Ownership by Household Size in Lake Oswego
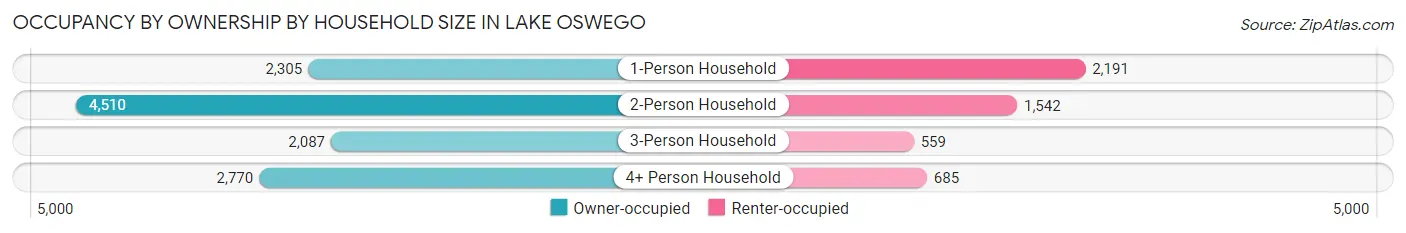
| Household Size | Owner-occupied | Renter-occupied |
| 1-Person Household | 2,305 (51.3%) | 2,191 (48.7%) |
| 2-Person Household | 4,510 (74.5%) | 1,542 (25.5%) |
| 3-Person Household | 2,087 (78.9%) | 559 (21.1%) |
| 4+ Person Household | 2,770 (80.2%) | 685 (19.8%) |
| Total Housing Units | 11,672 (70.1%) | 4,977 (29.9%) |
Occupancy by Educational Attainment in Lake Oswego
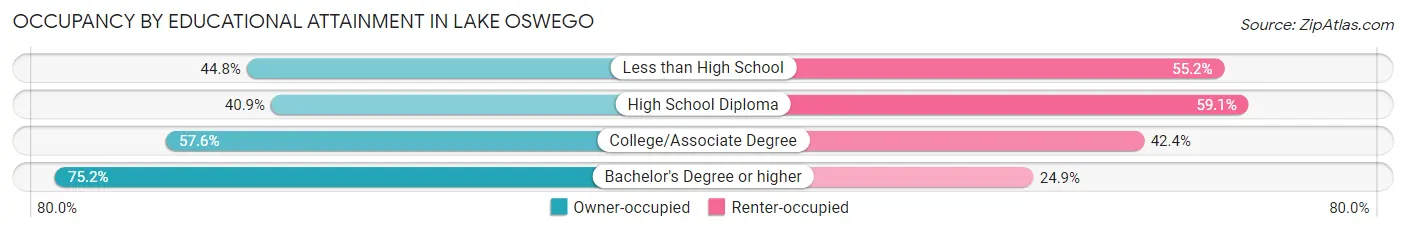
| Household Size | Owner-occupied | Renter-occupied |
| Less than High School | 30 (44.8%) | 37 (55.2%) |
| High School Diploma | 339 (40.9%) | 489 (59.1%) |
| College/Associate Degree | 1,755 (57.6%) | 1,294 (42.4%) |
| Bachelor's Degree or higher | 9,548 (75.1%) | 3,157 (24.8%) |
Occupancy by Age of Householder in Lake Oswego
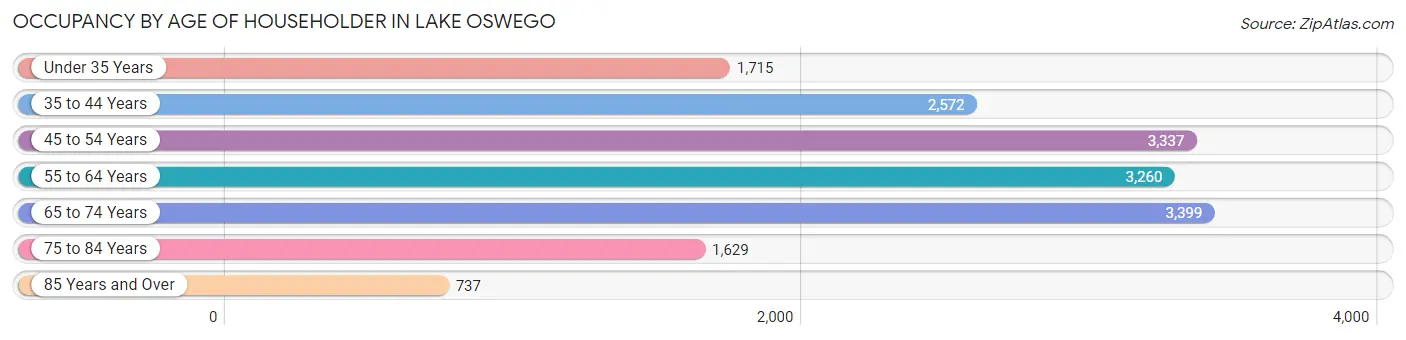
| Age Bracket | # Households | % Households |
| Under 35 Years | 1,715 | 10.3% |
| 35 to 44 Years | 2,572 | 15.4% |
| 45 to 54 Years | 3,337 | 20.0% |
| 55 to 64 Years | 3,260 | 19.6% |
| 65 to 74 Years | 3,399 | 20.4% |
| 75 to 84 Years | 1,629 | 9.8% |
| 85 Years and Over | 737 | 4.4% |
| Total | 16,649 | 100.0% |
Housing Finances in Lake Oswego
Median Income by Occupancy in Lake Oswego
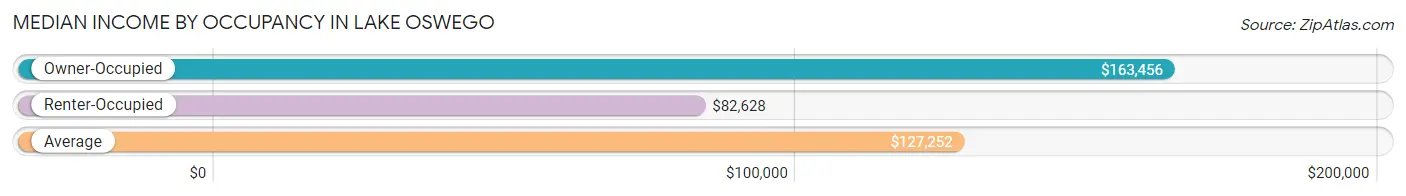
| Occupancy Type | # Households | Median Income |
| Owner-Occupied | 11,672 (70.1%) | $163,456 |
| Renter-Occupied | 4,977 (29.9%) | $82,628 |
| Average | 16,649 (100.0%) | $127,252 |
Occupancy by Householder Income Bracket in Lake Oswego
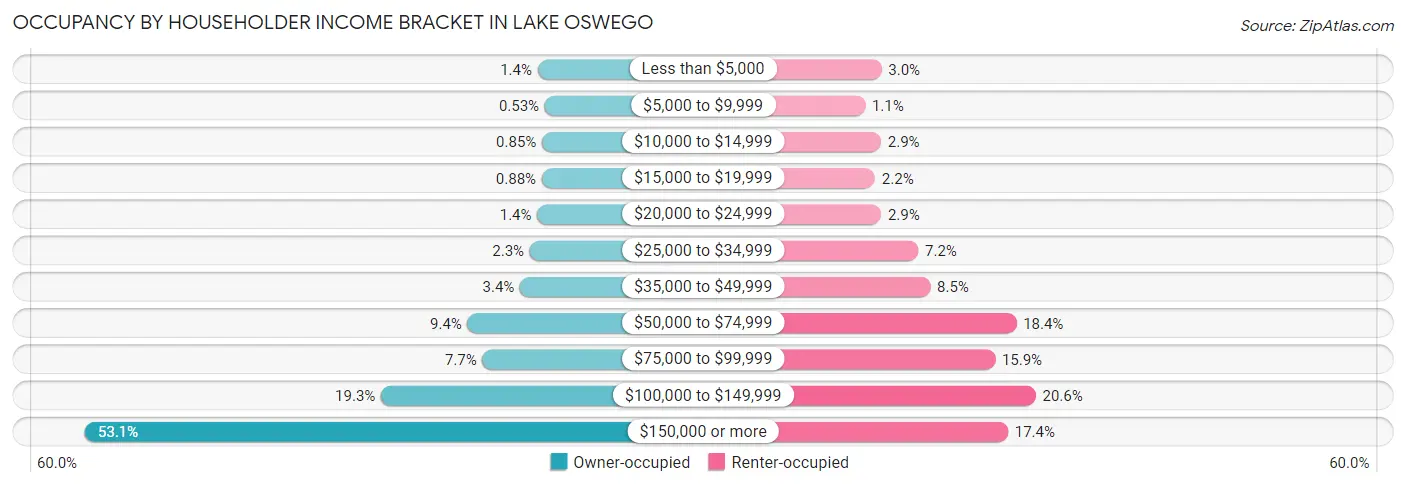
| Income Bracket | Owner-occupied | Renter-occupied |
| Less than $5,000 | 157 (1.3%) | 147 (2.9%) |
| $5,000 to $9,999 | 62 (0.5%) | 54 (1.1%) |
| $10,000 to $14,999 | 99 (0.9%) | 144 (2.9%) |
| $15,000 to $19,999 | 103 (0.9%) | 110 (2.2%) |
| $20,000 to $24,999 | 163 (1.4%) | 145 (2.9%) |
| $25,000 to $34,999 | 263 (2.2%) | 356 (7.1%) |
| $35,000 to $49,999 | 392 (3.4%) | 424 (8.5%) |
| $50,000 to $74,999 | 1,093 (9.4%) | 914 (18.4%) |
| $75,000 to $99,999 | 894 (7.7%) | 793 (15.9%) |
| $100,000 to $149,999 | 2,247 (19.3%) | 1,024 (20.6%) |
| $150,000 or more | 6,199 (53.1%) | 866 (17.4%) |
| Total | 11,672 (100.0%) | 4,977 (100.0%) |
Monthly Housing Cost Tiers in Lake Oswego
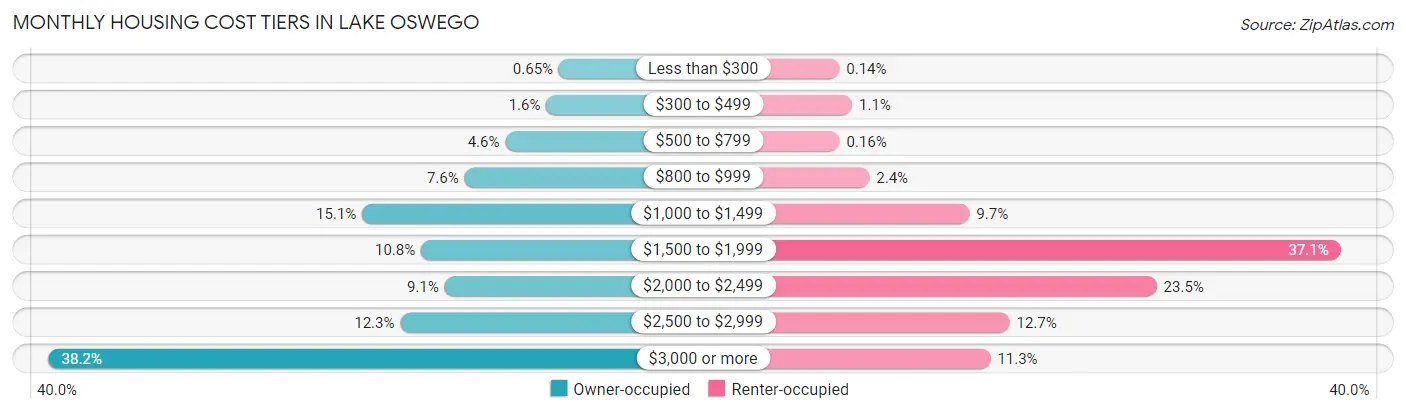
| Monthly Cost | Owner-occupied | Renter-occupied |
| Less than $300 | 76 (0.6%) | 7 (0.1%) |
| $300 to $499 | 185 (1.6%) | 54 (1.1%) |
| $500 to $799 | 537 (4.6%) | 8 (0.2%) |
| $800 to $999 | 887 (7.6%) | 117 (2.4%) |
| $1,000 to $1,499 | 1,767 (15.1%) | 484 (9.7%) |
| $1,500 to $1,999 | 1,260 (10.8%) | 1,844 (37.0%) |
| $2,000 to $2,499 | 1,059 (9.1%) | 1,170 (23.5%) |
| $2,500 to $2,999 | 1,439 (12.3%) | 631 (12.7%) |
| $3,000 or more | 4,462 (38.2%) | 561 (11.3%) |
| Total | 11,672 (100.0%) | 4,977 (100.0%) |
Physical Housing Characteristics in Lake Oswego
Housing Structures in Lake Oswego
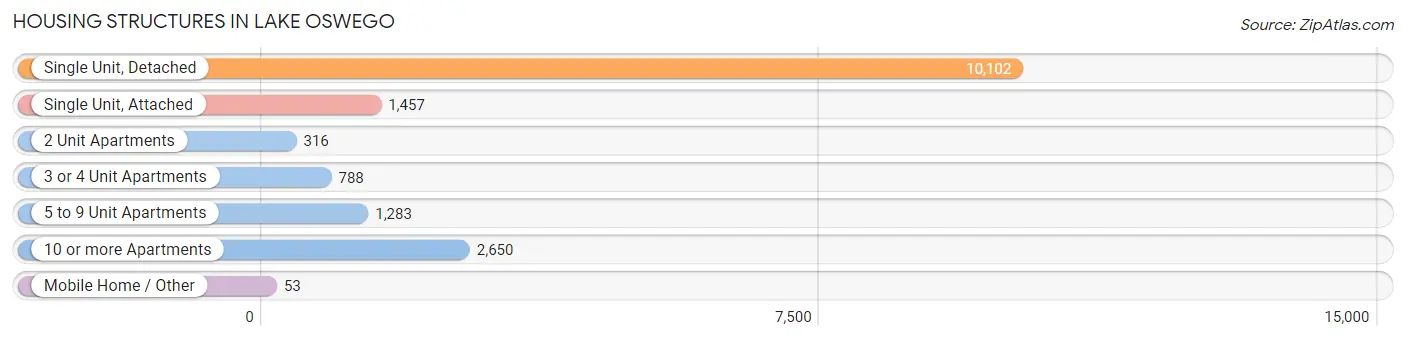
| Structure Type | # Housing Units | % Housing Units |
| Single Unit, Detached | 10,102 | 60.7% |
| Single Unit, Attached | 1,457 | 8.7% |
| 2 Unit Apartments | 316 | 1.9% |
| 3 or 4 Unit Apartments | 788 | 4.7% |
| 5 to 9 Unit Apartments | 1,283 | 7.7% |
| 10 or more Apartments | 2,650 | 15.9% |
| Mobile Home / Other | 53 | 0.3% |
| Total | 16,649 | 100.0% |
Housing Structures by Occupancy in Lake Oswego
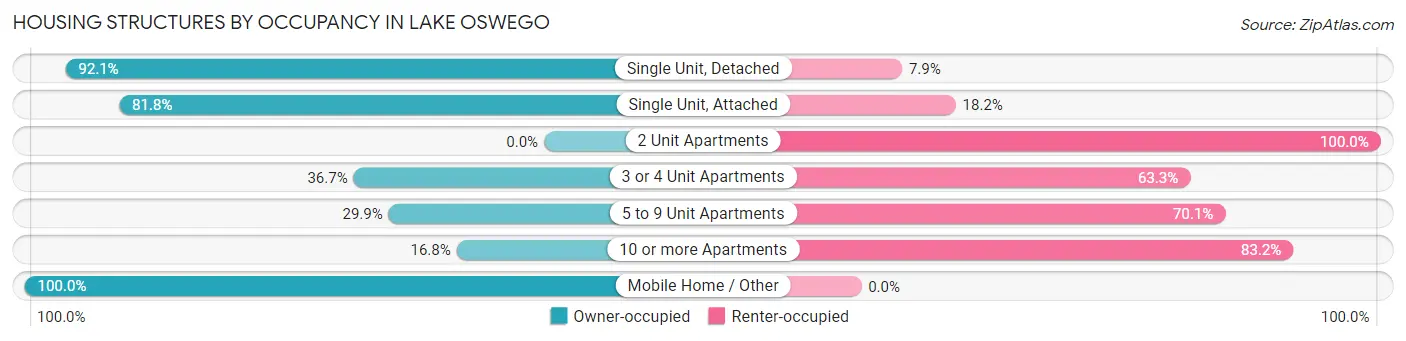
| Structure Type | Owner-occupied | Renter-occupied |
| Single Unit, Detached | 9,308 (92.1%) | 794 (7.9%) |
| Single Unit, Attached | 1,192 (81.8%) | 265 (18.2%) |
| 2 Unit Apartments | 0 (0.0%) | 316 (100.0%) |
| 3 or 4 Unit Apartments | 289 (36.7%) | 499 (63.3%) |
| 5 to 9 Unit Apartments | 384 (29.9%) | 899 (70.1%) |
| 10 or more Apartments | 446 (16.8%) | 2,204 (83.2%) |
| Mobile Home / Other | 53 (100.0%) | 0 (0.0%) |
| Total | 11,672 (70.1%) | 4,977 (29.9%) |
Housing Structures by Number of Rooms in Lake Oswego
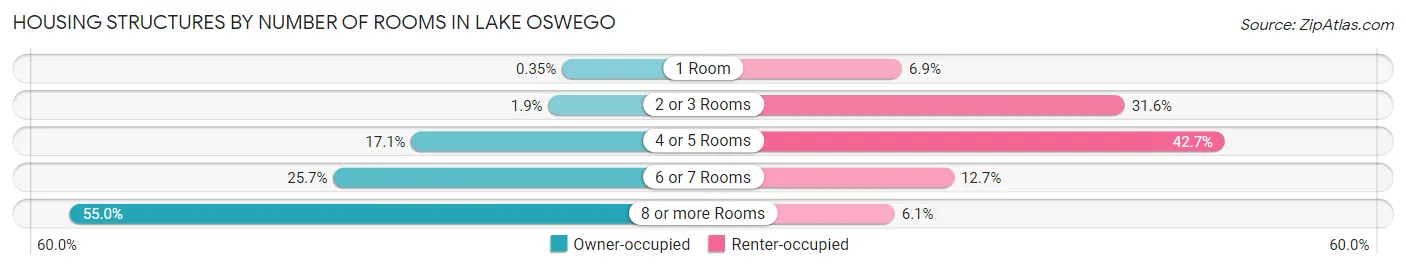
| Number of Rooms | Owner-occupied | Renter-occupied |
| 1 Room | 41 (0.4%) | 344 (6.9%) |
| 2 or 3 Rooms | 217 (1.9%) | 1,574 (31.6%) |
| 4 or 5 Rooms | 1,992 (17.1%) | 2,126 (42.7%) |
| 6 or 7 Rooms | 3,003 (25.7%) | 630 (12.7%) |
| 8 or more Rooms | 6,419 (55.0%) | 303 (6.1%) |
| Total | 11,672 (100.0%) | 4,977 (100.0%) |
Housing Structure by Heating Type in Lake Oswego
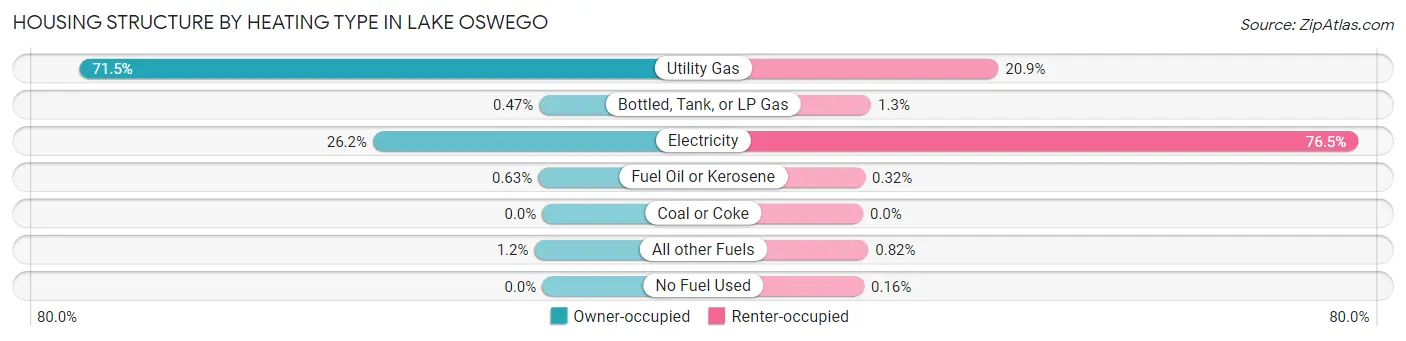
| Heating Type | Owner-occupied | Renter-occupied |
| Utility Gas | 8,348 (71.5%) | 1,041 (20.9%) |
| Bottled, Tank, or LP Gas | 55 (0.5%) | 62 (1.3%) |
| Electricity | 3,055 (26.2%) | 3,809 (76.5%) |
| Fuel Oil or Kerosene | 73 (0.6%) | 16 (0.3%) |
| Coal or Coke | 0 (0.0%) | 0 (0.0%) |
| All other Fuels | 141 (1.2%) | 41 (0.8%) |
| No Fuel Used | 0 (0.0%) | 8 (0.2%) |
| Total | 11,672 (100.0%) | 4,977 (100.0%) |
Household Vehicle Usage in Lake Oswego
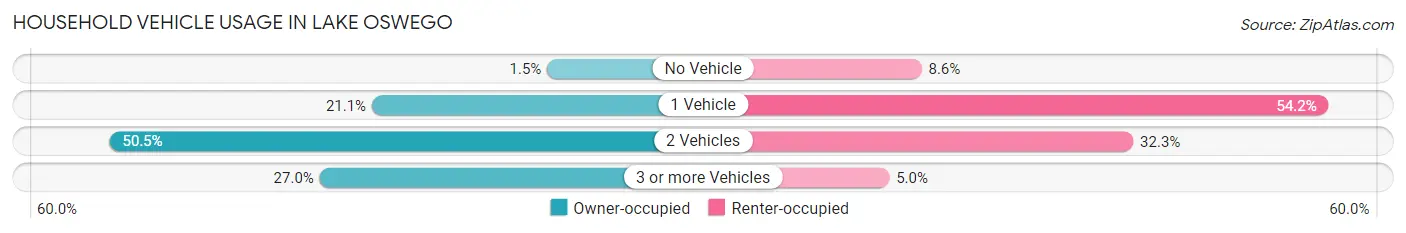
| Vehicles per Household | Owner-occupied | Renter-occupied |
| No Vehicle | 170 (1.5%) | 427 (8.6%) |
| 1 Vehicle | 2,462 (21.1%) | 2,696 (54.2%) |
| 2 Vehicles | 5,894 (50.5%) | 1,607 (32.3%) |
| 3 or more Vehicles | 3,146 (27.0%) | 247 (5.0%) |
| Total | 11,672 (100.0%) | 4,977 (100.0%) |
Real Estate & Mortgages in Lake Oswego
Real Estate and Mortgage Overview in Lake Oswego
| Characteristic | Without Mortgage | With Mortgage |
| Housing Units | 3,819 | 7,853 |
| Median Property Value | $820,000 | $827,700 |
| Median Household Income | $127,664 | $4,561 |
| Monthly Housing Costs | $1,161 | $4,351 |
| Real Estate Taxes | $7,977 | $101 |
Property Value by Mortgage Status in Lake Oswego
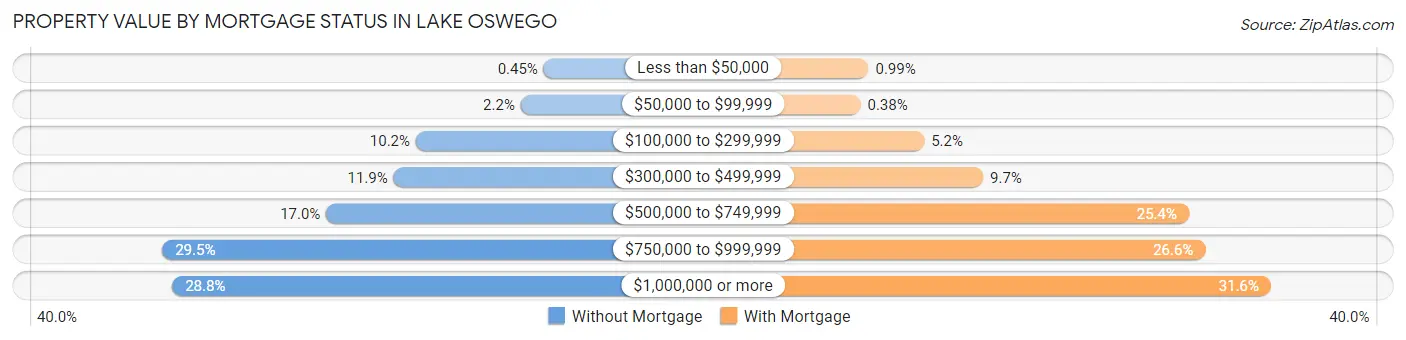
| Property Value | Without Mortgage | With Mortgage |
| Less than $50,000 | 17 (0.4%) | 78 (1.0%) |
| $50,000 to $99,999 | 84 (2.2%) | 30 (0.4%) |
| $100,000 to $299,999 | 389 (10.2%) | 411 (5.2%) |
| $300,000 to $499,999 | 454 (11.9%) | 763 (9.7%) |
| $500,000 to $749,999 | 650 (17.0%) | 1,994 (25.4%) |
| $750,000 to $999,999 | 1,127 (29.5%) | 2,092 (26.6%) |
| $1,000,000 or more | 1,098 (28.7%) | 2,485 (31.6%) |
| Total | 3,819 (100.0%) | 7,853 (100.0%) |
Household Income by Mortgage Status in Lake Oswego
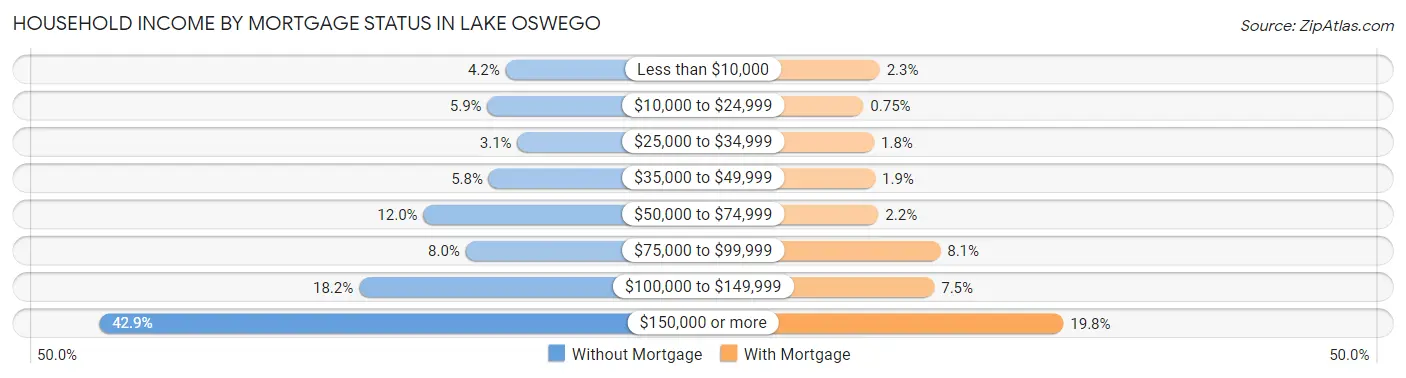
| Household Income | Without Mortgage | With Mortgage |
| Less than $10,000 | 160 (4.2%) | 181 (2.3%) |
| $10,000 to $24,999 | 226 (5.9%) | 59 (0.7%) |
| $25,000 to $34,999 | 117 (3.1%) | 139 (1.8%) |
| $35,000 to $49,999 | 221 (5.8%) | 146 (1.9%) |
| $50,000 to $74,999 | 459 (12.0%) | 171 (2.2%) |
| $75,000 to $99,999 | 305 (8.0%) | 634 (8.1%) |
| $100,000 to $149,999 | 693 (18.1%) | 589 (7.5%) |
| $150,000 or more | 1,638 (42.9%) | 1,554 (19.8%) |
| Total | 3,819 (100.0%) | 7,853 (100.0%) |
Property Value to Household Income Ratio in Lake Oswego
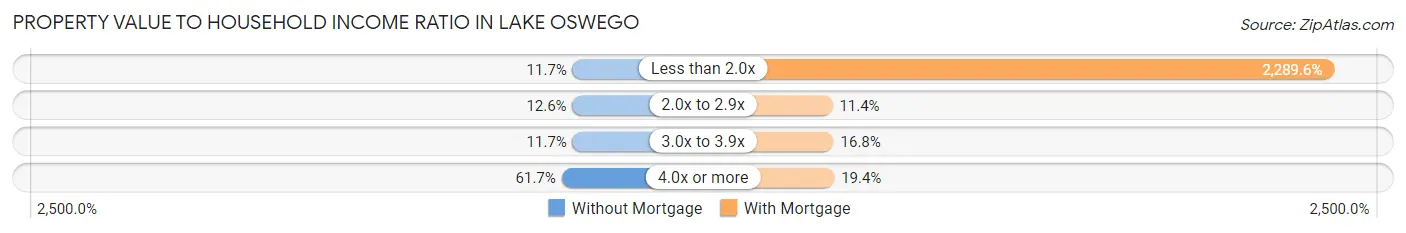
| Value-to-Income Ratio | Without Mortgage | With Mortgage |
| Less than 2.0x | 448 (11.7%) | 179,801 (2,289.6%) |
| 2.0x to 2.9x | 480 (12.6%) | 895 (11.4%) |
| 3.0x to 3.9x | 445 (11.7%) | 1,318 (16.8%) |
| 4.0x or more | 2,357 (61.7%) | 1,522 (19.4%) |
| Total | 3,819 (100.0%) | 7,853 (100.0%) |
Real Estate Taxes by Mortgage Status in Lake Oswego
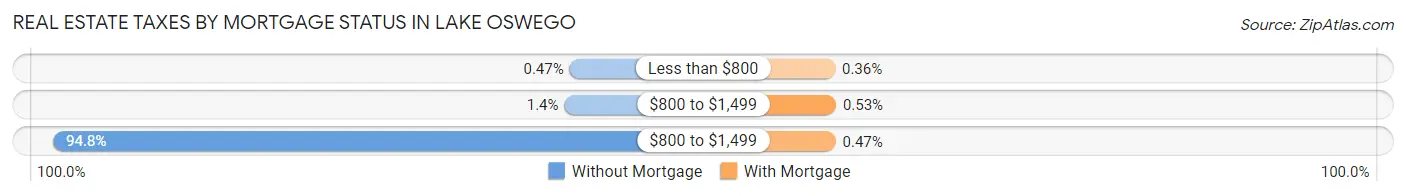
| Property Taxes | Without Mortgage | With Mortgage |
| Less than $800 | 18 (0.5%) | 28 (0.4%) |
| $800 to $1,499 | 54 (1.4%) | 42 (0.5%) |
| $800 to $1,499 | 3,620 (94.8%) | 37 (0.5%) |
| Total | 3,819 (100.0%) | 7,853 (100.0%) |
Health & Disability in Lake Oswego
Health Insurance Coverage by Age in Lake Oswego
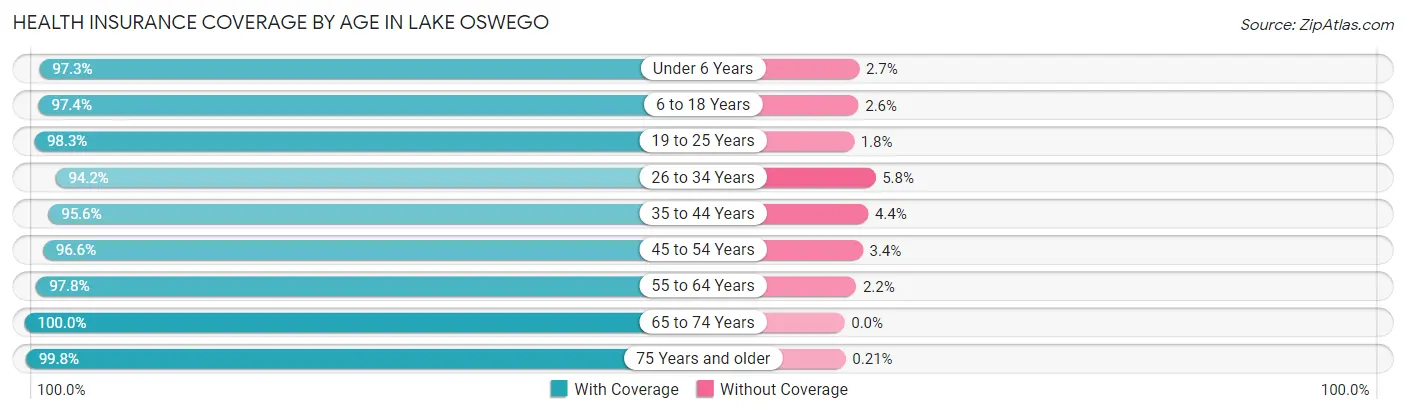
| Age Bracket | With Coverage | Without Coverage |
| Under 6 Years | 2,424 (97.3%) | 68 (2.7%) |
| 6 to 18 Years | 6,820 (97.4%) | 183 (2.6%) |
| 19 to 25 Years | 1,741 (98.3%) | 31 (1.8%) |
| 26 to 34 Years | 3,270 (94.2%) | 200 (5.8%) |
| 35 to 44 Years | 4,888 (95.6%) | 226 (4.4%) |
| 45 to 54 Years | 5,876 (96.6%) | 207 (3.4%) |
| 55 to 64 Years | 5,440 (97.8%) | 121 (2.2%) |
| 65 to 74 Years | 5,497 (100.0%) | 0 (0.0%) |
| 75 Years and older | 3,318 (99.8%) | 7 (0.2%) |
| Total | 39,274 (97.4%) | 1,043 (2.6%) |
Health Insurance Coverage by Citizenship Status in Lake Oswego
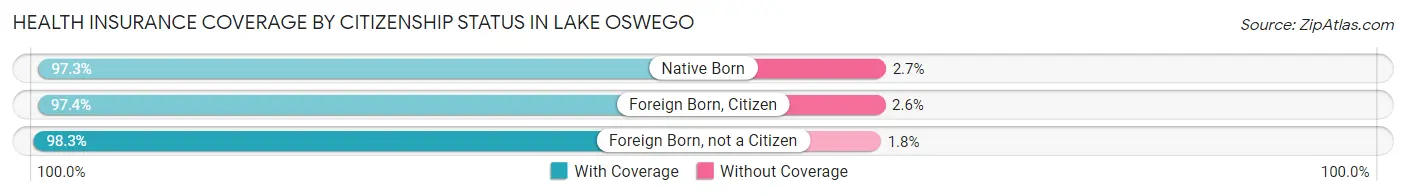
| Citizenship Status | With Coverage | Without Coverage |
| Native Born | 2,424 (97.3%) | 68 (2.7%) |
| Foreign Born, Citizen | 6,820 (97.4%) | 183 (2.6%) |
| Foreign Born, not a Citizen | 1,741 (98.3%) | 31 (1.8%) |
Health Insurance Coverage by Household Income in Lake Oswego
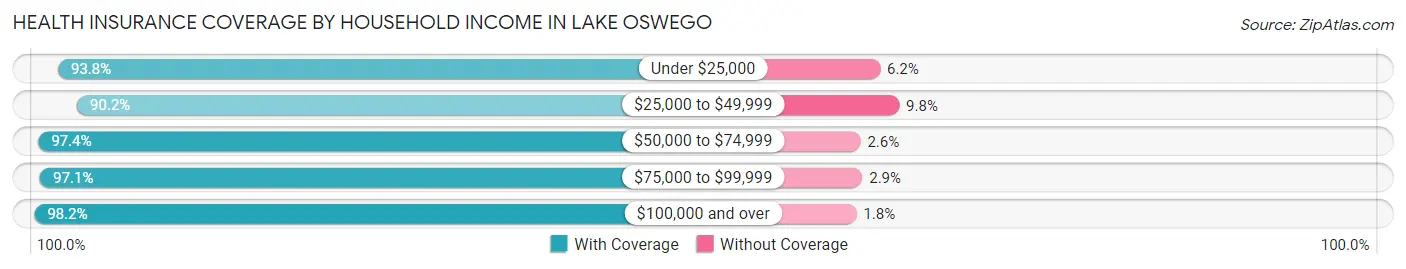
| Household Income | With Coverage | Without Coverage |
| Under $25,000 | 1,670 (93.8%) | 111 (6.2%) |
| $25,000 to $49,999 | 1,913 (90.2%) | 208 (9.8%) |
| $50,000 to $74,999 | 4,035 (97.4%) | 106 (2.6%) |
| $75,000 to $99,999 | 2,978 (97.1%) | 89 (2.9%) |
| $100,000 and over | 28,639 (98.2%) | 529 (1.8%) |
Public vs Private Health Insurance Coverage by Age in Lake Oswego
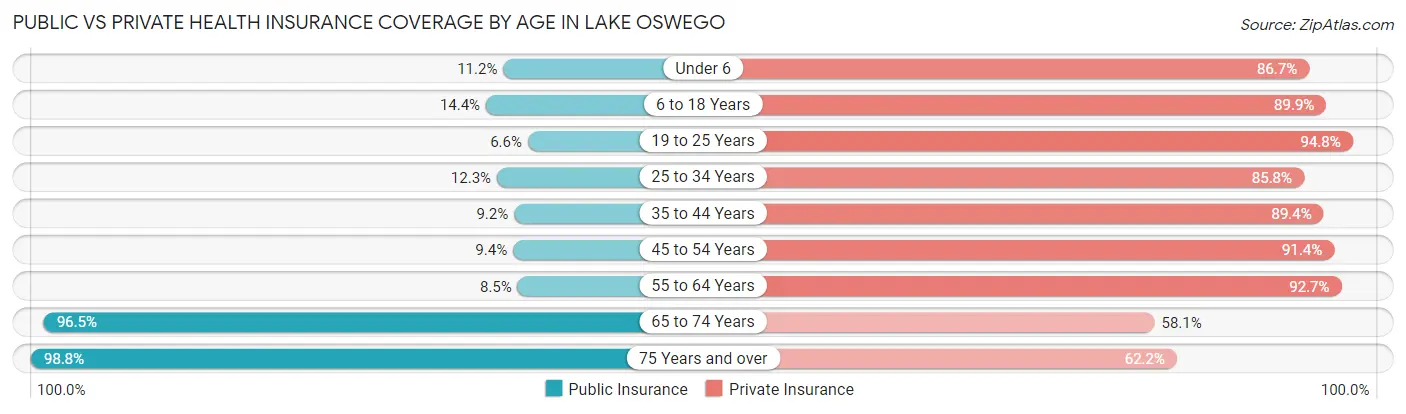
| Age Bracket | Public Insurance | Private Insurance |
| Under 6 | 278 (11.2%) | 2,161 (86.7%) |
| 6 to 18 Years | 1,006 (14.4%) | 6,296 (89.9%) |
| 19 to 25 Years | 117 (6.6%) | 1,680 (94.8%) |
| 25 to 34 Years | 428 (12.3%) | 2,976 (85.8%) |
| 35 to 44 Years | 468 (9.1%) | 4,573 (89.4%) |
| 45 to 54 Years | 569 (9.3%) | 5,558 (91.4%) |
| 55 to 64 Years | 472 (8.5%) | 5,156 (92.7%) |
| 65 to 74 Years | 5,302 (96.5%) | 3,191 (58.1%) |
| 75 Years and over | 3,286 (98.8%) | 2,067 (62.2%) |
| Total | 11,926 (29.6%) | 33,658 (83.5%) |
Disability Status by Sex by Age in Lake Oswego
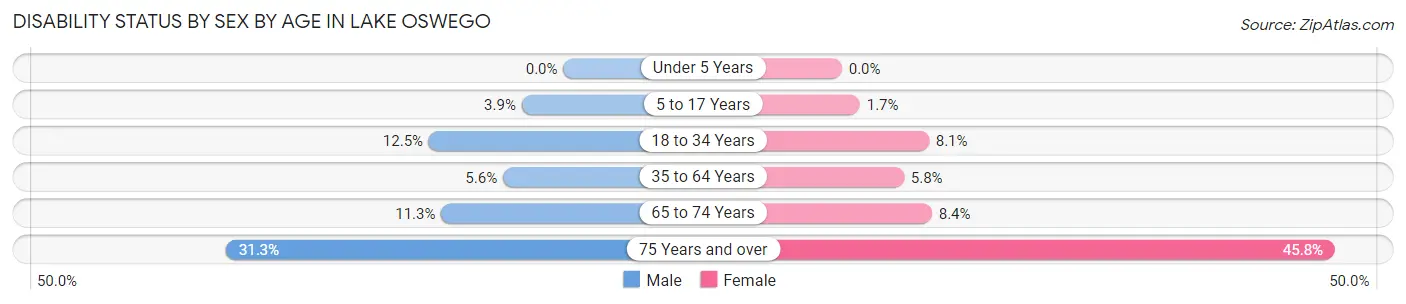
| Age Bracket | Male | Female |
| Under 5 Years | 0 (0.0%) | 0 (0.0%) |
| 5 to 17 Years | 159 (3.9%) | 51 (1.7%) |
| 18 to 34 Years | 399 (12.5%) | 191 (8.1%) |
| 35 to 64 Years | 462 (5.6%) | 490 (5.8%) |
| 65 to 74 Years | 289 (11.3%) | 246 (8.4%) |
| 75 Years and over | 450 (31.3%) | 864 (45.8%) |
Disability Class by Sex by Age in Lake Oswego
Disability Class: Hearing Difficulty
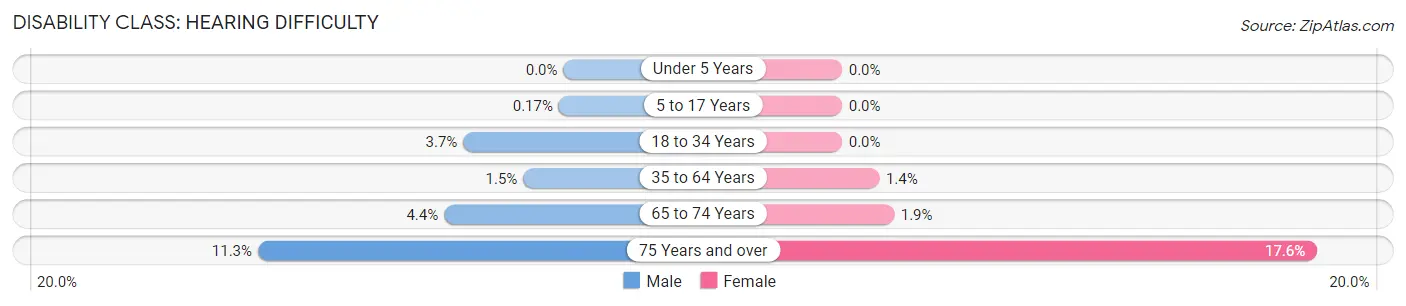
| Age Bracket | Male | Female |
| Under 5 Years | 0 (0.0%) | 0 (0.0%) |
| 5 to 17 Years | 7 (0.2%) | 0 (0.0%) |
| 18 to 34 Years | 119 (3.7%) | 0 (0.0%) |
| 35 to 64 Years | 123 (1.5%) | 117 (1.4%) |
| 65 to 74 Years | 113 (4.4%) | 57 (1.9%) |
| 75 Years and over | 163 (11.3%) | 333 (17.6%) |
Disability Class: Vision Difficulty
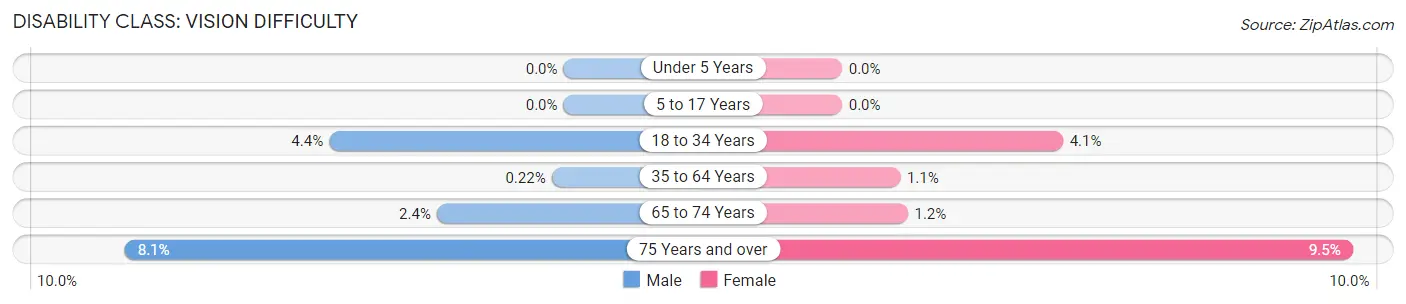
| Age Bracket | Male | Female |
| Under 5 Years | 0 (0.0%) | 0 (0.0%) |
| 5 to 17 Years | 0 (0.0%) | 0 (0.0%) |
| 18 to 34 Years | 139 (4.3%) | 97 (4.1%) |
| 35 to 64 Years | 18 (0.2%) | 92 (1.1%) |
| 65 to 74 Years | 60 (2.4%) | 36 (1.2%) |
| 75 Years and over | 117 (8.1%) | 179 (9.5%) |
Disability Class: Cognitive Difficulty
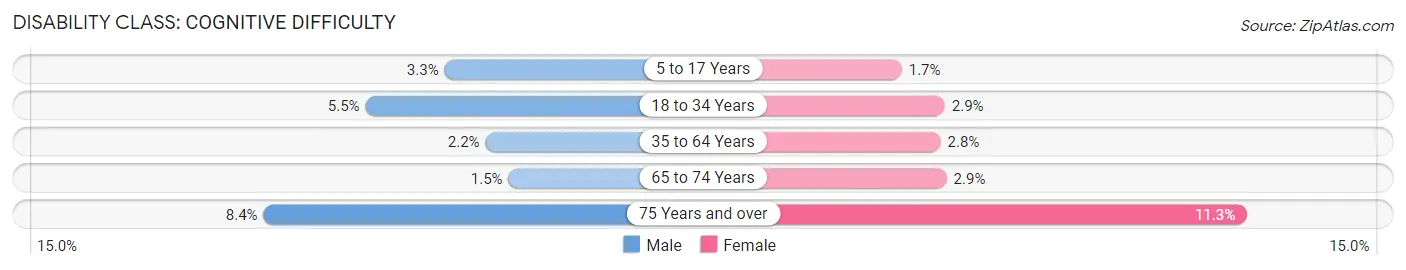
| Age Bracket | Male | Female |
| 5 to 17 Years | 136 (3.3%) | 51 (1.7%) |
| 18 to 34 Years | 176 (5.5%) | 68 (2.9%) |
| 35 to 64 Years | 179 (2.2%) | 234 (2.8%) |
| 65 to 74 Years | 39 (1.5%) | 86 (2.9%) |
| 75 Years and over | 120 (8.4%) | 213 (11.3%) |
Disability Class: Ambulatory Difficulty
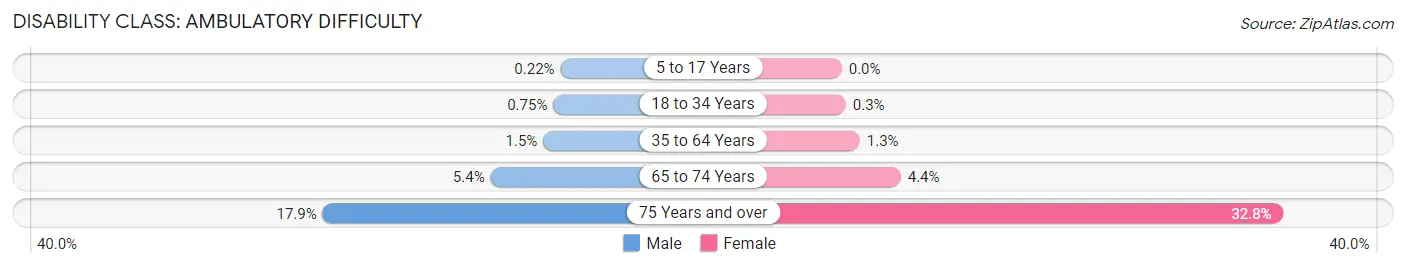
| Age Bracket | Male | Female |
| 5 to 17 Years | 9 (0.2%) | 0 (0.0%) |
| 18 to 34 Years | 24 (0.7%) | 7 (0.3%) |
| 35 to 64 Years | 124 (1.5%) | 114 (1.3%) |
| 65 to 74 Years | 138 (5.4%) | 129 (4.4%) |
| 75 Years and over | 257 (17.9%) | 619 (32.8%) |
Disability Class: Self-Care Difficulty
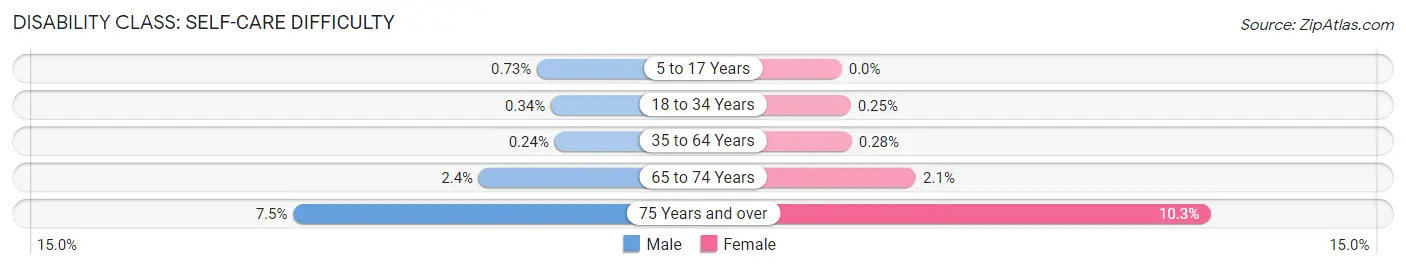
| Age Bracket | Male | Female |
| 5 to 17 Years | 30 (0.7%) | 0 (0.0%) |
| 18 to 34 Years | 11 (0.3%) | 6 (0.3%) |
| 35 to 64 Years | 20 (0.2%) | 24 (0.3%) |
| 65 to 74 Years | 60 (2.4%) | 61 (2.1%) |
| 75 Years and over | 108 (7.5%) | 194 (10.3%) |
Technology Access in Lake Oswego
Computing Device Access in Lake Oswego
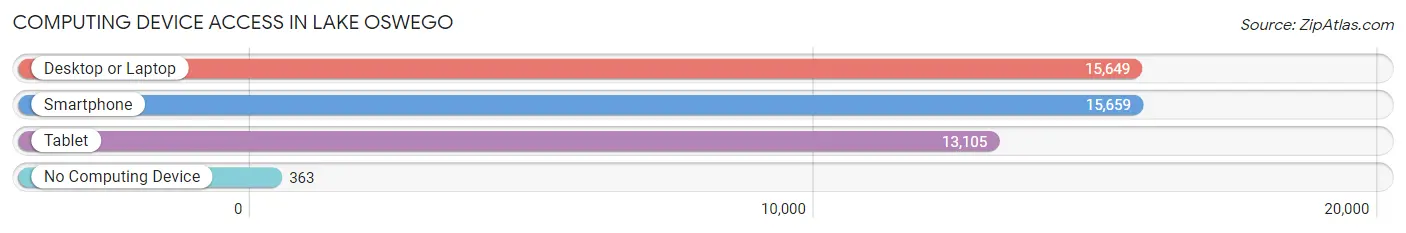
| Device Type | # Households | % Households |
| Desktop or Laptop | 15,649 | 94.0% |
| Smartphone | 15,659 | 94.1% |
| Tablet | 13,105 | 78.7% |
| No Computing Device | 363 | 2.2% |
| Total | 16,649 | 100.0% |
Internet Access in Lake Oswego
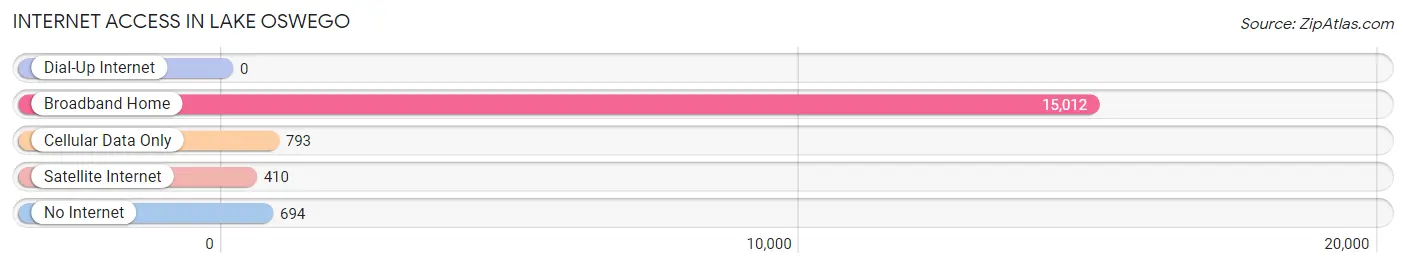
| Internet Type | # Households | % Households |
| Dial-Up Internet | 0 | 0.0% |
| Broadband Home | 15,012 | 90.2% |
| Cellular Data Only | 793 | 4.8% |
| Satellite Internet | 410 | 2.5% |
| No Internet | 694 | 4.2% |
| Total | 16,649 | 100.0% |
Lake Oswego Summary
Lake Oswego is a city located in the state of Oregon, in the United States. It is located in Clackamas County, about 8 miles south of Portland. The city has a population of approximately 39,000 people, making it the fifth-largest city in the state.
History
The area that is now Lake Oswego was originally inhabited by the Clackamas Indians, who lived in the area for thousands of years before the arrival of European settlers. The first European settlers arrived in the area in the early 1800s, and the city was officially incorporated in 1910.
The city was named after Oswego Lake, which was named after the Oswego River, which was named after the Oswego Indians, who lived in the area prior to the arrival of the Europeans. The city was originally a small farming community, but it began to grow in the late 19th century when the Oregon Iron and Steel Company opened a steel mill in the area.
The city continued to grow throughout the 20th century, and by the 1970s it had become a popular suburb of Portland. The city has continued to grow since then, and today it is a thriving community with a strong economy and a vibrant culture.
Geography
Lake Oswego is located in the Willamette Valley, in the northwestern part of Oregon. The city is situated on the banks of the Willamette River, and is surrounded by the Tualatin Mountains to the west and the Cascade Mountains to the east. The city covers an area of approximately 10 square miles, and is located about 8 miles south of Portland.
The climate in Lake Oswego is mild and temperate, with warm summers and cool winters. The average annual temperature is around 50 degrees Fahrenheit, and the average annual precipitation is around 40 inches.
Economy
The economy of Lake Oswego is largely based on the service industry, with many residents employed in retail, healthcare, education, and other service-related industries. The city is also home to several large companies, including Intel, Nike, and Tektronix.
The city is also home to several large shopping centers, including the Lake Grove Shopping Center and the Bridgeport Village Shopping Center. The city is also home to several parks and recreational areas, including the Oswego Lake Park and the Tryon Creek State Natural Area.
Demographics
As of the 2010 census, the population of Lake Oswego was 39,179. The racial makeup of the city was 87.3% White, 4.2% Asian, 2.2% African American, 0.4% Native American, 0.1% Pacific Islander, and 5.8% from other races. The median household income was $77,837, and the median family income was $93,919.
The city is home to several educational institutions, including the Lake Oswego School District, the Oregon Episcopal School, and the Marylhurst University. The city is also home to several churches, including the Lake Oswego United Methodist Church and the Lake Oswego Presbyterian Church.
Conclusion
Lake Oswego is a vibrant city located in the state of Oregon. It has a rich history, a beautiful geography, and a strong economy. The city is home to a diverse population, and is home to several educational institutions and churches. The city is a great place to live, work, and play, and is a great place to call home.
Common Questions
What is Per Capita Income in Lake Oswego?
Per Capita income in Lake Oswego is $82,157.
What is the Median Family Income in Lake Oswego?
Median Family Income in Lake Oswego is $166,154.
What is the Median Household income in Lake Oswego?
Median Household Income in Lake Oswego is $127,252.
What is Income or Wage Gap in Lake Oswego?
Income or Wage Gap in Lake Oswego is 35.2%.
Women in Lake Oswego earn 64.8 cents for every dollar earned by a man.
What is Inequality or Gini Index in Lake Oswego?
Inequality or Gini Index in Lake Oswego is 0.50.
What is the Total Population of Lake Oswego?
Total Population of Lake Oswego is 40,457.
What is the Total Male Population of Lake Oswego?
Total Male Population of Lake Oswego is 20,695.
What is the Total Female Population of Lake Oswego?
Total Female Population of Lake Oswego is 19,762.
What is the Ratio of Males per 100 Females in Lake Oswego?
There are 104.72 Males per 100 Females in Lake Oswego.
What is the Ratio of Females per 100 Males in Lake Oswego?
There are 95.49 Females per 100 Males in Lake Oswego.
What is the Median Population Age in Lake Oswego?
Median Population Age in Lake Oswego is 45.8 Years.
What is the Average Family Size in Lake Oswego
Average Family Size in Lake Oswego is 2.9 People.
What is the Average Household Size in Lake Oswego
Average Household Size in Lake Oswego is 2.4 People.
How Large is the Labor Force in Lake Oswego?
There are 19,927 People in the Labor Forcein in Lake Oswego.
What is the Percentage of People in the Labor Force in Lake Oswego?
61.2% of People are in the Labor Force in Lake Oswego.
What is the Unemployment Rate in Lake Oswego?
Unemployment Rate in Lake Oswego is 4.6%.