Redding, CA Map & Demographics
Redding Map
Redding Overview
$35,923
PER CAPITA INCOME
$84,168
AVG FAMILY INCOME
$67,323
AVG HOUSEHOLD INCOME
25.2%
WAGE / INCOME GAP [ % ]
74.8¢/ $1
WAGE / INCOME GAP [ $ ]
$11,217
FAMILY INCOME DEFICIT
0.44
INEQUALITY / GINI INDEX
93,327
TOTAL POPULATION
45,507
MALE POPULATION
47,820
FEMALE POPULATION
95.16
MALES / 100 FEMALES
105.08
FEMALES / 100 MALES
38.8
MEDIAN AGE
3.0
AVG FAMILY SIZE
2.5
AVG HOUSEHOLD SIZE
43,550
LABOR FORCE [ PEOPLE ]
58.3%
PERCENT IN LABOR FORCE
5.9%
UNEMPLOYMENT RATE
Redding Area Codes
Income in Redding
Income Overview in Redding
Per Capita Income in Redding is $35,923, while median incomes of families and households are $84,168 and $67,323 respectively.
| Characteristic | Number | Measure |
| Per Capita Income | 93,327 | $35,923 |
| Median Family Income | 22,105 | $84,168 |
| Mean Family Income | 22,105 | $105,161 |
| Median Household Income | 36,522 | $67,323 |
| Mean Household Income | 36,522 | $89,349 |
| Income Deficit | 22,105 | $11,217 |
| Wage / Income Gap (%) | 93,327 | 25.20% |
| Wage / Income Gap ($) | 93,327 | 74.80¢ per $1 |
| Gini / Inequality Index | 93,327 | 0.44 |
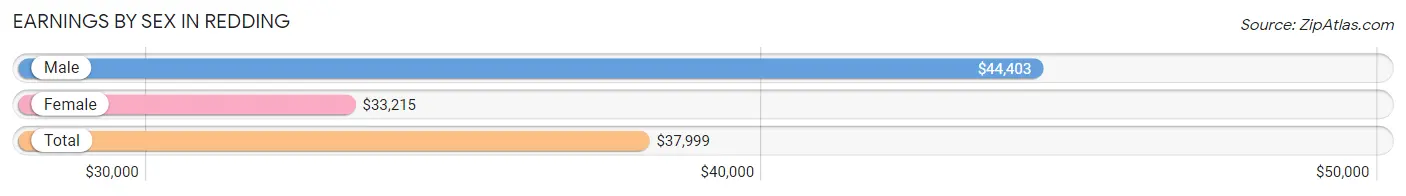
Earnings by Sex in Redding
Average Earnings in Redding are $37,999, $44,403 for men and $33,215 for women, a difference of 25.2%.
| Sex | Number | Average Earnings |
| Male | 23,119 (51.0%) | $44,403 |
| Female | 22,166 (48.9%) | $33,215 |
| Total | 45,285 (100.0%) | $37,999 |
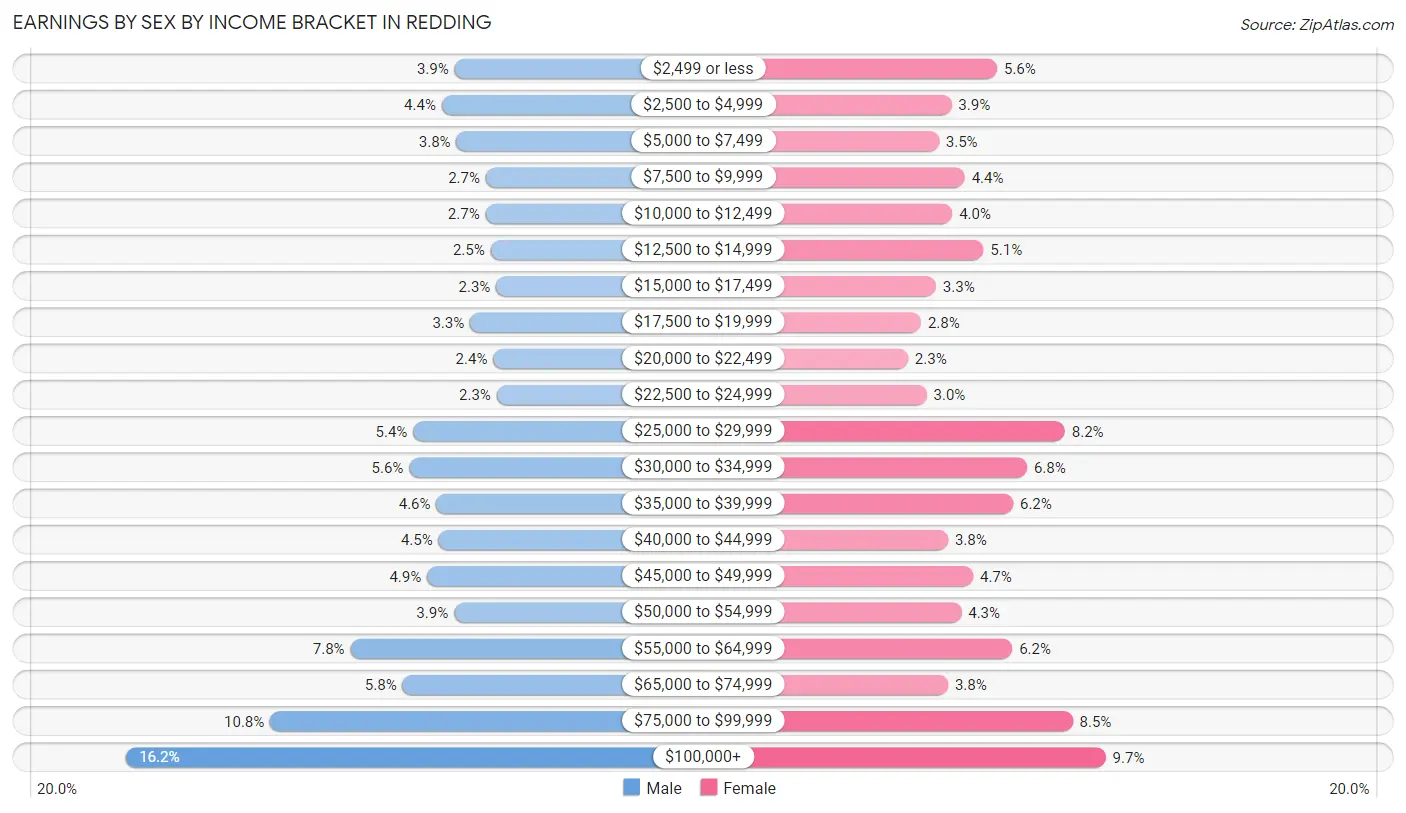
Earnings by Sex by Income Bracket in Redding
The most common earnings brackets in Redding are $100,000+ for men (3,743 | 16.2%) and $100,000+ for women (2,151 | 9.7%).
| Income | Male | Female |
| $2,499 or less | 900 (3.9%) | 1,248 (5.6%) |
| $2,500 to $4,999 | 1,011 (4.4%) | 868 (3.9%) |
| $5,000 to $7,499 | 882 (3.8%) | 764 (3.5%) |
| $7,500 to $9,999 | 629 (2.7%) | 980 (4.4%) |
| $10,000 to $12,499 | 631 (2.7%) | 875 (4.0%) |
| $12,500 to $14,999 | 587 (2.5%) | 1,136 (5.1%) |
| $15,000 to $17,499 | 539 (2.3%) | 740 (3.3%) |
| $17,500 to $19,999 | 766 (3.3%) | 617 (2.8%) |
| $20,000 to $22,499 | 564 (2.4%) | 507 (2.3%) |
| $22,500 to $24,999 | 533 (2.3%) | 662 (3.0%) |
| $25,000 to $29,999 | 1,258 (5.4%) | 1,812 (8.2%) |
| $30,000 to $34,999 | 1,292 (5.6%) | 1,496 (6.8%) |
| $35,000 to $39,999 | 1,057 (4.6%) | 1,381 (6.2%) |
| $40,000 to $44,999 | 1,039 (4.5%) | 840 (3.8%) |
| $45,000 to $49,999 | 1,137 (4.9%) | 1,049 (4.7%) |
| $50,000 to $54,999 | 904 (3.9%) | 950 (4.3%) |
| $55,000 to $64,999 | 1,800 (7.8%) | 1,374 (6.2%) |
| $65,000 to $74,999 | 1,351 (5.8%) | 841 (3.8%) |
| $75,000 to $99,999 | 2,496 (10.8%) | 1,875 (8.5%) |
| $100,000+ | 3,743 (16.2%) | 2,151 (9.7%) |
| Total | 23,119 (100.0%) | 22,166 (100.0%) |
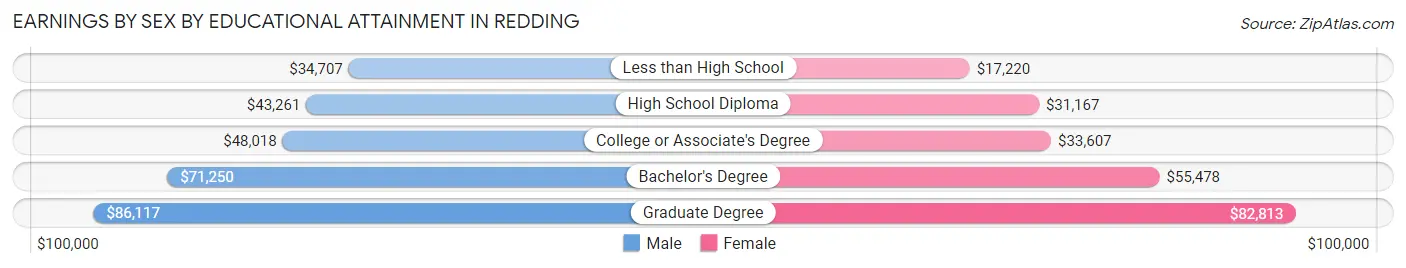
Earnings by Sex by Educational Attainment in Redding
Average earnings in Redding are $51,168 for men and $38,627 for women, a difference of 24.5%. Men with an educational attainment of graduate degree enjoy the highest average annual earnings of $86,117, while those with less than high school education earn the least with $34,707. Women with an educational attainment of graduate degree earn the most with the average annual earnings of $82,813, while those with less than high school education have the smallest earnings of $17,220.
| Educational Attainment | Male Income | Female Income |
| Less than High School | $34,707 | $17,220 |
| High School Diploma | $43,261 | $31,167 |
| College or Associate's Degree | $48,018 | $33,607 |
| Bachelor's Degree | $71,250 | $55,478 |
| Graduate Degree | $86,117 | $82,813 |
| Total | $51,168 | $38,627 |
Family Income in Redding
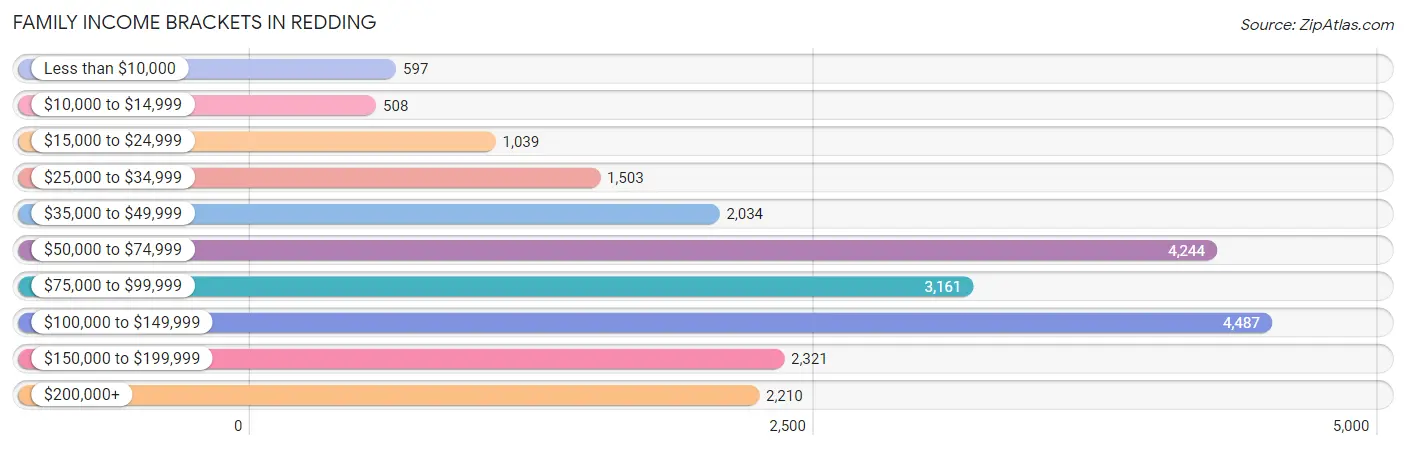
Family Income Brackets in Redding
According to the Redding family income data, there are 4,487 families falling into the $100,000 to $149,999 income range, which is the most common income bracket and makes up 20.3% of all families. Conversely, the $10,000 to $14,999 income bracket is the least frequent group with only 508 families (2.3%) belonging to this category.
| Income Bracket | # Families | % Families |
| Less than $10,000 | 597 | 2.7% |
| $10,000 to $14,999 | 508 | 2.3% |
| $15,000 to $24,999 | 1,039 | 4.7% |
| $25,000 to $34,999 | 1,503 | 6.8% |
| $35,000 to $49,999 | 2,034 | 9.2% |
| $50,000 to $74,999 | 4,244 | 19.2% |
| $75,000 to $99,999 | 3,161 | 14.3% |
| $100,000 to $149,999 | 4,487 | 20.3% |
| $150,000 to $199,999 | 2,321 | 10.5% |
| $200,000+ | 2,210 | 10.0% |
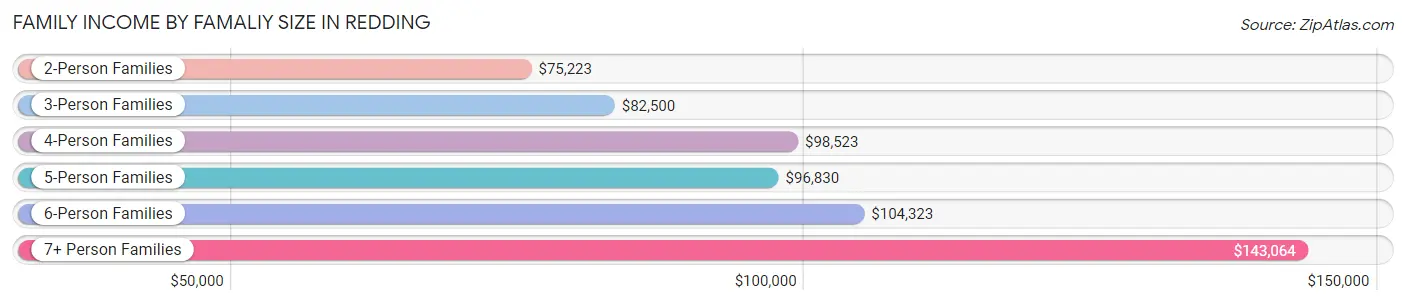
Family Income by Famaliy Size in Redding
7+ person families (415 | 1.9%) account for the highest median family income in Redding with $143,064 per family, while 2-person families (11,421 | 51.7%) have the highest median income of $37,612 per family member.
| Income Bracket | # Families | Median Income |
| 2-Person Families | 11,421 (51.7%) | $75,223 |
| 3-Person Families | 4,532 (20.5%) | $82,500 |
| 4-Person Families | 3,669 (16.6%) | $98,523 |
| 5-Person Families | 1,641 (7.4%) | $96,830 |
| 6-Person Families | 427 (1.9%) | $104,323 |
| 7+ Person Families | 415 (1.9%) | $143,064 |
| Total | 22,105 (100.0%) | $84,168 |
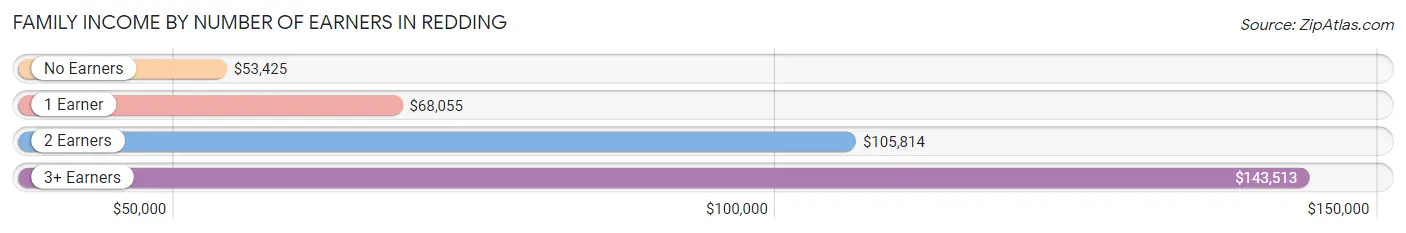
Family Income by Number of Earners in Redding
The median family income in Redding is $84,168, with families comprising 3+ earners (1,827) having the highest median family income of $143,513, while families with no earners (4,339) have the lowest median family income of $53,425, accounting for 8.3% and 19.6% of families, respectively.
| Number of Earners | # Families | Median Income |
| No Earners | 4,339 (19.6%) | $53,425 |
| 1 Earner | 7,649 (34.6%) | $68,055 |
| 2 Earners | 8,290 (37.5%) | $105,814 |
| 3+ Earners | 1,827 (8.3%) | $143,513 |
| Total | 22,105 (100.0%) | $84,168 |
Household Income in Redding
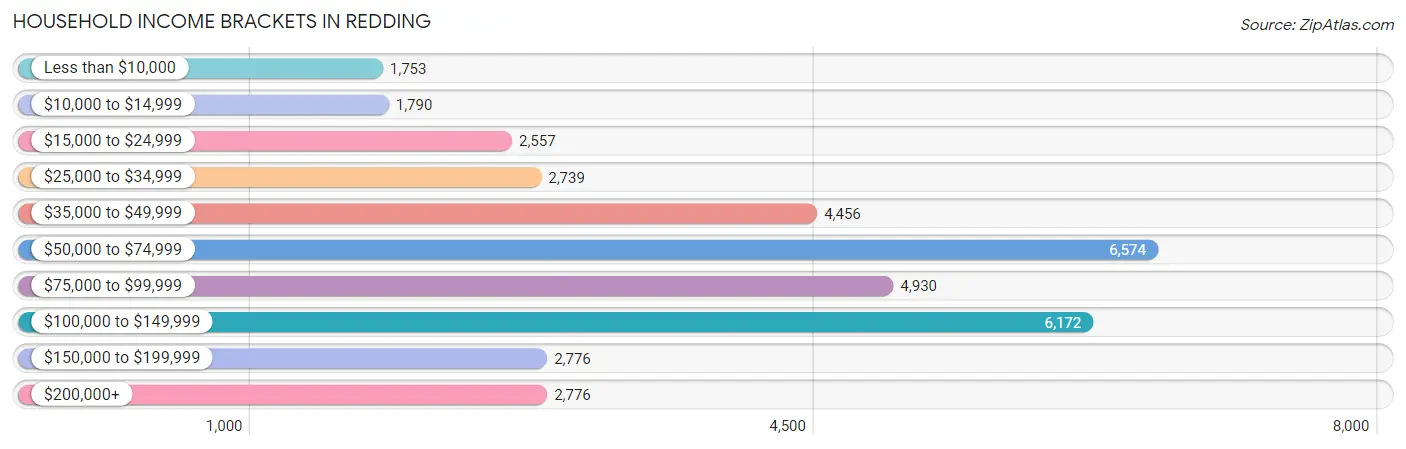
Household Income Brackets in Redding
With 6,574 households falling in the category, the $50,000 to $74,999 income range is the most frequent in Redding, accounting for 18.0% of all households. In contrast, only 1,753 households (4.8%) fall into the less than $10,000 income bracket, making it the least populous group.
| Income Bracket | # Households | % Households |
| Less than $10,000 | 1,753 | 4.8% |
| $10,000 to $14,999 | 1,790 | 4.9% |
| $15,000 to $24,999 | 2,557 | 7.0% |
| $25,000 to $34,999 | 2,739 | 7.5% |
| $35,000 to $49,999 | 4,456 | 12.2% |
| $50,000 to $74,999 | 6,574 | 18.0% |
| $75,000 to $99,999 | 4,930 | 13.5% |
| $100,000 to $149,999 | 6,172 | 16.9% |
| $150,000 to $199,999 | 2,776 | 7.6% |
| $200,000+ | 2,776 | 7.6% |
Household Income by Householder Age in Redding
The median household income in Redding is $67,323, with the highest median household income of $81,165 found in the 25 to 44 years age bracket for the primary householder. A total of 11,501 households (31.5%) fall into this category. Meanwhile, the 65+ years age bracket for the primary householder has the lowest median household income of $52,837, with 11,311 households (31.0%) in this group.
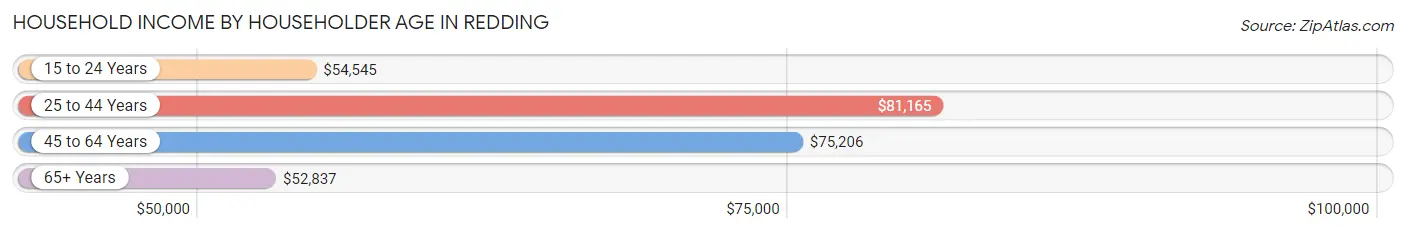
| Income Bracket | # Households | Median Income |
| 15 to 24 Years | 1,678 (4.6%) | $54,545 |
| 25 to 44 Years | 11,501 (31.5%) | $81,165 |
| 45 to 64 Years | 12,032 (32.9%) | $75,206 |
| 65+ Years | 11,311 (31.0%) | $52,837 |
| Total | 36,522 (100.0%) | $67,323 |
Poverty in Redding
Income Below Poverty by Sex and Age in Redding
With 11.8% poverty level for males and 16.3% for females among the residents of Redding, under 5 year old males and 18 to 24 year old females are the most vulnerable to poverty, with 534 males (18.5%) and 1,079 females (27.2%) in their respective age groups living below the poverty level.
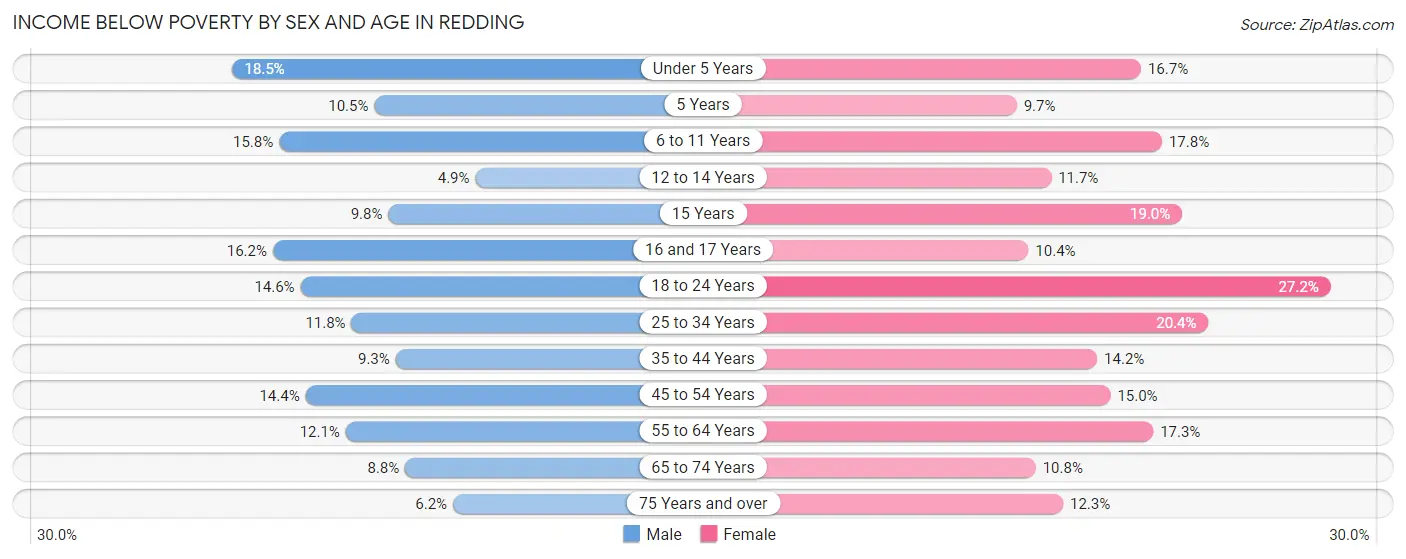
| Age Bracket | Male | Female |
| Under 5 Years | 534 (18.5%) | 342 (16.7%) |
| 5 Years | 79 (10.5%) | 70 (9.7%) |
| 6 to 11 Years | 485 (15.8%) | 643 (17.8%) |
| 12 to 14 Years | 98 (4.9%) | 190 (11.7%) |
| 15 Years | 51 (9.8%) | 144 (19.0%) |
| 16 and 17 Years | 239 (16.2%) | 87 (10.4%) |
| 18 to 24 Years | 536 (14.6%) | 1,079 (27.2%) |
| 25 to 34 Years | 756 (11.8%) | 1,310 (20.4%) |
| 35 to 44 Years | 538 (9.3%) | 823 (14.2%) |
| 45 to 54 Years | 661 (14.4%) | 793 (15.0%) |
| 55 to 64 Years | 659 (12.1%) | 1,036 (17.3%) |
| 65 to 74 Years | 407 (8.8%) | 563 (10.8%) |
| 75 Years and over | 191 (6.1%) | 561 (12.3%) |
| Total | 5,234 (11.8%) | 7,641 (16.3%) |
Income Above Poverty by Sex and Age in Redding
According to the poverty statistics in Redding, males aged 12 to 14 years and females aged 5 years are the age groups that are most secure financially, with 95.1% of males and 90.3% of females in these age groups living above the poverty line.
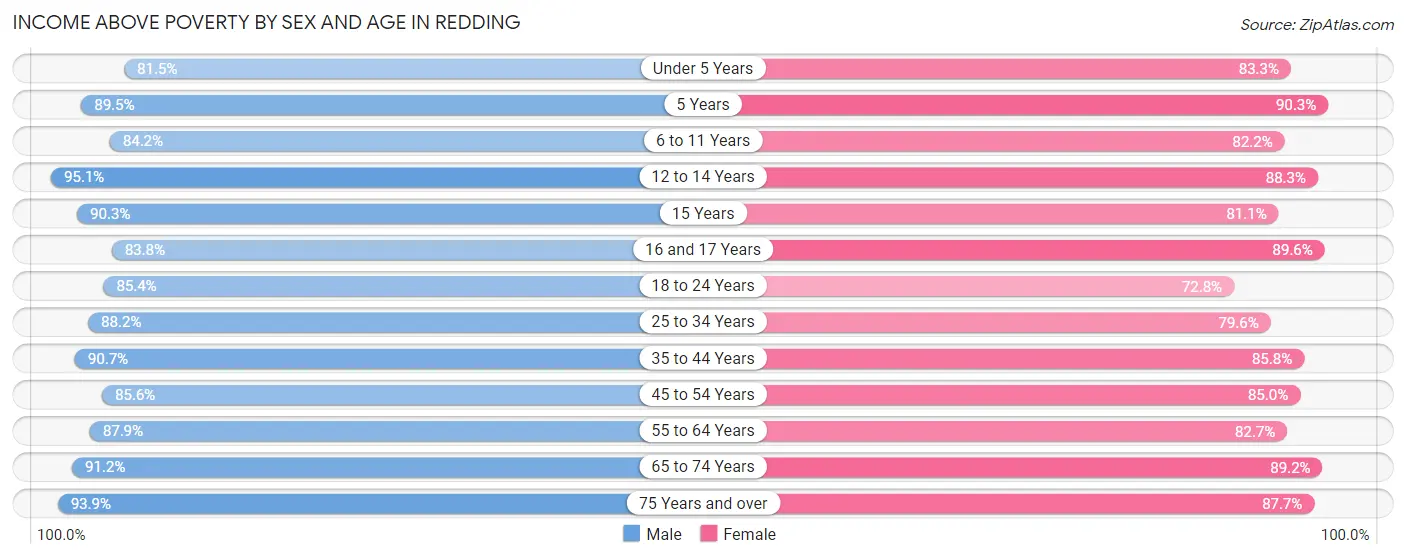
| Age Bracket | Male | Female |
| Under 5 Years | 2,355 (81.5%) | 1,711 (83.3%) |
| 5 Years | 671 (89.5%) | 649 (90.3%) |
| 6 to 11 Years | 2,578 (84.2%) | 2,963 (82.2%) |
| 12 to 14 Years | 1,902 (95.1%) | 1,440 (88.3%) |
| 15 Years | 472 (90.2%) | 616 (81.0%) |
| 16 and 17 Years | 1,238 (83.8%) | 750 (89.6%) |
| 18 to 24 Years | 3,124 (85.4%) | 2,885 (72.8%) |
| 25 to 34 Years | 5,649 (88.2%) | 5,107 (79.6%) |
| 35 to 44 Years | 5,223 (90.7%) | 4,966 (85.8%) |
| 45 to 54 Years | 3,941 (85.6%) | 4,508 (85.0%) |
| 55 to 64 Years | 4,778 (87.9%) | 4,938 (82.7%) |
| 65 to 74 Years | 4,212 (91.2%) | 4,650 (89.2%) |
| 75 Years and over | 2,917 (93.9%) | 3,992 (87.7%) |
| Total | 39,060 (88.2%) | 39,175 (83.7%) |
Income Below Poverty Among Married-Couple Families in Redding
The poverty statistics for married-couple families in Redding show that 4.2% or 642 of the total 15,471 families live below the poverty line. Families with 3 or 4 children have the highest poverty rate of 9.8%, comprising of 141 families. On the other hand, families with 5 or more children have the lowest poverty rate of 0.0%, which includes 0 families.
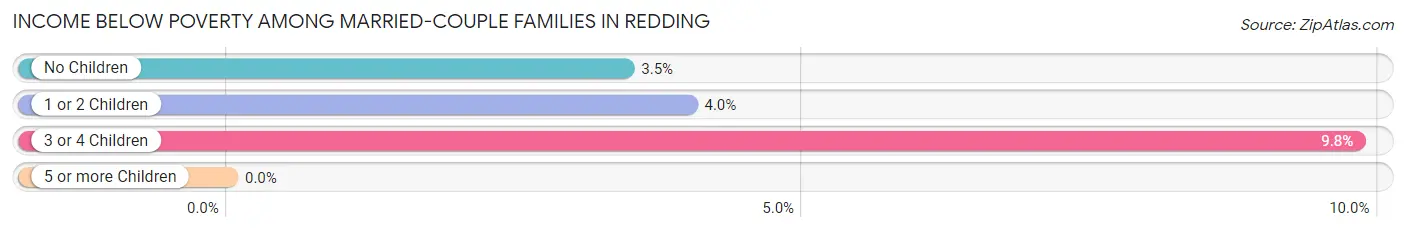
| Children | Above Poverty | Below Poverty |
| No Children | 9,392 (96.6%) | 336 (3.5%) |
| 1 or 2 Children | 3,957 (96.0%) | 165 (4.0%) |
| 3 or 4 Children | 1,296 (90.2%) | 141 (9.8%) |
| 5 or more Children | 184 (100.0%) | 0 (0.0%) |
| Total | 14,829 (95.9%) | 642 (4.2%) |
Income Below Poverty Among Single-Parent Households in Redding
According to the poverty data in Redding, 8.4% or 180 single-father households and 21.0% or 943 single-mother households are living below the poverty line. Among single-father households, those with 3 or 4 children have the highest poverty rate, with 59 households (35.3%) experiencing poverty. Likewise, among single-mother households, those with 3 or 4 children have the highest poverty rate, with 206 households (53.4%) falling below the poverty line.
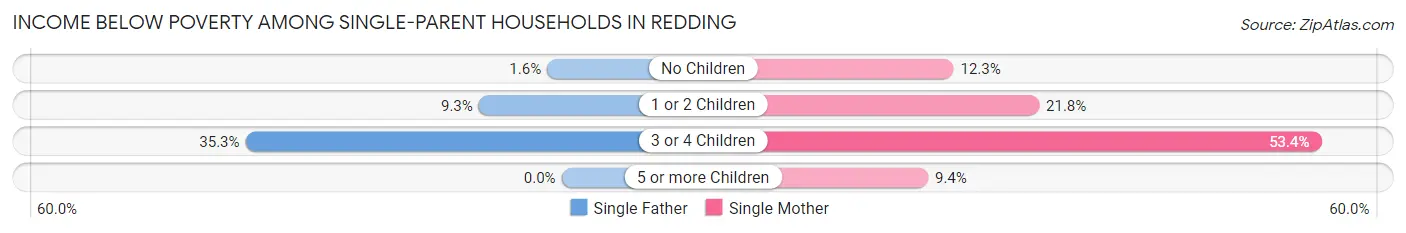
| Children | Single Father | Single Mother |
| No Children | 13 (1.6%) | 199 (12.3%) |
| 1 or 2 Children | 108 (9.3%) | 533 (21.8%) |
| 3 or 4 Children | 59 (35.3%) | 206 (53.4%) |
| 5 or more Children | 0 (0.0%) | 5 (9.4%) |
| Total | 180 (8.4%) | 943 (21.0%) |
Income Below Poverty Among Married-Couple vs Single-Parent Households in Redding
The poverty data for Redding shows that 642 of the married-couple family households (4.2%) and 1,123 of the single-parent households (16.9%) are living below the poverty level. Within the married-couple family households, those with 3 or 4 children have the highest poverty rate, with 141 households (9.8%) falling below the poverty line. Among the single-parent households, those with 3 or 4 children have the highest poverty rate, with 265 household (47.9%) living below poverty.
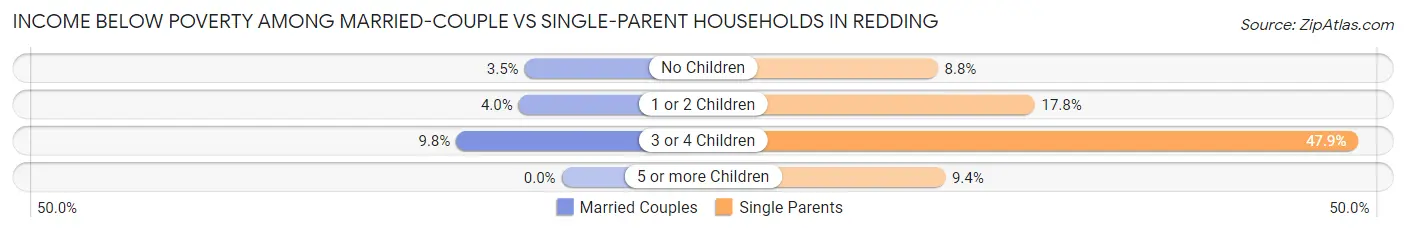
| Children | Married-Couple Families | Single-Parent Households |
| No Children | 336 (3.5%) | 212 (8.7%) |
| 1 or 2 Children | 165 (4.0%) | 641 (17.8%) |
| 3 or 4 Children | 141 (9.8%) | 265 (47.9%) |
| 5 or more Children | 0 (0.0%) | 5 (9.4%) |
| Total | 642 (4.2%) | 1,123 (16.9%) |
Race in Redding
The most populous races in Redding are White / Caucasian (74,177 | 79.5%), Hispanic or Latino (11,364 | 12.2%), and Two or more Races (9,581 | 10.3%).
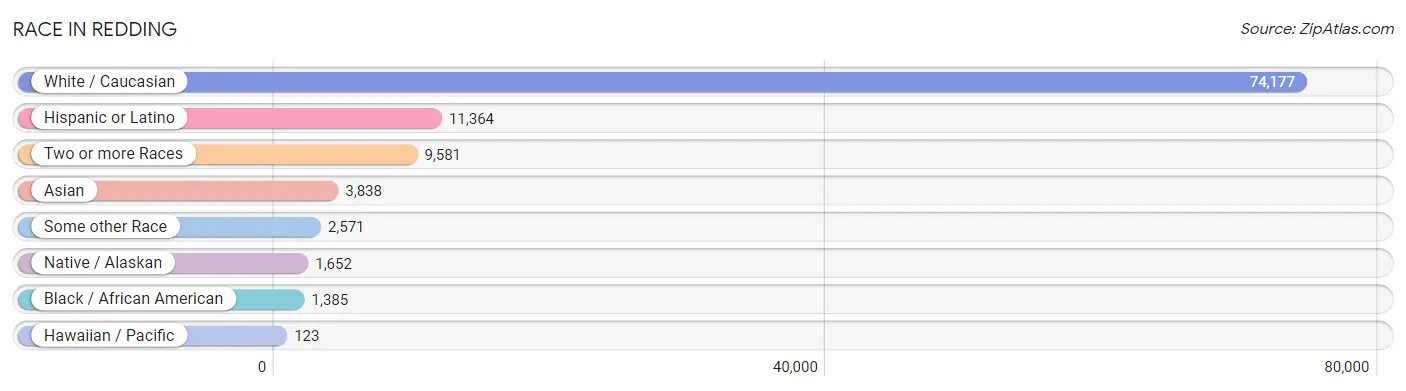
| Race | # Population | % Population |
| Asian | 3,838 | 4.1% |
| Black / African American | 1,385 | 1.5% |
| Hawaiian / Pacific | 123 | 0.1% |
| Hispanic or Latino | 11,364 | 12.2% |
| Native / Alaskan | 1,652 | 1.8% |
| White / Caucasian | 74,177 | 79.5% |
| Two or more Races | 9,581 | 10.3% |
| Some other Race | 2,571 | 2.8% |
| Total | 93,327 | 100.0% |
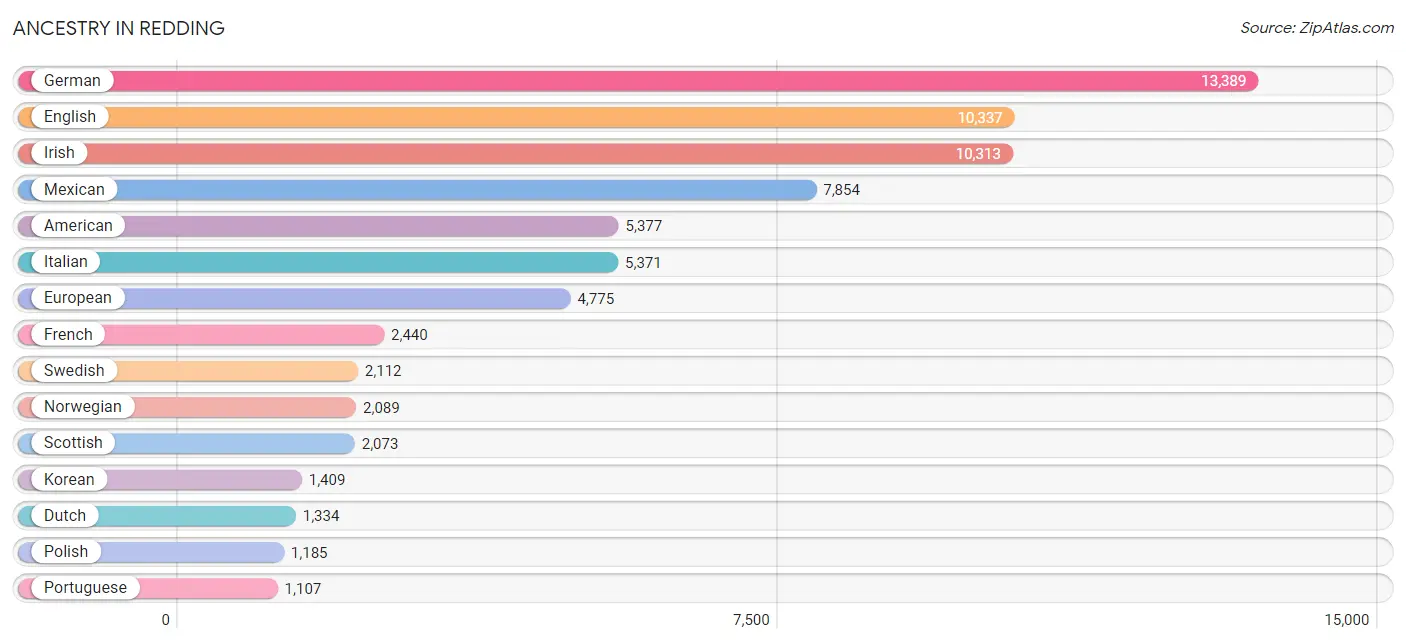
Ancestry in Redding
The most populous ancestries reported in Redding are German (13,389 | 14.3%), English (10,337 | 11.1%), Irish (10,313 | 11.1%), Mexican (7,854 | 8.4%), and American (5,377 | 5.8%), together accounting for 50.7% of all Redding residents.
| Ancestry | # Population | % Population |
| African | 19 | 0.0% |
| Alaska Native | 8 | 0.0% |
| Alaskan Athabascan | 67 | 0.1% |
| Albanian | 14 | 0.0% |
| American | 5,377 | 5.8% |
| Apache | 140 | 0.2% |
| Arab | 324 | 0.4% |
| Argentinean | 23 | 0.0% |
| Armenian | 39 | 0.0% |
| Australian | 46 | 0.1% |
| Austrian | 136 | 0.2% |
| Bangladeshi | 276 | 0.3% |
| Basque | 92 | 0.1% |
| Belgian | 63 | 0.1% |
| Belizean | 2 | 0.0% |
| Bhutanese | 372 | 0.4% |
| Blackfeet | 228 | 0.2% |
| Bolivian | 6 | 0.0% |
| Brazilian | 152 | 0.2% |
| British | 883 | 0.9% |
| Burmese | 449 | 0.5% |
| Canadian | 280 | 0.3% |
| Carpatho Rusyn | 21 | 0.0% |
| Celtic | 31 | 0.0% |
| Central American | 605 | 0.6% |
| Central American Indian | 155 | 0.2% |
| Cherokee | 524 | 0.6% |
| Cheyenne | 8 | 0.0% |
| Chickasaw | 3 | 0.0% |
| Chilean | 13 | 0.0% |
| Chippewa | 7 | 0.0% |
| Choctaw | 338 | 0.4% |
| Colombian | 100 | 0.1% |
| Colville | 5 | 0.0% |
| Comanche | 14 | 0.0% |
| Costa Rican | 90 | 0.1% |
| Cree | 16 | 0.0% |
| Creek | 6 | 0.0% |
| Croatian | 102 | 0.1% |
| Cuban | 39 | 0.0% |
| Czech | 319 | 0.3% |
| Czechoslovakian | 108 | 0.1% |
| Danish | 844 | 0.9% |
| Delaware | 3 | 0.0% |
| Dominican | 7 | 0.0% |
| Dutch | 1,334 | 1.4% |
| Dutch West Indian | 9 | 0.0% |
| Eastern European | 280 | 0.3% |
| Ecuadorian | 5 | 0.0% |
| English | 10,337 | 11.1% |
| Ethiopian | 16 | 0.0% |
| European | 4,775 | 5.1% |
| Filipino | 96 | 0.1% |
| Finnish | 205 | 0.2% |
| French | 2,440 | 2.6% |
| French Canadian | 334 | 0.4% |
| German | 13,389 | 14.3% |
| Greek | 412 | 0.4% |
| Guamanian / Chamorro | 64 | 0.1% |
| Guatemalan | 27 | 0.0% |
| Haitian | 10 | 0.0% |
| Honduran | 23 | 0.0% |
| Hungarian | 202 | 0.2% |
| Icelander | 46 | 0.1% |
| Indian (Asian) | 699 | 0.7% |
| Indonesian | 36 | 0.0% |
| Inupiat | 52 | 0.1% |
| Iranian | 22 | 0.0% |
| Irish | 10,313 | 11.1% |
| Iroquois | 17 | 0.0% |
| Italian | 5,371 | 5.8% |
| Jamaican | 21 | 0.0% |
| Japanese | 12 | 0.0% |
| Korean | 1,409 | 1.5% |
| Laotian | 21 | 0.0% |
| Latvian | 19 | 0.0% |
| Lebanese | 78 | 0.1% |
| Liberian | 8 | 0.0% |
| Lithuanian | 52 | 0.1% |
| Luxembourger | 9 | 0.0% |
| Malaysian | 539 | 0.6% |
| Maltese | 25 | 0.0% |
| Marshallese | 41 | 0.0% |
| Mexican | 7,854 | 8.4% |
| Mexican American Indian | 114 | 0.1% |
| Moroccan | 38 | 0.0% |
| Native Hawaiian | 365 | 0.4% |
| Navajo | 112 | 0.1% |
| Nepalese | 481 | 0.5% |
| Nicaraguan | 190 | 0.2% |
| Northern European | 355 | 0.4% |
| Norwegian | 2,089 | 2.2% |
| Paiute | 14 | 0.0% |
| Pakistani | 121 | 0.1% |
| Palestinian | 3 | 0.0% |
| Panamanian | 163 | 0.2% |
| Paraguayan | 9 | 0.0% |
| Pennsylvania German | 27 | 0.0% |
| Peruvian | 111 | 0.1% |
| Polish | 1,185 | 1.3% |
| Portuguese | 1,107 | 1.2% |
| Potawatomi | 20 | 0.0% |
| Pueblo | 10 | 0.0% |
| Puerto Rican | 500 | 0.5% |
| Romanian | 113 | 0.1% |
| Russian | 538 | 0.6% |
| Salvadoran | 112 | 0.1% |
| Samoan | 73 | 0.1% |
| Scandinavian | 438 | 0.5% |
| Scotch-Irish | 800 | 0.9% |
| Scottish | 2,073 | 2.2% |
| Serbian | 9 | 0.0% |
| Shoshone | 121 | 0.1% |
| Sioux | 105 | 0.1% |
| Slavic | 35 | 0.0% |
| Slovak | 58 | 0.1% |
| South African | 166 | 0.2% |
| South American | 281 | 0.3% |
| South American Indian | 9 | 0.0% |
| Spaniard | 966 | 1.0% |
| Spanish | 497 | 0.5% |
| Spanish American Indian | 9 | 0.0% |
| Sri Lankan | 386 | 0.4% |
| Subsaharan African | 245 | 0.3% |
| Swedish | 2,112 | 2.3% |
| Swiss | 369 | 0.4% |
| Syrian | 160 | 0.2% |
| Thai | 564 | 0.6% |
| Tongan | 19 | 0.0% |
| Turkish | 13 | 0.0% |
| Ukrainian | 243 | 0.3% |
| Venezuelan | 14 | 0.0% |
| Welsh | 786 | 0.8% |
| West Indian | 21 | 0.0% |
| Yakama | 9 | 0.0% |
| Yugoslavian | 59 | 0.1% | View All 136 Rows |
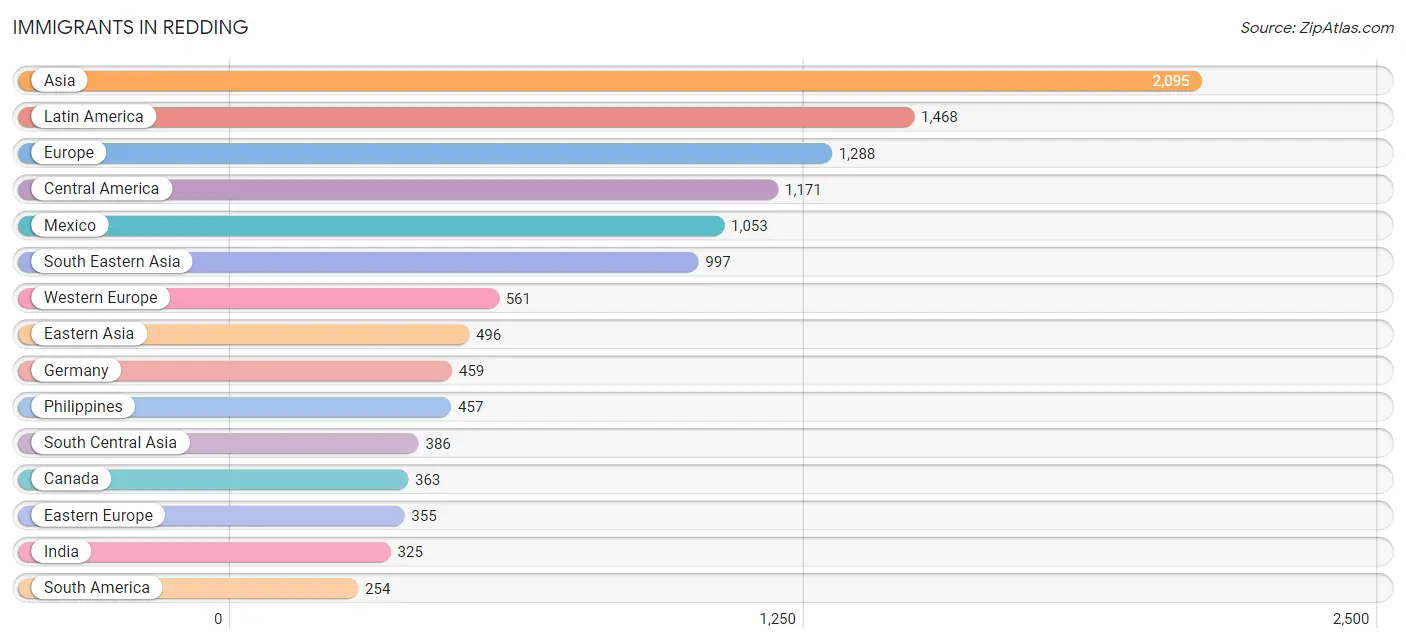
Immigrants in Redding
The most numerous immigrant groups reported in Redding came from Asia (2,095 | 2.2%), Latin America (1,468 | 1.6%), Europe (1,288 | 1.4%), Central America (1,171 | 1.3%), and Mexico (1,053 | 1.1%), together accounting for 7.6% of all Redding residents.
| Immigration Origin | # Population | % Population |
| Africa | 239 | 0.3% |
| Albania | 14 | 0.0% |
| Argentina | 8 | 0.0% |
| Asia | 2,095 | 2.2% |
| Australia | 33 | 0.0% |
| Austria | 6 | 0.0% |
| Azores | 6 | 0.0% |
| Brazil | 85 | 0.1% |
| Cambodia | 7 | 0.0% |
| Canada | 363 | 0.4% |
| Caribbean | 43 | 0.1% |
| Central America | 1,171 | 1.3% |
| Chile | 13 | 0.0% |
| China | 240 | 0.3% |
| Colombia | 29 | 0.0% |
| Czechoslovakia | 110 | 0.1% |
| Denmark | 19 | 0.0% |
| Eastern Africa | 28 | 0.0% |
| Eastern Asia | 496 | 0.5% |
| Eastern Europe | 355 | 0.4% |
| Ecuador | 44 | 0.1% |
| Egypt | 10 | 0.0% |
| El Salvador | 45 | 0.1% |
| England | 130 | 0.1% |
| Europe | 1,288 | 1.4% |
| France | 13 | 0.0% |
| Germany | 459 | 0.5% |
| Greece | 50 | 0.1% |
| Grenada | 7 | 0.0% |
| Guatemala | 21 | 0.0% |
| Haiti | 36 | 0.0% |
| Honduras | 27 | 0.0% |
| Hong Kong | 5 | 0.0% |
| Hungary | 2 | 0.0% |
| India | 325 | 0.4% |
| Indonesia | 8 | 0.0% |
| Iran | 10 | 0.0% |
| Ireland | 17 | 0.0% |
| Italy | 41 | 0.0% |
| Japan | 93 | 0.1% |
| Korea | 163 | 0.2% |
| Laos | 137 | 0.2% |
| Latin America | 1,468 | 1.6% |
| Latvia | 33 | 0.0% |
| Lebanon | 64 | 0.1% |
| Liberia | 8 | 0.0% |
| Malaysia | 15 | 0.0% |
| Mexico | 1,053 | 1.1% |
| Micronesia | 55 | 0.1% |
| Moldova | 4 | 0.0% |
| Morocco | 25 | 0.0% |
| Nepal | 41 | 0.0% |
| Netherlands | 13 | 0.0% |
| Northern Africa | 35 | 0.0% |
| Northern Europe | 236 | 0.3% |
| Oceania | 88 | 0.1% |
| Pakistan | 10 | 0.0% |
| Panama | 15 | 0.0% |
| Peru | 41 | 0.0% |
| Philippines | 457 | 0.5% |
| Poland | 13 | 0.0% |
| Portugal | 6 | 0.0% |
| Romania | 5 | 0.0% |
| Russia | 46 | 0.1% |
| Scotland | 18 | 0.0% |
| Singapore | 9 | 0.0% |
| South Africa | 168 | 0.2% |
| South America | 254 | 0.3% |
| South Central Asia | 386 | 0.4% |
| South Eastern Asia | 997 | 1.1% |
| Southern Europe | 136 | 0.2% |
| Spain | 39 | 0.0% |
| Sweden | 10 | 0.0% |
| Switzerland | 34 | 0.0% |
| Syria | 139 | 0.2% |
| Taiwan | 126 | 0.1% |
| Thailand | 191 | 0.2% |
| Turkey | 13 | 0.0% |
| Ukraine | 107 | 0.1% |
| Venezuela | 14 | 0.0% |
| Vietnam | 153 | 0.2% |
| Western Africa | 8 | 0.0% |
| Western Asia | 216 | 0.2% |
| Western Europe | 561 | 0.6% | View All 84 Rows |
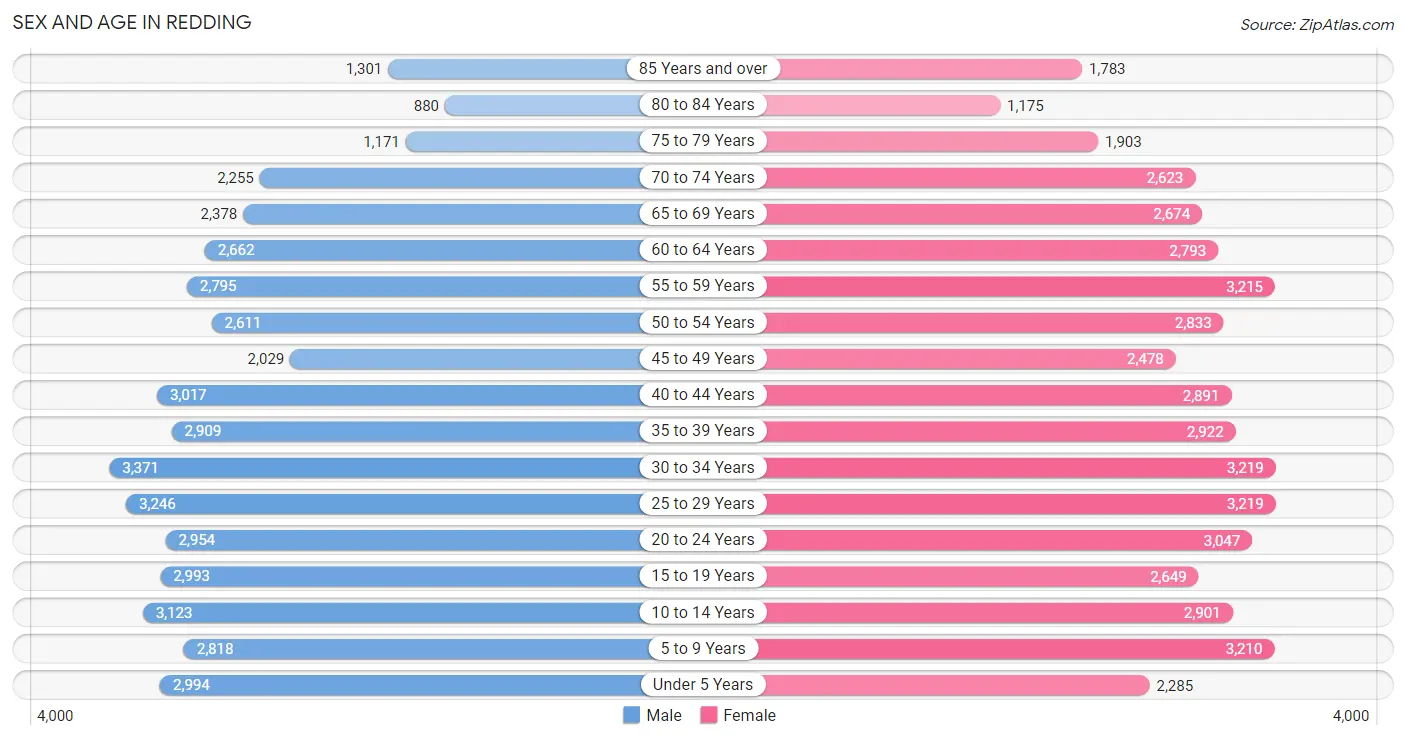
Sex and Age in Redding
Sex and Age in Redding
The most populous age groups in Redding are 30 to 34 Years (3,371 | 7.4%) for men and 25 to 29 Years (3,219 | 6.7%) for women.
| Age Bracket | Male | Female |
| Under 5 Years | 2,994 (6.6%) | 2,285 (4.8%) |
| 5 to 9 Years | 2,818 (6.2%) | 3,210 (6.7%) |
| 10 to 14 Years | 3,123 (6.9%) | 2,901 (6.1%) |
| 15 to 19 Years | 2,993 (6.6%) | 2,649 (5.5%) |
| 20 to 24 Years | 2,954 (6.5%) | 3,047 (6.4%) |
| 25 to 29 Years | 3,246 (7.1%) | 3,219 (6.7%) |
| 30 to 34 Years | 3,371 (7.4%) | 3,219 (6.7%) |
| 35 to 39 Years | 2,909 (6.4%) | 2,922 (6.1%) |
| 40 to 44 Years | 3,017 (6.6%) | 2,891 (6.0%) |
| 45 to 49 Years | 2,029 (4.5%) | 2,478 (5.2%) |
| 50 to 54 Years | 2,611 (5.7%) | 2,833 (5.9%) |
| 55 to 59 Years | 2,795 (6.1%) | 3,215 (6.7%) |
| 60 to 64 Years | 2,662 (5.9%) | 2,793 (5.8%) |
| 65 to 69 Years | 2,378 (5.2%) | 2,674 (5.6%) |
| 70 to 74 Years | 2,255 (5.0%) | 2,623 (5.5%) |
| 75 to 79 Years | 1,171 (2.6%) | 1,903 (4.0%) |
| 80 to 84 Years | 880 (1.9%) | 1,175 (2.5%) |
| 85 Years and over | 1,301 (2.9%) | 1,783 (3.7%) |
| Total | 45,507 (100.0%) | 47,820 (100.0%) |
Families and Households in Redding
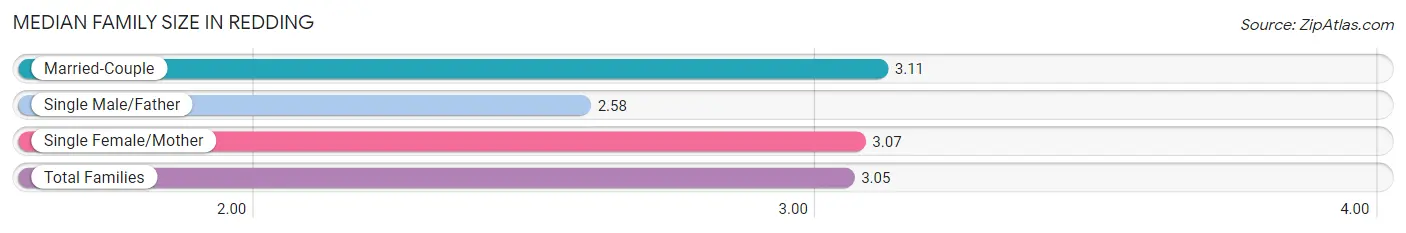
Median Family Size in Redding
The median family size in Redding is 3.05 persons per family, with married-couple families (15,471 | 70.0%) accounting for the largest median family size of 3.11 persons per family. On the other hand, single male/father families (2,134 | 9.7%) represent the smallest median family size with 2.58 persons per family.
| Family Type | # Families | Family Size |
| Married-Couple | 15,471 (70.0%) | 3.11 |
| Single Male/Father | 2,134 (9.7%) | 2.58 |
| Single Female/Mother | 4,500 (20.4%) | 3.07 |
| Total Families | 22,105 (100.0%) | 3.05 |
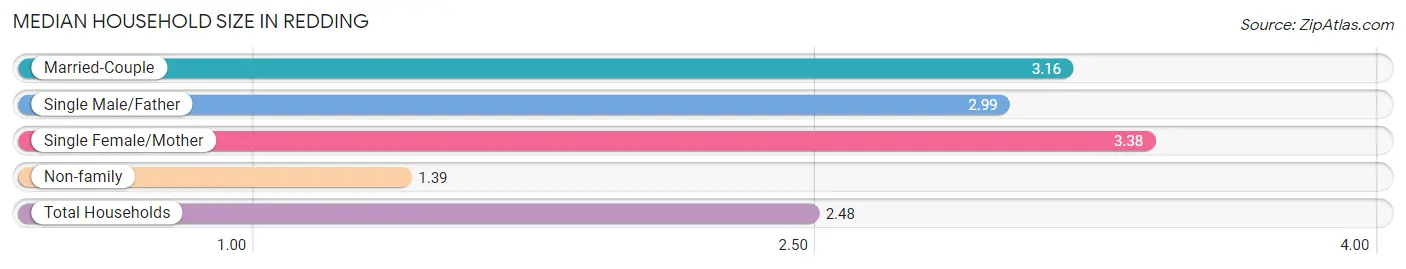
Median Household Size in Redding
The median household size in Redding is 2.48 persons per household, with single female/mother households (4,500 | 12.3%) accounting for the largest median household size of 3.38 persons per household. non-family households (14,417 | 39.5%) represent the smallest median household size with 1.39 persons per household.
| Household Type | # Households | Household Size |
| Married-Couple | 15,471 (42.4%) | 3.16 |
| Single Male/Father | 2,134 (5.8%) | 2.99 |
| Single Female/Mother | 4,500 (12.3%) | 3.38 |
| Non-family | 14,417 (39.5%) | 1.39 |
| Total Households | 36,522 (100.0%) | 2.48 |
Household Size by Marriage Status in Redding
Out of a total of 36,522 households in Redding, 22,105 (60.5%) are family households, while 14,417 (39.5%) are nonfamily households. The most numerous type of family households are 2-person households, comprising 10,310, and the most common type of nonfamily households are 1-person households, comprising 10,649.
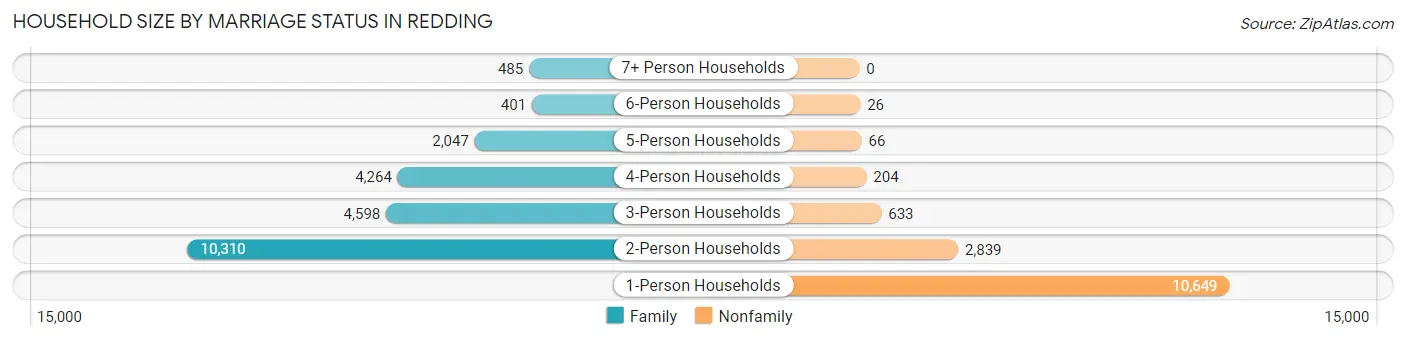
| Household Size | Family Households | Nonfamily Households |
| 1-Person Households | - | 10,649 (29.2%) |
| 2-Person Households | 10,310 (28.2%) | 2,839 (7.8%) |
| 3-Person Households | 4,598 (12.6%) | 633 (1.7%) |
| 4-Person Households | 4,264 (11.7%) | 204 (0.6%) |
| 5-Person Households | 2,047 (5.6%) | 66 (0.2%) |
| 6-Person Households | 401 (1.1%) | 26 (0.1%) |
| 7+ Person Households | 485 (1.3%) | 0 (0.0%) |
| Total | 22,105 (60.5%) | 14,417 (39.5%) |
Female Fertility in Redding
Fertility by Age in Redding
Average fertility rate in Redding is 39.0 births per 1,000 women. Women in the age bracket of 20 to 34 years have the highest fertility rate with 61.0 births per 1,000 women. Women in the age bracket of 20 to 34 years acount for 69.5% of all women with births.
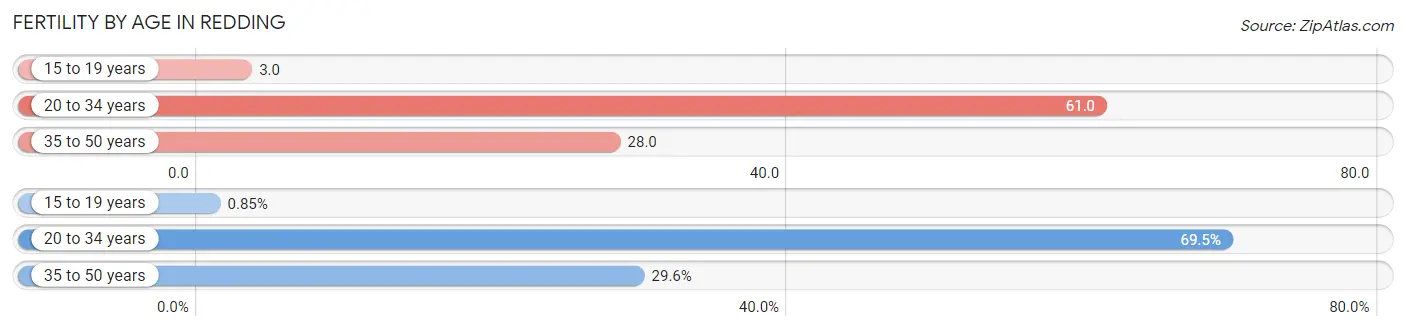
| Age Bracket | Women with Births | Births / 1,000 Women |
| 15 to 19 years | 7 (0.9%) | 3.0 |
| 20 to 34 years | 575 (69.5%) | 61.0 |
| 35 to 50 years | 245 (29.6%) | 28.0 |
| Total | 827 (100.0%) | 39.0 |
Fertility by Age by Marriage Status in Redding
54.1% of women with births (827) in Redding are married. The highest percentage of unmarried women with births falls into 15 to 19 years age bracket with 100.0% of them unmarried at the time of birth, while the lowest percentage of unmarried women with births belong to 20 to 34 years age bracket with 44.7% of them unmarried.
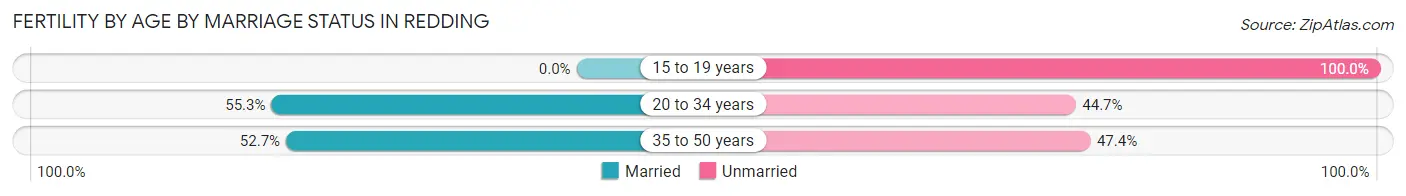
| Age Bracket | Married | Unmarried |
| 15 to 19 years | 0 (0.0%) | 7 (100.0%) |
| 20 to 34 years | 318 (55.3%) | 257 (44.7%) |
| 35 to 50 years | 129 (52.6%) | 116 (47.3%) |
| Total | 447 (54.0%) | 380 (46.0%) |
Fertility by Education in Redding
Average fertility rate in Redding is 39.0 births per 1,000 women. Women with the education attainment of high school diploma have the highest fertility rate of 67.0 births per 1,000 women, while women with the education attainment of graduate degree have the lowest fertility at 15.0 births per 1,000 women. Women with the education attainment of college or associate's degree represent 41.0% of all women with births.
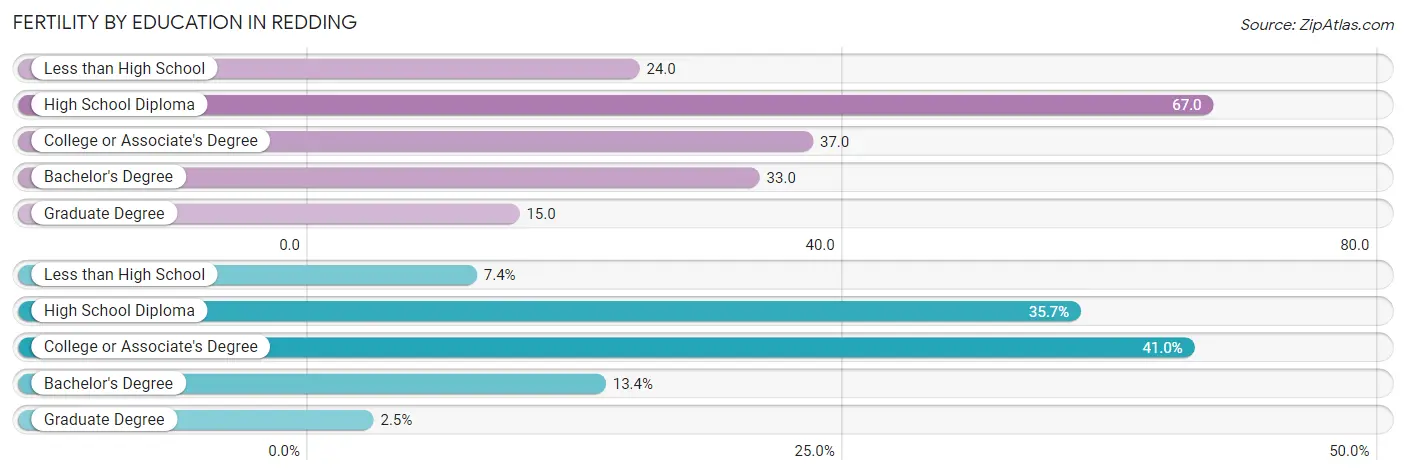
| Educational Attainment | Women with Births | Births / 1,000 Women |
| Less than High School | 61 (7.4%) | 24.0 |
| High School Diploma | 295 (35.7%) | 67.0 |
| College or Associate's Degree | 339 (41.0%) | 37.0 |
| Bachelor's Degree | 111 (13.4%) | 33.0 |
| Graduate Degree | 21 (2.5%) | 15.0 |
| Total | 827 (100.0%) | 39.0 |
Fertility by Education by Marriage Status in Redding
46.0% of women with births in Redding are unmarried. Women with the educational attainment of bachelor's degree are most likely to be married with 100.0% of them married at childbirth, while women with the educational attainment of high school diploma are least likely to be married with 61.0% of them unmarried at childbirth.
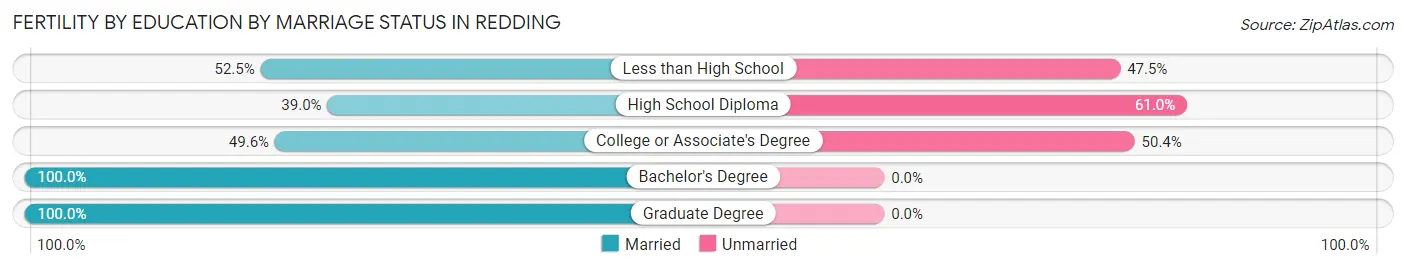
| Educational Attainment | Married | Unmarried |
| Less than High School | 32 (52.5%) | 29 (47.5%) |
| High School Diploma | 115 (39.0%) | 180 (61.0%) |
| College or Associate's Degree | 168 (49.6%) | 171 (50.4%) |
| Bachelor's Degree | 111 (100.0%) | 0 (0.0%) |
| Graduate Degree | 21 (100.0%) | 0 (0.0%) |
| Total | 447 (54.0%) | 380 (46.0%) |
Employment Characteristics in Redding
Employment by Class of Employer in Redding
Among the 39,823 employed individuals in Redding, private company employees (24,375 | 61.2%), local government employees (4,236 | 10.6%), and not-for-profit organizations (3,617 | 9.1%) make up the most common classes of employment.
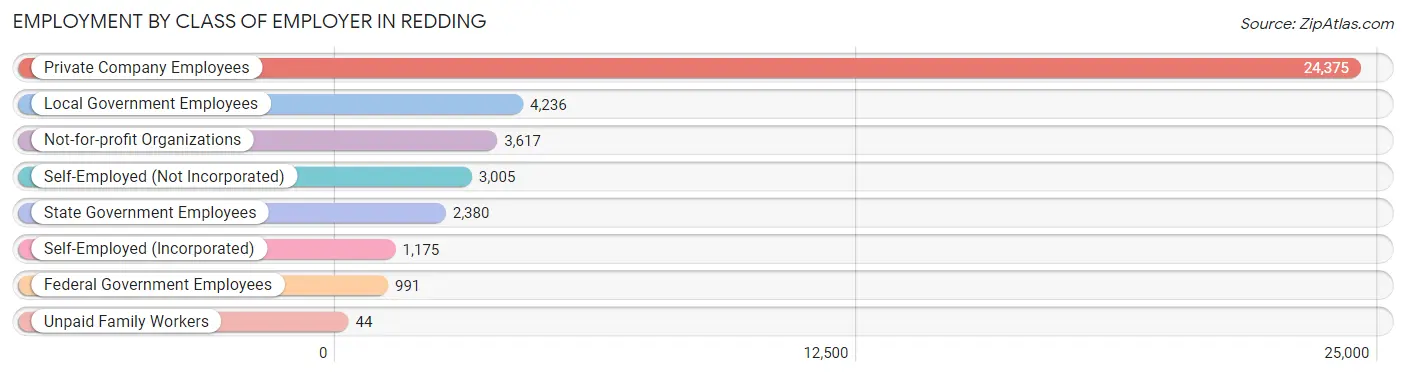
| Employer Class | # Employees | % Employees |
| Private Company Employees | 24,375 | 61.2% |
| Self-Employed (Incorporated) | 1,175 | 2.9% |
| Self-Employed (Not Incorporated) | 3,005 | 7.5% |
| Not-for-profit Organizations | 3,617 | 9.1% |
| Local Government Employees | 4,236 | 10.6% |
| State Government Employees | 2,380 | 6.0% |
| Federal Government Employees | 991 | 2.5% |
| Unpaid Family Workers | 44 | 0.1% |
| Total | 39,823 | 100.0% |
Employment Status by Age in Redding
According to the labor force statistics for Redding, out of the total population over 16 years of age (74,699), 58.3% or 43,550 individuals are in the labor force, with 5.9% or 2,569 of them unemployed. The age group with the highest labor force participation rate is 35 to 44 years, with 80.7% or 9,473 individuals in the labor force. Within the labor force, the 16 to 19 years age range has the highest percentage of unemployed individuals, with 24.6% or 435 of them being unemployed.
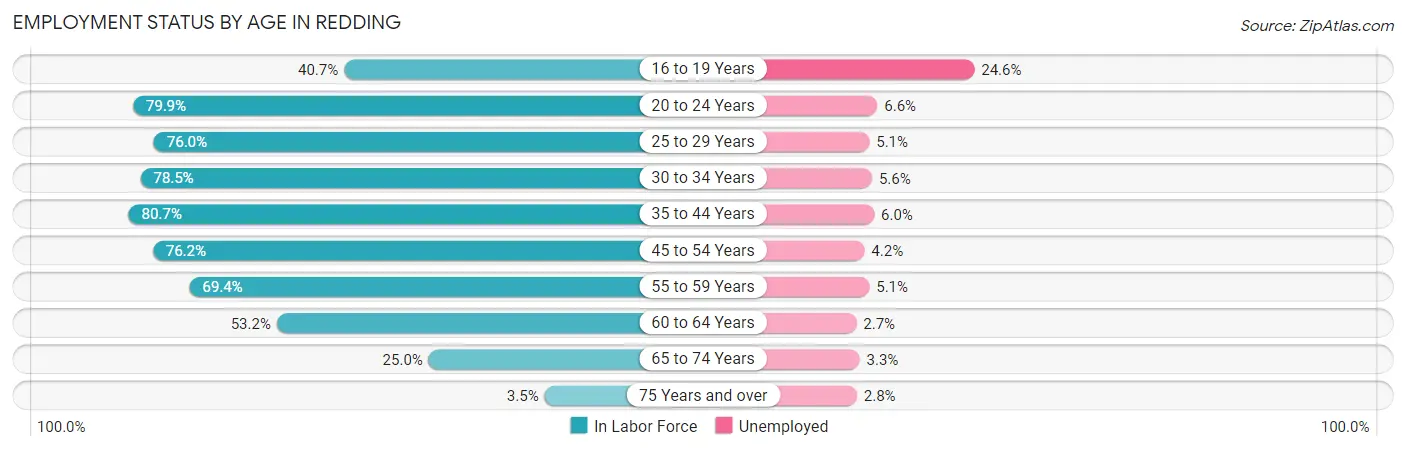
| Age Bracket | In Labor Force | Unemployed |
| 16 to 19 Years | 1,768 (40.7%) | 435 (24.6%) |
| 20 to 24 Years | 4,795 (79.9%) | 316 (6.6%) |
| 25 to 29 Years | 4,913 (76.0%) | 251 (5.1%) |
| 30 to 34 Years | 5,173 (78.5%) | 290 (5.6%) |
| 35 to 44 Years | 9,473 (80.7%) | 568 (6.0%) |
| 45 to 54 Years | 7,583 (76.2%) | 318 (4.2%) |
| 55 to 59 Years | 4,171 (69.4%) | 213 (5.1%) |
| 60 to 64 Years | 2,902 (53.2%) | 78 (2.7%) |
| 65 to 74 Years | 2,482 (25.0%) | 82 (3.3%) |
| 75 Years and over | 287 (3.5%) | 8 (2.8%) |
| Total | 43,550 (58.3%) | 2,569 (5.9%) |
Employment Status by Educational Attainment in Redding
According to labor force statistics for Redding, 74.0% of individuals (34,195) out of the total population between 25 and 64 years of age (46,210) are in the labor force, with 5.0% or 1,710 of them being unemployed. The group with the highest labor force participation rate are those with the educational attainment of bachelor's degree or higher, with 81.8% or 10,074 individuals in the labor force. Within the labor force, individuals with less than high school education have the highest percentage of unemployment, with 9.0% or 166 of them being unemployed.
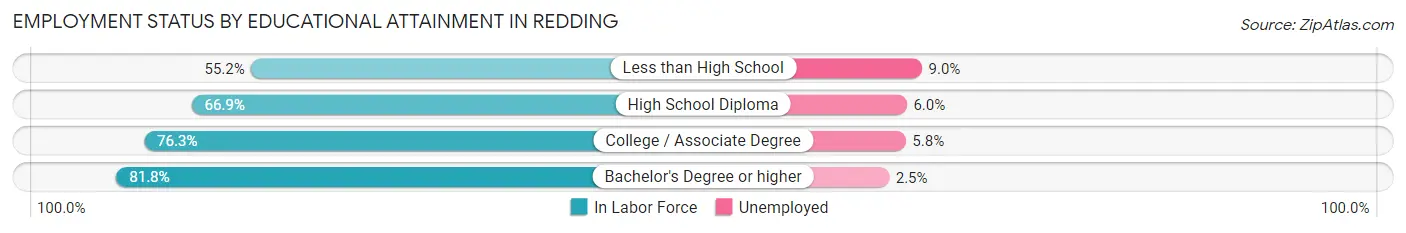
| Educational Attainment | In Labor Force | Unemployed |
| Less than High School | 1,846 (55.2%) | 301 (9.0%) |
| High School Diploma | 7,210 (66.9%) | 647 (6.0%) |
| College / Associate Degree | 15,086 (76.3%) | 1,147 (5.8%) |
| Bachelor's Degree or higher | 10,074 (81.8%) | 308 (2.5%) |
| Total | 34,195 (74.0%) | 2,310 (5.0%) |
Employment Occupations by Sex in Redding
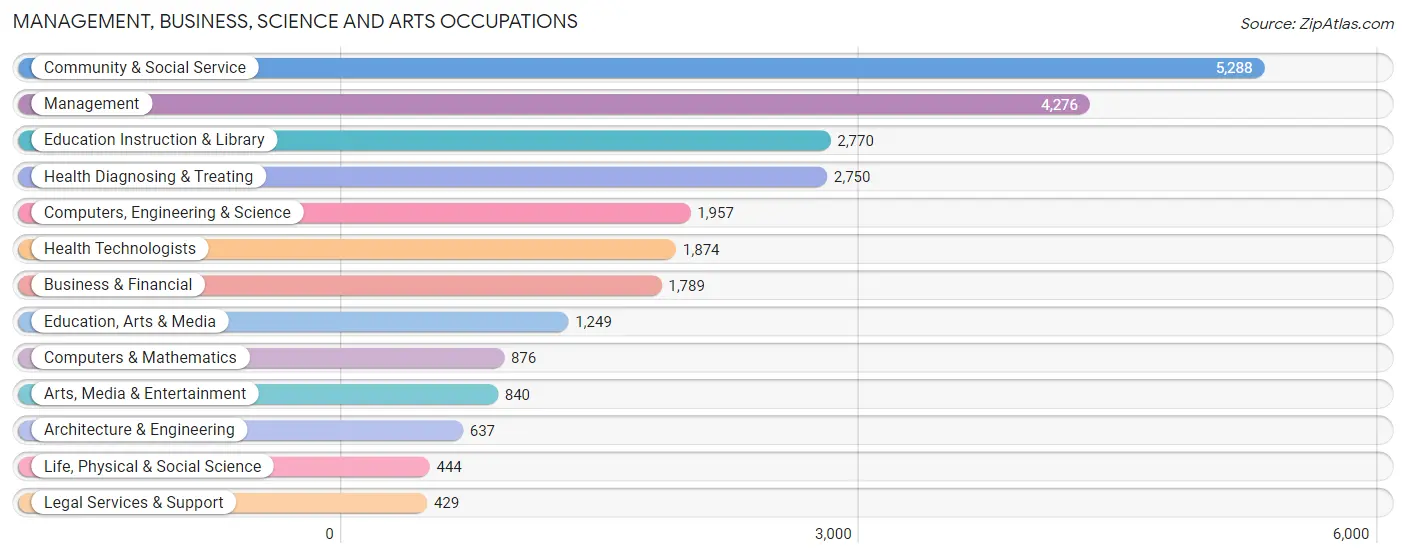
Management, Business, Science and Arts Occupations
The most common Management, Business, Science and Arts occupations in Redding are Community & Social Service (5,288 | 12.9%), Management (4,276 | 10.4%), Education Instruction & Library (2,770 | 6.8%), Health Diagnosing & Treating (2,750 | 6.7%), and Computers, Engineering & Science (1,957 | 4.8%).
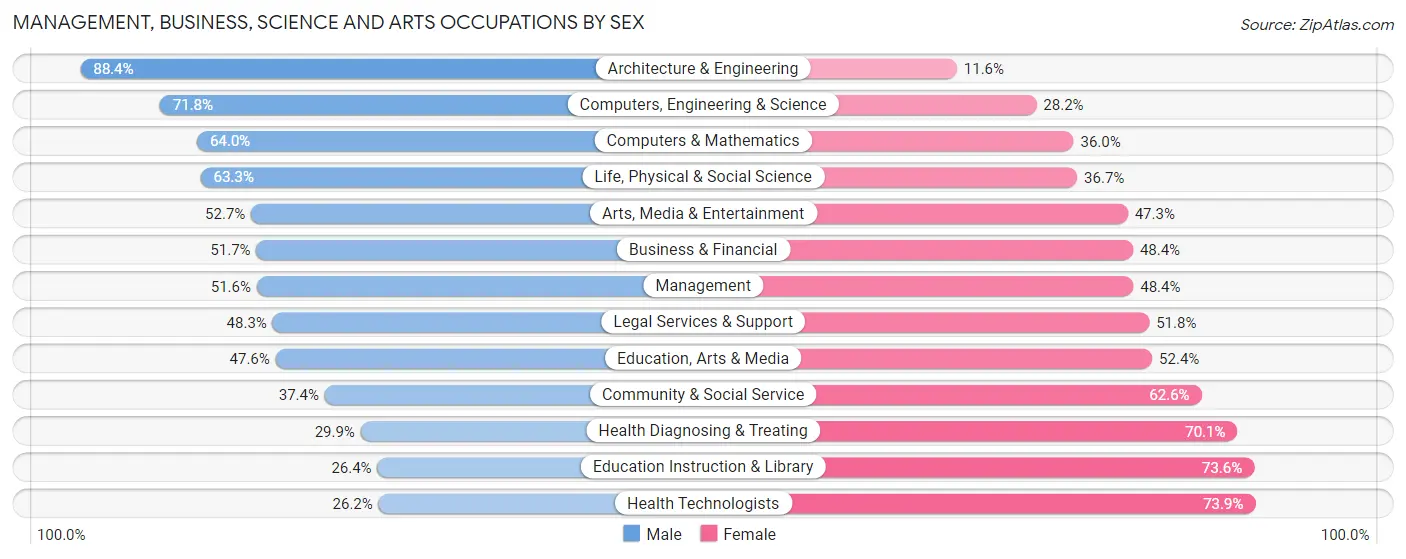
Management, Business, Science and Arts Occupations by Sex
Within the Management, Business, Science and Arts occupations in Redding, the most male-oriented occupations are Architecture & Engineering (88.4%), Computers, Engineering & Science (71.8%), and Computers & Mathematics (64.0%), while the most female-oriented occupations are Health Technologists (73.9%), Education Instruction & Library (73.6%), and Health Diagnosing & Treating (70.1%).
| Occupation | Male | Female |
| Management | 2,205 (51.6%) | 2,071 (48.4%) |
| Business & Financial | 924 (51.6%) | 865 (48.3%) |
| Computers, Engineering & Science | 1,405 (71.8%) | 552 (28.2%) |
| Computers & Mathematics | 561 (64.0%) | 315 (36.0%) |
| Architecture & Engineering | 563 (88.4%) | 74 (11.6%) |
| Life, Physical & Social Science | 281 (63.3%) | 163 (36.7%) |
| Community & Social Service | 1,976 (37.4%) | 3,312 (62.6%) |
| Education, Arts & Media | 595 (47.6%) | 654 (52.4%) |
| Legal Services & Support | 207 (48.2%) | 222 (51.7%) |
| Education Instruction & Library | 731 (26.4%) | 2,039 (73.6%) |
| Arts, Media & Entertainment | 443 (52.7%) | 397 (47.3%) |
| Health Diagnosing & Treating | 822 (29.9%) | 1,928 (70.1%) |
| Health Technologists | 490 (26.2%) | 1,384 (73.9%) |
| Total (Category) | 7,332 (45.7%) | 8,728 (54.3%) |
| Total (Overall) | 21,024 (51.3%) | 19,924 (48.7%) |
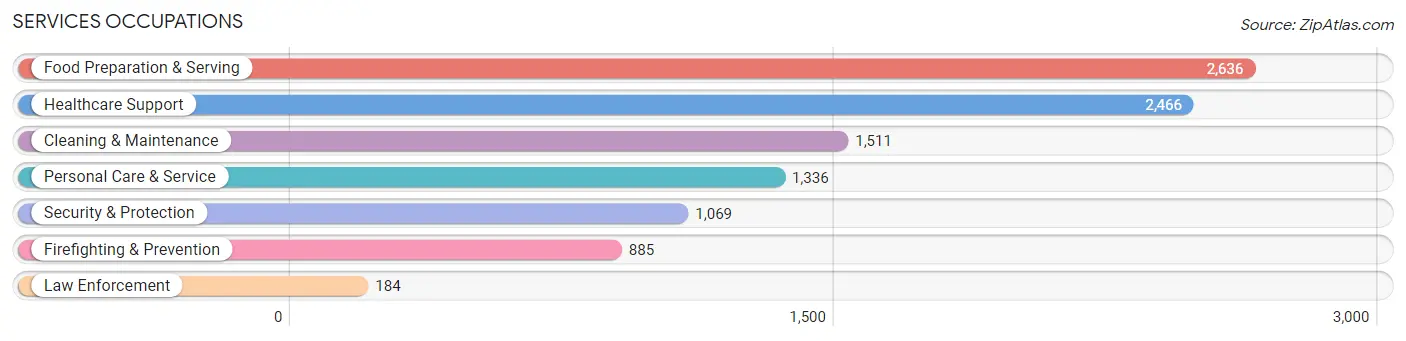
Services Occupations
The most common Services occupations in Redding are Food Preparation & Serving (2,636 | 6.4%), Healthcare Support (2,466 | 6.0%), Cleaning & Maintenance (1,511 | 3.7%), Personal Care & Service (1,336 | 3.3%), and Security & Protection (1,069 | 2.6%).
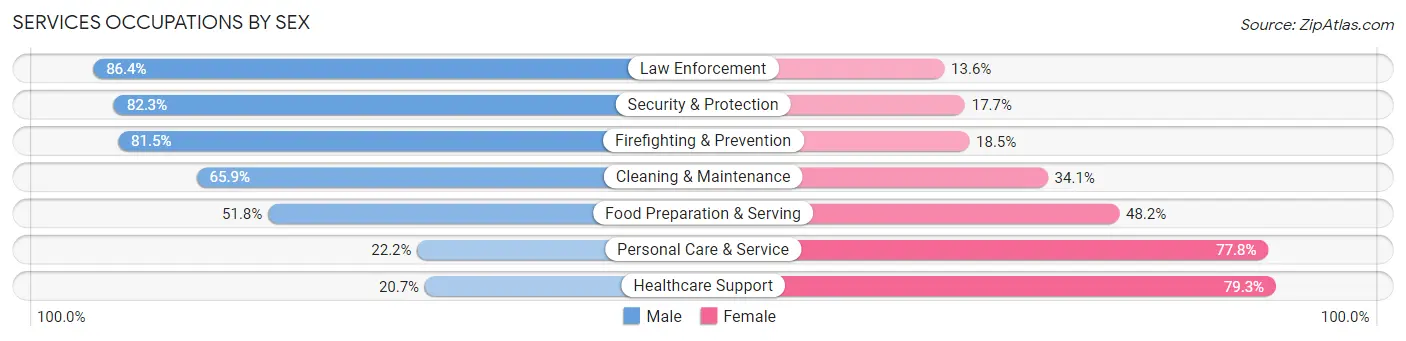
Services Occupations by Sex
Within the Services occupations in Redding, the most male-oriented occupations are Law Enforcement (86.4%), Security & Protection (82.3%), and Firefighting & Prevention (81.5%), while the most female-oriented occupations are Healthcare Support (79.3%), Personal Care & Service (77.8%), and Food Preparation & Serving (48.2%).
| Occupation | Male | Female |
| Healthcare Support | 511 (20.7%) | 1,955 (79.3%) |
| Security & Protection | 880 (82.3%) | 189 (17.7%) |
| Firefighting & Prevention | 721 (81.5%) | 164 (18.5%) |
| Law Enforcement | 159 (86.4%) | 25 (13.6%) |
| Food Preparation & Serving | 1,365 (51.8%) | 1,271 (48.2%) |
| Cleaning & Maintenance | 996 (65.9%) | 515 (34.1%) |
| Personal Care & Service | 297 (22.2%) | 1,039 (77.8%) |
| Total (Category) | 4,049 (44.9%) | 4,969 (55.1%) |
| Total (Overall) | 21,024 (51.3%) | 19,924 (48.7%) |
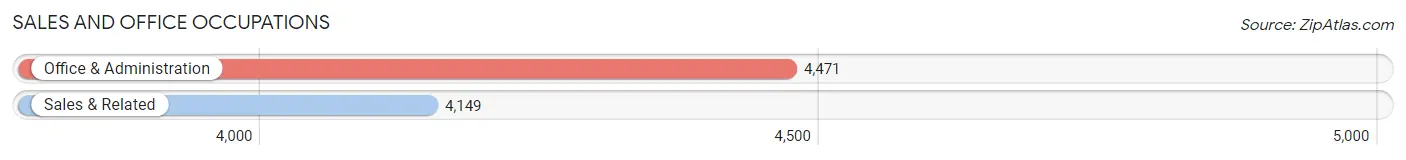
Sales and Office Occupations
The most common Sales and Office occupations in Redding are Office & Administration (4,471 | 10.9%), and Sales & Related (4,149 | 10.1%).
Sales and Office Occupations by Sex
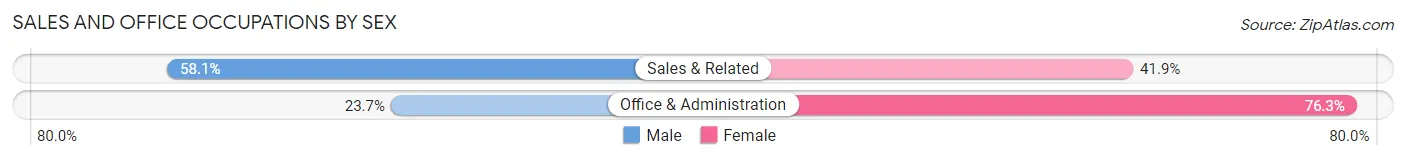
| Occupation | Male | Female |
| Sales & Related | 2,409 (58.1%) | 1,740 (41.9%) |
| Office & Administration | 1,058 (23.7%) | 3,413 (76.3%) |
| Total (Category) | 3,467 (40.2%) | 5,153 (59.8%) |
| Total (Overall) | 21,024 (51.3%) | 19,924 (48.7%) |
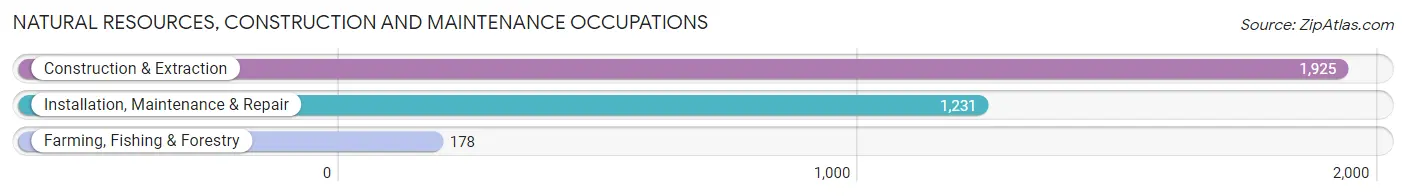
Natural Resources, Construction and Maintenance Occupations
The most common Natural Resources, Construction and Maintenance occupations in Redding are Construction & Extraction (1,925 | 4.7%), Installation, Maintenance & Repair (1,231 | 3.0%), and Farming, Fishing & Forestry (178 | 0.4%).
Natural Resources, Construction and Maintenance Occupations by Sex
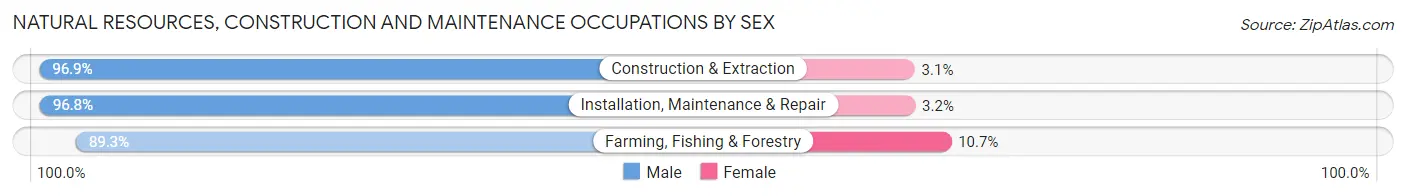
| Occupation | Male | Female |
| Farming, Fishing & Forestry | 159 (89.3%) | 19 (10.7%) |
| Construction & Extraction | 1,866 (96.9%) | 59 (3.1%) |
| Installation, Maintenance & Repair | 1,192 (96.8%) | 39 (3.2%) |
| Total (Category) | 3,217 (96.5%) | 117 (3.5%) |
| Total (Overall) | 21,024 (51.3%) | 19,924 (48.7%) |
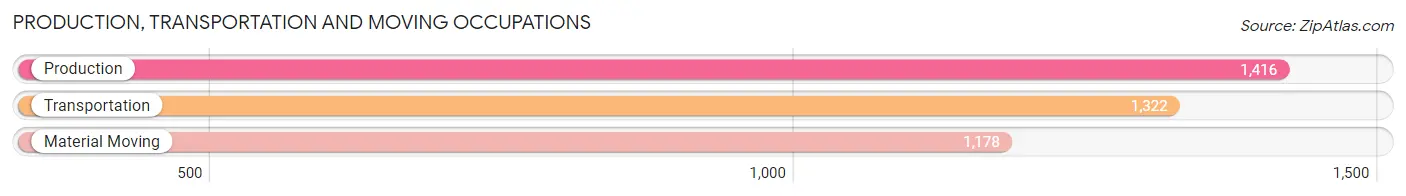
Production, Transportation and Moving Occupations
The most common Production, Transportation and Moving occupations in Redding are Production (1,416 | 3.5%), Transportation (1,322 | 3.2%), and Material Moving (1,178 | 2.9%).
Production, Transportation and Moving Occupations by Sex
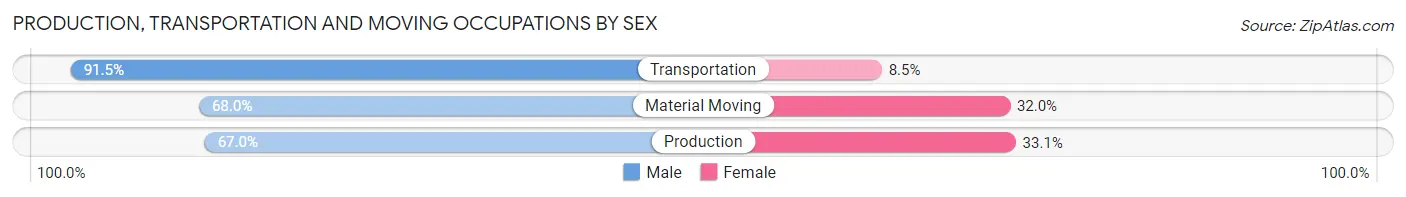
| Occupation | Male | Female |
| Production | 948 (66.9%) | 468 (33.1%) |
| Transportation | 1,210 (91.5%) | 112 (8.5%) |
| Material Moving | 801 (68.0%) | 377 (32.0%) |
| Total (Category) | 2,959 (75.6%) | 957 (24.4%) |
| Total (Overall) | 21,024 (51.3%) | 19,924 (48.7%) |
Employment Industries by Sex in Redding
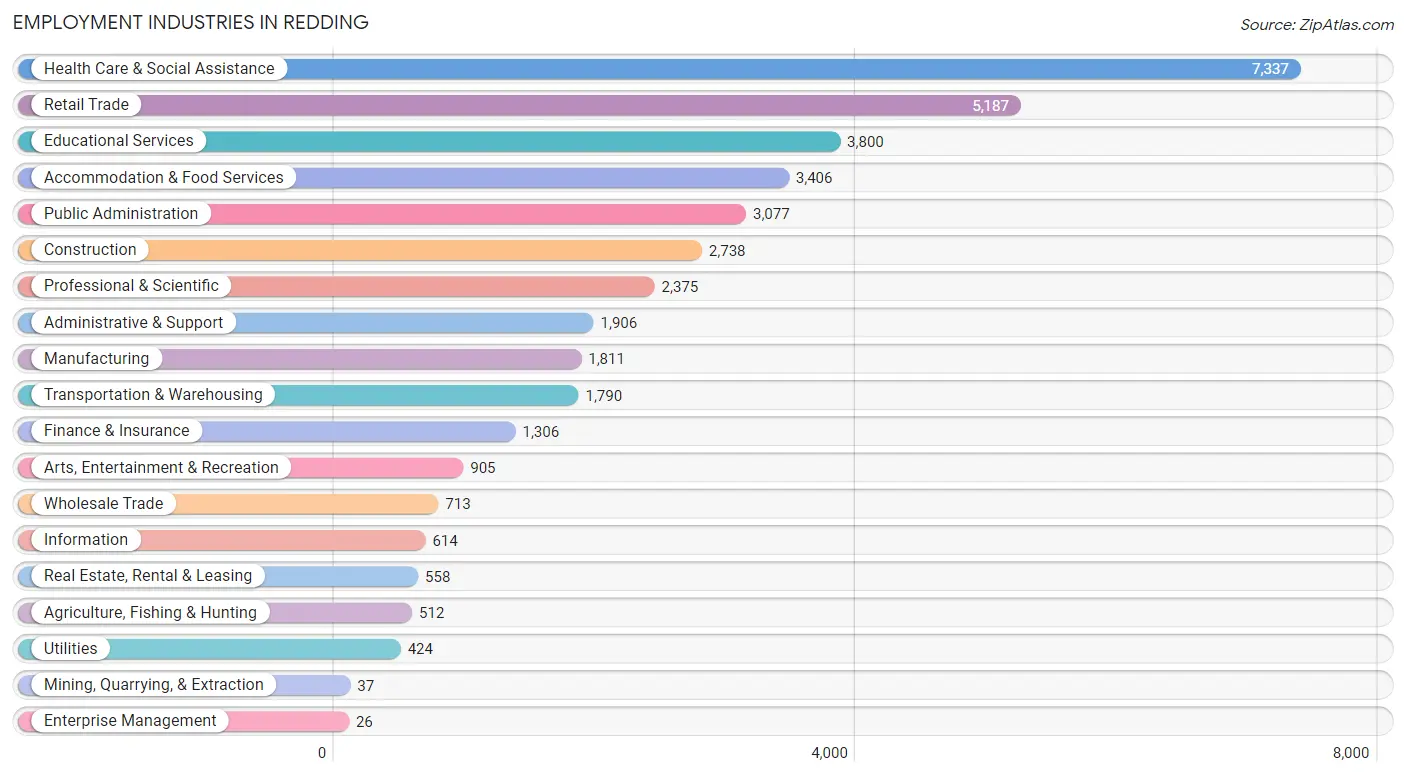
Employment Industries in Redding
The major employment industries in Redding include Health Care & Social Assistance (7,337 | 17.9%), Retail Trade (5,187 | 12.7%), Educational Services (3,800 | 9.3%), Accommodation & Food Services (3,406 | 8.3%), and Public Administration (3,077 | 7.5%).
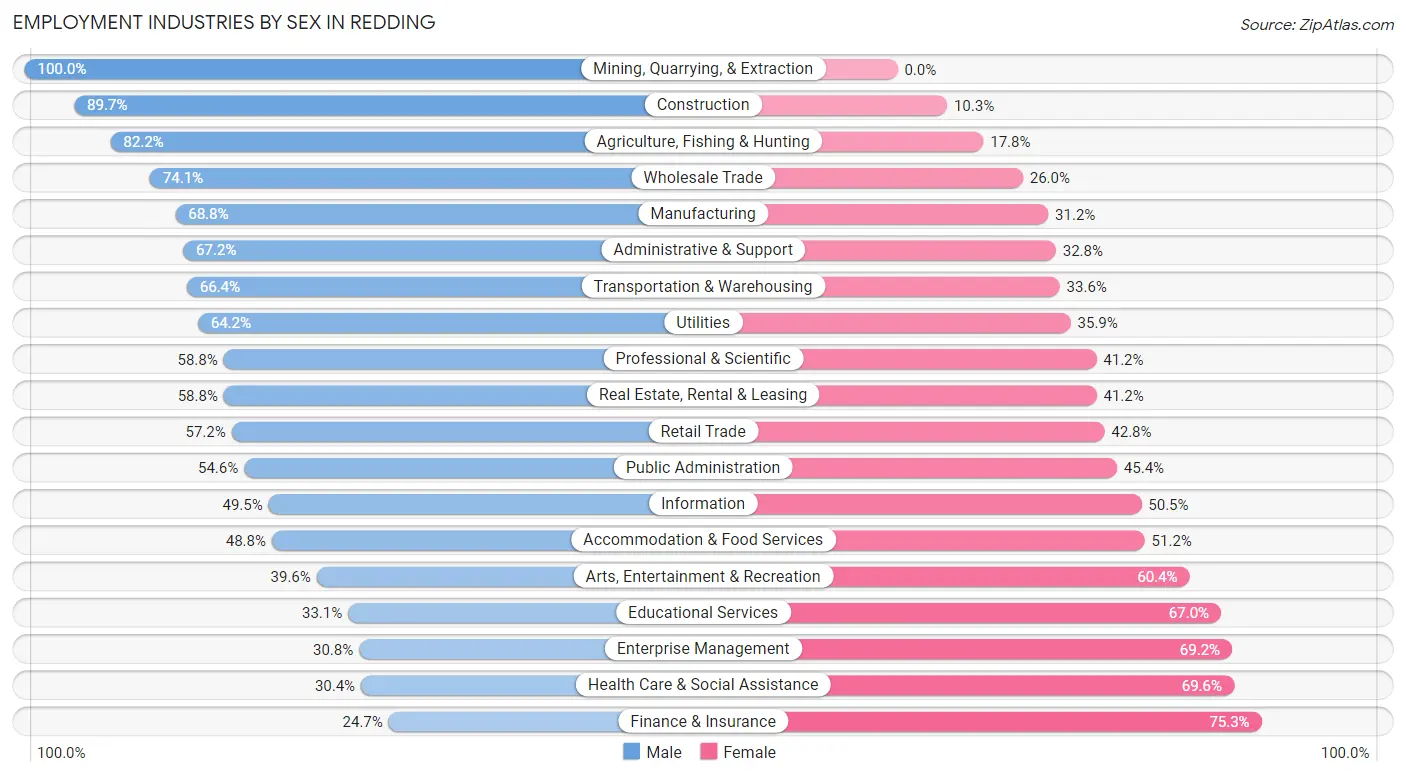
Employment Industries by Sex in Redding
The Redding industries that see more men than women are Mining, Quarrying, & Extraction (100.0%), Construction (89.7%), and Agriculture, Fishing & Hunting (82.2%), whereas the industries that tend to have a higher number of women are Finance & Insurance (75.3%), Health Care & Social Assistance (69.6%), and Enterprise Management (69.2%).
| Industry | Male | Female |
| Agriculture, Fishing & Hunting | 421 (82.2%) | 91 (17.8%) |
| Mining, Quarrying, & Extraction | 37 (100.0%) | 0 (0.0%) |
| Construction | 2,457 (89.7%) | 281 (10.3%) |
| Manufacturing | 1,246 (68.8%) | 565 (31.2%) |
| Wholesale Trade | 528 (74.1%) | 185 (26.0%) |
| Retail Trade | 2,965 (57.2%) | 2,222 (42.8%) |
| Transportation & Warehousing | 1,189 (66.4%) | 601 (33.6%) |
| Utilities | 272 (64.1%) | 152 (35.8%) |
| Information | 304 (49.5%) | 310 (50.5%) |
| Finance & Insurance | 322 (24.7%) | 984 (75.3%) |
| Real Estate, Rental & Leasing | 328 (58.8%) | 230 (41.2%) |
| Professional & Scientific | 1,397 (58.8%) | 978 (41.2%) |
| Enterprise Management | 8 (30.8%) | 18 (69.2%) |
| Administrative & Support | 1,281 (67.2%) | 625 (32.8%) |
| Educational Services | 1,256 (33.1%) | 2,544 (66.9%) |
| Health Care & Social Assistance | 2,229 (30.4%) | 5,108 (69.6%) |
| Arts, Entertainment & Recreation | 358 (39.6%) | 547 (60.4%) |
| Accommodation & Food Services | 1,663 (48.8%) | 1,743 (51.2%) |
| Public Administration | 1,679 (54.6%) | 1,398 (45.4%) |
| Total | 21,024 (51.3%) | 19,924 (48.7%) |
Education in Redding
School Enrollment in Redding
The most common levels of schooling among the 23,215 students in Redding are college / undergraduate (5,641 | 24.3%), elementary school (4,679 | 20.2%), and middle school (4,630 | 19.9%).
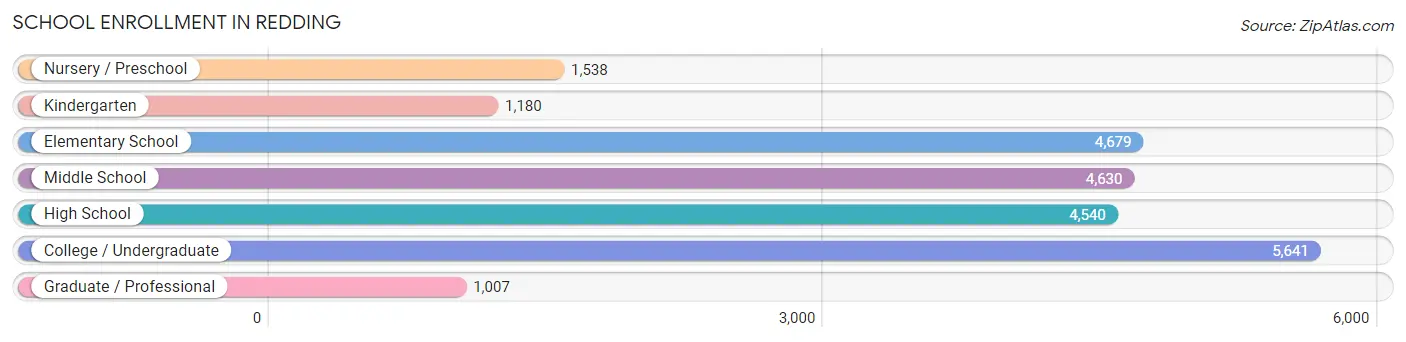
| School Level | # Students | % Students |
| Nursery / Preschool | 1,538 | 6.6% |
| Kindergarten | 1,180 | 5.1% |
| Elementary School | 4,679 | 20.2% |
| Middle School | 4,630 | 19.9% |
| High School | 4,540 | 19.6% |
| College / Undergraduate | 5,641 | 24.3% |
| Graduate / Professional | 1,007 | 4.3% |
| Total | 23,215 | 100.0% |
School Enrollment by Age by Funding Source in Redding
Out of a total of 23,215 students who are enrolled in schools in Redding, 4,480 (19.3%) attend a private institution, while the remaining 18,735 (80.7%) are enrolled in public schools. The age group of 18 to 19 year olds has the highest likelihood of being enrolled in private schools, with 556 (38.0% in the age bracket) enrolled. Conversely, the age group of 15 to 17 year olds has the lowest likelihood of being enrolled in a private school, with 3,281 (92.7% in the age bracket) attending a public institution.
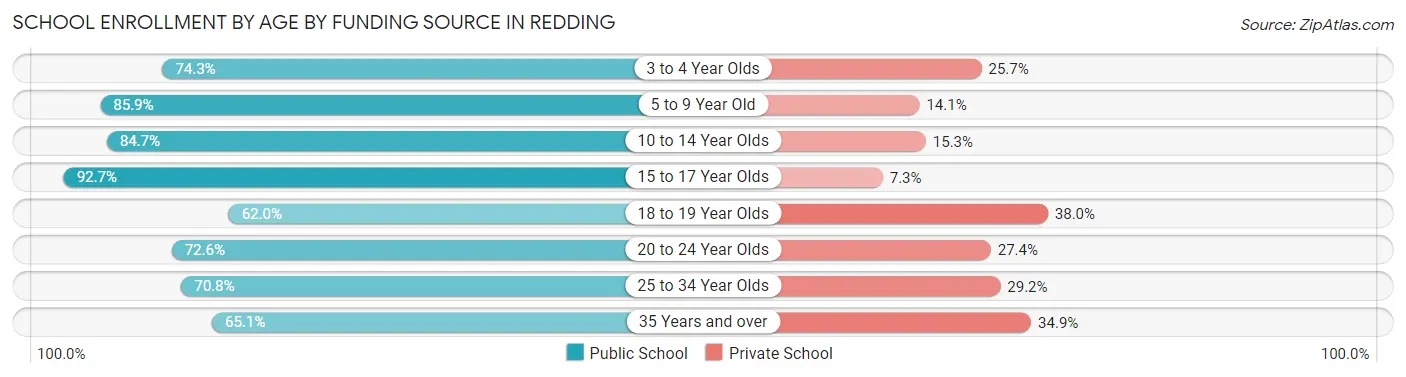
| Age Bracket | Public School | Private School |
| 3 to 4 Year Olds | 822 (74.3%) | 284 (25.7%) |
| 5 to 9 Year Old | 4,926 (85.9%) | 810 (14.1%) |
| 10 to 14 Year Olds | 4,890 (84.7%) | 884 (15.3%) |
| 15 to 17 Year Olds | 3,281 (92.7%) | 258 (7.3%) |
| 18 to 19 Year Olds | 906 (62.0%) | 556 (38.0%) |
| 20 to 24 Year Olds | 1,528 (72.6%) | 577 (27.4%) |
| 25 to 34 Year Olds | 1,419 (70.8%) | 585 (29.2%) |
| 35 Years and over | 969 (65.1%) | 520 (34.9%) |
| Total | 18,735 (80.7%) | 4,480 (19.3%) |
Educational Attainment by Field of Study in Redding
Business (2,290 | 12.8%), science & technology (2,228 | 12.4%), liberal arts & history (1,777 | 9.9%), education (1,673 | 9.3%), and bio, nature & agricultural (1,662 | 9.3%) are the most common fields of study among 17,956 individuals in Redding who have obtained a bachelor's degree or higher.
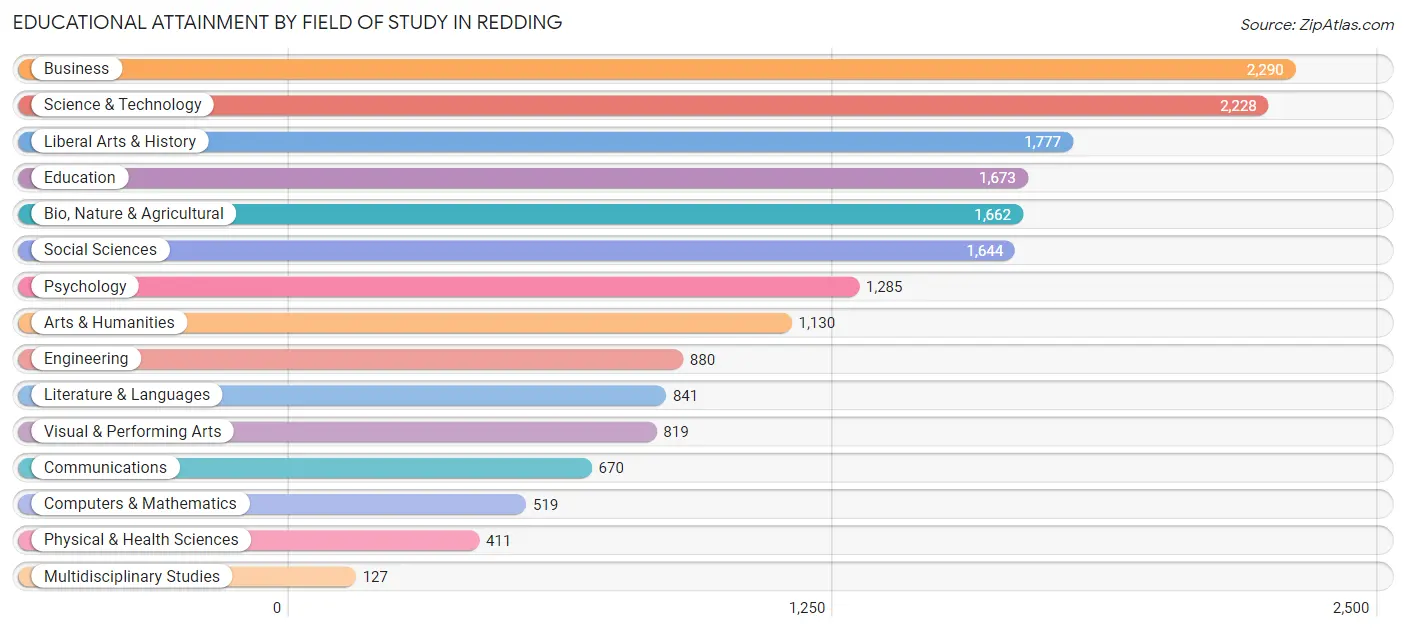
| Field of Study | # Graduates | % Graduates |
| Computers & Mathematics | 519 | 2.9% |
| Bio, Nature & Agricultural | 1,662 | 9.3% |
| Physical & Health Sciences | 411 | 2.3% |
| Psychology | 1,285 | 7.2% |
| Social Sciences | 1,644 | 9.2% |
| Engineering | 880 | 4.9% |
| Multidisciplinary Studies | 127 | 0.7% |
| Science & Technology | 2,228 | 12.4% |
| Business | 2,290 | 12.8% |
| Education | 1,673 | 9.3% |
| Literature & Languages | 841 | 4.7% |
| Liberal Arts & History | 1,777 | 9.9% |
| Visual & Performing Arts | 819 | 4.6% |
| Communications | 670 | 3.7% |
| Arts & Humanities | 1,130 | 6.3% |
| Total | 17,956 | 100.0% |
Transportation & Commute in Redding
Vehicle Availability by Sex in Redding
The most prevalent vehicle ownership categories in Redding are males with 2 vehicles (8,441, accounting for 41.4%) and females with 2 vehicles (8,012, making up 44.2%).
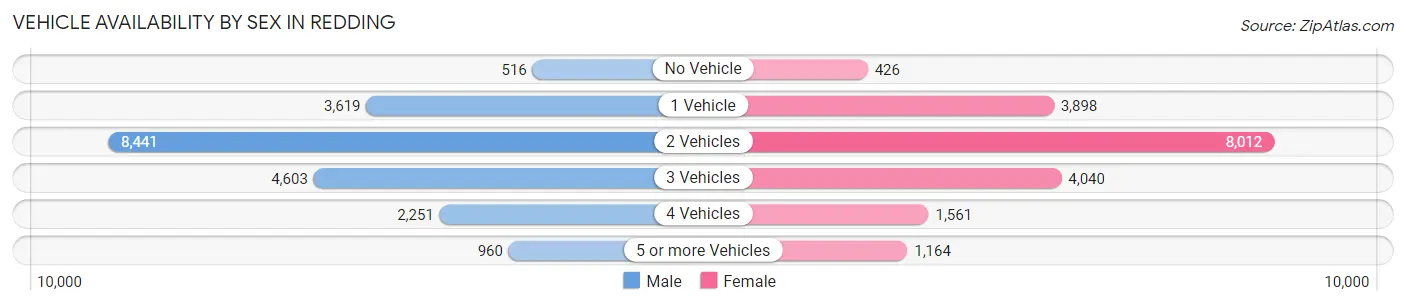
| Vehicles Available | Male | Female |
| No Vehicle | 516 (2.5%) | 426 (2.2%) |
| 1 Vehicle | 3,619 (17.7%) | 3,898 (20.4%) |
| 2 Vehicles | 8,441 (41.4%) | 8,012 (41.9%) |
| 3 Vehicles | 4,603 (22.6%) | 4,040 (21.1%) |
| 4 Vehicles | 2,251 (11.0%) | 1,561 (8.2%) |
| 5 or more Vehicles | 960 (4.7%) | 1,164 (6.1%) |
| Total | 20,390 (100.0%) | 19,101 (100.0%) |
Commute Time in Redding
The most frequently occuring commute durations in Redding are 10 to 14 minutes (10,433 commuters, 28.1%), 15 to 19 minutes (9,005 commuters, 24.3%), and 5 to 9 minutes (7,221 commuters, 19.5%).
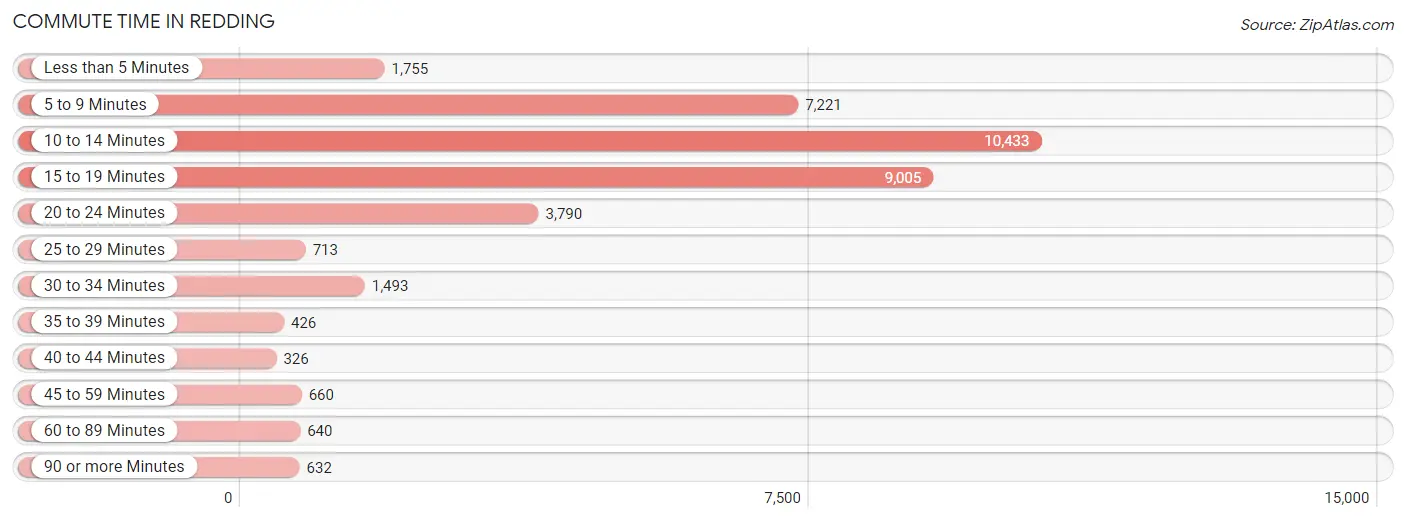
| Commute Time | # Commuters | % Commuters |
| Less than 5 Minutes | 1,755 | 4.7% |
| 5 to 9 Minutes | 7,221 | 19.5% |
| 10 to 14 Minutes | 10,433 | 28.1% |
| 15 to 19 Minutes | 9,005 | 24.3% |
| 20 to 24 Minutes | 3,790 | 10.2% |
| 25 to 29 Minutes | 713 | 1.9% |
| 30 to 34 Minutes | 1,493 | 4.0% |
| 35 to 39 Minutes | 426 | 1.1% |
| 40 to 44 Minutes | 326 | 0.9% |
| 45 to 59 Minutes | 660 | 1.8% |
| 60 to 89 Minutes | 640 | 1.7% |
| 90 or more Minutes | 632 | 1.7% |
Commute Time by Sex in Redding
The most common commute times in Redding are 10 to 14 minutes (5,189 commuters, 26.7%) for males and 10 to 14 minutes (5,244 commuters, 29.7%) for females.
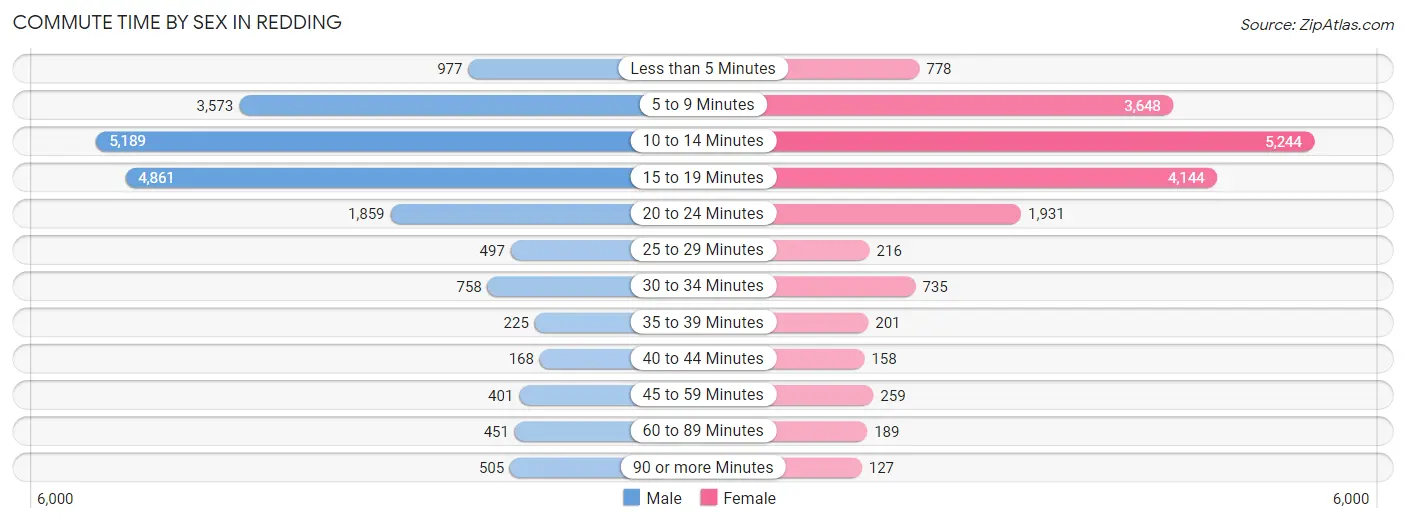
| Commute Time | Male | Female |
| Less than 5 Minutes | 977 (5.0%) | 778 (4.4%) |
| 5 to 9 Minutes | 3,573 (18.4%) | 3,648 (20.7%) |
| 10 to 14 Minutes | 5,189 (26.7%) | 5,244 (29.7%) |
| 15 to 19 Minutes | 4,861 (25.0%) | 4,144 (23.5%) |
| 20 to 24 Minutes | 1,859 (9.6%) | 1,931 (11.0%) |
| 25 to 29 Minutes | 497 (2.5%) | 216 (1.2%) |
| 30 to 34 Minutes | 758 (3.9%) | 735 (4.2%) |
| 35 to 39 Minutes | 225 (1.2%) | 201 (1.1%) |
| 40 to 44 Minutes | 168 (0.9%) | 158 (0.9%) |
| 45 to 59 Minutes | 401 (2.1%) | 259 (1.5%) |
| 60 to 89 Minutes | 451 (2.3%) | 189 (1.1%) |
| 90 or more Minutes | 505 (2.6%) | 127 (0.7%) |
Time of Departure to Work by Sex in Redding
The most frequent times of departure to work in Redding are 7:30 AM to 7:59 AM (3,167, 16.3%) for males and 7:30 AM to 7:59 AM (4,184, 23.7%) for females.
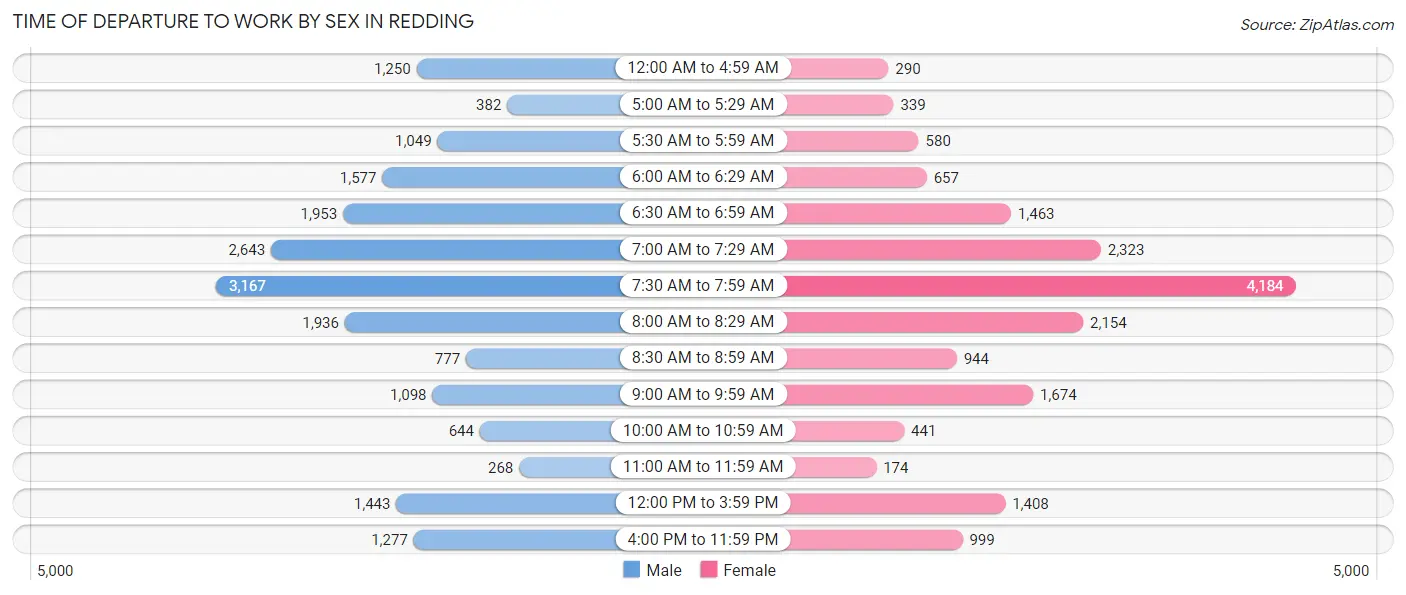
| Time of Departure | Male | Female |
| 12:00 AM to 4:59 AM | 1,250 (6.4%) | 290 (1.6%) |
| 5:00 AM to 5:29 AM | 382 (2.0%) | 339 (1.9%) |
| 5:30 AM to 5:59 AM | 1,049 (5.4%) | 580 (3.3%) |
| 6:00 AM to 6:29 AM | 1,577 (8.1%) | 657 (3.7%) |
| 6:30 AM to 6:59 AM | 1,953 (10.0%) | 1,463 (8.3%) |
| 7:00 AM to 7:29 AM | 2,643 (13.6%) | 2,323 (13.2%) |
| 7:30 AM to 7:59 AM | 3,167 (16.3%) | 4,184 (23.7%) |
| 8:00 AM to 8:29 AM | 1,936 (10.0%) | 2,154 (12.2%) |
| 8:30 AM to 8:59 AM | 777 (4.0%) | 944 (5.3%) |
| 9:00 AM to 9:59 AM | 1,098 (5.6%) | 1,674 (9.5%) |
| 10:00 AM to 10:59 AM | 644 (3.3%) | 441 (2.5%) |
| 11:00 AM to 11:59 AM | 268 (1.4%) | 174 (1.0%) |
| 12:00 PM to 3:59 PM | 1,443 (7.4%) | 1,408 (8.0%) |
| 4:00 PM to 11:59 PM | 1,277 (6.6%) | 999 (5.7%) |
| Total | 19,464 (100.0%) | 17,630 (100.0%) |
Housing Occupancy in Redding
Occupancy by Ownership in Redding
Of the total 36,522 dwellings in Redding, owner-occupied units account for 20,066 (54.9%), while renter-occupied units make up 16,456 (45.1%).
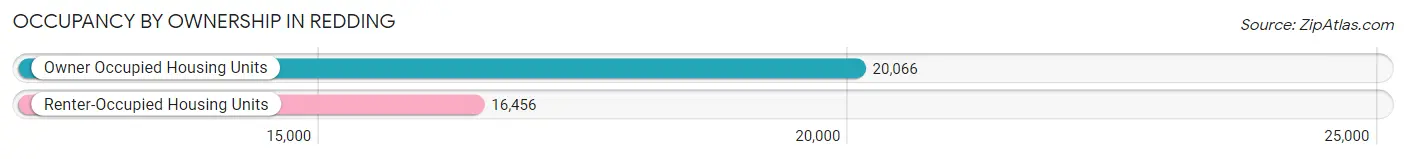
| Occupancy | # Housing Units | % Housing Units |
| Owner Occupied Housing Units | 20,066 | 54.9% |
| Renter-Occupied Housing Units | 16,456 | 45.1% |
| Total Occupied Housing Units | 36,522 | 100.0% |
Occupancy by Household Size in Redding
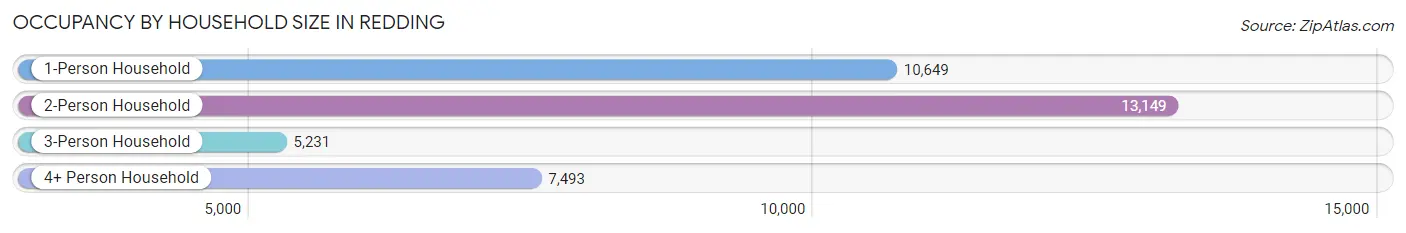
| Household Size | # Housing Units | % Housing Units |
| 1-Person Household | 10,649 | 29.2% |
| 2-Person Household | 13,149 | 36.0% |
| 3-Person Household | 5,231 | 14.3% |
| 4+ Person Household | 7,493 | 20.5% |
| Total Housing Units | 36,522 | 100.0% |
Occupancy by Ownership by Household Size in Redding
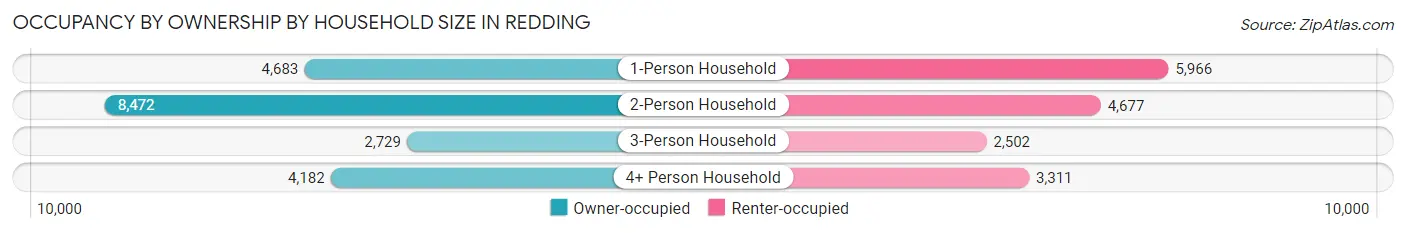
| Household Size | Owner-occupied | Renter-occupied |
| 1-Person Household | 4,683 (44.0%) | 5,966 (56.0%) |
| 2-Person Household | 8,472 (64.4%) | 4,677 (35.6%) |
| 3-Person Household | 2,729 (52.2%) | 2,502 (47.8%) |
| 4+ Person Household | 4,182 (55.8%) | 3,311 (44.2%) |
| Total Housing Units | 20,066 (54.9%) | 16,456 (45.1%) |
Occupancy by Educational Attainment in Redding
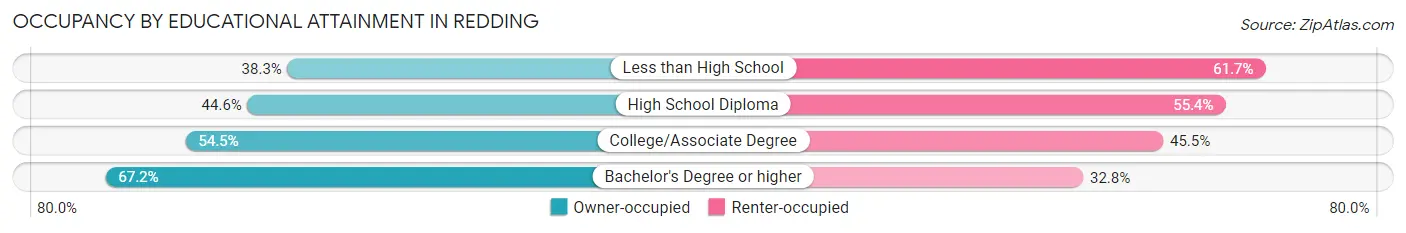
| Household Size | Owner-occupied | Renter-occupied |
| Less than High School | 746 (38.3%) | 1,203 (61.7%) |
| High School Diploma | 3,514 (44.6%) | 4,361 (55.4%) |
| College/Associate Degree | 9,159 (54.5%) | 7,646 (45.5%) |
| Bachelor's Degree or higher | 6,647 (67.2%) | 3,246 (32.8%) |
Occupancy by Age of Householder in Redding
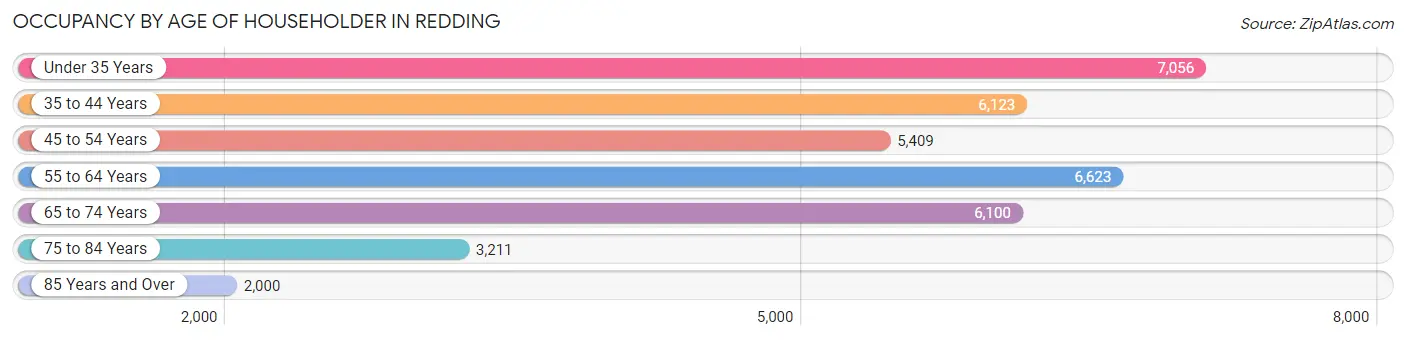
| Age Bracket | # Households | % Households |
| Under 35 Years | 7,056 | 19.3% |
| 35 to 44 Years | 6,123 | 16.8% |
| 45 to 54 Years | 5,409 | 14.8% |
| 55 to 64 Years | 6,623 | 18.1% |
| 65 to 74 Years | 6,100 | 16.7% |
| 75 to 84 Years | 3,211 | 8.8% |
| 85 Years and Over | 2,000 | 5.5% |
| Total | 36,522 | 100.0% |
Housing Finances in Redding
Median Income by Occupancy in Redding
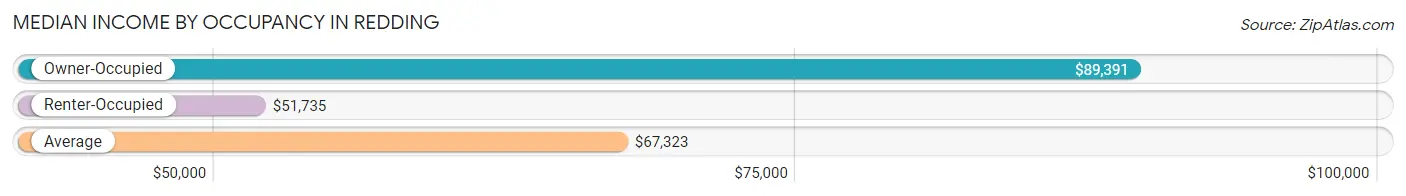
| Occupancy Type | # Households | Median Income |
| Owner-Occupied | 20,066 (54.9%) | $89,391 |
| Renter-Occupied | 16,456 (45.1%) | $51,735 |
| Average | 36,522 (100.0%) | $67,323 |
Occupancy by Householder Income Bracket in Redding
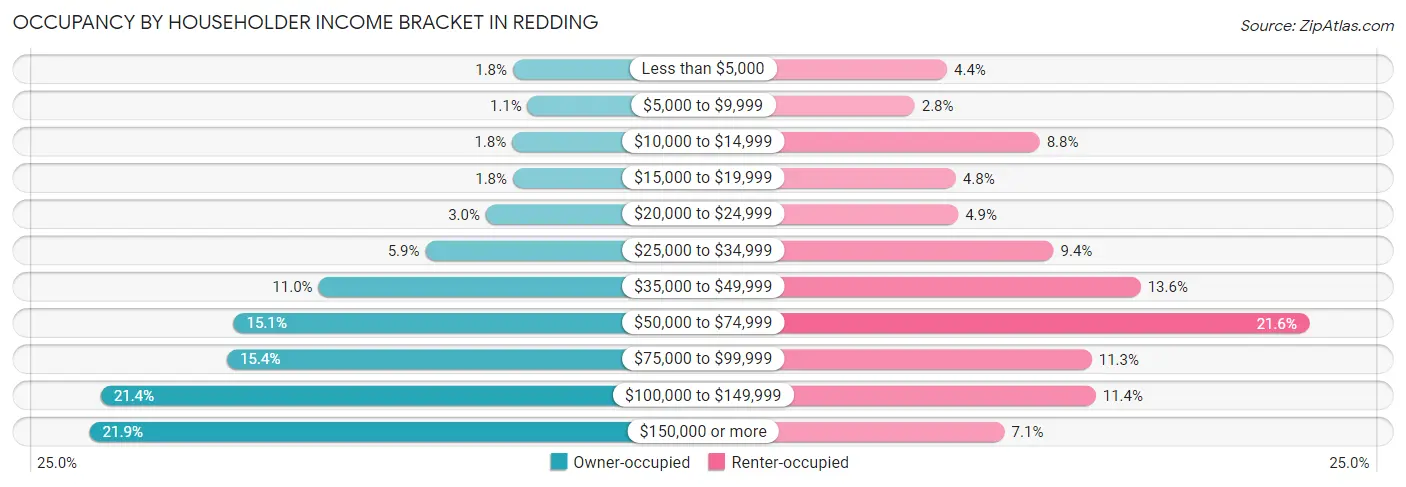
| Income Bracket | Owner-occupied | Renter-occupied |
| Less than $5,000 | 352 (1.8%) | 717 (4.4%) |
| $5,000 to $9,999 | 211 (1.1%) | 464 (2.8%) |
| $10,000 to $14,999 | 359 (1.8%) | 1,444 (8.8%) |
| $15,000 to $19,999 | 351 (1.8%) | 786 (4.8%) |
| $20,000 to $24,999 | 611 (3.0%) | 804 (4.9%) |
| $25,000 to $34,999 | 1,188 (5.9%) | 1,552 (9.4%) |
| $35,000 to $49,999 | 2,210 (11.0%) | 2,234 (13.6%) |
| $50,000 to $74,999 | 3,019 (15.0%) | 3,552 (21.6%) |
| $75,000 to $99,999 | 3,082 (15.4%) | 1,852 (11.3%) |
| $100,000 to $149,999 | 4,288 (21.4%) | 1,882 (11.4%) |
| $150,000 or more | 4,395 (21.9%) | 1,169 (7.1%) |
| Total | 20,066 (100.0%) | 16,456 (100.0%) |
Monthly Housing Cost Tiers in Redding
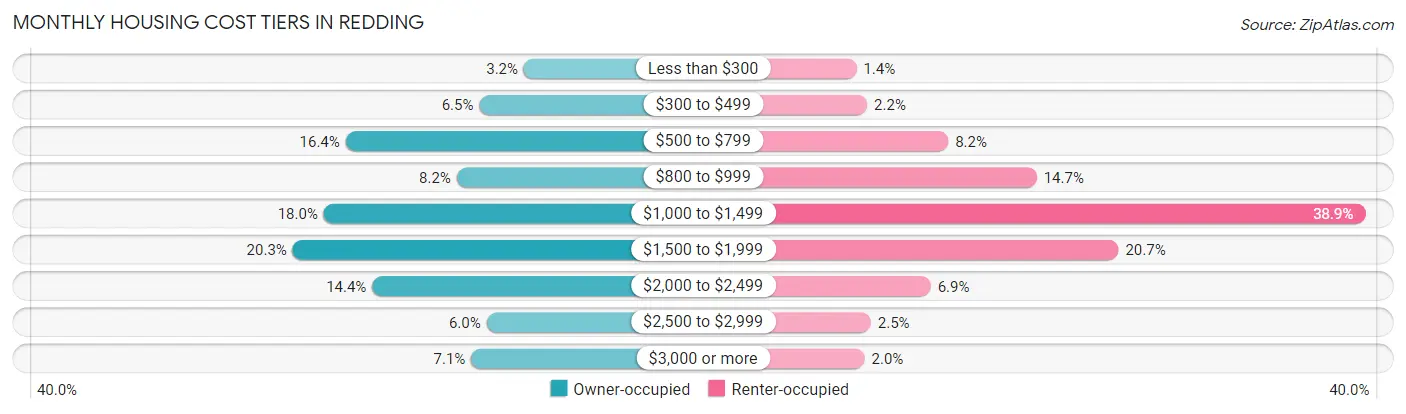
| Monthly Cost | Owner-occupied | Renter-occupied |
| Less than $300 | 649 (3.2%) | 230 (1.4%) |
| $300 to $499 | 1,307 (6.5%) | 361 (2.2%) |
| $500 to $799 | 3,283 (16.4%) | 1,343 (8.2%) |
| $800 to $999 | 1,642 (8.2%) | 2,416 (14.7%) |
| $1,000 to $1,499 | 3,605 (18.0%) | 6,397 (38.9%) |
| $1,500 to $1,999 | 4,065 (20.3%) | 3,407 (20.7%) |
| $2,000 to $2,499 | 2,890 (14.4%) | 1,130 (6.9%) |
| $2,500 to $2,999 | 1,199 (6.0%) | 404 (2.5%) |
| $3,000 or more | 1,426 (7.1%) | 329 (2.0%) |
| Total | 20,066 (100.0%) | 16,456 (100.0%) |
Physical Housing Characteristics in Redding
Housing Structures in Redding
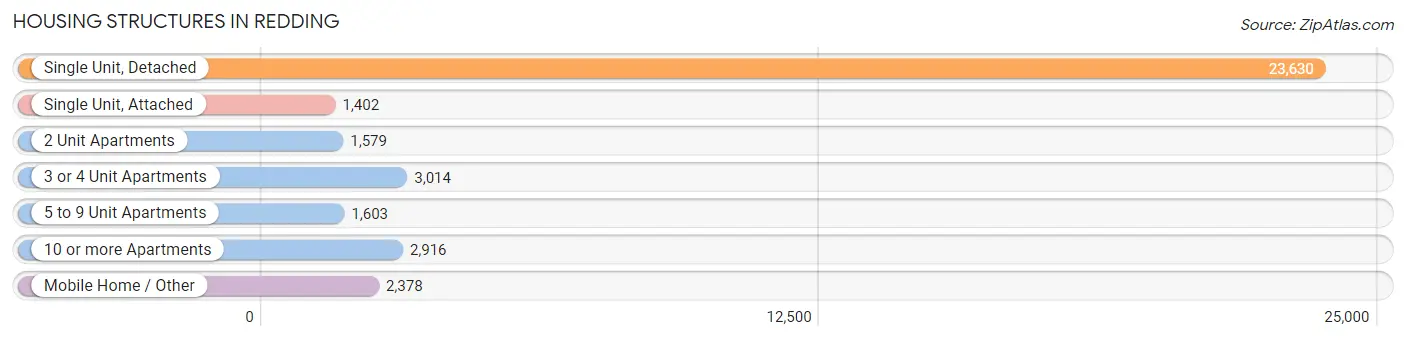
| Structure Type | # Housing Units | % Housing Units |
| Single Unit, Detached | 23,630 | 64.7% |
| Single Unit, Attached | 1,402 | 3.8% |
| 2 Unit Apartments | 1,579 | 4.3% |
| 3 or 4 Unit Apartments | 3,014 | 8.3% |
| 5 to 9 Unit Apartments | 1,603 | 4.4% |
| 10 or more Apartments | 2,916 | 8.0% |
| Mobile Home / Other | 2,378 | 6.5% |
| Total | 36,522 | 100.0% |
Housing Structures by Occupancy in Redding
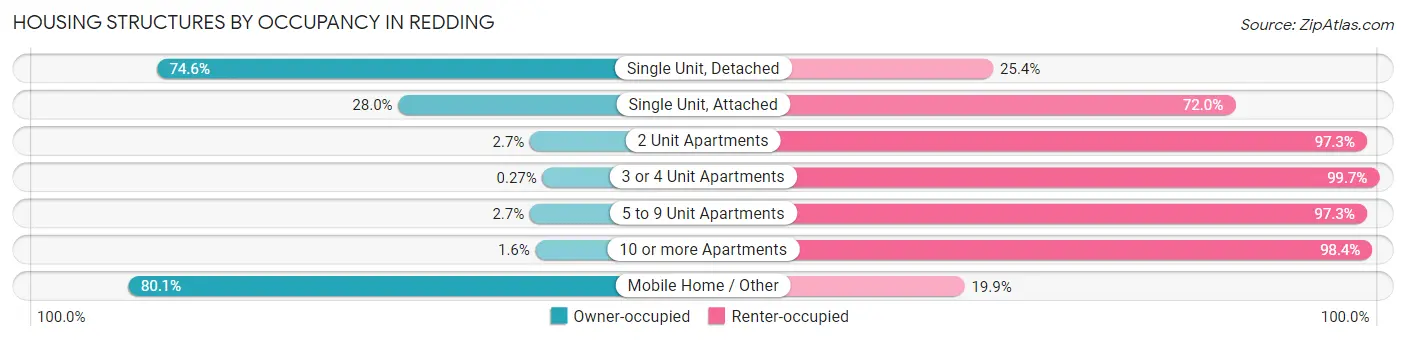
| Structure Type | Owner-occupied | Renter-occupied |
| Single Unit, Detached | 17,628 (74.6%) | 6,002 (25.4%) |
| Single Unit, Attached | 393 (28.0%) | 1,009 (72.0%) |
| 2 Unit Apartments | 42 (2.7%) | 1,537 (97.3%) |
| 3 or 4 Unit Apartments | 8 (0.3%) | 3,006 (99.7%) |
| 5 to 9 Unit Apartments | 43 (2.7%) | 1,560 (97.3%) |
| 10 or more Apartments | 47 (1.6%) | 2,869 (98.4%) |
| Mobile Home / Other | 1,905 (80.1%) | 473 (19.9%) |
| Total | 20,066 (54.9%) | 16,456 (45.1%) |
Housing Structures by Number of Rooms in Redding
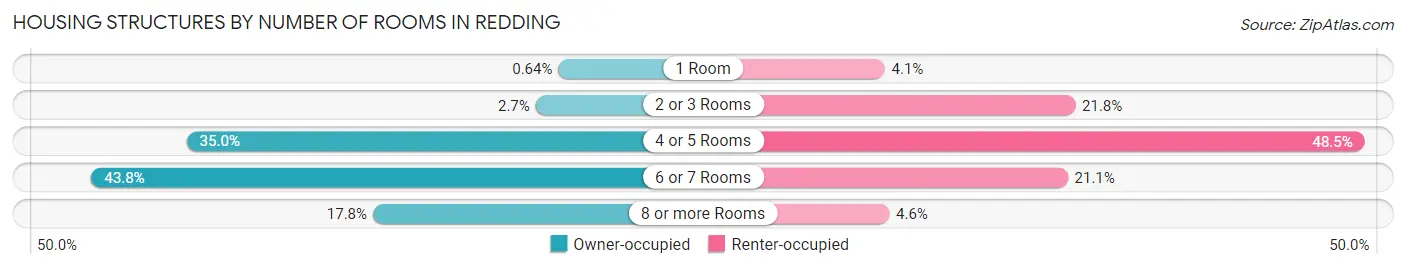
| Number of Rooms | Owner-occupied | Renter-occupied |
| 1 Room | 128 (0.6%) | 679 (4.1%) |
| 2 or 3 Rooms | 550 (2.7%) | 3,580 (21.7%) |
| 4 or 5 Rooms | 7,026 (35.0%) | 7,984 (48.5%) |
| 6 or 7 Rooms | 8,793 (43.8%) | 3,465 (21.1%) |
| 8 or more Rooms | 3,569 (17.8%) | 748 (4.5%) |
| Total | 20,066 (100.0%) | 16,456 (100.0%) |
Housing Structure by Heating Type in Redding
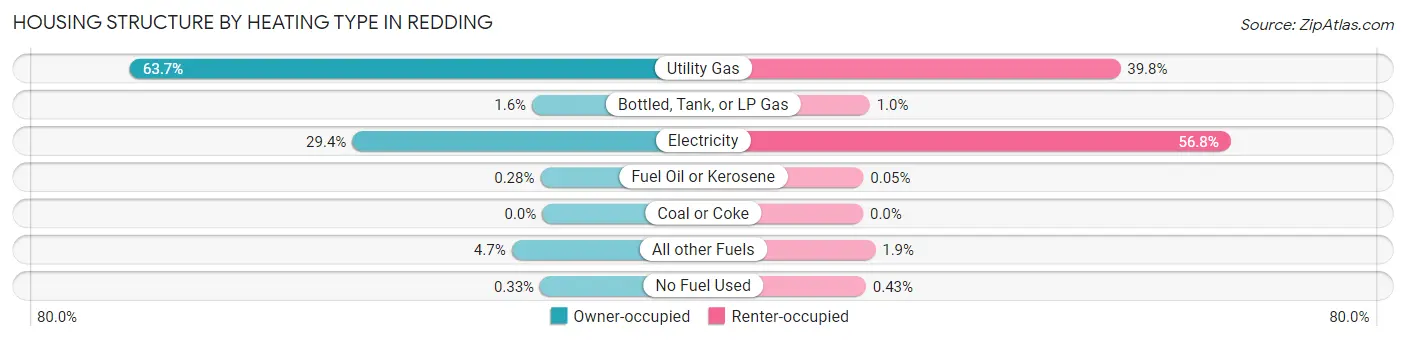
| Heating Type | Owner-occupied | Renter-occupied |
| Utility Gas | 12,786 (63.7%) | 6,545 (39.8%) |
| Bottled, Tank, or LP Gas | 316 (1.6%) | 169 (1.0%) |
| Electricity | 5,892 (29.4%) | 9,351 (56.8%) |
| Fuel Oil or Kerosene | 56 (0.3%) | 9 (0.1%) |
| Coal or Coke | 0 (0.0%) | 0 (0.0%) |
| All other Fuels | 950 (4.7%) | 311 (1.9%) |
| No Fuel Used | 66 (0.3%) | 71 (0.4%) |
| Total | 20,066 (100.0%) | 16,456 (100.0%) |
Household Vehicle Usage in Redding
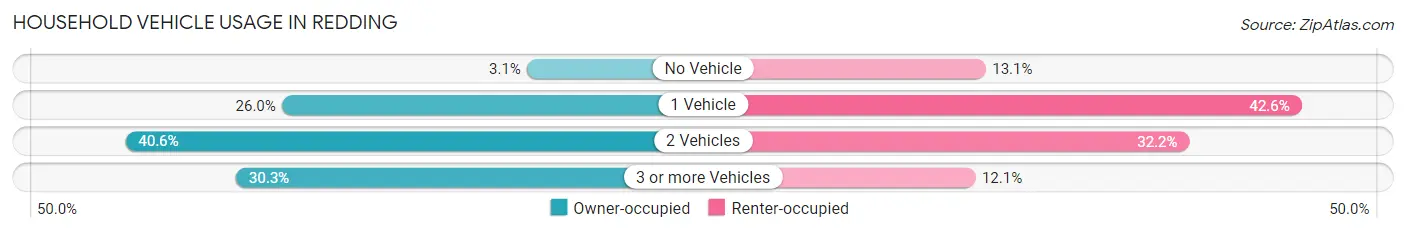
| Vehicles per Household | Owner-occupied | Renter-occupied |
| No Vehicle | 629 (3.1%) | 2,155 (13.1%) |
| 1 Vehicle | 5,220 (26.0%) | 7,013 (42.6%) |
| 2 Vehicles | 8,144 (40.6%) | 5,291 (32.2%) |
| 3 or more Vehicles | 6,073 (30.3%) | 1,997 (12.1%) |
| Total | 20,066 (100.0%) | 16,456 (100.0%) |
Real Estate & Mortgages in Redding
Real Estate and Mortgage Overview in Redding
| Characteristic | Without Mortgage | With Mortgage |
| Housing Units | 7,213 | 12,853 |
| Median Property Value | $313,400 | $355,400 |
| Median Household Income | $59,783 | $3,449 |
| Monthly Housing Costs | $667 | $1,416 |
| Real Estate Taxes | $2,176 | $268 |
Property Value by Mortgage Status in Redding
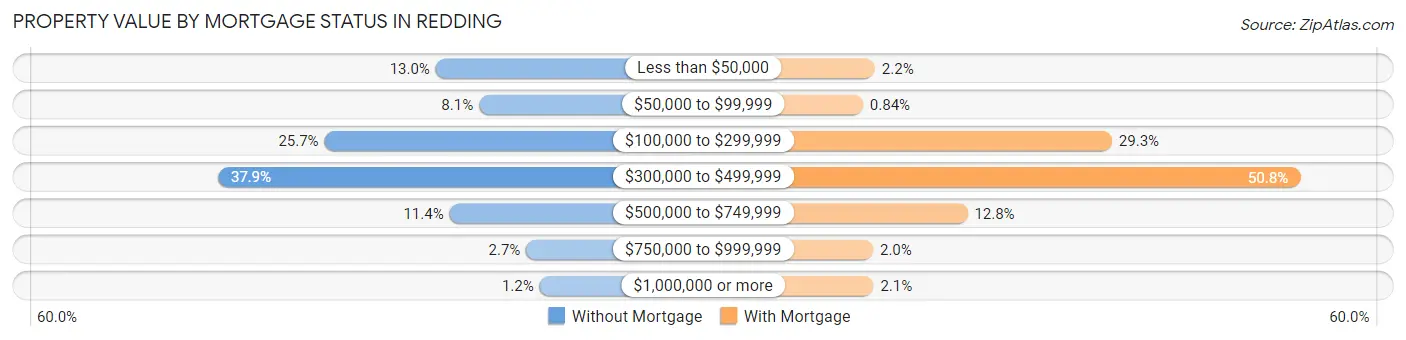
| Property Value | Without Mortgage | With Mortgage |
| Less than $50,000 | 939 (13.0%) | 284 (2.2%) |
| $50,000 to $99,999 | 582 (8.1%) | 108 (0.8%) |
| $100,000 to $299,999 | 1,856 (25.7%) | 3,766 (29.3%) |
| $300,000 to $499,999 | 2,735 (37.9%) | 6,530 (50.8%) |
| $500,000 to $749,999 | 825 (11.4%) | 1,644 (12.8%) |
| $750,000 to $999,999 | 193 (2.7%) | 257 (2.0%) |
| $1,000,000 or more | 83 (1.1%) | 264 (2.1%) |
| Total | 7,213 (100.0%) | 12,853 (100.0%) |
Household Income by Mortgage Status in Redding
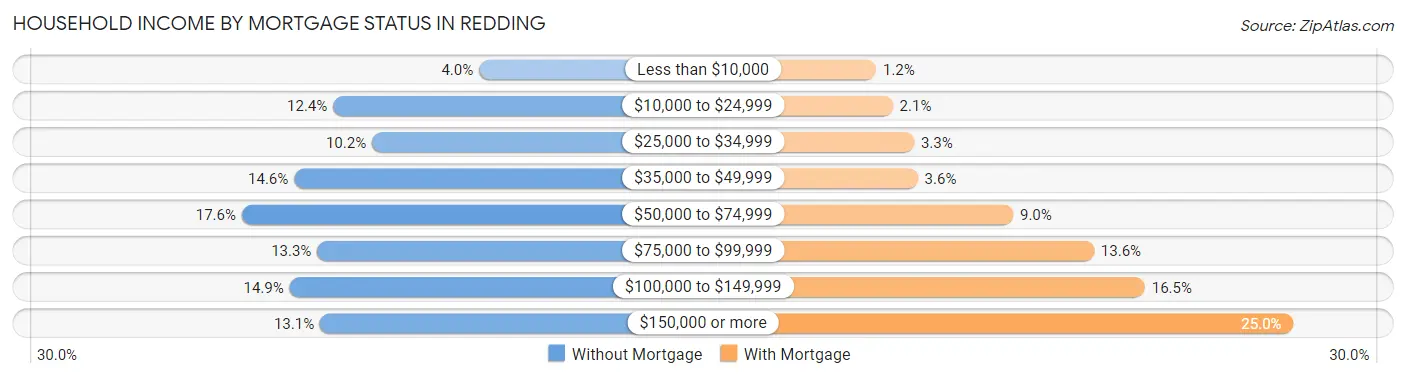
| Household Income | Without Mortgage | With Mortgage |
| Less than $10,000 | 291 (4.0%) | 151 (1.2%) |
| $10,000 to $24,999 | 892 (12.4%) | 272 (2.1%) |
| $25,000 to $34,999 | 732 (10.2%) | 429 (3.3%) |
| $35,000 to $49,999 | 1,053 (14.6%) | 456 (3.5%) |
| $50,000 to $74,999 | 1,269 (17.6%) | 1,157 (9.0%) |
| $75,000 to $99,999 | 958 (13.3%) | 1,750 (13.6%) |
| $100,000 to $149,999 | 1,072 (14.9%) | 2,124 (16.5%) |
| $150,000 or more | 946 (13.1%) | 3,216 (25.0%) |
| Total | 7,213 (100.0%) | 12,853 (100.0%) |
Property Value to Household Income Ratio in Redding
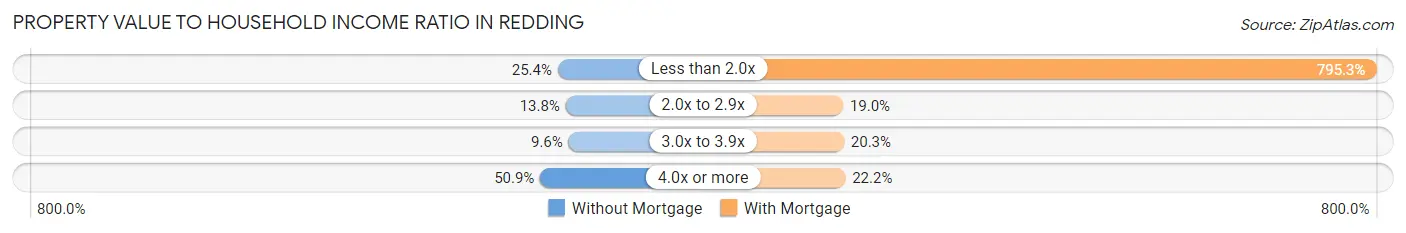
| Value-to-Income Ratio | Without Mortgage | With Mortgage |
| Less than 2.0x | 1,829 (25.4%) | 102,225 (795.3%) |
| 2.0x to 2.9x | 997 (13.8%) | 2,436 (19.0%) |
| 3.0x to 3.9x | 691 (9.6%) | 2,606 (20.3%) |
| 4.0x or more | 3,671 (50.9%) | 2,857 (22.2%) |
| Total | 7,213 (100.0%) | 12,853 (100.0%) |
Real Estate Taxes by Mortgage Status in Redding
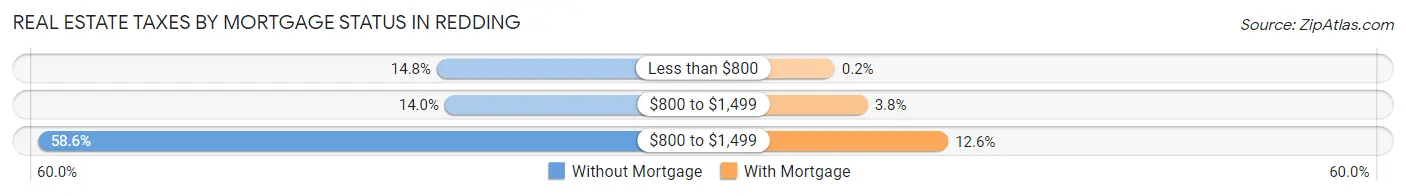
| Property Taxes | Without Mortgage | With Mortgage |
| Less than $800 | 1,069 (14.8%) | 26 (0.2%) |
| $800 to $1,499 | 1,006 (14.0%) | 489 (3.8%) |
| $800 to $1,499 | 4,224 (58.6%) | 1,622 (12.6%) |
| Total | 7,213 (100.0%) | 12,853 (100.0%) |
Health & Disability in Redding
Health Insurance Coverage by Age in Redding
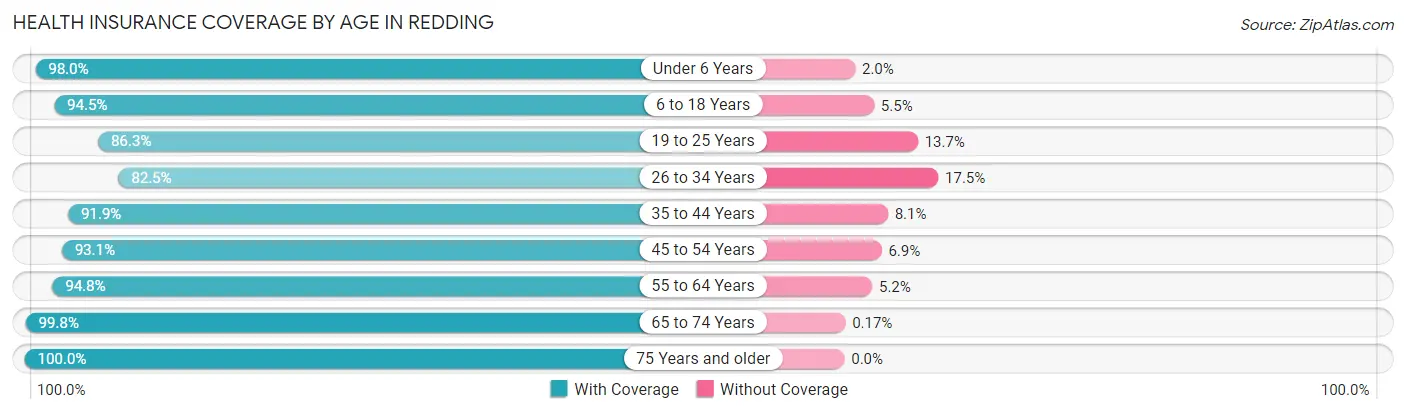
| Age Bracket | With Coverage | Without Coverage |
| Under 6 Years | 6,619 (98.0%) | 135 (2.0%) |
| 6 to 18 Years | 14,378 (94.5%) | 840 (5.5%) |
| 19 to 25 Years | 6,818 (86.3%) | 1,081 (13.7%) |
| 26 to 34 Years | 9,739 (82.5%) | 2,065 (17.5%) |
| 35 to 44 Years | 10,616 (91.9%) | 934 (8.1%) |
| 45 to 54 Years | 9,217 (93.1%) | 686 (6.9%) |
| 55 to 64 Years | 10,823 (94.8%) | 590 (5.2%) |
| 65 to 74 Years | 9,815 (99.8%) | 17 (0.2%) |
| 75 Years and older | 7,661 (100.0%) | 0 (0.0%) |
| Total | 85,686 (93.1%) | 6,348 (6.9%) |
Health Insurance Coverage by Citizenship Status in Redding
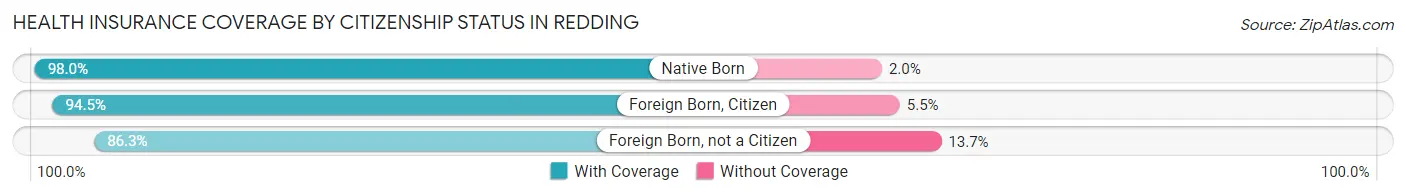
| Citizenship Status | With Coverage | Without Coverage |
| Native Born | 6,619 (98.0%) | 135 (2.0%) |
| Foreign Born, Citizen | 14,378 (94.5%) | 840 (5.5%) |
| Foreign Born, not a Citizen | 6,818 (86.3%) | 1,081 (13.7%) |
Health Insurance Coverage by Household Income in Redding
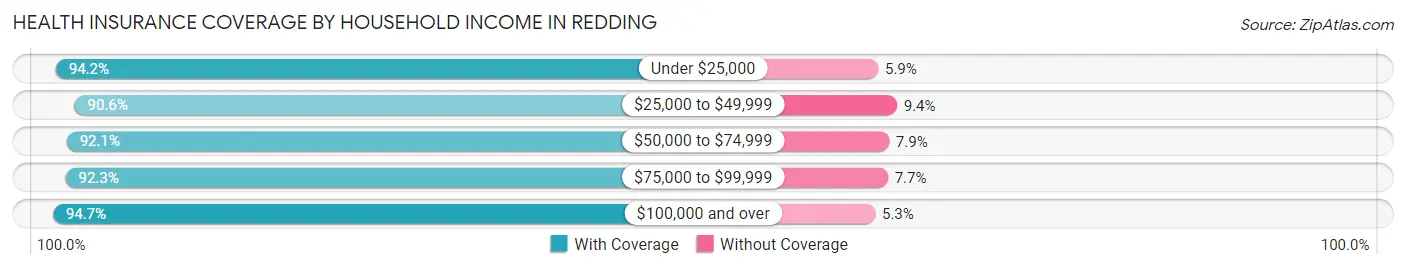
| Household Income | With Coverage | Without Coverage |
| Under $25,000 | 9,443 (94.2%) | 587 (5.9%) |
| $25,000 to $49,999 | 13,316 (90.6%) | 1,377 (9.4%) |
| $50,000 to $74,999 | 14,832 (92.1%) | 1,270 (7.9%) |
| $75,000 to $99,999 | 12,027 (92.3%) | 999 (7.7%) |
| $100,000 and over | 34,754 (94.7%) | 1,940 (5.3%) |
Public vs Private Health Insurance Coverage by Age in Redding
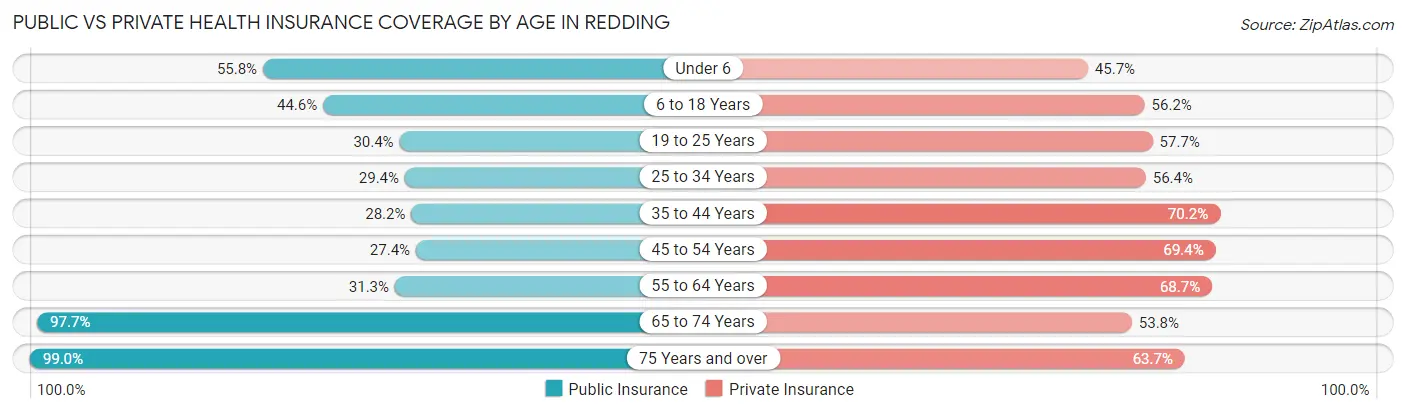
| Age Bracket | Public Insurance | Private Insurance |
| Under 6 | 3,766 (55.8%) | 3,085 (45.7%) |
| 6 to 18 Years | 6,789 (44.6%) | 8,556 (56.2%) |
| 19 to 25 Years | 2,403 (30.4%) | 4,558 (57.7%) |
| 25 to 34 Years | 3,473 (29.4%) | 6,661 (56.4%) |
| 35 to 44 Years | 3,260 (28.2%) | 8,107 (70.2%) |
| 45 to 54 Years | 2,710 (27.4%) | 6,870 (69.4%) |
| 55 to 64 Years | 3,569 (31.3%) | 7,842 (68.7%) |
| 65 to 74 Years | 9,602 (97.7%) | 5,294 (53.8%) |
| 75 Years and over | 7,586 (99.0%) | 4,876 (63.6%) |
| Total | 43,158 (46.9%) | 55,849 (60.7%) |
Disability Status by Sex by Age in Redding
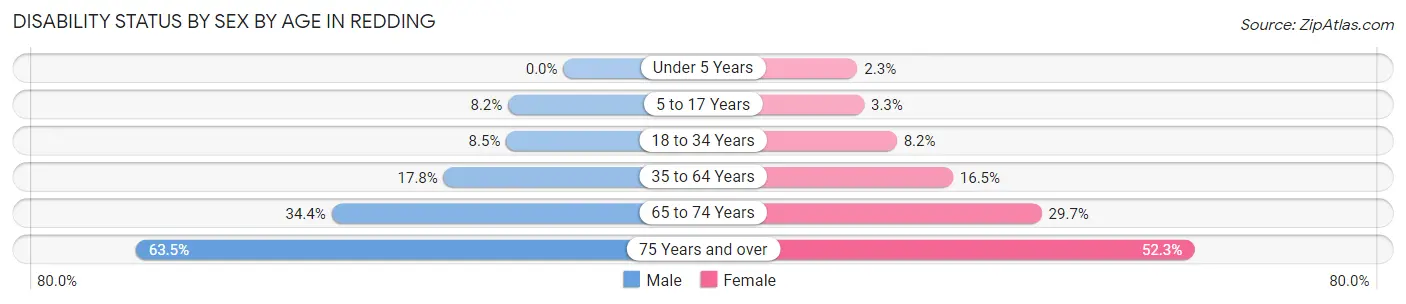
| Age Bracket | Male | Female |
| Under 5 Years | 0 (0.0%) | 53 (2.3%) |
| 5 to 17 Years | 650 (8.2%) | 254 (3.3%) |
| 18 to 34 Years | 869 (8.5%) | 858 (8.2%) |
| 35 to 64 Years | 2,810 (17.8%) | 2,815 (16.5%) |
| 65 to 74 Years | 1,590 (34.4%) | 1,547 (29.7%) |
| 75 Years and over | 1,973 (63.5%) | 2,381 (52.3%) |
Disability Class by Sex by Age in Redding
Disability Class: Hearing Difficulty
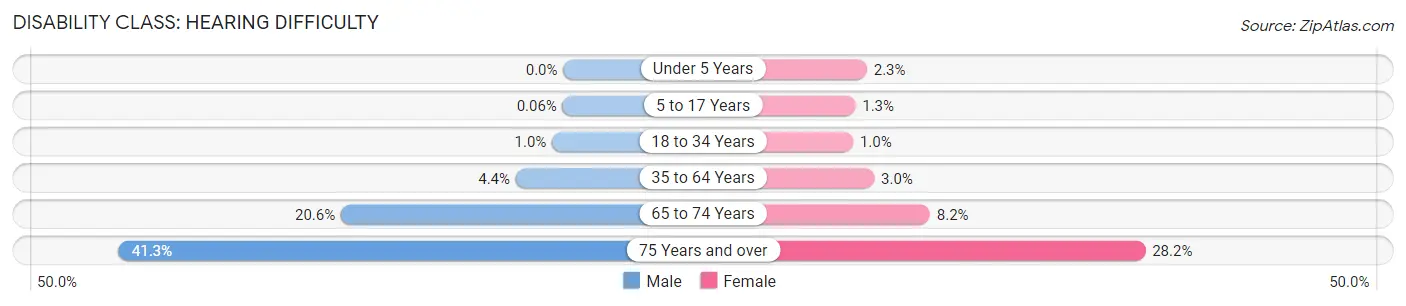
| Age Bracket | Male | Female |
| Under 5 Years | 0 (0.0%) | 53 (2.3%) |
| 5 to 17 Years | 5 (0.1%) | 96 (1.3%) |
| 18 to 34 Years | 107 (1.0%) | 109 (1.0%) |
| 35 to 64 Years | 696 (4.4%) | 512 (3.0%) |
| 65 to 74 Years | 953 (20.6%) | 426 (8.2%) |
| 75 Years and over | 1,282 (41.2%) | 1,282 (28.2%) |
Disability Class: Vision Difficulty
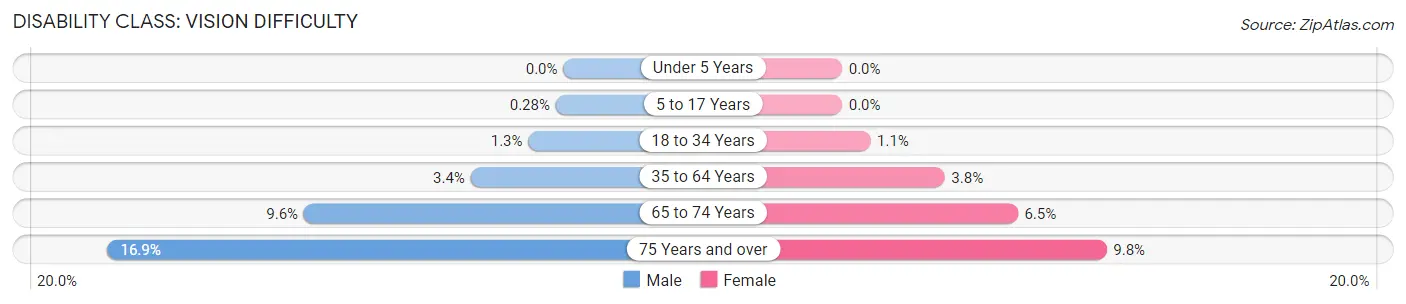
| Age Bracket | Male | Female |
| Under 5 Years | 0 (0.0%) | 0 (0.0%) |
| 5 to 17 Years | 22 (0.3%) | 0 (0.0%) |
| 18 to 34 Years | 133 (1.3%) | 110 (1.1%) |
| 35 to 64 Years | 544 (3.4%) | 650 (3.8%) |
| 65 to 74 Years | 445 (9.6%) | 340 (6.5%) |
| 75 Years and over | 526 (16.9%) | 447 (9.8%) |
Disability Class: Cognitive Difficulty
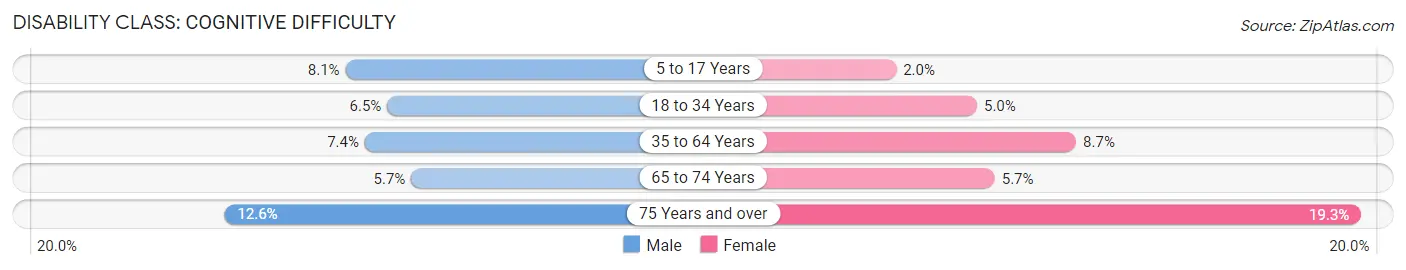
| Age Bracket | Male | Female |
| 5 to 17 Years | 641 (8.1%) | 156 (2.0%) |
| 18 to 34 Years | 670 (6.5%) | 528 (5.0%) |
| 35 to 64 Years | 1,164 (7.4%) | 1,484 (8.7%) |
| 65 to 74 Years | 261 (5.7%) | 296 (5.7%) |
| 75 Years and over | 391 (12.6%) | 878 (19.3%) |
Disability Class: Ambulatory Difficulty
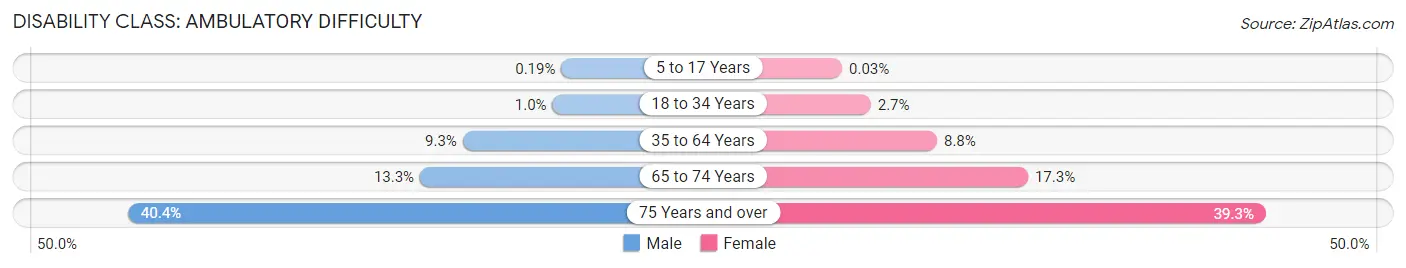
| Age Bracket | Male | Female |
| 5 to 17 Years | 15 (0.2%) | 2 (0.0%) |
| 18 to 34 Years | 104 (1.0%) | 283 (2.7%) |
| 35 to 64 Years | 1,475 (9.3%) | 1,508 (8.8%) |
| 65 to 74 Years | 615 (13.3%) | 901 (17.3%) |
| 75 Years and over | 1,256 (40.4%) | 1,791 (39.3%) |
Disability Class: Self-Care Difficulty
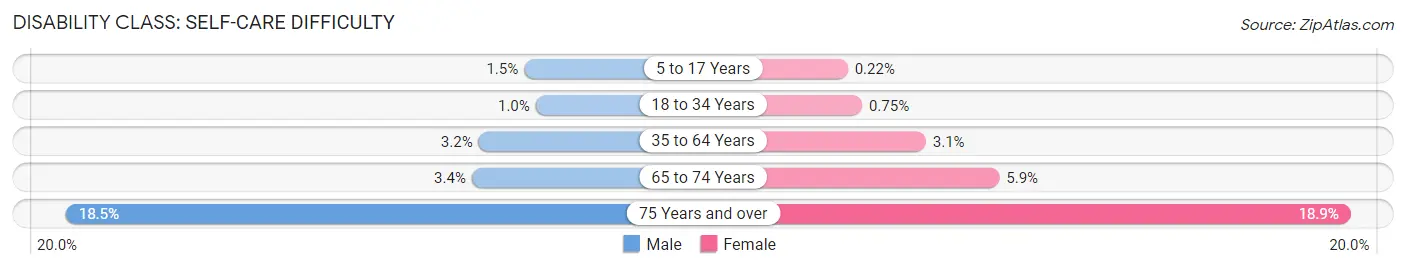
| Age Bracket | Male | Female |
| 5 to 17 Years | 116 (1.5%) | 17 (0.2%) |
| 18 to 34 Years | 106 (1.0%) | 79 (0.7%) |
| 35 to 64 Years | 498 (3.2%) | 532 (3.1%) |
| 65 to 74 Years | 157 (3.4%) | 305 (5.9%) |
| 75 Years and over | 574 (18.5%) | 860 (18.9%) |
Technology Access in Redding
Computing Device Access in Redding
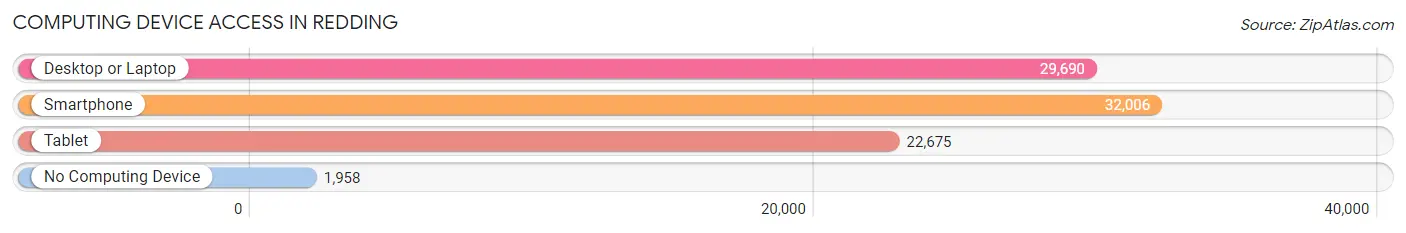
| Device Type | # Households | % Households |
| Desktop or Laptop | 29,690 | 81.3% |
| Smartphone | 32,006 | 87.6% |
| Tablet | 22,675 | 62.1% |
| No Computing Device | 1,958 | 5.4% |
| Total | 36,522 | 100.0% |
Internet Access in Redding
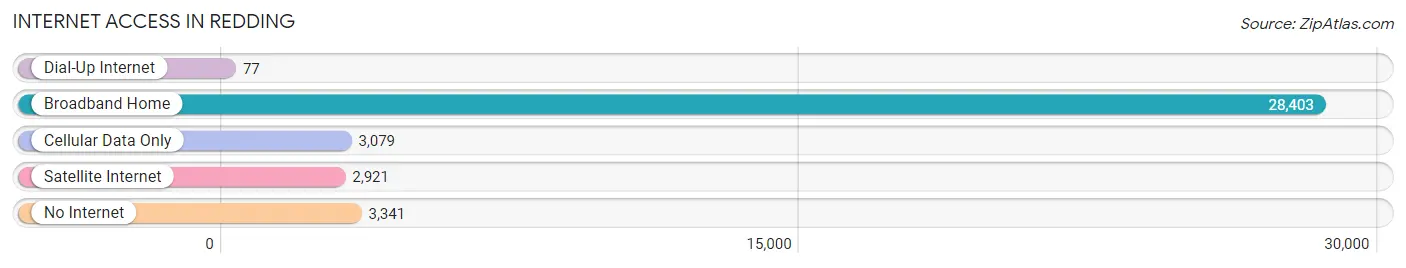
| Internet Type | # Households | % Households |
| Dial-Up Internet | 77 | 0.2% |
| Broadband Home | 28,403 | 77.8% |
| Cellular Data Only | 3,079 | 8.4% |
| Satellite Internet | 2,921 | 8.0% |
| No Internet | 3,341 | 9.1% |
| Total | 36,522 | 100.0% |
Redding Summary
Redding, California is a city located in the northern part of the state, in Shasta County. It is the county seat and the largest city in the county. The city is situated at the northern end of the Sacramento Valley, near the base of the Cascade Range and the Trinity Alps. The city is known for its natural beauty, outdoor recreation, and its proximity to the Sacramento River.
History
The area that is now Redding was first inhabited by the Wintu and Yana Native American tribes. The first European settlers arrived in the area in the early 1850s, and the city was officially founded in 1872. The city was named after B.B. Redding, a railroad official.
In the late 19th century, the city became a major hub for the lumber industry, and it was also a popular destination for tourists. The city experienced a period of rapid growth in the early 20th century, and by the 1950s, it had become a major center for the timber industry.
Geography
Redding is located in the northern part of California, in Shasta County. It is situated at the northern end of the Sacramento Valley, near the base of the Cascade Range and the Trinity Alps. The city is located at the confluence of the Sacramento River and the Pit River. The city is surrounded by mountains, forests, and lakes, and it is known for its natural beauty.
The city has a total area of 44.3 square miles, of which 43.9 square miles is land and 0.4 square miles is water. The city has a warm-summer Mediterranean climate, with hot, dry summers and mild, wet winters.
Economy
Redding’s economy is largely based on the timber industry, and the city is home to several lumber mills. The city is also a major center for the health care industry, and it is home to several hospitals and medical centers. The city is also a popular tourist destination, and it is home to several attractions, including the Turtle Bay Exploration Park and the Sundial Bridge.
Demographics
As of the 2010 census, the population of Redding was 89,861. The racial makeup of the city was 79.2% White, 1.7% African American, 1.3% Native American, 2.2% Asian, 0.2% Pacific Islander, 11.7% from other races, and 4.0% from two or more races. The median household income was $41,919, and the median family income was $50,919.
Redding is a diverse city, with a variety of cultures and backgrounds. The city is home to a large number of churches, and it is also home to several museums and art galleries. The city is also home to a vibrant music and arts scene, and it is known for its outdoor recreation opportunities.
Common Questions
What is Per Capita Income in Redding?
Per Capita income in Redding is $35,923.
What is the Median Family Income in Redding?
Median Family Income in Redding is $84,168.
What is the Median Household income in Redding?
Median Household Income in Redding is $67,323.
What is Income or Wage Gap in Redding?
Income or Wage Gap in Redding is 25.2%.
Women in Redding earn 74.8 cents for every dollar earned by a man.
What is Family Income Deficit in Redding?
Family Income Deficit in Redding is $11,217.
Families that are below poverty line in Redding earn $11,217 less on average than the poverty threshold level.
What is Inequality or Gini Index in Redding?
Inequality or Gini Index in Redding is 0.44.
What is the Total Population of Redding?
Total Population of Redding is 93,327.
What is the Total Male Population of Redding?
Total Male Population of Redding is 45,507.
What is the Total Female Population of Redding?
Total Female Population of Redding is 47,820.
What is the Ratio of Males per 100 Females in Redding?
There are 95.16 Males per 100 Females in Redding.
What is the Ratio of Females per 100 Males in Redding?
There are 105.08 Females per 100 Males in Redding.
What is the Median Population Age in Redding?
Median Population Age in Redding is 38.8 Years.
What is the Average Family Size in Redding
Average Family Size in Redding is 3.0 People.
What is the Average Household Size in Redding
Average Household Size in Redding is 2.5 People.
How Large is the Labor Force in Redding?
There are 43,550 People in the Labor Forcein in Redding.
What is the Percentage of People in the Labor Force in Redding?
58.3% of People are in the Labor Force in Redding.
What is the Unemployment Rate in Redding?
Unemployment Rate in Redding is 5.9%.